mechanical properties of geopolymer mortars in …...mechanical properties of geopolymer mortars in...
TRANSCRIPT

Original papers
362 Ceramics – Silikáty 55 (4) 362-372 (2011)
MeChaniCal prOpertieS Of geOpOlyMer MOrtarSin relatiOn tO their pOrOuS StruCture
MiChaela SteinerOva
Institute of Rock Structure and Mechanics, Academy of Sciences of the Czech Republic, v.v.i.V Holešovičkách 41, 182 00 Prague, Czech Republic
e-mail: [email protected]
Submitted January 20, 2011; accepted October 26, 2011
Keywords: geopolymers, Mechanical properties, frost resistance, pore-size distribution, itZ
This research dealt with metakaolinite geopolymers of various textures controlled by the addition of a quartz sand in a range of 0–93 wt.%. Mechanical properties were measured to quantify the impact of changing composition on the specimen structure, aimed to the mixture optimizing. The compressive and flexural strengths, Young’s modulus and frost resistance were compared with structure parameters determined by mercury porosimetry. The resulting relations are discussed revealing varying control plots modifying the strengths and frost resistance. The existence of an interfacial transition zone caused by the interaction between the quartz aggregates and the geopolymer was verified to be positively affecting the composite strengths. It has been found that the material of the best mechanical properties underwent the maximal densification of the sand aggregates causing the approaching on the shortest distance with the condition of entirely coating by geopolymer gel. In this manner, the highest interface participation is represented on the composite structure. Besides the high strength, freezing resistance was conditioned by an at least 20% content (within the total porosity) of 1-8 μm large mesopores.
intrOduCtiOn
geopolymer cements (since 1979 researched and named by professor J. davidovits) have brought a revo- lutionary change into a series of classic inorganic binding agents [1]. from the classics based on crystalline substances as in the case of plaster, lime and nano-crystalline structure of the predominant CSh gel in portland cement beside the initial clinker minerals, geopolymers are distinguished by their completely amorphous structure arising from the aqueous sol-gel dispersion of various aluminosilicates. the sol-gel state is initiated by a strong alkali environment [2], which enables a hydrolysis of the source components and their decay, releasing geopolymer precursors, hydrated units of SiO4 and alO4 [3]. they connect to one another while forming a polycondensed network of matrix affecting the final mechanical and structural properties through their proportion [4]. it is supposed, at the metakaolinite-geopolymer matrix, that the Si-O-al bonds are connected in the first twenty-five hours and later the chains are connected into the spatial network by the Si-O-Si bonds [5]. during that, water condenses arising from the conversion of the non-bridging oxygens of the precursors into the bridging oxygens of the matrix chains. geopolymers, as a heterogeneous mixture of non-reactive impurities and added particles with homogenous sol-gel of precursors, undergo a high alkaline treatment
of all the present components during hydrolysis studied previously [6,7]. this induces an interaction on the surface of added particles such as siliceous aggregates [8], likely creating covalent Si–O bonds between the matrix and grain surface [9], and thus an interface between the geopolymer gel and aggregates has a beneficial effect on compressive and tensile strength. The modified microstructure is described as an interfacial transition zone (itZ) chemical and structural quite distinctive from the one known at portland cement composites [10] actually weakening the concrete structure [11]. the itZ being approximately 50 µm thick is estimated to be 10 times thicker than the itZ in geopolymer composite,
indicated by the concentration gradients in the SeM-edS [12]. Geopolymer initial dispersion possesses significant wettability and adhesion to filler materials such as lime-stone and quartz sand [13], basalt, siltstone, albit and steel [14]. it was found that the presence of soluble silica in the high alkali environment of the initial geopolymer solution leads to the deposition of an al-rich interfacial layer, which is essential for the strong interface [12]. a question remains of the interface ratio participation in the final strength. Until now, the impact of the structure on the strength of the geopolymer composites has not been directly examined in terms of filler-aggregate proportion, except in terms of the impact of matrix composition on porosity. that was found being mainly affected by the water ratio independent on preparing
Mechanical properties of geopolymer mortars in relation to their porous structure
Ceramics – Silikáty 55 (4) 362-372 (2011) 363
conditions [15]. the porosity is determined by a pore size being in the fly-ash geopolymer gel of the main range of above 100 nm, whereas the main pore-size in metakaolinite gel is only 5-20 nm [4]. aside from strength, porosity is the main factor affecting the frost resistance of clays [16] and concrete [17], as silicate materials. however, articles on the frost resistance of geopolymers have been focused on their durability and verified on fly ash geopolymers as being very resistant when combined with suitable additives [13], but this was done without consideration of porosity or the changing amount of the additives or filler. The incorporation of a large amount of sand filler while reaching sufficient material cohesion was proven in practice with geopolymers of sandstone-like appearance [18,19]. in any case, this work is intended to set the baseline for further studies that will contribute to the industrial application of geopolymer technologies by comparing the known impacts of various filler/binder ratios. The aim is therefore to demonstrate the changing properties using the chosen model of composites with a quartz sand filler and metakaolinite geopolymer gel binder and to determine the optimized mixture. the further contribution should be a description of the influence of structure on frost resistance. The filler/binder ratio was successively increased, mapping in this manner the technologically available compositions and the relations between the mechanical properties and the changing structure parameters. the resulting mechanical property trends were to trace and provide evidence of the interaction between the quartz sand and geopolymer gel.
eXperiMental
MaterialsGeopolymer binder
pure kaolin was used as the standard aluminosilicates source. its main component was kaolinite (90 %) and the admixtures were mica and quartz. the washed Sedlec ia kaolin was provided from the Sedlecky kaolin a.s., Bozicany, Czech republic kaolin works (table 1). Metakaolinite was prepared by firing at 750 ° C with
a dwell of 6 h. the particle size d50 = 9 µm corresponded to a content of 50% of particles smaller than 9 µm in diameter. the geopolymer binder was prepared from a mix-ture of metakaolinite with a solution of naOh and na2O.xSiO2 at ratios of Si/Al = 1.4, Na/Al = 1 and H2O/Na = 7.14. Analogous to the water-cement ratio (w/c), the water/metakaolinite ratio was determined to be 0.74, which corresponded to the minimal water content in the initial dispersion achievable by the mixing technique used.
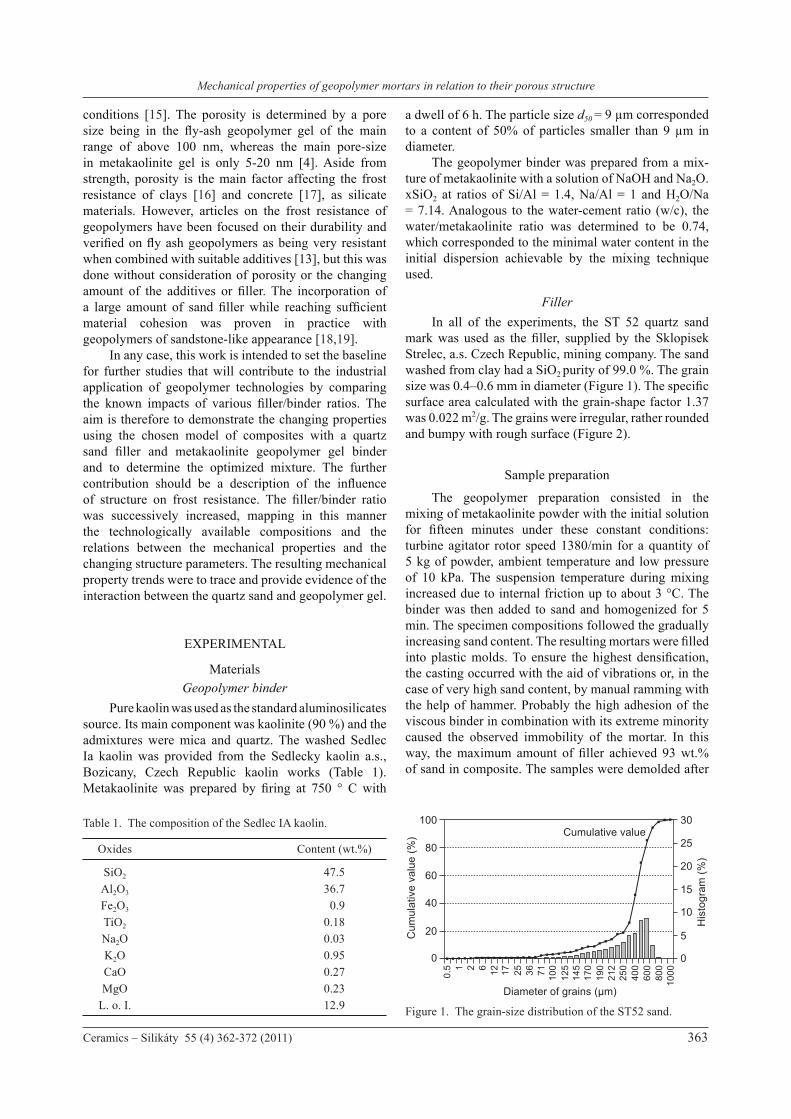
Filler in all of the experiments, the St 52 quartz sand mark was used as the filler, supplied by the Sklopisek Strelec, a.s. Czech republic, mining company. the sand washed from clay had a SiO2 purity of 99.0 %. the grain size was 0.4–0.6 mm in diameter (Figure 1). The specific surface area calculated with the grain-shape factor 1.37 was 0.022 m2/g. The grains were irregular, rather rounded and bumpy with rough surface (figure 2).
Sample preparation
the geopolymer preparation consisted in the mixing of metakaolinite powder with the initial solution for fifteen minutes under these constant conditions: turbine agitator rotor speed 1380/min for a quantity of 5 kg of powder, ambient temperature and low pressure of 10 kpa. the suspension temperature during mixing increased due to internal friction up to about 3 °C. The binder was then added to sand and homogenized for 5 min. the specimen compositions followed the gradually increasing sand content. The resulting mortars were filled into plastic molds. To ensure the highest densification, the casting occurred with the aid of vibrations or, in the case of very high sand content, by manual ramming with the help of hammer. probably the high adhesion of the viscous binder in combination with its extreme minority caused the observed immobility of the mortar. in this way, the maximum amount of filler achieved 93 wt.% of sand in composite. the samples were demolded after
Diameter of grains (µm)
Cumulative value
Cum
ulat
ive
valu
e (%
)
0
0.5 1 2 6 12 17 25 36 71 100
125
145
170
190
212
250
400
600
800
1000
20
40
60
80
100
His
togr
am (%
)
0
5
10
15
25
20
30
figure 1. the grain-size distribution of the St52 sand.
table 1. the composition of the Sedlec ia kaolin.
Oxides Content (wt.%)
SiO2 47.5 al2O3 36.7 fe2O3 0.9 tiO2 0.18 na2O 0.03 K2O 0.95 CaO 0.27 MgO 0.23 l. o. i. 12.9

Steinerova M.
364 Ceramics – Silikáty 55 (4) 362-372 (2011)
24 h and cured at laboratory temperature and pressure in sealed plastic foils for 3 weeks. the mechanical and structural properties were measured after twenty-eight days from fabrication on dried samples. The final dried product of the specimens contained following amount of sand in wt.%: 0, 14, 28, 34, 50, 60, 74, 78, 82, 90 and 93.
Characterisation methods
Compressive and tensile strength Measurement was carried out according to the en 196-1 standard for portland cement concrete testing, for which the samples were formed into blocks of a dimension 40 × 40 × 160 mm. the compressive strength was measured on the eu40 load-testing ma-chine, Werkstoffprüfmaschinen, veB leipzig, germany. The flexural strength tests were conducted in the 3-point bending on the fpZ100 load-teSsting machine, thüringer industriewerk, veB rauenstein, germany.
The flexural strength conducted by load-deflection course was measured for each composite on three samples; the compressive strength was then measured on the remaining samples after the bending tests, i.e. six.
Young’s modulus the tests were performed on the inSpeKt universal testing machine by hegenwald peschke Mess und prüf-technik, gmbh, germany. the measured samples had a shape of a long prism with dimensions of 7 × 4 × 50 mm. the measurement was carried out under 4-point-bending with a 40 mm distance of the fixed edge points (Figure 3). the force acted in the two middle points towards the sample. the deformation by extension was detected by three extensometers below the sample. the young’s modulus was determined on six samples, measured three times. their courses of dependences of deformation on the force were linear.
Frost resistance the determination was performed with the assis-tance of compressive strength measured on soaked samples after twenty-five freezing cycles as compared to the ordinary compressive strength measured as was mentioned above. the average value was gained from six measurements from each specimen. the resulting frost resistance was determined as the decrease in % of the ordinary compressive strength after the freezing cycles:
resistance tests passed when the compressive strength remained above 75 %. a cycle between freezing and thawing from -18°C to 20°C lasted 24 h. The usual frost resistance was accompanied by parallel tests of
figure 2. the sand grain shapes and the surface appearance.
40 mm
20 mm
20 mm
figure 3. the arrangement of young’s modulus measurement distances.
specific fracture energy = ×100.Compressive strength after freezing
Ordinary compressive strength

Mechanical properties of geopolymer mortars in relation to their porous structure
Ceramics – Silikáty 55 (4) 362-372 (2011) 365
Young’s modulus combined with flexural strength also after twenty-five cycles of freezing on six samples from each specimen composition. the measurements of young’s modulus were always repeated three times. all of the samples were completely soaked before freezing and tightly sealed by welding into foil to keep the full saturation of the water for the entire measurement time.
Microscopy study SeM was performed on a CaMeCa SX100 (from CaMeCa, SaS, france) equipment with Se and BSe detectors and Wd spectrometers. the microscopy was provided on a polished section coated with carbon in a focused beam at a current of 10 na and beam voltage of 15 kev. Other SeM environmental microphotographs were obtained by a Quanta 450 microprobe (from fei Comp., uSa).
High pressure mercury porosimetry the structural parameters were measured on coup-led pascal 140 and pascal 240 porosimeters supplied by pOrOteC, gmbh, germany. the pascal porosimetr 140 served as a filling equipment. The Porosimetr 240 operated in the pressure range from 0.1 to 200 Mpa. an evaluation of the measurements using the pOrOteC software provided the entire structure determination. The results were calculated with the help of a flask-like model of the pores determining the total porosity (%), cumulative volume of pores (mm3/g), specific surface area (m3/g), and pore-size distribution. The structural parameters were completed by the determination of the bulk density (g/cm3) and apparent density calculated directly from the mercury consumption. all of the measurements were conducted twice to verify their repeatability.
reSultS and diSCuSSiOn
Mechanical properties
the results of the mechanical properties measured are shown in figure 4. the discrete values are outlined in trends in order to highlight the dependencies. the mechanical properties achieved their extremes within the optimal content of the quartz sand aggregates in a range of 75–78 wt.%, hence satisfying the condition that the grains were coated by geopolymer binder avoiding coarse pores. the best composition of 78 wt.% of sand was recorded by both the compressive strength and the flexural strength of 70MPa and of 11.7 MPa, respectively. the young’s modulus peak reached up to 19 gpa at 75 wt.% of sand. Generally, if the flexural strength is supposed to be proportional to the bond frequency, a positive impact on the strength and cohesion could be suggested of the interface between the matrix and the aggregate grains, creating strong itZ. the increasing strength depends
also on the inclusion effect. this phenomenon appears because the flexural strength trend demonstrates an in-crease already with the small sand addition. as shown in figure 4, the strength gradually rises as the sand content increases, achieving the supreme load at 78 wt.% of the content of the sand aggregates. indeed, the bulk density exhibits its maximum here (figure 9b). When this rate of the sand is exceeded, a lack of binder is relayed between the grains, leading to coarse-pore formation and a rise in porosity. the bending ultimate load at a spe-cimens of 82 wt.% of sand drops sharply owing to the structure being weakened by the reduced contact area between the sand grains and the matrix. Conveniently for that, also the compressive strength slope collapses at the same interval, whereas young’s modulus trend undergoes a slow decrease. it could be supposed that it is the mechanism of failure that is responsible for the difference, in contrast to the elasticity modulus measurement, which is a non-destructive method. the further description is divided into sections according to the sand content and takes notice of the predominant features with the main influences on the presented trends.
0-34 wt.%: there is an abundance of binder. 34-60 wt.%: the strengths are elevated. 74-78 wt.%: the optimal composition without cracks is
achieved. 78-93 wt.%: The lack of binder/abundance of the sand
filler aggregates causes coarse-pore forma-tion.
0-34 wt.% of sand the compressive strength shows a converse trend to the flexural strength in the low concentration of sand. at the beginning, the compressive strength does not react to the increasing sand content. it is apparently caused by the long distance between the grains, up to 50 wt.% of sand (see figure 8). the shortening of the distances
Sand content (wt.%)
coarsepores
0 10 20 30 40 50 60 70 80 90 100
Flexural strengthCompressive strength
Flex
ural
stre
ngth
(MP
a)
0
5
10
15
20
25
30
Com
pres
sive
stre
ngth
(MP
a)
0102030
5040
60708090
figure 4. the trends of the mechanical properties in relation to the sand content (a) flexural strength, Compressive strength; (b) young’s modulus. ???!!!
Steinerova M.
366 Ceramics – Silikáty 55 (4) 362-372 (2011)
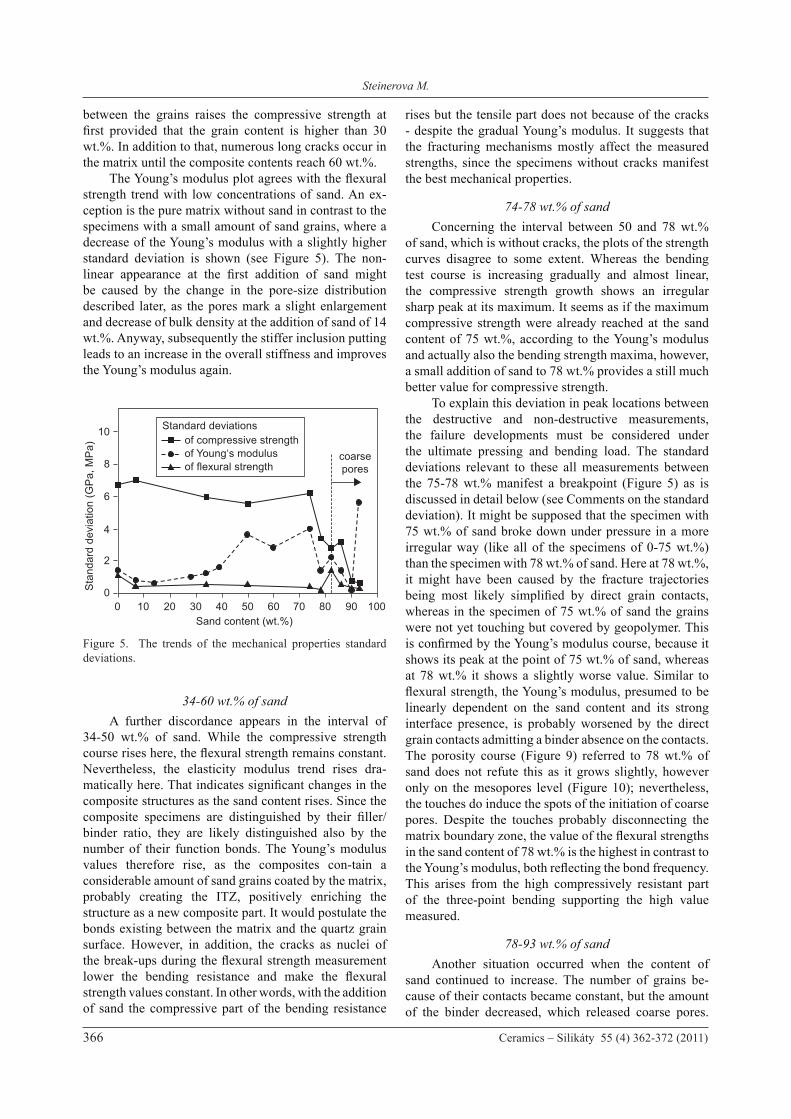
between the grains raises the compressive strength at first provided that the grain content is higher than 30 wt.%. in addition to that, numerous long cracks occur in the matrix until the composite contents reach 60 wt.%. The Young’s modulus plot agrees with the flexural strength trend with low concentrations of sand. an ex-ception is the pure matrix without sand in contrast to the specimens with a small amount of sand grains, where a decrease of the young’s modulus with a slightly higher standard deviation is shown (see figure 5). the non-linear appearance at the first addition of sand might be caused by the change in the pore-size distribution described later, as the pores mark a slight enlargement and decrease of bulk density at the addition of sand of 14 wt.%. anyway, subsequently the stiffer inclusion putting leads to an increase in the overall stiffness and improves the young’s modulus again.
34-60 wt.% of sand a further discordance appears in the interval of 34-50 wt.% of sand. While the compressive strength course rises here, the flexural strength remains constant. nevertheless, the elasticity modulus trend rises dra-matically here. That indicates significant changes in the composite structures as the sand content rises. Since the composite specimens are distinguished by their filler/binder ratio, they are likely distinguished also by the number of their function bonds. the young’s modulus values therefore rise, as the composites con-tain a considerable amount of sand grains coated by the matrix, probably creating the itZ, positively enriching the structure as a new composite part. it would postulate the bonds existing between the matrix and the quartz grain surface. however, in addition, the cracks as nuclei of the break-ups during the flexural strength measurement lower the bending resistance and make the flexural strength values constant. in other words, with the addition of sand the compressive part of the bending resistance
rises but the tensile part does not because of the cracks - despite the gradual young’s modulus. it suggests that the fracturing mechanisms mostly affect the measured strengths, since the specimens without cracks manifest the best mechanical properties.
74-78 wt.% of sand Concerning the interval between 50 and 78 wt.% of sand, which is without cracks, the plots of the strength curves disagree to some extent. Whereas the bending test course is increasing gradually and almost linear, the compressive strength growth shows an irregular sharp peak at its maximum. it seems as if the maximum compressive strength were already reached at the sand content of 75 wt.%, according to the young’s modulus and actually also the bending strength maxima, however, a small addition of sand to 78 wt.% provides a still much better value for compressive strength. to explain this deviation in peak locations between the destructive and non-destructive measurements, the failure developments must be considered under the ultimate pressing and bending load. the standard deviations relevant to these all measurements between the 75-78 wt.% manifest a breakpoint (figure 5) as is discussed in detail below (see Comments on the standard deviation). it might be supposed that the specimen with 75 wt.% of sand broke down under pressure in a more irregular way (like all of the specimens of 0-75 wt.%) than the specimen with 78 wt.% of sand. here at 78 wt.%, it might have been caused by the fracture trajectories being most likely simplified by direct grain contacts, whereas in the specimen of 75 wt.% of sand the grains were not yet touching but covered by geopolymer. this is confirmed by the Young’s modulus course, because it shows its peak at the point of 75 wt.% of sand, whereas at 78 wt.% it shows a slightly worse value. Similar to flexural strength, the Young’s modulus, presumed to be linearly dependent on the sand content and its strong interface presence, is probably worsened by the direct grain contacts admitting a binder absence on the contacts. the porosity course (figure 9) referred to 78 wt.% of sand does not refute this as it grows slightly, however only on the mesopores level (figure 10); nevertheless, the touches do induce the spots of the initiation of coarse pores. despite the touches probably disconnecting the matrix boundary zone, the value of the flexural strengths in the sand content of 78 wt.% is the highest in contrast to the Young’s modulus, both reflecting the bond frequency. this arises from the high compressively resistant part of the three-point bending supporting the high value measured.
78-93 wt.% of sand another situation occurred when the content of sand continued to increase. the number of grains be-cause of their contacts became constant, but the amount of the binder decreased, which released coarse pores.
Sand content (wt.%)
coarsepores
0 10 20 30 40 50 60 70 80 90 100
Sta
ndar
d de
viat
ion
(GP
a, M
Pa)
0
2
4
6
8
10 Standard deviationsof compressive strengthof Young‘s modulusof flexural strength
figure 5. the trends of the mechanical properties standard deviations.
Mechanical properties of geopolymer mortars in relation to their porous structure
Ceramics – Silikáty 55 (4) 362-372 (2011) 367
figure 9 shows that above the point of 78 wt.% of sand, the porosity is gradually rising while the bulk density is decreasing. the reason is the occurrence of coarse pores, which is evident in the SeM (figure 8) above the content of 82 wt.% of sand. Similarly, the pore size-distribution describes the pore size growth (figure 10). as the lack of binder reduces the matter joining the grains, the weakened structure denotes the compressive strength sinking to its lowest values, less than a quarter of the value at the matrix without any filler. The trend of elasticity modulus however shows that the remaining bonds provide values of about one half of the young’s modulus of the matrix without any filler. Moreover, the flexural strength proves that the bonding is sufficient even in a composite of 93 wt.% of sand, showing the same values as at the matrix without any filler. It implies that the itZ as the only remaining structure between grains, seems to be much stronger than the ordinary matrix without any filler, considering that the matrix amount is minimized through the prevalent coarse pores.
Comment on the standard deviations despite the small number of samples, the deviations suggest that the measuring accuracy of the geopolymer mechanical properties is hindered by different effects. the trends differ by their standard deviations as well as considering their sand content (figure 5), as the changing microstructure induces different control plots. While the compressive strength shows the largest standard deviations, the young’s modulus denotes smaller standard deviation and the flexural strength than even the quite smallest one. the different value dispersions of the compressive and bending strengths are caused by the differently proceeding break-ups. Most likely, it is the fracturing mechanism and internal stress in the geopolymer matrix that play the main roles in the rupture process.
Whereas all of the specimens burst suddenly under the bending load (shown below in figure 6), the mea-surement under the ultimate compressive load was slowed or hindered enough to be observed to modify the values measured. it prompts an explanation that the geopolymer matrix bonds might manage to absorb the compressive stress and transfer it into the sand grains. as an irregular event, it could cause the large standard deviations. On the contrary, the specimens abundant on sand with a minority matrix imply a minimum stress resistance above the 86 wt.% of the sand content. the break-ups spread in fact along the numerous coarse pores, which are indicated by the small standard deviation at the compressive as well as flexural strengths. Under the ultimate bending however, the crack propagation followed the shortest way along structure failures, which is shown by almost constant and small deviations. the specimens with 82 wt.% of sand needed an altered technique of compaction by rather ineffective vibrating to pressing with a hammer. the standard deviation trend successively decreases again as the break-ups were facilitated by the huge number of coarse pores. the standard deviations of young’s modulus are also variable regarding the specimen structure, but in comparison with the destructive measurements the influences are likely to be different. First of all, the standard deviation of the young’s modulus is low. it becomes higher when the filler/binder ratio reaches ca 1:1. With lesser or greater oscillation, the standard deviation rises to the optimal composition and also the young’s modulus value is at its highest. the sand contents of 82 wt.% and more show smaller deviations, similar to other mechanical properties. the high standard deviation at the 93 wt.% of sand indicates limited measurement sensitivity. the weaker specimens had to be loaded with very low tension leading to dispersed results.
Comment on the courses of the flexural strength measurements
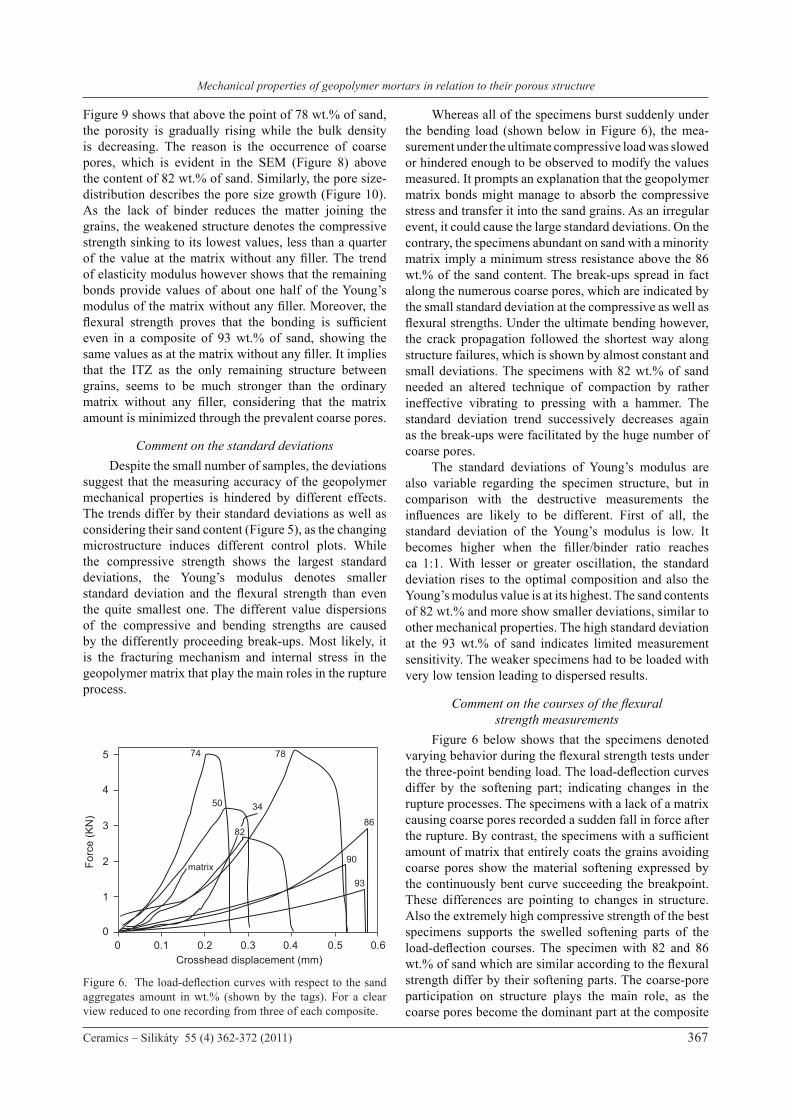
figure 6 below shows that the specimens denoted varying behavior during the flexural strength tests under the three-point bending load. The load-deflection curves differ by the softening part; indicating changes in the rupture processes. the specimens with a lack of a matrix causing coarse pores recorded a sudden fall in force after the rupture. By contrast, the specimens with a sufficient amount of matrix that entirely coats the grains avoiding coarse pores show the material softening expressed by the continuously bent curve succeeding the breakpoint. these differences are pointing to changes in structure. also the extremely high compressive strength of the best specimens supports the swelled softening parts of the load-deflection courses. The specimen with 82 and 86 wt.% of sand which are similar according to the flexural strength differ by their softening parts. the coarse-pore participation on structure plays the main role, as the coarse pores become the dominant part at the composite
Crosshead displacement (mm)
86
93
90
3450
matrix
74 78
0 0.1 0.2 0.3 0.4 0.5 0.6
Forc
e (K
N)
0
1
2
3
4
5
82
Figure 6. The load-deflection curves with respect to the sand aggregates amount in wt.% (shown by the tags). for a clear view reduced to one recording from three of each composite.

Steinerova M.
368 Ceramics – Silikáty 55 (4) 362-372 (2011)
with 86 wt.% of sand (see figure 8). Similarly the courses of the same flexural strengths of specimens with 74 and 78 wt.% of sand differ by the swelled softening part at 78 wt.%. it implies the increased interface participation on structure of the 78 wt. % of sand at the expense of the regular matrix. as mentioned above the interface appears to be stronger than the regular matrix. a very steep rise of the specimen with 74 wt.% of sand is apparent in accordance with the young’s modulus course (figure 4), as the peak is situated just at 74 wt.% of sand. the load-deflection courses were recorded each time on three samples with very similar results. there are chosen the middle curves and shown on the figure 6.
frost-resistance tests
the resistance to freezing cycles was determined in order to verify the durability of the geopolymer composites in adverse weather conditions, with the damaging effect of water’s transformation into ice inside the pores. the results are shown in figure 7a as ratios of the average compressive strength decrease after twenty-five freezing cycles. In the other diagram, Figure 7b, a decrease of the young’s modulus is shown along with the flexural strength decrease as measured under the same conditions of the freezing and thawing cycles. the specimens indicate that the frost resistance is limited by a sand content of at least 34 wt.%. the samples with a lower amount of sand did not endure the twenty-five cycles of freezing and defrosting. The explanation consists in their adverse porous structure, as the pores were too small, nanosized, as it is discussed in detail in the next chapter reporting on the microstructure. Concerning these samples, it has been observed that the more sand they contained, the higher number of cycles they reached while less and less cracks occurred. Beside the ice expansion in the pores and cracks, the moisture dilatation combined with the matrix internal stress was suspected to be the cause of the destruction. this assessment arises from the fact that while the samples with low sand content did not survive the first defrosting,
the samples of the pure matrix did not withstand even the soaking. they were marked by sudden cracking reaching as deep below the surface as the water that had soaked; with the sample decay in the end. as is evident from figure 7a, the samples enduring the regular freezing cycles far exceeded the limit of the sufficient compressive strength given by 75% of its ordinary value without freezing. actually, they are slightly under the ordinary compressive strength while some specimens reached the same strength and some even a superior one (82 wt.% of sand). the trend appears progressive to sand content, which means the following: if the specimens contain enough geopolymer matrix binder to avoid coarse pores, the frost-resistance trend rises with the sand content, up to 82 wt.%. above this limit, the excessive sand caused coarse pores to appear, leading to a decrease in frost resistance, followed by a subsequent rise upwards again. it appears that the trend tends to be a J-shaped doublet, divided by the point of the incipient coarse pores between 82 and 86 wt.% of sand. in the case of 93 wt.% of sand, the measured frost resistance appears extremely high. it is partly because both the ordinary and the after-freezing strengths are very low, and partly because the large pores among sand grains prevented full saturation. the strength improvement after the freezing cycles could also be caused by the long-time curing of the samples in wet circumstances, possibly facilitating the matrix late structuralization in the presence of the pore solution as a transporting medium for the later built molecular clusters. as is shown in figure 7b, only specimens in the interval of ca 70–82 wt.% of sand survived the twenty-five freezing cycles. These are the specimens of the highest strengths. in contrast to the massive samples for the compressive strength measurement providing them with the sufficient compactness, the subtle samples for the young’s modulus measurement accompanied by a simultaneous flexural strength measurement were very sensible to frost tests. their shape factor given by a far higher ratio of the surface area to the small cross section led to decay probably owing to the changed
Sand content (wt.%)
coarsepores
Resistant
Unresisting
0 10 20 30 40 50 60 70 80 90 100
Fros
t res
ista
nce
(%)
50
75
100
125
Sand content (wt.%)
Resistant
Unresisting
ratios of Young‘s modulusratios of flexural strength
0 10 20 30 40 50 60 70 80 90 100
Fros
t res
ista
nce
(%)
50
75
100
125
coarsepores
Figure 7. The discreet values of the ratios of compressive strengths (a) and Young’s modulus and flexural strengths (b) after/before twenty-five freezing cycles
b)a)

Mechanical properties of geopolymer mortars in relation to their porous structure
Ceramics – Silikáty 55 (4) 362-372 (2011) 369
circumstances of ice formation in the pores [19]. as is assumed, ice expansion initiating stress inside the sample could balance further ice arising, which causes a stress gradient that renders the thin shape disadvantageous. in any case, the number of samples that had survived proved remarkable high young’s modulus and flexural strength. Like with compressive strength shown in Figure 7a, the flexural strength ratio in Figure 7b rises slightly. By contrast, the young’s modulus ratios slightly decrease, which can evoke a degenerative change in the structure. On the other hand, a new ordering might be supposed rather than structural degeneration, because a raised reversible deformation was revealed (from 1.3
µm before to 2.0 µm after freezing). this could indicate changes in the elastic behavior, since the young’s modulus was measured under the same force as before freezing.
Structural parameters
SEM microscopy
the SeM microscopy images of the structures caused by the changing amount of sand are shown in Figure 8. First, the low filler concentration denotes irregular dispersion of grains; the structure involves
figure 8. SeM micrographs of the polished sections with marked 0–93 wt.% of sand in the geopolymer composites.
Matrix 14 wt.% 28 wt.%
39 wt.% 50 wt.% 60 wt.%
74 wt.% 78 wt.% 82 wt.%
86 wt.% 90 wt.% 93 wt.%

Steinerova M.
370 Ceramics – Silikáty 55 (4) 362-372 (2011)
long cracks between 0 and 34 wt.% of sand. from 39 to 60 wt.% of sand, the increasing sand ratio means a rather regular dispersion of grains. as is apparent, the contraction cracks evolved in the specimens with 0-60 wt.% of sand. the cracks divided the matrix into local shrinkage zones. this led to preferred short cracks bounded by grains, as the bonds to the grains seem stronger than those in the distant primary matrix. the shortening of cracks occurred above 50 wt.% of sand and the cracks fully disappeared when the sand content increased to 74 wt.% the steep strength increase could be attributed to these. The ITZ became a significant part of the structure, gradually replacing the primary matrix. the grains are still entirely coated by the binder matrix; 78 wt.% of sand denotes the highest compaction. the abundance of sand at 82-93 wt.% of sand implies dominantly coarse pores; a minority binder forms the rare linkage among the sand aggregates. at 93 wt.% of sand, the binder matrix is hardly recognizable.
Porosity, bulk density,and specific surface area
the structure parameters resulting from mercury porosimetry are shown in figure 9. the most noticeable changes regarding the rising sand content are recorded by the trends of bulk density and porosity, as is discussed below. porosity decreases from the initial 36.5% to 16.3%. the minimum porosity, which refers to the highest densification, occurs at 74 wt.% of sand. However, bulk density has its peak (2.08 g/cm3), denoting the maximum sand-grain compaction, shifted to 78 wt.% of sand. Between these compositions of 74-78 wt.%, there is a constant specific surface area, indicating a structural similarity, but it rises again after 82 wt.% as a result of the steeply rising porosity. That reflects the coarse pores that were opening here, which was confirmed by the
SeM image (figure 8) and by the porosity growth itself. the porous area hence sinks and the porosity grows as the coarse pores become larger and larger. as for the 93 wt.% sample, which shows slightly lower porosity, this is owing to the excessive amount of nonporous grains towards the porous matrix which is in a minority. for the same reason, the density hits the maximum 2.65 g/cm3
with the highest content of sand, whereas the pure matrix density is only 2.21 g/cm3. in contrast to the smooth bulk density growth, the porosity trend undergoes oscillations. that arises from the changing pore sizes, detected by the step recordings of mercury porosimetry. It is reflected in the simultaneously descending specific surface area, which is also somewhat oscillating. the change of pore-size distribution has also caused the sudden peak at 24.6 m2/g
of the specific surface area trend at a low concentration (14 wt.%) of sand. decreasing bulk density and constant porosity reflect this anomalous course, likely caused by the impact discussed below of a small addition of sand grains.
Pore-size distribution
figure 10 shows the pore-size distribution of all of the specimens differing by the ratio between the amount of the sand filler and the binder. the geopolymer matrix without added sand shows a large amount of pores, up to 36 vol.%. these are mesopores of mono-modal size distribution ranging between 8 and 20 nm in diameter. they came from the polycondensation process, during which the evolving water was displaced into interstitial spaces by the chain terminals. Once a low amount of sand was added of 14 wt.%, the histogram of pore-size distribution revealed a mono-modal image with the average pore diameter shifted to a slightly larger size (from 8 to 13 nm). it caused the anomalous decrease of specific surface area at the
Sand content (wt.%)
bulk densitydensity
0 10 20 30 40 50 60 70 80 90 100
Bul
k de
nsity
, den
sity
(g c
m-3)
0.20
0.6
1.0
1.4
0.4
0.8
1.2
1.6
2.0
2.4
1.8
2.2
2.62.8
coarsepores
Sand content (wt.%)0 10 20 30 40 50 60 70 80 90 100
Por
osity
(%),
Spe
cific
sur
face
are
a (m
2 /g)
0
5
10
15
20
25
35
30
40
porosityspecific surface area coarse
pores
Figure 9. The trends of the structural parameters of the geopolymer composites in relation to the content of the sand filler.
b) porosity and specific surface areaa) bulk density and density

Mechanical properties of geopolymer mortars in relation to their porous structure
Ceramics – Silikáty 55 (4) 362-372 (2011) 371
14 wt.% specimen mentioned above. this slightly larger mesopores might also be the reason that caused the non-linear events of the young’s modulus trends, mentioned in the mechanical properties chapter. Considering the different properties of the initial dispersion preparation with a small amount or without any sand, it has to be noted that the moving sand grains had visibly reduced the dispersion viscosity during agitation and thus possibly facilitated the homogenization and matrix structuring, which lead to a narrower pore-size distribution of slightly larger mesopores. Of course, this effect was most apparent in the low sand concentration. the same event is still indicated by the next addition of sand in the 28 wt.% specimen. another effect arose with the further addition of sand up to 34 wt.%, which shows a wider dispersion of pore sizes, appearing thus bi-modal. the pore size-distribution here revealed a new group of mesopores with a diameter of ca 1-8 µm, through which the specimens were probably frost resistant as mentioned in the foregoing chapter. these large mesopores were manifested by all the specimens with a sand content above 34 wt.%. the cumulative volumes of these pores (not shown) results in their proportion in porosity being 35, 33 and 20 %, referring to the most frost-resistant specimens, i.e. 74, 78 and 82 wt.% of sand, respectively. as shown in figure 10, this group of large mesopores occurs as long as the matrix thoroughly fills the space between the sand grains. a question remains of what caused the formation of the 1-8 µm large mesopores. it again indicates the leading role of the sand grains likely modifying the matrix structure between the grains, considering all of the specimens as a formation of itZ that involves the 1–8 µm mesopores. possibly water transport could contribute to the mesopore enlarging because of the main role of
condensed water in pore formation. Of the structural causes, the higher amount of sand, above 34 wt.%, became significant in the participation of ITZ with 1-8 µm pores facilitating the escape of water. it is possible that the main difference between the structure of itZ and the primary matrix, as the matrix near or distant from the grains, consist in conditions under which the condensate water is gathered in mesopores. possibly, while water distant from the sand grains has enough place to initiate numerous small pores of nanoscale, water near the sand grains has less place to condensate, which could result in the occurrence of large mesopores with size of micrometers in the itZ. it is evident from the figure 10 that the above-discussed 1-8 µm large mesopores completely disappear if the sand content surpasses 82 wt.%. Because of the coarse pores opening, the water gathering was likely no longer hindered but condensed directly in the coarse pores. this implies that the large mesopores did not need to arise. the nanoscale mesopores of matrix however remained untouched in all of the specimens despite the sand content. they are only diminished proportionally to the filler/binder ratio.
COnCluSiOn
a series of geopolymer composites was investigated. their composition varied by the ratio between the sand and the metakaolinite geopolymer gel amount ranging from 0 to 93 wt.% of sand in the final product, a dried composite. The dependence of compressive and flexural strengths, young’s modulus and frost resistance were determined. the composite structure was controlled by the content of sand modifying the structure within the grain distances and the number of pores and their size distribution. Mercury porosimetry examined the structural parameters. at low sand content, the strengths were negatively affected by a presence of contraction micro-cracks in the geopolymer matrix. nevertheless, this was balanced by the addition of sand, because the grains acted as buffer blocking the cracks. in addition, the grains raised the strength greatly because of their interaction with the matrix, which modified the structure of the matrix on the grain surface and created a strong interface. as the proposed interfacial transition zone, that was not only to prevent the cracks but probably also to provide frost resistance, because it has been found that the resistant samples contained mesopores of a diameter of 1-8 µm. Besides their participation on porosity of 20-30%, what is important in order to achieve frost-resistance is the material cohesion as well. that is because the highest frost resistance was evidenced with the samples that had the best mechanical properties. the matrix cohesion and the adhesion to grain surface resulted (in comparison with portland cement concrete) in relatively high mecha-
Pore size in diameter (nm
/µm)
nm│µm
Rel
ativ
e vo
lum
e (%
)
Sand content (wt.%)
0
Monomodal mesopores
Bimodal mesopores
Full frost resistance
Coarse pores
0
10
14
20
2834395060747882869093
40
30
4-26-44-612-816-1220-1630-2040-3060-4080-60120-80160-120200-160300-200400-300600-400800-600
1.2-0.81-1.22-1.6
3-24-36-48-612-816-12
20-1640-2060-4080-60100-80120-100
figure 10. the histograms of the pore-size distribution.
Steinerova M.
372 Ceramics – Silikáty 55 (4) 362-372 (2011)
nical strengths of all the composites, even et an excess of sand, from 82 wt.%, which led to the formation of coarse pores, which worsened the results. the best mechanical properties were therefore revealed between 74 and 78 wt.% of sand, when the maximum sand content was simultaneously conducted by the space among the grains filled by the geopolymer gel. The explanation is a strengthening effect of sand, strong interface, and a lack of large voids due to packing. Beside that, it is the composition in which the participation of itZ in structure represents a high ratio at the expense of regular matrix.
references
1. Škvára f.: Ceramics-Silikaty 51, 173 (2007).2. Hanzliček T., Steinerova-Vondrakova M.: Ceramics-
Silikaty 46, 97 (2002).3. duxson p., fernandez-Jimenez a., provis J. l., lukey g.
C., palomo a., van deventer J. S. J.: J. Mater. Sci. 42, 2917 (2007).
4. duxson p., provis J. l., lukey g. C., Mallicoat S. W., Kriven W. M., van deventer J. S. J.: Colloids Surf. a 269, 47 (2005).
5. rüscher C. h., Mielcarek e., lutz W., ritzmann a., W. M. Kriven: am. Ceram. Soc. 93, 2585 (2010).
6 Hanzliček T., Steinerova M., Straka P.: J. Am. Ceram. Soc. 89, 3541 (2006).
7. Hanzliček T., Steinerova-Vondrakova M.: J. Am. Ceram. Soc. 89, 968 (2006).
8. lee W. K. W., van deventer J. S. J.: Cem. Concr. res. 34,195 (2004).
9. Brus J., Škrdlantová M.: J. non-Cryst. Solids 28, 61 (2001).10. elsharief a., Cohen M. d., Olek J.: Cem. Concr. res. 33,
1837 (2003).11. Machovič V., Kopecký L., Němeček J., Kolař F., Svitilova
J., Bittnar Z., andertová J.: Ceramics-Silikaty 52, 54 (2008).
12. lee W. K. W., van deventer J. S. J.: Cem. Concr. res. 37, 844 (2007).
13. Škvara F., Jilek T., Kopecký L.: Ceramics-Silikaty 49, 195 (2005).
14. yong S. l., feng d. W., lukey g. C., van deventer J. S. J.: Colloids Surf. a 302, 411 (2007).
15. Škvara, F., Kopecký, L., Němeček, J., Bittnar, Z.: Ceramics-Silikaty 50, 208 (2006).
16. perrin B., vu n. a., Multon S., voland t., ducroquetz C.: Construction and Building Materials 25, 1056 (2011).
17. Coussy O., Monteiro p. J. M.: Cem. Concr. res. 38, 40 (2008).
18. Perna I., Hanzliček T., Straka P., Steinerova M.: Ceramics-Silikaty 53, 48 (2009).
19. Hanzliček T., Steinerova M., Straka P., Perna I., Siegl P., Svarcová t.: Mater. des. 30, 3229 (2009).