mechanical properties of plasma-sprayed zro -8 wt% y o thermal
TRANSCRIPT

Sung R. ChoiOhio Aerospace Institute, Brook Park, Ohio
Dongming ZhuU.S. Army Research Laboratory, Glenn Research Center, Cleveland, Ohio
Robert A. MillerGlenn Research Center, Cleveland, Ohio
Mechanical Properties of Plasma-SprayedZrO2-8 wt% Y2O3 Thermal Barrier Coatings
NASA/TM—2004-213216
November 2004
https://ntrs.nasa.gov/search.jsp?R=20040191421 2018-02-14T09:51:12+00:00Z

The NASA STI Program Office . . . in Profile
Since its founding, NASA has been dedicated tothe advancement of aeronautics and spacescience. The NASA Scientific and TechnicalInformation (STI) Program Office plays a key partin helping NASA maintain this important role.
The NASA STI Program Office is operated byLangley Research Center, the Lead Center forNASA’s scientific and technical information. TheNASA STI Program Office provides access to theNASA STI Database, the largest collection ofaeronautical and space science STI in the world.The Program Office is also NASA’s institutionalmechanism for disseminating the results of itsresearch and development activities. These resultsare published by NASA in the NASA STI ReportSeries, which includes the following report types:
• TECHNICAL PUBLICATION. Reports ofcompleted research or a major significantphase of research that present the results ofNASA programs and include extensive dataor theoretical analysis. Includes compilationsof significant scientific and technical data andinformation deemed to be of continuingreference value. NASA’s counterpart of peer-reviewed formal professional papers buthas less stringent limitations on manuscriptlength and extent of graphic presentations.
• TECHNICAL MEMORANDUM. Scientificand technical findings that are preliminary orof specialized interest, e.g., quick releasereports, working papers, and bibliographiesthat contain minimal annotation. Does notcontain extensive analysis.
• CONTRACTOR REPORT. Scientific andtechnical findings by NASA-sponsoredcontractors and grantees.
• CONFERENCE PUBLICATION. Collectedpapers from scientific and technicalconferences, symposia, seminars, or othermeetings sponsored or cosponsored byNASA.
• SPECIAL PUBLICATION. Scientific,technical, or historical information fromNASA programs, projects, and missions,often concerned with subjects havingsubstantial public interest.
• TECHNICAL TRANSLATION. English-language translations of foreign scientificand technical material pertinent to NASA’smission.
Specialized services that complement the STIProgram Office’s diverse offerings includecreating custom thesauri, building customizeddatabases, organizing and publishing researchresults . . . even providing videos.
For more information about the NASA STIProgram Office, see the following:
• Access the NASA STI Program Home Pageat http://www.sti.nasa.gov
• E-mail your question via the Internet [email protected]
• Fax your question to the NASA AccessHelp Desk at 301–621–0134
• Telephone the NASA Access Help Desk at301–621–0390
• Write to: NASA Access Help Desk NASA Center for AeroSpace Information 7121 Standard Drive Hanover, MD 21076

Sung R. ChoiOhio Aerospace Institute, Brook Park, Ohio
Dongming ZhuU.S. Army Research Laboratory, Glenn Research Center, Cleveland, Ohio
Robert A. MillerGlenn Research Center, Cleveland, Ohio
Mechanical Properties of Plasma-SprayedZrO2-8 wt% Y2O3 Thermal Barrier Coatings
NASA/TM—2004-213216
November 2004
National Aeronautics andSpace Administration
Glenn Research Center

Acknowledgments
The authors are grateful to both Ralph Pawlik for experimental work and George Leissler for processingTBC billets. This work was supported by the Ultra-Efficient Engine Technology (UEET) Program,
NASA Glenn Research Center, Cleveland, Ohio.
Available from
NASA Center for Aerospace Information7121 Standard DriveHanover, MD 21076
National Technical Information Service5285 Port Royal RoadSpringfield, VA 22100
This report is a formal draft or workingpaper, intended to solicit comments and
ideas from a technical peer group.
Trade names or manufacturers’ names are used in this report foridentification only. This usage does not constitute an officialendorsement, either expressed or implied, by the National
Aeronautics and Space Administration.
Available electronically at http://gltrs.grc.nasa.gov

NASA/TM—2004-213216 1
Mechanical Properties of Plasma-Sprayed ZrO2-8 wt% Y2O3
Thermal Barrier Coatings
Sung R. Choi
Ohio Aerospace Institute
Brook Park, Ohio 44142
Dongming Zhu
U.S. Army Research Laboratory
National Aeronautics and Space Administration
Glenn Research Center
Cleveland, Ohio 44135
Robert A. Miller
National Aeronautics and Space Administration
Glenn Research Center
Cleveland, Ohio 44135
Summary
Mechanical behavior of freestanding, plasma-sprayed ZrO2-8 wt% Y2O3 thermal barrier coatings,
including strength, fracture toughness, fatigue, constitutive relation, elastic modulus, and directionality,
has been determined under various loading-specimen configurations. This report presents and describes a
summary of mechanical properties of the plasma-sprayed coating material to provide them as a design
database.
Introduction
Thermal barrier coatings (TBCs) have attracted ever-increasing attention for advanced gas turbine
and diesel engine applications because of their ability to provide thermal insulation to engine components
(refs. 1 to 3). The merits of using ceramic TBCs are well recognized and include a potential increase in
engine operating temperature with reduced cooling requirements, resulting in significant improvements in
thermal efficiency, performance, and reliability. Plasma-sprayed zirconia-based ceramics are one of the
most important coating materials because of their low thermal conductivity, relatively high thermal
expansivity, and unique microstructure as a result of the plasma spraying process. However, the durability
of TBCs under severe thermal and mechanical loading conditions encountered in heat engines remains
one of the major problems. As a result, the development of TBCs requires better understanding of both
mechanical and thermal behavior of the coating materials to ensure life and reliability of the engine
components.
During the past one to two decades, various plasma-sprayed thermal barrier coating systems have
been developed and characterized to determine their mechanical properties such as strength, creep,
deformation, elastic modulus, fatigue, and interfacial toughness at ambient and/or elevated temperatures
(refs. 4 to 23). These attempts have been made using either freestanding TBCs or TBC-substrate systems.
However, few studies have been done to present a multitude of mechanical properties of any given TBC
in a single place from which the properties can be conveniently used as a design database.
Mechanical and thermal properties of plasma-sprayed ZrO2-8 wt% Y2O3 TBCs have been evaluated
under various test conditions at the NASA Glenn. Mechanical properties of freestanding, as-sprayed

NASA/TM—2004-213216 2
TBCs are summarized in this report as simply as possible to provide them as a design database. The
mechanical properties include strength, fracture toughness, fatigue (slow crack growth), constitutive
relation (deformation), elastic modulus, and Poisson’s response, determined under various loading-
specimen configurations. TBCs exhibit unique microstructure with microcracking, porosity, and lamellar-
like splat morphology, so that they would be expected to reveal some directionality of mechanical
properties. The directionality effect has been quantified through fracture toughness and Knoop hardness
measurements and is also presented in this report. Some of the properties presented here have appeared
elsewhere, and those desiring additional details should see references 24 to 29; the data on strength
(in part), elastic modulus, Poisson’s response, and directionality are appearing here for the first time.
A comparison of mechanical properties with other or similar TBC systems was beyond the scope of this
report and thus was not made here; the ZrO2-8 wt% Y2O3 TBC system alone is studied here.
Experimental Techniques
Unlike dense ceramics, the stress-strain behavior of as-sprayed TBCs is not linear-elastic. Therefore,
applying conventional test methods that are employed for dense materials may not be pertinent, in a
rigorous sense, to TBCs. However, since no standardized test methods are currently available for TBCs,
most of the experimental techniques used here to determine their mechanical properties were followed in
principle in accordance with ASTM test standards that are primarily applied to dense advanced ceramics
that are commonly regarded to be isotropic and homogenous.
Material
The ZrO2-8 wt% Y2O3 powder (Zircoa, Inc., Solon, OH) with an average particle size of 60 µm,
fabricated by sintering and crushing, was first plasma-sprayed on a graphite substrate measuring
150 by 100 by 6.5 mm to a thickness of about 6 mm, using a Sulzer-Metco ATC–1 plasma coating system
(Sulzer Metco, Inc., Westbury, NY) with an industrial robot. The plasma-spray conditions can be found
elsewhere (ref. 30). Freestanding, as-sprayed ceramic billets were then obtained by burning away the
graphite substrate at 680 °C in air for 24 h. The billets were machined into test specimen configurations
such as cylindrical rods, flexure beams, or disks, depending on test matrix. Figure 1 shows a typical
layered structure, a polished surface, and a fracture surface, showing the microstructure of as-processed
coatings, in which a large number of microcracks and pores are characterized in conjunction with a splat
(platelet) structure. It has been found that the coatings primarily consist of the tetragonal t phase (ref. 8)
and have a density of 5.147±0.020 g/cm3 with a porosity of about 10 percent.

NASA/TM—2004-213216 3
Strength
The five different loading-specimen configurations used in strength testing at ambient temperature
(25 °C) were uniaxial tension, transthickness tension, uniaxial compression, four-point uniaxial flexure,
and ring-on-ring biaxial flexure. Schematics of test specimens and direction of applied load with respect
to plasma-spray direction are shown in figure 2. Dimensions of test specimens and corresponding test
methods (ASTM C 1273, C 1468, C 1424, and C 1161 in refs. 31 to 34, respectively) are shown in table I.
Note that in certain cases some variations in test specimens’ dimensions from the specifications of related
ASTM test standards were inevitable, due to the limited size of the coating material. The final finish of
test specimens was achieved using #500 diamond grinding wheel. For test specimens with a round
section, a combination of surface and cylindrical grinding was used. Testing was performed at a test rate
of 0.5 mm/min using an electromechanical test frame (Model 8562, Instron Corporation, Canton, MA).
The magnitude of strength was found almost independent whether the top surface was placed in tension or
the bottom surface previously in contact with the graphite substrate was placed in tension, as determined
with four-point flexure bars.
Fracture Toughness
The method used to determine fracture toughness in modes I and II at 25, 800, and 1316 °C was the
single edge V-notched beam (SEVNB) technique (ref. 35). Sharp V notches in which final notch depth
and root radius were 2.0 mm and 20 to 50 µm, respectively, were introduced in flexure test specimens
(3 by 4 (depth) by 25 to 50 mm). Through-the-thickness sharp notches thus prepared were aligned parallel
with respect to the plasma spraying direction. Other methods used to generate sharp cracks to estimate

NASA/TM—2004-213216 4
TABLE I.—RESULTS OF STRENGTH TESTING FOR PLASMA-SPRAYED ZrO2-8wt% Y2O3 THERMAL BARRIER
COATINGS IN FIVE DIFFERENT LOADING-SPECIMEN CONFIGURATIONS AT AMBIENT TEMPERATURE
Type of testing Test
method
Specimen
dimensions,a
mm
Number
of test
specimens
Direction of
fractureb
Average
strength,c
MPa
Weibull
modulus,
m
Uniaxial tensionASTM
C 12735 15 (diam L) 10 P 15(1) 7
Transthickness
tension
ASTM
C 146815 3 (diam T) 10 N 11(1) 13
Uniaxial compressionASTM
C 14245 10 (diam L) 10 P/N 300(77) 4
Uniaxial flexure
(four-point)
ASTM
C 1161
3 4 25 to 50
(H W L),
20/40- or
10/20-mm spans
30 P 33(7) 6
Biaxial flexure
(ring-on-ring)------
25 3 (diam T)
(11/22 mm rings)10 P 40(4) 12
aDiam is diameter; L, length; T, thickness; H, height; W, width.
bDirection of fracture with respect to the plasma-spray direction. P is parallel; N, normal.
cNumbers in parentheses indicate ±1.0 standard deviation.
fracture toughness, such as the single edge precracked beam and the surface crack in flexure techniques
(ASTM C 1421, ref. 36) by indentation, were not feasible for the coating material, since indentation
response was very poor because of the material’s significant porosity and microcracks. Modes I and II
fracture toughness KIc and KIIc were determined in symmetric and asymmetric four-point flexure,
respectively, as shown in figure 3. Testing was performed in air at a test rate of 0.5 mm/min using the
electromechanical test frame. At elevated-temperature testing, each test specimen was heated at a rate of
about 20 °C/min and held for 15 min at test temperature for about 15 min prior to testing. Typically, more
than four specimens were tested in each mode at a given temperature.
Fatigue (Slow Crack Growth)
Dynamic fatigue (constant stress rate) testing in accordance with ASTM C 1368 and C 1465 (refs. 37
and 38, respectively) was performed in flexure at 25 and 800 °C in air to evaluate slow-crack-growth
behavior of the coating material. The dimensions of test specimens were identical to those used in

NASA/TM—2004-213216 5
uniaxial four-point flexure strength or fracture toughness testing. The number of stress rates was three, 50,
0.05, and 0.0005 MPa/s, and the number of test specimens was five at each stress rate. Cyclic fatigue
(cyclic stress) testing was also conducted in tension at 25 °C in air using uniaxial tensile test specimens
(see fig. 2) with a stress ratio of R = 0.1 at a frequency of 10 Hz (R = min/ max, where is applied stress).
Dynamic and cyclic fatigue testing were conducted using electromechanical (Model 8562) and
servohydraulic (Model 8502, Instron, Canton, MA) test frames.
Constitutive Relation and Deformation Behavior
Strain gages were used to determine constitutive relations (stress-strain curves or deformation
behavior) for different loading-specimen configurations used in the strength testing (fig. 2). Typically,
one test specimen with one strain gage aligned along the principal stress direction was used for each
configuration. In ring-on-ring biaxial flexure, a biaxial strain gage was placed at the center of the disk in
tension side. Particularly, in four-point flexure loading, two strain gages—one in tension and another in
compression—were employed to determine the constitutive relations in both sides of a test specimen.
Elastic Modulus and Poisson’s Ratio
Elastic modulus was determined from the slopes of the stress-strain curves obtained from the
“constitutive relation” testing. In addition, the impulse excitation technique, ASTM C 1259 (ref. 39), was
employed using flexure test specimens (3 by 4 by 50 mm) to determine elastic modulus in both directions
at ambient temperature. Direction 1 corresponds to the case that excitation in flexure mode is made on the
4 mm side of a test specimen, while direction 2 is the case when excitation is made on the 3 mm side.
Five test specimens were used.
Poisson’s ratio was estimated with a uniaxial compression test specimen (fig. 2) by determining both
longitudinal and transverse strains via two strain gages that were oriented perpendicular to each other. A
test specimen annealed at 1316 °C in air for 500 h was also used for comparison.
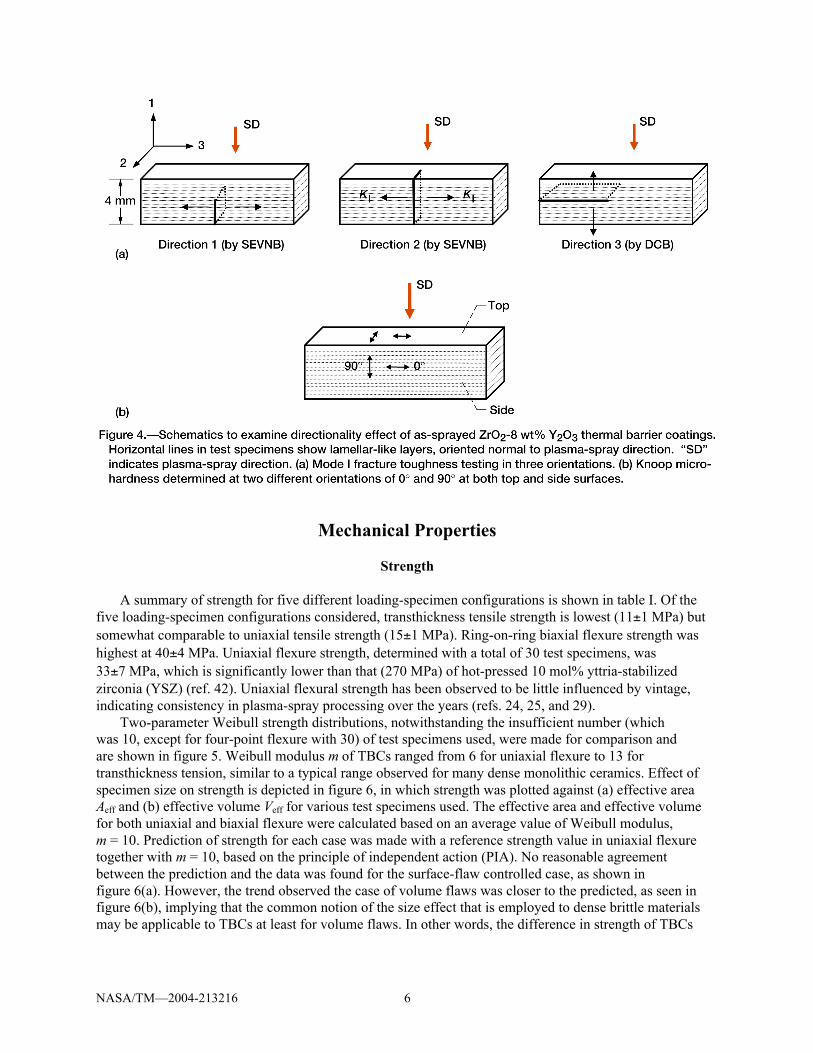
Directionality
The effect of direction of the mechanical properties of as-sprayed TBCs was examined using flexure
test specimens by determining both mode I fracture toughness and microhardness as a function of
material axis, as shown in figure 4. Fracture toughness (see fig. 4(a)) in direction 2 was determined by the
SEVNB method, whereas fracture toughness in direction 3 (i.e., the interlamina direction) was determined
by the double cantilever beam (DCB) method with a sharp V notch introduced in the midplane of the test
specimens. Four to five flexure test specimens were tested for each direction. Fracture toughness in the
DCB specimens was calculated based on the formula by Murakami (ref. 40).
Knoop microhardness, in accordance with ASTM C 1326 (ref. 41), was determined with a four-point
flexure test specimen (see fig. 4(b)) at both 0° and 90° on its top (perpendicular to plasma-spraying
direction) and side (parallel to plasma-spraying direction) surfaces. An indentation load of 9.8 N was used
with a total of five indents at each orientation for a given specimen surface.
NASA/TM—2004-213216 6
Mechanical Properties
Strength
A summary of strength for five different loading-specimen configurations is shown in table I. Of the
five loading-specimen configurations considered, transthickness tensile strength is lowest (11±1 MPa) but
somewhat comparable to uniaxial tensile strength (15±1 MPa). Ring-on-ring biaxial flexure strength was
highest at 40±4 MPa. Uniaxial flexure strength, determined with a total of 30 test specimens, was
33±7 MPa, which is significantly lower than that (270 MPa) of hot-pressed 10 mol% yttria-stabilized
zirconia (YSZ) (ref. 42). Uniaxial flexural strength has been observed to be little influenced by vintage,
indicating consistency in plasma-spray processing over the years (refs. 24, 25, and 29).
Two-parameter Weibull strength distributions, notwithstanding the insufficient number (which
was 10, except for four-point flexure with 30) of test specimens used, were made for comparison and
are shown in figure 5. Weibull modulus m of TBCs ranged from 6 for uniaxial flexure to 13 for
transthickness tension, similar to a typical range observed for many dense monolithic ceramics. Effect of
specimen size on strength is depicted in figure 6, in which strength was plotted against (a) effective area
Aeff and (b) effective volume Veff for various test specimens used. The effective area and effective volume
for both uniaxial and biaxial flexure were calculated based on an average value of Weibull modulus,
m = 10. Prediction of strength for each case was made with a reference strength value in uniaxial flexure
together with m = 10, based on the principle of independent action (PIA). No reasonable agreement
between the prediction and the data was found for the surface-flaw controlled case, as shown in
figure 6(a). However, the trend observed the case of volume flaws was closer to the predicted, as seen in
figure 6(b), implying that the common notion of the size effect that is employed to dense brittle materials
may be applicable to TBCs at least for volume flaws. In other words, the difference in strength of TBCs

NASA/TM—2004-213216 7
between different specimen geometries would be explained at minimum by the specimen size effect
associated with volume flaws. However, the deviation of prediction from the data still indicates that
inconsistency in flaw populations was much more predominant in complexly structured TBCs than in
relatively homogeneous dense brittle ceramics.

NASA/TM—2004-213216 8
Typical examples of fracture surfaces and fracture modes of various tested specimens are shown in
figure 7. Fracture surfaces of TBCs are typified such that exact fracture origins and their nature were
hardly identifiable, because of the loosely connected, open structure, which also yielded significantly low
strength. Probable fracture origins are indicated with arrows in the figure. For dense brittle materials, the
fracture origin can be easily identified from a well-developed region of the fracture mirror, and its nature
can be explored in relative simplicity. Hence, unlike dense brittle ceramics, TBCs give rise to an
enormous challenge in fractography.
Fracture Toughness
A summary of modes I and II fracture toughness is presented in figure 8. The values of KIc and KIIc
represent the average of four and eight measurements, respectively, at 25 °C and the average of four
measurements for each tested at 1316 °C. The values of fracture toughness were KIc = 1.15±0.07,
1.03±0.07, and 0.98±0.13 MPa m at 25, 800, and 1316 °C, respectively, whereas KIIc = 0.73±0.10 and
0.65 ± 0.04 MPa at m 25 and 1316 °C, respectively. This indicates that fracture toughness in either
mode I or mode II remained almost consistent regardless of temperature up to 1316 °C. KIIc was about
35 percent lower than KIc. It has been reported that for some dense ceramics, KIIc was greater than KIc,

NASA/TM—2004-213216 9
presumably attributed to frictional
interaction between the two facing crack
planes (ref. 43). However, the previous
studies on advanced dense ceramics
including silicon nitrides, alumina, and
zirconia (refs. 44 and 45) showed a different
result: KIIc was almost identical to KIc,
indicative of an insignificant frictional
effect on KIIc by either coarse-grained or
fine-grained ceramics. The coating material,
however, did not exhibit similar values in
both KIIc and KIc but rather yielded a lower
value in KIIc than in KIc at both 25 and
1316 °C. Hot-pressed 10 mol% YSZ
showed a value of KIc = 1.7 MPa m at
25 °C (ref. 42), consistent with other dense
YSZs (with >8 mol% yttria) exhibiting
KIc = 1 to 2 MPa m (refs. 46 and 47).
It must be noted that the effect of sintering on fracture toughness during elevated-temperature testing
particularly at 1316 °C was found to be negligible based on a sintering study in which fracture toughness
increase of the coating material was about 0.12 MPa m /h for the first 5-h annealing at 1316 °C in air
(ref. 29). This indicates that the fracture toughness increase observed in the present tests at 1316 °C would
be about 3 percent. Therefore, care must be exercised in interpreting test results when even higher test
temperatures and/or longer test durations are used. This caution applies to any mechanical testing for
plasma-sprayed TBCs at elevated temperatures.
Fatigue (Slow Crack Growth)
Fatigue (slow crack growth) behavior of TBCs at 25 °C in tension and at 800 °C in flexure is shown
in figure 9. The coating material exhibited a negligible susceptibility to cyclic fatigue in tension at 25 °C
with a significant fatigue parameter n > 100, as shown in figure 9(a). The fatigue parameter n is from the
conventional power-law type of crack growth, expressed as
VK
K
n
=⎛
⎝⎜
⎞
⎠⎟α I
Ic
where V is crack velocity, is another fatigue parameter, and KI is Mode I stress intensity factor. At
800 °C, the coating material did not exhibit any fatigue (i.e., n > 100), but rather a strength increase with
decreasing applied test rate, attributed to some minor sintering effect at lower test rates, as shown in
figure 9(b). These results indicate that the resistance to fatigue or slow crack growth of as-sprayed TBCs
was very significant at both temperatures, implying that slow crack growth under either cyclic tension or
monotonic flexure would be hindered by frequent entrapping of a growing crack at the pore- and/or
microcrack-rich regions. The significant resistance of TBCs to fatigue was also observed in cyclic tension
at ambient temperature by Wesling, Socie, and Beardsley (ref. 48).

NASA/TM—2004-213216 10
Constitutive Relation and Deformation Behavior
Figure 10 shows the stress-strain curves in tension, compression, biaxial flexure, and uniaxial flexure.
TBCs did not exhibit any idealized linear elasticity in either loading or unloading, resulting in an
appreciable hysteresis in one full loading-unloading sequence. A similar nonlinear elastic behavior was
also found previously by the authors (unpublished) in sandstone that possesses a TBC-like, loosely
connected, open microstructure. Despite their nonlinearity, as-sprayed TBCs revealed almost elastic
behavior with little plastic deformation. The nonlinear elastic behavior was independent of loading rate,
number of cycles, and type of loading configurations in either tension, compression, or flexure (refs. 24,
26, and 27). The initial stress-strain curves were altered slightly as the number of loading-unloading
cycles increased, as seen in figures 10(a) and (c). However, once the number of cycles was beyond 10 or
so, the difference in the shape of stress-strain curves remained almost unchanged. This indicates that any
notable damage evolution, such as crack propagation, microcracking, and/or mechanical-interlocking
loosening, would not have occurred under repeated loading-and-unloading sequences. The stress-strain
curve of a uniaxial flexure test specimen exhibited greater stiffness in compression than in tension,
evidence of the loosely connected, open microstructure of TBCs. Several sequences of loading and
unloading with different levels of compressive stress are shown in figure 11. This figure shows that
regardless of applied stress, each loading curve follows the same loading path, whereas the unloading
curve follows a unique path from the respective peak stress, eventually returning back to its original
starting point.
Elastic Modulus and Poisson’s Ratio
Elastic modulus.—Due to significant nonlinear behavior of its stress-strain curves, a single-valued
elastic modulus of the coating material cannot be determined. Rather, different values of elastic modulus
are evaluated, depending on the type of loading and on the magnitude of applied stress. The most accurate
approach, of course, is to use the tangent modulus (E = d /d ) of elasticity, which is the slope of a stress
( )-strain ( ) curve at any point for a given loading or unloading sequence (refs. 22 and 26). With this

NASA/TM—2004-213216 11
approach, an assessment of elastic modulus could be made for a given range of applied stress, consistently
from specimen to specimen. However, this approach is not practical—particularly in design, analysis, and
lifing, in which single values of elastic modulus are predominantly desirable.
Alternatively, if the variation of slopes in the curves is not significant from the lowest stress to the
peak, the slope between these two extreme points, the secant modulus of elasticity in a broad sense, could
be used as an approximated value of elastic modulus. This alternative approach, applied to tension and
compression in each of their loading sequences in figures 10(a) and (b), yielded an elastic modulus of
Et 13 GPa in tension and Ec 25 GPa in compression. The variation of elastic modulus with different
levels of applied stress, for example in compression, was negligible with Ec 22 to 25 GPa at applied
stresses of 10, 20, 30, and 45 MPa. It is noted that elastic modulus in pure tension, Et = 13 GPa, is
comparable with Et = 16 GPa in transthickness tension (ref. 26), where the latter was evaluated between
applied stresses of 0 to 5 MPa. However, this secant-modulus approach does not account for the
hysteresis and would not be appropriate for the unloading sequences. Because of the difference in elastic
modulus between tension and compression, a neutral-axis shift should be taken into account in calculating
stresses in uniaxial and biaxial flexure. The stresses in both biaxial and uniaxial flexure shown in
figures 10(c) and (d), respectively, were calculated based on the linear elastic approach without
considering the neutral-axis shift for simplicity. Without considering the neutral-axis shift, the elastic
modulus was determined to be E = 44 GPa with Poisson ratio of 0.04 in biaxial flexure (fig. 10(c)), and
E = 24 and 30 GPa in tension and compression sides, respectively, in uniaxial flexure (fig. 10(d)).

NASA/TM—2004-213216 12
The situation that elastic modulus varies with applied stress could be changed when TBCs are
annealed at elevated temperatures, so that gradually increasing linearity develops with increasing
annealing time, as shown in figure 12 (ref. 29). The stress-strain curves in the figure were obtained in
compression at 25 °C after annealing cylindrical compression test specimens at 1316 °C in air. This
change in constitutive relation was attributed to sintering in which the coating material was converted
from a loosely connected to a more closely connected microstructure. The values of elastic modulus were
E 45, 55, 75, and 77 GPa, respectively, for 5, 20, 100, and 500 h annealing time, while the as-sprayed
value was E 25 GPa, as previously mentioned. In view of this systematic change in constitutive relation,

NASA/TM—2004-213216 13
it would be reasonable to use the two extreme points of a curve, as a first order of approximation, in order
to estimate an approximated value of elastic modulus of as-sprayed TBCs. The effect of sintering on
various mechanical properties of TBCs has been determined in detail in a previous study (ref. 29).
The values of elastic modulus determined by the impulse excitation technique were E = 36±2 and
39±2 GPa, respectively, for directions 1 and 2 (see fig. 4(a)). Note the insignificant difference between
the values in the two directions. The values of elastic modulus determined by impulse excitation were
greater than those determined by strain gaging (Et 13 GPa and Ec 25 GPa). The reason for this
discrepancy has not been explored yet, but is believed to be due to the fact that elastic modulus estimated
by the impulse excitation technique involved a flexural mode of vibration, a combination of both tension
and compression displacements. This may require a modification of the fundamental flexural-resonance
equation in the impulse excitation method if it is used for TBCs that exhibit a difference in elastic
modulus between tension and compression. Note that the impulse excitation technique is used primarily
for isotropic, homogeneous materials. Elastic modulus of hot-pressed 10 mol% YSZ was found to be
E = 219 GPa by the impulse excitation technique (ref. 42).
Poisson’s ratio.—Figure 13 shows both longitudinal and transverse strains of cylindrical compression
test specimens as sprayed and annealed at 1316 °C for 500 h in air, determined by strain gaging. Despite
the appreciable nonlinearity in stress-strain curves of the as-sprayed test specimen, Poisson’s ratio, which
is defined as = 2/ 1 (see the figure) for each pair of loading curves, was very low but relatively
consistent with = 0.04, regardless of level of applied stress. By contrast, the annealed test specimen
exhibited an increased value of Poisson’s ratio, = 0.2, which is close to the Poisson’s ratio of many
dense brittle materials. This again shows a change in microstructure from a loosely connected to a closely
connected network, due to the sintering effect upon high temperature annealing.
Directionality
TBCs were fabricated via the plasma-spray process so that anisotropy might be expected because of
the prevailing open, splat microstructure preferably aligned perpendicular with respect to the plasma-
spray direction. The effect of such anisotropy, as described in the Experimental Techniques section, was
determined for as-sprayed TBCs through mode I fracture toughness and Knoop microhardness testing.
The results are summarized in table II.

NASA/TM—2004-213216 14
TABLE II.—FRACTURE TOUGHNESS AND KNOOP MICROHARDNESS WITH RESPECT
TO MATERIAL DIRECTION FOR PLASMA-SPRAYED ZrO2-8 wt% Y2O3
THERMAL BARRIER COATINGS AT AMBIENT TEMPERATURE
Type of testing Direction or surfacea
Methodb
Number of tests Average valuesc
Fracture toughness,
KIc,
MPa m
1
2
3
SEVNB
SEVNB
DCB
5
4
4
Overall average
1.15(0.07)
1.04(0.11)
1.04(0.05)
1.08(0.06)
Microhardness,d
H,
GPa
0°, side
90°, side
0°, top
90°, top
Knoop
Knoop
Knoop
Knoop
5
5
5
5
Overall average
3.25(0.32)
3.19(0.86)
3.31(0.55)
3.68(1.27)
3.36(0.45)aSee figure 4.
bSEVNB is single edge V-notched beam and DCB, double cantilever beam.
cNumbers in parentheses indicate ±1.0 standard deviation.
dIndentation load of 9.8 N was used.
The values of fracture toughness additionally determined in directions 2 and 3 (see fig. 4(a))
were KIc = 1.04±0.11 and 1.04±0.05 MPa m , respectively. These values compare well with KIc =
1.15±0.07 MPa m in direction 1, described in the foregoing Fracture Toughness section. Therefore,
fracture toughness yielded an almost consistent value with only a 10 percent variation in three directions,
showing an insignificant directionality response. Note that the expected weakest direction (interlaminar,
direction 3) yielded a value of fracture toughness similar to the presumably strongest counterpart
(direction 1 or 2).
As for Knoop microhardness as a function of material axis (see fig. 4(b)), a particular interest is in the
side surface: the value of microhardness (H = 3.25±0.32 GPa) parallel to the layers (at 0° angle) was not
significantly different from that (3.19±0.86 GPa) perpendicular to the layers (at 90° angle). Furthermore,
Knoop microhardness exhibited little difference between 0 and 90° directions in the top surface,
resulting in similar values to those in the side surface. This indicates that as-sprayed TBCs exhibited
macroscopically “homogenous” in response to microhardness deformation. However, the somewhat
significant scatter in hardness—the COV (coefficient of variation) ranges from 10 to 35 percent—should
not be neglected. Also, it must be stated that the value of microhardness was found to be dependent on
applied indentation load because of the localized densification of TBCs upon indentation: less localized
densification would occur with a lower indentation load, resulting in a higher microhardness value, and
vice versa (ref. 29). A value of H = 2.7 GPa was reported for as-sprayed ZrO2-8 wt% Y2O3 by Knoop
indentation with an indent load of 9.8 N (ref. 12).
As already seen, the elastic modulus of the coating material was similar both in uniaxial tension
(E 13 GPa) and in transthickness (interlaminar) tension (E 16 GPa) determined by strain gaging, and
there was also reasonable agreement between the values in direction 1 (E = 36 GPa) and direction 2
(E = 39 GPa) obtained from the impulse excitation technique.
A conclusion considering the effect of direction on the mechanical properties can be made: despite
their unique complicated, loosely connected, open microstructure, the as-sprayed TBCs used in this work
could be categorized as homogeneous materials from a perspective of macroscopic continuum mechanics.
Concluding Remarks
Mechanical properties of free-standing as-sprayed ZrO2-8 wt% Y2O3 thermal barrier coatings were
described and summarized in this report. The properties examined were strength, fracture toughness,
fatigue, constitutive relation, elastic modulus, Poisson’s ratio, and directionality. The loosely connected,
open microstructure of the TBCs resulted in unique responses to mechanical loading, so many mechanical
NASA/TM—2004-213216 15
properties and responses of TBCs were unique and different from those of dense polycrystalline ceramics.
From the continuum mechanics point of view, directionality of as-sprayed TBCs was found to be
macroscopically negligible through the determinations of fracture toughness, Knoop microhardness, and
elastic modulus with respect to material axis.
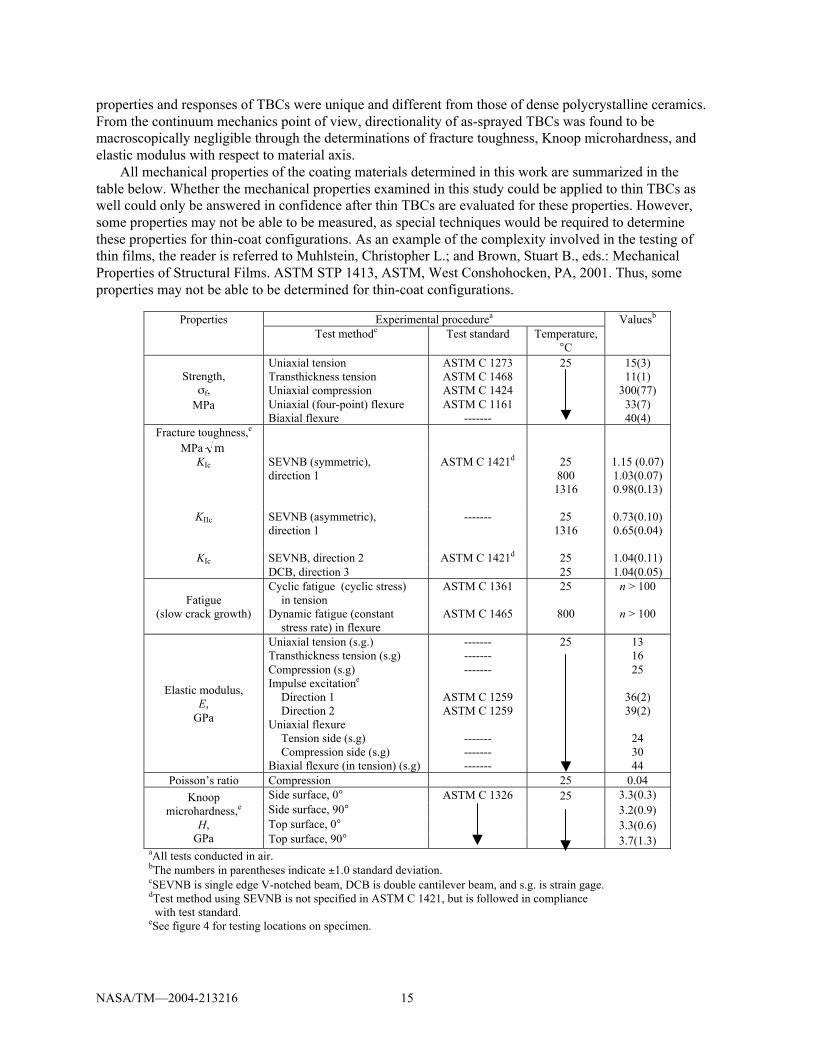
All mechanical properties of the coating materials determined in this work are summarized in the
table below. Whether the mechanical properties examined in this study could be applied to thin TBCs as
well could only be answered in confidence after thin TBCs are evaluated for these properties. However,
some properties may not be able to be measured, as special techniques would be required to determine
these properties for thin-coat configurations. As an example of the complexity involved in the testing of
thin films, the reader is referred to Muhlstein, Christopher L.; and Brown, Stuart B., eds.: Mechanical
Properties of Structural Films. ASTM STP 1413, ASTM, West Conshohocken, PA, 2001. Thus, some
properties may not be able to be determined for thin-coat configurations.
Experimental procedurea
Properties
Test methodc
Test standard Temperature,
°C
Valuesb
Strength,
f,
MPa
Uniaxial tension
Transthickness tension
Uniaxial compression
Uniaxial (four-point) flexure
Biaxial flexure
ASTM C 1273
ASTM C 1468
ASTM C 1424
ASTM C 1161
-------
25 15(3)
11(1)
300(77)
33(7)
40(4)
Fracture toughness,e
MPa mKIc SEVNB (symmetric),
direction 1
ASTM C 1421d
25
800
1316
1.15 (0.07)
1.03(0.07)
0.98(0.13)
KIIc SEVNB (asymmetric),
direction 1
------- 25
1316
0.73(0.10)
0.65(0.04)
SEVNB, direction 2 ASTM C 1421d
25 1.04(0.11)KIc
DCB, direction 3 25 1.04(0.05)
Fatigue
(slow crack growth)
Cyclic fatigue (cyclic stress)
in tension
Dynamic fatigue (constant
stress rate) in flexure
ASTM C 1361
ASTM C 1465
25
800
n > 100
n > 100
Elastic modulus,
E,
GPa
Uniaxial tension (s.g.)
Transthickness tension (s.g)
Compression (s.g)
Impulse excitatione
Direction 1
Direction 2
Uniaxial flexure
Tension side (s.g)
Compression side (s.g)
Biaxial flexure (in tension) (s.g)
-------
-------
-------
ASTM C 1259
ASTM C 1259
-------
-------
-------
25 13
16
25
36(2)
39(2)
24
30
44
Poisson’s ratio Compression 25 0.04
ASTM C 1326 25 3.3(0.3)
3.2(0.9)
3.3(0.6)
Knoop
microhardness,e
H,
GPa
Side surface, 0°
Side surface, 90°
Top surface, 0°
Top surface, 90° 3.7(1.3)aAll tests conducted in air.
bThe numbers in parentheses indicate ±1.0 standard deviation.
cSEVNB is single edge V-notched beam, DCB is double cantilever beam, and s.g. is strain gage.
dTest method using SEVNB is not specified in ASTM C 1421, but is followed in compliance
with test standard.eSee figure 4 for testing locations on specimen.

NASA/TM—2004-213216 16
References
1. Miller, R.A.: Current Status of Thermal Barrier Coatings An Overview. Surf. Coat. Tech., vol. 30,
no. 1, 1987, pp. 1 11.
2. Miller, R.A.: Thermal Barrier Coatings for Aircraft Engines History and Directions. Thermal
Barrier Coating Workshop, NASA CP 3312, 1996, pp. 17 34.
3. Yonushonis, T.M.: Thick Thermal Barrier Coatings for Diesel Components; Final Report. NASA
CR 187111, 1991.
4. Firestone, R.F., et al.: Creep of Plasma-Sprayed ZrO2 Thermal-Barrier Coatings. Ceram. Eng. Sci.
Proc., vol. 3, nos. 9 10, 1982, pp. 758 771.
5. Eaton, H.E.; and Novak, R.C.: Sintering Studies of Plasma-Sprayed Zirconia. Surf. Coat. Tech.,
vol. 32, 1987, nos. 1 4.
6. Brink, R.C.: Material Property Evaluation of Thick Thermal Barrier Coating Systems. J. Eng. Gas
Turbines Power, vol. 111, 1989, pp. 570 577.
7. Cruse, T.A.; Johnsen, B.P.; and Nagy, A.: Mechanical Properties Testing and Results for Thermal
Barrier Coatings. J. Thermal Spray Technol., vol. 6, no. 1, 1997, pp. 57 66.
8. Zhu, D.M.; and Miller, R.A.: Sintering and Creep Behavior of Plasma-Sprayed Zirconia- and
Hafnia-Based Thermal Barrier Coatings. Surf. Coat. Tech., vol. 108, nos. 1 3, 1998, pp. 114 120.
9. Berndt, C.C., et al.: Influence of Plasma Spray Parameters on Mechanical Properties of Yttria
Stabilized Zirconia Coatings. I: Four Point Bend Test. Mater. Sci. Eng., vol. A284, nos. 1 2, 2000,
pp. 29 40.
10. Rybicki, E.F., et al.: In Situ Evaluations of Young’s Modulus and Poisson’s Ratio Using a
Cantilever Beam Specimen. Advances in Thermal Spray Science and Technology, Proceedings of
the 8th National Thermal Spray Conference, C.C. Berndt and S. Sampath, ASM International,
Materials Park, OH, 1995, pp. 409 414.
11. Johnson, C.A., et al.: A Method for Measuring Non-Linear Elastic Properties of Thermal Barrier
Coatings. Advances in Thermal Spray Science and Technology, Proceedings of the 8th National
Thermal Spray Conference, C.C. Berndt and S. Sampath, ASM International, Materials Park, OH,
1995, pp. 415 420.
12. Leigh, S.H.; Lin, C.K.; and Berndt, C.C.: Elastic Response of Thermal Spray Deposits Under
Indentation Tests. J. Am. Ceram. Soc., vol. 80, no. 8, 1997, pp. 2093 2099.
13. Rejda, E.F.; Socie, D.F.; and Itoh, T.: Deformation Behavior of Plasma-Sprayed Thick Thermal
Barrier Coatings. Surf. Coat. Tech., vol. 113, no. 3, 1999, pp. 218 226.
14. Trice, R.W.; Prine, D.W.; and Faber, K.T.: Deformation Mechanisms in Compression-Loaded,
Stand-Alone Plasma-Sprayed Alumina Coatings. J. Am. Ceram. Soc., vol. 83, no. 12, 2000,
pp. 3057 3064.
15. Cruse, T.A.; Stewart, S.E.; and Ortiz, M.: Thermal Barrier Coating Life Prediction Model
Development. J. Eng. Gas Turbines Power, vol. 110, no. 4, 1988, pp. 610 616.
16. Wesling, K.F.; Socie, D.F.; and Beardsley, B.: Fatigue of Thick Thermal Barrier Coatings. J. Am.
Ceram. Soc., vol. 77, no. 7, 1994, pp. 1863 1868.
17. Johnsen, B.P., et al.: Compressive Fatigue of a Plasma-Sprayed ZrO2-8wt%-Y2O3 and ZrO2-10wt%-
Nicralcoy TTBC. J. Eng. Mater. Technol. Trans. ASME, vol. 117, no. 3, 1995, pp. 305 310.
18. Shaw, L.L., et al.: Measurements of the Interfacial Fracture Energy of Thermal Barrier Coatings.
Scr. Mater., vol. 39, no. 10, 1998, pp. 1427 1434.
19. Callus, P.J.; and Berndt, C.C.: Relationships Between the Mode II Fracture Toughness and
Microstructure of Thermal Spray Coatings. Surf. Coat. Tech., vol. 114, nos. 2 3, 1999,
pp. 114 128.
20. Thurn, G., et al.: Toughness Anisotropy and Damage Behavior of Plasma Sprayed ZrO2 Thermal
Barrier Coatings. Surf. Coat. Tech., vol. 123, nos. 2 3, 2000, pp. 147 158.

NASA/TM—2004-213216 17
21. Zhou, Y.C., et al.: Fracture Characteristics of Thermal Barrier Coatings After Tensile and Bending
Tests. Surf. Coat. Tech., vol. 157, nos. 2 3, 2002, pp. 118 127.
22. Evans, A.G., et al.: Mechanisms Controlling the Durability of Thermal Barrier Coatings. Prog.
Mater. Sci., vol. 46, no. 5, 2001, pp. 505 553.
23. Steinbrech, R.W.: Thermomechanical Behavior of Plasma Sprayed Thermal Barrier Coatings.
Ceram. Eng. Sci. Proc., vol. 23, no. 4, 2002, pp. 397 408.
24. Choi, S.R.: High-Temperature Slow Crack Growth, Fracture Toughness and Room-Temperature
Deformation Behavior of Plasma-Sprayed ZrO2-8wt% Y2O3. Ceram. Eng. Sci. Proc., vol. 19, no. 4,
1998, pp. 293 301.
25. Choi, S.R.; Zhu, D.; and Miller, R.A.: Flexural and Compressive Strengths and Room-Temperature
Creep/Relaxation Properties of Plasma-Sprayed ZrO2-8wt% Y2O3. Ceram. Eng. Sci. Proc., vol. 20,
issue 3, 1999, pp. 365 372.
26. Choi, S.R.; and Zhu, D.; and Miller, R.A.: Deformation and Strength Behavior of Plasma-Sprayed
ZrO2-8wt% Y2O3 Thermal Barrier Coatings in Biaxial Flexure and Trans-Thickness Tension.
Ceram., Eng. Sci. Proc., vol. 21, no. 4, 2000, pp. 653 661.
27. Choi, S.R.; Zhu, D.M.; and Miller, R.A.: Deformation and Tensile Cyclic Fatigue of Plasma-
Sprayed ZrO2-8wt% Y2O3 Thermal Barrier Coatings. Ceram. Eng. Sci. Proc., vol. 22, no. 4, 2001,
pp. 427 434, 2001.
28. Choi, Sung R., Zhu, Dongming, and Miller, Robert A.: Mode I, Mode II, and Mixed-Mode Fracture
of Plasma-Sprayed Thermal Barrier Coatings at Ambient and Elevated Temperatures.
NASA/TM 2003-212185, 2003.
29. Choi, Sung R.; Zhu, Dong-Ming, and Miller, Robert A.: Effect of Sintering on Mechanical and
Physical Properties of Plasma-Sprayed Thermal Barrier Coatings. NASA/TM 2004-212625, 2004.
30. Zhu, D.M.; and Miller, R.A.: Thermal Conductivity and Elastic Modulus Evolution of Thermal
Barrier Coatings Under High Heat Flux Conditions. J. Therm. Spray Tech., vol. 9, no. 2, 2000,
pp. 175 180.
31. Test Method for Tensile Strength of Monolithic Advanced Ceramics at Ambient Temperatures.
Annual Book of ASTM Standards 2004, ASTM Designation: C 1273 95a(2000), section 15,
vol. 15.01, ASTM, West Conshohocken, PA, 2004.
32. Test Method for Transthickness Tensile Strength of Continuous Fiber-Reinforced Advanced
Ceramics at Ambient Temperature. Annual Book of ASTM Standards 2004, ASTM Designation:
C 1468 00, section 15, vol. 15.01, ASTM, West Conshohocken, PA, 2004.
33. Test Method for Monotonic Compressive Strength of Advanced Ceramics at Ambient Temperature.
Annual Book of ASTM Standards 2004, ASTM Designation: C 1424 99, section 15, vol. 15.01,
ASTM, West Conshohocken, PA, 2004.
34. Test Method for Flexural Strength of Advanced Ceramics at Ambient Temperature. Annual Book of
ASTM Standards 2004, ASTM Designation: C 1161 02c, section 15, vol. 15.01, ASTM, West
Conshohocken, PA, 2004.
35. a. Kübler, J.: Fracture Toughness of Ceramics Using the SEVNB Method: Preliminary Results. Cer.
Eng. Sci. Proc., vol. 18, issue 4, 1997.
b. Quinn, G.; Kübler, J.; and Gettings, J.: Fracture Toughness of Advanced Ceramics by the Surface
Crack in Flexure (SCF) Method: A VAMAS Round Robin. VAMAS Report No. 17, NIST,
Gaithersburg, MD, 1994.
36. Test Methods for Determination of Fracture Toughness of Advanced Ceramics at Ambient
Temperature. Annual Book of ASTM Standards 2004, ASTM Designation: C 1421 01b, section 15,
vol. 15.01, ASTM, West Conshohocken, PA, 2004.
37. Test Method for Determination of Slow Crack Growth Parameters of Advanced Ceramics by
Constant Stress-Rate Flexural Testing at Ambient Temperature. Annual Book of ASTM Standards
2004, ASTM Designation: C 1368 01, section 15, vol. 15.01, ASTM, West Conshohocken, PA,
2004.

NASA/TM—2004-213216 18
38. Test Method for Determination of Slow Crack Growth Parameters of Advanced Ceramics by
Constant Stress-Rate Flexural Testing at Elevated Temperatures. Annual Book of ASTM Standards
2004, ASTM Designation: C 1465 00, section 15, vol. 15.01, ASTM, West Conshohocken, PA,
2004.
39. Test Method for Dynamic Young’s Modulus, Shear Modulus, and Poisson’s Ratio for Advanced
Ceramics by Impulse Excitation of Vibration. Annual Book of ASTM Standards 2004, ASTM
Designation: C 1259 01, section 15, vol. 15.01, ASTM, West Conshohocken, PA, 2004.
40. Murakami, Y., ed.: Stress Intensity Factors Handbook. Pergamon, New York, NY, 1987.
41. Test Method for Knoop Indentation Hardness of Advanced Ceramics. Annual Book of ASTM
Standards 2004, ASTM Designation: C 1326 03, section 15, vol. 15.01, ASTM, West
Conshohocken, PA, 2004.
42. a. Choi, Sung R.; and Bansal, Narottam P.: Processing and Mechanical Properties of Various
Zirconia/Alumina Composites for Fuel Cell Applications. NASA/TM 2002-211580, 2002.
b. Choi, S.R.; and Bansal, N.P.: Strength and Fracture Toughness of Zirconia/Alumina Composite
for Solid Oxide Fuel Cells. Cer. Eng. Sci. Proc., vol. 23, issue 3, 2002, pp. 741 750.
43. Shetty, D.K.; Rosenfield, A.R.; and Duckworth, W.H.: Mixed-Mode Fracture of Ceramics in
Diametral Compression. J. Am. Ceram. Soc., vol. 69, no. 6, 1986, pp. 437 443.
44. Tikare, V.; and Choi, S.R.: Combined Mode-I and Mode-II Fracture of Monolithic Ceramics. J. Am.
Ceram. Soc., vol. 76, no. 9, 1993, pp. 2265 2272.
45. Tikare, V.; and Choi, S.R.: Combined Mode I Mode II Fracture of 12-mol%-Ceria-Doped
Tetragonal Zirconia Polycrystalline Ceramic. J. Am. Ceram. Soc., vol. 80, no. 6, 1997,
pp. 1624 1626.
46. Lange, F.F.: Transformation Toughening. 3. Experimental-Observations in the ZrO2-Y2O3 System.
J. Mat. Sci., vol. 17, no. 1, 1982, pp. 240 246.
47. Shimada, M., et al.: Temperature-Dependence of Young Modulus and Internal-Friction in Alumina,
Silicon-Nitride, and Partially Stabilized Zirconia Ceramics. J. Am. Cer. Soc., vol. 67, no. 2, 1984,
pp. C23 C24.
48. Wesling, K.F.; Socie, D.F.; and Beardsley, B.: Fatigue of Thick Thermal Barrier Coatings. J. Am.
Cer. Soc., vol. 77, no. 7, 1994, pp. 1863 1868.

This publication is available from the NASA Center for AeroSpace Information, 301–621–0390.
REPORT DOCUMENTATION PAGE
2. REPORT DATE
19. SECURITY CLASSIFICATION OF ABSTRACT
18. SECURITY CLASSIFICATION OF THIS PAGE
Public reporting burden for this collection of information is estimated to average 1 hour per response, including the time for reviewing instructions, searching existing data sources,gathering and maintaining the data needed, and completing and reviewing the collection of information. Send comments regarding this burden estimate or any other aspect of thiscollection of information, including suggestions for reducing this burden, to Washington Headquarters Services, Directorate for Information Operations and Reports, 1215 JeffersonDavis Highway, Suite 1204, Arlington, VA 22202-4302, and to the Office of Management and Budget, Paperwork Reduction Project (0704-0188), Washington, DC 20503.
NSN 7540-01-280-5500 Standard Form 298 (Rev. 2-89)Prescribed by ANSI Std. Z39-18298-102
Form ApprovedOMB No. 0704-0188
12b. DISTRIBUTION CODE
8. PERFORMING ORGANIZATION REPORT NUMBER
5. FUNDING NUMBERS
3. REPORT TYPE AND DATES COVERED
4. TITLE AND SUBTITLE
6. AUTHOR(S)
7. PERFORMING ORGANIZATION NAME(S) AND ADDRESS(ES)
11. SUPPLEMENTARY NOTES
12a. DISTRIBUTION/AVAILABILITY STATEMENT
13. ABSTRACT (Maximum 200 words)
14. SUBJECT TERMS
17. SECURITY CLASSIFICATION OF REPORT
16. PRICE CODE
15. NUMBER OF PAGES
20. LIMITATION OF ABSTRACT
Unclassified Unclassified
Technical Memorandum
Unclassified
National Aeronautics and Space AdministrationJohn H. Glenn Research Center at Lewis FieldCleveland, Ohio 44135–3191
1. AGENCY USE ONLY (Leave blank)
10. SPONSORING/MONITORING AGENCY REPORT NUMBER
9. SPONSORING/MONITORING AGENCY NAME(S) AND ADDRESS(ES)
National Aeronautics and Space AdministrationWashington, DC 20546–0001
Available electronically at http://gltrs.grc.nasa.gov
November 2004
NASA TM—2004-213216
E–14724
WBS–22–714–04–05
24
Mechanical Properties of Plasma-Sprayed ZrO2-8 wt% Y2O3Thermal Barrier Coatings
Sung R. Choi, Dongming Zhu, and Robert A. Miller
Thermal barrier coatings; Mechanical properties; Strength; Fracture toughness; Fatigue;Deformation; Elastic modulus; Directionality; Plasma-sprayed ZrO2-8 wt% Y2O3
Unclassified -UnlimitedSubject Category: 07 Distribution: Nonstandard
Sung R. Choi, Ohio Aerospace Institute, Brook Park, Ohio 44142; Dongming Zhu, U.S. Army Research Laboratory,NASA Glenn Research Center; and Robert A. Miller, Glenn Research Center. Responsible person, Sung R. Choi,organization code 5920, 216–433–8366.
Mechanical behavior of free standing, plasma-sprayed ZrO2-8 wt% Y2O3 thermal barrier coatings, including strength,fracture toughness, fatigue, constitutive relation, elastic modulus, and directionality, has been determined under variousloading-specimen configurations. This report presents and describes a summary of mechanical properties of the plasma-sprayed coating material to provide them as a design database.

