mechanical property analysis of kenaf-glass fiber
TRANSCRIPT

Mechanical property analysis of kenaf-glass fiber reinforced polymer composites using
finite element analysis
M. Ramesha,*, S. Nijanthanb
a, bDepartment of Mechanical Engineering,
Sri Sai Ram Engineering College, Chennai-600044, Tamil Nadu, India.
[email protected], [email protected].
*Corresponding Author
Abstract: Nowadays, natural fibers are used as a reinforcing material in polymer composites,
due to severe environmental concerns. Among many different types of natural resources, kenaf
plants have been extensively exploited over the past few years. In this experimental study,
partially eco-friendly hybrid composites are fabricated by using kenaf and glass fibers with two
different fiber orientations of 0° and 90°. The mechanical properties such as tensile, flexural and
impact strengths of these composites have been evaluated. From the experiment, it has been
observed that the composites with the 0° fiber orientation can withstand the maximum tensile
strength of 49.27MPa, flexural strength of 164.35MPa, and impact strength of 6 Joules. Whereas,
the composites with the 90° fiber orientation hold the maximum tensile strength of 69.86MPa,
flexural strength of 162.566MPa, and impact strength of 6.66 Joules. The finite element analysis
has been carried out to analyze the elastic behavior of the composites and to predict the
mechanical properties by using NX Nastran 9.0 software. The experimental results are compared
with the predicted values and have found that, there is a high correlation occurs between the
results. The morphology of the fractured surfaces of the composites is analyzed using a Scanning
Electron Microscopy (SEM) analysis. The results indicated that the properties are in the
increasing trend and comparable with pure synthetic fiber reinforced composites, which shows
the potential for hybridization of kenaf fiber with glass fiber.
Key words: Natural fibers; Kenaf fiber; Eco-friendly composites; Hybrid; Mechanical
properties; Kenaf-glass fiber composites.
1. Introduction
In a view to reduce the cost of production and the harmful destruction, there are a lot of
ongoing researches for the possibility of mixing natural fibers with the synthetic fibers by using
polymer resins. One of the reasons for this growing interest is that, the natural fibers have a
higher specific strength than the glass fiber and a similar specific modulus [1]. Natural fibers are
the composite materials designed by nature. Most of the natural fibers, except cotton, are
composed of cellulose, hemicellulose, lignin, waxes, and several water-soluble compounds [2].
An important attribute of plant fibers is their ability to absorb moisture from the atmosphere
comparatively in large quantities because these fibers are hygroscopic in nature. The natural
fibers are extracted from the outer stem of the respective plants, possess very good mechanical
properties, and are used as reinforcing materials in polymer composites [3-5]. However, the
products made from natural fiber composite are still limited to the structural applications, due to
their poor mechanical properties [6]. To solve this issue, the natural fibers are hybridized with
synthetic fibers to make the composite hybrid. This plays a vital role in many engineering
applications and serves as alternative materials to the pure synthetic fiber composites [7-9].
Kenaf grows in tropical climates, by requiring minimal fertilizers, water and pesticides
[10, 11]. Kenaf has already proven eco-friendly and economically feasible feedstock for several
bio-energy applications due to its high cellulose and low lignin content [12]. In general, the use
of kenaf fiber reinforced composite helps to generate jobs in both rural and urban areas; in

addition, it helps to reduce waste, and thus, contributes to a healthier environment [13]. Kenaf
fiber is a good reinforcement candidate for high performance bio-degradable polymer
composites [14]. It has great potential to use as automotive and construction materials due to its
long fibers derived from outer fibrous bark, the bast [15]. The typical images of kenaf plants and
fibers are presented in Fig. 1. Kenaf fiber reinforced composites possess superior mechanical
properties based on the strong interaction between the fiber and the resin. Accordingly, the kenaf
fiber reinforced composite is a good alternative to conventional polymer composites [16]. Kenaf
fibers have exhibited superior properties of polymeric composites under flexural loading
conditions when compared to the other natural fibers. Moreover, there is a possibility of
replacing the synthetic fibers for flexural loading applications [17].
The identification of the most appropriate natural fiber to be hybridized with glass fiber
reinforced polymer composites for the fabrication of automotive component is based on
functional performance, weight and product cost [18]. Hybridization of kenaf fibers with glass
fibers could be utilized in automotive components such as bumper beam by improving the
impact property. Moreover, the impact property is improved by optimizing the structural design
parameters or through material improvement [19]. The chemical treatment of the fiber has
enhanced the adhesion between the fiber and the matrix and consequently it has improved the
mechanical properties of the composites [20]. The NaOH treated kenaf fiber composites have
shown improvement in flexural properties, compared with the untreated fiber composites [21].
Treated and untreated kenaf fibers have been treated in different solutions and have examined
through SEM. The results have indicated that, the tensile strength and the modulus of the kenaf
fiber composites have been decreased due to the deteriorating effect of the aging solutions [22].
Mechanical testing of kenaf and basalt fibers reinforced polyethylene composites is carried out

and it is found that, the hybridization has successfully increased the performance especially
under tensile loading [23]. The effect of fiber content, fiber size and surface treatment on the
mechanical and water absorption properties of the kenaf fiber reinforced polyester composites
are studied by Farahani et al. [24]. The results show that, the length of fiber plays a major role on
the mechanical properties and alkali treatment causes a better adhesion between the fiber and
matrix. The effect of fiber volume fraction on the properties of kenaf fiber reinforced epoxy
composites is evaluated and found that, the tensile strength and modulus of elasticity have
increased when there is an increase in the fiber volume [25].
The dynamic mechanical properties of kenaf/PALF fibers reinforced polyethylene
composites have been evaluated by Aji et al. [26]. From the investigation, they have found that,
the storage modulus of all hybrid composites at different fiber ratios have been enormously
improved with an increase in the fiber length, marginal difference in loss modulus and no
difference in damping factor in regard to variation in fiber length. The impact strength and
elongation at break of ethylene acrylate modified kenaf fiber reinforced polylactic acid
composites have been improved by increasing the modifier content but an opposite trend is
observed for the tensile strength and modulus [27]. The mechanical properties of kenaf/glass
fiber reinforced polypropylene short random oriented hybrid composites material have been
predicted by using rule of mixture (RoM) and rule of hybrid mixtures (RoHM) [28]. Three
different compositions are analyzed with total fiber contents 30 vol%, 40 vol% and 50 vol% and
the relative glass fiber contents are varied from 0 to 100 vol%. The outcome of the analysis has
showed that, the stiffness of the hybrid short and randomly oriented composites increases as the
overall fiber volume contents increases.

Kenaf and glass fiber reinforced polyester composites have been fabricated through sheet
moulding process and they have shown higher tensile, flexural and impact strength [29].
According to Ghani et al. [30], the dimensional stability and mechanical properties of kenaf and
glass fiber reinforced composites are caused by humidity aging. Moreover, the mechanical
properties of the kenaf fiber which get depreciated by the moisture penetration into the
kenaf/glass fiber polyester composite even under dissimilar environmental situations. The effects
of layering sequence on mechanical properties of kenaf/aramid hybrid composites fabricated
through hand lay-up techniques have been evaluated [31]. The results show that, the properties of
hybrid composites have improved along with the fabricated composites with aramid as a skin
layer when compared to kenaf as skin layers. Placing the glass fibers on the top and bottom
layers of the composite specimen possess very good mechanical strength [32]. The effects of
fiber orientation on the mechanical properties of banana/kenaf fiber reinforced hybrid polyester
composites have been carried out and found that, the maximum increase in mechanical strength
is observed in the plain hybrid composites rather than in randomly oriented composites [33].
This indicates that, the minimum stress development at the interface of composites is due to the
distribution of load transfer along the fiber direction.
The evaluation of the mechanical properties of natural and synthetic fibers reinforced
hybrid composites is to find their potential applications; it is an important area of research, which
is of current interest. From the available literature, it has been found that, the comprehensive
analysis on the mechanical properties of these composites is still a valid problem, and hence,
there is a need for carrying out such studies on composite materials. To take the advantage of
kenaf fibers, they have been added it with the glass fibers, conjointly to the matrix, so that an
optimal, superior but economical composite is obtained. Hence, in this experimental study, kenaf

glass fibers reinforced hybrid composites are prepared with two different fiber orientations of 0°
and 90°. The properties of these hybrid composites such as tensile strength, flexural strength and
impact strength have been evaluated. The finite element analysis has been carried out to analyze
the elastic behavior of the composites and also to predict the important mechanical properties by
using NX Nastran 9.0 software. The experimental results are compared with the predicted values
and have found that, high correlation occurs between the results.
Fig. 1 Typical images of (A) kenaf plantation and (B) kenaf fiber
2. Materials and methods
2.1 Materials
In this present experimental study, the composites subjected to the mechanical testing are
fabricated from kenaf and glass fibers by using epoxy resin. The kenaf fiber is supplied by
Chandra Prakash & Co., Jaipur, Rajasthan, India. The glass fiber (chopped strand mat), epoxy
resin and the hardener HY951, are purchased from M/s. Sakthi Fiber Glass Ltd., in Chennai,
India. The kenaf and glass fibers used for the experiment are presented in Fig. 2. The properties
of fibers used for composite fabrication are presented in Table 1.
Fig. 2 Fibers used for composite fabrication (A) Kenaf fibers and (B) Glass fiber
Table 1. Physical properties of kenaf and glass fiber [12]
2.2 Composite preparation
There are many specialized processes available for processing of composite materials, but
only the most commonly used commercial process is hand lay-up process. Before lay-up the
fibers, the mould is prepared with a tefflon coated base sheet to ensure that the sample does not
stick to the mould. The reinforcing fibers are cut into the required length and they are laid in the
mould. The resin is mixed with hardener for quick setting and then it is applied on the fiber

surface. A roller is used to impregnate the fibers with the resin and to distribute the resin
throughout the fiber surface. The fabrication procedure of composite sample in this experimental
study is explained in three simple steps. Step 1: The rust in the mould is cleaned by scrubbing
with an abrasive paper. Then, the surface is allowed to dry, after cleaning it with a thinner
solution. After drying, the surface is coated with tefflon gel. Step 2: Place the glass fiber over the
base plate in the mould and apply resin. Roller is used for proper bonding of resin with fiber.
Place the kenaf fiber over glass fiber and apply resin. Step 3: Repeat the process up to 5 layers.
The processing steps of the composites are presented in Fig. 3. In that, three layers (first, third
and fifth) are filled with glass fibers and the second and fourth layers are filled with kenaf fibers.
In this experiment, the kenaf and glass fiber reinforced hybrid composites are prepared at the
room temperature and an average relative humidity of 65%.
Fig. 3 Processing steps of the composite samples
3. Mechanical properties
The objective of the mechanical testing of composite is the determination of
mechanical parameters such as strength and stiffness that will be used for design of composite
structures. ASTM standards are used as an instrumental in the evaluation and determination of
the properties of materials. These standards are also helpful in guiding the manufacturers and
users of such materials in their proper fabrication and testing for the assurance of their quality.
The specimen used for mechanical testing is presented in Fig. 4.
Fig. 4 Mechanical test specimen for (a) tensile testing, (b) flexural testing and (c) impact testing
3.1 Tensile properties
A tensile test, also known as tension test, is probably the most fundamental type of
mechanical test performed on material. The tensile strength of the composite depends on, how
well the load transfers from the broken to the surviving fibers through shear in the resin at the
interface and the amount of load a sample can withstand before failure occurred [31]. As the
material is loaded, we find its strength along with how much it elongates. These methods are
discussed according to ASTM D638 [34] standards for plastics and polymeric materials. The
material is loaded in the universal testing machine (Make FIE; Model: UTN 40, S. No. 11/98-
2450). Then, the load is applied by increasing rate until it reaches the maximum tensile load.
When the load reaches the maximum tensile load it breaks. The load at this point is used to
calculate the maximum tensile strength of the composite material. The tensile test set up with
fractured specimen is presented in Fig. 5.
Fig. 5 Tensile test set up with fractured specimen
3.2 Flexural properties
Flexural strength, also known as modulus of rupture, bending strength, or fracture
strength, a mechanical parameter is defined as a material's ability to resist deformation under
bending load. Flexural strength determines the capability of composites to withstand the bending
load before reaching the breaking point [31]. The transverse bending test is the most frequently
employed, in which a specimen having rectangular cross-section is bent until fracture uses a
three point flexural test technique. The flexural strength represents the highest stress experienced
within the material at its moment of rupture. The flexural strength is the same as the direct tensile
strength, if the material is homogeneous. In fact, most of the materials have small or large
defects in them, which act to concentrate the stresses locally, effectively by causing a localized
weakness. In this present experimental study, the flexural test has been conducted as per ASTM
D790 [35] by using the same universal testing machine. The flexural test set up with fractured
specimen is shown in Fig. 6.

Fig. 6 Flexural test set up with specimen
3.3 Impact properties
A test is designed to give information on how a material will respond to a suddenly
applied load. The charpy impact test, also known as the charpy v-notch test, is a standardized
high strain-rate test which determines the amount of energy, which is absorbed by a material
during fracture, has been carried out in this experimental study. The samples are prepared for the
charpy impact test according to ASTM D6110 [36] standards. The impact strength tests are
carried out, using a charpy impact-testing machine (Model: KL-300, S. No. 96/1054, and Make:
Krystal Elmec). During the testing process, the specimen is loaded in the testing machine, and
the pendulum is allowed by striking the samples with a heavy impact load. This absorbed energy
is a measure of a given material's toughness and acts as a tool to study brittle-ductile nature of a
material. The machine used for impact testing is shown in Fig. 7.
Fig. 7 Impact test set-up
3.4 Finite element analysis (FEA)
To study the elastic behavior of the composites and predict some of the resulting
important mechanical properties, a finite element analysis has been carried out. Although, most
of these properties are obtained through experimentation. The elastic-plastic transition behavior
in composites is not easy to study under experimental conditions, hence a need for theoretical
modeling. In addition to validate the experimental findings, the theoretical prediction of these
properties has shortened the cycle time, which maximizes the resulting composite properties. The
NX Nastran 9.0 is the premier finite element structural analysis solver for linear and nonlinear
analysis, dynamic response, rotor dynamics, elasticity and optimization. The vonmises stress is
included in the output for those elements, that supports stress calculation when computing the

response of a structure due to random loads. Preliminary results from tensile, flexural, and
impact tests have indicated that, the composite material is very brittle but has exhibited the linear
deformation in its elastic state.
4. Results and discussion
In this experimental study, kenaf and glass fibers reinforced hybrid composites are
fabricated and their mechanical properties such as tensile, flexural and impact strengths have
been evaluated. Table 2 shows that, the experimental results have related to the mechanical
properties of the kenaf and glass fibers reinforced epoxy composites with different fiber
orientation. The predicted values of the mechanical properties from NX Nastran 9.0 are
presented in Table 3.
Table 2 Experimental results of the flax-glass fiber composite samples
Table 3 The mechanical properties are predicted from NX Nastran 9.0.
4.1 Tensile strength analysis
4.1.1 Experimental analysis
The typical load vs. displacement curve generated directly from the universal testing
machine during tensile loading is presented in Fig. 8. From the figure, it is observed that, there is
the gradual increase in the displacement, when the applied load is increased and there is a sudden
drop in the displacement after the material breaks. The experimental tensile strength comparison
of the composites with two different fiber orientation is presented in Fig 9. From the figure, it
has been found that, the kenaf-glass fiber reinforced composites with 90° fiber orientation have
more tensile strength than the 0° fiber orientation composite samples.
Fig. 8 Typical load vs. displacement curve generated directly from the machine during
tensile loading

Fig. 9 Experimental tensile strength comparison
4.1.2 Analysis of tensile strength using FEA
The Fig. 10 shows the FEA simulation plot for the tensile test specimen with 0° fiber
orientation. The simulated stress distribution for mechanical properties of kenaf-glass fiber
reinforced hybrid composites is obtained under different loading conditions. The maximum
tensile stress acting on the specimen is 40.24 MPa, which is located at the middle portion of the
specimen, where the maximum stress occurs. The results from tensile test indicate that, the
composites are very brittle, but have exhibited linear deformation in its elastic state. The FEA
simulation result plot for the kenaf-glass fiber reinforced hybrid composite sample with 90° fiber
orientation subjected to the tensile loading is presented in Fig. 11. From the figure, it is found
that, the maximum tensile stress acting on the 90° fiber orientation composite specimen is
53.65MPa, which is located at the middle portion of the specimen, where the maximum stress
occurs. The result from tensile test further indicates that, the composites are very brittle but have
exhibited linear deformation in its elastic state. From the FEA analysis results, it is found that,
the values are closer to the experimental results.
Fig. 10 Simulation plot of tensile test specimen with 0° fiber orientation
Fig. 11 Simulation plot of tensile test specimen with 90° fiber orientation
4.2 Flexural strength analysis
4.2.1 Experimental analysis
The typical load vs. displacement curve generated directly from the universal testing
machine during flexural loading is presented in Fig. 12. From the figure, it is observed that there
is the gradual increase in the displacement, when the applied load is increases and there is a
sudden drop in the displacement after the material breaks. The experimental flexural strength

comparison of the different fiber orientation composites is presented in Fig. 13. The figure
reveals that, the flexural strength of the 0° fiber orientation composite samples performs slightly
better than the 90° fiber orientation composite samples. This is due to the direction of load acting
on the specimen. From the figure, further it is observed that, the fiber orientation does not have
much influence on the flexural properties.
Fig. 12 Typical load vs. displacement curve generated directly from the machine during
flexural loading
Fig. 13 Experimental flexural strength comparison
4.2.2 Analysis of flexural strength using FEA
The Fig. 14 shows the FEA simulation plot for the flexural test specimen with 0° fiber
orientation. The flexural strength of these composites is found due to the fiber orientation and
binding properties. The maximum flexural stress acting on the 0° fiber orientation specimen is
153.3MPa, which is located at the middle portion of the specimen, where the maximum stress
occurs. The FEA simulation result plot for the kenaf-glass hybrid composite specimen with 90°
fiber orientation is presented in Fig. 15. From the figure, it is found that, the maximum flexural
stress acting on the 90° fiber orientation composite specimen is 150.3MPa, which is located at
the middle portion of the specimen, where the maximum stress occurs. The result from the
flexural test, further has indicated that, the composites are very brittle but they have exhibited
linear deformation in its elastic state. It is also found that, the FEA analysis results are closer to
the experimental results.
Fig. 14 Simulation plot of flexural test specimen with 0° fiber orientation
Fig. 15 Simulation plot of flexural test specimen with 90° fiber orientation
4.3 Impact strength analysis

4.3.1 Experimental analysis
The results obtained from the impact test for kenaf-glass fiber composites are tabulated in
Table 2. The experimental impact strength comparison of these composite materials is presented
in Fig. 16. From the figure, it has been found that, kenaf-glass fiber composites with 90° fiber
orientation have more capable of withstanding high impact load than 0° fiber orientation
composite samples.
Fig. 16 Experimental impact strength comparison
4.3.2 Analysis of impact strength using FEA
The Fig. 17 shows the FEA simulation plot for the impact test specimen with 0° fiber
orientation. The simulated stain energy distribution for mechanical properties of kenaf-glass
hybrid composites is obtained under different loading conditions. The maximum strain energy
observed for the 0° fiber orientation specimen is 6.075J, which is located at the middle portion of
the specimen, where the maximum stress occurs. The FEA simulation result plot for the kenaf-
glass hybrid composite specimen with 90° fiber orientation subjected to flexural loading is
presented in Fig. 18. The maximum strain energy observed by the specimen is 4.8J, which is
located at the middle portion of the specimen, where the maximum stress occurs. Result from
impact test, further has indicated that, the composites are very brittle but have exhibited linear
deformation in its elastic state. It is found that, the FEA analysis results are closer to the
experimental result.
Fig. 17 Strain energy distribution of impact test specimen with 0° fiber orientation
Fig. 18 Strain energy distribution of impact test specimen with 90° fiber orientation
4.5 Scanning electron microscopy (SEM) analysis

The Fig. 19 shows the SEM images of the fractured surfaces of the kenaf-glass fiber
composites, which are subjected to tensile loading. The images clearly show the orientation of
kenaf and glass fibers in the fractured surface. Matrix cracking and debonding of fibers from the
composites are visible. The images further show that, the interfacial characteristics, internal
surface of the fractured specimens due to the application of the tensile load. Thus, the images
show the general arrangement of molecules of kenaf-glass fibers and the distribution of fibers are
also faintly visible.
Fig. 19 SEM micrographs for kenaf-glass fiber samples subjected to tensile loading (a) 0° fiber
orientation and (b) 90° fiber orientation
The SEM micrographs of the fractured surfaces of the kenaf-glass fiber reinforced
composites subjected to flexural loading are presented in Fig. 20. From the images, it is observed
that, the layering sequence of the fibers and matrix are very clearly. The images further show
that, the orientation of fiber, interfacial characteristics, internal surface of the fractured
specimens due to the application of the flexural load. Matrix cracking and debonding of fibers
from the composites are also visible.
Fig. 20 SEM micrographs for kenaf-glass fiber samples subjected to flexural loading (a) 0°
fiber orientation and (b) 90° fiber orientation
The SEM micrographs of the fractured surfaces of the kenaf-glass fibers reinforced
composite samples subjected to impact loading are presented in Fig. 21. The figure clearly shows
the void formation inside the material due to insufficient flow of resin and fractured fiber
particles due to impact load. The images also show the orientation of fibers in the fractured
specimen, matrix cracking and debonding of fibers from the matrix. The interfacial
characteristics, internal surface of the fractured specimens due to the application of the impact
load are also visible.
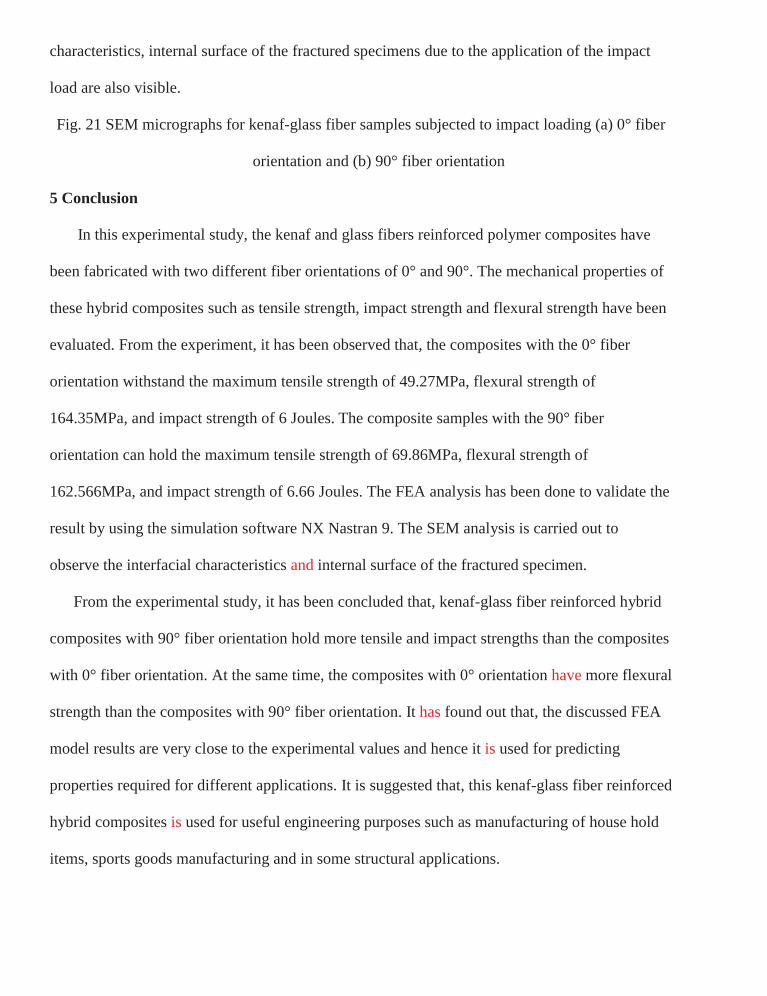
Fig. 21 SEM micrographs for kenaf-glass fiber samples subjected to impact loading (a) 0° fiber
orientation and (b) 90° fiber orientation
5 Conclusion
In this experimental study, the kenaf and glass fibers reinforced polymer composites have
been fabricated with two different fiber orientations of 0° and 90°. The mechanical properties of
these hybrid composites such as tensile strength, impact strength and flexural strength have been
evaluated. From the experiment, it has been observed that, the composites with the 0° fiber
orientation withstand the maximum tensile strength of 49.27MPa, flexural strength of
164.35MPa, and impact strength of 6 Joules. The composite samples with the 90° fiber
orientation can hold the maximum tensile strength of 69.86MPa, flexural strength of
162.566MPa, and impact strength of 6.66 Joules. The FEA analysis has been done to validate the
result by using the simulation software NX Nastran 9. The SEM analysis is carried out to
observe the interfacial characteristics and internal surface of the fractured specimen.
From the experimental study, it has been concluded that, kenaf-glass fiber reinforced hybrid
composites with 90° fiber orientation hold more tensile and impact strengths than the composites
with 0° fiber orientation. At the same time, the composites with 0° orientation have more flexural
strength than the composites with 90° fiber orientation. It has found out that, the discussed FEA
model results are very close to the experimental values and hence it is used for predicting
properties required for different applications. It is suggested that, this kenaf-glass fiber reinforced
hybrid composites is used for useful engineering purposes such as manufacturing of house hold
items, sports goods manufacturing and in some structural applications.

References
[1] Kozlowski R, Mieleniak B, Helwig M, Przepiera A. Flame resistant lignocellulosic-mineral
composite particleboards. Polymer Degradation and Stability 1999; 64: 523–528.
[2] Akil HM, Omar MF, Mazuki AAM, Safiee S, Ishak ZAM, Bakar AA. Kenaf fiber reinforced
composites: A review. Materials and Design 2011; 32: 4107–4121.
[3] Liu W, Drzal LT, Mohanthy AK, Misra M. Influence of processing methods and fiber length
on physical properties of kenaf fiber reinforced soy based biocomposites. Composites: Part
B 2007; 38(11): 352–359.
[4] Zampaloni M, Pourboghrat F, Yankovich SA, Rodgers BN, Moore J, Drzal LT, Mohanty
AK, Misra M. Kenaf natural fiber reinforced polypropylene composites: A discussion on
manufacturing problems and solutions. Composites: Part A 2007; 38: 1569–1580.
[5] Paridah MT, Ahmed AB, SaifulAzry SOA, Ahmed Z. Retting process of some bast plant
fibers and its effect on fiber quality: a review. BioResources 2011; 6: 5260–5281.
[6] Ramesh M, Sudharsan P, Palanikumar K. Processing and mechanical property evaluation of
flax-glass fiber reinforced polymer composites. Applied Mechanics and Materials 2015;
766-767: 144-149.
[7] Bhoopathi R, Deepa C, Sasikala G, Ramesh M. Experimental investigation on mechanical
properties of hemp-banana-glass fiber reinforced composites. Applied Mechanics and
Materials 2015; 766-767: 167-172.
[8] Ramesh M, Palanikumar K, Reddy KH. Mechanical property evaluation of sisal-jute-glass
fiber reinforced polyester composites. Composites: Part B 2013; 48: 1-9.
[9] Ramesh M, Palanikumar K, Reddy KH. Comparative evaluation on properties of hybrid glass
fiber-sisal/jute reinforced epoxy composites. Procedia Engineering 2013; 51: 745-750.

[10] Pang C, Shanks RA, Daver F. Characterization of kenaf fiber composites prepared with
tributyl citrate plasticized cellulose acetate. Composites: Part A 2015; 70: 52–58.
[11] Aziz SH, Ansell MP, Clarke SJ, Panteny SR. Modified polyester resins for natural fiber
composites. Composite Science and Technology 2005; 65: 525–535.
[12] Saba N, Jawaid M, Hakeem KR, Paridah MT, Khalina A, Alothman OY. Potential of bio-
energy production from industrial kenaf (Hibiscus cannabinus L.) based on Malaysian
perspective. Renewable and Sustainable Energy Reviews 2015; 42: 446–459.
[13] Ramesh M, Nijanthan S, Palanikumar K. Processing and mechanical property evaluation of
kenaf-glass fiber reinforced polymer composites. Applied Mechanics and Materials 2015;
766-767: 187-192.
[14] Nishino T, Hirao K, Koter M, Nakamae K, Inagaki H. Kenaf reinforced biodegradable
composite. Composites Science and Technology 2003; 63: 1281–1286.
[15] Saba N, Paridah MT, Jawaid M. Mechanical properties of kenaf fiber reinforced polymer
composite: A review. Construction and Building Materials 2015; 76: 87–96.
[16] Nishino T, Hirao K, Koter M. X-ray diffraction studies on stress transfer of kenaf reinforced
poly (L-lactic acid) composite. Composites: Part A 2006; 37: 2269–2273.
[17] Yousif BF, Shalwan A, Chin CW, Ming KC. Flexural properties of treated and untreated
kenaf/epoxy composites. Materials and Design 2012; 40: 378–385.
[18] Yang B, Nar M, Visi DK, Allen M, Ayre B, Webber III CL, Lu H, D’Souza NA. Effects of
chemical versus enzymatic processing of kenaf fibers on poly (hydroxybutyrate-co-
valerate)/poly (butylenesadipate-co-terephthalate) composite properties. Composites: Part B
2014; 56: 926–933.

[19] Davoodi MM, Sapuan SM, Ahmad D, Ali A, Khalina A, Jonoobi M. Mechanical properties
of hybrid kenaf/glass reinforced epoxy composite for passenger car bumper beam. Materials
and Design 2010; 31: 4927–4932.
[20] Ismail H, Abdullah AH, Bakar AA. The effects of a silane-based coupling agent on the
properties of kenaf core-reinforced high-density polyethylene (HDPE)/soya powder
composites. Polymer-Plastics Technology and Engineering 2010; 49(11): 1095-1100.
[21] Lai WL, Mariatti M, Jani SM. The properties of woven kenaf and betel palm (Areca
catechu) reinforced unsaturated polyester composites. Polymer-Plastics Technology and
Engineering 2008; 47(12): 1193-1199.
[22] Yamamoto Y, Zahora D, Netravali AN. Determination of the interfacial properties between
modified soy protein resin and kenaf fiber. Composite Interfaces 2007; 14(7-9): 699-713.
[23] Mokhtar I, Yahya MY, Kadir MRA, Kambali MF. Effect on mechanical performance of
UHMWPE/HDPE blend reinforced with kenaf, basalt and hybrid kenaf/basalt fiber.
Polymer-Plastics Technology and Engineering 2013; 52(11): 1140-1146.
[24] Farahani GN, Ahmad I, Mosadeghzad Z. Effect of fiber content, fiber length and alkali
treatment on properties of kenaf fiber/upr composites based on recycled pet wastes.
Polymer-Plastics Technology and Engineering 2012; 51(6): 634-639.
[25] Abdullah AH, Khalina A, Ali A. Effects of fiber volume fraction on unidirectional
kenaf/epoxy composites: The transition region. Polymer-Plastics Technology and
Engineering 2011; 50(13): 1362-1366.
[26] Aji IS, Zainudin ES, Sapuan SM, Khalina A, Khairul MD. Study of hybridized kenaf/palf-
reinforced HDPE composites by dynamic mechanical analysis. Polymer-Plastics
Technology and Engineering 2012; 51(2): 146-153.

[27] Taib RM, Hassan HM, Ishak ZAM. Mechanical and morphological properties of polylactic
acid/kenaf bast fiber composites toughened with an impact modifier. Polymer-Plastics
Technology and Engineering 2014; 53(2): 199-206.
[28] Mansor MR, Sapuan SM, Zainudin ES, Nuraini AA, Hambali A. Reinforced polypropylene
composites using rule of mixtures (RoM) and rule of hybrid mixtures (RoHM). Journal of
Polymer Materials 2013; 30(3): 321-334.
[29] Atiqah A, Maleque MA, Jawaid M, Iqbal M. Development of kenaf–glass reinforced
unsaturated polyester hybrid composite for structural applications. Composites: Part B
2014; 56: 68–73.
.[30] Ghani MAA, Salleh Z, Hyie KM, Berhan MN, Taib YMD, Bakri MAI. Mechanical
properties of kenaf/fiber glass polyester hybrid composite. Procedia Engineering 2012;
41:1654–1659.
[31] Yahaya R, Sapuan SM, Jawaid M, Leman Z, Zainudin ES. Effect of layering sequence and
chemical treatment on the mechanical properties of woven kenaf–aramid hybrid laminated
composites. Materials and Design 2015; 67: 173–179.
[32] Ahmed KS, Vijayarangan S. Tensile, flexural and interlaminar shear properties of woven
jute and jute-glass fabric reinforced polyester composites. Journal of Material Processing
Technology 2008; 207: 330-335.
[33] Alavudeen A, Rajini N, Karthikeyan S, Thiruchitrambalam M, Venkateshwaren N.
Mechanical properties of banana/kenaf fiber reinforced hybrid polyester composites: Effect
of woven fabric and random orientation. Materials and Design 2015; 66: 246–257.
[34] ASTM standard D638. Standard test method for testing tensile properties of plastics.
Annual book of ASTM standards: 2002.

[35] ASTM standard D790. Standard test method for testing flexural properties of unreinforced
and reinforced plastics and electrical insulating materials. Annual book of ASTM standards:
2002.
[36] ASTM standard D6110. Standard test method for determining the charpy impact resistance
of notched specimens of plastics. Annual book of ASTM standards: 2002.

Fig. 1 Typical images of (A) kenaf plantation and (B) kenaf fiber
Fig. 2 Fibers used for composite fabrication (A) kenaf fiber and (B) glass fiber
(A) (B)
(A) (B)

Fig. 3 Processing steps of the composite samples
(1)
(2)
(3)

Fig. 4 Mechanical test specimen for (a) tensile testing, (b) flexural testing and (c) impact testing
Fig. 5 Tensile test set up with fractured specimen
(a)
(b)
(c)
Material breakage

Fig. 6 Flexural test set up with specimen
Fig. 7 Impact test set-up
Material breakage

Fig. 8 Typical load vs. displacement curve generated directly from the machine during
tensile loading
Fig. 9 Experimental tensile strength comparison
0
10
20
30
40
50
60
70
80
1 2 3
Tens
ile st
reng
th (M
Pa)
Samples
0° Orientation 90° Orientation
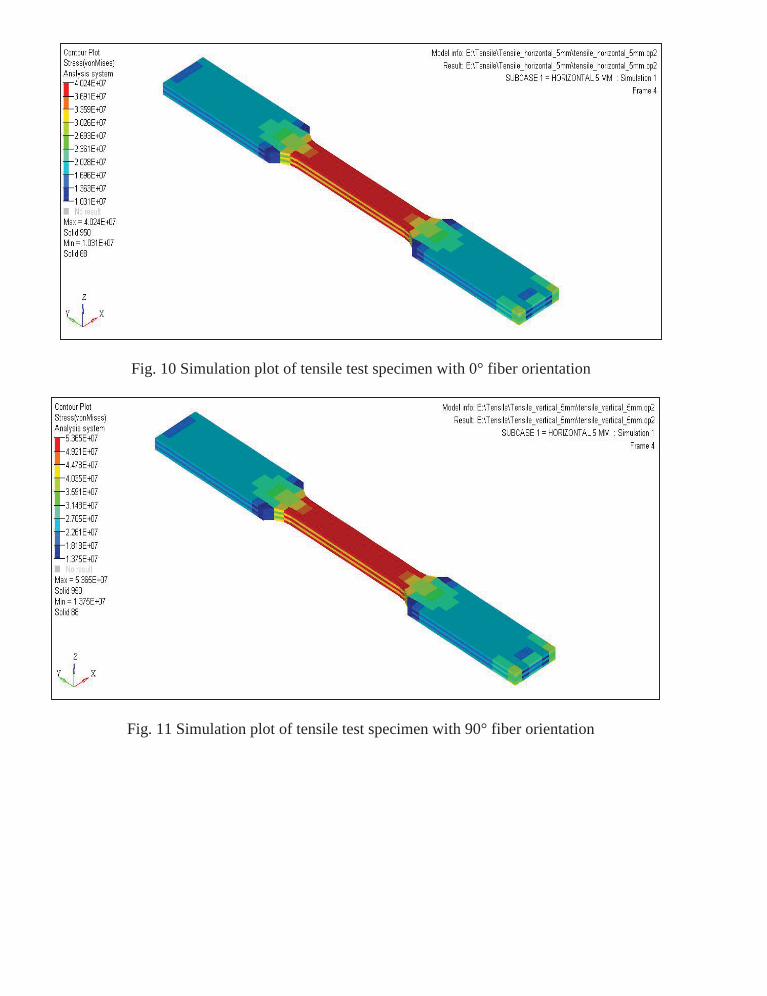
Fig. 10 Simulation plot of tensile test specimen with 0° fiber orientation
Fig. 11 Simulation plot of tensile test specimen with 90° fiber orientation

Fig. 12 Typical load vs. displacement curve generated directly from the machine during
flexural loading
Fig. 13 Experimental flexural strength comparison
157158159160161162163164165166167
1 2 3
Flex
ural
stre
ngth
(MPa
)
Samples
0° Orientation 90° Orientation

Fig. 14 Simulation plot of flexural test specimen with 0° fiber orientation
Fig. 15 Simulation plot of flexural test specimen with 90° fiber orientation

Fig. 16 Experimental impact strength comparison
Fig. 17 Strain energy distribution of impact test specimen with 0° fiber orientation
0
2
4
6
8
10
1 2 3Impa
ct st
reng
th (J
oule
s)
Samples
0° Orientation 90° Orientation
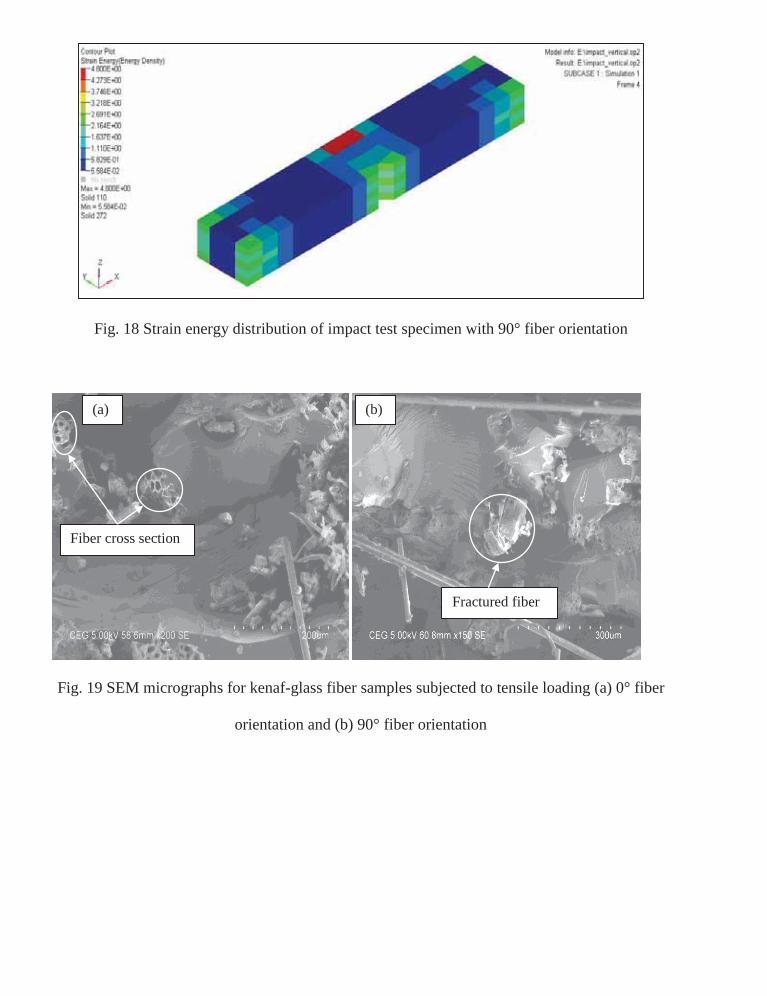
Fig. 18 Strain energy distribution of impact test specimen with 90° fiber orientation
Fig. 19 SEM micrographs for kenaf-glass fiber samples subjected to tensile loading (a) 0° fiber
orientation and (b) 90° fiber orientation
(a) (b)
Fractured fiber
Fiber cross section

Fig. 20 SEM micrographs for kenaf-glass fiber samples subjected to flexural loading (a) 0° fiber
orientation and (b) 90° fiber orientation
Fig. 21 SEM micrographs for kenaf-glass fiber samples subjected to impact loading (a) 0° fiber
orientation and (b) 90° fiber orientation
(a) (b)
Fiber layer arrangement
Fractured fiber layer
Matrix fracture
(a) (b)
Void formation
Fractured fiber particles
Fiber orientation 0° and 90°

Table 1. Physical properties of kenaf and glass fiber [12]
Property Kenaf Glass
Cellulose [%]
Lignin [%]
Moisture [%]
Density [g/cm3]
Elongation at break [%]
Young’s modulus [GPa]
51- 52
17
12-14
1.2-1.4
9.1-12.3
20
-
-
-
2.5-2.6
3-5
65-75
Table 2 Experimental results of the flax-glass fiber composite samples
Fiber orientation (Deg.) Tensile strength
(MPa)
Flexural strength
(MPa)
Impact strength
(Joules)
0 49.27 164.350 6
90 69.86 162.566 6.66
Table 3 The mechanical properties are predicted from NX Nastran 9.0.
Fiber orientation
(Deg.)
Max. tensile strength
(MPa)
Max. Flexural strength
(MPa)
Max. Impact strength
(Joules)
0 40.24 153.3 6.075
90 53.65 150.3 4.800