mechanics of materials - govt....
TRANSCRIPT

Th
ird
Ed
ition
MECHANICS OF MATERIALS
Beer • Johnston • DeWolf
Contents
Stress & Strain: Axial Loading
Normal Strain
Stress-Strain Test
Stress-Strain Diagram: Ductile Materials
Stress-Strain Diagram: Brittle Materials
Hooke’s Law: Modulus of Elasticity
Elastic vs. Plastic Behavior
Fatigue
Deformations Under Axial Loading
Example 2.01
Sample Problem 2.1
Static Indeterminacy
Example 2.04
Thermal Stresses
Poisson’s Ratio
Generalized Hooke’s Law
Dilatation: Bulk Modulus
Shearing Strain
Example 2.10
Relation Among E, , and G
Sample Problem 2.5
Composite Materials
Saint-Venant’s Principle
Stress Concentration: Hole
Stress Concentration: Fillet
Example 2.12
Elastoplastic Materials
Plastic Deformations
Residual Stresses
Example 2.14, 2.15, 2.16
© 2002 The McGraw-Hill Companies, Inc. All rights reserved. 2 - 1

Th
ird
Ed
ition
MECHANICS OF MATERIALS
Beer • Johnston • DeWolf
Stress & Strain: Axial Loading
• Suitability of a structure or machine may depend on the deformations in
the structure as well as the stresses induced under loading. Statics
analyses alone are not sufficient.
• Considering structures as deformable allows determination of member forces and reactions which are statically indeterminate.
• Determination of the stress distribution within a member also requires
consideration of deformations in the member.
• Chapter 2 is concerned with deformation of a structural member under
axial loading. Later chapters will deal with torsional and pure bending loads.
© 2002 The McGraw-Hill Companies, Inc. All rights reserved. 2 - 2

Th
ird
Ed
ition
MECHANICS OF MATERIALS
Beer • Johnston • DeWolf
Normal Strain
P
A stress
2P
P 2 A A
P
A
L normal strain
L
2
2L L
© 2002 The McGraw-Hill Companies, Inc. All rights reserved. 2 - 3

Th
ird
Ed
ition
MECHANICS OF MATERIALS
Beer • Johnston • DeWolf
Stress-Strain Test
© 2002 The McGraw-Hill Companies, Inc. All rights reserved. 2 - 4

Th
ird
Ed
ition
MECHANICS OF MATERIALS
Beer • Johnston • DeWolf
Stress-Strain Diagram: Ductile Materials
© 2002 The McGraw-Hill Companies, Inc. All rights reserved. 2 - 5

Th
ird
Ed
ition
MECHANICS OF MATERIALS
Beer • Johnston • DeWolf
Stress-Strain Diagram: Brittle Materials
© 2002 The McGraw-Hill Companies, Inc. All rights reserved. 2 - 6

Th
ird
Ed
ition
MECHANICS OF MATERIALS
Beer • Johnston • DeWolf
Hooke‟s Law: Modulus of Elasticity
• Below the yield stress
E
E Youngs Modulus or
Modulus of Elasticity
• Strength is affected by alloying,
heat treating, and manufacturing
process but stiffness (Modulus of
Elasticity) is not.
© 2002 The McGraw-Hill Companies, Inc. All rights reserved. 2 - 7

Th
ird
Ed
ition
MECHANICS OF MATERIALS
Beer • Johnston • DeWolf
Elastic vs. Plastic Behavior
• If the strain disappears when the
stress is removed, the material is
said to behave elastically.
• The largest stress for which this
occurs is called the elastic limit.
• When the strain does not return
to zero after the stress is
removed, the material is said to
behave plastically.
© 2002 The McGraw-Hill Companies, Inc. All rights reserved. 2 - 8

Th
ird
Ed
ition
MECHANICS OF MATERIALS
Beer • Johnston • DeWolf
Fatigue
• Fatigue properties are shown on
S-N diagrams.
• A member may fail due to fatigue
at stress levels significantly below
the ultimate strength if subjected
to many loading cycles.
• When the stress is reduced below
the endurance limit, fatigue
failures do not occur for any
number of cycles.
© 2002 The McGraw-Hill Companies, Inc. All rights reserved. 2 - 9

Th
ird
Ed
ition
MECHANICS OF MATERIALS
Beer • Johnston • DeWolf
Deformations Under Axial Loading
• From Hooke’s Law:
E
P
E AE
• From the definition of strain:
L
• Equating and solving for the deformation,
PL AE
• With variations in loading, cross-section or
material properties,
i
Pi Li
Ai Ei
© 2002 The McGraw-Hill Companies, Inc. All rights reserved. 2 - 10

Th
ird
Ed
ition
MECHANICS OF MATERIALS
Beer • Johnston • DeWolf
Example 2.01
E 29 106 psi
SOLUTION:
• Divide the rod into components at
the load application points.
• Apply a free-body analysis on each
component to determine the
D 1.07 in. d 0.618 in.
Determine the deformation of
the steel rod shown under the
given loads.
internal force
• Evaluate the total of the component
deflections.
© 2002 The McGraw-Hill Companies, Inc. All rights reserved. 2 - 11

Th
ird
Ed
ition
MECHANICS OF MATERIALS
Beer • Johnston • DeWolf
SOLUTION:
• Divide the rod into three
components:
• Apply free-body analysis to each
component to determine internal forces,
P1 60 103lb
P2 15103lb
P3 30 103lb
• Evaluate total deflection,
Pi Li
1 P1L1 P2L2
P3L3
i Ai Ei E A1 A2 A3
1 60 103 12
15103 12
30 103 16
29 106
75.9 103in.
0.9 0.9 0.3
L1 L2 12 in. L3 16 in. 75.9 103 in.
A1 A2 0.9 in2 A3 0.3 in2
© 2002 The McGraw-Hill Companies, Inc. All rights reserved. 2 - 12

Th
ird
Ed
ition
MECHANICS OF MATERIALS
Beer • Johnston • DeWolf
Sample Problem 2.1
The rigid bar BDE is supported by two
links AB and CD.
Link AB is made of aluminum (E = 70
GPa) and has a cross-sectional area of 500
mm2. Link CD is made of steel (E = 200
GPa) and has a cross-sectional area of (600
mm2).
For the 30-kN force shown, determine the
deflection a) of B, b) of D, and c) of E.
SOLUTION:
• Apply a free-body analysis to the bar
BDE to find the forces exerted by
links AB and DC.
• Evaluate the deformation of links AB
and DC or the displacements of B
and D.
• Work out the geometry to find the
deflection at E given the deflections
at B and D.
© 2002 The McGraw-Hill Companies, Inc. All rights reserved. 2 - 13

Th
ird
Ed
ition
MECHANICS OF MATERIALS
Beer • Johnston • DeWolf
Sample Problem 2.1
SOLUTION:
Free body: Bar BDE
Displacement of B:
B
PL AE
60 103 N
0.3m
MB 0
500 10-6 m2
514 106 m
B Displacement of D:
70 109 Pa
0.514 mm
0 30 kN 0.6 m FCD 0.2 m PL
FCD
MD
90 kN
0
tension D
AE
90 103 N0.4 m
0 30 kN 0.4 m FAB 0.2 m 600 10-6 m2 200 109 PaFAB 60 kN compression 300 106 m
D 0.300 mm
© 2002 The McGraw-Hill Companies, Inc. All rights reserved. 2 - 14

Th
ird
Ed
ition
MECHANICS OF MATERIALS
Beer • Johnston • DeWolf
Sample Problem 2.1
Displacement of D:
BB
BH DD HD
0.514 mm
0.300 mm 200 mm x
x
x 73.7 mm
EE
HE DD HD
E
0.300 mm 400 73.7mm
73.7 mm
E 1.928 mm
E 1.928 mm
© 2002 The McGraw-Hill Companies, Inc. All rights reserved. 2 - 15

Th
ird
Ed
ition
MECHANICS OF MATERIALS
Beer • Johnston • DeWolf
Static Indeterminacy
• Structures for which internal forces and reactions
cannot be determined from statics alone are said
to be statically indeterminate.
• A structure will be statically indeterminate
whenever it is held by more supports than are
required to maintain its equilibrium.
• Redundant reactions are replaced with
unknown loads which along with the other
loads must produce compatible deformations.
• Deformations due to actual loads and redundant
reactions are determined separately and then added
or superposed.
L R 0
© 2002 The McGraw-Hill Companies, Inc. All rights reserved. 2 - 16

Th
ird
Ed
ition
MECHANICS OF MATERIALS
Beer • Johnston • DeWolf
Example 2.04
Determine the reactions at A and B for the steel
bar and loading shown, assuming a close fit at
both supports before the loads are applied.
SOLUTION:
• Consider the reaction at B as redundant, release
the bar from that support, and solve for the
displacement at B due to the applied loads.
• Solve for the displacement at B due to the
redundant reaction at B.
• Require that the displacements due to the loads
and due to the redundant reaction be compatible,
i.e., require that their sum be zero.
• Solve for the reaction at A due to applied loads
and the reaction found at B.
© 2002 The McGraw-Hill Companies, Inc. All rights reserved. 2 - 17

Th
ird
Ed
ition
MECHANICS OF MATERIALS
Beer • Johnston • DeWolf
Example 2.04 SOLUTION:
• Solve for the displacement at B due to the applied
loads with the redundant constraint released,
P1 0 P2 P3 600 103 N P4 900 103 N
A1 A2 400 106 m2 A3 A4 250 106 m2
L1 L2 L3 L4 0.150 m
L i
Pi Li
Ai Ei
1.125109
E
• Solve for the displacement at B due to the redundant
constraint,
P1 P2 RB
A1 400 106 m2 A2 250 106 m2
L1 L2 0.300 m
δR Pi Li A E
1.95103 RB E i i i
© 2002 The McGraw-Hill Companies, Inc. All rights reserved. 2 - 18

Th
ird
Ed
ition
MECHANICS OF MATERIALS
Beer • Johnston • DeWolf
Example 2.04
• Require that the displacements due to the loads and due to
the redundant reaction be compatible,
L R 0
1.125109
E 1.95103 RB
E
RB 577 103 N 577 kN
• Find the reaction at A due to the loads and the reaction at B
Fy 0 RA 300 kN 600 kN 577 kN
RA 323kN
RA 323kN
RB 577 kN
© 2002 The McGraw-Hill Companies, Inc. All rights reserved. 2 - 19
0

Th
ird
Ed
ition
MECHANICS OF MATERIALS
Beer • Johnston • DeWolf
Thermal Stresses
• A temperature change results in a change in length or
thermal strain. There is no stress associated with the
thermal strain unless the elongation is restrained by
the supports.
• Treat the additional support as redundant and apply
the principle of superposition.
T T L P PL
AE
thermal expansion coef.
• The thermal deformation and the deformation from
the redundant support must be compatible.
T P 0
T L PL
0
T P 0
P AE T P
AE E T A
© 2002 The McGraw-Hill Companies, Inc. All rights reserved. 2 - 20

Th
ird
Ed
ition
MECHANICS OF MATERIALS
Beer • Johnston • DeWolf
Poisson‟s Ratio
• For a slender bar subjected to axial loading:
x x
E y z 0
• The elongation in the x-direction is
accompanied by a contraction in the other
directions. Assuming that the material is
isotropic (no directional dependence),
y z 0
• Poisson’s ratio is defined as
lateral strain axial strain
y
x
z
x
© 2002 The McGraw-Hill Companies, Inc. All rights reserved. 2 - 21

Th
ird
Ed
ition
MECHANICS OF MATERIALS
Beer • Johnston • DeWolf
Generalized Hooke‟s Law
• For an element subjected to multi-axial loading,
the normal strain components resulting from the
stress components may be determined from the
principle of superposition. This requires:
1) strain is linearly related to stress
2) deformations are small
• With these restrictions:
x xE
y E
z E
y
z
x
E
x
E
yE
y
E
z
E
zE
© 2002 The McGraw-Hill Companies, Inc. All rights reserved. 2 - 22

Th
ird
Ed
ition
E
2
MECHANICS OF MATERIALS
Beer • Johnston • DeWolf
Dilatation: Bulk Modulus
• Relative to the unstressed state, the change in volume is
e 1 1 x 1 y 1 z 1 1 x y z x y z
1 2
E x y z
dilatation (change in volume per unit volume)
• For element subjected to uniform hydrostatic pressure,
e p 31 2
p
E k
k
bulk modulus 3 1 2
• Subjected to uniform pressure, dilatation must be
negative, therefore
0 1
© 2002 The McGraw-Hill Companies, Inc. All rights reserved.

Th
ird
Ed
ition
MECHANICS OF MATERIALS
Beer • Johnston • DeWolf
Shearing Strain
• A cubic element subjected to a shear stress will
deform into a rhomboid. The corresponding shear
strain is quantified in terms of the change in angle
between the sides,
xy f xy
• A plot of shear stress vs. shear strain is similar the
previous plots of normal stress vs. normal strain
except that the strength values are approximately
half. For small strains,
xy G xy yz G yz zx G zx
where G is the modulus of rigidity or shear modulus.
© 2002 The McGraw-Hill Companies, Inc. All rights reserved. 2 - 24

Th
ird
Ed
ition
MECHANICS OF MATERIALS
Beer • Johnston • DeWolf
Example 2.10
SOLUTION:
• Determine the average angular
deformation or shearing strain of
the block.
• Apply Hooke’s law for shearing stress
and strain to find the corresponding
A rectangular block of material with
modulus of rigidity G = 90 ksi is
bonded to two rigid horizontal plates.
The lower plate is fixed, while the
upper plate is subjected to a horizontal
force P. Knowing that the upper plate
moves through 0.04 in. under the action
of the force, determine a) the average
shearing strain in the material, and b)
the force P exerted on the plate.
shearing stress.
• Use the definition of shearing stress to
find the force P.
© 2002 The McGraw-Hill Companies, Inc. All rights reserved. 2 - 25

Th
ird
Ed
ition
MECHANICS OF MATERIALS
Beer • Johnston • DeWolf
• Determine the average angular deformation
or shearing strain of the block.
xy tan xy 0.04in.
2in. xy 0.020 rad
• Apply Hooke’s law for shearing stress and
strain to find the corresponding shearing
stress.
xy G xy 90 103 psi0.020 rad 1800 psi
• Use the definition of shearing stress to find
the force P.
P xy A 1800 psi8in.2.5in. 36 103lb
P 36.0 kips
© 2002 The McGraw-Hill Companies, Inc. All rights reserved. 2 - 26

Th
ird
Ed
ition
MECHANICS OF MATERIALS Beer • Johnston • DeWolf
Relation Among E, and G
• An axially loaded slender bar will
elongate in the axial direction and
contract in the transverse directions.
• An initially cubic element oriented as in
top figure will deform into a rectangular
parallelepiped. The axial load produces a
normal strain.
• If the cubic element is oriented as in the
bottom figure, it will deform into a
rhombus. Axial load also results in a shear
strain.
• Components of normal and shear strain are
related,
E 1
2G
© 2002 The McGraw-Hill Companies, Inc. All rights reserved. 2 - 27

Th
ird
Ed
ition
MECHANICS OF MATERIALS
Beer • Johnston • DeWolf
Sample Problem 2.5
A circle of diameter d = 9 in. is scribed on an unstressed aluminum plate of thickness t = 3/4 in. Forces acting in the plane of the plate later
cause normal stresses x = 12 ksi and z = 20
ksi.
For E = 10x106 psi and = 1/3, determine the
change in:
a) the length of diameter AB,
b) the length of diameter CD,
c) the thickness of the plate, and
d) the volume of the plate.
© 2002 The McGraw-Hill Companies, Inc. All rights reserved. 2 - 28

Th
ird
Ed
ition
MECHANICS OF MATERIALS SOLUTION:
Beer • Johnston • DeWolf
• Apply the generalized Hooke’s Law to • Evaluate the deformation components.
find the three components of normal
strain. B A xd 0.533103in./in.9in.
x x
y
z B A 4.8103in.
E E E C D zd 1.600 103in./in.9in.
1 12 ksi 0
1 20 ksi
10 106 psi 3 C D 14.4 10 3in.
0.533103in./in. t yt 1.067 103in./in.0.75in.
y x
E y
E z
E t 0.800103in.
1.067 103in./in.
• Find the change in volume
z x y
E E z
E e x y z 1.067 103 in3/in3
1.600 103in./in. V eV 1.067 1031515 0.75in3
V 0.187 in3
© 2002 The McGraw-Hill Companies, Inc. All rights reserved. 2 - 29

Th
ird
Ed
ition
MECHANICS OF MATERIALS
Beer • Johnston • DeWolf
Composite Materials
• Fiber-reinforced composite materials are formed
from lamina of fibers of graphite, glass, or
polymers embedded in a resin matrix.
• Normal stresses and strains are related by Hooke’s
Law but with directionally dependent moduli of
elasticity,
E x
x x
Ey
y
E z
z z
• Transverse contractions are related by directionally
dependent values of Poisson’s ratio, e.g.,
xy
y
x
xz
z
x
• Materials with directionally dependent mechanical
properties are anisotropic.
© 2002 The McGraw-Hill Companies, Inc. All rights reserved. 2 - 30
y

Th
ird
Ed
ition
MECHANICS OF MATERIALS
Beer • Johnston • DeWolf
Saint-Venant‟s Principle
• Loads transmitted through rigid
plates result in uniform distribution
of stress and strain.
• Concentrated loads result in large
stresses in the vicinity of the load
application point.
• Stress and strain distributions
become uniform at a relatively short
distance from the load application
points.
• Saint-Venant’s Principle:
Stress distribution may be assumed
independent of the mode of load
application except in the immediate
vicinity of load application points.
© 2002 The McGraw-Hill Companies, Inc. All rights reserved. 2 - 31

Th
ird
Ed
ition
MECHANICS OF MATERIALS
Beer • Johnston • DeWolf
Stress Concentration: Hole
Discontinuities of cross section may result in
high localized or concentrated stresses. K
max
ave
© 2002 The McGraw-Hill Companies, Inc. All rights reserved. 2 - 32

Th
ird
Ed
ition
MECHANICS OF MATERIALS
Beer • Johnston • DeWolf
Stress Concentration: Fillet
© 2002 The McGraw-Hill Companies, Inc. All rights reserved. 2 - 33

Th
ird
Ed
ition
MECHANICS OF MATERIALS
Beer • Johnston • DeWolf
Example 2.12
Determine the largest axial load P
that can be safely supported by a
flat steel bar consisting of two
portions, both 10 mm thick, and
respectively 40 and 60 mm wide,
connected by fillets of radius r = 8
mm. Assume an allowable normal
stress of 165 MPa.
SOLUTION:
• Determine the geometric ratios and
find the stress concentration factor
from Fig. 2.64b.
• Find the allowable average normal
stress using the material allowable
normal stress and the stress
concentration factor.
• Apply the definition of normal stress to
find the allowable load.
© 2002 The McGraw-Hill Companies, Inc. All rights reserved. 2 - 34

Th
ird
Ed
ition
MECHANICS OF MATERIALS
Beer • Johnston • DeWolf
• Determine the geometric ratios and
find the stress concentration factor
from Fig. 2.64b.
D
60 mm d 40 mm
1.50 r
8 mm d 40 mm
0.20
K 1.82
• Find the allowable average normal
stress using the material allowable
normal stress and the stress
concentration factor.
ave max
K
165 MPa 1.82
90.7 MPa
• Apply the definition of normal stress
to find the allowable load.
P A ave 40 mm10 mm90.7 MPa
36.3103 N
P 36.3kN
© 2002 The McGraw-Hill Companies, Inc. All rights reserved. 2 - 35

Th
ird
Ed
ition
MECHANICS OF MATERIALS
Beer • Johnston • DeWolf
Elastoplastic Materials
• Previous analyses based on assumption of
linear stress-strain relationship, i.e.,
stresses below the yield stress
• Assumption is good for brittle material
which rupture without yielding
• If the yield stress of ductile materials is
exceeded, then plastic deformations occur
• Analysis of plastic deformations is
simplified by assuming an idealized
elastoplastic material
• Deformations of an elastoplastic material
are divided into elastic and plastic ranges
• Permanent deformations result from
loading beyond the yield stress
© 2002 The McGraw-Hill Companies, Inc. All rights reserved. 2 - 36

Th
ird
Ed
ition
MECHANICS OF MATERIALS
Beer • Johnston • DeWolf
Plastic Deformations
P ave A max A
K
PY Y A
K
• Elastic deformation while maximum
stress is less than yield stress
• Maximum stress is equal to the yield
stress at the maximum elastic
loading
PU Y A
K PY
• At loadings above the maximum
elastic load, a region of plastic
deformations develop near the hole
• As the loading increases, the plastic
region expands until the section is at
a uniform stress equal to the yield
stress
© 2002 The McGraw-Hill Companies, Inc. All rights reserved. 2 - 37

Th
ird
Ed
ition
MECHANICS OF MATERIALS
Beer • Johnston • DeWolf
Residual Stresses
• When a single structural element is loaded uniformly
beyond its yield stress and then unloaded, it is permanently
deformed but all stresses disappear. This is not the general
result.
• Residual stresses will remain in a structure after
loading and unloading if
- only part of the structure undergoes plastic
deformation
- different parts of the structure undergo different
plastic deformations
• Residual stresses also result from the uneven heating or
cooling of structures or structural elements
© 2002 The McGraw-Hill Companies, Inc. All rights reserved. 2 - 38

Th
ird
Ed
ition
MECHANICS OF MATERIALS
Beer • Johnston • DeWolf
Example 2.14, 2.15, 2.16
A cylindrical rod is placed inside a tube
of the same length. The ends of the rod
and tube are attached to a rigid support
on one side and a rigid plate on the
other. The load on the rod-tube
assembly is increased from zero to 5.7
kips and decreased back to zero.
a) draw a load-deflection diagram
for the rod-tube assembly
b) determine the maximum
Ar 0.075in.2
Er 30 106 psi
At 0.100in.2
Et 15106 psi
elongation
c) determine the permanent set
d) calculate the residual stresses in
the rod and tube.
σY ,r 36 ksi σY ,t 45 ksi
© 2002 The McGraw-Hill Companies, Inc. All rights reserved. 2 - 39

Th
ird
Ed
ition
36 10 psi -3
45 10 psi -3
MECHANICS OF MATERIALS
Beer • Johnston • DeWolf
Example 2.14, 2.15, 2.16
a) draw a load-deflection diagram for the rod-
tube assembly
PY ,r Y ,r Ar 36 ksi0.075in2 2.7 kips
δY,r Y ,r L Y ,r
EY ,r
3 L 30in. 36 10
30 106 psi
in.
PY ,t Y ,t At 45 ksi 0.100in2 4.5 kips
δY,t Y ,t L Y ,t
EY ,t
3 L 30in. 90 10
15106 psi
in.
P Pr Pt
r t
© 2002 The McGraw-Hill Companies, Inc. All rights reserved. 2 - 40

b,c) determine the maximum elongation and permanent set
Th
ird
Ed
ition
MECHANICS OF MATERIALS
Beer • Johnston • DeWolf
Example 2.14, 2.15, 2.16
• at a load of P = 5.7 kips, the rod has reached the
plastic range while the tube is still in the elastic range
Pr PY ,r 2.7 kips
Pt P Pr 5.7 2.7kips 3.0 kips
t Pt
At
3.0 kips 0.1 i
n2
30 ksi
30 103 psi
t t L t
Et
L
15106 psi 30in. max t 60 103in.
• the rod-tube assembly unloads along a line parallel to
0Yr
m 4.5 kips
36 10-3in. 125 kips in. slope
Pmax 5.7 kips 45.6 103in.
m 125 kips in.
p max 60 45.6103in. p 14.4 103in.
© 2002 The McGraw-Hill Companies, Inc. All rights reserved. 2 - 41

Th
ird
Ed
ition
MECHANICS OF MATERIALS
Beer • Johnston • DeWolf
Example 2.14, 2.15, 2.16
• calculate the residual stresses in the rod and tube.
calculate the reverse stresses in the rod and tube
caused by unloading and add them to the maximum
stresses.
45.6 103in.
1.52 103 in.
in.
r
t
L
Er
Et
30in.
1.52 103 30 106 psi 45.6 ksi
1.52 103 15106 psi 22.8 ksi
residual,r
residual,t
r
t
r
t
36 45.6ksi 9.6 ksi
30 22.8ksi 7.2 ksi
© 2002 The McGraw-Hill Companies, Inc. All rights reserved. 2 - 42

Torsional failures
(ductile, buckling,
buckling):

1 3/8” Isolator ( Assembly)
Torsional induced shear
stresses throughout – where is
it maximum?
Other loadings to consider?
(welcome to my nightmare)
Drill Bit
Isolator (QC-
19835, 1 /38”
or QC-20036,
1”)
Drill Rod
Drill Bit
Torsion Load=300 lb-ft
Chuck
Isolator (QC-
19836, 1 3/8”)

Ch 5 - Torsion
Recall: External loads (T)
produce internal loads which
produce deformation, strain
and stress.

Before Torque
After Torque

5.1 Torsional Deformation of a Circular
Shaft
(x) = angle of twist
(varies linearly
along the length, 0
at x = 0, max at x =
L)

Recall = shear strain (rad)
x
ddx
Notice, shear strain,
varies linearly with
radial distance, a nd
is max on the outer
surface!!

Notice, shear strain, varies linearly with
radial distance, a nd
is max on the outer
surface!!
c
Distance from
center to point of
interest
max
Distance from
center to outer
fiver (i.e. outer
radius)

What have we learned so far?
= angle of twist varies from zero at fixed
support to max at end.
= shear strain varies from zero at center
to max at outer fiber.

What about stress???
• Deformation = strain
• Strain = stress
• If you can visualize deformation, you can
visualize stress
• The stress is a shear stress!!

5.2 The Torsion Formula
If linear elastic,
Hooke‟s law applies, t
= Gy
Therefore, stress
follows same profile
as strain!!
c
max

c
EMCH13
Derivation – simple Torque
balance. The torque
produced by the stress
distribution over the entire
cross section must be equal to
the resultant internal torque,
or:
T A
dA
A
max dA
T max
c 2dA A
This is simply polar moment of
inertia, J (an area property)

Outer radius of
shaft (m or in)
max J
Max shear
stress in shaft
(MPa, psi/ksi,
etc.)
Polar moment of
inertia (m4 or in4)
or TJ
The torsion formula (see derivation):
Tc
Torque (N-m, N-
mm or lb-in, lb-
ft, etc)

J = polar moment of inertia
• Solid shaft: •Hollow
J
2
shaft:
c4 J
2 c 4 c 4
o i

Stress Profiles: Shear stress profile – YOU
MUST UNDERSTAND
THIS!!!!
Where is shear stress
max? zero? How does it
vary along the length and
circumference?


Stress Profiles:

J
Examples:
1. Analysis: max
Tc J
Want << allow
2. Design: c
T
allow
Find
geometry


Power (watts, ft-lb/s
or hp)
Torque (N-m, lb-
ft)
5.3 Power Transmission
• Nothing new, just calculate Torque, T, from power equation:
P = T
Careful with units!
Angular velocity (rad/s or Hz)
Note: 1 hp = 550 ft-lb/s
2f
f = Hz or rev/s

Troubleshooting Guide for Blow Molding
Problem Possible Causes Possible Solutions
1. Parison not being blown
Defective blow timer, clogged blow lines, or too sharp pinch- offs
Replace blow timer
Clean blow lines
Stone pinch-offs to create more pinch area
Reset cushion
Clean tooling
2. Parison curling Mandrel and bushing not flush, bushing too cold, low container weight, or stock resin temperature too low
Remachine tooling
Raise bushing temperature
Check heat controllers
Increase container weight
Increase stock resin temperature
Center mandrel in die
Check screw tip design
3. Drawdown, parison sag/stretch
Too high parison temperature, melt index of resin too high, or mold open time too high
Decrease stock temperature
Increase extrusion pressure/rate
Decrease extrusion back pressure
Use lower melt index resin
Reduce mold open time
Decrease container weight
4. Parison tail sticking to parts
Parison too long Shorten parison length or increase pinch-off land area to cool compressed tail
5. Rough parison surface/uneven parison thickness
Extrusion speed too fast, cold parison, stock temperature too low, resin melt index too low, loose mandrel, or insufficient venting
Adjust extrusion rate
Increase stock temperature
Use resin with higher melt index
Check mold alignment
Check tool design
Add venting by either sandblasting the mold surface channels or venting the interior of the mold
6. Black specks in containers
Resin hang-up in die, or material contamination
Clean die surface and tooling
Check material for contamination
7. Bubbles/fish eyes Blow air orifice too small or restricted, low stock temperature, mold temperature too low, tooling damage, or wet and contaminated resin
Check the orifice for restrictions and size
Increase air pressure
Increase melt temperature
Increase mold temperature
Check tooling
Check resin for moisture
Check for contamination
Check for resin lines and/or streamers
Page 1 of 3

8. Streaks Stock temperature too high, contamination in die head, or degraded material on tooling
Decrease stock resin temperature
Check heat controllers
Clean die head
Check for contamination in material
Clean tooling
Decrease extrusion back pressure
Decrease regrind level
Check design of flow path in die
9. Scratches and die lines
Stock temperature too low, die surface poorly polished, extrusion rate too slow, or damaged tooling
Increase stock temperature
Clean die surface
Increase extrusion rate
Check tooling for damage
Check tooling for burnt materials
Check tooling for contamination
10. Orange peel Parison temperature too low, sweat on mold surface, or melt index too low
Increase melt temperature
Increase mold temperature
Check mold vent surface
Decrease cycle time
Use higher MFI resin
11. Containers stick in mold
Parison and mold temperature too high, blowing air pressure too low, part wall too thick
Decrease stock temperature
Decrease mold temperature
Increase blowing air pressure
Check mold for damage
Center mandrel in die
Check for contamination in tooling
12. Parts blow-out Blow-up ratio too large, mold separation, pinch-off too sharp or hot, or parts blow too fast
Use large die
Increase clamp pressure or decrease blow pressure
Provide wider land in pinch-off
Cool mold pinch-off
Use low pressure blow followed by high pressure blow
13. Excessive shrinkage
Stock or mold temperature too high, cooling cycle too short, blowing air pressure too low, or uneven parison wall thickness
Decrease stock temperature
Decrease mold temperature
Check mold cooling
Increase blowing pressure and delay air release
Align mandrel and die
Program parison
14. Poor weld or seal at pinch-off
Stock temperature too low, mold temperature too high, mold closing speed too fast, incorrect design of pinch-off blade, or improper mold venting
Increase stock temperature
Decrease mold temperature
Increase mold closing time
Check pinch-off blade land size
Check pinch-off of mold for clearance and damage
Check mold alignment
Check mold venting
Page 2 of 3

Page 3 of 3
15. Excessive flash Melt too hot, blowing air pressure too high, clamping mechanism out of adjustment, or excessive material being forced into mold
Decrease melt temperature Decrease extrusion back pressure
Decrease pre-blow air pressure
Decrease pre-blow time
Reset clamp or increase clamp pressure
Increase recess at pinch-off areas to accommodate more material
16. Warpage Stock or mold temperature too high, blowing air pressure too low, material density too low, tooling condition, or part wall too thick
Decrease stock temperature Increase cycle time
Check mold for cooling
Reduce cycle time to obtain proper mold cooling
Increase blow air pressure
Use resin of proper density
Check tooling design
Center mandrel
Decrease container weight

Seals, Packing’s and Gaskets.
Introduction:-
Seal is a device used to prevent or minimize leakages of fluids through any mechanical
clearance. They are widely used both in static and in dynamic states. Packing and gaskets the two types
of seals are also used for the same purpose. The only difference is that the gaskets are used only to seal
the static clearances while pickings are used in the case of dynamic clearance also. Some application of
pickings or gaskets may be:-
1) Piston ring in gas, oil or steam engine.
2) Gland packing on reciprocating shaft of pumps.
3) Gasket below the cylinder head of an I.c. engine etc.
The seals may be classified, considering their nature of performance in the basic shapes of the
surface (cylindrical, spherical etc) or on the type of motion (rotary, reciprocating etc.)
Static seal (Gasket):-
A gasket may be made of soft rubber, where water is being handled or it may
even be of thin iron rings to use them under high pressure or a high temperature, Leather and
asbestos are popular materials for gaskets. It may be remembered that gaskets of all sizes and
shapes may generally made in the plant itself. The hand cut gasket is generally located nearly inside
the bolts and is not extended beyond the flange diameter. The compressibility of the gasket material
is commonly taken into consideration while selecting a gasket. The load, being offered by the bolts
must seat the gasket to eliminate the effects of flange surface irregularities. The bolt holes in the
gasket serve also the purpose of locating the same. The best enable of metallic gaskets are the
piston rings. The use of an O-ring gasket is show in figure. The rings are extended above the groove
surfaces to provide cross- sectional compression. They may be of rectangular or round in cross-
section.
There are also gaskets which take its shape under pressure being tightened. They may be termed as
out gaskets. For heavy, pressure a double leather packing for a double acting pump. But for too high
pressures U- leather pickings are most satisfactory.

Dynamic Seals:-
Dynamic seals are there which experience elective movement between the
components. The cylinder and piston assemble of a diesel engine has been show to show the
position of piston rings. They are generally of cast- iron.
Split piston rings are widely used for gas, oil or steam engines. Dynamic seal carry the hydraulic
loads and retain fluid under pressure where pressure is absent or too less, a spring load is applied.
They lubricants like seal oils act as coolants and also serve the purpose of formation of a separating
film.
For very low pressure, carbon rings are used with a shaft, they are generally segmented carbon
rings.
When the component is having an extreme speed, a mechanical mounted on the shaft and the seal
against the stationery seat for an absolute control. Such an arrangement makes the real assembly
balanced. The balancing is a vital criterion for proper functioning of seals.
The dynamic seal materials may be of different types such as stainless steel, sprayed ceramic
satellite, teed, bronze etc, the selection of the face material of packing of a seal should be proper to
have a longer life.
The mechanical seal may be explained in brief.

Belt Drives:-
Belt and pulley drive is extensively used in industry for transmission of power. We will
concentrate on both flat and V-belt drives.
Flat Belts:-
The flat belts may be differentiated as follows with respect to the material of belts.
1) Non- water proof oak leather.
2) Water proof oak leather.
3) Mineral retained leather.
4) Combination of oak and mineral retained leather.
5) Friction surface rubber belts and
6) Cotton belts.
Belt Joining:-
Belt joining may be (1) End less (2) Laced or (3) Metallic
End less Method:-
End less method is considered to be very much efficient. The leather belts offer
the most favorable conditions for making them and less because it is of multiple joints. The ends are
to be scrapped down to a thin edge. Primarily, they are to be sized with a wither proof pyroxylin
cement. After getting them dried, another coating of the cement may be applied on the sized
surface. Then they are to be properly placed together and should be finally kept under pressure for
2-3 houses. Belt joining by hot glue methods of making end less joints.
Lace Joint:-
The laced method employed rawhide or wire. Rawhide lacing and the wire lacing may
also be performed by machine.
Metallic Joints:-
Wire hook lacings are easy to apply by portable or a stationary machine. They are
pressed into the ends of belts so as to form a series of loops. Loops are meshed together and either
rawhide or fiber pins are inserted. Hooks are generally of plain steel, stainless steel or money metal.
Installation of Belts:-
Belts are to be installed naturally on pulleys which are mounted on the shaft
installation procedure deserves perfectness of the total system. Moreover the selection of belt, it’s
with its thickness are also very important. The shafts should be checked so as to be sure that they
are running parallel and without any eccentricity. The squareness of the pulley may be checked by

the help of a try square and then the alignment of the pulley may be checked. This can easily be
done with the help of a string.
Joining the belts which has already been discussed before, is also a part of belt installation. The
tension of the belt should be adjusted so as to transmit power without slippage. A too tight belt
drive may spoil bearing.
Maintenance of Belting:-
Systematic ears and attention are absolutely necessary to maintain the
efficiency of the operation. Some important points are given below:-
a) Belting should be maintained in proper physical condition.
b) Belting requires dressing or lubrication. The dressing should be of suitable character to
accomplish the desirable results. The driving face of a belt should be maintained in a mastic
state. This will enable the belt to run sticker and will lengthen its service life. A minute of good
tallow and cod liver oil or whale oil is used. A dressing compound with some curing ingredients
may also be used. Mineral and vegetable oil should not be used. Rubber or a canvas balt do not
require dressing.
c) The belt surface should always be kept clean from grease or machine oil.
V – Belt Drives:-
V- Belt drives are widely used both for heavy and light duty operation.
Generally for heavy duty application, that is for industrial uses, when frequent heavy starting
and stopping or some other shock loads are involved. Multiple V- belt drives are installed. For a
fractional horse power a single belt may also be used.
V- Belt is of trapezoidal cross-section. And are made of chord and fabric impregnated
with rubber. The chords may be of cotton or synthetic or of steel.
While selecting V- belt the following factors are taken into consideration.
a) The H.P. required to be transmitted.
b) Speed of smaller pulley.
c) The difference between outside and pitch diameter of pulleys.
The difference between the inside and outside length of the belt is also to be taken into
consideration. While selecting the belt, different service factors, suggested by the account
to ensure adequate capacity to offer long and continuous service.
Installation:-
(i) Select matched set of V- belts.
(ii) V- Belts are never stretched or are forced into the grooves to avoid the rapture of an
outside jacket or the inside chords or of both.

(iii) The mover is better to move towards the machine to be driven. The belts are placed
in the pulley grooves and then the prime movers may be moved away to apply
tension.
(iv) A V- belt may ride up to the top surface of the pulley groove. The in correct
installation procedures and a correct one is shown in figure. Definite clearance
should be provided between the base of the pulley groove and the base of the belt.
(v) It an idler is to be used to adjust belt tension, it should always be used on the inside
of the belt.
Maintenance:-
(i) Entry of any metal particles, sawdust etc. in the belt drive should be avoided
to restrict the abrasion of belt. The belt drive may be made covered at the
top and at the said for this purpose.
(ii) Excessive load which results in excessive stretch on the belt, should always
be avoided.
(iii) V- Belt should be preserved free from conditions, injurious to the subbed
component.
(iv) Slippage if any in the drive should be checked periodically to ensure the
transmission of sated load.
(v) Belts of different bands should not be mixed. When replacing belts, total set
of belts should not run to get her.
(vi) The belt wear results from its contact with the walls of the pulley groove.
So a periodic checking of grooves with templates as essential. The grooves
should also be inspected for burrs, rough, spots, dust, dist etc.
Chain Drive :-
A positive transmission of power by the help of chains is very much
common especially for light and medium drives, chain drives consists of end less
chain links over sprockets, fitted on both the driving and driven shafts. The chain
links are generally made of alloy steel. Mostly two types of chains are used as
standard chain drive.
(a) Roller chain drive and
(b) Silent chain drive
Roller chain drives:-
Looking at the chains, it may be seen that the set of rollers
are connected with the inner links. The link pin is mounted tightly with the outer
links and the bushings are fitted on the inner links in such a way that the roller
can rotate round the pin.
While making assembly, two sets of rollers and bushings are placed in the
inner link and it is connected with the other rings through the pine.

To obtain a permissible operating speed chain drive of shorter pitch of roller
chains are preferred.
Silent chain drive:-
These are the inverted tooth – type links joined on pins one
after another to form the endless chain. Such a drive deserves to operate within
casing having provision for lubrication.
Erection:-
(i) The shafts on which the sprockets are rigidly mounted should be
parallel and truly aligned.
(ii) It possible, it is better to mount sprockets close to be bearings.
(iii) Before starting the chain connections are to be checked and to be
properly lubricated.
Maintenance:-
(i) Scheduled lubrication should be employed to restrict wear of bus has
and pins.
(ii) It is a good practice to check the adjustment and alignment about one
month after the installation and then at a regular intervals of six month.
(iii) The chain wear may be inspected periodically, pulling it racially away
from the larger sprocket.
(iv) Worn out sprocket may sometimes be used refitting it in a reverse
manner, if the wear is not too high.
(v) New chains should never be installed over a worn-out sprocket. The
sprocket also should be replaced in such cases.
Gears:-
The power transmission procedures by belts, ropes, chains etc have the
advantage to connect the shafts at long centre distances but in not positive.
There is slip and creep. The gear drive on the other hand is a positive and
smooth drive, but the shafts at comparatively short distances can only be
connected by means of gears.
Common types of gears generally used in industrial application generally
used in industrial application in eludes spur, helical, herring bone, bevel, worm
gears etc.
Spur gears are generally used to transmit power to a paroles shaft without
end thrust and axial displacement at moderate speeds.

Helical gears allow meshing several teeth at a time increasing the load carrying
capacity and it reduces noise and vibration. It produces end thrust and that is
why it is to be accommodated with thrust bearing.
Bevel gears are normally used to transmit power to a shaft at right angles
Worm gears are very much popular due to its noise and vibration less compact
service.
Gear tooth failure:-
The failure of a gear tooth may be of two types (1) Surface
wear and (2) Tooth breakage
The surface deterioration may be due to caver, place flow, searing, surface
fatigue and the tooth breakage may be due to fatigue heavy wear, over load or
cracking.
Maintenance:-
The recommended lubricants and filter is to be used to avoid
normal wearing. But abrasive wear may be caused by fine particles passing
though the contact surface of gear teeth. Scratching on the teeth is a mark of
identification of abrasive wear. In such cases, oil should be drained stopping the
unit. The gear teeth should be scrapped and cleaned and care is to be taken to
use dust free lubricants. Plastic flow may occur under heavy load. Ridging is a
appears as diagonal lines. It is caused also due to heavy load and inadequate
lubrication.
Scoring is the quick removal of metal from a tooth surface. It may be caused due
to a rapture of the oil film. Extreme press use lubricants may be used in this
case. It starts from the tearing out of a small surface particle. Marks due to
scoring appear in the direction of sliding.
Tooth surface fatigue is also a type of failure caused due to reparative surface
stresses baying its endurance dimity. Metals are removed from the surface and
the cavities may be format due to surface fatigue. Pitting is a type of surface
fatigue generally occurs in the initial stage of operation. Normally, gradual
running sometimes polishes the surface reducing pitting. Sometimes grinding
and polishing of tooth surface is to be done to avoid pitting.
Gear Inspection:-
Gear inspection is a part of the gear maintenance work for
achieving satisfactory performance of a gear train.

The following major errors may be tested during annual servicing for gear trains
which under go excessive loading
Pitch Error:-
This is an individual spacing error between successive tooth. This
error is cheeked generally by a measuring head which consists of a fined stopper and
movable lever.
Radial Rainout or eccentricity error:-
Radial run out occurs due to the combined
effects of teeth irregularity misalignment and eccentricity of teeth with reference to
the airs of gear. This error can be measured by the process as described previously
during gear mounting.
Tooth alignment Error:-
This is the total deviation of the actual tooth trace from
the theoretical or desired tooth trace on the reference cylinder. This is a measured in
transverse direction. The alignment error for a spur gear is measured by passing a stylus
of a dial indicator on the tooth flank across the face with of the gear, parallel to the gear
anis and recording the reading.
The tooth thickness error, tooth profile error, should also be measured
accordingly for a thorough inspection to take necessary measures for maintenance and
repair.
Repair Method:-
(1) Gears running in one direction may be reversed 1800 to take the help of a
non-worn surface for better operation.
(2) When a wear appears on both the sides of the tooth surface, it may be seen
that a smaller meshing gear will wear more. This may be replaced by a new
one sometimes, the depth of a tooth in the smaller gear is chosen slightly
less than the normal and the outside diameter of the larger gear is reduced
to match it.
(3) It a particular tooth of a large gear is broken, it can be re-built by welding
the deposit.

Lubrication
Introduction:-
Metal surfaces are mostly irregular in nature and when two surfaces are kept in contact
with each other, they touch only at the tips of their asperities. The real area of contact is much smaller
than the apparent. At this stage, a strong adhesion is produced due to the attraction of atoms of one
surface with those of the other. While sliding this adhesion force is to be over come by shearing the
junction of contacts. This junction shearing is actually the basic cense of friction in clean metals. The
wear and tear of substance is also caused due to this phenomenon.
Lubrication is a procedure to separate the surface with a film of lubricant to minimize friction and to
restrict wear and tear as well. The substance used for this purpose is called lubricants.
Functions of Lubrication:-
The major function of lubrication may be summarized as:-
(a) To minimize friction in the mating surface.
(b) To minimize wear and tear of the surface.
(c) To carry out the heat generated due to friction, leaving the assembly cool as for as practicable.
(d) To lengthen the service life of the components by per forming the above function.
It may be noted that the lubrication can properties the desired result, depending on the
(a) Physical, chemical and mechanical properties of the selected lubricants.
(b) The lubricating method.
Properties of Lubricants:-
The major important properties of lubricants are stated below:-
Viscosity:-
It is the indication of the degree of fluidity of lubricating oil. It only focuses how the
liquid/ lubricating oil will flow under the temperature at which it is to function. Viscosity
enables the lubricant to with stand load as because it is a resistance forming and retaining
property. The rate of change of viscosity with temperature is called viscosity index. Low range
of variation of viscosity with temperature identifies good viscosity- index.
Flash point and fire point:-
Flash point is the temperature at which the lubricants produce
sufficient vapor at the application of a flame and the fire point is to some extent, higher
temperature at which the generated vapor will ignite and the oil will burn steadily. They actually

the properties of the lubricants to with stand temperature of the environment where it is
applied.
Pour point:-
This is the property to know the behavior of lubricants at low temperatures. The
pour point can be specified by the temperature at which the lubricant causes to flow. It is of
major importance in the refrigeration grade of oil.
Oiliness:-
It is the degree of a billet to form an oily surface on the metal. It is a combined
measure of surface tension and wet ability to form a film of lubrication.
Neutralsation Number:-
This number indicates the acidity or alkalinity of lubricants and is
measured by the amount of potassium hydroxide (KOH) in milligrams required to neutralize one
gram of oil.
Saponification Number :-
Its purpose is to identify animal and vegetable oils. It is also tested as
the milligrams of KOH required to form soaps, when it is added to 1 groom of oil. Mineral oil will
not help to form soaps and thus it identifies fat or fatty acids.
Carbon residual property:-
It indicates the amount of carbon residue on evaporating the oil
under special conditions. Such tests are generally conducted while using oil for internal
combustion engines.
Types of Lubricants:-
The lubricants may be either solid or liquid or semi-liquid. The solid
lubricants are used when oil or greases are unsuitable or not permissible, such as at very low or
high temperatures. The solid lubricants may be used in pure or combination or suspended form.
The common solid lubricants are soap, mica, molybdenum – disulphide etc. Graphite is also used
in mining it with oils. The adhesive characteristic of graphite with oil enables it to retain film or
oil on the surface. Polyhedral fluorethylene (PTFE) being highly resistant to aggressive media is
also popularly used.
The very popular semi – liquid lubricant is grease. It has got a number of grades and depending
on the types of lubrication required, the grade is judiciously selected. Grease is basically mineral
or synthetic oil and is thickening agents.

The grease may be of various types, such as Non – soap greases, lithium base greases, calcium
base grease etc.
Selection of Lubricants:-
The best selection of a lubricants for a particular type will be the
simplest and cheapest one. Which will of course, meet the requirements?
In general, in any assembly without any feed mechanism, a small quantity of mineral oil is
ideal. Again, a small quantity may not be functional when wear debris creates problem or heat
generation is more. In that case, an oil – feed system may be preferred.
When cooling is not much required but sealing is the criterion, grease is the choice.
But under high temperature range or for special requirements e – g low flammability or low –
carbonization, synthetic oil is preferred.
Generally oil of lower viscosity is suitable for high – speed mechanism. And for high load and low
speed mechanisms, highly viscous oil or grease is used.
It the temperature becomes too high or too low number product contamination is acceptable,
if extremely long life is required, the best choice may be a solid lubricant.
Modes of lubrication:-
The modes of lubrications are usually characterized by the friction and
wear behavior of surface layers. It is generally of three type.
(a) Boundary lubrication
(b) Fluid film lubrication and
(c) Mined lubrication.
The modes can be identified considering the value of “R” where
R = Mean fluid film thickness
Surface Roughness.
Where R< 1, it is boundary lubrication. If 5 < R < 100, it is mined lubrication
(a) Bound Lubrication :-
This type of lubrication mode is generally found on machine tool
slide ways and most commonly in door – hinds. The principle is 1 and 2 represent the
underlying materials. The area 4 is the boundary lubricant and the area 3 is the

protective film which may be present. Due to the physical and chemical reaction be
tureen the surface layer and the lubricant. It is generally an oxide film.
(b) Fluid film lubrication :-
Surface wear can best be minimized by the formation of a fluid
film (3) in between the mating surface (1 and 2). This film can be formed by the motion
of solid or by the an application of an external pressure. The former one is known as self
acting or hydrodynamic type and the later one is externally pressurized or hydrostatic
type of lubrication.
However, in both cases the main objective is to form a film of lubrication which should
be thicker than the dimensions of surface issegularities. The best example of such
lubrication is as in case of a journal bearing. The applied load (IV) forces the journal into
an eccentric position within the bearing thus providing a converging film. At no load
condition the film thickness remain constant.
(c) Mixed Lubrication :-
In most of the machine elements the lubrication mechanism is a
mixture of both boundary and film lubrication. In most cases, the surface intersection
and boundary lubrication contributes to the overall friction and wear characteristics. In
addition to a significant fluid film lubrication action. Such a phenomenon is termed as
mixed lubrication. For which both the physical properties and to be taken into
consideration for an efficient lubrication.
Types of lubrication systems:-
(1) Hand System :-
This is termed as hand oiling, that is application of lubricant by
hand, say by oil can It is of circumstances. But it is not at all an efficient system. Too
much wastage of lubricant is caused. A chance of applying oil in excessive quantity is
always there of course for simple bearings and where an easy access is available this
system is followed in good numbers. It is always better to use this system as a
temporary measure.
Dip Type:-
The principle is to keep a ring of chain dipped into the oil and its rotating
motion will provide lubrication at the appropriate place. The horizontal bearing can
be easily lubricated by this system. The ring may rest on the journal. When the
journal rotates, the ring will also rotate at a lower speed and will carry oil from the
bath along with it. Inefficient in high speeds.

Wick Type:-
The system functions with the capillary principles. A capillary tube is
inserted in a oil reservoir. The top of the capillary tube will certainly remain above
the oil level. The wick is inserted through it by insert stick up to the point of
lubrication. A continuous flow of oil will take place through the dipper wick. Amount
of oil transfer will depend. Upon the formation of the wick and on the viscosity of
the oil. Case should be taken to change the wick when it ceases to function desirably
or it becomes contaminated.
Splash Type:-
Such a system operates when a running component it self is dipped
into a oil sump and it splashes oil round the parts requiring it splash lubrication is
very much common in small power vertical and horizontal high – speed engines with
a closed crank case. It is also effectively employed in the all gear drives. The lower
part of the gears remain dipping in the oil for a part of the feed box of a lathe.
Circulating Type:-
Such a system provides means to supply a lubricant to different
point from the tank or sump by a pressure pump. It may consist of a suction filter,
pump, lubricating points. And a return line filter. It is suitable for the applications
where a large number of points at different access are to be lubricated and the cost
is ultimately justified.
Mist System:-
Its principle is to produce an aerosol spray. Lubricating oil is mixed
with compressed air, drop by drop and at the lubricating points the mist is throttled
to atmospheric pressure. Thus the rubbing surface wet and the air is permitted to
escape to atmosphere.
Grease Cup:-
Grease lubrication is a popular type of lubrication and may be applied
by the help of a grease cup.
The rotation of the cup presses the grease and forces it to pass through the hole in
the base piece.
Such an arrangement is employed only where design has provided the means for
lubrication with such procedure.
Lubrication a Regular maintenance:-
It is needless to emphasis the importance of
lubrication any more. It is a regular work being performed by the operators,
attendants during the operation. It will be sufficient to note that each and every
system will be supplied by the manufacturer along with their suggestions and

instruction for lubrication, regarding the quality of lubricants required, several
procedures of lubrication to be followed, key points to be lubricated intervals of
lubrication etc.

Objectives_template
file:///D|/Web%20Course/Dr.%20Nishith%20Verma/local%20server/fluid_mechanics/lecture20/20_1.htm[5/9/2012 3:33:36 PM]
Module 7: Energy conservation
Lecture 20: Bernoulli equation and applications
Bernoulli equation and applications

Objectives_template
Bernoulli equation and applications
In the previous lecture, we obtained an expression for the conservation of mechanical energy in a
flowing system. We will like to apply the same expression between two points or location in the flow-
field. Before that, let us understand „streamlines‟ and “stream tubes”.
Streamline – it represents a line drawn in the flow field such that tangent drawn at every point of it
is in the direction of the local
(Fig. 20a)
Note that streamline will change in the unsteady-state flow field. Also, note that laminar flow is
represented/ characterized by streamlines (turbulent flow is characterized by eddy, irregular, unstable
flow patterns). If we inject dyes or color at a certain location in the laminar flow, we can track the
path of dyes and visualize streamlines. Similarly, if we inject or sprinkle several tiny (mass-less)
needles in the fluid under steady- state laminar flow conditions, the needles will align themselves
along the fluid- flow path. A hypothetical line connecting the head of the needles may be considered
to be „streamline.
Two streamlines cannot cross each other, because there will be two velocities at the point of
intersection, which is not possible.
On similar note, mass cannot cross a streamline. Based on the understanding of streamlines,
one can visualize a stream tube as a hypothetical 3D tube encompassing streamlines inside,
whose surface also consists of streamlines.
Note that at the entry and exit of the stream tube
(marked in bold lines), velocity is perpendicular to
the CS.
(Fig. 20b)
file:///D|/Web%20Course/Dr.%20Nishith%20Verma/local%20server/fluid_mechanics/lecture20/20_2.htm[5/9/2012 3:33:36 PM]
Module 7: Energy conservation
Lecture 20: Bernoulli equation and applications
velocity vector,

Objectives_template
It can be said that fluid cannot cross the CS of the stream tube, and therefore, the outer boundary or
CS of the tube may be replaced with a solid wall!
We can now apply the mechanical energy balance equation to the CV of a stream tube
between ports 1 and 2:
constant, with the assumptions
(a) (2) (3) laminar flow (4) inviscid fluid or no viscous loss, and (5)
isothermal.
Under the extreme case of zero width or diameter of 3D stream tube, the equation may be
applied between points 1 and 2 along a streamline
(Fig. 20c)
The same equation gets a name, the famous “Bernoulli equation” with the additional constraint (6)
that this equation must be applied along a streamline. See the figure below. The BE cannot be
applied between „1‟ and ‟3‟, because they do not lie on a streamline, but can be applied between „1‟
and „2‟.
(Fig. 20d)
file:///D|/Web%20Course/Dr.%20Nishith%20Verma/local%20server/fluid_mechanics/lecture20/20_3.htm[5/9/2012 3:33:36 PM]
Module 7: Energy conservation
Lecture 20: Bernoulli equation and applications

Objectives_template
file:///D|/Web%20Course/Dr.%20Nishith%20Verma/local%20server/fluid_mechanics/lecture20/20_4.htm[5/9/2012 3:33:36 PM]
Module 7: Energy conservation
Lecture 20: Bernoulli equation and applications
It is interesting to mention that if there is a pump which delivers energy to the fluid and if there are
viscous losses because of friction with the walls or expansion or contraction, the BE is modified as
an engineering approximation :
Example: An inverse U-tube is used to drain water from a tank or reservoir. The bend of the
inverted tube is 1m above the free surface of the water in the tank and 10 m above the ground
where the water is discharged. Water exits the tube at atmospheric pressure. Determine the
pressure in the bend.
(Fig. 20e)
To apply BE, assume
, and neglect viscous losses (losses in the bend or due to wall-friction)

Objectives_template
Apply BE between (1) and (B). (It is obvious that we have chosen a streamline along (1) and (B),
shown as a dotted line)
, where
and are the elevations from a reference line.
(considering that the tank area is significantly larger than the tube‟s size,
which is always true). Mathematically, one can apply continuity in such case:
.
Therefore,
Obtain . How? Apply continuity between „B' and „2‟
Obtain . How? Apply BE between „1‟and „2‟
Substitute to obtain
Substitute to obtain
x
file:///D|/Web%20Course/Dr.%20Nishith%20Verma/local%20server/fluid_mechanics/lecture20/20_5.htm[5/9/2012 3:33:36 PM]
Module 7: Energy conservation
Lecture 20: Bernoulli equation and applications

Chapter 1
Introduction
1.1 Definition:
Definition of Stress
Consider a small area δA on the surface of a body (Fig. 1.1). The force acting on this area is δF
This force can be resolved into two perpendicular components
The component of force acting normal to the area called normal force and is denoted by δFn
The component of force acting along the plane of area is called tangential force and is denoted
by δFt
Fig 1.1 Normal and Tangential Forces on a surface
When they are expressed as force per unit area they are called as normal stress and tangential
stress respectively. The tangential stress is also called shear stress
The normal stress
(1.1)
And shear stress
(1.2)

Definition of Fluid
A fluid is a substance that deforms continuously in the face of tangential or shear stress,
irrespective of the magnitude of shear stress .This continuous deformation under the
application of shear stress constitutes a flow.
In this connection fluid can also be defined as the state of matter that cannot sustain any shear
stress.
Example : Consider Fig 1.2
Fig 1.2 Shear stress on a fluid body
If a shear stress τ is applied at any location in a fluid, the element 011' which is initially at rest, will move
to 022', then to 033'. Further, it moves to 044' and continues to move in a similar fashion.
In other words, the tangential stress in a fluid body depends on velocity of deformation and vanishes
as this velocity approaches zero. A good example is Newton's parallel plate experiment where
dependence of shear force on the velocity of deformation was established.

1.2 Science of Fluid Mechanics:
Distinction Between Solid and Fluid
Solid Fluid
More Compact Structure Attractive Forces between the molecules
are larger therefore more closely packed Solids can resist tangential stresses in
static condition Whenever a solid is subjected to shear
stress a. It undergoes a definite
deformation α or breaks b. α is proportional to shear stress
upto some limiting condition Solid may regain partly or fully its
original shape when the tangential stress
is removed
Less Compact Structure Attractive Forces between the molecules
are smaller therefore more loosely
packed Fluids cannot resist tangential stresses in
static condition. Whenever a fluid is subjected to shear
stress a. No fixed deformation b. Continious deformation takes
place until the shear stress is applied
A fluid can never regain its original
shape, once it has been distorded by the
shear stress
Fig 1.3 Deformation of a Solid Body

1.3 Fluid Properties:
Characteristics of a continuous fluid which are independent of the motion of the fluid are called
basic properties of the fluid. Some of the basic properties are as discussed below.
Property Symbol Definition Unit
Density
ρ
The density p of a fluid is its mass per unit volume . If a fluid element enclosing
a point P has a volume Δ and mass Δm (Fig. 1.4), then density (ρ)at point P is
written as
However, in a medium where continuum model is valid one can write -
(1.3)
Fig 1.4 A fluid element enclosing point P
kg/m3
Specific
Weight γ
The specific weight is the weight of fluid per unit volume. The specific weight
is given N/m
3

by γ= ρg (1.4)
Where g is the gravitational acceleration. Just as weight must be clearly
distinguished from mass, so must the specific weight be distinguished from
density.
Specific
Volume
v
The specific volume of a fluid is the volume occupied by unit mass of fluid.
Thus
(1.5)
m3
/kg
Specific
Gravity
s
For liquids, it is the ratio of density of a liquid at actual conditions to the density
of pure water at 101 kN/m2
, and at 4°C.
The specific gravity of a gas is the ratio of its density to that of either hydrogen
or air at some specified temperature or pressure.
However, there is no general standard; so the conditions must be stated while
referring to the specific gravity of a gas.
-
Viscosity ( μ ) :
Viscosity is a fluid property whose effect is understood when the fluid is in motion.
In a flow of fluid, when the fluid elements move with different velocities, each element
will feel some resistance due to fluid friction within the elements.
Therefore, shear stresses can be identified between the fluid elements with different
velocities.
The relationship between the shear stress and the velocity field was given by Sir Isaac
Newton.
Consider a flow (Fig. 1.5) in which all fluid particles are moving in the same direction in such a way that
the fluid layers move parallel with different velocities.

Fig 1.5 Parallel flow of a fluid Fig 1.6 Two adjacent layers of a moving fluid.
The upper layer, which is moving faster, tries to draw the lower slowly moving layer
along with it by means of a force F along the direction of flow on this layer. Similarly,
the lower layer tries to retard the upper one, according to Newton's third law, with an
equal and opposite force F on it (Figure 1.6).
Such a fluid flow where x-direction velocities, for example, change with y-coordinate is
called shear flow of the fluid.
Thus, the dragging effect of one layer on the other is experienced by a tangential force F
on the respective layers. If F acts over an area of contact A, then the shear stress τ is
defined as
τ = F/A
Newton postulated that τ is proportional to the quantity Δu/ Δy where Δy is the distance
of separation of the two layers and Δu is the difference in their velocities.
In the limiting case of Δy→ 0, Δu / Δy equals du/dy, the velocity gradient at a point in a
direction perpendicular to the direction of the motion of the layer.
According to Newton τ and du/dy bears the relation
(1.7)
where, the constant of proportionality μ is known as the coefficient of viscosity or simply
viscosity which is a property of the fluid and depends on its state. Sign of τ depends upon the
sign of du/dy. For the profile shown in Fig. 1.5, du/dy is positive everywhere and hence, τ is
positive. Both the velocity and stress are considered positive in the positive direction of the

coordinate parallel to them.
Equation
defining the viscosity of a fluid, is known as Newton's law of viscosity. Common fluids, viz. water, air,
mercury obey Newton's law of viscosity and are known as Newtonian fluids.
Other classes of fluids, viz. paints, different polymer solution, blood do not obey the typical linear
relationship, of τ and du/dy and are known as non-Newtonian fluids. In non-newtonian fluids viscosity
itself may be a function of deformation rate as you will study in the next lecture.
Causes of Viscosity
The causes of viscosity in a fluid are possibly attributed to two factors:
(i) intermolecular force of cohesion
(ii) molecular momentum exchange
Due to strong cohesive forces between the molecules, any layer in a moving fluid tries to drag the
adjacent layer to move with an equal speed and thus produces the effect of viscosity as discussed
earlier. Since cohesion decreases with temperature, the liquid viscosity does likewise.
Fig 1.7 Movement of fluid molecules between two adjacent moving layers
Molecules from layer aa in course of continous thermal agitation migrate into layer bb
Momentum from the migrant molecules from layer aa is stored by molecules of layer bb by way
of collision
Thus layer bb as a whole is speeded up
Molecules from the lower layer bb arrive at aa and tend to retard the layer aa

Every such migration of molecules causes forces of acceleration or deceleration to drag the layers
so as to oppose the differences in velocity between the layers and produce the effect of viscosity.
As the random molecular motion increases with a rise in temperature, the viscosity also increases
accordingly. Except for very special cases (e.g., at very high pressure) the viscosity of both
liquids and gases ceases to be a function of pressure.
For Newtonian fluids, the coefficient of viscosity depends strongly on temperature but varies very
little with pressure.
For liquids, molecular motion is less significant than the forces of cohesion, thus viscosity of
liquids decrease with increase in temperature.
For gases,molecular motion is more significant than the cohesive forces, thus viscosity of gases
increase with increase in temperature.
Fig 1.8: Change of Viscosity of Water and Air under 1 atm
No-slip Condition of Viscous Fluids
It has been established through experimental observations that the relative velocity between the
solid surface and the adjacent fluid particles is zero whenever a viscous fluid flows over a solid
surface. This is known as no-slip condition.
This behavior of no-slip at the solid surface is not same as the wetting of surfaces by the fluids.
For example, mercury flowing in a stationary glass tube will not wet the surface, but will have
zero velocity at the wall of the tube.
The wetting property results from surface tension, whereas the no-slip condition is a consequence
of fluid viscosity.

1.4 Capillarity:
The interplay of the forces of cohesion and adhesion explains the phenomenon of capillarity.
When a liquid is in contact with a solid, if the forces of adhesion between the molecules of the
liquid and the solid are greater than the forces of cohesion among the liquid molecules
themselves, the liquid molecules crowd towards the solid surface. The area of contact between the
liquid and solid increases and the liquid thus wets the solid surface.
The reverse phenomenon takes place when the force of cohesion is greater than the force of
adhesion. These adhesion and cohesion properties result in the phenomenon of capillarity by
which a liquid either rises or falls in a tube dipped into the liquid depending upon whether the
force of adhesion is more than that of cohesion or not (Fig.2.4).
The angle θ as shown in Fig. 2.4, is the area wetting contact angle made by the interface with the
solid surface.
Fig 2.4 Phenomenon of Capillarity
For pure water in contact with air in a clean glass tube, the capillary rise takes place with θ = 0 .
Mercury causes capillary depression with an angle of contact of about 1300 in a clean glass in
contact with air. Since h varies inversely with D as found from Eq. ( ), an
appreciable capillary rise or depression is observed in tubes of small diameter only.

1.5 Surface Tension:
The phenomenon of surface tension arises due to the two kinds of intermolecular forces
(i) Cohesion : The force of attraction between the molecules of a liquid by virtue of which they
are bound to each other to remain as one assemblage of particles is known as the force of
cohesion. This property enables the liquid to resist tensile stress.
(ii) Adhesion : The force of attraction between unlike molecules, i.e. between the
molecules of different liquids or between the molecules of a liquid and those of a solid
body when they are in contact with each other, is known as the force of adhesion. This
force enables two different liquids to adhere to each other or a liquid to adhere to a solid
body or surface.
Figure 2.3 The intermolecular cohesive force field in a bulk of liquid with a free surface
A and B experience equal force of cohesion in all directions, C experiences a net force
interior of the liquid The net force is maximum for D since it is at surface
Work is done on each molecule arriving at surface against the action of an inward force. Thus
mechanical work is performed in creating a free surface or in increasing the area of the surface.
Therefore, a surface requires mechanical energy for its formation and the existence of a free
surface implies the presence of stored mechanical energy known as free surface energy. Any
system tries to attain the condition of stable equilibrium with its potential energy as minimum.
Thus a quantity of liquid will adjust its shape until its surface area and consequently its free
surface energy is a minimum.
The magnitude of surface tension is defined as the tensile force acting across imaginary short and
straight elemental line divided by the length of the line.
The dimensional formula is F/L or MT-2
. It is usually expressed in N/m in SI units.

Surface tension is a binary property of the liquid and gas or two liquids which are in contact with
each other and defines the interface. It decreases slightly with increasing temperature. The
surface tension of water in contact with air at 20°C is about 0.073 N/m.
It is due to surface tension that a curved liquid interface in equilibrium results in a greater
pressure at the concave side of the surface than that at its convex side.
1.6 Compressibility:
Compressibility of any substance is the measure of its change in volume under the action
of external forces.
The normal compressive stress on any fluid element at rest is known as hydrostatic
pressure p and arises as a result of innumerable molecular collisions in the entire fluid.
The degree of compressibility of a substance is characterized by the bulk modulus of
elasticity E defined as
(2.3)
Where Δ and Δp are the changes in the volume and pressure respectively, and is the
initial volume. The negative sign (-sign) is included to make E positive, since increase in
pressure would decrease the volume i.e for Δp>0 , Δ <0) in volume.
For a given mass of a substance, the change in its volume and density satisfies the
relation
Dm = 0, D( ρ ) = 0
(2.4)
using
we get
(2.5)

Values of E for liquids are very high as compared with those of gases (except at very high
pressures). Therefore, liquids are usually termed as incompressible fluids though, in fact, no
substance is theoretically incompressible with a value of E as .
For example, the bulk modulus of elasticity for water and air at atmospheric pressure are
approximately 2 x 10⁶ kN/m
2 and 101 kN/m
2 respectively. It indicates that air is about 20,000
times more compressible than water. Hence water can be treated as incompressible.
For gases another characteristic parameter, known as compressibility K, is usually defined , it is
the reciprocal of E
(2.6)
K is often expressed in terms of specific volume . For any gaseous substance, a change in pressure is generally associated with a change in volume
and a change in temperature simultaneously. A functional relationship between the pressure,
volume and temperature at any equilibrium state is known as thermodynamic equation of
state for the gas.
For an ideal gas, the thermodynamic equation of state is given by
p = ρRT (2.7)
where T is the temperature in absolute thermodynamic or gas temperature scale (which are, in
fact, identical), and R is known as the characteristic gas constant, the value of which depends
upon a particular gas. However, this equation is also valid for the real gases which are
thermodynamically far from their liquid phase. For air, the value of R is 287 J/kg K.
K and E generally depend on the nature of process

1.7 Units and Dimensions:
Pascal (N/m2) is the unit of pressure.
Pressure is usually expressed with reference to either absolute zero pressure (a complete vacuum)or local
atmospheric pressure.
The absolute pressure: It is the difference between the value of the pressure and the absolute zero
pressure.
Gauge pressure: It is the diference between the value of the pressure and the local atmospheric
pressure(patm)
Vacuum Pressure: If p<patm then the gauge pressure becomes negative and is called the
vacuum pressure.But one should always remember that hydrostatic pressure is always compressive in nature
Fig 4.1 The Scale of Pressure
At sea-level, the international standard atmosphere has been chosen as Patm = 101.32 kN/m2

1.8 Normal and Shear Stresses in Fluid Flow:
Fluid Elements - Definition: Fluid element can be defined as an infinitesimal region of the fluid
continuum in isolation from its surroundings.
Two types of forces exist on fluid elements
Body Force: distributed over the entire mass or volume of the element. It is usually expressed per
unit mass of the element or medium upon which the forces act.
Example: Gravitational Force, Electromagnetic force fields etc. Surface Force: Forces exerted on the fluid element by its surroundings through direct contact at
the surface.
Surface force has two components:
Normal Force: along the normal to the area
Shear Force: along the plane of the area.
The ratios of these forces and the elemental area in the limit of the area tending to zero are called
the normal and shear stresses respectively.
The shear force is zero for any fluid element at rest and hence the only surface force on a fluid
element is the normal component.
Normal Stress in a Stationary Fluid
Consider a stationary fluid element of tetrahedral shape with three of its faces coinciding with
the coordinate planes x, y and z.
Fig 3.1 State of Stress in a Fluid Element at Rest

Since a fluid element at rest can develop neither shear stress nor tensile stress, the normal
stresses acting on different faces are compressive in nature.
Suppose, ΣFx, ΣFy and ΣFz are the net forces acting on the fluid element in positive x,y and z
directions respectively. The direction cosines of the normal to the inclined plane of an area
ΔA are cos α, cos β and cos g .Considering gravity as the only source of external body force, acting in the -ve z direction, the equations of static equlibrium for the tetrahedronal fluid element
can be written as
(3.1)
(3.2)
(3.3)
where = Volume of tetrahedral fluid element

Chapter 2
Regimes of Fluid Flow
2.1 Continuum and Free Molecular flow:
Concept of Continuum
The concept of continuum is a kind of idealization of the continuous description of matter
where the properties of the matter are considered as continuous functions of space
variables. Although any matter is composed of several molecules, the concept of
continuum assumes a continuous distribution of mass within the matter or system with no
empty space, instead of the actual conglomeration of separate molecules.
Describing a fluid flow quantitatively makes it necessary to assume that flow variables
(pressure , velocity etc.) and fluid properties vary continuously from one point to another.
Mathematical description of flow on this basis have proved to be reliable and treatment of
fluid medium as a continuum has firmly become established. For example density at a
point is normally defined as
Here Δ is the volume of the fluid element and m is the mass
If Δ is very large ρ is affected by the inhomogeneities in the fluid medium.
Considering another extreme if Δ is very small, random movement of atoms (or
molecules) would change their number at different times. In the continuum
approximation point density is defined at the smallest magnitude of Δ , before
statistical fluctuations become significant. This is called continuum limit and is
denoted by Δ c.
One of the factors considered important in determining the validity of continuum model
is molecular density. It is the distance between the molecules which is characterised by
mean free path ( λ ). It is calculated by finding statistical average distance the molecules
travel between two successive collisions. If the mean free path is very small as compared
with some characteristic length in the flow domain (i.e., the molecular density is very
high) then the gas can be treated as a continuous medium. If the mean free path is large in
comparison to some characteristic length, the gas cannot be considered continuous and it
should be analysed by the molecular theory.

A dimensionless parameter known as Knudsen number, K n = λ / L, where λ is the mean
free path and L is the characteristic length. It describes the degree of departure from continuum.
Usually when K n> 0.01, the concept of continuum does not hold good.
Beyond this critical range of Knudsen number, the flows are known as
slip flow (0.01 < K n < 0.1),
transition flow (0.1 < K n < 10) and
free-molecule flow (Kn > 10).
However, for the flow regimes considered in this course , K n is always less than 0.01
and it is usual to say that the fluid is a continuum.
Other factor which checks the validity of continuum is the elapsed time between
collisions. The time should be small enough so that the random statistical description of
molecular activity holds good.
In continuum approach, fluid properties such as density, viscosity, thermal
conductivity, temperature, etc. can be expressed as continuous functions of space
and time.
2.2 Inviscid and Viscous Flows:
Refer to Section 1.3
2.3 Incompressible and Compressible Flows:
Distinction between an Incompressible and a Compressible Flow
In order to know, if it is necessary to take into account the compressibility of gases in
fluid flow problems, we need to consider whether the change in pressure brought about
by the fluid motion causes large change in volume or density.
Using Bernoulli's equation
p + (1/2)ρV2= constant (V being the velocity of flow), change in pressure, Δp, in a flow

field, is of the order of (1/2)ρV2
(dynamic head).
Invoking this relationship into
we get ,
(2.12)
So if Δρ/ρ is very small, the flow of gases can be treated as incompressible with a good
degree of approximation.
According to Laplace's equation, the velocity of sound is given by
Hence
where, Ma is the ratio of the velocity of flow to the acoustic velocity in the flowing medium at the condition and is known as Mach number. So we can conclude that the compressibility of gas in a flow can be neglected if Δρ/ρ is considerably smaller than
unity, i.e. (1/2)Ma2<<1.
In other words, if the flow velocity is small as compared to the local acoustic velocity,
compressibility of gases can be neglected. Considering a maximum relative change in
density of 5 per cent as the criterion of an incompressible flow, the upper limit of
Mach number becomes approximately 0.33. In the case of air at standard pressure and
temperature, the acoustic velocity is about 335.28 m/s. Hence a Mach number of 0.33
corresponds to a velocity of about 110 m/s. Therefore flow of air up to a velocity of 110
m/s under standard condition can be considered as incompressible flow.

2.4 Newtonian and Non- Newtonian Flow:
Ideal Fluid
Consider a hypothetical fluid having a zero viscosity ( μ = 0). Such a fluid is called an
ideal fluid and the resulting motion is called as ideal or inviscid flow. In an ideal flow,
there is no existence of shear force because of vanishing viscosity.
All the fluids in reality have viscosity (μ > 0) and hence they are termed as real fluid
and their motion is known as viscous flow.
Under certain situations of very high velocity flow of viscous fluids, an accurate analysis
of flow field away from a solid surface can be made from the ideal flow theory.
Non-Newtonian Fluids
There are certain fluids where the linear relationship between the shear stress and the
deformation rate (velocity gradient in parallel flow) as expressed by the is
not valid. For these fluids the viscosity varies with rate of deformation.
Due to the deviation from Newton's law of viscosity they are commonly termed as non-
Newtonian fluids. Figure 2.1 shows the class of fluid for which this relationship is
nonlinear.

Figure 2.1 Shear stress and deformation rate relationship of different fluids
The abscissa in Fig. 2.1 represents the behaviour of ideal fluids since for the ideal fluids
the resistance to shearing deformation rate is always zero, and hence they exhibit zero
shear stress under any condition of flow.
The ordinate represents the ideal solid for there is no deformation rate under any loading
condition.
The Newtonian fluids behave according to the law that shear stress is linearly
proportional to velocity gradient or rate of shear strain . Thus for these fluids,
the plot of shear stress against velocity gradient is a straight line through the origin. The
slope of the line determines the viscosity.
The non-Newtonian fluids are further classified as pseudo-plastic, dilatant and Bingham
plastic.

2.5 Aerodynamic Force and Moments:
A fluid motion, under all such forces is characterised by
1. Hydrodynamic parameters like pressure, velocity and acceleration due to gravity,
2. Rheological and other physical properties of the fluid involved, and
3. Geometrical dimensions of the system.
It is important to express the magnitudes of different forces in terms of these parameters, to
know the extent of their influences on the different forces acting on a flluid element in the course
of its flow.
Inertia Force
The inertia force acting on a fluid element is equal in magnitude to the mass of the
element multiplied by its acceleration.
The mass of a fluid element is proportional to ρl3
where, ρ is the density of fluid and l is
the characteristic geometrical dimension of the system. The acceleration of a fluid element in any direction is the rate at which its velocity in that
direction changes with time and is therefore proportional in magnitude to some characteristic velocity V divided by some specified interval of time t. The time interval t is proportional to the characteristic length l divided by the characteristic velocity V, so
that the acceleration becomes proportional to V2/l.
The magnitude of inertia force is thus proportional to
This can be written as,
(18.1a)
Viscous Force
The viscous force arises from shear stress in a flow of fluid.
Therefore, we can write
Magnitude of viscous force = shear stress X surface area over which the shear stress acts

Again, shear stress = µ (viscosity) X rate of shear strain
where, rate of shear strain velocity gradient and surface area
Hence
Pressure Force
(18.1b)
The pressure force arises due to the difference of pressure in a flow field.
Hence it can be written as
(where, Dp is some characteristic pressure difference in the flow.)
Gravity Force
(18.1c)
The gravity force on a fluid element is its weight. Hence,
(18.1d)
(where g is the acceleration due to gravity or weight per unit mass)
Capillary or Surface Tension Force
The capillary force arises due to the existence of an interface between two fluids.
The surface tension force acts tangential to a surface .
It is equal to the coefficient of surface tension σ multiplied by the length of a linear
element on the surface perpendicular to which the force acts.
Therefore,
(18.1e)

Compressibility or Elastic Force
Elastic force arises due to the compressibility of the fluid in course of its flow.
For a given compression (a decrease in volume), the increase in pressure is proportional
to the bulk modulus of elasticity E
This gives rise to a force known as the elastic force.
Hence, for a given compression
(18.1f)
The flow of a fluid in practice does not involve all the forces simultaneously.
Therefore, the pertinent dimensionless parameters for dynamic similarity are derived from the
ratios of significant forces causing the flow.
2.6 Dimensional Analysis:
Principles of Physical Similarity - An Introduction
Laboratory tests are usually carried out under altered conditions of the operating variables from
the actual ones in practice. These variables, in case of experiments relating to fluid flow, are
pressure, velocity, geometry of the working systems and the physical properties of the working
fluid.
The pertinent questions arising out of this situation are:
Answer of the above two questions lies in the principle of physical similarity. This principle is
useful for the following cases:
1. How to apply the test results from laboratory experiments to the
actual problems?
2. Is it possible, to reduce the large number of experiments to a
lesser one in achieving the same objective?

Concept and Types of Physical Similarity
The primary and fundamental requirement for the physical similarity between two problems is
that the physics of the problems must be the same.
For an example, two flows: one governed by viscous and pressure forces while the other by
gravity force cannot be made physically similar. Therefore, the laws of similarity have to be
sought between problems described by the same physics.
Definition of physical similarity as a general proposition
Two systems, described by the same physics, operating under different sets of conditions are said
to be physically similar in respect of certain specified physical quantities; when the ratio of
corresponding magnitudes of these quantities between the two systems is the same everywhere.
In the field of mechanics, there are three types of similarities which constitute the complete
similarity between problems of same kind.
Geometric Similarity : If the specified physical quantities are geometrical dimensions, the
similarity is called Geometric Similarty,
Kinematic Similarity : If the quantities are related to motions, the similarity is called Kinematic
Similarity
1. To apply the results taken from tests under one set of
conditions to another set of conditions
and
2. To predict the influences of a large number of independent
operating variables on the performance of a system from an
experiment with a limited number of operating variables.

Dynamic Similarity: If the quantities refer to forces, then the similarity is termed as Dynamic
Similarity.
Geometric Similarity
Geometric Similarity implies the similarity of shape such that, the ratio of any length in
one system to the corresponding length in other system is the same everywhere.
This ratio is usually known as scale factor.
Therefore, geometrically similar objects are similar in their shapes, i.e., proportionate in their
physical dimensions, but differ in size.
In investigations of physical similarity,
· the full size or actual scale systems are known as prototypes
· the laboratory scale systems are referred to as models
· use of the same fluid with both the prototype and the model is not necessary
· model need not be necessarily smaller than the prototype. The flow of fluid
through an injection nozzle or a carburettor , for example, would be more easily
studied by using a model much larger than the prototype.
· the model and prototype may be of identical size, although the two may then
differ in regard to other factors such as velocity, and properties of the fluid.
If l1 and l2 are the two characteristic physical dimensions of any object, then the requirement of
geometrical similarity is
(model ratio)
(The second suffices m and p refer to model and prototype respectively) where lr is the scale
factor or sometimes known as the model ratio. Figure 5.1 shows three pairs of geometrically similar objects, namely, a right circular cylinder, a parallelopiped, and a triangular prism.

Fig 17.1 Geometrically Similar Objects (In all the above cases model ratio is ½)
Geometric similarity is perhaps the most obvious requirement in a model system designed to
correspond to a given prototype system.
A perfect geometric similarity is not always easy to attain. Problems in achieving perfect
geometric similarity are:
· For a small model, the surface roughness might not be reduced according to the scale
factor (unless the model surfaces can be made very much smoother than those of the
prototype). If for any reason the scale factor is not the same throughout, a distorted
model results.
· Sometimes it may so happen that to have a perfect geometric similarity within the
available laboratory space, physics of the problem changes. For example, in case of large
prototypes, such as rivers, the size of the model is limited by the available floor space of
the laboratory; but if a very low scale factor is used in reducing both the horizontal and
vertical lengths, this may result in a stream so shallow that surface tension has a
considerable effect and, moreover, the flow may be laminar instead of turbulent. In this
situation, a distorted model may be unavoidable (a lower scale factor”for horizontal
lengths while a relatively higher scale factor for vertical lengths. The extent to which

perfect geometric similarity should be sought therefore depends on the problem being
investigated, and the accuracy required from the solution.
Kinematic Similarity
Kinematic similarity refers to similarity of motion.
Since motions are described by distance and time, it implies similarity of lengths (i.e.,
geometrical similarity) and, in addition, similarity of time intervals.
If the corresponding lengths in the two systems are in a fixed ratio, the velocities of
corresponding particles must be in a fixed ratio of magnitude of corresponding time intervals.
If the ratio of corresponding lengths, known as the scale factor, is lr and the ratio of corresponding time intervals is tr, then the magnitudes of corresponding velocities are in the
ratio lr/tr and the magnitudes of corresponding accelerations are in the ratio lr/t2
r.
A well-known example of kinematic similarity is found in a planetarium. Here the galaxies of
stars and planets in space are reproduced in accordance with a certain length scale and in
simulating the motions of the planets, a fixed ratio of time intervals (and hence velocities and
accelerations) is used.
When fluid motions are kinematically similar, the patterns formed by streamlines are
geometrically similar at corresponding times.
Since the impermeable boundaries also represent streamlines, kinematically similar flows are
possible only past geometrically similar boundaries.
Therefore, geometric similarity is a necessary condition for the kinematic similarity to be
achieved, but not the sufficient one.
For example, geometrically similar boundaries may ensure geometrically similar streamlines in
the near vicinity of the boundary but not at a distance from the boundary.
Dynamic Similarity
Dynamic similarity is the similarity of forces .
In dynamically similar systems, the magnitudes of forces at correspondingly similar points in
each system are in a fixed ratio.
In a system involving flow of fluid, different forces due to different causes may act on a fluid
element. These forces are as follows:

Viscous Force (due to viscosity)
Pressure Force ( due to different in pressure)
Gravity Force (due to gravitational attraction)
Capillary Force (due to surface tension)
Compressibility Force ( due to elasticity)
According to Newton 's law, the resultant FR of all these forces, will cause the acceleration of a
fluid element. Hence
(17.1)
Moreover, the inertia force is defined as equal and opposite to the resultant accelerating
force
= -
Therefore Eq. 17.1 can be expressed as
For dynamic similarity, the magnitude ratios of these forces have to be same for both the
prototype and the model. The inertia force is usually taken as the common one to describe
the ratios as (or putting in other form we equate the the non dimensionalised forces in the two
systems)

2.7 Non Dimensional Parameters:
The criterion of dynamic similarity for the flows controlled by viscous, pressure and inertia
forces are derived from the ratios of the representative magnitudes of these forces with the help
of Eq. (18.1a) to (18.1c) as follows:
(18.2a)
|
(18.2b)
The term is known as Reynolds number, Re after the name of the scientist who first
developed it and is thus proportional to the magnitude ratio of inertia force to viscous force
.(Reynolds number plays a vital role in the analysis of fluid flow)
The term is known as Euler number, Eu after the name of the scientist who first
derived it. The dimensionless terms Re and Eu represent the critieria of dynamic similarity for
the flows which are affected only by viscous, pressure and inertia forces. Such instances, for
example, are
1. the full flow of fluid in a completely closed conduit,
2. flow of air past a low-speed aircraft and
3. the flow of water past a submarine deeply submerged to produce no waves on the surface.
Hence, for a complete dynamic similarity to exist between the prototype and the model for this
class of flows, the Reynolds number, Re and Euler number, Eu have to be same for the two
(prototype and model). Thus
(18.2c)
(18.2d)
where, the suffix p and suffix m refer to the parameters for prototype and model respectively.
In practice, the pressure drop is the dependent variable, and hence it is compared for the two
systems with the help of Eq. (18.2d), while the equality of Reynolds number (Eq. (18.2c)) along
with the equalities of other parameters in relation to kinematic and geometric similarities are
maintained.
The characteristic geometrical dimension l and the reference velocity V in the expression
of the Reynolds number may be any geometrical dimension and any velocity which
are significant in determining the pattern of flow.

For internal flows through a closed duct, the hydraulic diameter of the duct Dh and the
average flow velocity at a section are invariably used for l and V respectively. The hydraulic diameter Dh is defined as Dh= 4A/P where A and P are the cross-sectional
area and wetted perimeter respectively.
A flow of the type in which significant forces are gravity force, pressure force and inertia
force, is found when a free surface is present.
Examples can be
1. the flow of a liquid in an open channel.
2. the wave motion caused by the passage of a ship through water.
3. the flows over weirs and spillways.
The condition for dynamic similarity of such flows requires
the equality of the Euler number Eu (the magnitude ratio of pressure to inertia force), and
the equality of the magnitude ratio of gravity to inertia force at corresponding points in
the systems being compared.
Thus ,
(18.2e)
In practice, it is often convenient to use the square root of this ratio so to deal with the
first power of the velocity.
From a physical point of view, equality of implies equality of as regard
to the concept of dynamic similarity.
The reciprocal of the term is known as Froude number ( after William Froude who
first suggested the use of this number in the study of naval architecture. )
Hence Froude number, .
Therefore, the primary requirement for dynamic similarity between the prototype and the
model involving flow of fluid with gravity as the significant force, is the equality of Froude
number, Fr, i.e.,
(18.2f)

Surface tension forces are important in certain classes of practical problems such as ,
1. flows in which capillary waves appear
2. flows of small jets and thin sheets of liquid injected by a nozzle in air
3. flow of a thin sheet of liquid over a solid surface.
Here the significant parameter for dynamic similarity is the magnitude ratio of the surface
tension force to the inertia force.
This can be written as
The term is usually known as Weber number, Wb (after the German naval architect
Moritz Weber who first suggested the use of this term as a relevant parameter.)
Thus for dynamically similar flows (Wb)m =(Wb)p
i.e.,
When the compressibility of fluid in the course of its flow becomes significant, the elastic force
along with the pressure and inertia forces has to be considered.
Therefore, the magnitude ratio of inertia to elastic force becomes a relevant parameter for
dynamic similarity under this situation.
Thus we can write,
(18.2h)
The parameter is known as Cauchy number, (after the French mathematician A.L.
Cauchy)
If we consider the flow to be isentropic, then it can be written
(18.2i)
(where Es is the isentropic bulk modulus of elasticity)

Reynolds
number Re
Thus for dynamically similar flows (cauchy)m=(cauchy)p
ie.,
The velocity with which a sound wave propagates through a fluid medium equals to
.
Hence, the term can be written as where a is the acoustic velocity in the
fluid medium.
The ratio V/a is known as Mach number, Ma (after an Austrian physicist Earnst Mach)
It has been shown in Chapter 1 that the effects of compressibility become important when the
Mach number exceeds 0.33.
The situation arises in the flow of air past high-speed aircraft, missiles, propellers and rotory
compressors. In these cases equality of Mach number is a condition for dynamic similarity.
Therefore,
(Ma)p=(Ma)m
i.e.
(18.2j)
Ratios of Forces for Different Situations of Flow
Pertinent Dimensionless term as the
croterion of dynamic similarity in
different situations of fluid flow
Representative
magnitude ration of the
forces
Name Recommended
symbol
Euler number Eu
Froude number Fr

Weber number Wb
Mach number Ma

Chapter 3
Fluid Statics
3.1 Pascal’s Law:
Pascal's Law of Hydrostatics
Pascal's Law
The normal stresses at any point in a fluid element at rest are directed towards the point from all
directions and they are of the equal magnitude.
Fig 3.2 State of normal stress at a point in a fluid body at rest
Derivation:
The inclined plane area is related to the fluid elements (refer to Fig 3.1) as follows
(3.4)
(3.5)
(3.6)
Substituting above values in equation 3.1- 3.3 we get
(3.7)

Conclusion:
The state of normal stress at any point in a fluid element at rest is same and directed towards the
point from all directions. These stresses are denoted by a scalar quantity p defined as the
hydrostatic or thermodynamic pressure.
Using "+" sign for the tensile stress the above equation can be written in terms of pressure as
(3.8)
3.2 Types of Forces on Fluid Systems:
Forces on Fluid Elements
Fluid Elements - Definition:
Fluid element can be defined as an infinitesimal region of the fluid continuum in isolation from
its surroundings.
Two types of forces exist on fluid elements
Body Force: distributed over the entire mass or volume of the element. It is usually expressed per
unit mass of the element or medium upon which the forces act.
Example: Gravitational Force, Electromagnetic force fields etc.
Surface Force: Forces exerted on the fluid element by its surroundings through direct contact at
the surface.
Surface force has two components:
Normal Force: along the normal to the area
Shear Force: along the plane of the area.
The ratios of these forces and the elemental area in the limit of the area tending to zero are called
the normal and shear stresses respectively.
The shear force is zero for any fluid element at rest and hence the only surface force on a fluid
element is the normal component.
Normal Stress in a Stationary Fluid
Consider a stationary fluid element of tetrahedral shape with three of its faces coinciding with
the coordinate planes x, y and z.

Fig 3.1 State of Stress in a Fluid Element at Rest
Since a fluid element at rest can develop neither shear stress nor tensile stress, the normal
stresses acting on different faces are compressive in nature.
Suppose, ΣFx, ΣFy and ΣFz are the net forces acting on the fluid element in positive x,y and z
directions respectively. The direction cosines of the normal to the inclined plane of an area
ΔA are cos α, cos β and cos .Considering gravity as the only source of external body force,
acting in the -ve z direction, the equations of static equlibrium for the tetrahedronal fluid element
can be written as
(3.1)
(3.2)
(3.3)

where = Volume of tetrahedral fluid element
3.3 Measurement of Pressure:
Pascal (N/m2) is the unit of pressure .
Pressure is usually expressed with reference to either absolute zero pressure (a complete vacuum)or local
atmospheric pressure.
The absolute pressure: It is the difference between the value of the pressure and the absolute zero
pressure.
Gauge pressure: It is the diference between the value of the pressure and the local atmospheric
pressure(patm)
Vacuum Pressure: If p<patm then the gauge pressure becomes negative and is called the
vacuum pressure.But one should always remember that hydrostatic pressure is always compressive in nature
Fig 4.1 The Scale of Pressure
At sea-level, the international standard atmosphere has been chosen as Patm = 101.32 kN/m2

Piezometer Tube
The direct proportional relation between gauge pressure and the height h for a fluid of constant
density enables the pressure to be simply visualized in terms of the vertical height, .
The height h is termed as pressure head corresponding to pressure p. For a liquid without a free
surface in a closed pipe, the pressure head at a point corresponds to the vertical height
above the point to which a free surface would rise, if a small tube of sufficient length and open to
atmosphere is connected to the pipe
Fig 4.2 A piezometer Tube
Such a tube is called a piezometer tube, and the height h is the measure of the gauge pressure of
the fluid in the pipe. If such a piezometer tube of sufficient length were closed at the top and the
space above the liquid surface were a perfect vacuum, the height of the column would then
correspond to the absolute pressure of the liquid at the base. This principle is used in the well
known mercury barometer to determine the local atmospheric pressure.

3.4 Manometers and Gauges:
The Barometer
Barometer is used to determine the local atmospheric pressure. Mercury is employed in the
barometer because its density is sufficiently high for a relative short column to be obtained. and
also because it has very small vapour pressure at normal temperature. High density scales down
the pressure head(h) to repesent same magnitude of pressure in a tube of smaller height.
Fig 4.3 A Simple Barometer
Even if the air is completely absent, a perfect vacuum at the top of the tube is never possible. The
space would be occupied by the mercury vapour and the pressure would equal to the vapour
pressure of mercury at its existing temperature. This almost vacuum condition above the mercury
in the barometer is known as Torricellian vacuum.
The pressure at A equal to that at B (Fig. 4.3) which is the atmospheric pressure patm since A and
B lie on the same horizontal plane. Therefore, we can write
(4.1)
The vapour pressure of mercury pv, can normally be neglected in comparison to patm.
At 200C,Pv is only 0.16 patm, where patm =1.0132 X10
5 Pa at sea level. Then we get from Eq.
(4.1)

For accuracy, small corrections are necessary to allow for the variation of r with temperature, the
thermal expansion of the scale (usually made of brass). and surface tension effects. If water was
used instead of mercury, the corresponding height of the column would be about 10.4 m
provided that a perfect vacuum could be achieved above the water. However, the vapour pressure
of water at ordinary temperature is appreciable and so the actual height at, say, 15°C would be
about 180 mm less than this value. Moreover with a tube smaller in diameter than about 15 mm,
surface tension effects become significant.
Manometers for measuring Gauge and Vacuum Pressure
Manometers are devices in which columns of a suitable liquid are used to measure the difference
in pressure between two points or between a certain point and the atmosphere.
Manometer is needed for measuring large gauge pressures. It is basically the modified form of
the piezometric tube. A common type manometer is like a transparent "U-tube" as shown in Fig.
4.4.
Fig 4.4 A simple manometer to measure gauge
pressure
Fig 4.5 A simple manometer to measure vacuum
pressure
One of the ends is connected to a pipe or a container having a fluid (A) whose pressure is to be
measured while the other end is open to atmosphere. The lower part of the U-tube contains a
liquid immiscible with the fluid A and is of greater density than that of A. This fluid is called the
manometric fluid.
The pressures at two points P and Q (Fig. 4.4) in a horizontal plane within the continuous
expanse of same fluid (the liquid B in this case) must be equal. Then equating the pressures at P

and Q in terms of the heights of the fluids above those points, with the aid of the fundamental
equation of hydrostatics (Eq 3.16), we have
Hence,
where p1 is the absolute pressure of the fluid A in the pipe or container at its centre line, and patm
is the local atmospheric pressure. When the pressure of the fluid in the container is lower than
the atmospheric pressure, the liquid levels in the manometer would be adjusted as shown in Fig.
4.5. Hence it becomes,
(4.2)
Manometers to measure Pressure Difference
A manometer is also frequently used to measure the pressure difference, in course of flow, across
a restriction in a horizontal pipe.
Fig 4.6 Manometer measuring pressure difference

The axis of each connecting tube at A and B should be perpendicular to the direction of flow and
also for the edges of the connections to be smooth. Applying the principle of hydrostatics at P
and Q we have,
(4.3)
where, ρ m is the density of manometric fluid and ρw is the density of the working fluid flowing
through the pipe.
We can express the difference of pressure in terms of the difference of heads (height of the
working fluid at equilibrium).
(4.4)
Inclined Tube Manometer
For accurate measurement of small pressure differences by an ordinary u-tube manometer, it is
essential that the ratio rm/rw should be close to unity. This is not possible if the working fluid is a
gas; also having a manometric liquid of density very close to that of the working liquid and giving at the same time a well defined meniscus at the interface is not always possible. For this purpose, an inclined tube manometer is used.
If the transparent tube of a manometer, instead of being vertical, is set at an angle θ to the
horizontal (Fig. 4.7), then a pressure difference corresponding to a vertical difference of levels x
gives a movement of the meniscus s = x/sinq along the slope.
Fig 4.7 An Inclined Tube Manometer

If θ is small, a considerable mangnification of the movement of the meniscus may be
achieved.
Angles less than 50
are not usually satisfactory, because it becomes difficult to determine
the exact position of the meniscus.
One limb is usually made very much greater in cross-section than the other. When a
pressure difference is applied across the manometer, the movement of the liquid surface
in the wider limb is practically negligible compared to that occurring in the narrower
limb. If the level of the surface in the wider limb is assumed constant, the displacement of
the meniscus in the narrower limb needs only to be measured, and therefore only this
limb is required to be transparent.
Inverted Tube Manometer
For the measurement of small pressure differences in liquids, an inverted U-tube manometer is
used.
Fig 4.8 An Inverted Tube Manometer
Here and the line PQ is taken at the level of the higher meniscus to equate the
pressures at P and Q from the principle of hydrostatics. It may be written that
where represents the piezometric pressure, (z being the vertical height of the point concerned from any reference datum). In case of a horizontal pipe (z1= z2) the difference in
piezometric pressure becomes equal to the difference in the static pressure. If is

sufficiently small, a large value of x may be obtained for a small value of . Air is used
as the manometric fluid. Therefore, is negligible compared with and hence,
(4.5)
Air may be pumped through a valve V at the top of the manometer until the liquid menisci are at
a suitable level.
Micromanometer
When an additional gauge liquid is used in a U-tube manometer, a large difference in meniscus
levels may be obtained for a very small pressure difference.
Fig 4.9 A Micromanometer
The equation of hydrostatic equilibrium at PQ can be written as

where and are the densities of working fluid, gauge liquid and manometric liquid
respectively.
From continuity of gauge liquid,
(4.6)
(4.7)
If a is very small compared to A
(4.8)
With a suitable choice for the manometric and gauge liquids so that their densities are close
a reasonable value of y may be achieved for a small pressure difference.
3.5 Hydraulic Devices: Under Development
3.6 Forces on Partially and Fully Submerged Bodies (Curved Surfces):
Hydrostatic Thrusts on Submerged Plane Surface
Due to the existence of hydrostatic pressure in a fluid mass, a normal force is exerted on any part
of a solid surface which is in contact with a fluid. The individual forces distributed over an area
give rise to a resultant force.
Plane Surfaces
Consider a plane surface of arbitrary shape wholly submerged in a liquid so that the plane of the
surface makes an angle θ with the free surface of the liquid. We will assume the case where the
surface shown in the figure below is subjected to hydrostatic pressure on one side and
atmospheric pressure on the other side.

Fig 5.1 Hydrostatic Thrust on Submerged Inclined Plane Surface
Let p denotes the gauge pressure on an elemental area dA. The resultant force F on the area A is
therefore
According to Eq (3.16a) Eq (5.1) reduces to
(5.1)
(5.2)
Where h is the vertical depth of the elemental area dA from the free surface and the distance
y is measured from the x-axis, the line of intersection between the extension of the inclined plane
and the free surface (Fig. 5.1). The ordinate of the centre of area of the plane surface A is defined
as
(5.3)
Hence from Eqs (5.2) and (5.3), we get
(5.4)

where is the vertical depth (from free surface) of centre c of area .
Equation (5.4) implies that the hydrostatic thrust on an inclined plane is equal to the pressure at
its centroid times the total area of the surface, i.e., the force that would have been experienced by
the surface if placed horizontally at a depth hc from the free surface (Fig. 5.2).
Fig 5.2 Hydrostatic Thrust on Submerged Horizontal Plane Surface
The point of action of the resultant force on the plane surface is called the centre of pressure .
Let and be the distances of the centre of pressure from the y and x axes respectively.
Equating the moment of the resultant force about the x axis to the summation of the moments of
the component forces, we have
(5.5)
Solving for yp from Eq. (5.5) and replacing F from Eq. (5.2), we can write
(5.6)
In the same manner, the x coordinate of the centre of pressure can be obtained by taking moment
about the y-axis. Therefore,

From which,
(5.7)
The two double integrals in the numerators of Eqs (5.6) and (5.7) are the moment of inertia about
the x-axis Ixxand the product of inertia Ixy about x and y axis of the plane area respectively. By
applying the theorem of parallel axis
(5.8)
(5.9)
where, and are the moment of inertia and the product of inertia of the surface about
the centroidal axes , and are the coordinates of the center c of the area with respect
to x-y axes.
With the help of Eqs (5.8), (5.9) and (5.3), Eqs (5.6) and (5.7) can be written as
(5.10a)
(5.10b)
The first term on the right hand side of the Eq. (5.10a) is always positive. Hence, the centre of
pressure is always at a higher depth from the free surface than that at which the centre of area
lies. This is obvious because of the typical variation of hydrostatic pressure with the depth from
the free surface. When the plane area is symmetrical about the y' axis, , and .
Hydrostatic Thrusts on Submerged Curved Surfaces
On a curved surface, the direction of the normal changes from point to point, and hence the
pressure forces on individual elemental surfaces differ in their directions. Therefore, a scalar
summation of them cannot be made. Instead, the resultant thrusts in certain directions are to be
determined and these forces may then be combined vectorially. An arbitrary submerged curved
surface is shown in Fig. 5.3. A rectangular Cartesian coordinate system is introduced whose xy

plane coincides with the free surface of the liquid and z-axis is directed downward below the x -
y plane.
Fig 5.3 Hydrostatic thrust on a Submerged Curved Surface
Consider an elemental area dA at a depth z from the surface of the liquid. The hydrostatic force
on the elemental area dA is
(5.11)
and the force acts in a direction normal to the area dA. The components of the force dF in x, y
and z directions are
(5.12a)
(5.12b)
(5.13c)
Where l, m and n are the direction cosines of the normal to dA. The components of the surface
element dA projected on yz, xz and xy planes are, respectively

Substituting Eqs (5.13a-5.13c) into (5.12) we can write
(5.13a)
(5.13b)
(5.13c)
(5.14a)
(5.14b)
(5.14c)
Therefore, the components of the total hydrostatic force along the coordinate axes are
(5.15a)
(5.15b)
(5.15c)
where zc is the z coordinate of the centroid of area Ax and Ay (the projected areas of curved
surface on yz and xz plane respectively). If zp and yp are taken to be the coordinates of the point
of action of Fx on the projected area Ax on yz plane, , we can write
(5.16a)
(5.16b)
where Iyy is the moment of inertia of area Ax about y-axis and Iyz is the product of inertia of Ax
with respect to axes y and z. In the similar fashion, zp' and x p
' the coordinates of the point of
action of the force Fy on area Ay, can be written as

(5.17a)
(5.17b)
where Ixx is the moment of inertia of area Ay about x axis and Ixz is the product of inertia of Ay
about the axes x and z.
We can conclude from Eqs (5.15), (5.16) and (5.17) that for a curved surface, the component of
hydrostatic force in a horizontal direction is equal to the hydrostatic force on the projected plane
surface perpendicular to that direction and acts through the centre of pressure of the projected
area. From Eq. (5.15c), the vertical component of the hydrostatic force on the curved surface can
be written as
(5.18)
where is the volume of the body of liquid within the region extending vertically above the
submerged surface to the free surfgace of the liquid. Therefore, the vertical component of
hydrostatic force on a submerged curved surface is equal to the weight of the liquid volume
vertically above the solid surface of the liquid and acts through the center of gravity of the liquid
in that volume.
3.7 Bouyancy:
Buoyancy
When a body is either wholly or partially immersed in a fluid, a lift is generated due to
the net vertical component of hydrostatic pressure forces experienced by the body.
This lift is called the buoyant force and the phenomenon is called buoyancy Consider a solid body of arbitrary shape completely submerged in a homogeneous liquid as
shown in Fig. 5.4. Hydrostatic pressure forces act on the entire surface of the body.

Fig 5.4 Buoyant Force on a Submerged Body

To calculate the vertical component of the resultant hydrostatic force, the body is considered to
be divided into a number of elementary vertical prisms. The vertical forces acting on the two
ends of such a prism of cross-section dAz (Fig. 5.4) are respectively
(5.19a)
(5.19b)
Therefore, the buoyant force (the net vertically upward force) acting on the elemental prism of
volume is -
Hence the buoyant force FB on the entire submerged body is obtained as
(5.19c)
(5.20)
Where is the total volume of the submerged body. The line of action of the force FB can be
found by taking moment of the force with respect to z-axis. Thus
(5.21)
Substituting for dFB and FB from Eqs (5.19c) and (5.20) respectively into Eq. (5.21), the x
coordinate of the center of the buoyancy is obtained as
(5.22)
which is the centroid of the displaced volume. It is found from Eq. (5.20) that the buoyant
force FB equals to the weight of liquid displaced by the submerged body of volume . This
phenomenon was discovered by Archimedes and is known as the Archimedes principle.
ARCHIMEDES PRINCIPLE
The buoyant force on a submerged body
The Archimedes principle states that the buoyant force on a submerged body is equal to
the weight of liquid displaced by the body, and acts vertically upward through the
centroid of the displaced volume.
Thus the net weight of the submerged body, (the net vertical downward force experienced
by it) is reduced from its actual weight by an amount that equals the buoyant force.
The buoyant force on a partially immersed body

According to Archimedes principle, the buoyant force of a partially immersed body is
equal to the weight of the displaced liquid.
Therefore the buoyant force depends upon the density of the fluid and the submerged
volume of the body.
For a floating body in static equilibrium and in the absence of any other external force,
the buoyant force must balance the weight of the body
3.8 Stability of Floating Bodies:
Stability of Unconstrained Submerged Bodies in Fluid
The equilibrium of a body submerged in a liquid requires that the weight of the body
acting through its centre of gravity should be colinear with equal hydrostatic lift acting
through the centre of buoyancy.
In general, if the body is not homogeneous in its distribution of mass over the entire
volume, the location of centre of gravity G does not coincide with the centre of
volume, i.e., the centre of buoyancy B.
Depending upon the relative locations of G and B, a floating or submerged body attains
three different states of equilibrium-
Let us suppose that a body is given a small angular displacement and then released. Then it will
be said to be in
Stable Equilibrium: If the body returns to its original position by retaining the
originally vertical axis as vertical.
Unstable Equilibrium: If the body does not return to its original position but moves
further from it.
Neutral Equilibrium: If the body neither returns to its original position nor increases
its displacement further, it will simply adopt its new position.
Stable Equilibrium
Consider a submerged body in equilibrium whose centre of gravity is located below the centre of
buoyancy (Fig. 5.5a). If the body is tilted slightly in any direction, the buoyant force and the
weight always produce a restoring couple trying to return the body to its original position (Fig.
5.5b, 5.5c).

Fig 5.5 A Submerged body in Stable Equilibrium
Unstable Equilibrium
On the other hand, if point G is above point B (Fig. 5.6a), any disturbance from the equilibrium
position will create a destroying couple which will turn the body away from its original position
(5.6b, 5.6c).
Fig 5.6 A Submerged body in Unstable Equilibrium
Neutral Equilibrium
When the centre of gravity G and centre of buoyancy B coincides, the body will always assume
the same position in which it is placed (Fig 5.7) and hence it is in neutral equilibrium.

Fig 5.7 A Submerged body in Neutral Equilibrium
Therefore, it can be concluded that a submerged body will be in stable, unstable or neutral
equilibrium if its centre of gravity is below, above or coincident with the center of
buoyancy respectively (Fig. 5.8).
Fig 5.8 States of Equilibrium of a Submerged Body
(a) STABLE EQUILIBRIUM (B) UNSTABLE EQUILIBRIUM (C) NEUTRAL
EQUILIBRIUM
Stability of Floating Bodies in Fluid
When the body undergoes an angular displacement about a horizontal axis, the shape of
the immersed volume changes and so the centre of buoyancy moves relative to the body.

As a result of above observation stable equlibrium can be achieved, under certain
condition, even when G is above B.
Figure 5.9a illustrates a floating body -a boat, for example, in its equilibrium position.
Fig 5.9 A Floating body in Stable equilibrium
Important points to note here are
a. The force of buoyancy FB is equal to the weight of the body W
b. Centre of gravity G is above the centre of buoyancy in the same vertical line.
c. Figure 5.9b shows the situation after the body has undergone a small angular
displacement with respect to the vertical axis.
d. The centre of gravity G remains unchanged relative to the body (This is not always true
for ships where some of the cargo may shift during an angular displacement).
e. During the movement, the volume immersed on the right hand side increases while that
on the left hand side decreases. Therefore the centre of buoyancy moves towards the right
to its new position B'.
Let the new line of action of the buoyant force (which is always vertical) through B' intersects
the axis BG (the old vertical line containing the centre of gravity G and the old centre of
buoyancy B) at M. For small values of the point M is practically constant in position and is
known as metacentre. For the body shown in Fig. 5.9, M is above G, and the couple acting on
the body in its displaced position is a restoring couple which tends to turn the body to its original
position. If M were below G, the couple would be an overturning couple and the original
equilibrium would have been unstable. When M coincides with G, the body will assume its new
position without any further movement and thus will be in neutral equilibrium. Therefore, for a
floating body, the stability is determined not simply by the relative position of B and G,
rather by the relative position of M and G. The distance of metacentre above G along the line
BG is known as metacentric height GM which can be written as
GM = BM -BG

Hence the condition of stable equilibrium for a floating body can be expressed in terms of
metacentric height as follows:
GM > 0 (M is above G) Stable equilibrium
GM = 0 (M coinciding with G) Neutral equilibrium
GM < 0 (M is below G) Unstable equilibrium
The angular displacement of a boat or ship about its longitudinal axis is known as 'rolling' while
that about its transverse axis is known as "pitching".
Floating Bodies Containing Liquid
If a floating body carrying liquid with a free surface undergoes an angular displacement, the
liquid will also move to keep its free surface horizontal. Thus not only does the centre of
buoyancy B move, but also the centre of gravity G of the floating body and its contents move in
the same direction as the movement of B. Hence the stability of the body is reduced. For this
reason, liquid which has to be carried in a ship is put into a number of separate compartments so
as to minimize its movement within the ship.
Period of Oscillation
The restoring couple caused by the buoyant force and gravity force acting on a floating body
displaced from its equilibrium placed from its equilibrium position is (Fig. 5.9 ).
Since the torque equals to mass moment of inertia (i.e., second moment of mass) multiplied by
angular acceleration, it can be written
(5.23)
Where IM represents the mass moment of inertia of the body about its axis of rotation. The minus
sign in the RHS of Eq. (5.23) arises since the torque is a retarding one and decreases the angular acceleration. If θ is small, sin θ=θ and hence Eq. (5.23) can be written as
(5.24)
Equation (5.24) represents a simple harmonic motion. The time period (i.e., the time of a
complete oscillation from one side to the other and back again) equals to .
The oscillation of the body results in a flow of the liquid around it and this flow has been
disregarded here. In practice, of course, viscosity in the liquid introduces a damping action which

quickly suppresses the oscillation unless further disturbances such as waves cause new angular
displacements.
3.9 Centre of Gravity and Metacentric Height:
Refer to Section 3.8

Chapter 4
Description of Fluid Motion
4.1 Lagrangian and Eulerian Methods:
Introduction
Kinematics is the geometry of Motion.
Kinematics of fluid describes the fluid motion and its consequences without consideration of the
nature of forces causing the motion.
The subject has three main aspects:
Description of Fluid Motion
A. Lagrangian Method
Using Lagrangian method, the fluid motion is described by tracing the kinematic
behaviour of each particle constituting the flow.
Identities of the particles are made by specifying their initial position (spatial location) at
a given time. The position of a particle at any other instant of time then becomes a
function of its identity and time.
Analytical expression of the last statement :
is the position vector of a particle (with respect to
a fixed point of reference) at a time t.
(6.1)

is its initial position at a given time t =t0
Equation (6.1) can be written into scalar components with respect to a rectangular
cartesian frame of coordinates as:
x = x(x0,y0,z0,t)
y = y(x0,y0,z0,t)
(where, x0,y0,z0 are the initial coordinates
and x, y, z are the coordinates at a time t of
the particle.)
(6.1a)
(6.1b)
z = z(x0,y0,z0,t) (6.1c)
Hence in can be expressed as
velocity and acceleration
The velocity and acceleration of the fluid particle can be obtained from the material
derivatives of the position of the particle with respect to time. Therefore,
(6.2a)
In terms of scalar components,
(6.2b)
(6.2c)
(6.2d)
where u, v, w are the components of velocity in x, y, z directions respectively.
, , and are the unit vectors along x, y and z
axes respectively.

Similarly, for the acceleration,
(6.3a)
and hence,
(6.3b)
(6.3c)
(6.3d)
where ax, ay, az are accelerations in x, y, z directions respectively.
Advantages of Lagrangian Method:
1. Since motion and trajectory of each fluid particle is known, its history can be traced.
2. Since particles are identified at the start and traced throughout their motion, conservation
of mass is inherent.
Disadvantages of Lagrangian Method:
1. The solution of the equations presents appreciable mathematical difficulties except
certain special cases and therefore, the method is rarely suitable for practical applications.
B. Eulerian Method
The method was developed by Leonhard Euler.
This method is of greater advantage since it avoids the determination of the movement of each
individual fluid particle in all details.
It seeks the velocity and its variation with time t at each and every location ( ) in the
flow field.

In Eulerian view, all hydrodynamic parameters are functions of location and time.
Mathematical representation of the flow field in Eulerian method:
where
and
(6.4)
Therefore,
Relation between Eulerian and Lagrangian Method
The Eulerian description can be written as :
(6.5)
or
u = u (x, y, z, t)
v = v (x, y, z, t)
w = w (x, y, z, t)

The integration of Eq. (6.5) yields the constants of integration which are to be found from the
initial coordinates of the fluid particles.
Hence, the solution of Eq. (6.5) gives the equations of Lagrange as,
or
Above relation are same as Lagrangian formulation.
In principle, the Lagrangian method of description can always be derived from the Eulerian
method.
4.2 Description of Properties in a Moving Fluid:
Scalar and Vector Fields
Scalar: Scalar is a quantity which can be expressed by a single number representing its
magnitude.
Example: mass, density and temperature.
Scalar Field
If at every point in a region, a scalar function has a defined value, the region is called a scalar
field.
Example: Temperature distribution in a rod.
Vector: Vector is a quantity which is specified by both magnitude and direction.
Example: Force, Velocity and Displacement.

Vector Field
If at every point in a region, a vector function has a defined value, the region is called a vector
field.
Example: velocity field of a flowing fluid .
Flow Field
The region in which the flow parameters i.e. velocity, pressure etc. are defined at each and
every point at any instant of time is called a flow field.
Thus a flow field would be specified by the velocities at different points in the region at
different times.
Variation of Flow Parameters in Time and Space
Hydrodynamic parameters like pressure and density along with flow velocity may vary from one
point to another and also from one instant to another at a fixed point.
According to type of variations, categorizing the flow:
Steady and Unsteady Flow
Steady Flow
A steady flow is defined as a flow in which the various hydrodynamic parameters and
fluid properties at any point do not change with time.
In Eulerian approach, a steady flow is described as,
and
Implications:
1. Velocity and acceleration are functions of space coordinates only.
2. In a steady flow, the hydrodynamic parameters may vary with location, but the spatial
distribution of these parameters remain invariant with time.

In the Lagrangian approach,
1. Time is inherent in describing the trajectory of any particle.
2. In steady flow, the velocities of all particles passing through any fixed point at different
times will be same.
3. Describing velocity as a function of time for a given particle will show the velocities at
different points through which the particle has passed providing the information of
velocity as a function of spatial location as described by Eulerian method. Therefore,
the Eulerian and Lagrangian approaches of describing fluid motion become identical
under this situation.
Unsteady Flow
An unsteady Flow is defined as a flow in which the hydrodynamic parameters and fluid
properties changes with time.
Uniform and Non-uniform Flows
Uniform Flow
The flow is defined as uniform flow when in the flow field the velocity and other
hydrodynamic parameters do not change from point to point at any instant of time.
For a uniform flow, the velocity is a function of time only, which can be expressed in Eulerian
description as
Implication:
1. For a uniform flow, there will be no spatial distribution of hydrodynamic and other
parameters.
2. Any hydrodynamic parameter will have a unique value in the entire field,
irrespective of whether it
changes with time − unsteady uniform flow OR
does not change with time − steady uniform flow.
3. Thus ,steadiness of flow and uniformity of flow does not necessarily go together.

Non-Uniform Flow
When the velocity and other hydrodynamic parameters changes from one point to
another the flow is defined as non-uniform.
Important points:
1. For a non-uniform flow, the changes with position may be found either in the direction
of flow or in directions perpendicular to it.
2. Non-uniformity in a direction perpendicular to the flow is always encountered near solid
boundaries past which the fluid flows.
Reason: All fluids possess viscosity which reduces the relative velocity (of the fluid w.r.t. to the
wall) to zero at a solid boundary. This is known as no-slip condition.
Four possible combinations
4.3 Local and Material Rate of Change:
Material Derivative and Acceleration
Let the position of a particle at any instant t in a flow field be given by the space
coordinates (x, y, z) with respect to a rectangular cartesian frame of reference.
Type Example
1. Steady Uniform flow
Flow at constant rate through a duct of uniform
cross-section (The region close to the walls of the
duct is disregarded)
2. Steady non-uniform flow Flow at constant rate through a duct of non-
uniform cross-section (tapering pipe)
3. Unsteady Uniform flow
Flow at varying rates through a long straight pipe
of uniform cross-section. (Again the region close
to the walls is ignored.)
4. Unsteady non-uniform flow Flow at varying rates through a duct of non- uniform cross-section.

The velocity components u, v, w of the particle along x, y and z directions
respectively can then be written in Eulerian form as
u = u (x, y, z, t)
v = v (x, y, z, t)
w = w (x, y, z, t)
After an infinitesimal time interval t , let the particle move to a new position given by the
coordinates (x + Δx, y +Δy , z + Δz).
Its velocity components at this new position be u + Δu, v + Δv and w +Δw.
Expression of velocity components in the Taylor's series form:
The increment in space coordinates can be written as -
Substituting the values of in above equations, we have
etc
In the limit , the equation becomes

The above equations tell that the operator for total differential with respect to time, D/Dt
in a convective field is related to the partial differential as:
Explanation of equation 7.2 :
The total differential D/Dt is known as the material or substantial derivative with
respect to time.
The first term ¶/¶t in the right hand side of is known as temporal or local derivative
which expresses the rate of change with time, at a fixed position.
The last three terms in the right hand side of are together known as convective
derivative which represents the time rate of change due to change in position in the field.
Explanation of equation 7.1 (a, b, c):
The terms in the left hand sides of Eqs (7.1a) to (7.1c) are defined as x, y and z
components of substantial or material acceleration.
The first terms in the right hand sides of Eqs (7.1a) to (7.1c) represent the respective
local or temporal accelerations, while the other terms are convective accelerations.
Thus we can write,
(Material or substantial acceleration) = (temporal or local acceleration) + (convective
acceleration)
Important points:
1. In a steady flow, the temporal acceleration is zero, since the velocity at any point is
invariant with time.

Type of Flow Material Acceleration
4. Unsteady non-uniform
flow exists exists
2. In a uniform flow, on the other hand, the convective acceleration is zero, since the
velocity components are not the functions of space coordinates.
3. In a steady and uniform flow, both the temporal and convective acceleration vanish and
hence there exists no material acceleration.
Existence of the components of acceleration for different types of flow is shown in the
table below.
Temporal Convective
1. Steady Uniform flow 0 0
2. Steady non-uniform flow 0 exists
3. Unsteady Uniform flow exists 0
In vector form, Components of Acceleration in Cylindrical Polar Coordinate System (
r, q , z )
Fig 7.1 Velocity Components in a cylindrical Polar Coordinate System
In a cylindrical polar coordinate system (Fig. 7.1 ), the components of acceleration in r, θ
and z directions can be written as

4.4 Equations of Conservation of Mass for control Volume:
Conservation of Mass - The Continuity Equation
Law of conservation of mass
The law states that mass can neither be created nor be destroyed. Conservation of mass is
inherent to a control mass system (closed system).
The mathematical expression for the above law is stated as:
∆m/∆t = 0, where m = mass of the system
For a control volume (Fig.9.5), the principle of conservation of mass is stated as
Explanation of the additional terms appearing in the above equation:
1. The term appears due to an inward radial acceleration arising from a change in the
direction of Vθ ( velocity component in the azimuthal direction ) with θ as shown in Fig. 7.1. This is known as centripetal acceleration.
2. The term VrVθ/r represents a component of acceleration in azimuthal direction caused
by a change in the direction Vr of with θ

Rate at which mass enters = Rate at which mass leaves the region + Rate of accumulation of
mass in the region
OR
Rate of accumulation of mass in the control volume + Net rate of mass efflux from the control
volume = 0 (9.1)
Continuity equation
The above statement expressed analytically in terms of velocity and density field of a flow is
known as the equation of continuity.
Fig 9.5 A Control Volume in a Flow Field
Continuity Equation - Differential Form
Derivation
1. The point at which the continuity equation has to be derived, is enclosed by an
elementary control volume.
2. The influx, efflux and the rate of accumulation of mass is calculated across each surface
within the control volume.

Fig 9.6 A Control Volume Appropriate to a Rectangular Cartesian Coordinate System
Consider a rectangular parallelopiped in the above figure as the control volume in a rectangular
cartesian frame of coordinate axes.
Net efflux of mass along x -axis must be the excess outflow over inflow across faces
normal to x -axis.
Let the fluid enter across one of such faces ABCD with a velocity u and a density ρ.The
velocity and density with which the fluid will leave the face EFGH will be
and respectively (neglecting the higher order terms in δx).
Therefore, the rate of mass entering the control volume through face ABCD = ρu dy dz.
The rate of mass leaving the control volume through face EFGH will be
(neglecting the higher order terms in dx)

Similarly influx and efflux take place in all y and z directions also.
Rate of accumulation for a point in a flow field
Using, Rate of influx = Rate of Accumulation + Rate of Efflux
Transferring everything to right side
(9.2)
This is the Equation of Continuity for a compressible fluid in a rectangular cartesian
coordinate system.
Continuity Equation - Vector Form
The continuity equation can be written in a vector form as
or, (9.3)

where is the velocity of the point
In case of a steady flow,
Hence Eq. (9.3) becomes
(9.4)
In a rectangular cartesian coordinate system
(9.5)
Equation (9.4) or (9.5) represents the continuity equation for a steady flow.
In case of an incompressible flow,
ρ = constant
Hence,
Moreover
Therefore, the continuity equation for an incompressible flow becomes
(9.6)
(9.7)

In cylindrical polar coordinates eq.9.7 reduces to
Eq. (9.7) can be written in terms of the strain rate components as
(9.8)
4.5 Streamlines, Pathlines and Streakline:
Streamlines
Definition: Streamlines are the Geometrical representation of the of the flow velocity.
Description:
In the Eulerian method, the velocity vector is defined as a function of time and space
coordinates.
If for a fixed instant of time, a space curve is drawn so that it is tangent everywhere to
the velocity vector, then this curve is called a Streamline.
Therefore, the Eulerian method gives a series of instantaneous streamlines of the state of
motion (Fig. 7.2a).
Fig 7.2a Streamlines
Alternative Definition: A streamline at any instant can be defined as an imaginary curve or
line in the flow field so that the tangent to the curve at any point represents the direction of the
instantaneous velocity at that point.
Comments:
In an unsteady flow where the velocity vector changes with time, the pattern of
streamlines also changes from instant to instant.

In a steady flow, the orientation or the pattern of streamlines will be fixed.
From the above definition of streamline, it can be written as
Description of the terms:
(7.3)
1. is the length of an infinitesimal line segment along a streamline at a point .
2. is the instantaneous velocity vector.
The above expression therefore represents the differential equation of a streamline. In a
cartesian coordinate-system, representing
the above equation ( Equation 7.3 ) may be simplified as
(7.4)
Stream tube:
A bundle of neighboring streamlines may be imagined to form a passage through which the fluid
flows. This passage is known as a stream-tube.
Fig 7.2b Stream Tube
Properties of Stream tube:
1. The stream-tube is bounded on all sides by streamlines.
2. Fluid velocity does not exist across a streamline, no fluid may enter or leave a stream-tube
except through its ends.

3. The entire flow in a flow field may be imagined to be composed of flows through stream-
tubes arranged in some arbitrary positions
Path Lines
Definition: A path line is the trajectory of a fluid particle of fixed identity as defined by
Eq. (6.1).
Fig 7.3 Path lines
A family of path lines represents the trajectories of different particles, say, P1, P 2, P3,
etc. (Fig. 7.3).
Differences between Path Line and Stream Line
Note: In a steady flow path lines are identical to streamlines as the Eulerian and Lagrangian
versions become the same.
Streak Lines
Definition: A streak line is the locus of the temporary locations of all particles that have passed
though a fixed point in the flow field at any instant of time.
Features of a Streak Line:
Path Line Stream Line
This refers to a path followed by a fluid
particle over a period of time.
This is an imaginary curve in a flow
field for a fixed instant of time, tangent
to which gives the instantaneous
velocity at that point .
Two path lines can intersect each other as or a
single path line can form a loop as different
particles or even same particle can arrive at the
same point at different instants of time.
Two stream lines can never intersect
each other, as the instantaneous velocity
vector at any given point is unique.

While a path line refers to the identity of a fluid particle, a streak line is specified by a
fixed point in the flow field.
It is of particular interest in experimental flow visualization.
Example: If dye is injected into a liquid at a fixed point in the flow field, then at a later
time t, the dye will indicate the end points of the path lines of particles which have passed
through the injection point.
The equation of a streak line at time t can be derived by the Lagrangian method.
If a fluid particle passes through a fixed point in course of time t, then the Lagrangian
method of description gives the equation
(7.5)
Solving for ,
(7.6)
If the positions of the particles which have passed through the fixed point are
determined, then a streak line can be drawn through these points.
Equation: The equation of the streak line at a time t is given by
(7.7)
Substituting Eq. (7.5) into Eq. (7.6) we get the final form of equation of the streak line,
(7.8)

Difference between Streak Line and Path Line
Fig 7.4 Description of a Streak line
Above diagram can be described by the following points:
Describing a Path Line:
a) Assume P be a fixed point in space through which particles of different identities pass
at different times.
b) In an unsteady flow, the velocity vector at P will change with time and hence the
particles arriving at P at different times will traverse
different paths like PAQ, PBR and PCS which represent the path lines of the particle.
Describing a Streak Line:
a) Let at any instant these particles arrive at points Q, R and S.
b) Q, R and S represent the end points of the trajectories of these three particles at the
instant.
c) The curve joining the points S, R, Q and the fixed point P will define the streak line at
that instant.
d) The fixed point P will also lie on the line, since at any instant, there will be always a
particle of some identity at that point.
Above points show the differences.

Similarities:
a) For a steady flow, the velocity vector at any point is invariant with time
b) The path lines of the particles with different identities passing through P at different
times will not differ
c) The path line would coincide with one another in a single curve which will indicate the
streak line too.
Conclusion: Therefore, in a steady flow, the path lines, streak lines and streamlines are
identical.
4.6 Vorticity and Circulation:
Translation of a Fluid Element
The movement of a fluid element in space has three distinct features simultaneously.
Translation
Rate of deformation
Rotation.
Figure 7.4 shows the picture of a pure translation in absence of rotation and deformation of a
fluid element in a two-dimensional flow described by a rectangular cartesian coordinate system.
In absence of deformation and rotation,
a) There will be no change in the length of the sides of the fluid element.
b) There will be no change in the included angles made by the sides of the fluid element.
c) The sides are displaced in parallel direction.
This is possible when the flow velocities u (the x component velocity) and v (the y component
velocity) are neither a function of x nor of y, i.e., the flow field is totally uniform.

Fig 8.1 Fluid Element in pure translation
If a component of flow velocity becomes the function of only one space coordinate along which
that velocity component is defined.
For example,
if u = u(x) and v = v(y), the fluid element ABCD suffers a change in its linear
dimensions along with translation
there is no change in the included angle by the sides as shown in Fig. 7.5.
Fig 8.2 Fluid Element in Translation with Continuous Linear Deformation
The relative displacement of point B with respect to point A per unit time in x direction is

Similarly, the relative displacement of D with respect to A per unit time in y direction is
Translation with Linear Deformations
Observations from the figure:
Since u is not a function of y and v is not a function of x
All points on the linear element AD move with same velocity in the x direction.
All points on the linear element AB move with the same velocity in y direction.
Hence the sides move parallel from their initial position without changing the included
angle.
This situation is referred to as translation with linear deformation.
Strain rate:
The changes in lengths along the coordinate axes per unit time per unit original lengths are
defined as the components of linear deformation or strain rate in the respective directions.
Therefore, linear strain rate component in the x direction
and, linear strain rate component in y direction
Rate of Deformation in the Fluid Element
Let us consider both the velocity component u and v are functions of x and y, i.e.,
u = u(x,y)

v = v(x,y)
Figure 8.3 represent the above condition
Observations from the figure:
Point B has a relative displacement in y direction with respect to the point A.
Point D has a relative displacement in x direction with respect to point A.
The included angle between AB and AD changes.
The fluid element suffers a continuous angular deformation along with the linear
deformations in course of its motion.
Rate of Angular deformation:
The rate of angular deformation is defined as the rate of change of angle between the linear
segments AB and AD which were initially perpendicular to each other.
Fig 8.3 Fluid element in translation with simultaneous linear and angular deformation rates
From the above figure rate of angular deformation,
(8.1)

From the geometry
Hence,
Finally
Rotation
Figure 8.3 represent the situation of rotation
Observations from the figure:
(8.2a)
(8.2b)
(8.3)
(8.4)
The transverse displacement of B with respect to A and the lateral displacement of D
with respect to A (Fig. 8.3) can be considered as the rotations of the linear segments AB
and AD about A.
This brings the concept of rotation in a flow field.

Definition of rotation at a point:
The rotation at a point is defined as the arithmetic mean of the angular velocities of two
perpendicular linear segments meeting at that point.
Example: The angular velocities of AB and AD about A are
and respectively.
Considering the anticlockwise direction as positive, the rotation at A can be written as,
(8.5a)
or
(8.5b)
The suffix z in ω represents the rotation about z-axis.
When u = u (x, y) and v = v (x, y) the rotation and angular deformation of a fluid element
exist simultaneously.
Special case : Situation of pure Rotation
, and
Observation:
The linear segments AB and AD move with the same angular velocity (both in magnitude
and direction).
The included angle between them remains the same and no angular deformation takes
place. This situation is known as pure rotation.

Vorticity
Definition: The vorticity Ω in its simplest form is defined as a vector which is equal to two
times the rotation vector
(8.6)
For an irrotational flow, vorticity components are zero.
Vortex line:
If tangent to an imaginary line at a point lying on it is in the direction of the Vorticity vector at
that point , the line is a vortex line.
The general equation of the vortex line can be written as,
(8.6b)
In a rectangular cartesian cartesian coordinate system, it becomes
(8.6c)
where,
Vorticity components as vectors:
The vorticity is actually an anti symmetric tensor and its three distinct elements transform like
the components of a vector in cartesian coordinates.
This is the reason for which the vorticity components can be treated as vectors.

Existence of Flow
A fluid must obey the law of conservation of mass in course of its flow as it is a material
body.
For a Velocity field to exist in a fluid continuum, the velocity components must obey the
mass conservation principle.
Velocity components which follow the mass conservation principle are said to constitute
a possible fluid flow
Velocity components violating this principle, are said to describe an impossible flow.
The existence of a physically possible flow field is verified from the principle of
conservation of mass.
The detailed discussion on this is deferred to the next chapter along with the discussion on
principles of conservation of momentum and energy.
4.7 Laws of Vortex Motion:
Bernoulli's Equation In Irrotational Flow
In the previous lecture (lecture 13) we have obtained Bernoulli’s equation
This equation was obtained by integrating the Euler’s equation (the equation of motion)
with respect to a displacement 'ds' along a streamline. Thus, the value of C in the above
equation is constant only along a streamline and should essentially vary from streamline
to streamline.
The equation can be used to define relation between flow variables at point B on the
streamline and at point A, along the same streamline. So, in order to apply this equation,
one should have knowledge of velocity field beforehand. This is one of the limitations of
application of Bernoulli's equation.
Irrotationality of flow field
Under some special condition, the constant C becomes invariant from streamline to streamline
and the Bernoulli’s equation is applicable with same value of C to the entire flow field. The
typical condition is the irrotationality of flow field.
Proof:
Let us consider a steady two dimensional flow of an ideal fluid in a rectangular Cartesian
coordinate system. The velocity field is given by

hence the condition of irrotationality is
(14.1)
The steady state Euler's equation can be written as
(14.2a)
(14.2b)
We consider the y-axis to be vertical and directed positive upward. From the condition of
irrotationality given by the Eq. (14.1), we substitute in place of in the Eq. 14.2a and in
place of in the Eq. 14.2b. This results in
(14.3a)
(14.3b)
Now multiplying Eq.(14.3a) by 'dx' and Eq.(14.3b) by 'dy' and then adding these two equations
we have
(14.4)
The Eq. (14.4) can be physically interpreted as the equation of conservation of energy for an
arbitrary displacement

. Since, u, v and p are functions of x and y, we can write
(14.5a)
(14.5b)
(14.5c)
With the help of Eqs (14.5a), (14.5b), and (14.5c), the Eq. (14.4) can be written as
(14.6)
The integration of Eq. 14.6 results in
(14.7a)
For an incompressible flow,
(14.7b)
The constant C in Eqs (14.7a) and (14.7b) has the same value in the entire flow field, since no
restriction was made in the choice of dr which was considered as an arbitrary displacement in
evaluating the work.

Note: In deriving Eq. (13.8) the displacement ds was considered along a streamline. Therefore,
the total mechanical energy remains constant everywhere in an inviscid and irrotational flow,
while it is constant only along a streamline for an inviscid but rotational flow.
The equation of motion for the flow of an inviscid fluid can be written in a vector form as
where is the body force vector per unit mass
Plane Circular Vortex Flows
Plane circular vortex flows are defined as flows where streamlines are concentric circles.
Therefore, with respect to a polar coordinate system with the centre of the circles as the
origin or pole, the velocity field can be described as
where Vθ and Vr are the tangential and radial component of velocity respectively.
The equation of continuity for a two dimensional incompressible flow in a polar
coordinate system is
which for a plane circular vortex flow gives i.e. Vθ is not a function of θ. Hence, Vθ is a
function of r only.
We can write for the variation of total mechanical energy with radius as
(14.8)
Free Vortex Flows
Free vortex flows are the plane circular vortex flows where the total mechanical energy
remains constant in the entire flow field. There is neither any addition nor any destruction
of energy in the flow field.

Therefore, the total mechanical energy does not vary from streamline to streamline.
Hence from Eq. (14.8), we have,
or, (14.9)
Integration of Eq 14.9 gives
(14.10)
The Eq. (14.10) describes the velocity field in a free vortex flow, where C is a constant in
the entire flow field. The vorticity in a polar coordinate system is defined by -
In case of vortex flows, it can be written as
For a free vortex flow, described by Eq. (14.10),Ω becomes zero. Therefore we conclude
that a free vortex flow is irrotational, and hence, it is also referred to as irrotational
vortex.
It has been shown before that the total mechanical energy remains same throughout in an
irrotational flow field. Therefore, irrotationality is a direct consequence of the constancy
of total mechanical energy in the entire flow field and vice versa.
The interesting feature in a free vortex flow is that as [Eq. (14.10)].
It mathematically signifies a point of singularity at r = 0 which, in practice, is
impossible. In fact, the definition of a free vortex flow cannot be extended as r = 0 is
approached.
In a real fluid, friction becomes dominant as r→0 and so a fluid in this central region
tends to rotate as a solid body. Therefore, the singularity at r = 0 does not render the

theory of irrotational vortex useless, since, in practical problems, our concern is with
conditions away from the central core.
Pressure Distribution in a Free Vortex Flow
Pressure distribution in a vortex flow is usually found out by integrating the equation of
motion in the r direction. The equation of motion in the radial direction for a vortex flow
can be written as
(14.11)
(14.12)
Integrating Eq. (14.12) with respect to dr, and considering the flow to be incompressible
we have,
(14.13)
For a free vortex flow,
Hence Eq. 14.13 becomes
(14.14)
If the pressure at some radius r = ra, is known to be the atmospheric pressure patm then
equation (14.14) can be written as
(14.15)
where z and za are the vertical elevations (measured from any arbitrary datum) at r and ra.

Equation (14.15) can also be derived by a straight forward application of Bernoulli’s
equation between any two points at r = ra and r = r.
In a free vortex flow total mechanical energy remains constant. There is neither any
energy interaction between an outside source and the flow, nor is there any dissipation of
mechanical energy within the flow. The fluid rotates by virtue of some rotation
previously imparted to it or because of some internal action.
Some examples are a whirlpool in a river, the rotatory flow that often arises in a shallow
vessel when liquid flows out through a hole in the bottom (as is often seen when water
flows out from a bathtub or a wash basin), and flow in a centrifugal pump case just
outside the impeller.
Cylindrical Free Vortex
A cylindrical free vortex motion is conceived in a cylindrical coordinate system with
axis z directing vertically upwards (Fig. 14.1), where at each horizontal cross-section,
there exists a planar free vortex motion with tangential velocity given by Eq. (14.10).
The total energy at any point remains constant and can be written as
(14.16)
The pressure distribution along the radius can be found from Eq. (14.16) by considering z
as constant; again, for any constant pressure p, values of z, determining a surface of equal
pressure, can also be found from Eq. (14.16).
If p is measured in gauge pressure, then the value of z, where p = 0 determines the free
surface (Fig. 14.1), if one exists.
Fig 14.1 Cylindrical Free Vortex

Forced Vortex Flows
Flows where streamlines are concentric circles and the tangential velocity is directly
proportional to the radius of curvature are known as plane circular forced vortex flows.
The flow field is described in a polar coordinate system as,
(14.17a)
and (14.17b)
All fluid particles rotate with the same angular velocity ω like a solid body. Hence a
forced vortex flow is termed as a solid body rotation.
The vorticity Ω for the flow field can be calculated as
Therefore, a forced vortex motion is not irrotational; rather it is a rotational flow with a
constant vorticity 2ω. Equation (14.8) is used to determine the distribution of mechanical
energy across the radius as
Integrating the equation between the two radii on the same horizontal plane, we have,
(14.18)
Thus, we see from Eq. (14.18) that the total head (total energy per unit weight) increases
with an increase in radius. The total mechanical energy at any point is the sum of kinetic
energy, flow work or pressure energy, and the potential energy.
Therefore the difference in total head between any two points in the same horizontal
plane can be written as,

Substituting this expression of H2-H1 in Eq. (14.18), we get
The same equation can also be obtained by integrating the equation of motion in a radial
direction as
To maintain a forced vortex flow, mechanical energy has to be spent from outside and
thus an external torque is always necessary to be applied continuously.
Forced vortex can be generated by rotating a vessel containing a fluid so that the angular
velocity is the same at all points.
4.8 Translation, Rotation and Rate of Deformation of a Fluid Particle:
Refer to Section 4.6

Chapter 5
Equations of Fluid Motion
5.1 Euler and Navier Stokes Equation:
Euler’s Equation: The Equation of Motion of an Ideal Fluid
This section is not a mandatory requirement. One can skip this section (if he/she does not like to
spend time on Euler's equation) and go directly to Steady Flow Energy Equation.
Using the Newton's second law of motion the relationship between the velocity and pressure
field for a flow of an inviscid fluid can be derived. The resulting equation, in its differential
form, is known as Euler’s Equation. The equation is first derived by the scientist Euler.
Derivation:
Let us consider an elementary parallelopiped of fluid element as a control mass system in a
frame of rectangular cartesian coordinate axes as shown in Fig. 12.3. The external forces acting
on a fluid element are the body forces and the surface forces.
Fig 12.2 A Fluid Element appropriate to a Cartesian Coordinate System
used for the derivation of Euler's Equation

Let Xx, Xy, Xz be the components of body forces acting per unit mass of the fluid element along
the coordinate axes x, y and z respectively. The body forces arise due to external force fields like
gravity, electromagnetic field, etc., and therefore, the detailed description of Xx, Xy and Xz are
provided by the laws of physics describing the force fields. The surface forces for an inviscid fluid will be the pressure forces acting on different surfaces as shown in Fig. 12.3. Therefore, the net forces acting on the fluid element along x, y and z directions can be written as
Since each component of the force can be expressed as the rate of change of momentum in the
respective directions, we have
(12.5a)
(12.5b)
(12.5c)
s the mass of a control mass system does not change with time, is constant with time
and can be taken common. Therefore we can write Eqs (12.5a to 12.5c) as
(12.6a)
(12.6b)
(12.6c)
Expanding the material accelerations in Eqs (12.6a) to (12.6c) in terms of their respective
temporal and convective components, we get
(12.7a)

(12.7b)
(12.7c)
The Eqs (12.7a, 12.7b, 12.7c) are valid for both incompressible and compressible flow. By putting u = v = w = 0, as a special case, one can obtain the equation of hydrostatics . Equations (12.7a), (12.7b), (12.7c) can be put into a single vector form as
(12.7d)
(12.7e)
where the velocity vector and the body force vector per unit volume are defined as
Euler’s Equation along a Streamline
Fig 12.3 Force Balance on a Moving Element Along a Streamline
Equation (12.7d) or (12.7e) is the well known Euler’s equation in vector form, while Eqs (12.7a) to (12.7c) describe the Euler‟s equations in a rectangular Cartesian coordinate system.

Derivation
Euler’s equation along a streamline is derived by applying Newton’s second law of motion to a
fluid element moving along a streamline. Considering gravity as the only body force component
acting vertically downward (Fig. 12.3), the net external force acting on the fluid element along
the directions can be written as
(12.8)
where ∆A is the cross-sectional area of the fluid element. By the application of Newton’s second
law of motion in s direction, we get
(12.9)
From geometry we get
Hence, the final form of Eq. (12.9) becomes
(12.10)
Equation (12.10) is the Euler’s equation along a streamline.
Let us consider along the streamline so that
Again, we can write from Fig. 12.3
The equation of a streamline is given by

or, which finally leads to
Multiplying Eqs (12.7a), (12.7b) and (12.7c) by dx, dy and dz respectively and then substituting
the above mentioned equalities, we get
Adding these three equations, we can write
=
=
Hence,
This is the more popular form of Euler's equation because the velocity vector in a flow field is
always directed along the streamline.
Euler’s Equation in Different Conventional Coordinate System
Euler’s equation in different coordinate systems can be derived either by expanding the
acceleration and pressure gradient terms of Eq. (12.7d), or by the application of Newton’s second
law to a fluid element appropriate to the coordinate system.

Euler's Equation in Different Conventional Coordinate Systems
Coordinate System Euler's Equation (Equation of motion for an inviscid flow)
Rectangular Cartesian
coordinate
x direction
y direction
z direction
Cylindrical Polar
Coordinate
r direction
θ direction
z direction
Spherical Polar Coordinate
R direction
θ direction
υ direction
A Control Volume Approach for the Derivation of Euler’s Equation
Euler’s equations of motion can also be derived by the use of the momentum theorem for a
control volume.
Derivation
In a fixed x, y, z axes (the rectangular cartesian coordinate system), the parallelopiped which was
taken earlier as a control mass system is now considered as a control volume (Fig. 12.4).

Fig 12.4 A Control Volume used for the derivation of Euler's Equation
We can define the velocity vector and the body force per unit as

The rate of x momentum influx to the control volume through the face ABCD is equal to ρu2
dy
dz. The rate of x momentum efflux from the control volume through the face EFGH equals
Therefore the rate of net efflux of x momentum from the control volume due to the faces
perpendicular to the x direction (faces ABCD and EFGH) = where, , the
elemental volume = dx dy dz.
Similarly,
The rate of net efflux of x momentum due to the faces perpendicular to the y direction (face
BCGF and ADHE)
The rate of net efflux of x momentum due to the faces perpendicular to the z direction (faces
DCGH and ABFE) =
Hence, the net rate of x momentum efflux from the control volume becomes
The time rate of increase in x momentum in the control volume can be written as
(Since, , by the definition of control volume, is invariant with time)
Applying the principle of momentum conservation to a control volume (Eq. 4.28b), we get
(12.11a)
The equations in other directions y and z can be obtained in a similar way by considering the y
momentum and z momentum fluxes through the control volume as
(12.11b)

(12.11c)
The typical form of Euler’s equations given by Eqs (12.11a), (12.11b) and (12.11c) are known as
the conservative forms.
Navier-Strokes Equation
Generalized equations of motion of a real flow named after the inventors CLMH Navier
and GG Stokes are derived from the Newton's second law
Newton's second law states that the product of mass and acceleration is equal to sum
of the external forces acting on a body.
External forces are of two kinds- one acts throughout the mass of the body ----- body force ( gravitational
force, electromagnetic force)
another acts on the boundary---------------------- surface force (pressure
and frictional force).
Objective - We shall consider a differential fluid element in the flow field (Fig. 24.1). Evaluate
the surface forces acting on the boundary of the rectangular parallelepiped shown below.
Fig. 24.1 Definition of the components of stress and their locations in a differential fluid
element

Let the body force per unit mass be
and surface force per unit volume be
Consider surface force on the surface AEHD, per unit area,
(24.6)
(24.7)
[Here second subscript x denotes that the surface force is evaluated for the surface whose
outward normal is the x axis]
Surface force on the surface BFGC per unit area is
Net force on the body due to imbalance of surface forces on the above two surfaces is
(since area of faces AEHD and BFGC is dydz)
(24.8)
Total force on the body due to net surface forces on all six surfaces is
And hence, the resultant surface force dF, per unit volume, is
(since Volume= dx dy dz)
(24.9)
(24.10)
The quantities , and are vectors which can be resolved into normal stresses
denoted by and shearing stresses denoted by as
(24.11)

The stress system has nine scalar quantities. These nine quantities form a stress tensor.
Nine Scalar Quantities of Stress System - Stress Tensor
The set of nine components of stress tensor can be described as
(24.12)
The stress tensor is symmetric,
This means that two shearing stresses with subscripts which differ only in their sequence
are equal. For example
Considering the equation of motion for instantaneous rotation of the fluid element (Fig.
24.1) about y axis, we can write
where =dxdydz is the volume of the element, is the angular
acceleration is the moment of inertia of the element about y-axis
Since is proportional to fifth power of the linear dimensions and is proportional to
the third power of the linear dimensions, the left hand side of the above equation and the
second term on the right hand side vanishes faster than the first term on the right hand
side on contracting the element to a point.
Hence, the result is
From the similar considerations about other two remaining axes, we can write

which has already been observed in Eqs (24.2a), (24.2b) and (24.2c) earlier.
Invoking these conditions into Eq. (24.12), the stress tensor becomes
(24.13)
Combining Eqs (24.10), (24.11) and (24.13), the resultant surface force per unit volume
becomes
(8.14)
As per the velocity field,
(24.15)
By Newton's law of motion applied to the differential element, we can write
or,
Substituting Eqs (24.15), (24.14) and (24.6) into the above expression, we obtain
(24.16a)
(24.16b)

(24.16c)
Since
Similarly others follow.
So we can express , and in terms of field derivatives,
These differential equations are known as Navier-Stokes equations. At this juncture, discuss the equation of continuity as well, which has a general
(conservative) form
(24.18)
In case of incompressible flow ρ = constant. Therefore, equation of continuity for
incompressible flow becomes
(24.19)
Invoking Eq. (24.19) into Eqs (24.17a), (24.17b) and (24.17c), we get
(24.17a)
(24.17b)
(24.17c)

Similarly others follow
Thus,
Vector Notation& derivation in Cylindrical Coordinates - Navier-Stokes equation
(24.20a)
(24.20b)
(24.20c)
and
Using, vector notation to write Navier-Stokes and continuity equations for
incompressible flow we have
(24.21)
(24.22)
we have four unknown quantities, u, v, w and p , we also have four equations, - equations of motion in three directions and the
continuity equation.
In principle, these equations are solvable but to date generalized solution is not available
due to the complex nature of the set of these equations.
The highest order terms, which come from the viscous forces, are linear and of second
order
The first order convective terms are non-linear and hence, the set is termed as quasi-
linear.

Navier-Stokes equations in cylindrical coordinate (Fig. 24.2) are useful in solving many
problems. If , and denote the velocity components along the radial, cross-radial
and axial directions respectively, then for the case of incompressible flow, Eqs (24.21)
and (24.22) lead to the following system of equations:
FIG 24.2 Cylindrical polar coordinate and the velocity components
(24.23a)
(24.23b)

(24.23c)
(24.24)
5.2 Derivation of Bernoulli’s Equation for Inviscid and Viscous Flow Field
Bernoulli's Equation
Energy Equation of an ideal Flow along a Streamline
Euler’s equation (the equation of motion of an inviscid fluid) along a stream line for a steady
flow with gravity as the only body force can be written as
(13.6)
Application of a force through a distance ds along the streamline would physically imply work
interaction. Therefore an equation for conservation of energy along a streamline can be obtained
by integrating the Eq. (13.6) with respect to ds as
(13.7)
Where C is a constant along a streamline. In case of an incompressible flow, Eq. (13.7) can be
written as
(13.8)
The Eqs (13.7) and (13.8) are based on the assumption that no work or heat interaction between a
fluid element and the surrounding takes place. The first term of the Eq. (13.8) represents the flow
work per unit mass, the second term represents the kinetic energy per unit mass and the third
term represents the potential energy per unit mass. Therefore the sum of three terms in the left
hand side of Eq. (13.8) can be considered as the total mechanical energy per unit mass which
remains constant along a streamline for a steady inviscid and incompressible flow of fluid.
Hence the Eq. (13.8) is also known as Mechanical energy equation.

This equation was developed first by Daniel Bernoulli in 1738 and is therefore referred to as
Bernoulli’s equation. Each term in the Eq. (13.8) has the dimension of energy per unit mass. The
equation can also be expressed in terms of energy per unit weight as
(13.9)
In a fluid flow, the energy per unit weight is termed as head. Accordingly, equation 13.9 can be
interpreted as
Pressure head + Velocity head + Potential head =Total head (total energy per unit weight).
Bernoulli's Equation with Head Loss
The derivation of mechanical energy equation for a real fluid depends much on the information
about the frictional work done by a moving fluid element and is excluded from the scope of the
book. However, in many practical situations, problems related to real fluids can be analysed with
the help of a modified form of Bernoulli’s equation as
(13.10)
where, hf represents the frictional work done (the work done against the fluid friction) per unit
weight of a fluid element while moving from a station 1 to 2 along a streamline in the direction
of flow. The term hf is usually referred to as head loss between 1 and 2, since it amounts to the
loss in total mechanical energy per unit weight between points 1 and 2 on a streamline due to the effect of fluid friction or viscosity. It physically signifies that the difference in the total mechanical energy between stations 1 and 2 is dissipated into intermolecular or thermal energy and is expressed as loss of head hf in Eq. (13.10). The term head loss, is conventionally
symbolized as hL instead of hf in dealing with practical problems. For an inviscid flow hL = 0,
and the total mechanical energy is constant along a streamline.
Bernoulli's Equation In Irrotational Flow
In the previous lecture (lecture 13) we have obtained Bernoulli’s equation
This equation was obtained by integrating the Euler’s equation (the equation of motion)
with respect to a displacement 'ds' along a streamline. Thus, the value of C in the above
equation is constant only along a streamline and should essentially vary from streamline
to streamline.
The equation can be used to define relation between flow variables at point B on the
streamline and at point A, along the same streamline. So, in order to apply this equation,

one should have knowledge of velocity field beforehand. This is one of the limitations of
application of Bernoulli's equation.
Irrotationality of flow field
Under some special condition, the constant C becomes invariant from streamline to streamline
and the Bernoulli’s equation is applicable with same value of C to the entire flow field. The
typical condition is the irrotationality of flow field.
Click here to play the demonstration
Proof:
Let us consider a steady two dimensional flow of an ideal fluid in a rectangular Cartesian
coordinate system. The velocity field is given by
hence the condition of irrotationality is
(14.1)
The steady state Euler's equation can be written as
(14.2a)
(14.2b)
We consider the y-axis to be vertical and directed positive upward. From the condition of
irrotationality given by the Eq. (14.1), we substitute in place of in the Eq. 14.2a and
in place of in the Eq. 14.2b. This results in
(14.3a)
(14.3b)

Now multiplying Eq.(14.3a) by 'dx' and Eq.(14.3b) by 'dy' and then adding these two equations
we have
(14.4)
The Eq. (14.4) can be physically interpreted as the equation of conservation of energy for an
arbitrary displacement
. Since, u, v and p are functions of x and y, we can write
(14.5a)
(14.5b)
(14.5c)
With the help of Eqs (14.5a), (14.5b), and (14.5c), the Eq. (14.4) can be written as
(14.6)
The integration of Eq. 14.6 results in
(14.7a)
For an incompressible flow,
(14.7b)

The constant C in Eqs (14.7a) and (14.7b) has the same value in the entire flow field, since no
restriction was made in the choice of dr which was considered as an arbitrary displacement in
evaluating the work.
Note: In deriving Eq. (13.8) the displacement ds was considered along a streamline. Therefore,
the total mechanical energy remains constant everywhere in an inviscid and irrotational flow,
while it is constant only along a streamline for an inviscid but rotational flow.
The equation of motion for the flow of an inviscid fluid can be written in a vector form as
where is the body force vector per unit mass
5.3 Momentum Equation in Integral Form:
Conservation of Momentum: Momentum Theorem
In Newtonian mechanics, the conservation of momentum is defined by Newton’s second law of
motion.
Newton’s Second Law of Motion
The rate of change of momentum of a body is proportional to the impressed action and
takes place in the direction of the impressed action.
If a force acts on the body ,linear momentum is implied.
If a torque (moment) acts on the body,angular momentum is implied.
Reynolds Transport Theorem
A study of fluid flow by the Eulerian approach requires a mathematical modeling for a control
volume either in differential or in integral form. Therefore the physical statements of the
principle of conservation of mass, momentum and energy with reference to a control volume
become necessary.
This is done by invoking a theorem known as the Reynolds transport theorem which relates the
control volume concept with that of a control mass system in terms of a general property of the
system.
Statement of Reynolds Transport Theorem

The theorem states that "the time rate of increase of property N within a control mass system is
equal to the time rate of increase of property N within the control volume plus the net rate of
efflux of the property N across the control surface”.
Equation of Reynolds Transport Theorem
After deriving Reynolds Transport Theorem according to the above statement we get
(10.9)
In this equation
N - flow property which is transported
η - intensive value of the flow property
Application of the Reynolds Transport Theorem to Conservation of Mass and Momentum
Conservation of mass The constancy of mass is inherent in the definition of a control mass
system and therefore we can write
(10.13a)
To develop the analytical statement for the conservation of mass of a control volume, the Eq.
(10.11) is used with N = m (mass) and η = 1 along with the Eq. (10.13a).
This gives
(10.13b)
The Eq. (10.13b) is identical to Eq. (10.6) which is the integral form of the continuity equation
derived in earlier section. At steady state, the first term on the left hand side of Eq. (10.13b) is
zero. Hence, it becomes
(10.13c)
Conservation of Momentum or Momentum Theorem The principle of conservation of
momentum as applied to a control volume is usually referred to as the momentum theorem.

Linear momentumThe first step in deriving the analytical statement of linear momentum
theorem is to write the Eq. (10.11) for the property N as the linear - momentum and
accordingly η as the velocity . Then it becomes
(10.14)
The velocity defining the linear momentum in Eq. (10.14) is described in an inertial frame of
reference. Therefore we can substitute the left hand side of Eq. (10.14) by the external forces
on the control mass system or on the coinciding control volume by the direct application of
Newton’s law of motion. This gives
(10.15)
This Equation is the analytical statement of linear momentum theorem.
In the analysis of finite control volumes pertaining to practical problems, it is convenient to
describe all fluid velocities in a frame of coordinates attached to the control volume. Therefore,
an equivalent form of Eq.(10.14) can be obtained, under the situation, by substituting N as and
accordingly η as , we get
(10.16)
With the help of the Eq. (10.12) the left hand side of Eq. can be written as
where is the rectilinear acceleration of the control volume (observed in a fixed
coordinate system) which may or may not be a function of time. From Newton’s law of motion

Therefore,
(10.17)
The Eq. (10.16) can be written in consideration of Eq. (10.17) as
(10.18a)
At steady state, it becomes
(10.18b)
In case of an inertial control volume (which is either fixed or moving with a constant rectilinear
velocity), and hence Eqs (10.18a) and (10.18b) becomes respectively
(10.18c)
and (10.18d)
The Eqs (10.18c) and (10.18d) are the useful forms of the linear momentum theorem as applied
to an inertial control volume at unsteady and steady state respectively, while the Eqs (10.18a)
and (10.18b) are the same for a non-inertial control volume having an arbitrary rectilinear
acceleration.
In general, the external forces in Eqs (10.14, 10.18a to 10.18c) have two components - the
body force and the surface force. Therefore we can write
(10.18e)
where is the body force per unit volume and is the area weighted surface force.

5.4 Angular Momentum Equation in Integral Form:
Angular Momentum
The angular momentum or moment of momentum theorem is also derived from Eq.(10.10) in
consideration of the property N as the angular momentum and accordingly η as the angular
momentum per unit mass. Thus,
(10.19)
where AControl mass system is the angular momentum of the control mass system. . It has to be
noted that the origin for the angular momentum is the origin of the position vector
The term on the left hand side of Eq.(10.19) is the time rate of change of angular momentum of a
control mass system, while the first and second terms on the right hand side of the equation are
the time rate of increase of angular momentum within a control volume and rate of net efflux of
angular momentum across the control surface.
The velocity defining the angular momentum in Eq.(10.19) is described in an inertial frame
of reference.Therefore, the term can be substituted by the net moment ΣM applied
to the system or to the coinciding control volume. Hence one can write Eq. (10.19) as
(10.20a)
At steady state
(10.20b)

Chapter 6
Inviscid Incompressible Flow
6.1 Condition on Velocity for Incompressible Flow:
Analysis of Inviscid, Incompressible, Irrotation Flows
Incompressible flow is a constant density flow.
Let us visualize a fluid element of defined mass, moving along a streamline in an incompressible
flow.
Due to constant density , we can write
(20.1)
Irrotational Flow
if the fluid element does not rotate as it moves along the streamline, or to be precise,
if its motion is translational (and deformation with no rotation) only, the flow is
termed as irrotational.
The rate of rotation of the fluid element can be measured as the average rate of rotation of
two perpendicular line segments.
The average rate of rotation ωz about z-axis is expressed in terms of the gradients of velocity
components as
Similarly, the other two components of rotation are
ωx , ωy and ωz are components of

In a two-dimensional flow,ωz is the only non-trivial component of the rate of rotation called in-
plane component of vorticity and computed as
Thus for irrotational flow, vorticity is zero i.e.
6.2 Laplace Equation:
Potential Flow Theory
Let us imagine a pathline of a fluid particle shown in Fig. 20.1.
Rate of spin of the particle is ωz . The flow in which this spin is zero throughout is known as
irrotationalflow.
For irrotational flows,
Fig 20.1 Pathline of a Fluid Particle
Velocity Potential and Stream Function
Since for irrotational flows .
the velocity for an irrotational flow, can be expressed as the gradient of a scalar function called
the velocity potential, denoted by Φ
(20.2)
Combination of Eqs (20.1) and (20.2) yields
(20.3)

For irrotational flows
For two-dimensional case (as shown in Fig 20.1)
which is again Laplace's equation.
From Eq. (20.3) we see that an inviscid, incompressible, irrotational flow is governed
by Laplace's equation.
Laplace's equation is linear, hence any number of particular solutions of Eq.(20.3) added
together will yield another solution .
A complicated flow pattern for an inviscid, incompressible, irrotational flow can be
synthesized by adding together a number of elementary flows ( provided they are also
inviscid, incompressible and irrotational)----- The Superposition Principle
The analysis of Laplace's Eq. (20.3) and finding out the potential functions are known as
Potential Flow Theory and the inviscid, incompressible, irrotational flow is often called as
Potential Flow .
There are some elementary flows which constitute several complex potential-flow problems.

6.3 Potential Function:
Refer to Section 6.2
6.4 Stream Function:
Stream Function
Let us consider a two-dimensional incompressible flow parallel to the x - y plane in a rectangular
cartesian coordinate system. The flow field in this case is defined by
u = u(x, y, t)
v = v(x, y, t)
w = 0
The equation of continuity is
(10.1)
If a function ψ(x, y, t) is defined in the manner
(10.2a)
(10.2b)
so that it automatically satisfies the equation of continuity (Eq. (10.1)), then the function is
known as stream function.
Note that for a steady flow, ψ is a function of two variables x and y only.
Constancy of ψ on a Streamline
Since ψ is a point function, it has a value at every point in the flow field. Thus a change in the
stream function ψ can be written as
The equation of a streamline is given by

It follows that dψ = 0 on a streamline.This implies the value of ψ is constant along a streamline.
Therefore, the equation of a streamline can be expressed in terms of stream function as
ψ(x, y) = constant (10.3)
Once the function ψ is known, streamline can be drawn by joining the same values of ψ in
the flow field.
Stream function for an irrotational flow
In case of a two-dimensional irrotational flow
Conclusion drawn: For an irrotational flow, stream function satisfies the Laplace’s
equation

Physical Significance of Stream Funtion ψ
Figure 10.1 illustrates a two dimensional flow.
Fig 10.1 Physical Interpretation of Stream Function
Let A be a fixed point, whereas P be any point in the plane of the flow. The points A and P are
joined by the arbitrary lines ABP and ACP. For an incompressible steady flow, the volume flow
rate across ABP into the space ABPCA (considering a unit width in a direction perpendicular to
the plane of the flow) must be equal to that across ACP. A number of different paths connecting
A and P (ADP, AEP,...) may be imagined but the volume flow rate across all the paths would be
the same. This implies that the rate of flow across any curve between A and P depends only
on the end points A and P.
Since A is fixed, the rate of flow across ABP, ACP, ADP, AEP (any path connecting A and P) is
a function only of the position P. This function is known as the stream function ψ.

The value of ψ at P represents the volume flow rate across any line joining P to A.
The value of ψ at A is made arbitrarily zero. If a point P’ is considered (Fig. 10.1b),PP’ being
along a streamline, then the rate of flow across the curve joining A to P’ must be the same as
across AP, since, by the definition of a streamline, there is no flow across PP'
The value of ψ thus remains same at P’ and P. Since P’ was taken as any point on the streamline
through P, it follows that ψ is constant along a streamline. Thus the flow may be represented by a
series of streamlines at equal increments of ψ.
In fig (10.1c) moving from A to B net flow going past the curve AB is
The stream function, in a polar coordinate system is defined as
The expressions for Vr and Vθ in terms of the stream function automatically satisfy the equation
of continuity
given by
Stream Function in Three Dimensional and Compressible Flow
Stream Function in Three Dimensional Flow
In case of a three dimensional flow, it is not possible to draw a streamline with a single stream
function.
An axially symmetric three dimensional flow is similar to the two-dimensional case in a sense
that the flow field is the same in every plane containing the axis of symmetry.

The equation of continuity in the cylindrical polar coordinate system for an incompressible flow
is given by the following equation
For an axially symmetric flow (the axis r = 0 being the axis of symmetry), the term =0
,and simplified equation is satisfied by functions defined as
(10.4)
The function ψ , defined by the Eq.(10.4) in case of a three dimensional flow with an axial
symmetry, is called the stokesstream function.
Stream Function in Compressible Flow
For compressible flow, stream function is related to mass flow rate instead of volume flow rate
because of the extra density term in the continuity equation (unlike incompressible flow)
The continuity equation for a steady two-dimensional compressible flow is given by
Hence a stream function ψ is defined which will satisfy the above equation of continuity as
[where ρ0 is a reference density] (10.5)
ρ0 is used to retain the unit of ψ same as that in the case of an incompressible flow. Physically,
the difference in stream function between any two streamlines multiplied by the reference density ρ0 will give the mass flow rate through the passage of unit width formed by the
streamlines.

6.5 Basic Elementary Flows:
Uniform Flow
Velocity does not change with y-coordinate
There exists only one component of velocity which is in the x direction.
Magnitude of the velocity is U0 .
Since
or,
Thus,
(20.4)
Using stream function ψ for uniform flow
so (20.5)
The constants of integration C1 and K1 are arbitrary.
The values of ψ and Φ for different streamlines and velocity potential lines may change but flow
pattern is unaltered
. The constants of integration may be omitted, without any loss of generality and it is
possible to write
(20.6)

Fig 20..2 (a) Flownet for a Uniform Stream (b) Flownet for uniform Stream with an Anglea
with x-axis
These are plotted in Fig. 20.2(a) and consist of a rectangular mesh of straight streamlines and
orthogonal straight potential-lines (remember streamlines and potential lines are always
orthogonal ). It is conventional to put arrows on the streamlines showing the direction of flow.
In terms of polar (r - θ) coordinate, Eq. (20.6) becomes
(20.7)
Flow at an angle
If we consider a uniform stream at an angle α to the x-axis as shown in Fig. 20.2b. we require
that

and
(20.8)
Integrating. we obtain for a uniform velocity U0 at an angle α, the stream function and velocity
potential respectively as
(20.9)
Source or Sink
Source flow -
A flow with straight streamlines emerging from a point.
Velocity along each streamline varies inversely with distance from the point (shown in
Fig. 20.3).
Only the radial component of velocity is non-trivial. (vθ=0, vz=0 ).
Fig 20.3 Flownet for a source flow
In a steady source flow the amount of fluid crossing any given cylindrical surface of radius r and
unit length is constant ( )
that is ( )in= ( )out

(which shows that velocity is inversely proportional to the distance )
where, K is the source strength and is the volume flow rate
The definition of stream function in cylindrical polar coordinate states that
For the source flow,
(20.10a)
(20.11)
(20.12)
(20.13)
Combining Eqs (20 .12) and (20.13) , we get
(20.14)
Thus
Because the flow is irrotational, we can write
or
or
(20.15)
The integration constants C1 and C2 in Eqs (20.14) and (20.15) have no effect on the basic
structure of velocity and pressure in the flow.

The equations for streamlines and velocity potential lines for source flow become
(20.16)
Sink flow
When is negative , we get sink flow,
here the flow is in the opposite direction of the source flow.
In Fig. 20.3, the point 0 is the origin of the radial streamlines. We visualize that point O is a point
source or sink that induces radial flow in the neighbourhood .
The point source or sink is a point of singularity in the flow field (because vr becomes infinite).
The stream function and velocity potential function are
(20.17)
K = source strength and is proportional to
= the rate of volume flow from the source per unit
depth perpendicular to the page

Concept of Circulation in a Free Vortex Flow
Free Vortex Flow
Fluid particles move in circles about a point.
The only non-trivial velocity component is tangential.
This tangential speed varies with radius r so that same circulation is maintained.
Thus,all the streamlines are concentric circles about a given point where the velocity
along each streamline is inversely proportional to the distance from the centre. This flow
is necessarily irrotational.
Fig 21.1 Flownet for a vortex (free vortex)
Velocity components
In a purely circulatory (free vortex flow) motion, the tangential velocity can be written as
or,
(21.1) where is circulation
For purely circulatory motion we can also write
(21.2)
Stream Function

Using the definition of stream function, we can write
Combining Eqs (21.1) and (21.2) with the above said relations for stream function, it is possible
to write
(21.3)
Velocity Potential Function
Because of irrotationality, it should satisfy
Eqs (21.1) and (21.2) and the above solution of Laplace's equation yields
(21.4)
Since, the integration constants C1 and C2 have no effect on the structure of velocities or
pressures in the flow. We can ignore the integration constants without any loss of generality.
It is clear that the streamlines for vortex flow are circles while the potential lines are radial .
These are given by
(21.5)
In Fig. 21.1, point 0 can be imagined as a point vortex that induces the circulatory flow
around it.
The point vortex is a singularity in the flow field (vθ becomes infinite). Point 0 is simply a point formed by the intersection of the plane of a paper and a line
perpendicular to the plane.
This line is called vortex filament of strength where is the circulation around the
vortex filament .
Circulation is defined as
(21.6)

This circulation constant denotes the algebraic strength of the vortex filament contained
within the closed curve. From Eq. (21.6) we can write
For a two-dimensional flow
or,
(according to Fig. 21.2) (21.7)
Consider a fluid element as shown in Fig. 21.2. Circulation is positive in the anticlockwise
direction (not a mandatory but general convention).
Fig 21.2 Circulation in a flow field
After simplification
(21.8)
Physically, circulation per unit area is the vorticity of the flow .

Now, for a free vortex flow, the tangential velocity is given by Eq. (21.1) as
For a circular path (refer Fig.21.2)
Thus,
Therefore
G = 2πC (21.9) It may be noted that although free vortex is basically an irrotational motion, the circulation for a
given path containing a singular point (including the origin) is constant (2πC) and independent of
the radius of a circular streamline.
However, circulation calculated in a free vortex flow along any closed contour
excluding the singular point (the origin), should be zero.
Fig 21.3 (a) Free Vortex Flow
Considering Fig 21.3 (a) and taking a closed contour ABCD in order to obtain circulation about
the point, P around ABCD it may be shown that

Forced Vortex Flow
If there exists a solid body rotation at constant ω (induced by some external mechanism),
the flow should be called a forced vortex motion (Fig. 21.3 (b).
Fig 21.3 (b) Forced Vortex Flow
we can write
and
(21.10)
Equation (21.10) predicts that
1. The circulation is zero at the origin
2. It increases with increasing radius.
3. The variation is parabolic.
It may be mentioned that the free vortex (irrotational) flow at the origin is impossible because
of mathematical singularity. However, physically there should exist a rotational (forced vortex)
core which is shown by the dotted line ( in Fig. 21.3a ).
Below are given two statements which are related to Kelvin's circulation theorem (stated in
1869) and Cauchy's theorem on irrotational motion (stated in 1815) respectively
1. The circulation around any closed contour is invariant with time in an inviscid fluid.---
Kelvin's Theorem
2. A body of inviscid fluid in irrotational motion continues to move irrotationally.------------
Cauchy's Theorem

6.6 Superimposition of Elementary Flows:
Combination of Fundamental Flows
1) Doublet
We can now form different flow patterns by superimposing the velocity potential and
stream functions of the elementary flows stated above.
In order to develop a doublet, imagine a source and a sink of equal strength K at equal
distance s from the origin along x-axis as shown in Fig. 21.4.
Fig 21.4 Superposition of a Source and a Sink
From any point p(x, y) in the field, r1 and r2 are drawn to the source and the sink. The
polar coordinates of this point (r, θ) have been shown.
The potential functions of the two flows may be superimposed to describe the
potential for the combined flow at P as
(21.11)
Similarly,
(21.12)
Expanding θ1 and θ2 in terms of coordinates of p and s
(21.13)
(21.14)
where

Using
we find
Hence the stream function and the velocity potential function are formed by
combining Eqs (21.12) and (21.13), as well as Eqs(21.11) and (21.14) respectively
Hence ------- Stream Function
(21.15)
(21.16)
----- Potential Function
Doublet is a special case when a source as well as a sink are brought together in
such a way that
and at the same time the
strength is increased to an infinite value.
These are assumed to be accomplished in a manner which makes the product of s and
(in limiting case) a finite value c
This gives us
or,

Streamlines, Velocity Potential for a Doublet
We have seen in the last lecture that the streamlines associated with the doublet are
If we replace sinθ by y/r, and the minus sign be absorbed in C1 , we get
(21.17a)
Putting we get
(21.17b)
Equation (21.17b) represents a family of circles with
radius :
centre :
For x = 0, there are two values of y, one of them=0.
The centres of the circles fall on the y-axis.
On the circle, where y = 0, x has to be zero for all the values of the constant.
family of circles formed(due to different values of C1 ) is tangent to x-axis at the origin.
These streamlines are illustrated in Fig. 21.5.

Fig 21.5 Streamlines and Velocity Potential Lines for a Doublet
Due to the initial positions of the source and the sink in the development of the doublet , it is
certain that
the flow will emerge in the negative x direction from the origin
and
it will converge via the positive x direction of the origin.
Velocity potential lines
In cartresian coordinate the equation becomes
(21.18)
Once again we shall obtain a family of circles
radius:
centre:
The centres will fall on x-axis.
For y = 0 there are two values of x, one of which is zero.
When x = 0, y has to be zero for all values of the constant.
These circles are tangent to y-axis at the origin.

In addition to the determination of the stream function and velocity potential, it is observed that
for a doublet
As the centre of the doublet is approached; the radial velocity tends to be infinite.
It shows that the doublet flow has a singularity.
Since the circulation about a singular point of a source or a sink is zero for any strength, it is
obvious that the circulation about the singular point in a doublet flow must be zero i.e.
doublet flow =0
(21.19)
Applying Stokes Theorem between the line integral and the area-integral
(21.20)
From Eq. 21.20 the obvious conclusion is i.e., doublet flow is an irrotational flow.
Flow About a Cylinder without Circulation
Inviscid-incompressible flow about a cylinder in uniform flow is equivalent to the
superposition of a uniform flow and a doublet.
The doublet has its axis of development parallel to the direction of the uniform flow (x-
axis in this case).
The potential and stream function for this flow will be the sum of those for uniform flow
and doublet.
Potential Function
Stream function

Streamlines
In two dimensional flow, a streamline may be interpreted as
the edge of a surface, on which the velocity vector is always tangential.
and
there is no flow in the direction normal to the surface (characteristic of a solid impervious
boundary ).
Hence, a streamline may also be considered as the contour of an impervious two-dimensional
body .
Fig 22.1 Surface Streamline
Figure 22.1 shows a set of streamlines.
1. The streamline C-D may be considered as the edge of a two-dimensional body .
2. other streamlines form the flow about the boundary.
In order to form a flow about the body of interest, a streamline has to be determined which
encloses an area whose shape is of practical importance in fluid flow. This streamline describes
the boundary of a two-dimensional solid body. The remaining streamlines outside this solid
region, constitute the flow about this body.
If we look for the streamline whose value is zero, we will obtain
(22.1)
replacing y by rsinθ, we have
(22.2)

Solution of Eq. 22.2
1. If θ = 0 or θ = π, the equation is satisfied. This indicates that the x-axis is a part of the
streamline Ψ = 0.
2. When the quantity in the parentheses is zero, the equation is identically satisfied . Hence
it follows that
(22.3)
Interpretation of the solution
There is a circle of radius which is an intrinsic part of the streamline Ψ =
0. This is shown in Fig.22.2
Fig 22.2 Streamline ψ = 0 in a Superimposed Flow of Doublet and Uniform Stream
Stagnation Points
Let us look at the points of intersection of the circle and x- axis , i.e. the points A and B in the
above figure. The polar coordinate of these points are
for point A
for point B

The velocity at these points are found out by taking partial derivatives of the velocity potential in
two orthogonal directions and then substituting the proper values of the coordinates.
Since,
(22.4a)
(22.4b)
At point A
At point B
The points A and B are the stagnation points through which the flow divides and
subsequently reunites forming a zone of circular bluff body.
The circular region, enclosed by part of the streamline ψ = 0 could be imagined as a solid
cylinder in an inviscid flow. At a large distance from the cylinder the flow is moving uniformly
in a cross-flow configuration.

Fig. 22.3 Inviscid Flow past a Cylinder
Figure 22.3 shows the streamlines of the flow.
1. The streamlines outside the circle describe the flow pattern of the inviscid
irrotational flow across a cylinder.
2. The streamlines inside the circle may be disregarded since this region is considered as
a solid obstacle.
Flow Past a Source
When a uniform flow is added to that due to a source -
fluid emitted from the source is swept away in the downstream direction
stream function and velocity potential for this flow will be the sum of those for uniform
flow and source
Stream function;
Velocity Potential;
So
and

Fig 23.1 The streamlines of the flow past a line source for equal increments of 2πψ/q
The Plane coordinates are x/a, y/a where a=k/u
Explanation of Figure
At the point x = -a, y = 0 fluid velocity is zero.
This is called stagnation point of the flow
Here the source flow is turned around by the oncoming uniform flow
The parabolic streamline passing through stagnation point seperates uniform
flow from the source flow.
The streamline becomes parallel to x axis as
Flow Past Vortex
when uniform flow is superimposed with a vortex flow -
Flow will be asymmetrical about x - axis
Again stream function and velocity potential will be the sum of those for uniform flow
and vortex flow
Stream Function:
Velocity Potential:
so that;

Flow About a Rotating Cylinder
Magnus Effect
Flow about a rotating cylinder is equivalent to the combination of flow past a cylinder and a
vortex.
As such in addition to superimposed uniform flow and a doublet, a vortex is thrown at the
doublet centre which will simulate a rotating cylinder in uniform stream.
The pressure distribution will result in a force, a component of which will culminate in lift force
The phenomenon of generation of lift by a rotating object placed in a stream is known as Magnus
effect.
Velocity Potential and Stream Function
The velocity potential and stream functions for the combination of doublet, vortex and uniform
flow are
(clockwise rotation)
(23.1)
(clockwise rotation)
(23.2)
By making use of either the stream function or velocity potential function, the velocity
components are (putting x= rcosθ and y= rsinθ )
(23.3)
(23.4)
Stagnation Points
At the stagnation points the velocity components must vanish. From Eq. (23.3), we get
(23.5) =0
Solution :
1. From Eq. (23.5) it is evident that a zero radial velocity component may occur at

and
along the circle, .
Eq. (23.4) depicts that a zero transverse velocity requires
(23.6)
or
At the stagnation point, both radial and transverse velocity components must be zero .
Thus the location of stagnation point occurs at
There will be two stagnation points since there are two angles for a given sine except for sin-
1(±1)
Determination of Stream Line
The streamline passing through these points may be determined by evaluating ψ at these points.
Substitution of the stagnation coordinate (r, θ) into the stream function (Eq. 23.2) yields

(23.7)
or,
Equating the general expression for stream function to the above constant, we get
By rearranging we can write
(23.8)
All points along the circle satisfy Eq. (23.8) , since for this value of r, each
quantity within parentheses in the equation is zero.
Considering the interior of the circle (on which ψ = 0) to be a solid cylinder, the outer streamline
pattern is shown in Fig 23.2.
Fig 23.2 Flow Past a Cylinder with Circulation
At the stagnation point

The limiting case arises for , where and two stagnation points
meet at the bottom as shown in Fig. 23.3.
In the case of a circulatory flow past the cylinder, the streamlines are symmetric with respect to
the y-axis. The presures at the points on the cylinder surface are symmetrical with respect to the
y-axis. There is no symmetry with respect to the x-axis. Therefore a resultant force acts on the
cylinder in the direction of the y-axis, and the resultant force in the direction of the x-axis is
equal to zero as in the flow without circulation; that is, the D'Alembert paradox takes place here
as well. Thus, in the presence of circulation, different flow patterns can take place and, therefore,
it is necessary for the uniqueness of the solution, to specify the magnitude of circulation.
Fig 23.3 Flow Past a Circular Cylinder with Circulation Value
However, in all these cases the effects of the vortex and doublet become negligibly small as
one moves a large distance from the cylinder.
The flow is assumed to be uniform at infinity.

We have already seen that the change in strength G of the vortex changes the flow pattern,
particularly the position of the stagnation points but the radius of the cylinder remains
unchanged.
6.7 Non-Lifting and Lifting Flow over a Circular Cylinder:
Lift and Drag for Flow Past a Cylinder without Circulation
Pressure in the Cylinder Surface
Pressure becomes uniform at large distances from the cylinder ( where the influence of doublet is
small).
Let us imagine the pressure p0 is known as well as uniform velocity U0 .
We can apply Bernoulli's equation between infinity and the points on the boundary of the cylinder.
Neglecting the variation of potential energy between the aforesaid point at infinity and any point
on the surface of the cylinder, we can write
(22.5)
where the subscript b represents the surface on the cylinder.
Since fluid cannot penetrate the solid boundary, the velocity Ub should be only in the
transverse direction , or in other words, only vθ component of velocity is present on the
streamline ψ = 0 .
Thus at
(22.6)
From eqs (22.5) and (22.6) we obtain

or,
(22.7)
Lift and Drag
Lift :force acting on the cylinder (per unit length) in the direction normal to uniform flow.
Drag: force acting on the cylinder (per unit length) in the direction parallel to uniform
flow.
Fig 22.4 Calculation of Drag in a Cylinder
The drag is calculated by integrating the force components arising out of pressure, in the x
direction on the boundary. Referring to Fig.22.4, the drag force can be written as
infinitesimal length on the circumference
Since,

Similarly, the lift force may be calculated as
(22.8)
(22.9)
The Eqs (22.8) and (22.9) produce D=0 and L=0 after the integration is carried out.
However, in reality, the cylinder will always experience some drag force. This contradiction
between the inviscid flow result and the experiment is usually known as D 'Almbert
paradox.
Bernoulli's equation can be used to calculate the pressure distribution on the cylinder surface
The pressure coefficient , cp is therefore
(22.10)

Lift and Drag for Flow About a Rotating Cylinder
The pressure at large distances from the cylinder is uniform and given by p0.
Deploying Bernoulli's equation between the points at infinity and on the boundary of the
cylinder,
(23.9)
Hence,
(23.10)
From Eqs (23.9) and (23.10) we can write
(23.11)
The lift may calculated as
or,
(23.1

2)
The drag force , which includes the multiplication by cosθ (and integration over 2π) is zero.
Thus the inviscid flow also demonstrates lift.
lift becomes a simple formula involving only the density of the medium, free stream
velocity and circulation.
in two dimensional incompressible steady flow about a boundary of any shape, the lift is
always a product of these three quantities.----- Kutta- Joukowski theorem
6.8 Pressure Distribution over Circular Cylinder in real flow:
Refer above Section
6.9 Kutta Joukowaski’s Theorem:
Refer Above Section
6.10 Generation of Lift:
Refer Above Section

6.11 Lift on Airfoils:
Aerofoil Theory
Aerofoils are streamline shaped wings which are used in airplanes and turbo machinery. These
shapes are such that the drag force is a very small fraction of the lift. The following
nomenclatures are used for defining an aerofoil
Fig 23.4 Aerofoil Section
The chord (C) is the distance between the leading edge and trailing edge.
The length of an aerofoil, normal to the cross-section (i.e., normal to the plane of a paper)
is called the span of a aerofoil.
The camber line represents the mean profile of the aerofoil. Some important geometrical
parameters for an aerofoil are the ratio of maximum thickness to chord (t/C) and the ratio
of maximum camber to chord (h/C). When these ratios are small, an aerofoil can be
considered to be thin. For the analysis of flow, a thin aerofoil is represented by its
camber.
The theory of thick cambered aerofoils uses a complex-variable mapping which transforms the
inviscid flow across a rotating cylinder into the flow about an aerofoil shape with circulation.
Flow Around a Thin Aerofoil
Thin aerofoil theory is based upon the superposition of uniform flow at infinity and a
continuous distribution of clockwise free vortex on the camber line having circulation
density per unit length .
The circulation density should be such that the resultant flow is tangent to the
camber line at every point.
Since the slope of the camber line is assumed to be small, . The total
circulation around the profile is given by

(23.13)
Fig 23.5 Flow Around Thin Aerofoil
A vortical motion of strength at x= develops a velocity at the point p which may be
expressed as
The total induced velocity in the upward direction at point p due to the entire vortex distribution
along the camber line is
(23.14)
For a small camber (having small α), this expression is identically valid for the induced velocity
at point p' due to the vortex sheet of variable strength on the camber line. The resultant
velocity due to and v(x) must be tangential to the camber line so that the slope of a camber
line may be expressed as

(23.15)
From Eqs (23.14) and (23.15) we can write
Consider an element ds on the camber line. Consider a small rectangle (drawn with dotted line)
around ds. The upper and lower sides of the rectangle are very close to each other and these are
parallel to the camber line. The other two sides are normal to the camber line. The circulation
along the rectangle is measured in clockwise direction as
[normal component of velocity at the camber line should
be zero]
or
If the mean velocity in the tangential direction at the camber line is given by it
can be rewritten as
and
if v is very small becomes equal to . The difference in velocity across the
camber line brought about by the vortex sheet of variable strength causes pressure
difference and generates lift force.
Generation of Vortices Around a Wing
The lift around an aerofoil is generated following Kutta-Joukowski theorem . Lift is
a product of ρ , and the circulation .
When the motion of a wing starts from rest, vortices are formed at the trailing edge. At the start, there is a velocity discontinuity at the trailing edge. This is eventual because
near the trailing edge, the velocity at the bottom surface is higher than that at the top
surface. This discrepancy in velocity culminates in the formation of vortices at the
trailing edge.
Figure 23.6(a) depicts the formation of starting vortex by impulsively moving aerofoil.
However, the starting vortices induce a counter circulation as shown in Figure 23.6(b).
The circulation around a path (ABCD) enclosing the wing and just shed (starting) vortex
must be zero. Here we refer to Kelvin's theorem once again.

Fig 23.6 Vortices Generated when an Aerofoil Just Begins to Move
Initially, the flow starts with the zero circulation around the closed path. Thereafter, due
to the change in angle of attack or flow velocity, if a fresh starting vortex is shed, the
circulation around the wing will adjust itself so that a net zero vorticity is set around the
closed path.
Real wings have finite span or finite aspect ratio (AR) λ , defined as
(23.16)
where b is the span length, As is the plan form area as seen from the top..
For a wing of finite span, the end conditions affect both the lift and the drag. In the
leading edge region, pressure at the bottom surface of a wing is higher than that at the top
surface. The longitudinal vortices are generated at the edges of finite wing owing to
pressure differences between the bottom surface directly facing the flow and the top
surface.
Fig 23.7 Vortices Around a Finite Wing

Fig 23.8 Generation of Longitudinal Vortices

Chapter 7
Introduction to Viscous Flows
7.1 Qualitative Aspects of Viscous Flows:
General Viscosity Law
Newton's viscosity law is
(24.1)
where,
= Shear Stress,
n is the coordinate direction normal to the solid-fluid interface,
μ is the coefficient of viscosity, and
V is velocity.
The above law is valid for parallel flows.
Considering Stokes' viscosity law: shear stress is proportional to rate of shear strain so that
has two subscripts---
first subscript : denotes the direction of the normal to the plane on which the stress acts, while
the
second subscript : denotes direction of the force which causes the stress.
The expressions of Stokes' law of viscosity for normal stresses are
(24.2a)
(24.2b)
(24.2c)

where is a proportionality factor and it is related to the second coefficient of viscosity μ1 by
the relationship .
We have already seen that the thermodyamic pressure is
Now if we add the three equations 24.3(a),(b) and (c) , we obtain,
or
(24.4)
For incompressible fluids,
So, is satisfied eventually. This is known as Thermodynamic
pressure.
For compressible fluids, Stokes' hypothesis is .
Invoking this to Eq. (24.4), will finally result in (same as for
incompressible fluid).
Interesting historical aspects of the Stoke's assumption can be found in
Truesdell .
------------------------------------------------------------------------------------------------------------ ----------------------------------------------------------
(24.3a)
(24.3b)
(24.3c)

† Truesdell , C.A. "Stoke's Principle of Viscosity", Journal of Rational Mechanics and
Analysis, Vol.1, pp.228-231,1952.
------------------------------------------------------------------------------------------------------------
----------------------------------------------------------
Generally, fluids obeying the ideal gas equation follow this hypothesis and they are
called Stokesian fluids .
The second coefficient of viscosity, μ1 has been verified to be negligibly small.
Substituting μ for in 24.3a, 24.3b, 24.3c we obtain
In deriving the above stress-strain rate relationship, it was assumed that a fluid has the following
properties
Fluid is homogeneous and isotropic, i.e. the relation between components of stress and
those of rate of strain is the same in all directions.
Stress is a linear function of strain rate.
The stress-strain relationship will hold good irrespective of the orientation of the
reference coordinate system.
The stress components must reduce to the hydrostatic pressure "p" (typically thermodynamic
pressure = hydrostatic pressure ) when all the gradients of velocities are zero.
7.2 Viscosity and Thermal Conductivity:
Refer Section 1.3
(24.5a)
(24.5b)
(24.5c)

7.3 Phenomenon of Separation:
Seperation of Boundary Layer
It has been observed that the flow is reversed at the vicinity of the wall under certain
conditions.
The phenomenon is termed as separation of boundary layer.
Separation takes place due to excessive momentum loss near the wall in a boundary
layer trying to move downstream against increasing pressure, i.e., , which is
called adverse pressure gradient.
Figure 29.2 shows the flow past a circular cylinder, in an infinite medium.
1. Up to , the flow area is like a constricted passage and the
flow behaviour is like that of a nozzle.
2. Beyond the flow area is diverged, therefore, the flow behaviour
is much similar to a diffuser
This dictates the inviscid pressure distribution on the cylinder which is shown by a firm
line in Fig. 29.2.
Here
: pressure in the free stream
: velocity in the free stream and
: is the local pressure on the cylinder.

Fig. 29.2 Flow separation and formation of wake behind a circular cylinder
Consider the forces in the flow field.
In the inviscid region,
1. Until the pressure force and the force due to streamwise
acceleration i.e. inertia forces are acting in the same direction (pressure
gradient being negative/favourable)
2. Beyond , the pressure gradient is positive or adverse. Due to
the adverse pressure gradient the pressure force and the force due to
acceleration will be opposing each other in the in viscid zone of this part.
So long as no viscous effect is considered, the situation does not cause any sensation.
In the viscid region (near the solid boundary),
3. Up to , the viscous force opposes the combined pressure force
and the force due to acceleration. Fluid particles overcome this viscous
resistance due to continuous conversion of pressure force into kinetic
energy.

4. Beyond , within the viscous zone, the flow structure becomes
different. It is seen that the force due to acceleration is opposed by both
the viscous force and pressure force.
Depending upon the magnitude of adverse pressure gradient, somewhere around
, the fluid particles, in the boundary layer are separated from the wall and
driven in the upstream direction. However, the far field external stream pushes back these
separated layers together with it and develops a broad pulsating wake behind the
cylinder.
The mathematical explanation of flow-separation : The point of separation may be
defined as the limit between forward and reverse flow in the layer very close to the wall,
i.e., at the point of separation
(29.16)
This means that the shear stress at the wall, . But at this point, the adverse
pressure continues to exist and at the downstream of this point the flow acts in a reverse
direction resulting in a back flow.
We can also explain flow separation using the argument about the second derivative of
velocity u at the wall. From the dimensional form of the momentum at the wall, where u
= v = 0, we can write
(29.17)
Consider the situation due to a favourable pressure gradient where we
have, 1. . (From Eq. (29.17))
2. As we proceed towards the free stream, the velocity u approaches
asymptotically, so decreases at a continuously lesser rate in y direction.
3. This means that remains less than zero near the edge of the boundary
layer.
4. The curvature of a velocity profile is always negative as shown in (Fig.
29.3a)
Consider the case of adverse pressure gradient,
1. At the boundary, the curvature of the profile must be positive (since ).

2. Near the interface of boundary layer and free stream the previous argument
regarding and still holds good and the curvature is negative.
3. Thus we observe that for an adverse pressure gradient, there must exist a point for
which . This point is known as point of inflection of the velocity
profile in the boundary layer as shown in Fig. 29.3b
4. However, point of separation means at the wall.
5. at the wall since separation can only occur due to adverse pressure
gradient. But we have already seen that at the edge of the boundary layer,
. It is therefore, clear that if there is a point of separation, there
must exist a point of inflection in the velocity profile.
Fig. 29.3 Velocity distribution within a boundary layer
(a) Favourable pressure gradient,
(b) adverse pressure gradient,
1. Let us reconsider the flow past a circular cylinder and continue our discussion on the
wake behind a cylinder. The pressure distribution which was shown by the firm line in

Fig. 21.5 is obtained from the potential flow theory. However. somewhere near
(in experiments it has been observed to be at ) . the boundary layer detaches
itself from the wall.
2. Meanwhile, pressure in the wake remains close to separation-point-pressure since the eddies (formed as a consequence of the retarded layers being carried together with the
upper layer through the action of shear) cannot convert rotational kinetic energy into
pressure head. The actual pressure distribution is shown by the dotted line in Fig. 29.3.
3. Since the wake zone pressure is less than that of the forward stagnation point
(pressure at point A in Fig. 29.3), the cylinder experiences a drag force which is basically
attributed to the pressure difference.
The drag force, brought about by the pressure difference is known as form drag
whereas the shear stress at the wall gives rise to skin friction drag. Generally, these
two drag forces together are responsible for resultant drag on a body
7.4 Navier Stokes Equation in Vector Form:
A general way of deriving the Navier-Stokes equations from the basic laws of physics.
Consider a general flow field as represented in Fig. 25.1.
Imagine a closed control volume, within the flow field. The control volume is fixed
in space and the fluid is moving through it. The control volume occupies reasonably
large finite region of the flow field.
A control surface , A0 is defined as the surface which bounds the volume .
According to Reynolds transport theorem, "The rate of change of momentum for a
system equals the sum of the rate of change of momentum inside the control volume and
the rate of efflux of momentum across the control surface".
The rate of change of momentum for a system (in our case, the control volume
boundary and the system boundary are same) is equal to the net external force acting
on it.
Now, we shall transform these statements into equation by accounting for each term,

FIG 25.1 Finite control volume fixed in space with the fluid moving through it
Rate of change of momentum inside the control volume
(25.1)
(since t is independent of space variable)
Rate of efflux of momentum through control surface
Surface force acting on the control volume
( is symmetric stress tensor )
(25.2)
(25.3)

Body force acting on the control volume
in Eq. (25.4) is the body force per unit mass.
Finally, we get,
(25.4)
or
or,
or
(25.5)
We know that is the general form of mass conservation equation (popularly
known as the continuity equation), valid for both compressible and incompressible flows.
Invoking this relationship in Eq. (25.5), we obtain
(25.6)
Equation (25.6) is referred to as Cauchy's equation of motion . In this equation, is the
stress tensor,
After having substituted we get
(25.8)
From Stokes's hypothesis we get, (25.9)
or

We choose
.
Invoking above two relationships into Eq.( 25.6) we get
(25.10)
This is the most general form of Navier-Stokes equation.
7.5 Viscous Flow Energy Equation: Under Development
7.6 Exact Solutions to Navier Stokes Equations:
Exact Solutions Of Navier-Stokes Equations
Consider a class of flow termed as parallel flow in which only one velocity term is nontrivial
and all the fluid particles move in one direction only.
to be the direction along which all fluid particles travel , i.e.
Invoking this in continuity equation, we get
which means
Now. Navier-Stokes equations for incompressible flow become

So, we obtain
and
which means
(25.11)
7.7 Plane Poiseuille Flow:
Parallel Flow in a Straight Channel
Consider steady flow between two infinitely broad parallel plates as shown in Fig. 25.2.
Flow is independent of any variation in z direction, hence, z dependence is gotten rid of and Eq.
(25.11) becomes
FIG 25.2 Parallel flow in a straight channel
(25.12)

The boundary conditions are at y = b, u = 0; and y = -b, u = O.
From Eq. (25.12), we can write
or
Applying the boundary conditions, the constants are evaluated as
and
So, the solution is
(25.13)
which implies that the velocity profile is parabolic.
Average Velocity and Maximum Velocity
To establish the relationship between the maximum velocity and average velocity in the
channel, we analyze as follows
At y = 0, ; this yields
(25.14a)
On the other hand, the average velocity,
or

Finally, (25.14b)
So, or
(25.14c)
The shearing stress at the wall for the parallel flow in a channel can be determined from
the velocity gradient as
Since the upper plate is a "minus y surface", a negative stress acts in the positive x direction, i.e.
to the right.
The local friction coefficient, Cf is defined by
(25.14d)
where is the Reynolds number of flow based on average velocity and the channel
height (2b).
Experiments show that Eq. (25.14d) is valid in the laminar regime of the channel flow.
The maximum Reynolds number value corresponding to fully developed laminar flow,
for which a stable motion will persist, is 2300.
In a reasonably careful experiment, laminar flow can be observed up to even Re =
10,000.
But the value below which the flow will always remain laminar, i.e. the critical value of
Re is 2300.

7.8 Couette Flow:
Couette Flow
Couette flow is the flow between two parallel plates (Fig. 26.1). Here, one plate is at rest and
the other is moving with a velocity U . Let us assume the plates are infinitely large in z direction,
so the z dependence is not there.
The governing equation is
flow is independent of any variation in z-direction.
The boundary conditions are ---(i)At y = 0, u = 0 (ii)At y = h, u = U.
FIG 26.1 Couette flow between two parallel flat plates
We get,
Invoking the condition (at y = 0, u = 0), becomes equal to zero.
Invoking the other condition (at y = h, u = U),

(26.1)
Equation (26.1) can also be expressed in the form
(26.2a)
Where
,
Equation (26.2a) describes the velocity distribution in non-dimensional form across the channel
with P as a parameter known as the non-dimensional pressure gradient .
When P = 0, the velocity distribution across the channel is reduced to
This particular case is known as simple Couette flow.
When P > 0 , i.e. for a negative or favourable pressure gradient in the
direction of motion, the velocity is positive over the whole gap between the channel
walls. For negative value of P ( P < 0 ), there is a positive or adverse pressure gradient
in the direction of motion and the velocity over a portion of channel width can become
negative and back flow may occur near the wall which is at rest. Figure 26.2a shows the
effect of dragging action of the upper plate exerted on the fluid particles in the channel
for different values of pressure gradient.
So,
or,

FIG 26.2a - Velocity profile for the Couette flow for various values of pressure gradient
Maximum and minimum velocities
The quantitative description of non-dimensional velocity distribution across the channel,
depicted by Eq. (26.2a), is shown
in Fig. 26.2b.
The location of maximum or minimum velocity in the channel is found out by setting
=0. From Eq. (26.2a), we can write
Setting gives
26.2b
It is interesting to note that maximum velocity for P = 1 occurs at y/h = 1 and equals to
U . For P > 1, the maximum velocity occurs at a location .
This means that with P > 1, the fluid particles attain a velocity higher than that of the
moving plate at a location somewhere below the moving plate.

For P = -1, the minimum velocity occurs, at . For P < -1, the minimum velocity
occurs at a location .
This means that there occurs a back flow near the fixed plate. The values of maximum
and minimum velocities can be determined by substituting the value of y from Eq.
(26.2b) into Eq. (26.2a) as
(26.2c)
FIG 26.2b - Velocity distribution of the Couette flow

7.9 Hagen-Poisuelle’s Flow:
Hagen Poiseuille Flow
Consider fully developed laminar flow through a straight tube of circular cross-section as
in Fig. 26.3. Rotational symmetry is considered to make the flow two-dimensional
axisymmetric.
Let us take z-axis as the axis of the tube along which all the fluid particles travel, i.e.
Fig 26.3 - Hagen-Poiseuille flow through a pipe
Now, from continuity equation, we obtain
[ For rotational symmetry, ]
which means
Invoking in the
Navier-Stokes equations, we obtain
(26.3)
(in the z-direction)
For steady flow, the governing equation becomes
(26.4)

The boundary conditions are- (i) At r = 0, is finite and (ii) r = R, yields
Equation (26.4) can be written as
or,
or,
or,
or,
At r =0, is finite which means A should be equal to zero and at r = R, = 0 yields
(26.5)
This shows that the axial velocity profile in a fully developed laminar pipe flow is
having parabolic variation along r.
At r = 0, as such,
(26.6a)
The average velocity in the channel,

(26.6b)
or (26.6c)
Now, the discharge (Q) through a pipe is given by
(26.7)
or, [From Eq. 26.6b]
(26.8) or
7.10 Hele Shaw Flow: Under Development
or,

7.11 Flow through Co-rotating Cylinders:
Flow between Two Concentric Rotating Cylinders
Another example which leads to an exact solution of Navier-Stokes equation is the flow
between two concentric rotating cylinders.
Consider flow in the annulus of two cylinders (Fig. 26.5), where r1 and r2 are the radii of
inner and outer cylinders, respectively, and the cylinders move with different rotational
speeds ω1 and ω2 respectively
.
FIG 26.5 - Flow between two concentric rotating cylinders
From the physics of the problem we know, , .
From the continuity Eq. and these two conditions, we obtain
which means is not a function of θ. Assume z dimension to be large enough so that end
effects can be neglected and (any property) = 0.
This implies . With these simplifications and assuming that " θ symmetry"
holds good, Navier-Stokes equation reduces to
(26.17)
(26.18) and

Equation (26.17) signifies that the centrifugal force is supplied by the radial pressure,
exerted by the wall of the enclosure on the fluid. In other words, it describes the radial
pressure distribution.
From Eq. (26.18), we get
(26.19) or
and
For the azimuthal component of velocity, , the boundary conditions are: at
at .
Application of these boundary conditions on Eq. (26.19) will produce
Finally, the velocity distribution is given by
(26.20)
Calculation of Stress and Torque Transmitted
Now, is the general stress-strain relation.
or
In our case,

(26.21) or
Equations (26.20) and (26.21) yields
(26.22)
Now,
and,
For the case, when the inner cylinder is at rest and the outer cylinder rotates, the torque
transmitted by the outer cylinder to the fluid is
(26.23)
where l is the length of the cylinder.
The moment T1, with which the fluid acts on the inner cylinder has the same magnitude.
If the angular velocity of the external cylinder and the moment acting on the inner
cylinder are measured, the coefficient of viscosity can be evaluated by making use of the Eq. (26.23).
or

7.12 Transition from Laminar to Turbulent Flows:
Mechanisms of Boundary Layer Transition
One of the interesting problems in fluid mechanics is the physical mechanism of
transition from laminar to turbulent flow. The problem evolves about the generation of
both steady and unsteady vorticity near a body, its subsequent molecular diffusion, its
kinematic and dynamic convection and redistribution downstream, and the resulting
feedback on the velocity and pressure fields near the body. We can perhaps realise the
complexity of the transition problem by examining the behaviour of a real flow past a
cylinder.
Figure 31.4 (a) shows the flow past a cylinder for a very low Reynolds number .
The flow smoothly divides and reunites around the cylinder.
At a Reynolds number of about 4, the flow (boundary layer) separates in the
downstream and the wake is formed by two symmetric eddies . The eddies remain
steady and symmetrical but grow in size up to a Reynolds number of about 40 as
shown in Fig. 31.4(b).
At a Reynolds number above 40 , oscillation in the wake induces asymmetry and
finally the wake starts shedding vortices into the stream. This situation is termed as
onset of periodicity as shown in Fig. 31.4(c) and the wake keeps on undulating up to a
Reynolds number of 90 .
At a Reynolds number above 90 , the eddies are shed alternately from a top and
bottom of the cylinder and the regular pattern of alternately shed clockwise and
counterclockwise vortices form Von Karman vortex street as in Fig. 31.4(d).
Periodicity is eventually induced in the flow field with the vortex-shedding phenomenon.
The periodicity is characterised by the frequency of vortex shedding
In non-dimensional form, the vortex shedding frequency is expressed as known as the Strouhal number named after V. Strouhal, a German physicist who experimented with wires singing in the wind. The Strouhal number shows a slight but continuous variation with Reynolds number around a value of 0.21. The boundary layer
on the cylinder surface remains laminar and separation takes placeat about 810 from the
forward stagnation point.
At about Re = 500 , multiple frequencies start showing up and the wake tends to
become Chaotic.
As the Reynolds number becomes higher, the boundary layer around the cylinder tends to
become turbulent. The wake, of course, shows fully turbulent characters (Fig31.4 (e)).

For larger Reynolds numbers, the boundary layer becomes turbulent. A turbulent boundary layer offers greater resistance to seperation than a laminar boundary layer. As a consequence the seperation point moves downstream and the seperation angle is delayed
to 1100
from the forward stagnation point (Fig 31.4 (f) ).
Fig. 31.4 Influence of Reynolds number on wake-zone aerodynamics
Experimental flow visualizations past a circular cylinder are shown in Figure 31.5 (a)
and (b)

Fig 31.5 (a) Flow Past a Cylinder at Re=2000 [Photograph courtesy Werle and Gallon
(ONERA)]
Fig 31.5 (b) Flow Past a Cylinder at Re=10000 [Photograph courtesy Thomas Corke and
Hasan Najib (Illinois Institute of Technology, Chicago)]
A very interesting sequence of events begins to develop when the Reynolds number is
increased beyond 40, at which point the wake behind the cylinder becomes unstable.
Photographs show that the wake develops a slow oscillation in which the velocity is
periodic in time and downstream distance. The amplitude of the oscillation increases
downstream. The oscillating wake rolls up into two staggered rows of vortices with
opposite sense of rotation.

Karman investigated the phenomenon and concluded that a nonstaggered row of vortices
is unstable, and a staggered row is stable only if the ratio of lateral distance between the
vortices to their longitudinal distance is 0.28. Because of the similarity of the wake with
footprints in a street, the staggered row of vortices behind a blue body is called a
Karman Vortex Street . The vortices move downstream at a speed smaller than the
upstream velocity U.
In the range 40 < Re < 80, the vortex street does not interact with the pair of attached
vortices. As Re is increased beyond 80 the vortex street forms closer to the cylinder, and
the attached eddies themselves begin to oscillate. Finally the attached eddies periodically
break off alternately from the two sides of the cylinder.
While an eddy on one side is shed, that on the other side forms, resulting in an unsteady
flow near the cylinder. As vortices of opposite circulations are shed off alternately from
the two sides, the circulation around the cylinder changes sign, resulting in an oscillating
"lift" or lateral force. If the frequency of vortex shedding is close to the natural frequency
of some mode of vibration of the cylinder body, then an appreciable lateral vibration
culminates.
Numerical flow visualizations for the flow past a circular cylinder can be observed in Fig
31.6 and 31.7
Fig 31.6 Numerical flow visualization (LES results) for a low reynolds number flow past a
Circular Cylinder
[Animation by Dr.-Ing M. Breuer, LSTM, Univ Erlangen-Nuremberg ]

Fig 31.7 Numerical flow visualization (LES results) for a moderately high reynolds number
flow past a Circular Cylinder
[Animation by Dr.-Ing M. Breuer, LSTM, Univ Erlangen-Nuremberg ]
An understanding of the transitional flow processes will help in practical problems either
by improving procedures for predicting positions or for determining methods of
advancing or retarding the transition position.
The critical value at which the transition occurs in pipe flow is . The
actual value depends upon the disturbance in flow. Some experiments have shown the
critical Reynolds number to reach as high as 10,000. The precise upper bound is not
known, but the lower bound appears to be . Below this value, the flow
remains laminar even when subjected to strong disturbances.
In the case of flow through a channel, , the flow alternates randomly between laminar and partially turbulent. Near the centerline, the flow is more laminar
than turbulent, whereas near the wall, the flow is more turbulent than laminar. For
flow over a flat plate, turbulent regime is observed between Reynolds numbers
of 3.5 × 10⁵
and 106.
Several Events Of Transition -
Transitional flow consists of several events as shown in Fig. 31.8. Let us consider the events one
after another.
1. Region of instability of small wavy disturbances-

Consider a laminar flow over a flat plate aligned with the flow direction (Fig. 31.8).
In the presence of an adverse pressure gradient, at a high Reynolds number (water
velocity approximately 9-cm/sec), two-dimensional waves appear.
These waves are called Tollmien-Schlichting wave( In 1929, Tollmien and Schlichting
predicted that the waves would form and grow in the boundary layer).
These waves can be made visible by a method known as tellurium method.
2. Three-dimensional waves and vortex formation-
Disturbances in the free stream or oscillations in the upstream boundary layer can
generate wave growth, which has a variation in the span wise direction.
This leads an initially two-dimensional wave to a three-dimensional form.
In many such transitional flows, periodicity is observed in the span wise direction.
This is accompanied by the appearance of vortices whose axes lie in the direction of flow.
3. Peak-Valley development with streamwise vortices-
As the three-dimensional wave propagates downstream, the boundary layer flow
develops into a complex stream wise vortex system.
Within this vortex system, at some spanwise location, the velocities fluctuate violently
.
These locations are called peaks and the neighbouring locations of the peaks are
valleys (Fig. 31.9).
4. Vorticity concentration and shear layer development-
At the spanwise locations corresponding to the peak, the instantaneous streamwise velocity
profiles demonstrate the following
Often, an inflexion is observed on the velocity profile.
The inflectional profile appears and disappears once after each cycle of the basic wave.
5. Breakdown-
The instantaneous velocity profiles produce high shear in the outer region of the boundary layer.
The velocity fluctuations develop from the shear layer at a higher frequency than that of
the basic wave.
These velocity fluctuations have a strong ability to amplify any slight three-
dimensionality, which is already present in the flow field.
As a result, a staggered vortex pattern evolves with the streamwise wavelength twice
the wavelength of Tollmien-Schlichting wavelength .
The span wise wavelength of these structures is about one-half of the stream wise value.
The high frequency fluctuations are referred as hairpin eddies.

This is known as breakdown.
6. Turbulent-spot development-
The hairpin-eddies travel at a speed grater than that of the basic (primary) waves.
As they travel downstream, eddies spread in the spanwise direction and towards the wall.
The vortices begin a cascading breakdown into smaller vortices.
In such a fluctuating state, intense local changes occur at random locations in the shear
layer near the wall in the form of turbulent spots.
Each spot grows almost linearly with the downstream distance.
The creation of spots is considered as the main event of transition .
Fig. 31.8 Sequence of event involved in transition
Fig. 31.9 Cross-stream view of the streamwise vortex system
Laminar-Turbulent Transition
For a turbulent flow over a flat plate,
The turbulent boundary layer continues to grow in thickness, with a small region below it
called a viscous sublayer. In this sub layer, the flow is well behaved,just as the laminar
boundary layer (Fig. 32.3)

Fig. 32.3 Laminar - turbulent transition
Illustration
Observe that at a certain axial location, the laminar boundary layer tends to become
unstable. Physically this means that the disturbances in the flow grow in amplitude at this
location.
Free stream turbulence, wall roughness and acoustic signals may be among the sources of such
disturbances. Transition to turbulent flow is thus initiated with the instability in laminar
flow

The possibility of instability in boundary layer was felt by Prandtl as early as 1912.The
theoretical analysis of Tollmien and Schlichting showed that unstable waves could exist
if the Reynolds number was 575.
The Reynolds number was defined as
where is the free stream velocity , is the displacement thickness and is the kinematic
viscosity .
Taylor developed an alternate theory, which assumed that the transition is caused by a
momentary separation at the boundary layer associated with the free stream turbulence.
In a pipe flow the initiation of turbulence is usually observed at Reynolds numbers (
)in the range of 2000 to 2700.
The development starts with a laminar profile, undergoes a transition, changes over to turbulent
profile and then stays turbulent thereafter (Fig. 32.4). The length of development is of the order
of 25 to 40 diameters of the pipe.
Fig. 32.4 Development of turbulent flow in a circular duct

7.13 Turbulent Flow in Circular Pipe:
Fully Developed Turbulent Flow In A Pipe For Moderate Reynolds Numbers
The entry length of a turbulent flow is much shorter than that of a laminar flow, J.
Nikuradse determined that a fully developed profile for turbulent flow can be observed
after an entry length of 25 to 40 diameters. We shall focus to fully developed turbulent
flow in this section.
Considering a fully developed turbulent pipe flow (Fig. 34.3) we can write
(34.18)
or
(34.19)
Fig. 34.3 Fully developed turbulent pipe flow
It can be said that in a fully developed flow, the pressure gradient balances the wall shear stress
only and has a constant value at any . However, the friction factor ( Darcy friction factor ) is
defined in a fully developed flow as
(34.20)
Comparing Eq.(34.19) with Eq.(34.20), we can write

(34.21)
H. Blasius conducted a critical survey of available experimental results and established the
empirical correlation for the above equation as
where (34.22)
It is found that the Blasius's formula is valid in the range of Reynolds number of Re ≤105.
At the time when Blasius compiled the experimental data, results for higher Reynolds numbers were not available. However, later on, J. Nikuradse carried out experiments with
the laws of friction in a very wide range of Reynolds numbers, 4 x 10³ ≤ Re ≤ 3.2 x 10
6.
The velocity profile in this range follows:
(34.23)
where is the time mean velocity at the pipe centre and is the distance from the wall . The
exponent n varies slightly with Reynolds number. In the range of Re ~ 105, n is
The ratio of and for the aforesaid profile is found out by considering the volume
flow rate Q as
From equation (34.23)
or

or
or
or
(34.24a)
Now, for different values of n (for different Reynolds numbers) we shall obtain different
values of from Eq.(34.24a). On substitution of Blasius resistance formula (34.22)
in Eq.(34.21), the following expression for the shear stress at the wall can be obtained.
putting
and where
or
or

For n=7, becomes equal to 0.8. substituting in the above equation,
we get
Finally it produces
(34.24b)
or
where is friction velocity. However, may be spitted into and and we obtain
or
(34.25a)
Now we can assume that the above equation is not only valid at the pipe axis (y = R)
but also at any distance from the wall y and a general form is proposed as
(34.25b)
Concluding Remarks :
1. It can be said that (1/7)th power velocity distribution law (24.38b) can be derived from
Blasius's resistance formula (34.22) .
2. Equation (34.24b) gives the shear stress relationship in pipe flow at a moderate Reynolds
number, i.e . Unlike very high Reynolds number flow, here laminar effect

cannot be neglected and the laminar sub layer brings about remarkable influence on the
outer zones.
3. The friction factor for pipe flows, , defined by Eq. (34.22) is valid for a specific range
of Reynolds number and for a particular surface condition.

Chapter 8
Introduction to Incompressible Boundary Layer
8.1 Boundary Layer Concept:
Introduction
The boundary layer of a flowing fluid is the thin layer close to the wall
In a flow field, viscous stresses are very prominent within this layer.
Although the layer is thin, it is very important to know the details of flow within it.
The main-flow velocity within this layer tends to zero while approaching the wall (no-
slip condition).
Also the gradient of this velocity component in a direction normal to the surface is large
as compared to the gradient in the streamwise direction.
8.2 Boundary Layer Properties:
Boundary Layer Equations
In 1904, Ludwig Prandtl, the well known German scientist, introduced the concept of
boundary layer and derived the equations for boundary layer flow by correct reduction
of Navier-Stokes equations.
He hypothesized that for fluids having relatively small viscosity, the effect of internal
friction in the fluid is significant only in a narrow region surrounding solid
boundaries or bodies over which the fluid flows.
Thus, close to the body is the boundary layer where shear stresses exert an increasingly
larger effect on the fluid as one moves from free stream towards the solid boundary.
However, outside the boundary layer where the effect of the shear stresses on the
flow is small compared to values inside the boundary layer (since the velocity
gradient is negligible),---------
1. the fluid particles experience no vorticity and therefore,
2. the flow is similar to a potential flow.
Hence, the surface at the boundary layer interface is a rather fictitious one, that
divides rotational and irrotational flow. Fig 28.1 shows Prandtl's model regarding
boundary layer flow.
Hence with the exception of the immediate vicinity of the surface, the flow is frictionless
(inviscid) and the velocity is U (the potential velocity).

In the region, very near to the surface (in the thin layer), there is friction in the flow
which signifies that the fluid is retarded until it adheres to the surface (no-slip
condition).
The transition of the mainstream velocity from zero at the surface (with respect to the
surface) to full magnitude takes place across the boundary layer.
About the boundary layer
Boundary layer thickness is which is a function of the coordinate direction x .
The thickness is considered to be very small compared to the characteristic length L
of the domain.
In the normal direction, within this thin layer, the gradient is very
large compared to the gradient in the flow direction .
Now we take up the Navier-Stokes equations for : steady, two dimensional, laminar,
incompressible flows.
Considering the Navier-Stokes equations together with the equation of continuity, the following
dimensional form is obtained.
(28.1)
(28.2)
(28.3)
Fig 28.1 Boundary layer and Free Stream for Flow Over a flat plate

u - velocity component along x direction.
v - velocity component along y direction
p - static pressure
ρ - density.
μ - dynamic viscosity of the fluid
The equations are now non-dimensionalised.
The length and the velocity scales are chosen as L and respectively.
The non-dimensional variables are:
where is the dimensional free stream velocity and the pressure is non-
dimensionalised by twice the dynamic pressure .
Using these non-dimensional variables, the Eqs (28.1) to (28.3) become
where the Reynolds number,
(28.4)
(28.5)
(28.6)

8.3 Derivation of Prandtl Bounday Layer Equation:
Order of Magnitude Analysis
Let us examine what happens to the u velocity as we go across the boundary layer.
At the wall the u velocity is zero [ with respect to the wall and absolute zero for a
stationary wall (which is normally implied if not stated otherwise)].
The value of u on the inviscid side, that is on the free stream side beyond the boundary
layer is U.
For the case of external flow over a flat plate, this U is equal to .
Based on the above, we can identify the following scales for the boundary layer
variables:
Variable Dimensional scale Non-dimensional scale
The symbol describes a value much smaller than 1.
Now we analyse equations 28.4 - 28.6, and look at the order of magnitude of each
individual term
Eq 28.6 - the continuity equation
One general rule of incompressible fluid mechanics is that we are not allowed to drop any
term from the continuity equation.
From the scales of boundary layer variables, the derivative is of the order 1.
The second term in the continuity equation should also be of the order
1.The reason being has to be of the order because becomes at its
maximum.
Eq 28.4 - x direction momentum equation
Inertia terms are of the order 1.
is of the order 1
is of the order .

However after multiplication with 1/Re, the sum of the two second order derivatives should
produce at least one term which is of the same order of magnitude as the inertia terms. This is
possible only if the Reynolds number (Re) is of the order of .
It follows from that will not exceed the order of 1 so as to be in balance with
the remaining term.
Finally, Eqs (28.4), (28.5) and (28.6) can be rewritten as
(28.4)
(28.5)
(28.6)
As a consequence of the order of magnitude analysis, can be dropped from the
x direction momentum equation, because on multiplication with it assumes the
smallest order of magnitude.
Eq 28.5 - y direction momentum equation.
All the terms of this equation are of a smaller magnitude than those of Eq. (28.4).

This equation can only be balanced if is of the same order of magnitude as
other terms.
Thus they momentum equation reduces to
(28.7)
This means that the pressure across the boundary layer does not change. The
pressure is impressed on the boundary layer, and its value is determined by
hydrodynamic considerations.
This also implies that the pressure p is only a function of x. The pressure forces on a
body are solely determined by the inviscid flow outside the boundary layer.
The application of Eq. (28.4) at the outer edge of boundary layer gives
(28.8a)
In dimensional form, this can be written as
On integrating Eq ( 28.8b) the well known Bernoulli's equation is obtained
a constant
(28.8b)
(28.9)
Finally, it can be said that by the order of magnitude analysis, the Navier-Stokes
equations are simplified into equations given below.
(28.10)

(28.11)
(28.12)
These are known as Prandtl's boundary-layer equations.
The available boundary conditions are:
Solid surface
or (28.13)
Outer edge of boundary-layer
or
(28.14)
The unknown pressure p in the x-momentum equation can be determined from
Bernoulli's Eq. (28.9), if the inviscid velocity distribution U(x) is also known.
We solve the Prandtl boundary layer equations for and with U obtained from
the outer inviscid flow analysis. The equations are solved by commencing at the leading edge of
the body and moving downstream to the desired location
it allows the no-slip boundary condition to be satisfied which constitutes a significant
improvement over the potential flow analysis while solving real fluid flow problems.
The Prandtl boundary layer equations are thus a simplification of the Navier-Stokes
equations.

8.4 Blasius Solution:
Blasius Flow Over A Flat Plate
The classical problem considered by H. Blasius was
1. Two-dimensional, steady, incompressible flow over a flat plate at zero angle of
incidence with respect to the uniform stream of velocity .
2. The fluid extends to infinity in all directions from the plate.
The physical problem is already illustrated in Fig. 28.1
Blasius wanted to determine
(a) the velocity field solely within the boundary layer,
(b) the boundary layer thickness ,
(c) the shear stress distribution on the plate, and (d) the drag force on the plate.
The Prandtl boundary layer equations in the case under consideration are
The boundary conditions are
(28.15)
(28.16)
Note that the substitution of the term in the original boundary layer momentum
equation in terms of the free stream velocity produces which is equal to zero.
Hence the governing Eq. (28.15) does not contain any pressure-gradient term.

However, the characteristic parameters of this problem are that is,
This relation has five variables .
It involves two dimensions, length and time.
Thus it can be reduced to a dimensionless relation in terms of (5-2) =3 quantities (
Buckingham Pi Theorem)
Thus a similarity variables can be used to find the solution
Such flow fields are called self-similar flow field .
Law of Similarity for Boundary Layer Flows
It states that the u component of velocity with two velocity profiles of u(x,y) at
different x locations differ only by scale factors in u and y .
Therefore, the velocity profiles u(x,y) at all values of x can be made congruent
if they are plotted in coordinates which have been made dimensionless with
reference to the scale factors.
The local free stream velocity U(x) at section x is an obvious scale factor for u,
because the dimensionless u(x) varies between zero and unity with y at all
sections.
The scale factor for y , denoted by g(x) , is proportional to the local boundary
layer thickness so that y itself varies between zero and unity.
Velocity at two arbitrary x locations, namely x1 and x2 should satisfy the
equation
(28.17)
Now, for Blasius flow, it is possible to identify g(x) with the boundary layers
thickness δ we know
Thus in terms of x we get

i.e.,
where
or more precisely,
(28.18)
(28.19)
The stream function can now be obtained in terms of the velocity components as
or
(28.20)
where D is a constant. Also and the constant of integration is zero if

the stream function at the solid surface is set equal to zero.
Now, the velocity components and their derivatives are:
or
(28.21a)
(28.21b)
(28.21c)
(28.21d)
(28.21e)

Substituting (28.2) into (28.15), we have
or,
where
and
(28.22)
This is known as Blasius Equation .

8.5 Karmans Integral Equation:
Momentum-Integral Equations For The Boundary Layer
To employ boundary layer concepts in real engineering designs, we need approximate
methods that would quickly lead to an answer even if the accuracy is somewhat less.
Karman and Pohlhausen devised a simplified method by satisfying only the boundary
conditions of the boundary layer flow rather than satisfying Prandtl's differential
equations for each and every particle within the boundary layer. We shall discuss this
method herein.
Consider the case of steady, two-dimensional and incompressible flow, i.e. we shall refer
to Eqs (28.10) to (28.14). Upon integrating the dimensional form of Eq. (28.10) with
respect to y = 0 (wall) to y = δ (where δ signifies the interface of the free stream and the
boundary layer), we obtain
(29.10)
or,
The second term of the left hand side can be expanded as
or, by continuity equation
(29.11) or,

Substituting Eq. (29.11) in Eq. (29.10) we obtain
(29.12)
Substituting the relation between and the free stream velocity for the inviscid
zone in Eq. (29.12) we get
which is reduced to
Since the integrals vanish outside the boundary layer, we are allowed to increase the
integration limit to infinity (i.e . )
(29.13) or,
Substituting Eq. (29.6) and (29.7) in Eq. (29.13) we obtain

(29.14)
where is the displacement
thickness is momentum thickness
Equation (29.14) is known as momentum integral equation for two dimensional
incompressible laminar boundary layer. The same remains valid for turbulent boundary layers
as well.
Needless to say, the wall shear stress will be different for laminar and turbulent flows.
The term signifies space-wise acceleration of the free stream. Existence of this
term means that free stream pressure gradient is present in the flow direction.
For example, we get finite value of outside the boundary layer in the entrance
region of a pipe or a channel. For external flows, the existence of depends on
the shape of the body.
During the flow over a flat plate, and the momentum integral equation is
reduced to
(29.15)
Karman-Pohlhausen Approximate Method For Solution Of Momentum Integral Equation
Over A Flat Plate
The basic equation for this method is obtained by integrating the x direction momentum
equation (boundary layer momentum equation) with respect to y from the wall (at y = 0)
to a distance which is assumed to be outside the boundary layer. Using this
notation, we can rewrite the Karman momentum integral equation as

(30.1)
The effect of pressure gradient is described by the second term on the left hand side. For
pressure gradient surfaces in external flow or for the developing sections in internal flow,
this term contributes to the pressure gradient.
We assume a velocity profile which is a polynomial of . being a form of
similarity variable , implies that with the growth of boundary layer as distance x
varies from the leading edge, the velocity profile remains geometrically
similar.
We choose a velocity profile in the form
(30.2)
In order to determine the constants we shall prescribe the
following boundary conditions
(30.3a)
(30.3b)
at
at
(30.3c)
(30.3d)
These requirements will yield respectively
Finally, we obtain the following values for the coefficients in Eq. (30.2),
and the velocity profile becomes

(30.4)
For flow over a flat plate, and the governing Eq. (30.1)
reduces to
(30.5)
Again from Eq. (29.8), the momentum thickness is
The wall shear stress is given by
Substituting the values of and in Eq. (30.5) we get,

where C1 is any arbitrary unknown constant.
The condition at the leading edge ) yields
Finally we obtain,
(30.6)
(30.7)
(30.8)
This is the value of boundary layer thickness on a flat plate. Although, the method is an
approximate one, the result is found to be reasonably accurate. The value is slightly lower
than the exact solution of laminar flow over a flat plate . As such, the accuracy depends
on the order of the velocity profile. We could have have used a fourth order polynomial
instead --
(30.9)
In addition to the boundary conditions in Eq. (30.3), we shall require another boundary
condition at
This yields the constants as .
Finally the velocity profile will be

Subsequently, for a fourth order profile the growth of boundary layer is given by
(30.10)
8.6 Turbulent Boundary Layer over Flat Plate:
Derivation of Governing Equations for Turbulent Flow
For incompressible flows, the Navier-Stokes equations can be rearranged in
the form
(33.1a)
(33.1b)
(33.1c)
and
or,
(33.2)
Express the velocity components and pressure in terms of time-mean values and
corresponding fluctuations. In continuity equation, this substitution and
subsequent time averaging will lead to

Since,
We can write
(33.3a)
From Eqs (33.3a) and (33.2), we obtain
(33.3b)
It is evident that the time-averaged velocity components and the fluctuating
velocity components, each satisfy the continuity equation for incompressible
flow.
Imagine a two-dimensional flow in which the turbulent components are
independent of the z -direction. Eventually, Eq.(33.3b) tends to
(33.4)
On the basis of condition (33.4), it is postulated that if at an instant there is an increase
in u' in the x -direction, it will be followed by an increase in v' in the negative y -
direction. In other words, is non-zero and negative. (see Figure 33.2)
Fig 33.2 Each dot represents uν pair at an instant
Invoking the concepts of eqn. (32.8) into the equations of motion eqn (33.1 a, b,

c), we obtain expressions in terms of mean and fluctuating components. Now,
forming time averages and considering the rules of averaging we discern the
following. The terms which are linear, such as and vanish when they
are averaged [from (32.6)]. The same is true for the mixed terms like , or
, but the quadratic terms in the fluctuating components remain in the
equations. After averaging, they form , etc.
If we perform the aforesaid exercise on the x-momentum equation, we obtain
using rules of time averages,
We obtain
Introducing simplifications arising out of continuity Eq. (33.3a), we shall obtain.

Performing a similar treatment on y and z momentum equations, finally we obtain the
momentum equations in the form.
In x direction,
(33.5a)
In y direction,
(33.5b)
In z direction,
(33.5c)
Comments on the governing equation :
1. The left hand side of Eqs (33.5a)-(33.5c) are essentially similar to the steady-state
Navier-Stokes equations if the velocity components u, v and w are replaced by ,
and . 2. The same argument holds good for the first two terms on the right hand side of
Eqs (33.5a)-(33.5c).
3. However, the equations contain some additional terms which depend on turbulent
fluctuations of the stream. These additional terms can be interpreted as
components of a stress tensor.
Now, the resultant surface force per unit area due to these terms may be considered as
In x direction,
(33.6a)
In y direction,
(33.6b)
In z direction,

(33.6c)
Comparing Eqs (33.5) and (33.6), we can write
(33.7)
It can be said that the mean velocity components of turbulent flow satisfy the same
Navier-Stokes equations of laminar flow. However, for the turbulent flow, the laminar
stresses must be increased by additional stresses which are given by the stress tensor
(33.7). These additional stresses are known as apparent stresses of turbulent flow or
Reynolds stresses . Since turbulence is considered as eddying motion and the aforesaid
additional stresses are added to the viscous stresses due to mean motion in order to
explain the complete stress field, it is often said that the apparent stresses are caused by
eddy viscosity . The total stresses are now
(33.8)
and so on. The apparent stresses are much larger than the viscous components, and the viscous
stresses can even be dropped in many actual calculations.
Turbulent Boundary Layer Equations
For a two-dimensional flow (w = 0)over a flat plate, the thickness of turbulent boundary
layer is assumed to be much smaller than the axial length and the order of magnitude
analysis may be applied. As a consequence, the following inferences are drawn:

volume
is
The turbulent boundary layer equation together with the equation of continuity becomes
(33.9)
(33.10)
A comparison of Eq. (33.10) with laminar boundary layer Eq. (23.10) depicts that: u, v
and p are replaced by the time average values and ,and laminar viscous force per
unit
and
is replaced by where is the laminar shear stress
the turbulent shear stress.
Boundary Conditions
All the components of apparent stresses vanish at the solid walls and only stresses which
act near the wall are the viscous stresses of laminar flow. The boundary conditions, to be
satisfied by the mean velocity components, are similar to laminar flow.
A very thin layer next to the wall behaves like a near wall region of the laminar flow.
This layer is known as laminar sublayer and its velocities are such that the viscous

forces dominate over the inertia forces. No turbulence exists in it (see Fig. 33.3).
For a developed turbulent flow over a flat plate, in the near wall region, inertial effects
are insignificant, and we can write from Eq.33.10,
Fig 33.3 Different zones of a turbulent flow past a wall
which can be integrated as , =constant
We know that the fluctuating components, do not exist near the wall, the shear stress on
the wall is purely viscous and it follows
However, the wall shear stress in the vicinity ofthe laminar sublayer is estimated as
(33.11a)
where Us is the fluid velocity at the edge of the sublayer. The flow in the sublayer is specified by
a velocity scale (characteristic of this region).
We define the friction velocity,

(33.11b)
as our velocity scale. Once is specified, the structure of the sub layer is specified. It has been
confirmed experimentally that the turbulent intensity distributions are scaled with . For
example, maximum value of the is always about . The relationship between and the
can be determined from Eqs (33.11a) and (33.11b) as
Let us assume . Now we can write
(33.12a)
where is a proportionality constant
or
(33.12b)
Hence, a non-dimensional coordinate may be defined as, which will help us estimating
different zones in a turbulent flow. The thickness of laminar sublayer or viscous sublayer is
considered to be .
Turbulent effect starts in the zone of and in a zone of , laminar and turbulent
motions coexist. This domain is termed as buffer zone. Turbulent effects far outweight the
laminar effect in the zone beyond and this regime is termed as turbulent core .
For flow over a flat plate, the turbulent shear stress ( ) is constant throughout in
the y direction and this becomes equal to at the wall. In the event of flow through a
channel, the turbulent shear stress ( ) varies with y and it is possible to write

(33.12c)
where the channel is assumed to have a height 2h and is the distance measured from the
centreline of the channel . Figure 33.1 explains such variation of turbulent stress.
Shear Stress Models
In analogy with the coefficient of viscosity for laminar flow, J. Boussinesq introduced a
mixing coefficient for the Reynolds stress term, defined as
Using the shearing stresses can be written as
such that the equation
may be written as
(33.13)
The term νt is known as eddy viscosity and the model is known as eddy viscosity model .
Unfortunately the value of νt is not known. The term ν is a property of the fluid whereas
νt is attributed to random fluctuations and is not a property of the fluid. However, it is
necessary to find out empirical relations between νt, and the mean velocity. The following
section discusses relation between the aforesaid apparent or eddy viscosity and the mean velocity components
Prandtl's Mixing Length Hypothesis
Consider a fully developed turbulent boundary layer . The stream wise mean velocity
varies only from streamline to streamline. The main flow direction is assumed parallel to

the x-axis (Fig. 33.4).
The time average components of velocity are given by . The
fluctuating component of transverse velocity transports mass and momentum across a
plane at y1 from the wall. The shear stress due to the fluctuation is given by
(33.14)
Fluid, which comes to the layer y1 from a layer (y1- l) has a positive value of . If the
lump of fluid retains its original momentum then its velocity at its current location y1 is
smaller than the velocity prevailing there. The difference in velocities is then
(33.15)
Fig. 33.4 One-dimensional parallel flow and Prandtl's mixing length hypothesis
The above expression is obtained by expanding the function in a Taylor series and
neglecting all higher order terms and higher order derivatives. l is a small length scale known as
Prandtl's mixing length . Prandtl proposed that the transverse displacement of any fluid particle
is, on an average, 'l' .
Consider another lump of fluid with a negative value of . This is arriving at from
. If this lump retains its original momentum, its mean velocity at the current

lamina will be somewhat more than the original mean velocity of . This difference is
given by
(33.16)
The velocity differences caused by the transverse motion can be regarded as the turbulent
velocity components at .
We calculate the time average of the absolute value of this fluctuation as
(33.17)
Suppose these two lumps of fluid meet at a layer The lumps will collide with a velocity
and diverge. This proposes the possible existence of transverse velocity component
in both directions with respect to the layer at . Now, suppose that the two lumps move
away in a reverse order from the layer with a velocity . The empty space will
be filled from the surrounding fluid creating transverse velocity components which
will again collide at . Keeping in mind this argument and the
physical explanation accompanying Eqs (33.4), we may state that
or,
along with the condition that the moment at which is positive, is more likely to be
negative and conversely when is negative. Possibly, we can write at this stage

(33.18)
where C1 and C2 are different proportionality constants. However, the constant C2 can now be
included in still unknown mixing length and Eg. (33.18) may be rewritten as
For the expression of turbulent shearing stress we may write
(33.19)
After comparing this expression with the eddy viscosity Eg. (33.14), we may arrive at a
more precise definition,
(33.20a)
where the apparent viscosity may be expressed as

(33.20b)
and the apparent kinematic viscosity is given by
(33.20c)
The decision of expressing one of the velocity gradients of Eq. (33.19) in terms of its
modulus as was made in order to assign a sign to according to the sign of
. Note that the apparent viscosity and consequently,the mixing length are not properties of
fluid. They are dependent on turbulent fluctuation.
But how to determine the value of the mixing length? Several correlations, using
experimental results for have been proposed to determine .
However, so far the most widely used value of mixing length in the regime of isotropic
turbulence is given by
(33.21)
where is the distance from the wall and is known as von Karman constant .

8.7 Skin Friction Drag:
Wall Shear Stress
With the profile known, wall shear can be evaluated as
Now,
or
or
from Table 28.1
(29.1a)
(Wall Shear Stress)
and the local skin friction coefficient is
Substituting from (29.1a) we get
(29.1b)
(Skin Friction Coefficient)

In 1951, Liepmann and Dhawan , measured the shearing stress on a flat plate directly.
Their results showed a striking confirmation of Eq. (29.1).
Total frictional force per unit width for the plate of length L is
or
or
(29.2)
and the average skin friction coefficient is
(29.3)
where, .
For a flat plate of length L in the streamwise direction and width w perpendicular to the flow,
the Drag D would be
(29.4)

8.8 Boundary Layer Control:
Seperation of Boundary Layer
It has been observed that the flow is reversed at the vicinity of the wall under certain
conditions.
The phenomenon is termed as separation of boundary layer.
Separation takes place due to excessive momentum loss near the wall in a boundary
layer trying to move downstream against increasing pressure, i.e., , which
is called adverse pressure gradient.
Figure 29.2 shows the flow past a circular cylinder, in an infinite medium.
1. Up to , the flow area is like a constricted passage and the flow
behaviour is like that of a nozzle.
2. Beyond the flow area is diverged, therefore, the flow behaviour is much
similar to a diffuser
This dictates the inviscid pressure distribution on the cylinder which is shown by a firm
line in Fig. 29.2.
Here
: pressure in the free stream
: velocity in the free stream and
: is the local pressure on the cylinder.

Fig. 29.2 Flow separation and formation of wake behind a circular cylinder
Consider the forces in the flow field.
In the inviscid region,
1. Until the pressure force and the force due to streamwise acceleration
i.e. inertia forces are acting in the same direction (pressure gradient being
negative/favourable)
2. Beyond , the pressure gradient is positive or adverse. Due to the
adverse pressure gradient the pressure force and the force due to acceleration will
be opposing each other in the in viscid zone of this part.
So long as no viscous effect is considered, the situation does not cause any sensation.
In the viscid region (near the solid boundary),
1. Up to , the viscous force opposes the combined pressure force and the
force due to acceleration. Fluid particles overcome this viscous resistance due to
continuous conversion of pressure force into kinetic energy.

2. Beyond , within the viscous zone, the flow structure becomes different. It
is seen that the force due to acceleration is opposed by both the viscous force and
pressure force.
Depending upon the magnitude of adverse pressure gradient, somewhere around
, the fluid particles, in the boundary layer are separated from the wall and
driven in the upstream direction. However, the far field external stream pushes back these
separated layers together with it and develops a broad pulsating wake behind the
cylinder.
The mathematical explanation of flow-separation : The point of separation may be
defined as the limit between forward and reverse flow in the layer very close to the wall,
i.e., at the point of separation
(29.16)
This means that the shear stress at the wall, . But at this point, the adverse
pressure continues to exist and at the downstream of this point the flow acts in a reverse
direction resulting in a back flow.
We can also explain flow separation using the argument about the second derivative of
velocity u at the wall. From the dimensional form of the momentum at the wall, where u
= v = 0, we can write
(29.17)
Consider the situation due to a favourable pressure gradient where we
have, 1. . (From Eq. (29.17))
2. As we proceed towards the free stream, the velocity u approaches
asymptotically, so decreases at a continuously lesser rate in y direction.
3. This means that remains less than zero near the edge of the boundary
layer.
4. The curvature of a velocity profile is always negative as shown in (Fig.
29.3a)

Consider the case of adverse pressure gradient,
1. At the boundary, the curvature of the profile must be positive (since ).
2. Near the interface of boundary layer and free stream the previous argument
regarding and still holds good and the curvature is
negative.
3. Thus we observe that for an adverse pressure gradient, there must exist a point
for which . This point is known as point of inflection of the
velocity profile in the boundary layer as shown in Fig. 29.3b
4. However, point of separation means at the wall.
5. at the wall since separation can only occur due to adverse
pressure gradient. But we have already seen that at the edge of the boundary
layer,
. It is therefore, clear that if there is a point of separation, there
must exist a point of inflection in the velocity profile.
Fig. 29.3 Velocity distribution within a boundary layer

(a) Favourable pressure gradient,
(b) adverse pressure gradient,
1. Let us reconsider the flow past a circular cylinder and continue our discussion on the
wake behind a cylinder. The pressure distribution which was shown by the firm line in
Fig. 21.5 is obtained from the potential flow theory. However. somewhere near
(in experiments it has been observed to be at ) . the boundary layer detaches
itself from the wall.
2. Meanwhile, pressure in the wake remains close to separation-point-pressure since the
eddies (formed as a consequence of the retarded layers being carried together with the
upper layer through the action of shear) cannot convert rotational kinetic energy into
pressure head. The actual pressure distribution is shown by the dotted line in Fig. 29.3.
3. Since the wake zone pressure is less than that of the forward stagnation point
(pressure at point A in Fig. 29.3), the cylinder experiences a drag force which is basically
attributed to the pressure difference.
The drag force, brought about by the pressure difference is known as form drag
whereas the shear stress at the wall gives rise to skin friction drag. Generally, these
two drag forces together are responsible for resultant drag on a body
Control Of Boundary Layer Separation -
The total drag on a body is attributed to form drag and skin friction drag. In some flow
configurations, the contribution of form drag becomes significant.
In order to reduce the form drag, the boundary layer separation should be prevented
or delayed so that better pressure recovery takes place and the form drag is reduced
considerably. There are some popular methods for this purpose which are stated as
follows.
i. By giving the profile of the body a streamlined shape( as shown in Fig. 31.2).
1. This has an elongated shape in the rear part to reduce the magnitude of the
pressure gradient.
2. The optimum contour for a streamlined body is the one for which the
wake zone is very narrow and the form drag is minimum.

Fig. 31.2 Reduction of drag coefficient (CD) by giving the profile a streamlined
shape
ii. The injection of fluid through porous wall can also control the boundary
layer separation. This is generally accomplished by blowing high energy fluid
particles tangentially from the location where separation would have taken place
otherwise. This is shown in Fig. 31.3.
1. The injection of fluid promotes turbulence
2. This increases skin friction. But the form drag is reduced considerably
due to suppression of flow separation
3. The reduction in form drag is quite significant and increase in skin
friction drag can be ignored.
Fig. 31.3 Boundary layer control by blowing

Chapter 9
Dimensional Analysis and Similitude
9.1 Buckingham’s Theorem:
The Application of Dynamic Similarity - The Dimensional Analysis
The concept:
A physical problem may be characterised by a group of dimensionless similarity parameters or
variables rather than by the original dimensional variables.
This gives a clue to the reduction in the number of parameters requiring separate consideration
in an experimental investigation.
For an example, if the Reynolds number Re = ρV Dh /µ is considered as the independent
variable, in case of a flow of fluid through a closed duct of hydraulic diameter Dh, then a change
in Re may be caused through a change in flow velocity V only. Thus a range of Re can be
covered simply by the variation in V without varying other independent dimensional variables
ρ,Dh and µ.
In fact, the variation in the Reynolds number physically implies the variation in any of the
dimensional parameters defining it, though the change in Re, may be obtained through the
variation in anyone parameter, say the velocity V.
A number of such dimensionless parameters in relation to dynamic similarity are shown in
Table 5.1. Sometimes it becomes diffcult to derive these parameters straight forward from an
estimation of the representative order of magnitudes of the forces involved. An alternative
method of determining these dimensionless parameters by a mathematical technique is
known as dimensional analysis .
The Technique:
The requirement of dimensional homogeneity imposes conditions on the quantities involved in a
physical problem, and these restrictions, placed in the form of an algebraic function by the
requirement of dimensional homogeneity, play the central role in dimensional analysis.
There are two existing approaches;
one due to Buckingham known as Buckingham's pi theorem
other due to Rayleigh known as Rayleigh's Indicial method
In our next slides we'll see few examples of the dimensions of physical quantities.

Dimensions of Physical Quantities
All physical quantities are expressed by magnitudes and units.
For example , the velocity and acceleration of a fluid particle are 8m/s and 10m/s2
respectively.
Here the dimensions of velocity and acceleration are ms-1
and ms-2
respectively.
In SI (System International) units, the primary physical quantities which are assigned base
dimensions are the mass, length, time, temperature, current and luminous intensity. Of
these, the first four are used in fluid mechanics and they are symbolized as M (mass), L
(length), T (time), and θ (temperature).
Any physical quantity can be expressed in terms of these primary quantities by using the
basic mathematical definition of the quantity.
The resulting expression is known as the dimension of the quantity.
Let us take some examples:
1. Dimension of Stress
Shear stress is defined as force/area. Again, force = mass × acceleration
Dimensions of acceleration = Dimensions of velocity/Dimension of time.
Dimension of area = (Length)2
=L2
Hence, dimension of shear stress
(19.1)
2. Dimension of Viscosity
Consider Newton's law for the definition of viscosity as
or,

The dimension of velocity gradient du/dy can be written as dimension of du/dy= dimension
of u/dimension of y = (L / T)/L = T -1
The dimension of shear stress is given in Eq. (19.1).
Hence dimension of
Dimensions of Various Physical Quantities in Tabular Format
Physical Quantity Dimension
Mass M
Length L
Time T
Temperature θ
Velocity LT -1
Angular velocity T -1
Acceleration LT -2
Angular Acceleration T -2
Force, Thrust, Weight MLT -2

Buckingham's Pi Theorem
Assume, a physical phenomenon is described by m number of independent variables like x1 ,
x2 , x3 , ..., xm
The phenomenon may be expressed analytically by an implicit functional relationship of the
Stress, Pressure ML -1
T -2
Momentum MLT -1
Angular Momentum ML2T
-1
Moment, Torque ML2T
-2
Work, Energy ML2T
-2
Power ML2T
-3
Stream Function L2T
-1
Vorticity, Shear Rate T -1
Velocity Potential L2T
-1
Density ML-3
Coefficient of Dynamic Viscosity ML -1
T -1
Coefficient of Kinematic Viscosity L2T
-1
Surface Tension MT -2
Bulk Modulus of Elasticity ML -1
T -2

controlling variables as
(19.2)
Now if n be the number of fundamental dimensions like mass, length, time, temperature etc
., involved in these m variables, then according to Buckingham's p theorem -
The phenomenon can be described in terms of (m - n) independent dimensionless groups
like π1 ,π2 , ..., πm-n , where p terms, represent the dimensionless parameters and consist of
different combinations of a number of dimensional variables out of the m independent variables
defining the problem.
Therefore. the analytical version of the phenomenon given by Eq. (19.2) can be reduced to
(19.3)
according to Buckingham's pi theorem
This physically implies that the phenomenon which is basically described by m
independent dimensional variables, is ultimately controlled by (m-n) independent
dimensionless parameters known as π terms.
Alternative Mathematical Description of (π) Pi Theorem
A physical problem described by m number of variables involving n number of fundamental
dimensions (n < m) leads to a system of n linear algebraic equations with m variables of the form
or in a matrix form,
...................................................
(19.4)
(click the equation to follow hyperlink) (19.5)

where,
9.2 Non Dimensional Groups:
and
Determination of π terms
A group of n (n = number of fundamental dimensions) variables out of m (m = total
number of independent variables defining the problem) variables is first chosen to form a
basis so that all n dimensions are represented . These n variables are referred to as
repeating variables.
Then the p terms are formed by the product of these repeating variables raised to arbitrary
unknown integer exponents and anyone of the excluded (m -n) variables.
For example , if x1 x2 ...xn are taken as the repeating variables. Then
The sets of integer exponents a1, a2 . . . an are different for each p term.
Since p terms are dimensionless, it requires that when all the variables in any p term are
expressed in terms of their fundamental dimensions, the exponent of all the fundamental
dimensions must be zero.
...................................

This leads to a system of n linear equations in a, a2 . . . an which gives a unique solution
for the exponents. This gives the values of a1 a2 . . . an for each p term and hence the p
terms are uniquely defined.
In selecting the repeating variables, the following points have to be considered:
1. The repeating variables must include among them all the n fundamental dimensions, not
necessarily in each one but collectively.
2. The dependent variable or the output parameter of the physical phenomenon should not
be included in the repeating variables.
No physical phenomena is represented when -
m < n because there is no solution and
m = n because there is a unique solution of the variables involved and hence all the
parameters have fixed values.
. Therefore all feasible phenomena are defined with m > n .
When m = n + 1, then, according to the Pi theorem, the number of pi term is one and the
phenomenon can be expressed as
where, the non-dimensional term π1 is some specific combination of n + 1 variables involved in
the problem.
When m > n+ 1 ,
1. the number of π terms are more than one.
2. A number of choices regarding the repeating variables arise in this case.
Again, it is true that if one of the repeating variables is changed, it results in a different set of π
terms. Therefore the interesting question is which set of repeating variables is to be chosen , to
arrive at the correct set of π terms to describe the problem. The answer to this question lies in
the fact that different sets of π terms resulting from the use of different sets of repeating
variables are not independent. Thus, anyone of such interdependent sets is meaningful in
describing the same physical phenomenon.
From any set of such π terms, one can obtain the other meaningful sets from some combination
of the π terms of the existing set without altering their total numbers (m-n) as fixed by the Pi
theorem.

9.3 Geometric, Kinematic and Dynamic Similarity:
Principles of Physical Similarity - An Introduction
Laboratory tests are usually carried out under altered conditions of the operating variables from
the actual ones in practice. These variables, in case of experiments relating to fluid flow, are
pressure, velocity, geometry of the working systems and the physical properties of the working
fluid.
The pertinent questions arising out of this situation are:
Answer of the above two questions lies in the principle of physical similarity. This principle is
useful for the following cases:
Concept and Types of Physical Similarity
The primary and fundamental requirement for the physical similarity between two problems is
that the physics of the problems must be the same.
For an example, two flows: one governed by viscous and pressure forces while the other by
gravity force cannot be made physically similar. Therefore, the laws of similarity have to be
sought between problems described by the same physics.
1. How to apply the test results from laboratory experiments to the
actual problems?
2. Is it possible, to reduce the large number of experiments to a
lesser one in achieving the same objective?
1. To apply the results taken from tests under one set of conditions
to another set of conditions
and
2. To predict the influences of a large number of independent
operating variables on the performance of a system from an
experiment with a limited number of operating variables.

Definition of physical similarity as a general proposition.
Two systems, described by the same physics, operating under different sets of conditions are said
to be physically similar in respect of certain specified physical quantities; when the ratio of
corresponding magnitudes of these quantities between the two systems is the same everywhere.
In the field of mechanics, there are three types of similarities which constitute the complete
similarity between problems of same kind.
Geometric Similarity : If the specified physical quantities are geometrical dimensions, the
similarity is called Geometric Similarty,
Kinematic Similarity : If the quantities are related to motions, the similarity is called Kinematic
Similarity
Dynamic Similarity : If the quantities refer to forces, then the similarity is termed as Dynamic
Similarity.
Geometric Similarity
Geometric Similarity implies the similarity of shape such that, the ratio of any length in
one system to the corresponding length in other system is the same everywhere.
This ratio is usually known as scale factor.
Therefore, geometrically similar objects are similar in their shapes, i.e., proportionate in their
physical dimensions, but differ in size.
In investigations of physical similarity,
· the full size or actual scale systems are known as prototypes
· the laboratory scale systems are referred to as models
· use of the same fluid with both the prototype and the model is not necessary

· model need not be necessarily smaller than the prototype. The flow of fluid
through an injection nozzle or a carburettor , for example, would be more easily
studied by using a model much larger than the prototype.
· the model and prototype may be of identical size, although the two may then
differ in regard to other factors such as velocity, and properties of the fluid.
If l1 and l2 are the two characteristic physical dimensions of any object, then the requirement of
geometrical similarity is
(model ratio)
(The second suffices m and p refer to model and prototype respectively) where lr is the scale
factor or sometimes known as the model ratio. Figure 5.1 shows three pairs of geometrically similar objects, namely, a right circular cylinder, a parallelopiped, and a triangular prism.
Fig 17.1 Geometrically Similar Objects

In all the above cases model ratio is 1/2
Geometric similarity is perhaps the most obvious requirement in a model system designed to
correspond to a given prototype system.
A perfect geometric similarity is not always easy to attain. Problems in achieving perfect
geometric similarity are:
· For a small model, the surface roughness might not be reduced according to the scale
factor (unless the model surfaces can be made very much smoother than those of the
prototype). If for any reason the scale factor is not the same throughout, a distorted
model results.
· Sometimes it may so happen that to have a perfect geometric similarity within the
available laboratory space, physics of the problem changes. For example, in case of large
prototypes, such as rivers, the size of the model is limited by the available floor space of
the laboratory; but if a very low scale factor is used in reducing both the horizontal and
vertical lengths, this may result in a stream so shallow that surface tension has a
considerable effect and, moreover, the flow may be laminar instead of turbulent. In this
situation, a distorted model may be unavoidable (a lower scale factor ”for horizontal
lengths while a relatively higher scale factor for vertical lengths. The extent to which
perfect geometric similarity should be sought therefore depends on the problem being
investigated, and the accuracy required from the solution.
Kinematic Similarity
Kinematic similarity refers to similarity of motion.
Since motions are described by distance and time, it implies similarity of lengths (i.e.,
geometrical similarity) and, in addition, similarity of time intervals.
If the corresponding lengths in the two systems are in a fixed ratio, the velocities of
corresponding particles must be in a fixed ratio of magnitude of corresponding time intervals.
If the ratio of corresponding lengths, known as the scale factor, is lr and the ratio of corresponding time intervals is tr, then the magnitudes of corresponding velocities are in the
ratio lr/tr and the magnitudes of corresponding accelerations are in the ratio lr/t2
r.
A well-known example of kinematic similarity is found in a planetarium. Here the galaxies of
stars and planets in space are reproduced in accordance with a certain length scale and in
simulating the motions of the planets, a fixed ratio of time intervals (and hence velocities and
accelerations) is used.
When fluid motions are kinematically similar, the patterns formed by streamlines are
geometrically similar at corresponding times.

Since the impermeable boundaries also represent streamlines, kinematically similar flows are
possible only past geometrically similar boundaries.
Therefore, geometric similarity is a necessary condition for the kinematic similarity to be
achieved, but not the sufficient one.
For example, geometrically similar boundaries may ensure geometrically similar streamlines in
the near vicinity of the boundary but not at a distance from the boundary.
Dynamic Similarity
Dynamic similarity is the similarity of forces .
In dynamically similar systems, the magnitudes of forces at correspondingly similar points in
each system are in a fixed ratio.
In a system involving flow of fluid, different forces due to different causes may act on a fluid
element. These forces are as follows:
Viscous Force (due to viscosity)
Pressure Force ( due to different in pressure)
Gravity Force (due to gravitational attraction)
Capillary Force (due to surface tension) Compressibility Force ( due to elasticity)
According to Newton 's law, the resultant FR of all these forces, will cause the acceleration of a
fluid element. Hence
(17.1)
Moreover, the inertia force is defined as equal and opposite to the resultant accelerating
force
= -
Therefore Eq. 17.1 can be expressed as

For dynamic similarity, the magnitude ratios of these forces have to be same for both the
prototype and the model. The inertia force is usually taken as the common one to describe
the ratios as (or putting in other form we equate the the non dimensionalised forces in the two
systems)
9.4 Applications:
The Application of Dynamic Similarity - The Dimensional Analysis
The concept:
A physical problem may be characterised by a group of dimensionless similarity parameters or
variables rather than by the original dimensional variables.
This gives a clue to the reduction in the number of parameters requiring separate consideration
in an experimental investigation.
For an example, if the Reynolds number Re = ρV Dh /µ is considered as the independent
variable, in case of a flow of fluid through a closed duct of hydraulic diameter Dh, then a change
in Re may be caused through a change in flow velocity V only. Thus a range of Re can be
covered simply by the variation in V without varying other independent dimensional variables
ρ,Dh and µ.
In fact, the variation in the Reynolds number physically implies the variation in any of the
dimensional parameters defining it, though the change in Re, may be obtained through the
variation in anyone parameter, say the velocity V.
A number of such dimensionless parameters in relation to dynamic similarity are shown in
Table 5.1. Sometimes it becomes diffcult to derive these parameters straight forward from an
estimation of the representative order of magnitudes of the forces involved. An alternative
method of determining these dimensionless parameters by a mathematical technique is
known as dimensional analysis .
The Technique:
The requirement of dimensional homogeneity imposes conditions on the quantities involved in a
physical problem, and these restrictions, placed in the form of an algebraic function by the
requirement of dimensional homogeneity, play the central role in dimensional analysis.

There are two existing approaches;
one due to Buckingham known as Buckingham's pi theorem
other due to Rayleigh known as Rayleigh's Indicial method

Chapter 10
Elements of Compressible Flow
10.1 Compressible Flow Properties:
Introduction
Compressible flow is often called as variable density flow. For the flow of all liquids
and for the flow of gases under certain conditions, the density changes are so small that
assumption of constant density remains valid.
Let us consider a small element of fluid of volume . The pressure exerted on the
element by the neighbouring fluid is p . If the pressure is now increased by an amount dp
, the volume of the element will correspondingly be reduced by the amount d .The
compressibility of the fluid K is thus defined as
(38.1)
However, when a gas is compressed, its temperature increases. Therefore, the above mentioned
definition of compressibility is not complete unless temperature condition is specified. When the
temperature is maintained at a constant level, the isothermal compressibility is defined as
(38.2)
Compressibility is a property of fluids. Liquids have very low value of compressibility
(for ex. compressibility of water is 5 ´ 10-10
m2/N at 1 atm under isothermal condition),
while gases have very high compressibility (for ex. compressibility of air is 10-5
m2/N at
1 atm under isothermal condition).
If the fluid element is considered to have unit mass and v is the specific volume (volume

per unit mass) , the density is . In terms of density; Eq. (38.1) becomes
(38.3)
We can say that from Eqn (38.1) for a change in pressure, dp, the change in density is
(38.4)
If we also consider the fluid motion, we shall appreciate that the flows are initiated and
maintained by changes in pressure on the fluid. It is also known that high pressure
gradient is responsible for high speed flow. However, for a given pressure gradient dp ,
the change in density of a liquid will be much smaller than the change in density of a
gas (as seen in Eq. (38.4)).
So, for flow of gases, moderate to high pressure gradients lead to substantial changes in the
density. Due to such pressure gradients, gases flow with high velocity. Such flows, where is a
variable, are known as compressible flows.
Recapitulating Chapter 1, we can say that the proper criterion for a nearly incompressible
flow is a small Mach number,
(38.5)
where V is the flow velocity and a is the speed of sound in the fluid. For small Mach
number, changes in fluid density are small everywhere in the flow field.

In this chapter we shall treat compressible flows which have Mach numbers greater than
0.3 and exhibit appreciable density changes. The Mach number is the most important
parameter in compressible flow analysis. Aerodynamicists make a distinction between
different regions of Mach number.
Categories of flow for external aerodynamics.
Ma < 0.3: incompressible flow; change in density is negligible.
0.3< Ma < 0.8: subsonic flow; density changes are significant but shock
waves do not appear.
0.8< Ma < 1.2: transonic flow; shock waves appear and divide the
subsonic and supersonic regions of the flow. Transonic flow is
characterized by mixed regions of locally subsonic and supersonic flow
1.2 < Ma < 3.0: supersonic flow; flow field everywhere is above acoustic
speed. Shock waves appear and across the shock wave, the streamline
changes direction discontinuously.
3.0< Ma : hypersonic flow; where the temperature, pressure and density
of the flow increase almost explosively across the shock wave.
For internal flow, it is to be studied whether the flow is subsonic ( Ma < 1) or
supersonic (Ma > 1). The effect of change in area on velocity changes in subsonic and
supersonic regime is of considerable interest. By and large, in this chapter we shall
mostly focus our attention to internal flows.
Perfect Gas
A perfect gas is one in which intermolecular forces are neglected. The
equation of state for a perfect gas can be derived from kinetic theory. It was
synthesized from laboratory experiments by Robert Boyle, Jacques Charles,
Joseph Gay-Lussac and John Dalton. For a perfect gas, it can be written
(38.6)
where p is pressure ( N/m2
), is the volume of the system (m3
), M is the mass
of the system (kg), R is the characteristic gas constant (J/kg K) and T is the
temperature ( K ). This equation of state can be written as
(38.7)

where v is the specific volume (m3/kg). Also,
where is the density (kg/m3 ).
(38.8)
In another approach, which is particularly useful in chemically reacting
systems, the equation of state is written as
(38.9)
where N is the number of moles in the system, and is the universal gas
constant which is same for all gases
.
Recall that a mole of a substance is that amount which contains a mass equal to the molecular weight of the gas and which is identified with the particular system of units being used. For example, in case of oxygen (O2), 1 kilogram-
mole (or kg. mol) has a mass of 32 kg. Because the masses of different molecules are in the same ratio as their molecular weights; 1 mol of different gases always contains the same number of molecules, i.e. 1 kg-mol always
contains 6.02 ×1026
molecules, independent of the species of the gas. Dividing
Eq. (38.9) by the number of moles of the system yields
(38.10)
: Vol. per unit mole
If Eq. (38.9) is divided by the mass of the system, we can write
(38.11)
where v is the specific volume as before and is the mole-mass ratio (kg-
mol/kg). Also, Eq. (38.9) can be divided by system volume, which results in
(38.12)

The equation of state can also be expressed in terms of particles. If NA is the
number of molecules in a mole (Avogadro constant, which for a kilogram-
mole is 6.02 ×1026
particles), from Eq. (38.12) we obtain
(38.13)
In the above equation, NAC is the number density, i.e. number of particles per unit
volume and is the gas constant per particle, which is nothing but
Boltzmann constant.
Finally, Eq. (38.13) can be written as
(38.14)
where n: number density
: Boltzmann constant.
where C is the concentration (kg - mol/m3 )
It is interesting to note that there exist a variety of gas constants whose use
depends on the equation in consideration.
1.Universal gas constant- When the equation deals with moles, it is in use. It is same
for all the gases.
= 8314 J/( Kg-mol-K)
2.Characteristic gas constant- When the equation deals with mass, the characteristic gas
constant (R) is used. It is a gas constant per unit mass and it is different for different
gases. As such
conditions,
, where M is the molecular weight. For air at standard
R = 287 J/(kg-K)

3. Boltzmann constant- When the equation deals with molecules, Boltzmann constant
is used. It is a gas constant per unit molecule .
= 1.38 X 10 -23
J / K
Application of the perfect gas theory
a. It has been experimentally determined that at low pressures (1 atm or less) and
at high temperature (273 K and above), the value of ( the well known
compressibility z, of a gas) for most pure gases differs from unity by a quanity
less than one percent ( the well known compressibility z, of a gas).
b. Also, that at very low temperatures and high pressures the molecules are
densely packed. Under such circumstances, the gas is defined as real gas and
the perfect gas equation of state is replaced by the famous Van-der-Waals
equation which is
(38.15)
where a and b are constants and depend on the type of the gas.
In conclusion, it can be said that for a wide range of applications related to
compressible flows, the temperatures and pressures are such that the equation of
state for the perfect gas can be applied with high degree of confidence.
Internal Energy and Enthalpy
Microscopic view of a gas is a collection of particles in random motion. Energy
of a particle consists of translational energy, rotational energy, vibrational
energy and specific electronic energy. All these energies summed over all the
particles of the gas, form the specific internal energy, e , of the gas.
Imagine a gas in thermodynamic equilibrium,i.e., gradients in velocity,

Please note that in most of the compressible flow applications, the pressure and
temperatures are such that the gas can be considered as calorically perfect.
For calorically perfect gases, we assume constant specific heats and write
(38.19)
The specific heats at constant pressure and constant volume are defined as
(38.20)
pressure, temperature and chemical concentrations do not exist.
Then the enthalpy, h , is defined as , where is the specific volume.
(38.16)
If the gas is not chemically reacting and the intermolecular forces are neglected, the
system can be called as a thermally perfect gas, where internal energy and enthalpy
are functions of temperature only. One can write
(38.17)
For a calorically perfect gas,
(38.18)

10.2 Total Enthalpy:
Stagnation and Sonic Properties
The stagnation properties at a point are defined as those which are to be obtained if the
local flow were imagined to cease to zero velocity isentropically. As we will see in the
later part of the text, stagnation values are useful reference conditions in a compressible
flow.
Let us denote stagnation properties by subscript zero. Suppose the properties of a flow (such as
T, p , ρ etc.) are known at a point, the stangation enthalpy is, thus, defined as
where h is flow enthalpy and V is flow velocity.
For a perfect gas , this yields,
(40.1)
Equation (38.19), can be rewritten as
(38.21)
Also . So we can rewrite Eq. (38.21) as
(38.22)
In a similar way, from Eq. (38.19) we can write
(38.23)

which defines the Stagnation Temperature
Now, can be expressed as
Since,
(40.2)
If we know the local temperature (T) and Mach number (Ma) , we can find out the stagnation
temperature T0 .
Consequently, isentropic(adiabatic) relations can be used to obtain stagnation pressure and
stagnation density as
(40.3)
(40.4)
Values of and as a function of Mach number can be generated using the
above relationships and the tabulated results are known as Isentropic Table . Interested readers
are suggested to refer the following books
10.3 Total Temeperature: Refer Section 10.2

10.4 Temperature and Pressure ratio as function of Mach number:
Refer Section 10.2
10.5 Mass Flow Parameter:
Isentropic Flow in a Converging Nozzle
Consider the mass flow rate of an ideal gas through a converging nozzle. If the flow is isentropic,
we can write
where is flow velocity, is area, is the density of the field.
This can equivalently be written as-

(40.12)
In the expression (40.12), and R are constant
The discharge per unit area is a function of Ma only. There exists a particular value of
Ma for which it is maximum. Differentiating with respect to Ma and equating it to zero,
we get
Hence, discharge is maximum when Ma = 1.

10.6 Isentropic area ratio A/A*:
We know that . By logarithmic differentiation, we get
(40.13)
We also know that
By logarithmic differentiation, we get
(40.14)
From Eqs(40.13) and (40.14) , we get
(40.15)
From Eqs (40.11) and (40.15), we get
(40.16)
By substituting Ma=1 in Eq. (40.16), we get dA = 0 or A = constant.

Ma=1 can occur only at the throat and nowhere else, and this happens only when the
discharge is maximum. When Ma = 1 , the discharge is maximum and the nozzle is
said to be choked.
The properties at the throat are termed as critical properties which are already expressed
through Eq. (40.6a), (40.6b) and (40.6c). By substituting Ma = 1 in Eq. (40.12), we get
(40.17)
(as we have earlier designated critical or sonic conditions by a superscript asterisk). Dividing Eq.
(40.17) by Eq. (40.12) we obtain
(40.18)
From Eq. (40.18) we see that a choice of Ma gives a unique value of A/A* . The following figure
shows variation of A / A * with Ma (Fig 40.6). Note that the curve is double valued; that is, for a
given value of A/A* (other than unity), there are two possible values of Mach number. This
signifies the fact that the supersonic nozzle is diverging.
Fig 40.6: Variation of A/A* with Ma in isentropic flow for = 1.4

10.7 Velocity Area Variation:
Effect of Area Variation on Flow Properties in Isentropic Flow
In considering the effect of area variation on flow properties in isentropic flow, we shall
determine the effect on the velocity V and the pressure p .
From Eq . (39.11), we can write
Dividing by , we obtain
(40.8)
A convenient differential form of the continuity equation can be obtained from Eq. (39.6) as
Substituting from Eq. (40.8),
Invoking the relation (39.3b) for isentropic process in Eq. (40.9), we get
(40.9)
(40.10)

From Eq.(40.10), we see that for Ma<1 an area change causes a pressure change of the
same sign, i.e. positive dA means positive dp for Ma<1 . For Ma>1 , an area change
causes a pressure change of opposite sign.
Again, substituting from Eq. (40.8) into Eq. (40.10), we obtain
(40.11)
From Eq. (40.11) we see that Ma<1 an area change causes a velocity change of opposite sign, i.e.
positive dA means negative dV for Ma<1 . For Ma>1 an area change causes a velocity change of
same sign.
These results can be summarized in fig 40.2. Equations (40.10) and (40.11) lead to the following
important conclusions about compressible flows:
1. At subsonic speeds(Ma<1) a decrease in area increases the speed of flow. A subsonic
nozzle should have a convergent profile and a subsonic diffuser should possess a
divergent profile. The flow behaviour in the regime of Ma<1 is therefore qualitatively the
same as in incompressible flows.
2. In supersonic flows (Ma>1) the effect of area changes are different. According to Eq.
(40.11), a supersonic nozzle must be built with an increasing area in the flow direction. A
supersonic diffuser must be a converging channel. Divergent nozzles are used to produce
supersonic flow in missiles and launch vehicles.
Fig 40.2 Shapes of nozzles and diffusers in subsonic and supersonic regimes

10.8 2D Small Amplitude wave propagation:
Speed of Sound
The so-called sound speed is the rate of propogation of a pressure pulse of
infinitesimal strength through a still fluid. It is a thermodynamic property of a fluid.
A pressure pulse in an incompressible flow behaves like that in a rigid body. A
displaced particle displaces all the particles in the medium. In a compressible fluid, on
the other hand, displaced mass compresses and increases the density of neighbouring
mass which in turn increases density of the adjoining mass and so on. Thus, a
disturbance in the form of an elastic wave or a pressure wave travels through the
medium. If the amplitude and theerfore the strength of the elastic wave is infinitesimal,
it is termed as acoustic wave or sound wave.
Figure 39.1(a) shows an infinitesimal pressure pulse propagating at a speed " a "
towards still fluid (V = 0) at the left. The fluid properties ahead of the wave are p,T and
, while the properties behind the wave are p+dp, T+dT and . The fluid
velocity dV is directed toward the left following wave but much slower.
In order to make the analysis steady, we superimpose a velocity " a " directed towards
right, on the entire system (Fig. 39.1(b)). The wave is now stationary and the fluid
appears to have velocity " a " on the left and (a - dV) on the right. The flow in Fig. 39.1
(b) is now steady and one dimensional across the wave. Consider an area A on the
wave front. A mass balance gives

Fig 39.1: Propagation of a sound wave
(a) Wave Propagating into still Fluid (b) Stationary Wave
(39.1)
This shows that
(a) if dρ is positive.
(b) A compression wave leaves behind a fluid moving in the direction of the wave
(Fig. 39.1(a)).
(c) Equation (39.1) also signifies that the fluid velocity on the right is much
smaller than the wave speed " a ". Within the framework of infinitesimal strength of the
wave (sound wave), this " a " itself is very small.
Applying the momentum balance on the same control volume in Fig. 39.1 (b).
It says that the net force in the x direction on the control volume equals the rate
of outflow of x momentum minus the rate of inflow of x momentum. In
symbolic form, this yields
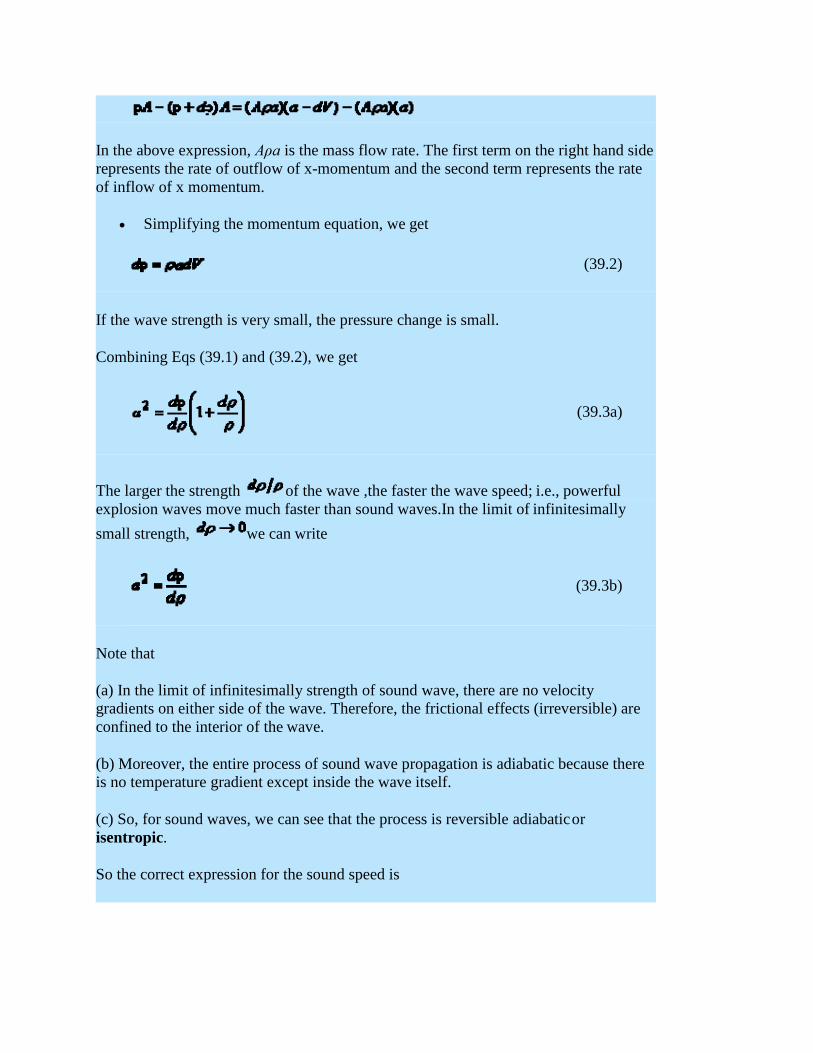
In the above expression, Aρa is the mass flow rate. The first term on the right hand side
represents the rate of outflow of x-momentum and the second term represents the rate
of inflow of x momentum.
Simplifying the momentum equation, we get
(39.2)
If the wave strength is very small, the pressure change is small.
Combining Eqs (39.1) and (39.2), we get
(39.3a)
The larger the strength of the wave ,the faster the wave speed; i.e., powerful
explosion waves move much faster than sound waves.In the limit of infinitesimally
small strength, we can write
(39.3b)
Note that
(a) In the limit of infinitesimally strength of sound wave, there are no velocity
gradients on either side of the wave. Therefore, the frictional effects (irreversible) are
confined to the interior of the wave.
(b) Moreover, the entire process of sound wave propagation is adiabatic because there
is no temperature gradient except inside the wave itself.
(c) So, for sound waves, we can see that the process is reversible adiabatic or
isentropic.
So the correct expression for the sound speed is

10.10 Description of Flow regime:
Refer Section 10.1
10.11 Introduction to Oblique and Normal Shocks:
Normal Shocks
Shock waves are highly localized irreversibilities in the flow .
Within the distance of a mean free path, the flow passes from a supersonic to a subsonic
state, the velocity decreases suddenly and the pressure rises sharply. A shock is said to
have occurred if there is an abrupt reduction of velocity in the downstream in course of a
supersonic flow in a passage or around a body.
Normal shocks are substantially perpendicular to the flow and oblique shocks are
inclined at any angle.
Shock formation is possible for confined flows as well as for external flows.
Normal shock and oblique shock may mutually interact to make another shock pattern.
(39.4)
For a perfect gas, by using of
sound as
, and , we deduce the speed of
(39.5)
For air at sea-level and at a temperature of 150C, a=340 m/s

Fig 41.1 Different type of Shocks
Figure below shows a control surface that includes a normal shock.

Fig 41.2 One Dimensional Normal Shock
The fluid is assumed to be in thermodynamic equilibrium upstream and downstream of
the shock, the properties of which are designated by the subscripts 1 and 2, respectively.
(Fig 41.2).
Continuity equation can be written as
(41.1)
where G is the mass velocity kg/ m
2 s, and is mass flow rate
From momentum equation, we can write
where p + ρV2
is termed as Impulse Function .
(41.2a)
(41.2b)

The energy equation is written as
where h0 is stagnation enthalpy.
From the second law of thermodynamics, we know
To calculate the entropy change, we have
For an ideal gas
For an ideal gas the equation of state can be written as
For constant specific heat, the above equation can be integrated to give
(41.3)
(41.4)
(41.5)
Equations (41.1), (41.2a), (41.3), (41.4) and (41.5) are the governing equations for the flow of an
ideal gas through normal shock.
If all the properties at state 1 (upstream of the shock) are known, then we have six unknowns
in these five equations.
We know relationship between h and T [Eq. (38.17)] for an ideal gas, . For an
ideal gas with constant specific heats,
(41.6)
Thus, we have the situation of six equations and six unknowns.

If all the conditions at state "1"(immediately upstream of the shock) are known, how
many possible states 2 (immediate downstream of the shock) are there? The
mathematical answer indicates that there is a unique state 2 for a given state 1.
Calculation of Flow Properties Across a Normal Shock
The easiest way to analyze a normal shock is to consider a control surface around the
wave as shown in Fig. 41.2. The continuity equation (41.1), the momentum equation
(41.2) and the energy equation (41.3) have already been discussed earlier. The energy
equation can be simplified for an ideal gas as
(40.9)
By making use of the equation for the speed of sound eq. (39.5) and the equation of state
for ideal gas eq. (38.8), the continuity equation can be rewritten to include the influence
of Mach number as:
Introducing the Mach number in momentum equation, we have
Therefore ,
(40.10)
(40.11)
Rearranging this equation for the static pressure ratio across the shock wave, we get
(40.12)

As already seen, the Mach number of a normal shock wave is always greater than unity in
the upstream and less than unity in the downstream, the static pressure always increases
across the shock wave.
The energy equation can be written in terms of the temperature and Mach number using
the stagnation temperature relationship (40.9) as
(40.13)
Substituting Eqs (40.12) and (40.13) into Eq. (40.10) yields the following relationship for the
Mach numbers upstream and downstream of a normal shock wave:
(40.14)
Then, solving this equation for as a function of we obtain two solutions. One solution
is trivial , which signifies no shock across the control volume. The other solution is
(40.15)
in Eq. (40.15) results in
Equations (40.12) and (40.13) also show that there would be no pressure or temperature increase
across the shock. In fact, the shock wave corresponding to is the sound wave across
which, by definition, pressure and temperature changes are infinitesimal. Therefore, it can be
said that the sound wave represents a degenerated normal shock wave. The pressure, temperature
and Mach number (Ma2) behind a normal shock as a function of the Mach number Ma1, in front
of the shock for the perfect gas can be represented in a tabular form (known as Normal Shock
Table). The interested readers may refer to Spurk[1] and Muralidhar and Biswas[2].
Oblique Shock
The discontinuities in supersonic flows do not always exist as normal to the flow
direction. There are oblique shocks which are inclined with respect to the flow direction.
Refer to the shock structure on an obstacle, as depicted qualitatively in Fig.41.6.
The segment of the shock immediately in front of the body behaves like a normal shock.
Oblique shock can be observed in following cases-

1. Oblique shock formed as a consequence of the bending of the shock in the
free-stream direction (shown in Fig.41.6)
2. In a supersonic flow through a duct, viscous effects cause the shock to be
oblique near the walls, the shock being normal only in the core region.
3. The shock is also oblique when a supersonic flow is made to change direction
near a sharp corner
Fig 41.6 Normal and oblique Shock in front of an Obstacle
The relationships derived earlier for the normal shock are valid for the velocity
components normal to the oblique shock. The oblique shock continues to bend in the
downstream direction until the Mach number of the velocity component normal to the
wave is unity. At that instant, the oblique shock degenerates into a so called Mach
wave across which changes in flow properties are infinitesimal.
Let us now consider a two-dimensional oblique shock as shown in Fig.41.7 below

Fig 41.7 Two dimensional Oblique Shock
For analyzing flow through such a shock, it may be considered as a normal shock on which a
velocity (parallel to the shock) is superimposed. The change across shock front is determined
in the same way as for the normal shock. The equations for mass, momentum and energy
conservation , respectively, are
(41.16)
(41.17)
(41.18)
These equations are analogous to corresponding equations for normal shock. In addition to these,
we have
and

Modifying normal shock relations by writing and in place of and
, we obtain
(41.19)
(41.20)
(41.21)
Note that although <1, might be greater than 1. So the flow behind an
oblique shock may be supersonic although the normal component of velocity is subsonic.
In order to obtain the angle of deflection of flow passing through an oblique shock, we use the
relation
Having substituted from Eq. (41.20), we get the relation
(41.22)
Sometimes, a design is done in such a way that an oblique shock is allowed instead of a normal
shock. The losses for the case of oblique shock are much less than those of normal shock.This is
the reason for making the nose angle of the fuselage of a supersonic aircraft small.
10.12 Working out solutions through Gas tables /Charts:
Not Available

WATER
71% from earth surface. 97% salt water (sea)
3% fresh water 87% ice and glaciers, underground, air.
13% surface water (0.4% total water).
Function Domestic.
Industry.
Agriculture.
Recreation.
Safety and security.

WATER
70% total human body wt.
30 – 40% bone mass.
Body functions: Absorption of oxygen at alveoli.
Control of body temperature.
Blood component.
Digestion in kidneys and intestine.
Alteration of 10% body content – health problem.
Alteration of 20% body content – death.

90%
80%
70%
60%
50%
40%
30%
20%
10%
0%
World North
America
Europe Africa Asia South
America
Domestic
Industry
Agriculture
Wa
ter
Usa
ge

WATER POLLUTION
Ideal water supply Quality.
Quantity.
Water quality parameter Physical.
Suspended solid (SS), color, taste, smell, temp.
Chemical. Dissolved substances, alkalinity, hardness, fluoride,
heavy metal, organic compound, nutrient (nitrogen & phosphorus), pH, biochemical oxygen demand (BOD), chemical oxygen demand (COD).
Biology. Bacteria, virus, protozoa, helminthes.

Mining (tin, gold, cuprum).
Industrialization.
Housing development.
Hydro dam.
SOURCES OF WATER POLLUTION
Uncontrolled land development since colonial era (end 19th century).
Agriculture (logging, estate, farms).

SOURCES OF WATER POLLUTION
Pollution of clean water resources
Erosion at water catchments areas.
Erosion of rivers.
Effluent from rubber and palm oil factories.
Effluent from mining site.
Effluent from industry area.
Effluent from farming area.
Effluent from domestic area.

SOURCES OF WATER POLLUTION
SOURCES YEAR
1978 1979 1985 1990
Palm Oil factory 1 1 4 6
Rubber factory 2 2 5 5
Mining 3 3 3 3
Industry 4 5 1 1
Farming 5 6 2 2
Mohamad Ismail Yaziz 1993

Land and forest clearance activities.
Mining.
Solid waste.
Wastewater.
SOURCES OF WATER POLLUTION
Puncak Niaga, 2001
Effluent from factories and agricultural activities.

SOURCES OF WATER POLLUTION
DOE, 1998
River cleanliness
25% clean (68.2% - 1989)
65% moderately polluted (29.3% - 1989)
10% polluted (2.5% - 1989)
Source of pollution
43% from farming and domestic.
34% from forest clearance and development.
21% from industries.

SOURCES OF WATER POLLUTION
DOE, 1998
Marin pollution
94.5% by oil and grease.
73.7% by suspended solids.
28.7% by E.coli
Underground water pollution
3% contents mercury, cadmium and lead.
23% contents phenolic.
40% contents arsenic.

pH.
Organic content (BOD).
Suspended solids.
Ammonium-nitrogen.
Micro bacteria.
Heavy metals
lead, cuprum, cadmium.
Pesticides.
TYPE OF POLLUTION

Will cause
Soil contamination.
Air contamination.
Food chain contamination.
Esthetic.
Lack of clean water supply for
Domestic demand.
Industry use.
Agriculture use.
WATER POLLUTION

Food poisoning.
Skin problem.
Will also cause
Breeding of diseases vector.
Spreading of water borne diseases.
WATER POLLUTION

PBB
80% of diseases in developing countries are due to water supply contamination.
4 – 5 million child died every year due to water supply contamination.
More than 1 million died after severe diarrhea.
WATER POLLUTION

Including chemical, physical and biological content.
Following standards and guidelines.
Using measurement of pH, color, cloudiness, conductivity.
Heavy metals, nutrient, pesticide, microbe.
Good water quality is where it free from disease organism, dangerous chemical substances, radioactive, accepted taste and smell.
WATER POLLUTION

Since March 1978.
443 sampling station by DOE.
Other agencies
Health Department.
Department of Irrigation and Drainage.
WATER POLLUTION CONTROL

WATER POLLUTION CONTROL
GOVERNMENT AGENCIES
WATER
DOE,
Department of Irrigation and Drainage,
Mining and Mineral Department,
Local Authority,
Fishery Department,
Health Department.