mechanism of long-term excessive deformation and delayed
TRANSCRIPT

Mechanism of Long-Term Excessive Deformation andDelayed Shear Failure of Underground RC Box CulvertsKoichi Maekawa, Xiaoxu Zhu Nobuhiro Chijiwa, , Shigeru Tanabe
Journal of Advanced Concrete Technology, volume ( ), pp.14 2016 183-204
Time-Dependent Constitutive Model of Solidifying Concrete Based on Thermodynamic State of Moisturein Fine PoresShingo Asamoto, Tetsuya Ishida Koichi Maekawa,Journal of Advanced Concrete Technology, volume ( ), pp.4 2006 301-323
An investigation into the long-term excessive deflection of PC Viaducts by using 3D multi-scaleintegrated analysisMotohiro Ohno , Koichi Maekawa Nobuhiro Chijiiwa, , Benny SuryantoJournal of Advanced Concrete Technology, volume ( ), pp.10 2012 47-58
Multi-scale based Simulation of Shear Critical Reinforced Concrete Beams Subjected to DryingEsayas Gebreyouhannes , Taiji Yoneda Tetsuya Ishida, , Koichi MaekawaJournal of Advanced Concrete Technology, volume ( ), pp.12 2014 363-377

Journal of Advanced Concrete Technology Vol. 14, 183-204 May 2016 / Copyright © 2016 Japan Concrete Institute 183
Scientific paper
Mechanism of Long-Term Excessive Deformation and Delayed Shear Failure of Underground RC Box Culverts
Koichi Maekawa1*, Xiaoxu Zhu2, Nobuhiro Chijiwa3 and Shigeru Tanabe4
Received 27 November 2015, accepted 29 April 2016 doi:10.3151/jact.14.183
Abstract The aim of this study is to clarify the mechanism of the progressive excessive deformation observed in real underground RC box culverts of about 30 years of age. It was found by the site-inspection, monitoring and the destructive testing that the excessive deflection of top slabs for the culverts, which is almost 10 times the design estimated value, accompanies the out-of-plane shear failure. It is also computationally investigated that the coupling of subsidence of the backfill soil and the combined creep and shrinkage of concrete after cracking is closely associated with the delayed shear failure found in the culvert in service. In order to prove the delayed shear failure under higher sustained loads, the time-dependent shear crack propagation was reproduced in the laboratory test and the computational approach used in this study was examined.
1. Introduction
Underground facilities which are essential parts of urban infrastructures are used for a wide range of applications from small pipelines for lifelines to middle and large-scale underground structures such as utility ducts and tunnels for transportation. As these facilities backfilled with soil can hardly be inspected visually, long-term serviceability and safety are an essential issue for dura-bility design and maintenance.
In the past decades, the long-term monitoring data for cracking and deflection of underground RC utility ducts was reported (Kunieda et al. 2014) and the excessive deflection of top slabs of these box culverts was recog-nized as shown in Fig. 1. Although the deflection of the top slabs was not periodically measured, cracking and its width were inspected in 15 and 30 years after con-struction as shown in Fig. 2. Cracks were increasing in number and their width has been enlarged (Chijiwa et al. 2015). It means that the nonlinearity of the ducts has proceeded ahead in the past three decades, and it seems that the deflection might be multiplying as well. The cracks are dispersed over the bottom faces of the top slabs. Attention should be directed to the fact that large cracks are also seen at the box culvert’s inside corner where the bending compression develops. Thus, these cracks are thought not to be caused by flexure. The di-agonal shear cracks and out-of-plane failure were sus-pected in danger (Zhu et al. 2014).
It is hard to identify the mode of failure by naked eyes, because cracks can be seen only from inside of RC box culverts. Then, the authors conducted the non-destructive testing by using an ultrasonic device and finally picked up core-boring. The diagonal shear cracks were definitely found (Chijiwa et al. 2015). It is not known when this diagonal out-of-plane shear cracks appeared, but it is assumed as shown in Fig. 2 that the shear failure may occur lately after the construction. In this paper, the authors define the late diagonal cracking as “delayed shear”. Fortunately, the zone of shear failure is detected within the limited area, and the whole struc-tural system remains stable at this moment.
It is indispensable to clarify the mechanics of delayed shear failure of RC culverts to predict what will take place in future. Otherwise, the maintenance planning cannot be systematically conducted. The aim of this study is to investigate the mechanism of long-term ex-cessive deformation and possible time-dependent shear failure of underground RC box culverts. The authors reported the trial multi-scale analysis of the under-ground RC culverts to show the possibility of delayed shear failure by considering 1) subsidence of backfilled soil foundation, 2) differential shrinkage and 3) time-dependent crack propagation (Kunieda et al. 2014). This paper is to deepen the discussion in more detail with the step-by-step verification and to verify the multi-scale soil-RC interaction analysis as a tool for future design and asset management of underground urban infrastruc-tures.
2. Multi-scale soil-RC interaction analysis
As underground box culverts are backfilled with soil, time-dependent creep of structural concrete before and after cracking has to be taken into account (Maekawa et al. 2008; Asamoto et al. 2006). At the same time, differential shrinkage of concrete is associated with
1Distinguished professor, The University of Tokyo,Japan. *Corresponding author, E-mail: [email protected] 2Engineer, Shimizu Corporation, Tokyo, Japan. 3Associate Professor, Tokyo Institute of Technology, Tokyo, Japan. 4Chief engineer, Tokyo Electric Power Company Hold-ings, Inc., Tokyo, Japan.

K. Maekawa, X. Zhu, N. Chijiwa and S. Tanabe / Journal of Advanced Concrete Technology Vol. 14, 183-204, 2016 184
long-term deformation and shear failure (Yoneda et al. 2013), because the inside space of box culverts is rather dry but their outer surface is surrounded by wet soil fundation and/or underground water. Since the out-of-plane shear failure is a problem in danger, the diagonal shear crack propagation, which is possibly associated with drying shrinkage of concrtete, shall be simulated (Gebreyouhannes et al. 2014) as well. Furthermore, the nonlinear soil-structure interaction is to be consiered for investigating the mecahnism of damages (Soltani and Maekawa 2015; Moshirabadi et al. 2015).
In this study, the authors utilize the thermo-hygral multi-scale analysis (integrated analysis) which may cover all factors stated in this chapter (Maekawa et al. 2008). The reliability, accuracy and scope of this simulation platform has been examined in the past decades based upon experimental facts and applied to some design and infrastructure maintenance for practice. First of all, further experimetal verification is caried out in terms of long-term structural performances of the underground box culverts.
Deflection excess 7~10times of design
code prediction
White line: chalked cracks
Actual crack picture※mm
Distance to center (mm)
Mid
-sp
an
de
flect
ion
(m
m) Deflection shape of top slab (30years after completion)
Expected in design
Measured
350
400
3600
350 3200 350
6800
sand
3000
Water level
Fig. 1 Long-term excessive deflection with cracks of underground RC culvert (Kunieda et al. 2014).
Fig. 3 Scheme of multi-scale modeling of structural concrete (Yoneda et al. 2013, 2015).
0
5
10
15
20
25
30
Nu
mb
er
of c
rack
s
Crack width (mm)
15 years
30 years
Lon
gitudina
l direction
0.9mm
Haunch
The neighbor cracks near center 0.2-0.6mm
Center
Fig. 2 The crack in progress and its large width observed near the corner haunch (Chijiwa et al. 2015).

K. Maekawa, X. Zhu, N. Chijiwa and S. Tanabe / Journal of Advanced Concrete Technology Vol. 14, 183-204, 2016 185
2.1 Vertical earth pressure to RC culvert backfilled with soil The underground box culvert targetted in this study was constructed about 35 years ago by open-cut and cover construction system as shown in Fig. 4. After dumping disturbed soil backfilled between sheet piles and the RC culvert, the dead weight of the overlay soil was directly applied on the top slab of the box culvert. Here, it must be noted that the backfill soil may be consolidated by gravity and the earth pressure will be increasing. Das-gupta and Sengupta (1991) conducted the large-scale mock-up of the box culvert backfilled with soil and measured the earth pressure which increases more than the initial value (Bennet et al. 2005; Tadros and Benak 1989; Woodbury et al. 1926). As a matter of fact, any dumped soil more or less comes upon subsidence even after compaction works and the increasing earth pres-sure is a potential cause of the delayed shear failure concerned. Then, the computational scheme in this study is required to be able to simulate the soil-structure interaction in time domain.
The pre-analyses to target the trap door test (Kuwano and Ebizuka 2010) were conducted for experimental verification of the vertical soil pressure owing to differential settlement of soil. The overview of the test is shown in Fig. 5. This experiment is aimed to mechanically reproduce the deformational fields similar to the case of backfill soil’s subsidence by using the trapdoors in downward motion, which is the analogy of the soil subsidence arround the box culvert and the rest of the fixed door represents the targetted underground box culvert. The motions of these trap doors were uniformly controlled by parallel rods connected to the single jack as shown in Fig. 5. The analysis domain was discretized by finite element mesh according to the shape and dimensioning of the set-up (lower right of Fig. 5). The same soil properties as those reported in the test were used in the nonlinear analysis as 0.652 of the void ratio, density=15.5 (kN/m3), internal frictional angle=49 (degree), dilatancy angle=19(degree) and 0.95 of the relative density. As the dry sand was used, the cohesion strength is assumed to be zero. Joint interface elements are arranged between soil and concrete to allow shear slip, where the coefficient of friction is assumed to be 0.4. The constitutive model for soil used in this study was originally deveoped by Towhata and Ishihara (1985a, 1985b) and Gutierrez et al. (1993), and installed into the integrated analysis (Soltani and Maekawa 2015).
The effect of creep and shrinkage of concrete (upper right of Fig. 5) will be also discussed in the following section.
Figure 6 shows the comparisons of experimental and analysis results. Just before the downward motion of the trap doors, the vertivcal soil presure applied on the flat floor was reported to be almost uniform as about 6 kPa, which is equivalent to the soil weight. After the trap door in motion, the soil pressure on the trap doors was decreasing. On the contrary, the pressure applied on the fixed floor was increased. The averaged pressure on the fixed floor came up to about 15 kPa and kept constant no matter how large the downward displacment was reproduced (left below of Fig. 6). It was also reported that the shear band was partially formed close to the fixed floor and roughly indicaed by dot lines.
This mode of deformation was simply illustrated in Fig. 6 by Kuwano and Ebizuka (2010). It means that the shear stress along the shear band develops and that the resultant downward shear force along the shear band is applied to the fixed door together with the gravity action of the soil foundation. Then, the resultant soil pressure on the fixed floor (=analogy of the underground box culvert) become greater than the initial soil pressure.
The analysis results are indicated with the corresponding experimental measurement. In general, multi-scale integrated analysis used in this study is capable of reproducing the increased soil pressure on the stable door due to the downward displacement of the movable ones. Not only the rapid increase in soil pressure with relatively small downward displacement (maximum soil pressure is observed at 0.5mm displacement), but also the localized shear band (Soltani and Maekawa 2015), which has a strong relation with the mechanism of increasing soil pressure, can be well simulated. The magnification ratio of the increased soil pressure (>1) attributes to the negative friction which develops along the inclined shear band. It has been empirically reported to be 1.1~2.0 in accordance with the overlay depth to duct span ratio (Kuwano and Ebizuka 2010). Since the delayed shear failure is possibly associated with the soil subsidence, the authors decided to use this soil model in the integrated analysis.
2.2 Coupled differential shrinkage-swelling and sustained loads
As stated in Chapter 1, the time-dependent mechanics of concrete has much to do with the excessive deflection
Fig. 4 Open-cut construction and consolidation of backfill soil after dumping.

K. Maekawa, X. Zhu, N. Chijiwa and S. Tanabe / Journal of Advanced Concrete Technology Vol. 14, 183-204, 2016 186
Shear stress
Deformationof fill
②Drying
①Water
Water level③Soil pressure
GroundTarget: Underground RC culvert
RC beam
Sustained loading
Water
Surrounding: Seal
Bottom: dry
(2) RC beam deformation under the integrate effect of Creep, water, drying and loading
(1) Pre-analysis for evaluating increased soil pressure
Trapdoor test by Kuwano et al. 2010
Movable bedStable
Downward forced displacement
Elasticelement
Joint Elements
Sand
400
mm
50mm 190mm 100mm
Experimental and analytical verification are needed!
Ha
lf a
naly
tica
l mo
del
Soil chamber
Fixed door
Clamp
Connecting board
Control jack
Trap door
Fig. 5 Vertical soil pressure by trapdoor test (Kuwano and Ebizuka 2010) and finite element discretization.
Fig. 6 Distribution and transition of vertical soil presure under the downward displacement of trapdoor.

K. Maekawa, X. Zhu, N. Chijiwa and S. Tanabe / Journal of Advanced Concrete Technology Vol. 14, 183-204, 2016 187
and the delayed shear failure of underground RC culverts. In design of RC members, the effects of creep and the shrinkage has been estimated seperately, and the whole structural responses were assumed to be a simple summation of each response. However, the reality of drying concrete deformation under the sustaind stress is not the mere summation of the one of wet concrete under sustaind stress (basic creep) and the volume change of drying concrete of zero stress (drying shrinkage). This is called as Pickett effect (Pickett 1942; Bazant 2001).
This nonlinearity is consistently simulated in considering moisture transport and the constitutive model for cement paste of meso-scale (Asamoto et al. 2006) before and after cracking (Maekawa et al. 2008; Yoneda et al. 2014, 2015). The coupling of sustained stresses and drying was also found to cause an excessive deflection of long-span PC box sectional viadcuts of about 10 years after construction (Bazant et al. 2010; Ohno et al. 2012). The authors also assume that the same coupling problem would be one of possible causes of excessive deformation and delayed shear failure as well. The excessive deflection of the PC viaducts and their simulation are mechanically related to strucrtural concrete before cracking. But, the problem of the underground RC box culverts discussed in this study is the one after cracking.
For verifying the integrated model used in this study,
the authors carried out the beam tests under sustained loads subjected to the gradient of the moisture as shown in the middle of Fig. 7. Four slender beams of different ambient moisture states denoted by N, W, P and A (See Table 1) were prepared and simply supported at both ends of the beam. Then, the shear deformation and out-of-plane failure are negligible. The concentrated dead weight of steel bars was put on the span center of 6.0m as shown in Fig. 7, and the time-dependent deflection was measured periodically. Within the rectangular section of 18*30cm, three D16 deformed bars were arranged as flexural main reinforcement with the effective depth of 15.0cm.
Four different moisture related boundary conditions were reproduced as listed in Table 1 and illustrated in the upper and the lower of Fig. 7. Specimen N is the standard case where the moisture loss by drying was allowed from all faces of the specimen after 9 days curing with the wooden formwork. After 281 days, the top face was covered by the stagnant water by a framed pond (illustrated in blue face of Fig. 7) and consequently, the swelling of concrete took place. This case is intended to examine the model of swelling concrete associated with water pre-wetting. As a matter of fact, the underground RC culverts are subjected to seasonal drying and wetting.
After 9 days curing like Specimen N, all side faces of Specimens W, P and Specimen A were sealed with sili-
10-1
100
101
102
103
Casting
Curing period
Self-weight
Mid-span loading
Case N Case W Case P Case A
W P A
Moisture changed
Mid-span load
Days
NW P
A
37th
70th
281th
Spry water
NWPA
Specimen N
Simple support
deadweight
Moisture boundary conditions were changed at 281 days
Initial moisture boundary conditions stagnant water on the beam
Mid-span deflectionEmbed moisture and temperature sensor
6
99S
ea
led
Unit: cm
Fig. 7 The slender beam specimens under different boundaries of moisture.
K. Maekawa, X. Zhu, N. Chijiwa and S. Tanabe / Journal of Advanced Concrete Technology Vol. 14, 183-204, 2016 188
cone to reproduce moisture motion in one-direction. The bottom face of Specimen W was kept without sealing and exposed to room air. The bottom face of Specimens P and A were sealed by using different materials. Spec-imen P was sealed with the epoxy grout and the polysty-rene sheet (see Table 1). Specimen A was sealed with polyurethane lining. The reason why the authors tried these methods of sealing in practical use is to multiply examine the perfectness of moisture sealing. If both materials would have the same performances, Specimen P and Specimen A shall behave similarly. Specimens W, P and A were targeted so that the differential shrinkage is coupled with the sustained flexure with cracking. This situation is also thought to be similar to the problematic top slabs of large numbers of cracks. The moisture sen-sors were embedded inside the specimens (See the low-er center of Fig. 7) to check the transient states of mois-ture over the 18cm depth direction of the specimens.
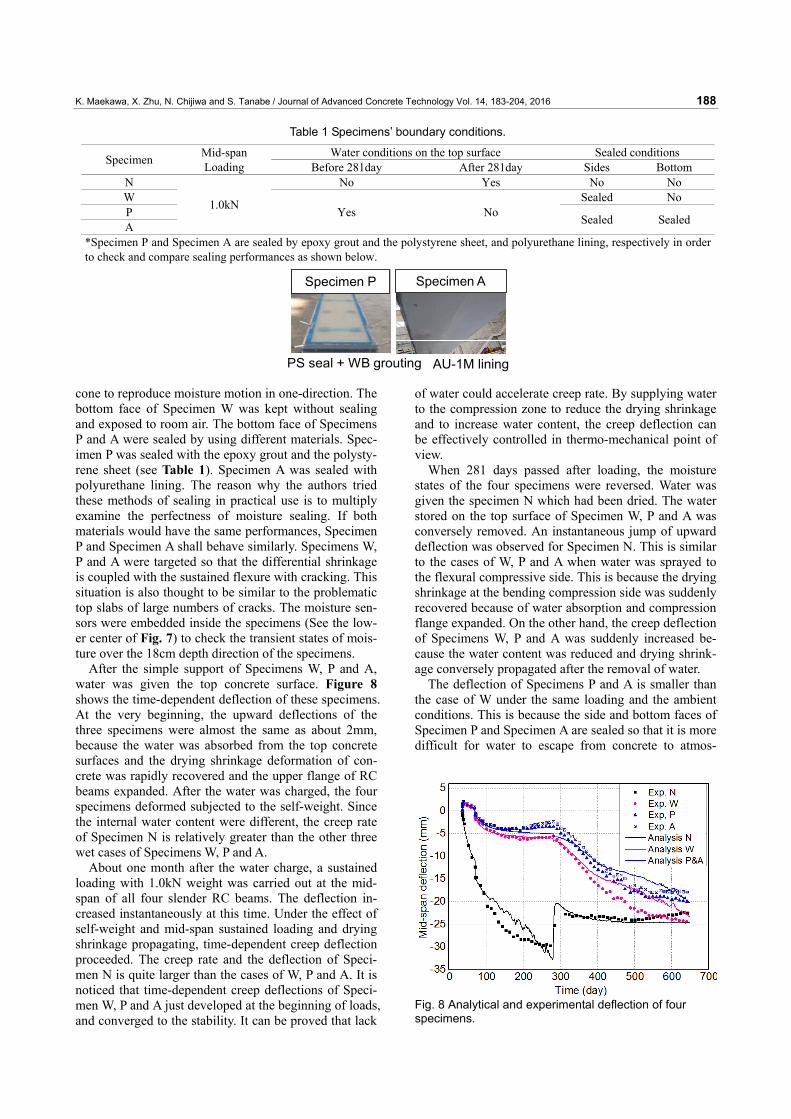
After the simple support of Specimens W, P and A, water was given the top concrete surface. Figure 8 shows the time-dependent deflection of these specimens. At the very beginning, the upward deflections of the three specimens were almost the same as about 2mm, because the water was absorbed from the top concrete surfaces and the drying shrinkage deformation of con-crete was rapidly recovered and the upper flange of RC beams expanded. After the water was charged, the four specimens deformed subjected to the self-weight. Since the internal water content were different, the creep rate of Specimen N is relatively greater than the other three wet cases of Specimens W, P and A.
About one month after the water charge, a sustained loading with 1.0kN weight was carried out at the mid-span of all four slender RC beams. The deflection in-creased instantaneously at this time. Under the effect of self-weight and mid-span sustained loading and drying shrinkage propagating, time-dependent creep deflection proceeded. The creep rate and the deflection of Speci-men N is quite larger than the cases of W, P and A. It is noticed that time-dependent creep deflections of Speci-men W, P and A just developed at the beginning of loads, and converged to the stability. It can be proved that lack
of water could accelerate creep rate. By supplying water to the compression zone to reduce the drying shrinkage and to increase water content, the creep deflection can be effectively controlled in thermo-mechanical point of view.
When 281 days passed after loading, the moisture states of the four specimens were reversed. Water was given the specimen N which had been dried. The water stored on the top surface of Specimen W, P and A was conversely removed. An instantaneous jump of upward deflection was observed for Specimen N. This is similar to the cases of W, P and A when water was sprayed to the flexural compressive side. This is because the drying shrinkage at the bending compression side was suddenly recovered because of water absorption and compression flange expanded. On the other hand, the creep deflection of Specimens W, P and A was suddenly increased be-cause the water content was reduced and drying shrink-age conversely propagated after the removal of water.
The deflection of Specimens P and A is smaller than the case of W under the same loading and the ambient conditions. This is because the side and bottom faces of Specimen P and Specimen A are sealed so that it is more difficult for water to escape from concrete to atmos-
Table 1 Specimens’ boundary conditions.
Specimen Mid-span Loading
Water conditions on the top surface Sealed conditions Before 281day After 281day Sides Bottom
N
1.0kN
No Yes No No W
Yes No Sealed No
P Sealed Sealed
A *Specimen P and Specimen A are sealed by epoxy grout and the polystyrene sheet, and polyurethane lining, respectively in order to check and compare sealing performances as shown below.
Specimen P Specimen A
PS seal + WB grouting AU-1M lining
Fig. 8 Analytical and experimental deflection of four specimens.

K. Maekawa, X. Zhu, N. Chijiwa and S. Tanabe / Journal of Advanced Concrete Technology Vol. 14, 183-204, 2016 189
phere. That is to say, the moisture can be fairly kept in Specimen P and Specimen A, whose side faces and bot-tom ones are sealed. The way of the side sealing of the Specimens P and A is common with silicon. The bottom sealing effect of Specimen A seems a little better than Specimen P, because the deflection of Specimen A is lightly smaller than Specimen P.
For experimental verification of the multi-scale inte-grated analysis used, time dependent creep deflection of four beams with bending cracks was computed as shown in Fig. 8. Figure 9 shows the FE discretization and the mix proportion and the material properties were used for input information of the integrated thermody-namics (Maekawa et al. 2008, Maekawa and Ishida 2002) As the moisture migration is in one-way and wet-ting/drying is defined on the upper and lower faces of the section, comparatively smaller size of elements is specified and the mean sizes of the elements placed around the core of the section are about twice the aver-age size of coarse aggregates in consideration of mois-ture migration analysis and local moisture exchange between aggregates and surrounding cement paste phas-es (Yoneda et al. 2014). Here, the cement hydration just after the mixing and associated micro-structure for-mation was computed in time and space, and the time-dependent deformation of cement hydrates were simu-
lated with the moisture states kept in the formed micro-pores. Thus, the mix proportion of concrete (see Table 2) is used as the input data of this thermo-mechanics integration. After cracking of hardened concrete, multi-directional crack (Maekawa and Fukuura 2014) and the meso-scale models were combined to conduct the be-havioural simulation. The properties of materials used and the bending capacity calculated by the design for-mulae of in-plane theory are summarized in Table 3. Thus, the applied sustained load level is less than 10% of the bending capacity of the specimens, and the short-term material nonlinearity is much less. The time-dependent deflection of beams and slabs under room ambient states were studied (Guo and Gilbert 2002; Gil-bert 1999), and the simulation by the integrated analysis has been verified (Maekawa et al. 2008). This study is further to examine the applicability under strong gradi-ent of moisture profile with exposure to condensed wa-ter.
The room temperature and the relative humidity were measured every one hour for about two years as shown in Fig. 10, which includes one-day averaged values used for the boundary conditions of the integrated analysis. Figure 11 shows the measured and analysed tempera-ture and the relative humidity inside the specimens. Ex-cept for the specimen N, the internal relative humidity is
Support
Loading Points
Axi
s of
sym
me
try
RC element
15cm 300cm
2*2*2*3*3*2*1cmC
en
tra
l axi
s lin
e
1*1
*2*2
*3*3
*2*2
*1*1
cm
Steel position
Fig. 9 Analytical model of RC beams.
Table 2 Mix proportion of concrete used.
W/C (%) water (kg/m3) cement (kg/m3) gravel (kg/m3) sand (kg/m3) air (%) 62.6 164 262 1082 845 4.5
Table 3 Material properties measured and used in the analysis.
Concrete compressive strength Steel yield strength Bending failure load 24 N/mm2 409 N/mm2 17.7 KN
Fig. 10 Ambient temperature and relative humidity and those used for themo-hygral analysis.

K. Maekawa, X. Zhu, N. Chijiwa and S. Tanabe / Journal of Advanced Concrete Technology Vol. 14, 183-204, 2016 190
higher than the ambient state owing to the moisture supply from the top surface of the specimen. The simu-lated deflection as well as the micro-climate is not so far from the reality within the reasonable accuracy for prac-tical use.
3. Site inspection and destructive testing
As discussed in the previous chapters, the computational tool is ready to simulate the long-term multi-scale be-haviors of the underground culverts with the excessive deflection. Here, the states of constituent materials and magnitude of deterioration of the targeted culverts shall be clarified because more than 30 years have passed after construction. Then, the authors made the detailed visual inspection in terms of cracking, laser measure-ment of the internal space (nearly equal to the deflection of the top slab), core sampling of concrete and the de-structive testing for working stresses of reinforcing bars.
Figure 12 shows the mid-span deflection and the lo-cation of cracks. First, the absolute distance between the
top and the bottom slabs was measured by the laser scanning devices. The relative distance compared with the one at the corner edges of the box section was calcu-lated. Unfortunately, the initial distance just after the construction is not available. Then, the authors assume that the top slab would be constructed being in flat plane. Then, the relative distance might be close to the deflec-tion after the construction. This measurement is much larger than the one calculated by the RC in-plane theory. In fact, some bolts and steel devices, which were at-tached to inside of the culvert, were found to be buckled and ruptured. The cracks indicated in red lines in Fig. 12 were found at the 30 years inspection, and the rest of the cracks were recorded at 15 years inspection. Then, it can be said that large number of cracks were further produced between 15 and 30 years of age.
As the excessive soil pressure as discussed in Chapter 2 is likely to introduce the yield of main reinforcement which would result in larger deflection than expected, the destructive testing of working stresses for rein-forcement was carried out (see Fig. 13). First, the con-
0 50 100 150 200 250 300
0
20
40
60
80
100
Rel
ativ
e hu
mid
ity (
%)
Time (day)
Specimen N Specimen W Specimen P Specimen A
0 50 100 150 200 250 300
0
20
40
60
80
100
Rel
ativ
e hu
mid
ity (
%)
Time (day)
Specimen N Specimen W Specimen P&A
Fig. 11 Moisture histograms inside of the hollow core: measurement (left), analysis (right).
Fig. 12 The measurement of deflection at the top slab and mid-span tension strains of steel rebar.

K. Maekawa, X. Zhu, N. Chijiwa and S. Tanabe / Journal of Advanced Concrete Technology Vol. 14, 183-204, 2016 191
crete cover was removed after the strengthening of the neighboring concrete and second, the strain gauges were put on the surface of reinforcing bars. Third, the steel bars with the gauges were cut at both ends and taken off from the main body of the RC box culvert. The steel stress was completely released and the elastic recovery to represent the working stress was measured as shown in Fig. 14. The so-called release test which the authors used in this study has been applied to PC viaducts (Maruyama 2007) and RC piers (Osada et al. 2006) to check the structural soundness as well.
The underground RC culverts are located about sev-eral meters deep beneath a narrow lane in a suburban area. Then, heavy truck and vehicles could not pass. In the past decades, no great earthquake actions happened to this area, too. Furthermore, the traffic loads can be dispersed widely and its impact to the underground cul-vert is much small. Thus, it can be assumed that live load’s effect of traffics is negligible on the excessive deflection discussed in this paper. Other underground RC culverts were also inspected widely in several towns in Japan and the authors could discover the same exces-sive deflection and lots of cracks. Then, this type of damage of urban underground facilities is regarded as a risk factor in the future asset management.
According to the yield strength of reinforcing bars, the elastic strain limit is about 1,800. The strain recov-ery of all points along the bar is less than the yield strain limit. Then, it can be concluded that the working stress of main reinforcement has been less than the yield strength of steel and kept in elasticity. So, the excessive deflection and the large numbers of cracks cannot be explained by the inelasticity of the structures. The work-ing stress level is about 1/2 of the yield strength. These culverts were originally designed based upon the allow-able stress method where the safety factor of the rein-forcement was 3. If the earth pressure wouold be equiv-alent to the the overlay soil, the working stress of rein-forcement is expected to 1/3 of the yield strength. One of the possible reasons of this mismatching of the stress level is that the real earth pressure is 1.5 time larger than the design earth pressure due to the subsidence of the backfill soil as discussed in Section 2.1.
The concrete core samples were also collected and the compressive strength was measued as shown in Table 4. The mix proportion and the composition of concrete were examined as well. The strength development of structural concrete is sufficient. Although the concrete quality is not so high in view of durability, the authors could not find any corrosion of steel in concrete. Then, the excessive deflection cannot be attributed to the aging of constituent materials.
4. Multi-scale thermo-mechanics analysis
This chapter is to simulate the long-term deformation and failure of the underground box culverts by using the multi-scale integrated analysis. These functions have been examined beforehand on soil subsidence (section
2.1) and the differential shrinkage (section 2.2) with sustained stresses before and after cracking. In order to upgrade the reliability of the analysis, the authors con-ducted the in-situ boring test of foundation as shown in Fig. 15, and used the tested properties of soil (see Table 5) for the integrated analysis.
In order to enhance the reliability of the integrated analysis, the relative humidity inside the structural con-crete was measured at site by digging the bore-holes as shown in Fig. 15. The temperature and moisture sensors were set up inside the holes 5cm from the surface and measured for a couple of months. The relative humidity of concrete just close to the outer surface (No.1-2, No.2-2 in Fig. 15) was almost 100% as shown in Fig. 16. For conducting the integrated analysis, we can define the perfectly wet boundary condition of the outer surface. The ambient humidity inside the box culvert was fluctu-ating by air conditioning in between 20 and 40%, but the relative humidity of the micro pores of concrete near the internal surface was almost kept constant as 60%. Then, 60% relative humidity was defined as the other boundary condition for the integrated analysis. The temperature varied rather stably around 25 degree. Then, the constant temperature of all surfaces (25 degree) was assumed in the analysis. The integrated analysis was performed for life assess-ment of the RC culvert whose finite element discretiza-tion of 2D one-half domains is shown in Fig. 17. The space-averaged smeared crack and reinforcement mod-eling is used and the bond between concrete and rein-forcement is expressed by means of the tension stiffness formulation for post-cracking states (Vecchio and Col-lins 1986; Salem and Maekawa 1999). As the steel ar-rangement pattern is not uniform in the longitudinal direction of the culvert, the averaged reinforcement ratio was used for 2D analyses. The wet and dry ambient conditions were defined as stated previously. The wet curing of concrete was assumed for 28 days during which the sealed condition is set forth in the integrated analysis. For reproducing the impact of consolidation, the forced downward displacement was made at the bottom line of backfill soil like the trapdoor test as shown in Fig. 5. Since the subsidence of the backfill soil is thought to take place and converge earlier rather than the concrete creep and drying shrinkage (Bang et al. 2007; Lade and Liu 1998; Siddiquee et al. 2006), the forced displacement increment was made constantly for 2 days. After the termination of consolidation, just the dead weight was continuously applied. According to the soil boring test, the shear stress-strain relation of soil under the confinement c’=98kPa is specified as shown in Fig. 17.
To figure out the effects of the soil subsidence and differential drying shrinkage and creep on the long-term deflection and shear failure of the top slab, the following four sensitivity analyses are executed; Case I: no drying of concrete and no subsidence of soil, Case II: subsidence with no drying, Case III: drying but no subsidence and

K. Maekawa, X. Zhu, N. Chijiwa and S. Tanabe / Journal of Advanced Concrete Technology Vol. 14, 183-204, 2016 192
①Reinforced with carbon fiber sheet ②Remove surface concrete;attach strain gauge; measurement started
③Cut steel rebar by disk sander
④Steel condition after cutting ⑤Concrete chipping ⑥Take off the steel rebarMeasurement finished
⑦Steel rebar restoration ⑧Surface recovery Fig. 13 Tension steel strain measurement process.
Fig. 14 Measurement of elastic strain recovery of reinforcing bars (minus value).

K. Maekawa, X. Zhu, N. Chijiwa and S. Tanabe / Journal of Advanced Concrete Technology Vol. 14, 183-204, 2016 193
Table 4 Concrete material tested results compared with design values.
Investigation Design compression strength (MPa) 24.2 24
Young’s modulus (MPa) 16.6 25 cement (kg/m3) 393 285 water (kg/m3) 248 154
fine aggregates (kg/m3) 643 809 coarse aggregates (kg/m3) 976 1076
water cement ratio (%) 63 54
carbonation depth (mm) 29.2 concrete cov-
er:58.6
Unit: cm
Soil boring test
3540
360
35 320 35
No.3(in the air)
No.1-2
No.1-1
Moisture test
No.2-2 No.2-1
Unit: cm
Measurement point located 5cm deep from the nearest surface
Fig. 15 The location of soil and moisture measurement.
Table 5 Soil foundation investigation test data.
Sample A B wet density (g/cm3) 1.923 1.783 dry density (g/cm3) 1.496 1.349 soil density (g/cm3) 2.68 2.696 water content (%) 28.5 32.2
void ratio 0.792 0.998 saturation ratio (%) 96.6 87
average N-value 2 0 cohesive force (KN/m2) 3.2 9.6 internal friction angel (°) 34.7 32.3
20
22
24
26
28
12/7
12/
27
1/16 2/5
2/25
3/17
T2-1T2-2T320
22
24
26
28
12/
7
12/
27
1/1
6
2/5
2/2
5
3/1
7
T1-1T1-2T3
0
20
40
60
80
100
12/7
12/2
7
1/16 2/5
2/25
3/17
RH1-1RH1-2RH3
0
20
40
60
80
100
12/7
12/2
7
1/16 2/5
2/25
3/17
RH2-1RH2-2RH3
Date (month/day)
Date (month/day)
Rel
ativ
e h
umid
ity (
%)
Tem
per
atu
re (
)
Fig. 16 The measured relative humidity and the temperature inside the concrete.

K. Maekawa, X. Zhu, N. Chijiwa and S. Tanabe / Journal of Advanced Concrete Technology Vol. 14, 183-204, 2016 194
Case IV in consideration of all factors as the most real-istic case as shown in Fig. 18. Thus, the difference be-tween Case I and Case II, III, IV respectively represent each effect described above. In reference to the site-monitoring as shown in Fig. 16, the ambient tempera-ture and the relative humidity of Case III and Case IV were simply maintained at the annual averages (inside culvert: 25 ℃ RH 60%, outside: 20℃ RH 100%).
In Case II and IV, the large subsidence of the backfill soil, which may induce the maximum possible soil pres-sure (see Fig. 6), was intentionally produced. The effect of the increased earth pressure due to the consolidation of backfill is thought to be somewhere in between the two extreme cases of Case I and IV. Figure 18 shows the deflection computed for 4 cases. The most realistic case of IV indicates the predicted deflection, which is close to the reality of site-measurement, and much larg-er than the case-I, which is equivalent to the structural design case for practice. The excessive deflection can be reproduced in the multi-scale integrated simulation, and the strain of main reinforcement is fairly predicted as well. In both computation and the reality, no yield of reinforcement takes place despite of the large deflection.
The influence of the differential shrinkage of concrete can be seen by comparing Case I (no shrinkage, no soil consolidation) with case III. Both flexural and shrinkage cracks computationally take place on the tension side of the top slab accompanying the reduced flexural stiffness. But, in both reality and simulation, no yield of rein-forcement occurs and the earth pressure hardly changes (see Figs. 18 and 19). Anyhow, effect of shrinkage and creep cannot be a sole reason of the excessive deflection.
The effect of backfill soil subsidence can be checked by comparing Case I and Case III of no drying shrink-age. The uneven settlement of the side backfill causes additional soil pressure like the case in Figs. 5 and 6. Consequently, the soil pressure on the top slab and the stress of main reinforcement increases about 1.5 times. Then at the early age when the soil pressure becomes stable, the deflection becomes about 1.5 times large. After that, almost the same rate of deflection proceeds as that of Case I as shown in Fig. 18. In reality, the stress level of flexural tension reinforcement is on the similar magnitude to the computed one (see Fig. 14). Then, it can be concluded that the soil subsidence can-not be a unique reason of the excessive deflection.
The simple summation of Case II and Case III is indi-cated by dotted line in Fig. 18. This fictitious line does not reflect the nonlinear interaction of creep and shrink-age. This trend denoted by the dotted line is almost the same as the full nonlinear analysis of Case IV up to 1~2 days, because the drying shrinkage is almost nil. After-wards, the deflection by the full analysis of Case IV gradually deviates from the dotted line of the simple summation of individual impact of creep, shrinkage and the soil subsidence up to 100~300 days after the loading. Here, attention shall be directed to 300~500 days after which the rate of deflection by the full analysis Case IV is greatly accelerated, and the absolute deflection comes up to 10~20 times the one of Case I. As a matter of fact, the computed deflection around 30 years of age is al-most similar level to the real deflection, although the deflection at each location has some scatter as shown in Fig. 12. In consideration of the possible deviation of the
Backfill 80cm
680cm
35cm
40cm
360cm
160cm
Concrete base(depth 15cm)
Sand soilC=0MPaɸ=35˚N=0~2Initial stiffness=5MPa
Vertical restraint Forced displacement
C.L
Bond element
Elastic element
Tensile reinforcement ratio:0.9%
Haunch:15cm×15cm
Culvert top slab
35cm
0
20
40
60
80
100
120
0 0.05 0.1 0.15 0.2
Shear strain
Sh
ea
r st
ress
(kP
a)
σc´= 98kPa
Shear stress-strain curve
60cm
Fig. 17 Two dimensional model of the underground RC culvert.

K. Maekawa, X. Zhu, N. Chijiwa and S. Tanabe / Journal of Advanced Concrete Technology Vol. 14, 183-204, 2016 195
soil properties and ground structures, it is thought to be within the tolerance.
It is thought that some highly nonlinear event might take place at the turning point of about 300-500 days. For clarifying the trigger of the following high nonline-arity, the strain field of out-of-plane section is shown in Fig. 21. Just after the settlement of the backfill soil, mode of deformation is flexure and bending crack zone can be seen on the bottom face near the span center of the top slab. But, this mode of deformation suddenly
shifts to out-of-plane shear accompanying the diagonal cracking as shown in Fig. 21. Afterwards, shear defor-mation proceeds more and more, and the internal in-clined shear crack is further propagating. Under this situation, deflection is going on without yield of main reinforcement.
Here, we have a tentative conclusion that the exces-sive deflection would be attributed to the “delayed shear failure”. Let us direct our attention again to the strain of main reinforcement for the cases of IV and II as shown
-15
-12
-9
-6
-3
0
0.01 0.1 1 10 100 1000 10000100000
Def
lect
ion
(mm
)
Elapsed time after curing (day)
Case I
Full analyses(Case IV)
Internal moisture contribution (Case III)
Uneven settlement contribution (Case II)
Soil settlement
Measured
Case II andCase III added
Measured
CaseInside
RH (%)OutsideRH (%)
Uneven settlement
I≒design 99.99 99.99 Without
II 99.99 99.99 With
III 60 99 without
IV=real 60 99 with
Effect of uneven settlement
Effect of internal moisture
Effect of both two effects
-15
-10
-5
0
-1500 -1000 -500 0 500 1000 1500De
form
atio
n (m
m)
Disance from center (mm)
-1000
-800
-600
-400
-200
0
0.01 0.1 1 10 100 100010000
Str
ain (10
-6)
Elapsed time after curing (day)
Case I
Internal moisture contribution (Case III)
0
300
600
900
1200
0.01 0.1 1 10 100 100010000
Str
ain
(1
0-6)
Elapsed time after curing (day)
Measured
Soil settlement
Case IUneven settlement contribution (Case II)
Full analyses(Case IV)
1.0
1.2
1.4
1.6
1.8
0.01 0.1 1 10 100 100010000
Ave
rage
soi
l pr
ess
ure
(kP
a)
Overburden soil weight (124kPa)
180
160
140
120
100
Fig. 20 Compressive steel strain at mid-span with internal RH contour figure.
Fig. 19 Tension steel strain at mid-span with average vertical soil pressure on culvert.
Fig. 18 Long-term deflection at mid-span and deformational mode at current age.
After settlement 300days 10000days
Full analysis ※20 times magnified deformation
Bending strain
Bending strain+
Shear strain!?
2000με
1500
1000
500
0
Fig. 21 The shear cracks observed near the haunch in the two dimensional analysis.

K. Maekawa, X. Zhu, N. Chijiwa and S. Tanabe / Journal of Advanced Concrete Technology Vol. 14, 183-204, 2016 196
in Fig. 19. The strain of main reinforcement at the span center is almost similar. Thus, the flexural deflection based upon in-plane mode is thought to be similar as well. But, the overall deflection is much different. Only possible explanation is that the displacement component of out-of-plane shear is different. This is “shear failure”.
The authors also checked the effect of 3D stress field in more detail by using the FE mesh as shown in Fig. 22. The arrangement of reinforcing bars in the longitudinal direction of the culvert is exactly reproduced. The rein-forcement ratio defined in the 2D analysis (Fig. 17) is the averaged one of reinforcing bars along the axis of the culvert (Fig. 22). The stress of main reinforcement
and the deflection are similar to the 2D analysis at the span center as shown in Fig. 23. The displacement of 3D analysis at 30 years is a bit smaller in comparison with those of 2D analysis having sharper localization of the shear failure zone, because the diagonal shear crack band is a little blunt due to non-uniform pattern of the reinforcement arrangement and the interactiofhn of shear crack band of 3D extent along the axis of the duct. Anyhow, the delayed diagonal shear crack propagation is the key factor of the excessive deflection.
Figure 24 shows the computed mean sectional shear force over time. For the full nonlinear coupling analysis, the computed shear force is kept almost constant and
Backfill soil 80cm
680cm
35cm
40cm
360cm
160cm
Concrete base(depth 15cm)
Sandy soilCohesion = 0MPaInt. friction ɸ=35˚N value = 0~2Initial soil stiffness= 5MPa
Vertically restrained
C.L
Interface element
Elastic elementsFor sheet pile
60cm
X
Z
Y
3D alternate of two rebar arrangement
Longitudinal direction of duct
Forced displacement
Fig. 22 Three-Dimensional FE model of underground RC culvert.
1 year 15 years 35 years
Flexure cracks
Shear crack
Shear crack
0
5
10
15
20
25
30
Num
ber
of c
rack
s
Crack width (mm)
15 years
30 years
D3
D2
D1
ε1
ε2
Fig. 23 Contour of the maximum principle strains and mid-span deflection in time domain.

K. Maekawa, X. Zhu, N. Chijiwa and S. Tanabe / Journal of Advanced Concrete Technology Vol. 14, 183-204, 2016 197
about 80~90% of the static shear capacity estimated by the shear design formulae (JSCE 2012). Then in compu-tation, the shear failure of the section takes place under the sustained shear force which does not reach the in-stantaneous static capacity. As stated previously, the diagonal shear crack starts to appear in the analysis at about 300 days and extends over the depth of the top slab for the next several years. At this moment, drying of moisture in concrete has been almost finished.
As shown in Fig. 24, the sectional mean shear stress is decayed after the shear failure. But, the soil-RC sys-tem is kept stable owing to the interaction. After the shear cracking, the vertical soil pressure around the span center of the top slab is definitely decreased, and the centroid of the soil pressure shifts (Dasgupta and Sengupta 1991) to the corner of high stiffness. Thus, the delayed shear failure under sustained shear force is thought to be caused mainly by the time-dependent crack propagation, i.e., “mechanistic” delayer shear failure, which shall be confirmed experimentally in the following chapter.
5. Out-of-plane shear failure and its detection
In the previous sections, out-of-plane shear failure is assumed to be associated with the excessive deflection based upon both the integrated analyses and the site monitoring. Then, it is very critical to prove the pres-ence of out-of-plane shear cracks. But, geometrically,
the shear crack which may develop within the web zone of the slabs and the walls cannot be seen from inside of the tunnels and utility ducts as shown in Fig. 25. The out-of-plane shear failure always accompanies the diag-onal cracks which may produce the transverse gap on the surface of members. On the contrary, the flexural cracks are introduced normal to the axis of the members, and just the flat opening mode arises as shown in Fig. 26.
The authors illuminated the slab surface laterally, and could find the shadow, which may not be made by the flat opening of flexure cracks but produced by the transverse gap of the shear cracking. When we touch and trace the surface by fingers, it is also easy to recog-nize the shear crack having the transvers gap in out-of-plane motion. As for the non-destructive testing to de-tect the shear cracking, this illumination method will be useful especially in dark spaces.
Finally, the authors conducted the destructive testing to directly observe the shear crack planes by digging several bore-holes as shown in Fig. 27. The core sam-ples and the mark of crack planes were obtained and their extension exhibits the inclined crack pattern as shear. Here, the presence of the diagonal shear crack and the out-of-plane failure zone is demonstrated. The close-up of the 3D nonlinear analysis around the corner of the duct (see Fig. 23) is added in Fig. 27. The loca-tion of the major shear crack zone accompanying the greatest surface crack opening and the shear gap rough-ly coincides with the 3D analysis. As stated in the pre-
0.0
0.5
1.0
1.5
2.0
2.5
0 20 40 60 80 100 120 140 160 180 200
After soil settlement 1year
10years 25years
Distance from the center at top slab(cm)
Average 1.4times
Local 1.9times
Ver
tical
soi
l pre
ssur
e co
effic
ient
Fig. 24 Profile of the vertical earth pressure and correponding sectional shear force.
Large crack
Small crack
Bending moment(Abhijit1991)
Tension area =crack
Crack site-investigation
A B
A
B
Fig. 25 Site inspections of problematic cracks near the corner of the box section.

K. Maekawa, X. Zhu, N. Chijiwa and S. Tanabe / Journal of Advanced Concrete Technology Vol. 14, 183-204, 2016 198
vious section, the secondary blunt shear band is seen in the analysis. Then, some other shear crack(s) might ex-ist near by the identified crack at site.
The analytical discussion is firmly supported by these circumstantial evidences. There are some other reports on the out-of-plane failure of underground concrete members such as the concrete invert for tunnels located in deep rocks (Maruyama 2013). But in this paper, the discussion is focused on the shallow underground utility ducts under differential shrinkage and the instability of foundation.
6. Delayed shear failure of RC beams under sustained loads
The integrated modelling used in this study has been
already verified regarding the reduced shear capacity of drying RC members (Gebreyouhannes et al. 2014). Then, this drying effect of structural concrete is implic-itly taken into account in the shear failure simulation as shown in Fig. 24. But in this verification, the loading rate of shear was rather rapid than the case of this study. The delayed shear failure simulation of the culvert is the case where the load is rather sustained. Then, in this chapter, the authors try to examine the case where the shear failure occurs under the sustained shear forces.
The multi-scale integrated analysis (Maekawa et al. 2008, Yoneda et al. 2014, Gebreyouhannes et al. 2014) used in this study brings about the delayed shear failure computationally as shown in Fig. 28. When 80% of the short-term shear capacity is kept loaded, the diagonal cracks gradually propagate and finally, instability of
Touch by finger
Ha
unc
h 1-2mm raised
See the shadow
Flexure cracks Shear cracks
Coarse aggregate
Relative deformation
Steel rebar
Relative deformation
Crack
Flat Opening
Crack
Sh
ear
cra
ck
Flat Opening
Fle
xure
cra
ck
Steel rebar
Fig. 26 Illuminating detection of shear cracks.
Principal strain pattern Location of diagonal crack
Core boring location
reinforcing bars
Expected diagonal crack
Fig. 27 Image of the inner surface of the bore-hole and detected diagonal shear crack.

K. Maekawa, X. Zhu, N. Chijiwa and S. Tanabe / Journal of Advanced Concrete Technology Vol. 14, 183-204, 2016 199
crack propagation causes member failure at about 100 days as shown in Fig. 28. As a matter of fact, almost the constant shear force of about 80% of the short-term static one was being applied (see Fig. 24) and reached the failure at about 300 days. When the sustained load level is raised, the period of life to failure is exponen-tially reduced. This trend computed for delayed shear is most similar to the creep rupture’s life of concrete in compression (Rusch 1960).
Sarkhosh et al. (2013) carried out the valuable exper-iments of RC beams subjected to constant loads of dif-ferent magnitude as shown in Fig. 29. The delayed shear failure was reported. Here, the relation of the shear force and corresponding life time till failure was not clear. As a matter of fact, deviation of experimentally obtained short-term shear capacity of RC beams is about 10% around the mean value. Then, it is logically hard to identify the response under 90% of the static capacity with small numbers of specimens. In other words, the exact short-term shear capacity cannot be identified before the experiment. Then in some cases, the failure happened before the target load level which was esti-mated beforehand. It actually happens that the estimated target loads could be more than the real static capacity, especially when the target level is rather close to the potential capacity.
Piseth et al. (2014) conducted the shear loading test where the persistent shear force was applied and its magnitude was increased step by step according to the diagonal crack propagation monitored periodically. Fi-nally, the propagation of a diagonal crack under the sus-
tained shear force was observed. Here, the different shear crack paths were also reported when the load-time path was changed. Since the time till failure was about a week, the progress of the drying shrinkage is estimated to be less. Thus, it can be concluded again that the de-layed shear failure or creep rupture may occur under constant loads. The point of discussion is how long RC beams can actually bear the constant high shear force.
In considering the experimental and analytical back-ground stated previously, the authors introduced the step-wise loading pattern as shown in Fig. 30 and Table 6 to the simply supported RC beam (see Fig. 31). The shear span to depth ratio of the RC beam was decided so that it may roughly fit the kinematics of foreseen com-bined sectional forces around the corner of the culvert.
80
82
84
86
88
90
92
94
96
0.01 0.1 1 10 100 1000 10000Time (day)
Su
sta
ine
d lo
adi
ng
leve
l (%
)
Failure before target loading level
Failure under sustained loading
Still under sustained loading
Fig. 29 Sustained shear experiment and delayed failure (Sarkhosh et al. 2013).
Fig. 30 Stepwise sustained loading in experiment.
Elapsed time after loading(day)
Load
P(k
gf)
Load level and failure time
0
1000
2000
3000
4000
5000
6000
0.0001 0.001 0.01 0.1 1 10 100 1000
0.99load0.90load
0.82load0.71load
Analytical beam
700Load PLoad P
250
250
Anchored bars at both ends
1500
2@19@bottom
ElasticWidth:150※mm
0.71 load level
Fig. 28 Computed delayed shear failure under different sustained loads.

K. Maekawa, X. Zhu, N. Chijiwa and S. Tanabe / Journal of Advanced Concrete Technology Vol. 14, 183-204, 2016 200
Originally, this method of step-wise uplift of loads has been used in experiments for the high cycle fatigue life of RC and PC bridge deck slabs. In this study, first, the middle-level constant load was applied for two or three days as shown in Fig. 30. If no failure takes place, the sustained load level was slightly raised, and we may
wait for the failure. If not, we go to the next stage. Then, we can roughly obtain the load level which causes de-layed shear failure to take 2~3 days till failure.
Figure 31 shows the experimental set-up, and the de-flection was measured under the step-wise load as shown in Fig. 30. The mix proportion of concrete used
Table 6 Stepwise loading history.
Step 1 2 3 4 5 6 7 8 9 10 11 12 13 14Sustained time (days) 1.9 2.2 2.6 2.1 2.0 2.0 2.0 2.0 2.9 3.0 3.0 3.1 2.8 0.1
Average loading increase (KN) 18.7 17.4 22.8 20.6 18.7 20.9 20.0 19.1 20.2 20.4 20.1 18.8 19.9 22.5
Table 7 Mix proportion of concrete.
W/C (%) water (kg/m3) cement (kg/m3) gravel (kg/m3) sand (kg/m3) air (%) 40 170 425 950 760 4.5
Fig. 31 Geometry of the RC beams (left) and measurement devices installed on the beam (right).
0 10 20 30 40 50 60 7050
52
54
56
58
60
Co
ncre
te c
ompr
ess
ive
stre
ngth
(MP
a)
Time since concrete casting (day)
Experiment Analysis
10cm
20c
m
Fig. 33 Computed and experimentally obtained compressive strength of cylinder and mean drying shrinkage of the standard specimen subjected to the ambient relative humidity in laboratory.
Table 8 Properties of materials.
concrete compressive strength (N/mm2)
concrete tensile strength (N/mm2)
steel yield strength (N/mm2)
bending failure load (KN)
shear failure load (KN)
57.3 (36days) 3.48 (39days) 450 285 275
Fig. 32 FE model of the delayed shear experiment of RC beam.

K. Maekawa, X. Zhu, N. Chijiwa and S. Tanabe / Journal of Advanced Concrete Technology Vol. 14, 183-204, 2016 201
for the input data of the thermo-hygral integrated analy-sis is listed in Table 7. The FE discretization is shown in Fig. 32 according to the dimensioning of the experiment. The wet curing was continued till 11 days after casting of fresh concrete.
During this period of wet curing, the cement hydra-tion in concrete, the micro-structure formation and strength development were simulated under no external force. The shrinkage deformation driven by the capillary forces and disjoining pressure was computed after 11 days of wet curing by the integrated analysis (Yoneda et al. 2013, 2015, Maekawa et al. 2008). Here, the room temperature was 20 degree Celsius and the relative hu-midity was 60%. Figure 33 shows the strength devel-opment of the cylinder specimen in uniaxial compres-sion, and the averaged drying shrinkage of the standard specimen. The computed results by the integrated analy-sis do not deviate from the reality. The step-by-step loading started at 36days after mixing, and the corre-sponding displacement at the span center of the top slab and the load-displacement relation are indicated in Fig. 34a. At the loading from 240kN, the shear failure sud-denly took place before keeping the load at the higher level.
Since the reproducibility of the shear capacity is
about 10% around the mean value (Okamura and Higai 1980) based upon about two thousands specimens, the authors re-computed the response under 95% mechanis-tic action of the experimentally applied load as shown in Fig. 34b. The relation of load-deflection and the transi-ent displacement with regard to time fairly follow up the experiment. Figure 35 is the close-up of the progres-sive deflection of the top slab under the sustained force
Fig. 35 Three stages of creep deflection under sustained loads just before the final shear failure.
Fig. 34a Applied load of 100% magnitude and corresponding deflection versus time.
Fig. 34b Applied load of 95% magnitude and corresponding deflection versus time.

K. Maekawa, X. Zhu, N. Chijiwa and S. Tanabe / Journal of Advanced Concrete Technology Vol. 14, 183-204, 2016 202
(95% in Fig. 34b) just before the collapse. The delayed shear failure certainly took about 2.3 hours under the 270kN, and the computation predicts about 2hours from 6mm to 18mm deflection in progress. Since the estimat-ed short-term shear capacity is 275kN (JSCE 2012), the observed delayed shear failure of about 2 hours will correspond to about 90% of the static capacity.
If the period of load suspension at each progressive step would be 10 days or 100 days, we will be able to have the level of shear force corresponding to each pe-riod of life till failure. Thus, this study does not encom-pass the whole figure of delayed shear failure, but mere-ly examines the short-term delayed shear failure and the partial verification of the integrated analysis. The de-layed shear failure under middle and/or lower levels of sustained loads will be clarified in future works.
7. Conclusions
In conjunction with the site inspection and monitoring, laboratory experiments and multi-scale integrated anal-yses, the mechanism of the excessive deflection and the out-of-plane shear failure of real underground box cul-verts were investigated, and the following conclusions are earned. (1) The out-of-plane diagonal shear cracks were found
near the corner of shallow underground RC box culverts in service, and the excessive deflection which is more than 10times the design deflection was recognized.
(2) The shear cracks appearing under the top slabs were detected by the illuminating technique as well as the destructive testing with bore holes. According to the past monitoring of cracks from inside of the culvert, its width and the absolute extension of cracking was increasing in the past three decades.
(3) The thermo-hygral multi-scale analysis was used for behavioural simulation of the soil-RC culvert system from the construction to the current state. Then, computationally reproduced are the transient extension of the shear crack, the delayed failure and the large excessive deflection of the culvert.
(4) The sensitivity analyses was systematically carried out in terms of i) subsidence of the backfill soil foundation, ii) differential shrinkage, and iii) sus-tained higher stress causing creep and transient crack propagation. It is found that coupling of all three factors lead to the excessive deflection with delayed shear failure. The delayed shear failure cannot be explained by only one factor.
(5) The delayed shear failure under sustained load less than the maximum shear capacity was proved by the experiment and the numerical analysis was par-tially verified.
Acknowledgements The authors express their sincere gratitude to Prof. R. Kuwano of The University of Tokyo, Dr. E. Ge-breyouhannes of Addis Ababa University, Mr. M. Ku-
nieda of Graduate School of the University of Tokyo, Dr. T. Mishima of Maeda Corporation, Dr. Y. Hiratsuka of Sho-bond Corporation for their valuable advices and suggestions. This paper was financially supported by MEXT/JSPS KAKENHI 23226011. References Abhijit, D. and Bratish, S., (1991). “Large-scale model
test on square box culvert backfilled with sand.” ASCE, Journal of Geotechnical Engineering, 117(1), 156-161.
Asamoto, S., Ishida, T. and Maekawa, K., (2006). “Time-dependent constitutive model of solidifying concrete based on thermodynamic state of moisture in fine pores.” Journal of Advanced Concrete Technology, 4(2), 301-323.
Bang, D. P. D., Benedetto, H. D., Duttine, A. and Ezaoui, A., (2007). “Viscous behaviour of dry sand.” International Journal for Numerical and Analytical Methods in Geomechanics, 31(15), 1631-1713.
Bažant, Z. P., Yu, Q., Li, G. H., Klein, G. J. and Krístek, V., (2010). “Excessive deflections of record-span prestressed box girder - Lessons learned from the collapse of the Koror-Babeldaob Bridge in Palau.” Concrete International, ACI, 32, 44.
Bazant, Z. P., (2001). “Prediction of concrete creep and shrinkage: past, present and future.” Nuclear Engineering and Design, 203(1), 27-38.
Bennett, R., Wood S., Drumm, E. and Rainwater, N., (2005). “Vertical loads on concrete box culverts under high embankments.” Journal of Bridge Engineering, 10(6), 643-649.
Chijiwa, N., Zhu, X., Ohno, H., Tanabe, S., Nakarai, K. and Maekawa, K., (2015). “Delayed shear crack formation of shallow RC box culverts in service.” In: C. Hellmich, B. Pichler and J. Kollegger, Eds. CONCREEP 10, Mechanics and Physics of Creep, Shrinkage and Durability of Concrete and Concrete Structures, 1579-1586.
Dasgupta, A. and Sengupta, B., (1991). “Large-scale model test on square box culvert backfilled with sand.” Journal of Geotechnical Engineering, 117, 156-161.
Gebreyouhannes, E., Yoneda, T., Ishida, T. and Maekawa, K. (2014). “Multi-scale based simulation of shear critical reinforced concrete beams subjected to drying.” Journal of Advanced Concrete Technology, 12(10), 363-377.
Gilbert, R. I., (1999). “Deflection calculation for reinforced concrete structures: why we sometimes get it wrong.” ACI Structural Journal, 96(6), 1027-1032.
Guo, X. and Gilbert, R. I., (2002). “An experimental study of reinforced concrete flat slabs under sustained service loads.” UNICIV Report R-407.
Gutierrez, M., Ishihara, K. and Towhata, I., (1993). “Model for the deformation of sand during rotation of principal stress directions.” Soils and Foundations, 33(3), 105-117.
Japan Society of Civil Engineers, (2012). “Standard

K. Maekawa, X. Zhu, N. Chijiwa and S. Tanabe / Journal of Advanced Concrete Technology Vol. 14, 183-204, 2016 203
Specification of Concrete Structures (Design).” JSCE, Maruzen, Tokyo.
Kunieda, M., Zhu, X., Nakajima, Y., Tanabe, S. and Maekawa, K., (2014). “Long-term serviceability and risk assessment of shallow underground RC culverts and tunnels.” In: K. van Breugel and E. A. B. Koenders, Eds. Proceedings of the 1st Ageing of Materials & Structures, The Netherland, 376-383.
Kuwano, R. and Ebizuka, H., (2010). “Trapdoor tests for the evaluation of earth pressure acting on a buried structure in an embankment.” In: Proceeding of the 9th International Symposium on New Technologies for Urban Safety of Mega Cities in Asia, USMCA, Kobe.
Lade, P. and Liu, C., (1998). “Experimental study of drained creep behavior of sand.” Journal of Engineering Mechanics, ASCE, 124(8), 912-920.
Maekawa, K., Ishida, T. and Kishi, T., (2008). “Multiscale Modeling of Structural Concrete.” Taylor & Francis.
Maekawa, K. and Fukuura, N., (2014). “Nonlinear modeling of 3D structural reinforced concrete and seismic performance.” In: Thomas T. C. Hsu, ed. Infrastructure Systems for Nuclear Energy, John Wiley & Sons.
Maekawa, K. and Ishida, T., (2002). “Modeling of structural performances under coupled environmental and weather actions.” Materials and Structures, 35, 591-602.
Maruyama, K., (2007). “Damage investigation of Tarui highway PRC bridge: What happened and what we should do in design and construction in practice.” Cement and Concrete, 725, 14-18 (in Japanese).
Maruyama, M., (2013). “Rebuild invert concrete through continuous 61-day Lane-Closure, -Joshin-etsu Expressway Nikkure-yama Tunnel-.” Tunnels and Underground, 44(12), 17-28. (in Japanese)
Mitani, T., Hyodo, H., Ota, K. and Sato, R., (2011). “Discover and the evaluation of shear strength decrease of reinforced normal-strength concrete beams.” Proceedings of Japan Concrete Institute, 33(2), 721-726. (in Japanese)
Moshirabadi, S., Soltani, M. and Maekawa, K., (2015). “Seismic interaction of underground RC ducts and neighboring bridge piers in liquefiable soil foundation.” Acta Geotechnica, 10(6), 761-780.
Ohno, M., Chijiwa, N., Suryanto, B. and Maekawa, K., (2012). “An investigation into the long-term excessive deflection of PC viaducts by using 3D multi-scale integrated analysis.” Journal of Advanced Concrete Technology, 10, 47-58.
Okamura, H. and Higai, T., (1980). “Proposed design equation for shear strength of reinforced concrete beams without web reinforcement.” Proceedings of Japan Society of Civil Engineers, 300, 131-141.
Osada, K., Ono, K., Maruya, T. and Ikeda, S., (2006). “Seismic performance of concrete piers deteriorated by alkali silica reaction.” Concrete Journal, 44(3), 34-42 (in Japanese).
Pickett, G., (1942). “The effect of change in moisture-content on the creep of concrete under a sustained load.” Journal of American Concrete Institute, 38, 333-356.
Piseth, V., Nakarai, K., Chijiwa, N. and Maekawa, K., (2015). “Experimental study on the effects of a loading rate on the shear performance of an RC beam.” CONCREEP 10, Mechanics and Physics of Creep, Shrinkage and Durability of Concrete and Concrete Structures, ASCE, 1561-1569.
Rusch, H., (1960). “Research towards a general flexural theory for structural concrete.” Journal of the ACI, 57(1), 1-27.
Salem, H. and Maekawa, K., (1999). “Spatially averaged tensile mechanics for cracked concrete and reinforcement under highly inelastic range.” Journal of Materials, Concrete Structures and Pavements, V-42(613), 277-293.
Sarkhosh, R., Walraven, J., den Uijl, J. and Braam, R., (2013). “Shear capacity of concrete beams under sustained loading.” IABSE Symposium Report, 99, 162-169.
Schabowicz, K. and Hola, J., (2012). “Nondestructive elastic-wave tests of foundation slab in office building.” Materials Transactions, Special Issue on APCNDT 2009, 53(2), 296-302.
Siddiquee, M. S. A., Tatsuoka, F. and Tanaka, T., (2006). “FEM Simulation of the viscous effects on the stress-strain behaviuour of sand in plane strain compression.” Soils and Foundations, 46(1), 99-108.
Soltani, M. and Maekawa, K., (2015). “Numerical simulation of progressive shear localization and scale effect in cohesionless soil media.” International Journal of Non-Linear Mechanics, 69(March), 1-13.
Tadros, M. K. and Benak, J. V., (1989). “Soil pressure on box culverts.” ACI Structural Journal, 86(4), 439-450.
Towhata, I. and Ishihara, K., (1985a). “Undrained strength of sand undergoing cyclic rotation of principal stress axis.” Soils and Foundations, 25(2), 135-147.
Towhata, I. and Ishihara, K., (1985b). “Modeling soil deformation undergoing cyclic rotation of principal stress axes.” In: Proceeding of 5th International Conference on Numerical Method in Geomechanics, Nagoya, Japan, 523-530.
Vecchio, F. and Collins, M. P., (1986). “The modified compression-field theory for reinforced concrete element subjected to shear.” ACI Journal, March-April, 219-231.
Woodbury, W. H., Bayer, E. J., Botts, A. E., Daley, C. A., Pettus, J. K. and Wilks, J. R., (1926). “Corrugated metal culverts for railroad purposes.” Preparing specifications, with assistance of committee on iron and steel structures, Bull. Am. Railway Eng. Assoc., 27(284), 794-828.
Yoneda, T., Ishida, T., Maekawa, K., Gebreyouhannes, E. and Mishima, T., (2015). “A micro-cracking model coupled with micro fracture and water status in micro

K. Maekawa, X. Zhu, N. Chijiwa and S. Tanabe / Journal of Advanced Concrete Technology Vol. 14, 183-204, 2016 204
pore structures.” Journal of Japan Society of Civil Engineers, E2 (Materials and Concrete Structures), 71(3), 263-282.
Yoneda, T., Ishida, T., Maekawa, K., Gebreyouhannes, E. and Mishima, T., (2013). “Simulation of early-age cracking due to drying shrinkage based on a multi-scale constitutive model.” Poromechanics V: ASCE,
579-588. Zhu, X., Kunieda, M., Nakajima, Y., Tanabe, S. and
Maekawa, K., (2014). “Long-term serviceability and delayed shear failure risk assessment of shallow underground RC culverts.” In: J. Sim Ed., The 6th International Conference of Asian Concrete Federation, Seoul.