mechanism of reaction in naalcl4 molten salt batteries with … · lowest plateau is associated...
TRANSCRIPT

General rights Copyright and moral rights for the publications made accessible in the public portal are retained by the authors and/or other copyright owners and it is a condition of accessing publications that users recognise and abide by the legal requirements associated with these rights.
Users may download and print one copy of any publication from the public portal for the purpose of private study or research.
You may not further distribute the material or use it for any profit-making activity or commercial gain
You may freely distribute the URL identifying the publication in the public portal If you believe that this document breaches copyright please contact us providing details, and we will remove access to the work immediately and investigate your claim.
Downloaded from orbit.dtu.dk on: Mar 01, 2020
Mechanism of Reaction in NaAlCl4 Molten Salt Batteries with Nickel Felt Cathodes andAluminum Anodes. Part II: Experimental Results and Comparison with ModelCalculations.
Knutz, B.C.; Berg, Rolf W.; Hjuler, Hans Aage; Bjerrum, Niels
Published in:Journal of The Electrochemical Society
Link to article, DOI:10.1149/1.2221099
Publication date:1993
Document VersionPublisher's PDF, also known as Version of record
Link back to DTU Orbit
Citation (APA):Knutz, B. C., Berg, R. W., Hjuler, H. A., & Bjerrum, N. (1993). Mechanism of Reaction in NaAlCl4 Molten SaltBatteries with Nickel Felt Cathodes and Aluminum Anodes. Part II: Experimental Results and Comparison withModel Calculations. Journal of The Electrochemical Society, 140(12), 3380-3390.https://doi.org/10.1149/1.2221099

Mechanism of Reaction in NaAICI4 Molten Salt Batteries with Nickel Felt Cathodes and Aluminum Anodes
II. Experimental Results and Comparison with Model Calculations
B. C. Knutz, a R. W. Berg, H. A. Hjuler,* and N. J. Bjerrum* Molten Salts Group, Chemistry Department A, The Technical University of Denmark, DK-2800 Lyngby, Denmark
ABSTRACT
The bat tery systems: A1/NaC1-A1C13-A12XJNi-felt (X = S, Se, Te) and the corresponding system without chalcogen have been studied experimental ly at 175~ Charge/discharge experiments, performed on cells with NaC1 saturated melts, show that advantages with regard to rate capabi l i ty and cyclabil i ty can be obtained with systems containing dissolved chalcogen compared with the chalcogen-free system. Exchange of chalcogen between cathode and electrolyte during cycling was confirmed by performing gravimetric analysis and Raman spectroscopy of the electrolytes. Cathode reactions were studied by coulometric t i t rat ions (performed on cells with slightly acidic NaC1-A1C13 melts and small amounts of chalcegen) and compared with model calculations. Cells containing chalcogen revealed at least three voltage plateaus during cycling. The lowest pla teau is associated with formation/decomposit ion of essentially NiySz and Ni, Sez in the sulfide and selenide system, respectively. Cells containing selenide revealed extra capacity below the NL Sez-plateau, most probably associated with a AI~Ni, Se~ compound. On the second plateau of sulfide systems NiC12 or a Niy~z C12y_2z compound with y > (4.4 +- 0.2) �9 z is formed during charging. Reduction of the formed compound to Ni takes place via consumption of sodium chloride. For [ c'l
% ?'A1 species. acidic melts, sulfide at the cathode was found to be present as A1 \C1 /
Cl / C1 j
It is well-known that there is a marked need for im- proved rechargeable batteries, e.g., for load-leveling and tract ion purposes. The bat tery A1/NaC1-A1C13-A12SJNi- felt (175~ or the corresponding system with a l iquid sodium-anode and a Na § conducting separator may turn out as candidates for these applications.
We have in the preceding paper (Part I s) presented a model describing thermodynamic properties of the above mentioned bat tery system.
Here we report experimental results obtained with cells in which the cathode mater ial is formed in situ during cy- cling. The cells had a pure nickel metal felt cathode in con- tact with a NaC1-A1C13 melt to which eventually was added elemental sulfur or a sulfur containing compound. Experi- ments were also performed on cells containing selenium and tellurium.
It is known 2 that sulfur, selenium, and perhaps tel lurium can react with aluminum in chloroaluminate melts accord- ing to the reactions
2A1 + 3X ---> "AleX3" [la]
o r
2A1 + 3X + 2NaC1 + NaA1C14 --> 3"NaA1XC12" [lb]
where X = S, Se, and perhaps Te. "A12X3" and "NaA1XC12" are apparent formulas, since the chalcogens probably exist in the form of polymeric species in NaC1-A1C13 melts. Fur- thermore, elemental chalcogens may be reduced by reac- tion with nickel forming chalcogenides, resulting in a par t ly charged cell instead of a discharged cell.
Results from several sets of experiments are reported. We first carr ied out charge/discharge tests. In order to investi- gate the positive electrode reactions, gravimetric analyses, Raman studies, and potentiometric measurements were performed.
Exper imenta l Common experimental conditions.--The experimental
cells used in this work are shown in Fig. I and 2. They were made of borosil icate glass. Aluminum metal (99.999 % from
* Electrochemical Society Active Member. a Present address: Randersgade 11, 2. th., DK-2100 Kabenhavn
s, Denmark.
Atomergic Chemetals Corporation) and nickel felt (from Sorapec, France ~'4) were used for the anode and cathode, respectively, with aluminum employed in excess. The an- odes were fabricated as cylinders (height 1 to 1.5 cm, di- ameter ~0.5 cm). Rigid tungsten wires (diameter 0.I cm), which served as current collectors, were squeezed into a drilled hole in the cylinders. Surface impurities arising from the machining of aluminum were removed by treating the anodes in a concentrated NaOH solution. To minimize the surface oxide present, the anodes were further treated in a 12:10:3 mixture by volume of concentrated H3PO~, H2SO4, and HNO3 acids, respectively, and finally cleaned with distilled water. Cells were washed with distilled water, dried at 150~ for about 24 h, leak-tested, and finally loaded with chemicals.
A JI
io)
j A m
B H
G - -
(b) Fig. 1. (a) Battery cell, (b) three-chamber cell used for potentiomet-
ric measurements: A, pressure equilibrating tubes; B, aluminum an- odes; C, sealing positions; D, main chambers of cells; E, nickel felt cathodes; F, electrolyte; G, current collectors (tungsten wires); H, porous diffusion separator.
3380 J. Electrochem. Soc., VoI. 140, No. 12, December 1993 �9 The Electrochemical Society, Inc.
Downloaded 28 Jun 2010 to 192.38.67.112. Redistribution subject to ECS license or copyright; see http://www.ecsdl.org/terms_use.jsp

J. Electrochem. Soc., Vol. 140, No. 12, December 1993 �9 The Electrochemical Society, Inc.
A
D
G
(a) (b) Fig. 2. Raman spectroscopy cells, (a) shaped to fit into the Raman
furnace, (b) designed with a greater electrode distance to avoid dendrite formation: A, sealing positions; B, current collectors (tungsten wires); C, nickel felt cathodes; D, bulb allowing for elec- trolyte exchange; E, electrolyte; F, aluminum anodes; G, cuvene sec- tion, introduced in the Raman furnace when performing spectral measurements.
The NaA1C14 electrolyte was prepared by mixing anhy- drous A1C13 (from Fluka) with analytical grade NaC1, dried at 175~ The mixing and subsequent melting of the mix- ture were performed in a glove box purged with dry air (dew point < -55~ Thereafter, the melt was pre-elec- trolyzed between aluminum electrodes (250 mA, 24 to 72 h) and filtered through a borosilicate glass filter. The purified melt was almost water clear. Further purification was per- formed by zone refining in sealed ampuls.
Two "NaA1SC12"/NaA1C14 mixtures, used as sources of sulfide, were produced from NaA1CI~ (zone refined), NaC1 (purified in the molten state by HCI and filtered), A1 (99.999%) and S (Riedel-de Hahn 99.5%, further distilled twice), by means of the reaction lb. The synthesis was car- ried out at 215~ in an evacuated ampul in a rocking fur- nace over a period of four days. A surplus of NaA1C14 was used giving mixtures with "NaA1SC12":NaA1C14 molar ra- tios of 1:7.97~ and l:10.000. The two mixtures were used in sulfide cells I and II, respectively, see below. Similarly, a "NaA1SeC12"/NaA1C14 mixture, with a molar ratio of 1:8.373, was produced from NaA1CI~ (pre-electrolyzed), NaC1 (analytical grade and dried at 175~ A1 (99.999%), and Se (99.999% Koch-Light Laboratories, Limited).
The hygroscopic chemicals were stored in sealed Pyrex ampuls between uses.
Cycling experiments .--Cycling experiments were per- formed on cells shown in Fig. la. The electrolyte was pre- electrolyzed NaA1C14 saturated with a surplus of NaC1. The melting point of this electrolyte was 155.47~ which should be compared with the value of 155.90~ obtained for an extrapolated oxide-free NaC1 saturated melt. ~ The melting point depression corresponds to an oxide impurity content of -0.045 mol/kg.
The nickel felt, of -0 .3 mm thickness, was cut to 1 x 3 cm ~ (weight ca. 200 mg) and spot welded to the tungsten wire.
Four cells were filled with electrolyte (each -25.0 g or 14.7 ml at 175~ in the dry air glove box. To three of the cells a further addition was made of either sulfur (Riede]-
3381
de Hahn 99.5 %, further distilled twice), selenium (99.999 % Koch-Light Laboratories, Limited), or tellurium (Fluka, puriss.).
Finally, the cells were evacuated, sealed off, and placed in a holder in a home-made oven heated to 175~ by circu- lated air. 2
The charge/discharge cyclings were performed by means of a microprocessor controlled battery test equipment. 2
Raman spectroscopy.--Two types of cells shown in Fig. 2 were used, shaped to fit the Raman spectroscopy furnace and to allow electrolyte changes during cycling to be ob- served spectroscopically. An experimental difficulty with type (a) proved to be electrical short circuit due to dendrite formation. This problem was avoided with cells of type (b) due to the greater distance between the electrodes. The charging and discharging with type (b) needed to be per- formed outside the Raman furnace (the cell was too big to fit into the furnace). After each charge/discharge step, the electrolyte was frozen and the cell turned upside down. Part of the electrolyte could now be remelted in a flame and the melt allowed to run down in the cuvette section (G) which was then introduced in the Raman furnace. In this way spectra were obtained of the electrolyte before and after each charging or discharging step.
Potentiometric measurements.--Potentiometric meas- urements were performed by means of three-chamber cells, see Fig. lb. The chamber containing an aluminum refer- ence electrode was connected to anode and cathode cham- bers through porous ceramic A1203 pins (6 mm length, 1.2 mm diam, and pore size 1.7 to 1.8 p~m). Four cells were investigated containing either no chalcogenide, dissolved sulfide (two cells), or selenide, respectively.
The masses of nickel felt and electrolyte used in these cells are given in Table I. Five layers of nickel felt, with a geometrical surface area of 1.9 x 1.0 cm 2, were tied to- gether and pinned to the tungsten current collector by means of a nickel wire (3.5 cm length, 0.5 mm diam) giving a geometrical electrode thickness of 1.5 mm (sulfur cell II had four layers and was thinner). The given size and mass of the electrodes corresponds to a porosity of about 75- 85 volume percent (v/o).
The cells were loaded with chemicals in an argon-filled glove box (Vacuum Atmospheres, Corporation). Sulfide and selenide were added in the form of the intimate mix- tures of NaA1C14 and "NaA1SC12" or "NaA1SeC12," as de- scribed above. The solvent was made slightly acidic [-0.51 mole percent (m/o) A1C13] to make possible a variation in the chloride activity or equivalently, the aluminum elec- trode potential. This is essential to derive conclusive infor- mation from the potentiometric measurements. On the con- trary, in the cycling experiments and Raman studies, the solvent was NaA1C14 saturated with NaC1.
After filling, the cells were evacuated and all loading tubes sealed off under vacuum. Subsequently the pressure equilibration tube, between reference and anode chambers (A, Fig. lb) was closed in order to prevent distillation of AICI3 from the anode/cathode compartments to the refer- ence compartment. The cells were then placed in a regu- lated furnace at 175.0 _+ 0.3~ The furnace was kept con- tinuously rocking during the experiments to ensure fast electrolyte equilibration in the anode/cathode chambers and a constant reference potential.
Aluminum anode and nickel felt cathode potentials were measured relative to the reference electrode by means of a xt-recorder with relative accuracy better than _+0.5 and _+ 1.0 mV for anode and cathode, respectively (absolute ac- curacies are estimated to be better than _+ 1.0 and _+ 2.0 mV). Voltage calibration was repeatedly done with a digital multimeter.
To allow for measurements of equilibrium potentials, charging and discharging were performed in successive steps, consisting of a galvanostatic period (lasting from i to 4 h) followed by a rest period, lasting between 12 and 24 h, depending on how fast the cells equilibrated. The cells nor- mally reached constant anode and cathode potentials
Downloaded 28 Jun 2010 to 192.38.67.112. Redistribution subject to ECS license or copyright; see http://www.ecsdl.org/terms_use.jsp

3382 J. Electrochem. Sac., Vol. 140, No. 12, December 1993 �9 The Electrochemical Society, Inc.
Table I. Chemicals loaded into the anode/cathode compartments of the cells used for patentiometric measurements and calculated molar compositions. The reference compartments contained NaAICI4 salurated with NaCI. a
Weighed chemicals in gram Corresponding mol compositions
Cell type Ni-felt NaA1C14 "NaA1XC12 ''b + NaA1C14 AIC13 ~ nN~C~ n~c~, n~,x~ b
No ehalcogen 0.546~ 25.011 0 0.56~ 0.13041 0.13467 O Sulfur (cell I) 0.5069 19.723 2.085 d 0.636 0.11396 0.1179o 4.131 �9 10 -4
(cell II) 0.3880 20.110 2.499 d 0.507 0.11692 0.12112 4.022 �9 10 -4 Selenium 0.5701 21.197 2.706 a 0.536 0.12457 0.12759 4.995 �9 10 -4
Ca. 11 g NaA1C14 and ca. 2 g NaC1. b X = S or Se. Distilled twice and recrystallized.
d The composition of the mixture is given in the Experimental section.
(within +0.5 and -1.0 mV, respectively, over a period of at least 2 h) in less than 12 h. These potentials were taken to be equal to the equilibrium values. In the case of selenide, especially near the end of discharging, equilibrium was not reached even after 24 h.
Constant current of either ~1 or ~2 mA was used during the galvanostatic periods. The exact value was measured by means of a 0.05% 10 12 resistance and a Keithley 175 digital multimeter. Due to small current fluctuations the accuracy of given charges was ca. _+2.5%.
Results Charge~discharge behavior of the different battery
cells.--A selected number of cycles obtained with the four cells A, B, C, and D, containing no chalcogen at all, sulfide, selenide, and telluride, respectively, are shown in Fig. 3. Charging and discharging of cell A proceeds mainly at a single voltage level or plateau, associated with formation/
�9 ] ~Fcycle 200 ...: .L~ . . . . . . . . = = ~ 0.5~,/-- cycle 100
IPI , , ,C , ,
oyo,e S,~ (i) 1' 5 t I @ cyc~.,'5~-o-~'-'~'-- ,~--@':--'-~-~ ~'~,. cyde 100 {B)
I- ~ J - - : - - - - ~ % ~ I:f_L ~,o2oo ,
~cycle 100 (c) l ' ~L -~ - " "~ " -u cycle.200.(~ 1 ~::'-'~":~ ~ "1
1=-7..~...| ..... ~ . . . [ . LcYCqe-~--~-.-~_.:_ _ 4
1 5 . . . . . . . . . . .~.r ~ (D)
/ ~ " eye, e200 ~ ...... 0 5 L'''~'-'- cycle100 cycle b :%,-~..~...
�9 . . ,- ! "~ , ,0, ,P, , ,0\
0 2 4 6 8 10 time (h)
Fig. 3. Constant current charge/discharge curves for cycles No. 5, 50, 100, and 200 of the battery cells at 175~ (A) Cell without additions to the NaCI~a,'AICI~ eleclrolyte (with 50.2 m/o NaCI); (B) cell with 0.387 mal S per liter; (C) cell with 0.376 mal Se per liter; (D) cell with -<0.027 mal Te per liter. Applied charging and discharging
o -t- o currents were 5 _ 5 ~o mA, except far cell A, where I _ 5 ~ mA were used after cycle No. 64. Charging and discharging were followed by a pause of 0.5 h. Termination conditions were for charging a maxi- mum charging time of 5 h and a maximum voltage of 2.0 V, and for discharging a maximum charging time of 5 h and a minimum voltage of 0.0 V, except for cell A, where the minimum voltage was 0.4 V for cycle No. 1-64 and 0.1 V for cycle No. 65-200. Notation: P, pause; C, charging; D, discharging. Plateaus are labeled No. 1, No. 2, and No. 3, according to the description in the text.
decomposition of NiCI2. The charge/discharge curves of the chalcogen containing cells (C, B, and D) differ markedly from those of cell A, showing that the chalcogens are chem- ically active in the cathode reactions. Compared with the chalcogenide free cell, those containing ehaleogen showed improvements with regard to rate capability.
Since the accuracy of the applied currents were -+5%, charging and discharging currents may have deviated up to -+ 10%. Therefore, the relatively poor coulomb efficiency of cells A and D(Te) may be due to higher discharging than charging currents during cycling. Similarly, the gradual in- crease of charging and discharging voltage with increasing number of cycles, observed for cells B(S) and C(Se), was probably caused by cycling with higher charging than dis- charging currents.
The charge/discharge curves in Fig. 3B are very similar to the ones found in experiments with cathodes prepared from nickel sulfides. 2 At least three horizontal plateaus, labeled No. 1, No. 2, and No. 3, are seen in Fig. 3B. Also in the telluride system (Fig. 3D), three plateaus are observed (most clearly seen from the charging curves), situated at about the same potentials as those in the sulfide system. At least the two lowest plateaus are also present in the se- lenide system (barely perceptible from the charge curves of cycle 5 and 50, respectively, see Fig. 3C). This indicates that similar reactions may take place in all three chalcogenide systems. As shown in Part I ~ plateau No. I involves forma- tion/decomposition of essentially Ni~Sz in the sulfide sys- tem, and NiySez in the selenide system. The intermediate plateau, No. 2, of sulfide containing cells at -0.975 V is associated with NiCI2, or a NiySzCl2y_2z-type compound with y > (4.4 _+ 0.2) �9 z, see below. Accordingly, the voltage of plateau No. 2 for chalcogen containing cells corresponds closely to the voltage observed for cell A. Plateau No. 2 appears most clearly on Fig. 3D probably because tel- lurium was not added in excess (50 mg of Te were added corresponding to 35 mg Ni or 85 mg Ni3Te2) and probably only part of it went into solution. Since plateau No. 3 at
1.2 V (seen clearly from the charge curves of cells B and D) was not observed for the chalcogenide free cell (A), the reaction taking place along plateau No. 3 must involve a compound containing chalcogen. It probably contains higher oxidation states of nickel or sulfur, since a plain nickel (If) chalcogenide is expected to give a lower poten- tial than NiC12.
Compared with the sulfide and telluride systems, the charge/discharge curves obtained with selenide show a smoother appearance, probably due to inferior cathode re- action kinetics. This together with a high state of charge may explain the obtained high cell voltages.
Chalcogen participation in cathode reaction.--The ex- periments discussed in the following were performed in order to examine the sulfur and selenium cell reactions in more detail. The identification of nickel sulfide phases by postoperation x-ray powder diffraction on cathode mate- rial from type B batteries proved to be not easily done. Many overlapping lines were observed from samples cov- ered by 6 p~m A1 foil protecting against moisture. However,
Downloaded 28 Jun 2010 to 192.38.67.112. Redistribution subject to ECS license or copyright; see http://www.ecsdl.org/terms_use.jsp
J. Electrochem. Soc., Vol. 140, No. 12, December 1993 �9 Th~ Electrochemical Society, Inc. 3383
lines indicative of Ni3S2 and perhaps NiS and NiC12 were observed. 6 Experiments aimed at finding a procedure to remove surplus melt without also decomposing the nickel sulfide have so far been unsuccessful.
In the literature, 7 the positive effect of adding sulfur to nickel powder cathodes in pure NaA1C14, has been at- tributed to morphological changes, in which sulfur and sul- fide seemed to inhibit nickel grain growth.
Gravimetric analysis of sulfur.--The electrolytes from three fully charged battery cells (with cathodes originally prepared from nickel mesh and nickel sulfide and with sul- fide-free NaA1CI~ electrolyte and cycled more than 100 times) were filtered and analyzed chemically for sulfide. The analysis, performed by oxidizing sulfide to sulfate and precipitating it as BaSO~, showed little sulfur (only 1.6 -+ 1.9% of the total amount was present in the electrolyte). Therefore, prac~tically all sulfur must be contained in the cathode of fully charged cells. The question was then to show that sulfur is exchanged between cathode and elec- trolyte during cycling.
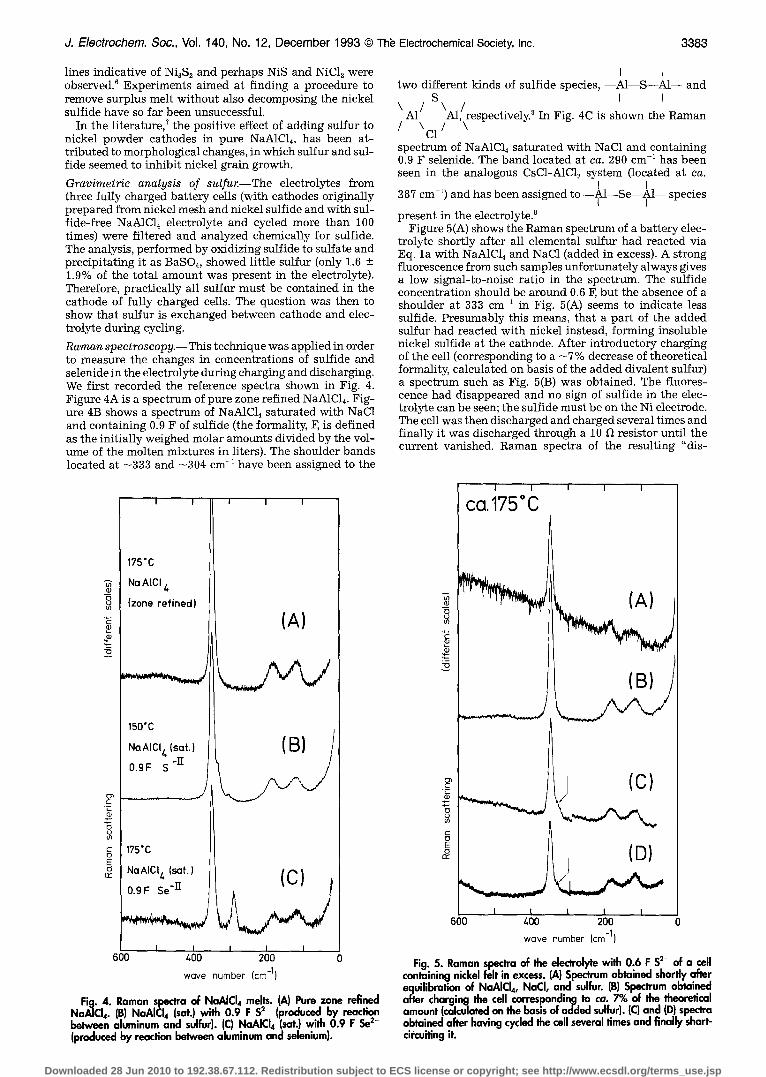
Raman spectroscopy.-- This technique was applied in order to measure the changes in concentrations of sulfide and selenide in the electrolyte during charging and discharging. We first recorded the reference spectra shown in Fig. 4. Figure 4A is a spectrum of pure zone refined NaA1C14. Fig- ure 4B shows a spectrum of NaA1CI4 saturated with NaC1 and containing 0.9 F of sulfide (the formality, F, is defined as the initially weighed molar amounts divided by the vol- ume of the molten mixtures in liters). The shoulder bands located at -333 and ~304 cm -~ have been assigned to the
E
'E-
!-,
E Es r r
175"C
Na AtCl 4
{zone refined)
150"C
Na AICI 4 {sat. )
0.9F S "Tl"
I I I I
(A)
175"C
NaAICI 4 (sat.)
I I I I I 600 400 200
wove number (cm -1)
Fig. 4. Raman spectra of NaAICI4 melts. (A) Pure zone refined NaA]CI4. (B) NaAICI4 (sat.) with 0.9 F S ~ (produced by reaction between aluminum and sulfur). (C) NaAICI4 (sat.) with 0.9 F Se x- (produced by reaction between aluminum and selenium).
I I two different kinds of sulfide species, - -A1--S--A1-- and
S I I \ 1 \ /
A1 AI, respectively. In Fig. 4C is shown the Raman
/ \C l / \ spectrum of NaAICI~ saturated with NaC1 and containing 0.9 F selenide. The band located at ca. 290 cm -1 has been seen in the analogous CsC1-A1CI~ system (located at ca.
I I 287 cm -1) and has been assigned to --A1--Se--A1-- species
I I present in the electrolyte?
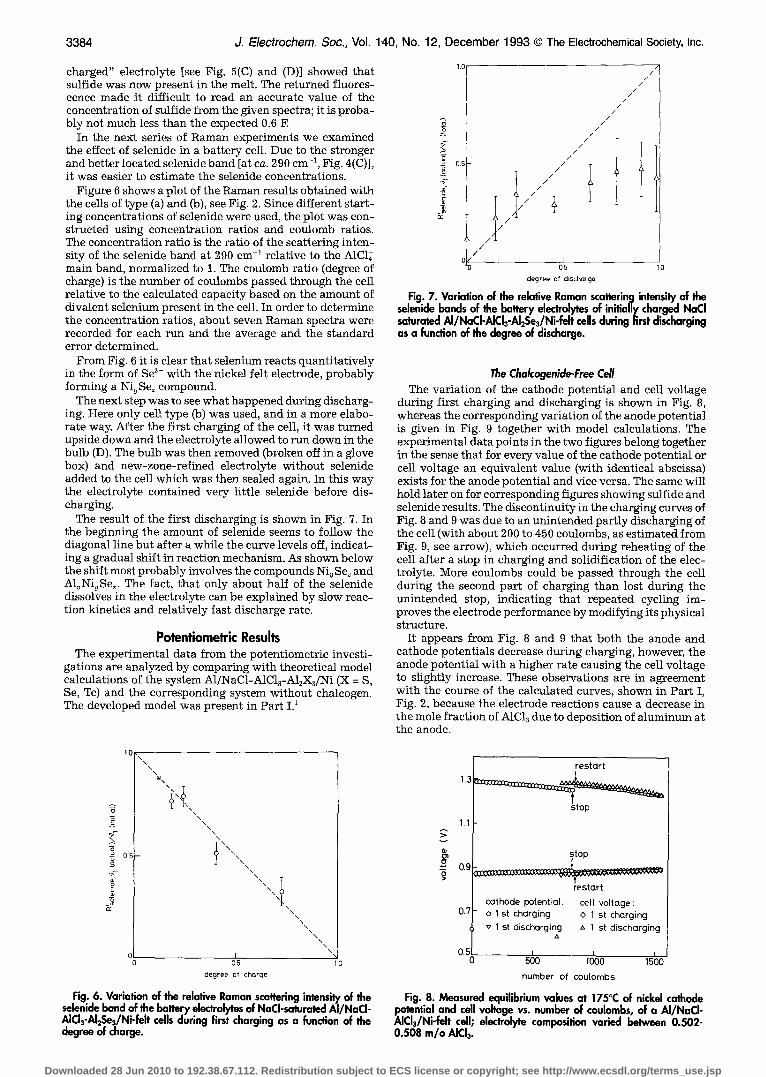
Figure 5(A) shows the Raman spectrum of a battery elec- trolyte shortly after all elemental sulfur had reacted via Eq. la with NaA1C14 and NaC1 (added in excess). A strong fluorescence from such samples unfortunately always gives a low signal-to-noise ratio in the spectrum. The sulfide concentration should be around 0.6 F, but the absence of a shoulder at 333 cm -1 in Fig. 5(A) seems to indicate less sulfide. Presumably this means, that a part of the added sulfur had reacted with nickel instead, forming insoluble nickel sulfide at the cathode. After introductory charging of the cell (corresponding to a - 7 % decrease of theoretical formality, calculated on basis of the added divalent sulfur) a spectrum such as Fig. 5(B) was obtained. The fluores- cence had disappeared and no sign of sulfide in the elec- trolyte can be seen; the sulfide must be on the Ni electrode. The cell was then discharged and charged several times and finally it was discharged through a 10 ~ resistor unti l the current vanished. Raman spectra of the resulting "dis-
$
E P
- o
E~
E c r
i I
c a 175 ~ C I I I
.____.__J
__j I (c)
(D)
I L I I 600 400 200 0
wove number (cm -1)
Fig. 5. Raman sL~'~'tra of the elec~olyte with 0.6 F S 2- of a cell containing nickel felt in excess. (A) Spectrum obtained shorlty after equilibration of NaAICI4, NaCI, and sulfur. (B) Spectrum obtained after charging the cell corresponding to ca. 7% of the theoretical amount (calculated on the basis of added sulfur). (C) and (D} spec~a obtained after having cycled the cell several times and finally short- circuiting it.
Downloaded 28 Jun 2010 to 192.38.67.112. Redistribution subject to ECS license or copyright; see http://www.ecsdl.org/terms_use.jsp
3384 J. Electrochem. Sac., Vol. 140, No. 12, December 1993 �9 The Electrochemical Society, Inc.
charged" electrolyte [see Fig. 5(C) and (D)] showed that sulfide was now present in the melt. The returned fluores- cence made it difficult to read an accurate value of the concentration of sulfide from the given spectra; it is proba- bly not much less than the expected 0.6 F.
In the next series of Raman experiments we examined the effect of selenide in a battery cell. Due to the stronger and better located selenide band [at ca. 290 cm -~, Fig. 4(C)], it was easier to estimate the selenide concentrations.
Figure 6 shows a plot of the Raman results obtained with the cells of type (a) and (b), see Fig. 2. Since different start- ing concentrations of selenide were used, the plot was con- structed using concentration ratios and coulomb ratios. The concentration ratio is the ratio of the scattering inten- sity of the selenide band at 290 cm -~ relative to the A1CI~ main band, normalized to 1. The coulomb ratio (degree of charge) is the number of coulombs passed through the cell relative to the calculated capacity based on the amount of divalent selenium present in the cell. In order to determine the concentration ratios, about seven Raman spectra were recorded for each run and the average and the standard error determined.
From Fig. 6 it is clear that selenium reacts quantitatively in the form of Se 2- with the nickel felt electrode, probably forming a NiySe~ compound.
The next step was to see what happened during discharg- ing. Here only cell type (b) was used, and in a more elabo- rate way. After the first charging of the cell, it was turned upside down and the electrolyte allowed to run down in the bulb (D). The bulb was then removed (broken off in a glove box) and new-zone-refined electrolyte without selenide added to the cell which was then sealed again. In this way the electrolyte contained very little selenide before dis- charging.
The result of the first discharging is shown in Fig. 7. In the beginning the amount of selenide seems to follow the diagonal line but after a while the curve levels off, indicat- ing a gradual shift in reaction mechanism. As shown below the shift most probably involves the compounds Niy Sez and Al~NiySez. The fact, that only about half of the selenide dissolves in the electrolyte can be explained by slow reac- tion kinetics and relatively fast discharge rate.
Potentiometric Results The experimental data from the potentiometric investi-
gations are analyzed by comparing with theoretical model calculations of the system A1/NaC1-A1C13-A12X3fNi (X = S, Se, Te) and the corresponding system without chalcogen. The developed model was present in Part I. ~
2 0,5
a ~
/
/ / /
/ "
/ i/
/ I
's os d e g r e e of dLscharge
/ / /
/ / /
/ /
/ /
/ / /
/
Fig. 7. Variation of the relative Raman sca#ering intensily of the selenide bands of the battery electrolytes of initially charged NaCI saturated AI/NaCI-AICI3-AI2Se3/Ni-feh cells during first discharging as a function of the degree of discharge.
The Chalcogenide-Free Cell The va r i a t i on of the cathode po ten t i a l and cel l vo l tage
during first charging and discharging is shown in Fig. 8, whereas the corresponding variation of the anode potential is given in Fig. 9 together with model calculations. The experimental data points in the two figures belong together in the sense that for every value of the cathode potential or cell voltage an equivalent value (with identical abscissa) exists for the anode potential and vice versa. The same will hold later on for corresponding figures showing sulfide and selenide results. The discontinuity in the charging curves of Fig. 8 and 9 was due to an unintended partly discharging of the cell (with about 200 to 450 coulombs, as estimated from Fig. 9, see arrow), which occurred during reheating of the cell after a stop in charging and solidification of the elec- trolyte. More coulombs could be passed through the cell during the second part of charging than lost during the unintended stop, indicating that repeated cycling im- proves the electrode performance by modifying its physical structure.
It appears from Fig. 8 and 9 that both the anode and cathode potentials decrease during charging, however, the anode potential with a higher rate causing the cell voltage to slightly increase. These observations are in agreement with the course of the calculated curves, shown in Part I, Fig. 2, because the electrode reactions cause a decrease in the mole fraction of A1C13 due to deposition of aluminum at the anode.
\
2 0.5
{
1,0, \ \ \
\ \ \
0 0
\ \
~ \ \ \ \ \ \
\ \ \
\ \ \ \ I \ \ \
x\ \ \
\ \ \
I O5
d e g r e e of charge
Fig. 6. Variation of the relative Raman scattering intensily of the selenide band of the battery electrolytes of NaCI-saturated AI/NaCI- AICI3-AI2Se3/Ni-felt cells during first charging as a function of the degree of charge.
restart
~stop
1.1
v
m ~top ~ o.g
restart cathode potential: cell vottage:
0.? o 1 st charging o 1 st charging v 1 st discharging z, 1 st discharging
zx
I I I 0 500 1000 1500
number of coulombs
Fig. 8. Measured equilibrium values at 175~ of nickel cathode potential and cell voltage v s . number of coulombs, of a AI/NaCI- AICIJNi-feh cell; eledrolyte composition varied between 0.502- 0.508 m/o AICI3.
Downloaded 28 Jun 2010 to 192.38.67.112. Redistribution subject to ECS license or copyright; see http://www.ecsdl.org/terms_use.jsp

J. Electrochem. Soc,, Vol. 140, No. 12, D e c e m b e r 1993 �9 The Electrochemical Society, Inc.
" 0 . 0 0
I , .
stop o ~, 0.35 o 1 st charging ~ o
" 1 st discharging %
0.33 I I I 500 1000 1500
number of coulombs
Fig. 9. Measured aluminum anode potential points at 175~ be- longing to the nickel potentials in Fig. 8. The solid lines shown are model calculations in accordance with Eq. 11 and 16 in Part I for charging and discharging, respectively. The stated labels designate the amount of NaCI "consumed" per six electrons transferred.
It is seen from Fig. 9 that the decrease of the anode poten- tial was faster at the beginning than during the main part of charging. A similar effect was observed in the case of the sulfide and selenide containing cells. An explanation may be that impurities take part in the electrode reactions and are gradually consumed during the first coulometric titra- tion steps. The change of the cathode potential from 0.618 to 1.288 V, as a result of the first step, reflects a change in the cathode reaction, which too may affect the variation of the anode potential.
Overcharge reaction.--There is strong evidence that an overcharge reaction, with generation of C12 at the cathode, took place during the last titration period before the unin- tended stop and during the last four ti tration periods be- fore discharging (in the second part of charging). The cathode overvoltage (at an applied current of 2 mA) changes from -100 mV, during titration in the main part of charge, to -1.25 V during overcharge, assuming negligible overvoltages associated with transport of ions in the bulk electrolyte. The anode overvoltage remained unchanged at - 10 mV. The nonequil ibrium cathode potential was 2.5 V. A potential plateau at that level has been found by other in- vestigators. T M The associated reaction most likely proceeds according to
4A1CI~ ---> 2A12CI~ + C12 + 2e [2]
causing decomposition of the electrolyte and evolution of C12. Generated CI~ dissolves to some extent in the melt. According to WEernes and Qstvold TM the solubility of C12 in an acidic NaCI-A1C13 melt with X~c~3 = 0,51 at 175~ is 9 �9 10 -6 tool cm ~ at 1 arm C12 pressure. Reduction of dissolved C12 is possible either at the cathode or anode and may pro- ceed via the following reactions
Cathode: Clz + Ni --> NiClz [3]
Anode: 3C12 + 2A1 ---> 2A1C18 [4]
The reversible overcharge reaction with generation of C12 at the cathode and reduction of C12 at the anode is a very favorable inherent property of the present battery system.
Modeling of the experimental results.--Charge reac- tion.--The solid lines in Fig. 9 are calculated curves fitted to the course of the anode potential. During charging, the curves were calculated according to Eq. 11 (Part I), corre- sponding to formation of a general NaxNiy Cl2y+.~ compound containing divalent nickel. However, the curves depend only on the relative consumption of A1C13 and NaC1.
3385
As stated in Part I, formation of an Ni(I)-compound is not likely. Moreover, the number of coulombs passed through the cells correspond to more nickel than present in the cells if Ni(I) alone was formed.
The first three measured anode potentials were not in- cluded in the model fitting in order to obtain good agree- ment with experiment and theory. The model potential curves were forced to start at the fourth data point (0.4134 V), by using, as initial conditions, 0.13438 mol A1C18 and 0.1301~ mol NaC1. In all model calculations throughout this paper, initial moles of A1C13 were calculated from the weighed out amount of AICI3 and corrected for the net con- sumption of A1CI~, whereas initial moles of NaC1 were cal- culated by means of the model so that the initial anode potential became equal to the experimental value.
Three curves are shown in Fig. 9, corresponding to differ- ent values of the fitting parameter, 3 �9 x/y, see Eq. 11, Part I. The best fit is obtained for x = 0.0, which corresponds to formation of NiC12. No attempt was made on fitting to the second part of the anode charging curve.
Precision.--To estimate the accuracy of the model, we per- formed several calculations, assuming somewhat different starting values. As a result, 3x/y is probably contained in the interval 0 <- 3x/y < 0.05 with a high degree of certainty (the lower boundary is due to physical reasons).
One further source of error has been considered. Due to different composition of the electrolyte in the reference and cell compartments, some net diffusion of ions might occur through the porous separator. This should show up as a steady increase of the deviation between the experimental data and model curves in Fig. 9. Such an effect was not seen, even though 25 days expired during charging with the first 800 coulombs. Also, during an open-circuit experi- ment, lasting for about one week, no appreciable drift of the anode poteniial was observed. Therefore, diffusion of ions through the separator can be assumed negligible. This was valid too for the cells with sulfide and selenide.
Discharge reaction.--A general discharge reaction is given in Eq. 16, Part I. Reduction of NiC12 to Ni is assumed to be accompanied with consumption of NaC1 at the cathode and formation of intermediate Na~Ni~C12~§
The discharge c~rve of the anode is shown in Fig. 9 to- gether with 4 theoretical curves, all starting from the po- tential 0.3382 V and calculated in accordance with reaction 16, Part I. The initial conditions used for the model curves were 0.12906 mol of NaC1 and 0.13004 mol of A1C13 (AIC13 was corrected for the coulombs lost by overcharging and during the stop, -120 and -200 coulombs, respectively). The inaccuracy of the initial amount of A1C13 is therefore relatively large. However, model calculations show that this only affects the theoretical curves slightly, as a conse- quence of the fact that the number of coulombs passed through the cell during charging only corresponds to a small part ( -5%) of the total amount of A1C13 present in the electrolyte. The curve for x = 0.3 represents a good fit to the experimental data, whereas curves for x = 0.15 and x = 0.45 state the margin of error of the model calculations. The lowermost curve gives the expected variation of the anode potential if no NaC1 was "consumed" during discharging at all. The deviation from the experimental data can hardly be explained by error sources. Hence it is concluded that sodium takes part in the cathode reaction and is consumed during discharging. The "consumed" NaC1 probably exists in the cathode in the form of NaC1 particles physically iso- lated from the acidic melt.
The NiC12/Ni electrode is known to be fully reversible in basic NaA1C14 melts. 13 In contrast to this we obtained a coulomb efficiency of only 70 to 85 % for the first cycle. One reason might be that NiC12 is slightly soluble in acidic NaAICL. Another factor contributing to low coulomb effi- ciency is shedding of cathode material. Visual inspection of the cell after the first cycle revealed deposition of a small amount of black material at the bottom of the cathode com- partment. Considering the high utilization of nickel (about
Downloaded 28 Jun 2010 to 192.38.67.112. Redistribution subject to ECS license or copyright; see http://www.ecsdl.org/terms_use.jsp

3386
1.3
1.1 >
o 0.! o
0.7
0.5
J. Electrochem. Soc., Vol. 140, No. 12, December 1993 �9 The Electrochemical Society, Inc.
Q O O O O O O ~ o
o I st charging z~ I st dischargin! a 2 nd charging
,ooO o ~ ~ - -
Z~
Z~
I I I 200 400 600
number of coulombs Fig. 10. Measured equilibrium potentials at 175~ of the nickel
cathode vs. number of coulombs, of the AI/NaCI-AICI3-AI2SJNi-felt cell I, see Table I. Potentials are measured relative to an AI/NaAICI4 reference electrode saturated with NaCI. Plateaus No. 1 and No. 2 are indicated.
50 to 60% during first charging), the constant disturbances caused by the rocking, and the lack of mechanical support, the structural integri ty of the cathodes is surprisingly good.
Variation of the cathode potentiaL--The variat ion of cathode potent ial vs. melt composition was analyzed in Part I. A plot of the experimental data as {Ec. F/(R �9 T . in 10) - g/6 log ([Na§ vs. pC1 = - l o g [CF] in Fig. 3, Part I, demonstrates a l inear dependence with a slope close to +1. This means that the observed variat ion of the cathode potential can be explained solely by changes in the elec- trolyte. For sake of clarity, only those experimental data used for curve fi t t ing in Fig. 9 were included in Fig. 3.
The consumption of NaC1 was also determined from the variat ion of the cathode potent ial by depicting the experi- mental data as Ec. F/(R. T. log 10) + log [CI-] vs. log ([Na § �9 [C1-]). The results were in reasonably good agreement with the NaCl-consumption obtained from model f i t t ing to the anode potent ial curve, see Part I.
The Sulfide Containing Cells Two cells (I and II) were investigated, see Table I. For
cell I the variat ion of the equil ibrium potentials of cathode and anode vs. the number of coulombs passed through the cell are shown in Fig. 10 and 11, respectively.
The course of the cathode potent ial reveals two plateaus, No. 1 and No. 2, indicat ing that two sequential cathode reactions are taking place during both charging and dis-
0.41
0.4C
A
IX
L~
0 L~ O o o o o O ~ o
o A
0
o o ~
o o &
o I st charging o z~
I st d i ~ h a r g i n g Oo
2 nd charging ~ A
oo 6oo
8 ~ ..,.., o
0.39
0.3~ 0
1.1C
1.0~ ~. 1St discharging / / /
1.0E a 2 nclcharging / t
1.04
1.00 c
0.98' A
0.9~ t I I 0 100 200 300 400
number of coulombs
Fig. 12. Measured cathode potential points from plateau No. 1, Fig. 10, fitted by calculaiod potential curves belonging to the sulfide species AI2SCI~, (n, m) = (2, 1).
number of coulombs
Fig. 1 i. Measured equilibrium aluminum anode potentials of cell I, belonging to the cathode potentials shown in Fig. 10.
charging. As seen from Fig. 11, the shift between the two charge/discharge reactions is associated with a change in the variat ion of the anode potential, which too reflects that two different cathode reactions are involved.
The low potential plateau.---Plateau length.--Since plateau No. 1 is not observed for the chalcogenide-free cell, it is obviously due to formation/decomposit ion of (in gen- eral) a NaxNi~S~CI~ compound. The corresponding overall cell reaction and the associated changes in the composition of the electrolyte are given in Par t I, by Eq. 22 and 23, respectively. 1
Assuming sulfide to react quanti tat ively with the nickel felt electrode (the formed compound may still contain Na and C1), the length of pla teau No. I should be -239 cou- lombs, calculated from the weighed amount of sulfide. Ex- perimentally, 225, 212, and 240 coulombs (read from Fig. 12, see above) were obtained for first charging, first discharging, and second charging, respectively. The devia- tion of these numbers from 239 coulomb may be due to inaccuracy in the measured charge and the amount of sul- fide. Furthermore, the relatively short p la teau- length of the first discharging (212 C) and long one of the second charging (240 C) are the result of slow cathode processes taking place below -0 .9 V (cathode potentials given for this range are not true equil ibrium values).
Thus, the length of pla teau No. 1 is in close accordance with sulfide reacting as S ~-. Furthermore, the anode poten- t ial is essentially constant along plateau No. 1, see Fig. 11. These two experimental results were compared in Part I with Eq. 23, which gave quanti tat ive evidence that pla teau No. 1 is associated with formation/decomposit ion of essen- t ial ly a pure nickel sulfide. Most probably Ni3S2 is formed since this compound has been identif ied by means of x - ray diffraction on one of our cathodes 6 and also in nearly dis- charged NaA1C1JNiS2-cathodes after removal of NaA1C14 by washing with CH3CN? Cathode plateau-curve fo rm. - -The dependence of the cathode potential of pla teau No. 1 on melt composition was given in Par t I by Eq. 27. Based on this expression cathode potentials were calculated vs. number of coulombs for dif-
(~-m)- ferent assumed sulfide species AI~S~_IC12~+2_m designated by (n, m). The results are given in Fig. 4, Par t I.
The calculated potentials belonging to the sulfide species s C l -1 -
C1 \ A1 / / \AI / (2, 1), t_]C1/ \ C1 / kc1 | . , are fi t ted to the experi-
mental cathode potential points in Fig. 12, which is an en- larged cutout of Fig. 10. Among the potential-curves from Fig. 4 only the one for the sulfide species (2, 1) agrees well with the experimental data. The second best fi t is obtained by the (3, 2)-curve. This strongly indicates, that dissolved
Downloaded 28 Jun 2010 to 192.38.67.112. Redistribution subject to ECS license or copyright; see http://www.ecsdl.org/terms_use.jsp

J. Electrochem. Sac., Vol. 140, No. 12, December 1993 �9
sulfide preferably exists in the form of sulfide-chloride double bridges in molten acidic NaC1-A1C13, at least for compositions greater than ca. 0.505 m/o A1C13. The same result was obtained previously by means of Raman spec- troscopy. 8 We were unable in that work to estimate n and m
AI~S~_~C12,+2_~ type species, in (apart from m > 0) of the {'-~- acidic melts. For basic melts generally m = 0. In dilute basic solutions n seems to attain small values like 3 to 4, whereas in more concentrated melts higher values of n are reached. The n = 2-type species was found to be of minor impor- tance. This may also be valid in the bulk electrolyte of acidic melts. On the other hand, at the electrode the sulfide species A12SCI~ (n = 2, m = 1) seems to be dominating, since only this species provides a good description of the varia- tion of the cathode potential (species entering into the Nernst equation are those staying at or close to the elec- trolyte/electrode interface). The cathode reaction itself may Contribute to the fo~znation of sulfide species with small chain lengths;If sulfide is released to the melt most likely a small ion (n = 2) is formed. On the other hand, if a sulfide species reacts with a nickel atom the reacting spe- cies will lose one monomeric uni t or it will break into two parts if either an end sulfide atom or a sulfide atom in the middle of the chain is captured, respectively. A requirement for the existence of small sulfide species (n small) nearby the electrode is that the cathode reaction is fast (associated with a high exchange current density) compared with the polymerization reaction of the sulfide species.
Anode plateau-curve form. - -F igure 13 shows the variation of the anode potential during the low potential plateau, No. 1, for first discharging and second charging, together with calculated curves for different assumed sulfide species (n, m). The increase in the measured anode potentials vs. number of coulombs shows, that the chloride concentration decreases (see Part I, Eq. 13) as sulfide in the electrolyte is "consumed" by the cathode reaction. This course is ex- pected if sulfide mainly exist as sulfide-chloride double
S
bridges of the type \A1 / \A1 / . Release of sulfide from / \ / \
C1 this configuration causes consumption of almost three free chloride ions, since aluminum prefers a four-fold coordina- tion. Thus, consumption of three sulfide ions by the cathode reaction and the associated release of eight chlo- ride ions at the anode (due to reduction of two A1C14) causes a net consumption of one chloride ion. On contrast, two extra chloride ions are produced for every net consumption of three sulfide atoms, when sulfide mainly exists in the
0.420 8,1 ,0 "1
0.412 8,5 Z~
o 0 . 4 0 8 1 0 , B - ~ , / / z~ / ' 1412 / / . / / /
0.40z A 1 st discharging z~ /
o 2 nd charging
0400 I I A 1, 0 100 200 3(30 J 4O0
number of coulombs
Fig. 13. Measured anode potential paints from Fig. 11 and calcu- lated anode potential curves belonging to different selected sulfide species of the iype AI, S,_ICI~'I-~,, designated by (n, m) in the figure.
The Electrochemical Society, Inc.
1.3
1.1
o 0.9
02
0
e} o @
Q z~
J I
200
o cathode p o t e n t i a l
,, cell voltage
I I I I - - 4 0 0 600 800 1000
number of coulombs
3387
Fig. 14. Measured equilibrium values at 175~ of nickel cathode potential and cell voltage vs. number of coulombs of the AI/NaCI- AICI3-AI~SJNi-felt cell II, see Table I. Plateaus No. 1, No. 2, and No. 3 are indicated.
form of - -A1--S--A1-- units. Therefore in Fig. 13, the cal- l I
culated anode potentials belonging to sulfide species (2, 0) and (8, 0) to (8, 4) decrease and the other curves increase vs. number of coulombs. The uppermost model curve is ob- tained for the species (2, 0). At the other extreme, the slope of the model curves belonging to the species (n, m) = (n, n - 1) increases slowly (with decreasing rate) as a function of increasing n, see the three lowermost curves in Fig. 13.
As seen, only model curves for sulfide species with rela- tively "large" values of m (m --- n - 1, m = n - 2) fits well to the experimental anode potentials. For small values of n, reasonable good agreement with experiment is obtained, with the sulfide species (n, n - 1) = (7, 5), (8, 6), (9, 7), (10, 8), (11, 9), (12, 10), (13, 10), (13, 11)., (14, 11), (14, 12), (15, 12), (15, 13), and so on. Thus, in acidic melts sulfide seems to exist mainly as sulfide-chloride double bridges, as found above from fitting to the cathode potential-curves. The eventual complication of a changing degree of polymeriza- tion vs. the sulfide concentration was left out of the model calculations. To summarize, only by assuming the sulfide species A12SCI~ to be present in the melt nearby the elec- trode the observed variation of the cathode potential can be explained. On the other hand, in the bulk electrolyte sul- fide may preferably exist in the form of polymeric species, i.e., values of n > 2.
The high potent ial plateau, No. 2.--Along plateau No. 2, the level of the cathode potential and its variation vs. num- ber of coulombs is very similar to the chalcogenide-free cell. The measured cathode potential points are "~5 mV lower compared with the calculated potentials of a Ni/ NiC12-electrode, see Part I, Eq. 14. This small discrepancy between the experimental and calculated potentials, which can be explained by experimental inaccuracy and short- comings of the model, strongly indicates that the formed compound has electrochemical properties very similar to NiC12 and certainly contains nickel in the divalent state. Therefore, generally the formed compound must belong to the series Na~ Ni~ Sz C12~-2:+x. The stoichiometric coefficients cannot be determined very accurately from the data on cell I, since the exact length of plateau No. 2 is unknown. We shifted from first charging to first discharging before termination of plateau No. 2 in order to avoid any partly discharging of the cell caused by dendrites, compare results on the selenide cell below.
Cell II was investigated in order to identify the composi- tion of the formed compound. To avoid the undesirable dis- chargings this ceil was constructed in a way which differed slightly from cell I, see Fig. 1. In cell II the nickel felt was placed above the channel connecting the anode and cathode chambers, and the tungsten current collector in-
Downloaded 28 Jun 2010 to 192.38.67.112. Redistribution subject to ECS license or copyright; see http://www.ecsdl.org/terms_use.jsp

3388 J. Electrochem. Soc., Vol. 140, No. 12, D e c e m b e r 1993 �9 The Electrochemical Society, Inc.
side the cathode chamber was "protected" by means of a glass tube.
The measured equil ibrium potentials of cathode and anode and cell voltage are.shown in Fig. 14 and 15 vs. num- ber of coulombs. Charging was continued until p la teau No. 3. Termination of the experiment occurred due to a power failure causing solidification of the electrolyte and cracking of the ceil.
The general overall cell reaction taking place along plateau No. 2, assuming formation of Na=NiyS~C12,_2 .. . . is given in Eq. 28, Par t I. Based on this equation, pla teau No. 2 terminates when either all Ni-metal or all NipS~ (pre- sumably formed along pla teau No. 1) is consumed. How- ever, for the real electrode, pla teau No. 2 may terminate before exhaustion of Ni-metal or NipSz since these compounds may become inaccessible by the electrochemi- cal reaction with degree of charge. This may not be a real problem in the case of NipS~ since it is formed on the surface of the Ni-felt. A lower limit for y/z can be derived by assuming termination of plateau No. 2 to be due to ex- haustion of NipS~. According to Eq. 28 3/(y - z) mol of Na~Ni~ S~ C12y-2~+~ are formed per 6 moles of electrons trans- ferred, i.e. (mole of electrons)/(mole of Na=Ni~S~CI2y_2~+~) = 2(y - z). This expression gives y > (4.4 +- 0.2). z, utilizing (i) that the total amount of sulfide present in the cell was (1.13 + 0.03) �9 I0 -3 reel (derived from the length of plateau No. 1 and (it) that the length of plateau No. 2 was 760 • 20 coulombs, see Fig. 14.
In Fig. 15 the experimental course of the anode potential is compared with calculated anode curves for different val- ues of the parameters 3x/(y - z). Good agreement with experiment is obtained only if x = 0. From this result and the relation given above between y and z, it follows that plateau No, 2 is associated with a NiyS~Cl~y_2~ compound with y > (4.4 -+ 0.2) �9 z.
However, we cannot exclude the possibil i ty that NipS~ is inactive and pure NiCI~ is formed, since the 980 coulombs passed through the cell unti l terminat ion of p la teau No. 2 corresponds to oxidation of at most ~6.0 �9 10 -3 tool of Ni- metal, which is still less than the total amount of Ni-felt (6.61 �9 10 -3 mol) in the cell.
The very large hysteresis between the anode potential curves along plateau No. 2 in Fig. 11 shows that sodium is "consumed" during the first discharging. Reduction of the compound formed during charging may take place via a sodium-chloride-r ich phase, as discussed in Part I for chalcogenide-free cells. As seen from Fig. 10, essentially all loss of capaci ty occurs during the high potential range,
0.45
0.40
0.35
0.30
0.25
0.20
0
-start of model curve
�9
0.30
"~0.10
0.00 ~ o
~>
g o
o
>o
o
I I I I I 200 400 600 800 1000
number of coulombs
Fig. 15. Measured equilibrium aluminum anode potentials of cell II, belonging to the cathede potentials shown in Fig. 14. Solid curves were calculated based on reaction 28, Part I, assuming formation of Na~NiyS~Cl2y_2~§ The stated parameters are equal to 3x/(y - z).
~41 | 1.3 o~amo o o o o o c~8~o~,~oAn ~
1.2
1.1 o
110 0
kCY 0 ~ [] 09 t , ~ ~ o'~ o o o _O~=oonoOOo~
0.8
0.7
0.6
0.5 0
A
O /,
a t ,~ o 1 st charging z~ 1st discharging
[] 2nd charging
I i [ 200 400 600
number of coulombs
Fig. 16. Measured "equilibrium" potentials at 175~ of the nickel cathode of a AI/NaCI-AlCl3-AI2SeJNi-felt cell vs. number of cou- lombs. Plateaus No. 1A, No. 1B, No. 1C, and No. 2 are indicated.
No. 2. Only minor changes in the length of the low potent ia l plateau, No. 1 (which was ascribed to NiySz) were observed, indicat ing that essentially no sulfide was lost during cy- cling. This means, that unreacted cathode mater ia l must exist in form of NiC12, probably isolated from the current collector.
The Selenide Containing Cell Measured potentials of the nickel felt cathode and alu-
minum anode are shown vs. number of coulombs in Fig. 16 and 17, respectively. The course of the potent ial curves of selenide and sulfide containing cells are quali tat ively very similar, the only difference being a significant extra capac- i ty beyond pla teau No. 1 in the selenide case.
Cathode potentials below 1.2 V are not true equil ibrium values, although 24 h, compared with - 1 4 h in the case of sulfide, were used as a rest period between each coulomet- ric t i t rat ion step.
The low potential plateau, No. / . - -Assuming a pure NiySez-reaction the lengths of plateaus No. 1 should be -290 coulombs, calculated from the amount of selenide. Read from Fig. 16, the experimental lengths of the plateaus No. 1A (first charging), No. 1B (first discharging), and No. 1C (second charging) are -240, ~260, and -330 cou- lombs, respectively. The deviation of ~17% of the length of pla teau No. 1A from the calculated 290 coulombs can be explained by the slow cathode processes, inaccuracy in the measured charge and in the amount of selenide. Therefore, in accordance with what was found for sulfide, p la teau
0.42
g"
o l
0.40
0.38
0 0 DI3(30130
~ %
0.36 o 1st charging ,'. 1st discharging
n 2nd charging
0.34 t t I 0 200 400 600
n u m b e r o f c o u l o m b s
Fig. 17. Measured "equilibrium" aluminum anode potentials ba- longing to the cathode potentials shown in Fig. 16. Far discontinuily see arrows and text.
Downloaded 28 Jun 2010 to 192.38.67.112. Redistribution subject to ECS license or copyright; see http://www.ecsdl.org/terms_use.jsp

J. Electrochem. Soc., Vol. 140, No. 12, December 1993 �9 The Electrochemical Society, Inc. 3389
No. 1A is most probably associated with a reaction involv- ing NiySez. This is the case also for the major part of plateaus No. 1B and No. 1C. However at the end of plateau No. 1B and particularly in the beginning of plateau No. 1C, the nickel selenide reaction is overlapped by the reaction taking place at potentials lower than those of plateau No. 1. Therefore, the length of the plateaus No. 1B and No. 1C are not comparable with the calculated 290 coulombs.
Model fitting to the low potential plateau, No. 1, has not been performed in the selenide case, since the measured cathode potentials below 1.2 V do not represent true equi- l ibrium values.
C a t h o d e r e a c t i o n b e l o w p o t e n t i a l p l a t e a u No . / . - -The variation in the concentration of selenide in the molten salt during discharging at potentials along and below plateau No. 1 (Fig. 16) was followed by Raman spectroscopy, see Fig. 7. It appears, that selenide in the cathode was released quantitatively during the first part of discharging, there- after essentially no release of selenide occurred. This result indicates the existence of two consecutive cathode reac- tions in agreement with the measured curve for the cathode potential during discharging, as given in Fig. 16. Due to the Raman results decomposition of Ni~Sez and release of se- lenide to the melt must take place along plateau No. 1. As seen from the length of plateau No. 1B all selenide is re- leased to the melt when the discharging is performed suffi- ciently slowly. That only about half of the selenide was released during the Raman measurements is due to the slow reaction kinetics in combination with the relatively fast discharge rate.
At potentials below plateau No. 1B a reaction given by Eq. 6 takes place due to the following reasons: The con- sumption of electrons at the cathode must be counterbal- anced either by release of anions or by incorporation of cations into the electrode material. It cannot be the release of selenide nor the release of chloride since the cathode hardly contains significant amounts of these species. Therefore, the cations Na § and perhaps AP § have to enter the electrode material together with selenide (since the po- tential range below plateau No. 1 is not observed in chalco- gen-free cells) and eventually accompanied by some amount of chloride. Therefore we assume that a general Al~Na=NiySe~Cl~-type of compound is formed according to cathode reaction 5 and the overall cell reaction 6
vA13+ + xNa + + wC1- + zSe 2- + yNi
+ (3v + x - w - 2 z ) e - --+ A1,Na=NiySezCl~ [5]
(3v + x - w - 6z)A1 + 3xNaC1 + (w - x) A1C13
+ 3zA12Se3 + 3yNi m 3A1,Na=NiySezCl~ [6]
The small variation of the anode potential in Fig. 17 shows that the acidity of the melt remains essentially un- changed, i.e., according to Eq., 6 3x = w - x or w = 4x. Thus, to a good approximation Eq. 6 can be written
(v - x - 2z)A1 + xNaC1 + xA1C13 + zA12Se3
+ yNi ~ Al~Na=NiySezC14= [7]
Due to the high affinity of the acidic NaC1-A1CI~ melt for NaC1, x is presumably nearly zero, which means that essen- tially a Al~NivSe~ compound is formed.
The gradual decrease of the cathode potential in the range below plateau No. 1B indicates that A1,NiySe~ is formed by an insertion reaction. However, some of the de- crease in potential is due to the slow reaction kinetics. This also explains the large hysteresis observed between first discharging and second charging (current reversal immedi- ately re-establishes the value of the potential, see plateau No. 1C).
T h e h i g h p o t e n t i a l p l a t e a u , No . 2.--As in the sulfide case, either a Ni-Se-C1 compound or NiC12 is formed along plateau No. 2 during charging. The high potential data points agree within - 1 mV with calculated potentials for a Ni/NiC12-electrode, see Part I, Eq. 14. Figure 17 shows evi- dence, that also in the selenide system NaC1 is "consumed" by the cathode reaction during first discharging.
The first charging curves of cathode and anode potentials display a discontinuity after -525 coulombs had passed through the cell, see Fig. 16 and 17. It amounts to a partly discharging of the cell with -180 coulombs, as estimated from Fig. 17. An aluminum dendrite might have drifted from the anode over to the cathode, causing it to be partly reduced. This ispossible, since dendritic spongelike Al-de- posits, with not too good attachment, are formed at the aluminum electrode during charging. 14 Rocking of the cell may cause some of the deposits to break off from the anode.
Summary and Conclusion A1/NaC1-A1C1JNi-felt secondary cells and correspond-
ing cells with dissolved sulfide or selenide were investi- gated at 175~
Cathode reactions were studied by means of gravimetric analysis, Raman spectroscopy, and potentiometric meas- urements. The latter were compared with theoretical calcu- lations performed by means of a model set up for A1/NaC1- A1C13-A12XJNi-felt cells (X = S, Se). 1 Gravimetric analysis of electrolytes from fully charged cells (containing sulfide and cycled more than 100 times) has shown, that in the fully charged state, essentially all sulfide is present in the cathode.
The exchange of sulfide and selenide between cathode and the molten salt during charging and discharging have been studied by means of Raman spectroscopy. Sulfide was found to be "consumed" by the cathode reaction during charging and released to the melt during discharging. Due to higher signal-to-noise ratio clearer results could be ob- tained with the selenide system. During first charging all selenide present in the electrolyte was found to react with the nickel electrode in the form of Se 2 . During the subse- quent discharging only about half of the selenide was re- leased to the melt; the rest remaining in the electrode.
The potentiometric measurements were performed with slightly acidic NaC1-A1C13 melts containing -0.51 m/o A1C13 and only small amounts of chalcogen.
Investigations on the chalcogenide-free cell showed that NiCI~ forms during charging. During discharging, NaC1 is "consumed" at the cathode.
In the sulfide system, the plateau of lowest potential, No. 1, is associated with formation/decomposition of es- sentially Ni~Sz, possibly Ni3S2. The following plateau, No. 2, involves either NiC12 or a Ni~SzC12~_2z-compound with y > (4.4 +- 0.2) . z. The NiySz plateau displays a very good charge retention. The poor coulomb efficiency of -80% for the first cycle is associated with plateau_No. 2.
In acidic melts the sulfide species AI~S~ ~CI~_),~ were found to be almost saturated with sulfide-chloride double
S \ / \A1 / corresponding to large bridges of the t y p e / A l \ / \ '
C1 values of m. At or nearby the cathode, A12SCI~ species (the smallest ion of the assumed series), were needed to.explain the experiments. However, in the bulk electrolyte sulfide species may exist with values of n > 2.
In the selenide system three sequential cathode reactions were observed. Compared with the sulfide system, cells containing selenide delivered a significant amount of charge at potentials below plateau No. 1. This charge/dis- charge range probably involves formation/decomposition of a AlvNiySez compound. In analogy with the sulfide re- sults, plateau No. 1 (at -0.85 V) is due to a NiySez reaction, whereas plateau No. 2 (at -1.275 V) is associated with ei- ther a Ni-Se-C1 compound or NiC12.
Acknowledgments We wish to thank Lars Rosenmeier, E W. Poulsen, Keld
West, and Bo Vestergaard for help and valuable discus- sions, and the Danish Ministry of Energy, Director Ib Hen- riksens Fond, Thomas B. Thriges Fond, the Danish Techni- cal Science Research Council, and the Technical University of Denmark for financial support.
Manuscript submitted Aug. 8, 1992; revised manuscript received Aug. 20, 1993.
Downloaded 28 Jun 2010 to 192.38.67.112. Redistribution subject to ECS license or copyright; see http://www.ecsdl.org/terms_use.jsp

3390 J. Electrochem. Soc., Vol. 140, No. 12, December 1993 �9 The Electrochemical Society, Inc.
REFERENCES 1. B. C. Knutz, H. A. Hjuler, R. W. Berg, andN. J. Bjerrum,
This Journal, 140, 3374 (1993). 2. H. A. Hjuler, R. W. Berg, and N. J. Bjerrum, Power
Sources, 16, 1 (1985); (Proceedings from the 14th In- ternational Power Sources Symposium 1984, Brighton, England).
3. B. Bugnet and D. Donoat, Power Sources, 10, 377 (1985); (Proceedings from the 14th International Power Sources Symposium 1984, Brighton, Eng- land).
4. B. Bugnet and D. Donoat, Fr. Pat. 2,558,485 (1984). 5. R. W. Berg, H. A. Hjuler, and N. J. Bjerrum, Inorg.
Chem., 23, 557 (1984). 6. H. A. Hjuler, R. W. Berg, and N. J. Bjerrum, Unpub-
lished. 7. R. J. Bones, D. A. Teagle, S. D. Brooker, and R. C. Gal-
loway, UK Pat. Appl. GB 2 164 786 A (1986). 8. R. W. Berg, S. von Winbush, and N. J. Bjerrum, Inorg.
Chem., 19, 2688 (1980). 9. K. M. Abraham and J. E. Elliot, This Journal, 131, 2211
(1984). 10. J-Y. Cherng, Ph.D. Thesis, Chemical Engineering De-
partment, Brigham Young University, Provo, UT (1987).
11. H. A. Hjuler, S. yon Winbush, R. W. Berg, and N. J. Bjerrum, This Journal, 136, 901 (1989).
12. O. W~ernes and T. Dstvold, Acta. Chem. Scand., A37, 293 (1983).
13. B. V. Ratnakumar, S. Di Stefano, and G. Halpert, This Journal, 137, 2991 (1990).
14. L. Qingfeng, H. A. Hjuler, R. W. Berg, and N. J. Bjerrum, ibid., 137, 593 (1990).
Oxidation of Acetonitrile-Based Electrolyte Solutions at High Potentials
An In Situ Fourier Transform Infrared Spectroscopy Study
Petr Krtil, ~ Ladislav Kavan, ~ and Pelt Nov6k b J. Heyrovsky Institute of Physical Chemistry and Electrochemistry, Dolej~kova 3, 182 23 Prague 8, Czech Republic
b Paul Scherrer Institute, CH-5232 Villigen PSI, Switzerland
ABSTRACT
The oxidation of LiAsFJacetonitrile and LiC104/acetonitrile solutions containing 0.003-0.05M H20 was studied on plat inum and glassy carbon electrodes by in situ Fourier transform infrared spectroscopy. Both the solvent and the solute are unstable at potentials positive to ca. 2.2 V vs. SCE. The main oxidation product is CO2. Other products detected are: acetamide (LiAsFdacetonitrile), C102, and an unspecified "nitrogen oxide" (LiC1OJacetonitrile). Carbon dioxide is formed via a reaction of acetonitrile with trace water as substantiated by the occurrence of an isotopic shift of the CO2 stretching vibration when using H2~80. The rate of the CO2 formation is increased by the presence of perchlorate anions and the Pt surface.
Research on li thium batteries ~ and photoelectrochemical cells 2'3 has demonstrated that the selection of a suitable electrolyte solution is as important as the design of elec- trodes. An appropriate aprotic solvent should be thermo- dynamically or at least kinetically stable over a wide po- tential range. Many experimental efforts are concentrated on the anodic stability of the electrolyte solutions since it controls various important practical parameters such as the overcharge stability of batteries, and photodegradation processes in solar cells employing n-type semiconductor electrodes.
Acetonitrile (AN) belongs to the most common class of aprotic solvents for electrochemical useJ -~4 The practically usable potential range of a Pt electrode extends up to about 2.3 to 2.7 V vs. SCE in perchlorate/AN solutions, but con- sfderably higher potentials can be achieved using BF~ or PF~ salts as a supporting electrolyteJ -6 Extremely high an- odic potentials can be achieved on a Pt microelectrode in pure acetonitrile (with no added supporting electrolyte)J ~ The limiting potential is hard to define precisely, e.g., by an arbitrary level of faradaic current at a given potential pro- gram, since it may strongly depend on the purity of elec- trolyte solution, electrode pretreatments, etc.
The potential limiting reactions, both anodic and cathodic, are apparently initiated by the solute decom- position, but the mechanism of these reactions is a subject of considerable controversy. 4-~ The lower anodic stability of perchlorate/AN solutions has been attributed to the reactions 7
C10~ --+ C10~ + e- [1]
C10~ + CH3CN --+ HC104 + CH2CN" [2]
2CH2CN" --+ NC--CH2CH2--CN [3]
The primary product, the perchlorate radical C10~ (Eq. 1), was reportedly identified by electron paramagnetic reso- nance (EPR). 1~ This was, however, later questioned, 13 since the EPR spectrum can also be interpreted as that of chlorine dioxide formed either from C10~ by the reaction
C10$ ~ C102 + 02 [4]
or by the decomposition of HCIQ (cf. Eq. 2). I~ Besides CIO2 and 02, the formation of Cl-, 9 03, and H202 was also men- tioned. 7 The faradaic yield of perchlorie acid (Eq. 2) is close to 100% as determined by acido-base titrations, v-9'12 (By changing the solute, other anhydrous acids, e.g. HCI, can thus be prepared. 12 On the other hand, the succinonitrile (Eq. 3) was not detected, TM and it was speculated that it is converted to pyrrole 7 (polypyrrole ?) or that reaction 2 leads to other oxidized species. 9 The formation of polyacetoni- trile, (--C(CH~)=N--)~,14 is another reaction pathway fol- lowing from Eq. 2
CH~CN + HCIO4 -+ CH3C*=NH,CIO~ [5]
n CH3CN + CH~C+----NH,C104
--> HN=C--(N=C--)~ N=C+,CIO; [6]
CH3 CH3 CH~
Polyacetonitrile (ClOg or BF~ doped) films gradually grow at the Pt anode at potentials more positive than 2.6 V vs. Ag/Ag + (0.01M). The --C----N-- bond in polyacetonitrile is sensitive to hydrolytic splitting, leading to various frag- ments including acetamide. 14
Downloaded 28 Jun 2010 to 192.38.67.112. Redistribution subject to ECS license or copyright; see http://www.ecsdl.org/terms_use.jsp