mechanisms by which gulf of guinea and eastern north
TRANSCRIPT
1 MARCH 2001 795V I Z Y A N D C O O K
q 2001 American Meteorological Society
Mechanisms by Which Gulf of Guinea and Eastern North AtlanticSea Surface Temperature Anomalies Can Influence African Rainfall
EDWARD K. VIZY AND KERRY H. COOK
Department of Earth and Atmospheric Sciences, Cornell University, Ithaca, New York
(Manuscript received 1 October 1999, in final form 18 May 2000)
ABSTRACT
The sensitivity of precipitation over West Africa to sea surface temperature anomalies (SSTAs) in the Gulfof Guinea and the eastern North Atlantic is studied using a GCM. Results from nine perpetual July simulationswith various imposed SSTAs are presented and analyzed to reveal associations between the precipitation andSST fields via large-scale circulation and atmospheric moisture anomalies.
Rainfall increases over the Guinean Coast and decreases over the Congo basin when warm SSTAs are presentin the Gulf of Guinea. These precipitation perturbations are related to the forcing of a Kelvin and a Rossbywave. The former is associated with a weakening of the Walker circulation, while the latter strengthens the WestAfrican monsoon. Rainfall over West Africa is less sensitive to cold SSTAs than to warm anomalies. Threecontributing factors are identified as follows: 1) latitude of the SST forcing, 2) background flow, and 3) non-linearity of the Clausius–Clapeyron equation (no more than a 20% effect). Despite the relative insensitivity toeastern North Atlantic SSTAs alone, a superposition of the individual responses to SSTAs is shown to be a poorpredictor of the response to combined SSTAs, especially over central northern Africa.
A comparison of the modeled moisture budget anomalies to the difference between the summer seasons of1988 and 1994 from the satellite observations and the NCEP reanalysis is conducted. While there may be manycauses of precipitation differences between two particular years, the moisture budget anomalies are similar inthat enhanced precipitation along the Guinean coast is supported mainly by low-level wind convergence fromthe south. The role of advection is also similar in the model and the reanalysis. However, the precipitationdecrease over the Congo Basin that is associated with the Kelvin wave response to Gulf of Guinea SSTs in themodel is not evident in the observations for these 2 yr.
1. Introduction
Since the mid-1960s annual rainfall has been pre-dominantly below normal across much of West Africa.In particular, the Sahel, a semiarid region of West Africabetween 108 and 208N, has been plagued by deficientrainfall and drought conditions (Nicholson 1993). Thescientific community is currently working to understandif this dry period represents change or variability, andhow the precipitation differences are related to sea sur-face temperatures (SSTs), land surface conditions, andfeatures of the large-scale circulation.
In this paper we consider only the effect of SST anom-alies (SSTAs). Dryness over Sahelian Africa has beenassociated statistically with SSTAs on a global scale.We are concerned with only a portion of the possibleeffects of SST on West African precipitation, namely,SSTAs in the eastern Atlantic Ocean. Using GCM sim-
Corresponding author address: Dr. Edward K. Vizy, Departmentof Earth and Atmospheric Sciences, Cornell University, 3152 SneeHall, Ithaca, NY 14853.E-mail: [email protected]
ulations and an examination of the National Centers forEnvironmental Prediction (NCEP) reanalysis, we ex-plore the mechanism(s) that physically connect SSTanomalies in the eastern Atlantic, including the Gulf ofGuinea, with the precipitation field through the large-scale atmospheric hydrodynamics.
Several empirical studies suggest that there is a sta-tistically significant relation between sub-Saharan pre-cipitation and global-scale SST distributions. Lamb(1978) found that during the deficient rainy season of1968 over the Sahel, warm SSTAs were present in theequatorial Atlantic, and during the abundant rainy sea-son of 1967 over the Sahel, cool SSTAs were presentin the equatorial Atlantic. Lamb and Peppler (1992)found a distinctive SSTA pattern over the Atlantic whencomparing three of the driest years since 1940 (1972,1977, and 1984) to the climatology, but the pattern brokedown for the 1983 drought year. Folland et al. (1986,1991) also identified a relationship between AtlanticSSTs and Sahelian precipitation, but they found a stron-ger correlation between African precipitation and ‘‘glob-al’’ SSTs. In attempts to classify types of drought pat-terns, Fontaine and Bigot (1993) and Fontaine and Jan-icot (1996) identified four different SSTA patterns that
Unauthenticated | Downloaded 01/15/22 08:43 PM UTC

796 VOLUME 14J O U R N A L O F C L I M A T E
were associated with West African rainfall. The mod-eling studies of Rowell et al. (1992) and Palmer et al.(1992) suggest that ocean forcing dominates the rainfallvariability over the sub-Sahara, in agreement with theempirical studies. Overall, there is agreement amongthese empirical studies that SST distributions are relatedto West African rainfall variability. However, the phys-ical basis for these correlations and their ramificationsare not yet fully understood.
Other empirical studies have focused on the influenceof more localized SSTAs, for example, in the Gulf ofGuinea and the eastern Atlantic. Newell and Kidson(1984) and Cadet and Nnoli (1987) discussed the im-portance of the Gulf of Guinea for providing a supplyof precipitable water to interior regions of Africa in thesummer. Bah (1987) found that reduced summer Sa-helian rainfall occurs in conjunction with warm SSTAsin the Gulf of Guinea in his composite created from thedry years (1948, 1949, 1968, 1970, 1971, and 1972),but that the reverse relationship does not hold for theanomalously wet year composite (1946, 1950, 1952,1953, 1954, 1955, 1957, 1958, and 1966). Ward (1998)suggested that Atlantic SSTs are important in predictingrainfall fluctuations over the Guinean coast. In a mod-eling study, Druyan and Koster (1989) suggest that theAtlantic Ocean, due west of Sahelian Africa, is a majorsource of water vapor for western Sahel in both wet anddry years, but the Gulf of Guinea is an important sourceof moisture for this region only during wetter than nor-mal years. Other modeling studies have associated drierseasons with a weaker cross-equatorial monsoonal flow(Lamb and Peppler 1990; Semazzi et al. 1993). Wagnerand Da Silva (1994) observed that during the summerof wet years near the Guinea coast, there was a lessdeveloped cold tongue in the Gulf of Guinea along witha relaxation of the trade winds. All of these studies agreethat the Gulf of Guinea is important in influencing rain-fall over the Sahel, but the role of the northern AtlanticOcean basin is still unclear.
Several studies have examined relationships betweenSST forcing and low-level dynamics of the atmosphere.Using composites derived from the 1948 to 1978 ob-servational data, Janicot (1992) found that many near-equatorial atmospheric features [i.e., locations of sub-tropical high pressure centers, zones of maximum con-vergence, and the intertropical convergence zone(ITCZ) precipitation] were displaced southward duringdry years over West Africa. However, empirical studiesby Shinoda (1990a,b) and Shinoda and Kawamura(1994) found during the period of 1900 through 1987that a reduction in rainfall intensity was more respon-sible for the reduced Sahelian rainfall than an equator-ward retraction of the ITCZ. Dynamical features thathave been associated with dry (wet) conditions acrossthe Sahel include a weaker (stronger) tropical easterlyjet in the upper troposphere, and a stronger (weaker)African easterly jet at the top of the boundary layer(Newell and Kidson 1984; Fontaine and Janicot 1992).
In a modeling study, Druyan (1991) associated warmSSTs over the equatorial and southern Atlantic with re-duced surface pressures over the South Atlantic, whichreduced water vapor flow into western Africa. Druyanand Hastenrath (1991, 1992) associated increased rain-fall during the summer of 1950 with a stronger pene-tration of the southerly flow off the Gulf of Guinea ontoWest Africa, consequently enhancing the moisture con-vergence over the Sahel. Rowell et al. (1992) found thatthe reduction in Sahelian rainfall in the summers of 1984and 1987 was linked to weaker low-level moisture con-vergence, but the reduction in rainfall in 1983 was re-lated to abnormally strong midlevel moisture diver-gence. Furthermore, the wet years of 1950 and 1958were associated with a reduction of midlevel divergenceof moisture.
The influence of surface conditions has also been ex-plored. Nicholson (1989) discussed the possible rolesof land surface parameters for strengthening or pro-longing drought episodes in Africa. She suggested thatchanges in vegetation cover, evapotranspiration, albedo,and/or soil moisture can lead to modifications in latentand sensible heat transfer, thermal stability, and con-vergence fields in the atmosphere, influencing rainfallpatterns over West Africa. Cook (1994a,b) identifiedthree mechanisms that may be responsible for com-municating between the surface and the precipitationfield in West Africa. In one mechanism, surface warm-ing generates increased dry convection, which increases(moisture) convergence over the land and enhancedrainfall. Second, lower-atmospheric warming results indecreased relative humidity, decreased low-level con-densation, and decreased (moisture) convergence andrainfall. Finally, enhanced midtropospheric condensa-tion drives low-level moisture convergence. Thesemechanisms together regulate rainfall over the conti-nent. According to these two studies, it is necessary tohave an understanding of the sensitivity of the atmo-sphere to the underlying surface in order to fully explainthe precipitation variability of West Africa.
The purpose of this research is to understand the re-sponse of the precipitation field and features of the large-scale circulation over West Africa in a climate modelto SSTAs in the Gulf of Guinea and the eastern NorthAtlantic Ocean in boreal summer. We are not implyingthat Atlantic SSTAs solely explain anomalous rainfalland circulation modifications over West Africa. How-ever, the response to regional SSTAs is an integral partof the complete picture of West African rainfall sensi-tivity to global SSTAs, and it is a part that can be un-derstood clearly by considering the low-level dynamics.
An atmospheric GCM is used to perform a series ofsimulations designed to isolate the response to SSTAsoff the West African coast by using simplified boundaryconditions. Then, with an understanding of the mech-anisms that are important in the idealized model, ob-servations of certain dry and wet years in West Africaare examined for evidence of similar mechanisms at
Unauthenticated | Downloaded 01/15/22 08:43 PM UTC

1 MARCH 2001 797V I Z Y A N D C O O K
FIG. 1. (a) Control simulation SST distribution, and (b) SSTA patterns in the GCM simulations. Contoursare in K.
work. Note the priority of this paper is to provide athorough analysis of the physical mechanisms that maybe important in the response of West African precipi-tation to regional SSTAs. The comparison of modeledresults with observations is meant only as a validationof these results and not necessarily a complete expla-nation for the contrasting rainfall patterns between thewet and dry years chosen, since other factors are con-tributing.
A description of the GCM and how it is used is givenin section 2, while section 3 discusses the diagnostictechnique utilized in this investigation. Section 4 com-pares the boreal African precipitation in the GCM withobservations. Sections 5 and 6 discuss the atmosphericresponse to Gulf of Guinea and eastern North AtlanticSSTAs, respectively, while section 7 explores the at-mospheric response to the combined Gulf of Guinea–eastern North Atlantic SSTA cases. Section 8 comparesthe mechanisms identified in the GCM simulations toconditions observed during the summers of 1988 and1994. The results are summarized in section 9.
2. Model and experiments
The model used for this study is a version of the GCMdeveloped and maintained by the Climate DynamicsGroup at the National Oceanic and Atmospheric Ad-ministration’s Geophysical Fluid Dynamics Laboratory.It is a spectral model with R30 resolution correspondingto a grid resolution of 2.258 lat 3 3.758 long, yielding32 grid points over the West African Sahel. This modelsolves the primitive equations plus a prognostic equationfor water vapor mixing ratio on 14 vertical levels insigma coordinates. The model is fully nonlinear andcontains feedbacks between the dynamics and physics.Cumulus convection is parameterized by means of amoist convective adjustment.
In order to isolate the effects of SSTAs on the WestAfrican climate, simplified surface boundary conditionshave been adopted. The only landmass included at thesurface is a flat version of Africa. The rest of the globe
is set to ocean conditions. The surface drag coefficientused in the bulk aerodynamical parameterizations ofsensible and latent heat fluxes from the surface are 0.001over the ocean and over land 0.003. The model is runin a ‘‘perpetual July’’ mode to efficiently produce aclimatology. Note, a climatology of similar durationgenerated from a seasonal mode simulation would re-quire an integration period of over 100 yr. Soil moisturedoes not respond to the precipitation field, but is heldfixed over Africa at climatological July conditions fromMintz and Walker (1993), and solar insolation representsmid-July conditions. Clouds are fixed at observed an-nual mean values, and their distribution is zonally uni-form. Diurnal solar forcing is not included, and sea iceis not allowed to form. Ozone concentrations are alsozonally uniform and hemispherically symmetric.
Nine simulations are discussed. Each is 3800 (model)days long, with the first 200 days devoted to spinupfrom an isothermal, dry atmosphere at rest. The last3600 days are averaged to form the climatology. Themodel time step is 16 min, and variables are sampleddaily. Different prescribed SSTs distinguish the nineGCM integrations. In the control integration, the ob-served climatological SST distribution from Shea et al.(1990) is prescribed off the west coast of Africa (458Nand 458S) and zonally uniform July SSTs cover the restof the ocean (Fig. 1a). Observed climatological SSTsare chosen for the Atlantic so the SST distribution canbe as realistic as possible near West Africa, whereSSTAs are to be superimposed. Zonally uniform SSTsare chosen for the rest of the ocean to represent summerconditions as closely as possible in the absence of othercontinents and their features.
In eight GCM simulations, perturbations are imposedon the background SST distribution (Fig. 1a) in the Gulfof Guinea and the eastern Atlantic. Observed SSTs fromShea et al. (1990) for the summers of 1988 and 1994were used as a guide for determining the positions andmagnitudes of the SSTAs. Preliminary simulations inwhich the idealized SSTAs had magnitudes similar tothe observed resulted in weak response in the model.
Unauthenticated | Downloaded 01/15/22 08:43 PM UTC

798 VOLUME 14J O U R N A L O F C L I M A T E
TABLE 1. GCM simulation descriptions.
Integration name Imposed SSTA
ControlWarm Gulf of GuineaCold Gulf of GuineaWarm eastern North AtlanticCold eastern North Atlantic
NoneSSTA12SSTA1SSTA22SSTA2
Warm gulf–cold eastern N. AtlanticCold gulf–warm eastern N. AtlanticWarm gulf–warm eastern N. AtlanticCold gulf–cold eastern N. Atlantic
SSTA1 and 2SSTA22SSTA1 and SSTA2SSTA1 and SSTA22SSTA1 and 2SSTA2
In order to produce a diagnosable response with rea-sonable integration times, magnitudes of the SSTAs ob-tained from the NCEP reanalysis were increased ap-proximately by a factor of 3. Figure 1b shows the SSTApatterns. Description of the location(s) and sign(s) ofthe Gaussian-shaped SSTAs for each simulation isshown in Table 1. All eight possible combinations ofSSTAs in the Atlantic are simulated.
3. Atmospheric moisture budget
To relate structure of the precipitation field to featuresof the large-scale circulation, we examine the atmo-spheric water vapor budget. Using the approach em-ployed by Lenters and Cook (1995), we partition thewater vapor budget so that the climatological precipi-tation rate P (in mm day21), is equal to the evaporationrate, E , minus the vertically integrated sum of the watervapor flux divergence and the local rate of change ofwater vapor mixing ratio according to
1 ]q dsP 5 E 2 p = · qu 1 . (1)E s 3p 3p 1 2[ ]]t grw0 p
Here, ps is the surface pressure, =3p is the three-dimen-sional divergence operator in pressure coordinates, q isthe water vapor mixing ratio, u3p is the three-dimen-sional wind velocity, g is the acceleration due to gravity,rw is the density of water, and ds is the sigma-levelthickness. In the time mean, the third term on the rhsof Eq. (1) can be neglected as
]q dsp ; 0. (2)s ]t grw
Decomposing Eq. (1) into time mean and transientcomponents, expanding the divergence operator intohorizontal and vertical components, evaluating the ver-tical derivative, and rewriting the integral as a finitesum yields
P 5 C 1 A 1 O 1 T 1 E, (3)
where all the variables in Eq. (3) represent climatolog-ical means, and
1psC 5 2 (q= · u )Ds, (4)O 2p 2gr s50w
1psA 5 2 (u · = q)Ds, (5)O 2 2pgr s50w
1O 5 2 (qv) , and (6)sgrw
11T ø 2 = · (p qu 2 p q u ) ds . (7)2 E s 2 s 2[ ]grw 0
[The overbar representing the time mean has been re-tained only in Eq. (7); see Lenters and Cook 1995 formore details.] Here C, or the ‘‘moisture convergenceterm,’’ represents precipitation associated with horizon-tal wind convergence in a moist environment, while A,the ‘‘moisture advection term,’’ represents precipitationassociated with horizontal wind advection of moisture.The ‘‘orographic term,’’ O, is the vertical moisture fluxinto the bottom of an atmospheric p surface column,and it represents orographic precipitation. In these sim-ulations O 5 0.
4. Evaluation of African precipitation in the GCM
Before examining the influence SSTAs in the Atlantichave on rainfall rates over Africa in the model, theGCM’s precipitation field and the moisture budget thatdetermines the precipitation field are validated using theNCEP reanalysis (Kalnay et al. 1996), satellite obser-vations, and station data.
Figure 2a shows the precipitation climatology fromthe GCM simulation with a featureless version of Africaalone. This simulation produces rainfall maxima of 10mm day21 over Cameroon (;108N, 158E), 18 mm day21
over Ethiopia (;58N, 408E), and 6 mm day21 over theArabian peninsula (;208N, 508E). Over West Africacentered along 108N rainfall rates are about 6 mm day21.Precipitation rates are low (less than 2 mm day21) overthe equatorial Atlantic between 108 and 408W.
Figure 2b shows the summer precipitation climatol-ogy from the satellite-gauge precipitation product ofHuffman et al. (1995). The precipitation product is pro-duced by using rain gauge reports to adjust a multisa-tellite estimate. The original data has a resolution of2.58 3 2.58 but is interpolated to the GCM’s resolutionof 2.258 lat 3 3.758 long. A climatology was createdby averaging the summers of 1987 through 1997. Thereare three precipitation maxima over Africa, on the westcoast, over Cameroon, and over Ethiopia. The far west-ern maximum is centered just off the coast of WestAfrica (108N, 158W), with a magnitude of over 12 mmday21. The position of the Cameroon maximum in thesatellite-derived product agrees with the GCM simula-tion. They both have magnitudes of about 10 mm day21.Unlike the GCM, the Ethiopia maxima is about 8 mmday21 and precipitation rates over northeast Africa are
Unauthenticated | Downloaded 01/15/22 08:43 PM UTC

1 MARCH 2001 799V I Z Y A N D C O O K
FIG. 2. Precipitation rates for (a) perpetual Jul control simulation, (b) satellite-gauge precipitation from Huffman et al. (1995), (c) NCEP1949–98 summer climatology, and (d) R30 GCM with realistic surface features, including topography. Contour interval is 2 mm day21.Shading denotes the presence of topography above 400 m in height.
generally less than 2 mm day21. Rainfall rates of over8 mm day21 are found over the equatorial Atlantic,stretching from the West Coast of Africa to the northerntip of South America.
Figure 2c shows the 40-yr summer climatology fromthe NCEP reanalysis. The NCEP reanalysis climatologycovers the years of 1949–98 and is also interpolated tothe GCM’s resolution. The rainfall maximum over farwestern West Africa is over 8 mm day21 and centeredat 108N and 108W. The Cameroon maximum is not pre-sent in the reanalysis. Instead, a broad band of over 6mm day21 rainfall rates stretches from 208W to 308Ebetween the equator and 108N. Rainfall rates over Ethi-opia are over 8 mm day21 and are displaced away fromthe east coast. Precipitation over the equatorial Atlantichas magnitudes weaker than the satellite-gauge mag-nitudes, but greater than the idealized GCM simulation.
A major difference between the GCM control sim-ulation and the observations is that the control simu-lation produces less rainfall across far western West Af-
rica and greater rainfall over East Africa than the ob-servational climatologies (Figs. 2b and 2c). Also, higherrainfall rates in the GCM simulation extend too far northover Africa, especially over East Africa and the ArabianPeninsula. Precipitation is also very weak over the equa-torial Atlantic.
Some of these differences are due to the simplifiedboundary conditions and some are associated with thewell-known difficulties of simulating precipitation inglobal models. The addition of other continents in theGCM simulation decreases precipitation over East Af-rica and increases West African precipitation, improvingthe agreement with the other climatologies. Applying arealistic surface albedo and topography to the all-con-tinent simulation (Fig. 2d) results in the West Africanrainfall maxima being focused over 108N and 108W,with a magnitude of over 14 mm day21. The GCM stillproduces very low rainfall over the equatorial Atlantic,and produces excessive rainfall over northern Africa.The Arabian precipitation maximum is a product of the
Unauthenticated | Downloaded 01/15/22 08:43 PM UTC

800 VOLUME 14J O U R N A L O F C L I M A T E
FIG. 3. (a) Convergence term [Eq. (4)], (b) advection term [Eq. (5)], (c) evaporation, and (d) transients term [Eq. (7)] from the controlR30 GCM simulation. Units are mm day21 and negative values are shaded.
simplified boundary conditions of the GCM, as is thepositive zonal gradient in the precipitation across trop-ical Africa.
Overall, if more complex surface parameterizationsare used, the simulated precipitation agrees better withthe satellite-gauge and the NCEP reanalysis climatol-ogies. The addition of topography and realistic surfacealbedo further improves the precipitation simulation.Discrepancies not associated with the simplified bound-ary conditions include the low rainfall over the equa-torial Atlantic between 108 and 408W, and the overpro-duction of precipitation over Saharan Africa.
Figure 3 shows the terms of the column moisturebudget [Eq. (3)] for the GCM control simulation. Mois-ture convergence in the GCM (Fig. 3a) contributes pos-itively toward precipitation over much of northern Af-rica and the tropical North Atlantic. The Ethiopian andArabian rainfall maximas are accompanied by moistureconvergence maximas larger than the rainfall maximas(by 3 mm day21 and 6 mm day21, respectively). OverCameroon and West Africa moisture convergence isabout 2 mm day21 smaller than the rainfall.
Moisture advection from Eq. (5) for the control sim-ulation is shown in Fig. 3b. Negative moisture advectionis present along the Guinean coast. A large moisturegradient exists between the Gulf of Guinea and WestAfrica as high mixing ratios are found along 128N andlower mixing ratios are positioned over the gulf. Thelow-level southerly flow transports relatively drier airfrom the gulf over West Africa. Negative moisture ad-vection is also found over northern and western Sahelbetween 208W and 108E. The northerly component ofthe low-level airflow transports dry Saharan air south-ward over the Sahel. Over the Sahel east of 108E, pos-itive moisture advection (1–2 mm day21) is present asthe zonal flow transports the relatively wetter air overWest Africa eastward.
Figure 3c is the evaporation field for the control sim-ulation. The largest evaporation rates occur over tropicalAfrica, where rates exceed 5 mm day21 over the Guineancoast. There is a sharp meridional gradient of evapo-ration over the Sahel, as rates are reduced from 4 mmday21 over the southern Sahel (108N) to less than 1 mmday21 over the Sahara.
Unauthenticated | Downloaded 01/15/22 08:43 PM UTC

1 MARCH 2001 801V I Z Y A N D C O O K
The transient eddies reduce the ITCZ’s precipitationover northern Africa. Transient moisture flux vectorsare directed away from each other along the axis of themixing ratio maxima (along 128N), resulting in the di-vergence over the Sahel and southern Sahara shown inFig. 3d. Relatively humid air from the ITCZ is trans-ported poleward toward the Sahara by the transient ed-dies. Negative moisture transients (about 1 mm day21)are also found over equatorial Africa, stretching intoEast Africa.
The boreal summer [June–August (JJA)] climatologyfrom the NCEP reanalysis interpolated to the GCM’stransform grid is compared with the GCM’s moisturebudget. Figure 4a shows the moisture convergence term[Eq. (4)] from the reanalysis. As in the idealized GCM(Fig. 3a), moisture convergence is positive over the Sa-hel. Even though the NCEP precipitation is smaller thanthe GCM precipitation in this region, the convergenceterm is about the same as in the reanalysis. A region ofmoisture divergence occurs over the Cameroon high-lands in Central Africa, which is not present in the con-trol simulation, but may be related to the tongue ofreduced moisture convergence over the Cameroon High-lands produced in the GCM control (Fig. 3a). Unlikethe GCM simulation, moisture convergence occurs overthe Atlantic, west of Africa, increasing the rainfall overthe eastern Atlantic.
The lack of moisture convergence over the easternAtlantic in the GCM is associated with a stronger low-level westerly wind component over West Africa. TheGCM’s zonal moisture divergence is stronger over WestAfrica than in the reanalysis, lowering the overall mois-ture convergence.
As in the GCM, negative moisture advection (Fig.4b) occurs along the Guinean coast and over the north-ern Sahel. Positive moisture advection of about 1 mmday21 is present over the southern Sahel in the reanal-ysis, which is larger than the control simulation. TheGCM only hints at this type of structure over the south-ern Sahel, west of 108E. In both the reanalysis and theGCM, negative moisture advection (less than 3 mmday21) occurs over the eastern North Atlantic and theGulf of Guinea.
The evaporation field for the reanalysis (Fig. 4c) com-pares favorably with the GCM simulation since the soilmoisture is prescribed. The band of maximum evapo-ration is found over tropical Africa, north of the equator,with evaporation rates over the Guinean Coast weaker(1 mm day21) than the GCM. One important differenceis the position of the meridional gradient of evaporation,which is about 58 lat farther north in the GCM.
The moisture transient term from the reanalysis isshown in Fig. 4d. Negative moisture transients over theSahel in the reanalysis are about 2 mm day21 weakerthan in the GCM, and these extend southward over theGulf of Guinea. As in the control simulation, positivetransients are found over the Sahara in the reanalysis,but with smaller magnitudes.
Figure 4e shows the residual of the moisture budgetbalance for the reanalysis. This includes the orographicterm, which is difficult to estimate for the reanalysis.The residual is positive along the Guinean Coast, in-dicating the possible importance of topographic effectsof the highlands along the west coast of Africa in de-termining rainfall.
Discrepancies in moisture convergence and advectionbetween the NCEP reanalysis and the GCM are dueprimarily to differences in the moisture field. Becausemoisture is not an assimilated variable, we use ground-based observations to validate. Figure 5a shows thesummertime mixing ratio profile over Douala, Came-roon (48N). The open-circled dashed line represents theNational Center for Atmospheric Research RAOBSsummer mixing ratio climatology (1956–64), while theclosed-circle long dashed line represents the NCEP re-analysis mixing ratio for the same climatology period.The reanalysis reproduces the moisture profile overDouala accurately, in contrast to the GCM control sim-ulation (solid line), which is drier throughout the at-mosphere. For Niamey, Niger, at 138N (Fig. 5b) theNCEP reanalysis mixing ratios are much larger in thelower and middle troposphere than both the RAOB andthe GCM control simulation. The GCM still has a drybias when compared to the observations; however, themoisture profile was more accurate than it was at Dou-ala. For Tamanrasset, Algeria, at 228N (Fig. 5c) theNCEP reanalysis has a wet bias in the lower and middletroposphere when compared to the observations and theGCM control. The GCM also has a wet bias at lowlevels. Overall, the NCEP reanalysis is too wet overAfrica, especially over the Sahel and Sahara, and a cau-tious approach should be taken when comparing mod-eled results to the reanalysis. It is also apparent that theGCM has a dry bias, compared to the observations andthe NCEP reanalysis.
Overall, the GCM reproduces structure that is com-parable to the structure in the African observed precip-itation field and in the atmospheric water vapor budgetcomponents in the reanalysis even with the model’s sim-plified land-surface boundary conditions. This suggeststhat the GCM, with simplified boundary conditions toallow clearer analysis of the response to SSTAs, can bea valuable tool for identifying mechanisms by whichthe SSTAs in the eastern Atlantic Ocean influence rain-fall across Africa.
5. Response to Gulf of Guinea SSTAs
Figure 6a shows the difference in rainfall betweenthe warm Gulf of Guinea SSTA case and the control(Table 1). Rainfall is enhanced by up to 30% over WestAfrica between the Guinean Coast and 128N. Rainfallis reduced by 1–2 mm day21 along the equator between108 and 408E, and over Sahelian East Africa. Positiverainfall anomalies stretch westward along the equator
Unauthenticated | Downloaded 01/15/22 08:43 PM UTC

802 VOLUME 14J O U R N A L O F C L I M A T E
FIG. 4. (a) Moisture convergence term, (b) the moisture advection term, (c) the evaporation term, (d) the moisture transients term, and (e)the orographic term from the NCEP reanalysis 1949–98 summer (JJA) climatology. Units are mm day21 and negative values are shaded.
Unauthenticated | Downloaded 01/15/22 08:43 PM UTC

1 MARCH 2001 803V I Z Y A N D C O O K
FIG. 5. Vertical profiles of mixing ratio for (a) Douala, Cameroon (at 48N and 98E); (b) Niamey, Niger (at 138N and 28E); and (c)Tamanrasset, Algeria (at 228N and 58E). The solid line in each panel represents the GCM control simulation mixing ratio and the open-circled dashed line represents the NCAR RAOB summer (JJA) mixing ratio climatology. The closed-circle long dashed line represents theNCEP reanalysis summer climatology. Units are g kg21.
FIG. 6. Anomalous precipitation for (a) the warm Gulf of Guinea SSTA simulation minus the control and (b) the cold Gulf of GuineaSSTA simulation minus the control. Contour interval is 1 mm day21. Shading denotes negative perturbations.
to 708W. Note that the rainfall anomalies do not reflectthe structure or position of the SSTAs that caused them.
Cold SSTAs in the Gulf of Guinea produce precipi-tation anomalies of similar structure, but opposite signand smaller magnitude. As shown in Fig. 6b, West Af-rican rainfall is reduced by only 10%–15% between theequator and 128N, and the response at these latitudesover central Africa is very small. The sign and mag-nitude of the response over East Africa is the same asin the warm SSTA case. Precipitation rates are alsoreduced over the Atlantic along the equator. The onlylocation with precipitation increases is equatorial centralAfrica, where precipitation rates are by up to 15% larger.
Figure 7 depicts anomalies from the control in thecomponents of the atmospheric moisture budget for thesimulations with warm (left column) and cold (rightcolumn) SSTAs in the Gulf of Guinea. Differences in
the moisture convergence term, C [Eq. (4)], are shownin Figs. 7a and 7b; differences in the moisture advectionterm, A [Eq. (5)], are in Figs. 7c and 7d; differences inE are in Figs. 7e and 7f; and differences in T [Eq. (7)]are shown in Figs. 7g and 7h. The orographic term [Eq.(6)] anomalies are negligible, since the model has notopography, and are not shown.
In both the warm and cold SSTA simulations, anom-alies in C (Figs. 7a and 7b) most closely resemble therainfall anomalies (Figs. 6a and 6b) in spatial structure,but their magnitudes are about 1 mm day21 larger thanthe precipitation anomalies. Differences in A and E donot account for this difference. These two terms havetheir largest differences directly over the SST anomaliesin the gulf. Enhanced evaporation over the warm SSTAs(Fig. 7e) is balanced by column moisture divergenceassociated with advection (Fig. 7c) as the added at-
Unauthenticated | Downloaded 01/15/22 08:43 PM UTC

804 VOLUME 14J O U R N A L O F C L I M A T E
Unauthenticated | Downloaded 01/15/22 08:43 PM UTC

1 MARCH 2001 805V I Z Y A N D C O O K
←
FIG. 7. Anomalous moisture convergence term for (a) the warm Gulf of Guinea SSTA case and (b) the cold Gulf of Guinea SSTA case,anomalous moisture advection term for (c) the warm Gulf of Guinea SSTA case and (d) the cold Gulf of Guinea SSTA case, anomalousevaporation for (e) the warm Gulf of Guinea SSTA case and (f ) the cold Gulf of Guinea SSTA case, and anomalous moisture transients for(g) the warm Gulf of Guinea SSTA case and (h) the cold Gulf of Guinea SSTA case. Contour interval is 0.5 mm day21, except for themoisture convergence term, where it is 1 mm day21. Shading denotes negative perturbations.
mospheric moisture is transported northward instead ofcondensing over the gulf and increasing precipitationrates in the vicinity of the SSTAs. The opposite occursin the cold SSTA case (Figs. 7d and 7f). Over WestAfrica, anomalies in A are generally under 1 mm day21
and of the same sign as the convergence term anomalies,so they do not explain the discrepancy between the con-vergence term anomalies and the precipitation anoma-lies.
Differences in column moisture convergence by tran-sient eddies oppose the differences in the convergenceterm anomalies, and account for the fact that the pre-cipitation anomalies are smaller than the convergenceterm anomalies. This is especially clear over West Africaand the Atlantic in the warm SSTA case (Fig. 7g), inwhich reductions in moisture convergence by transientactivity accompany increases in the convergence term(Fig. 7a). To the north, greater moisture convergenceby transients balances reductions in the convergenceterm, so there is no response in the precipitation fieldon the coast near 108N. In the cold SSTA case, anom-alous moisture convergence due to transient activity issmaller, but the tendency to oppose the contributionsfrom the moisture convergence and advection terms isthe same.
Changes in the column moisture budget due to Gulfof Guinea SSTAs are related to differences in the mois-ture content of the atmosphere as well as the dynamicalresponse of the atmosphere. The presence of the SSTAsis communicated from the sea surface into the atmo-sphere through the sensible heat flux and by evaporation(latent heating). Sensible heating modifies air temper-atures in the lower troposphere near the SSTAs. Dif-ferences in evaporation change the low-level moisturecontent, but directly modify atmospheric temperatureprimarily in the middle and upper troposphere wherecondensation occurs. The heat absorbed in evaporatingwater can be deposited into the atmosphere over theSSTAs, or in some location far removed.
The amount of water vapor present in the atmosphereover the Gulf of Guinea and the Guinean coast is in-creased (reduced) in the warm (cold) SSTA case. Figure8 shows mass-weighted, vertically integrated mixing ra-tio for the warm (Fig. 8a) and cold (Fig. 8b) SSTA cases.The amount of moisture increases over the warm Gulfof Guinea SSTAs, extending out over the Atlantic alongthe equator and penetrating onto the Guinean coast southof the ITCZ. Over the African Congo, the amount ofwater vapor in the atmosphere decreases.
The opposite occurs over the Gulf of Guinea and the
Congo in the cold SSTA case, but with smaller mag-nitudes. Reduced moisture amounts are found over thenorthwestern Sahel in the cold SSTA case, but the op-posite does not occur in the warm SSTA case. Thisreduction in water vapor in the cold SSTA case is as-sociated with a stronger, more active African easterlyjet, which removes water vapor from the atmosphericcolumn below the level of condensation. In addition,possibly because of the nonlinearity of the Clausius–Clapeyron equation, the change in saturation vapor pres-sure and, therefore, evaporation, associated with a tem-perature decrease is smaller than that associated with atemperature increase. For example, the saturation vaporpressure increases by about 6 mb due to a temperatureincrease from 297 to 300 K, but decreases by only 5mb for a temperature decrease from 297 to 294 K.Therefore, the magnitude of the vapor pressure anomalyis about 20% larger in the warm case. In addition, col-umn moisture convergence by transient eddies is moreimportant when SSTAs are cold, opposing anomalousmoisture convergence to reduce the magnitude of theanomalous precipitation response. The differences in themagnitudes of the precipitation anomalies between thewarm SSTA and cold SSTA cases are approximately20%.
Figure 9a shows anomalous eddy geopotential andeddy winds at 866 mb due to warm SSTAs in the gulf.The well-known response to steady forcing near theequator from the shallow water equations is evident[e.g., see Fig. 11.19 in Gill (1982)]. The purely zonalflow into the heating anomaly close to the equator isthe Kelvin wave response, and this is the only responseto the east of the heating. It is associated with zonaldivergence directly east of the SSTA (Fig. 7a) and pre-cipitation reductions over equatorial Africa (Fig. 6a).
Kelvin and Rossby wave responses both occur to thewest of the SSTA. The presence of the Rossby mode isindicated by the cyclonic anomaly near 128N and 108W,and meridional wind perturbations that occur in additionto the zonal wind perturbations of the Kelvin mode. Thenorthward meridional wind perturbations between theGuinean coast and 208N along the Greenwich meridianform part of the anomalous flow about the cyclone, andthey strengthen the West African monsoon flow in thisregion. As in the shallow water solution to steady heat-ing, the maximum vertical velocity perturbations arenear the maximum meridional wind perturbations, inthe southeast quadrant of the cyclonic perturbation. Thisplaces the vertical velocity perturbation associated with
Unauthenticated | Downloaded 01/15/22 08:43 PM UTC

806 VOLUME 14J O U R N A L O F C L I M A T E
FIG. 8. Anomalous mass-weighted vertically integrated mixing ratio for the (a) warm Gulf of Guinea SSTA simulation minus the control,and (b) the cold Gulf of Guinea SSTA simulation minus the control. Contour interval is 0.5 kgH2O m22 with negative values shaded.
the Rossby mode along the Guinean coast, and enhancedprecipitation in this region results.
The return flow of the Rossby wave response is theequatorward flow seen to the west of the heating anom-aly. This return flow occurs over a wider region (fromabout 208 to 808W) than the more concentrated polewardflow. The resulting convergence along the equator (Fig.7a), in the more moist environment near the warmSSTA, leads to the precipitation enhancements acrossthe equatorial Atlantic west of Africa (Fig. 6a).
The Kelvin wave response to Gulf of Guinea SSTAsis associated with the generation of an anticyclonic per-turbation over northern Sudan (Fig. 9a). Zonal diver-gence directly east of the SSTA over equatorial Africadiverts the low-level moist inflow from the Indian Oceanthat feeds the East African precipitation maximum. Thisresults in a westward shift of the precipitation maxi-mum, with reduced rainfall over western Sudan andChad. It is likely that this response would be less prom-inent in a model with topography, since the Ethiopianhighlands generate a strong orographic term in the col-umn moisture budget.
Unlike the Gill model formulation, the response inthe GCM is nonlinear and occurs in the presence of acomplicated basic-state flow, most notably the West Af-rican monsoon and a Walker circulation on the equator.The westerly flow anomalies to the east of the SSTAsrepresent a weakening of the basic-state onshore flowin this region, and a weakening of the Walker circula-tion. This contributes to a reduction in the subsidenceover the Gulf of Guinea, consistent with a decrease inthe land–sea temperature contrast that accompanies awarming in the gulf. This subsidence is an importantfactor in determining the intensity of the West Africanmonsoon. Because of this subsidence, rainfall is notenhanced over the SSTAs (Fig. 6a) but over the Africancoast to the north as explained by the column moisturebudget (Fig. 7). Changes in evaporation are associatedwith modifications in low-level moisture levels. Sub-
sidence over the gulf limits the vertical transport of thewater vapor out of the boundary layer, and the moistureanomaly is advected northward by the low-level flow(Figs. 7c and 7d). The moisture anomaly is advected tothe north, into West Africa because of purely dynamicalconstraints. The dynamical response to the midtropos-pheric condensational heating is the same as the onedescribed by Cook (1997), namely, increased midtro-pospheric heating due to the moisture anomaly generatespositive low-level vorticity tendencies between the Gui-nean coast and 108N. The lower atmosphere adjusts byincreasing the advection of lower absolute vorticity airfrom the Gulf of Guinea, while decreasing the advectionof higher vorticity air from the Sahara, generating anom-alous poleward flow over West Africa (Fig. 9a). In thisway, the West African monsoon is strengthened despitethe decrease in the land–sea temperature contrast thatoccurs when the gulf is warm.
The mechanism described above is responsible forthe precipitation dipole between the Sahel and GuineanCoast found in observations (Janowaik 1988; Janicot1992; Rowell et al. 1995). In association with the ad-vection of absolute vorticity, low-level wind conver-gence increases over the Guinean coast and decreasesover the Sahel, supporting the anomalous precipitationdipole. The negative precipitation anomaly signal overthe Sahel is weak because the dry air advection into theITCZ from the Sahara is also weak. This dynamicalresponse is associated with the precipitation dipole be-tween the Sahel and Guinean coast found in the obser-vations.
One can imagine that a large enough positive SSTAin the gulf could weaken the Walker circulation and thesubsidence enough so that convection would breakthrough directly over the SSTA. In this case, the pre-cipitation and SSTA anomalies would be coincident, andwe could expect a decrease of precipitation along theGuinean coast instead of the increase seen with a moremoderate SSTA.
Unauthenticated | Downloaded 01/15/22 08:43 PM UTC

1 MARCH 2001 807V I Z Y A N D C O O K
FIG. 9. (a) Warm Gulf of Guinea SSTA simulation minus the control, and (b) the cold Gulf of Guinea SSTAsimulation minus the control 866-mb eddy geopotential and eddy wind. Units are gpm for eddy geopotential,m s21 for the eddy wind. Negative eddy geopotential perturbations are shaded.
The opposite of the Gill response is seen in the at-mosphere’s response to cold SSTAs, and it explains theincrease in precipitation over the Congo basin and thedecrease over West Africa. The response is somewhatweaker since the moisture anomalies are not as large(Fig. 9b). Absent from the cold SSTA case is the anom-alous anticyclonic response over northeastern Africa,even though rainfall is still reduced over the region.Westerly zonal wind perturbations of the low-level flowover equatorial Africa divert some of the moist low-level inflow from the Indian Ocean eastward, whileweakening the onshore flow. The moisture content ofthe atmosphere (Fig. 8b) and condensational heatingrates are reduced over Sudan and southern Egypt, but
not to the extent they were in the warm Gulf of Guineacase because of the weaker atmospheric response to thecold SSTAs.
6. Response to eastern North Atlantic SSTAs
Figure 10a shows precipitation difference between thewarm eastern North Atlantic SSTA case and the controlsimulation (Table 1). Rainfall is enhanced along 108Nfrom the Greenwich meridian to 608W and over Sudanby about 1 mm day21. Over the Atlantic between theequator and 108N from 608 to 808W precipitation isreduced by about 1 mm day21. Rainfall is also reduced
Unauthenticated | Downloaded 01/15/22 08:43 PM UTC

808 VOLUME 14J O U R N A L O F C L I M A T E
FIG. 10. (a) Warm eastern North Atlantic SSTA simulation minus the control, and (b) cold eastern North Atlantic SSTA simulation minusthe control precipitation differences. Contour interval is 1 mm day21. Shading denotes negative perturbations.
by about 2 mm day21 over Africa along 108N betweenthe Greenwich meridian and 208E.
The cold SSTA case (Fig. 10b) is not exactly theopposite of the warm SSTA case over the AtlanticOcean. Rainfall is reduced by about 0.5 mm day21 along108N between the west coast of Africa and 708W, andenhanced by about 1 mm day21 along the equator. Overthe African continent precipitation perturbations are alsosmall and do not resemble the structure in Fig. 10a.
The precipitation perturbation magnitudes over theAfrican continent in both SSTA cases are much smallerthan the response to Gulf of Guinea SSTAs (Fig. 6),and symmetry between the warm and cold case re-sponses is not present. When precipitation climatologiesare formed from each half of the integration, the struc-ture of the anomalous precipitation over much of theAfrican continent is different between the first and thesecond halves. This suggests that even 3600-day meansare not sufficient to capture any response, which musttherefore be quite small. Over the North Atlantic, how-ever, the two climatologies have the same structure andour analysis focuses on that region.
To understand why the atmospheric response to east-ern North Atlantic SSTAs is weaker than the responseto Gulf of Guinea SSTAs, consider the low-level cir-culation. Figure 11a shows the low-level flow at 866mb from the control climatology. In association withthe North Atlantic high, the summertime flow is north-easterly over northwest Africa. Westerly flow is presentonly north of 358N. Since the thermal low over centralAfrica is centered at a lower latitude than the subtropicalAtlantic high (208 vs 308N), the continental circulationsystem also places easterly flow over much of northernAfrica, especially in the west where westerlies do notoccur north of 108N. Thus, in contrast to the Gulf ofGuinea case, the low-level flow is largely directed fromAfrica toward the eastern Atlantic, and this diminishesthe influence of eastern Atlantic SSTAs.
Figure 11b shows the difference in eddy geopotential
heights and winds at 866 mb between the warm easternNorth Atlantic SSTA case and the control. The NorthAtlantic anticyclone is weaker when warm SSTAs arepresent in the eastern North Atlantic. Eddy geopotentialheights are 5 gpm smaller in the center, and anomalouseddy flow indicates a reduction in circulation aroundthe anticyclone. The anticyclone contracts and shifts tothe west by about 58 of longitude. The strongest eddyheight perturbations are in the midlatitudes of the North-ern Hemisphere, north of the African continent. A low-level negative eddy geopotential perturbation is forcedeast of the heating center at 438N. This response to low-level heating at midlatitudes agrees with the responsepredicted by linear theory (Hoskins and Karoly 1981).A negative eddy geopotential perturbation is also foundover central northern Africa and is most likely an ex-tension of the negative geopotential perturbation northof the African continent.
An examination of the thermodynamic budget showsthat the atmosphere responds to the anomalous heatingfrom the warm SSTAs near 408N and 308W by increas-ing cold air advection from the northwest into the heat-ing region and increasing horizontal warm air advectionto the east away from heating perturbation. Figure 12ashows the difference in horizontal temperature advec-tion between the warm eastern North Atlantic SSTAcase. A negative perturbation forms west of the heatingat 408N and a positive perturbation to the east. Figure12b shows the adiabatic cooling for the same case. Per-turbations near 408N are smaller than the perturbationsin Fig. 12a, indicating the importance of horizontal tem-perature advection at midlatitudes in balancing the low-level heating. This is in contrast to the Gulf of GuineaSSTA case, in which perturbation vertical velocities (aweakening of the subsidence) balance the low-levelheating. Figure 12c shows the difference in horizontaltemperature advection between the warm Gulf of Guin-ea SSTA case and the control. Figure 12d shows thedifference in adiabatic cooling for the warm Gulf of
Unauthenticated | Downloaded 01/15/22 08:43 PM UTC

1 MARCH 2001 809V I Z Y A N D C O O K
FIG. 11. (a) The 866-mb eddy geopotential and eddy winds for the GCM control integration. (b) Warmeastern North Atlantic SSTA simulation minus the control for 866-mb eddy geopotential and eddy winddifferences. Contour units are gpm, and the vector scale is m s21. Negative perturbations of eddy geopotentialare shaded.
Guinea case. Perturbation values are centered over theheating region and are roughly three times larger thanthe horizontal perturbation values.
Farther south adiabatic cooling becomes a more im-portant mechanism for balancing the low-level heating.Subsidence over the heating weakens, and low-levelheights fall over the SSTA and along 108N, while overthe western North Atlantic between 708 and 1008Wheights rise.
The mixing ratio over the warm SSTAs increases,and much of the moisture is transported into middlelatitudes by the basic-state westerly flow. The rest ofthe moisture from SSTAs is advected equatorward in
the anticyclonic circulation. Some of the added moisturepenetrates onto West Africa between the Greenwich me-ridian and the west coast, but most is advected westwardinto the ITCZ. Rainfall is enhanced along 108N, fromthe Greenwich meridian to about 608W, due to the highermixing ratios and stronger upward vertical motions.
Figure 13 shows the difference in eddy geopotentialheights and winds at 866 mb between the cold easternNorth Atlantic SSTA case and the control. The NorthAtlantic anticyclone strengthens over the cold easternAtlantic SSTAs, expanding over northwest Africa. Low-level heights increase over the eastern North Atlantic,extending eastward over northwest Africa.
Unauthenticated | Downloaded 01/15/22 08:43 PM UTC

810 VOLUME 14J O U R N A L O F C L I M A T E
FIG. 12. The 935-mb warm eastern North Atlantic SSTA simulation minus the control (a) horizontal temperature advection and (b) adiabaticcooling differences. The 935-mb warm Gulf of Guinea SSTA simulation minus the control (c) horizontal temperature advection and (d)adiabatic cooling differences. Contour intervals are every 0.5 K day21 with negative perturbations shaded.
FIG. 13. Cold eastern North Atlantic SSTA simulation 866-mb eddy geopotential and eddy wind anomalies.Units are gpm for eddy geopotential, m s21 for the eddy wind. Negative eddy geopotential perturbations areshaded.
Unauthenticated | Downloaded 01/15/22 08:43 PM UTC

1 MARCH 2001 811V I Z Y A N D C O O K
FIG. 14. Differences from the GCM control precipitation for (a) the warm Gulf of Guinea–cold Eastern North Atlantic SSTAs case, (b)the cold Gulf of Guinea–warm Eastern North Atlantic SSTAs case, (c) the warm Gulf of Guinea–warm eastern North Atlantic SSTAs case,and (d) the cold Gulf of Guinea–cold eastern North Atlantic SSTAs case. Units are mm day21 and shading denotes negative perturbations.
An examination of the thermodynamic budget showsthat the atmosphere responds to anomalous cooling overthe eastern North Atlantic near 408N and 308W by in-creasing the advection of warm air from the west andsouthwest and by increasing the advection of cooler aireastward away from the region. Between 108 and 208Nadiabatic warming is more important. Anomalous sub-sidence weakens the upward vertical motions over theeastern North Atlantic along 108N, while farther south,over the equatorial Atlantic subsidence is reduced.
The mixing ratio over the cold SSTAs decreases asevaporation over the SSTAs is reduced. Relatively drierair is advected equatorward in the anticyclonic circu-lation. Rainfall is reduced along 108N over the Atlanticdue to the reduced moisture content of the atmosphereand the weaker upward vertical motions.
7. Response to combined SSTA cases
In general, the stronger response to Gulf of GuineaSSTAs dominates in the combined SSTA cases. Figures14a–d show the anomalous rainfall for the warm Gulf
of Guinea–cold eastern North Atlantic, the cold Gulf ofGuinea–warm eastern North Atlantic, the warm Gulf–warm eastern North Atlantic, and the cold Gulf–coldeastern North Atlantic SSTA cases, respectively. Thedifferences from the Gulf of Guinea only SSTA pre-cipitation perturbations (Figs. 6a and 6b) are relativelyminor. Notable differences are discussed below.
The combination of cold eastern North Atlantic andwarm Gulf of Guinea SSTAs results in a modificationof the magnitudes of the rainfall anomalies associatedwith the warm Gulf of Guinea SSTAs alone. Figure 14ashows the difference between the precipitation field withthese two SSTAs and the control. Negative rainfall per-turbations along 108N over the eastern North Atlanticand positive rainfall perturbations along the equator overthe Atlantic are larger in magnitude than the corre-sponding precipitation anomalies from the warm Gulfof Guinea SSTA only case. In the thermodynamic bud-get (not shown), negative perturbation vertical velocities(a weakening of upward vertical motions) balance thelow-level cooling over the eastern North Atlantic, northof the ITCZ. Mixing ratios north of the ITCZ over the
Unauthenticated | Downloaded 01/15/22 08:43 PM UTC
812 VOLUME 14J O U R N A L O F C L I M A T E
Atlantic are also lower than the warm Gulf of GuineaSSTA alone simulation’s mixing ratios. Compared tothe warm Gulf of Guinea SSTA only case rainfall isreduced more along 108N from the Greenwich meridianto 708W due to the lower mixing ratios and weakerupward vertical motions.
Figure 14b shows the rainfall difference between thecold gulf–warm eastern North Atlantic SSTA case andthe control (Table 1). Magnitudes of the rainfall per-turbations between 108N and the equator over the At-lantic Ocean are larger than the warm Gulf of GuineaSSTA alone simulation (Fig. 6b). Positive perturbationvertical motions near 108N balance the low-level heat-ing, while mixing ratios are larger than in the cold Gulfof Guinea SSTA alone case over the North Atlantic,leading to a bigger positive rainfall perturbation along108N. Over the equatorial Atlantic, negative rainfall per-turbations are about 25% larger than the cold Gulf ofGuinea SSTA case.
Figure 14c shows the precipitation difference betweenthe warm gulf–warm eastern North Atlantic SSTA caseand the control. Positive rainfall perturbations over thewestern Sahel are larger than in the warm Gulf of GuineaSSTA case. The Gill-like atmospheric response de-scribed in section 5 is about twice as strong as the re-sponse to the warm Gulf of Guinea SSTA alone case.Compared to the control simulation, heights are lowerover eastern North Atlantic and the thermal gradient isreduced between West Africa and the eastern North At-lantic. Subsidence is weaker than in the control overboth the Gulf of Guinea and the eastern North Atlantic,while moisture content of the atmosphere over the west-ern Sahel is about three to five times larger than thewarm Gulf of Guinea SSTA case.
Over the eastern North Atlantic north of 108N, pos-itive precipitation perturbations replace the negativeperturbations found in the cold Gulf of Guinea SSTAonly case. Anomalous adiabatic cooling balances thelow-level heating over the eastern North Atlantic, weak-ening the subsidence over the eastern North Atlantic,while strengthening the upward vertical motions in theITCZ.
Figure 14d shows the precipitation difference be-tween the cold gulf–cold eastern North Atlantic SSTAcase and the control simulation (Table 1). Negative pre-cipitation perturbations along the Guinean coast aresmaller than in the cold Gulf of Guinea SSTA alonecase. The addition of the cold eastern North AtlanticSSTAs strengthens the atmospheric response obtainedfrom the cold Gulf of Guinea SSTA case described insection 5. Compared to the cold Gulf of Guinea aloneSSTA case, the anticyclonic perturbation over West Af-rica is about 25% stronger. Heights are higher over theeastern North Atlantic as the North Atlantic high inten-sifies. Compared to the control simulation the land–seathermal gradient between Africa and the North Atlanticand subsidence over the eastern North Atlantic and Gulfof Guinea are stronger. The moisture content of the at-
mosphere over the North and South Atlantic is lowerthan in the control due to the reduced evaporation overthe SSTAs.
In general, the superposition of the perturbations fromthe Gulf of Guinea and eastern North Atlantic SSTAsimulations are not equivalent to anomalies from thecombined Gulf of Guinea–eastern North Atlantic SSTAcases (Table 1). For example, Fig. 15 shows the super-position of the rainfall differences between the warmGulf of Guinea SSTA case and the control and the warmeastern North Atlantic SSTA case and the control. Rain-fall perturbations in the superposition case have largermagnitudes than the perturbations for the combinedSSTA case. Unlike the combined SSTA case, negativeperturbations are present over the Sahel between theGreenwich meridian and 208E and over the easternNorth Atlantic along 108N.
The differences in the precipitation perturbations be-tween the superposition of the isolated cases and thecombined SSTA simulation arise because of nonlinear-ities in the low-level flow field, which are introducedwhen SSTAs are simultaneously present in the Gulf ofGuinea and the eastern North Atlantic.
Figure 16a shows the superposition of the differencesof the wind field at 866 mb between the warm Gulf ofGuinea SSTA case and the control, and between thewarm eastern North Atlantic SSTA simulation and thecontrol. As in the warm Gulf of Guinea SSTA case (Fig.9a), anomalous low-level flow is directed toward thewarm Gulf of Guinea SSTAs along the equator, andnorthward into West Africa. Two distinct cyclonic per-turbations are present over northern Africa, one overWest Africa associated with the Rossby wave responseto warm Gulf of Guinea SSTAs (Fig. 9a), and the otherover central Sahara associated with the response to thewarm eastern North Atlantic SSTAs (Fig. 11b).
Figure 16b shows the wind differences between thewarm gulf–warm eastern North Atlantic SSTA case andthe control (Table 1). Unlike the superposition case, thetwo cyclonic perturbations blend into a single large cy-clonic perturbation over West Africa. Anomalous south-erlies converge with anomalous northerlies over Nigerin the superposition case (Fig. 16a). In the warm gulf–warm eastern North Atlantic SSTA case, interactionsbetween these flow anomalies result in an anomalouslow-level flow that is more westerly over the Guineancoast and Sahel. This has an impact on the latent heatingfield over West Africa, since the southerly flow fromthe Gulf of Guinea is important in supplying moistureto West Africa. Mixing ratio contours from the controlsimulation are also shown in Fig. 16b. The structure ofthis field is predominantly zonal, with the largest mixingratios found in the vicinity of the ITCZ along 128N.Unlike the superposition case, more moisture is trans-ported eastward into the central Sahel in the warm gulf–warm eastern North Atlantic SSTA simulation, ulti-mately leading to larger latent heating rates over thisregion.
Unauthenticated | Downloaded 01/15/22 08:43 PM UTC

1 MARCH 2001 813V I Z Y A N D C O O K
FIG. 15. Superposition of the precipitation anomalies from the warm Gulf of Guinea SSTAcase and the warm eastern North Atlantic SSTA case. Units are mm day21 and shading denotesnegative perturbations.
FIG. 16. (a) Superposition of the 866-mb wind anomalies from the warm Gulf of Guinea SSTA and the warm eastern North Atlantic SSTAcases. (b) The 866-mb mixing ratio from the control simulation and wind anomalies from the warm Gulf of Guinea–warm eastern NorthAtlantic SSTA case. The contour units are gH2O kg21 and vector scale is m s21.
The dipole precipitation perturbation structure overthe Sahel and the Guinean coast is identified in obser-vational studies (e.g., Janicot 1992; Fontaine and Bigot1993; Rowell et al. 1995) when either a cold Gulf ofGuinea–warm eastern North Atlantic or a warm Gulf ofGuinea–cold eastern North Atlantic SSTA pattern oc-curs in the GCM simulations. The rainfall dipole re-sponse is present in the isolated Gulf of Guinea SSTA
cases, but is stronger in the warm gulf–cold easternNorth Atlantic and the cold gulf–warm eastern NorthAtlantic SSTA cases, where eastern North AtlanticSSTAs reinforce the dynamical response associated withthe Gulf SSTAs.
The dynamics leading to the dipole response in thesecases (cold–warm and warm–cold) is similar to that forthe warm and cold gulf cases of section 5. For example,
Unauthenticated | Downloaded 01/15/22 08:43 PM UTC

814 VOLUME 14J O U R N A L O F C L I M A T E
FIG. 17. Summer (JJA) surface temperature differences between the 1949 and 1998 NCEP average and the summer of (a) 1988 and (b)1994. Units are K and negative values are shaded.
when warm SSTAs are present in the gulf, there is anincrease (decrease) in advection of lower (higher) plan-etary vorticity air from the south (north) and the low-level wind convergence is stronger (weaker) over theGuinean coast (Sahel). This leads to more (less) rainfallover the Guinean coast (Sahel). Over the Guinean coast,this mechanism instigates a positive feedback tostrengthen the monsoon flow from the Gulf of Guinea.Over the Sahel, it is unclear from these climatologicalsimulations whether this mechanism instigates a positiveor negative feedback.
8. Comparison with the summers of 1988 and1994
It would be very difficult, and probably impossible,to conduct the above analysis on the observations. Whileexcellent ground-based precipitation datasets are avail-able for the last 100 yr or more (Nicholson 1980) thesedatasets do not cover the adjacent oceans. But one wouldalso need information about atmospheric moisture, low-level winds, and evaporation rates for the land surfaceand nearby oceans to conduct the moisture budget anal-ysis, and these are not available for the long timescalesand resolution needed.
On the other hand, restricting our analysis to the GCMoutput is unsatisfying. Two summer seasons (1988 and1994) are used to explore the degree to which we canattribute observed precipitation perturbations to ob-served SSTAs guided by the analysis from the idealizedGCM. SSTAs from Reynolds and Smith (1994), as pre-scribed in the NCEP reanalysis and the satellite-gaugeprecipitation dataset, are used to determine which sum-mer seasons to compare.
We choose the summers of 1988 and 1994 becauseof their contrasting SSTA and precipitation distribu-tions. The summer of 1988 was wet over the Sahel andsouthern Sahara, and was one of only two years in the
1980s where the annual rainfall exceeded the mean rain-fall (Nicholson 1993). During 1988, the ENSO cyclewas in a cold phase. The summer of 1994 from June toearly August was relatively dry over the western andsouthern Sahel and along the Guinean coast (Nicholsonet al. 1996). Unusually heavy rains occurred over theSahel late in the season, lasting into October, makingthe year of 1994 one of the wettest years over the Sahelin the past 30 yr. Note that our choice of definition for‘‘summer season’’ excludes the months of Septemberand October, therefore in the summer season of 1994the western Sahel and Guinean coast are drier than nor-mal. This definition of ‘‘summer’’ may be too rigid,missing the character of the late summer climate inter-actions.
Figure 17a shows the surface temperature differencesbetween the summer of 1988 and the 1949–98 summerclimatology. Warm SSTAs are present over the Gulf ofGuinea and the eastern North Atlantic in 1988. Thiscase is analogous to the warm gulf–warm eastern NorthAtlantic SSTA GCM simulation (Fig. 14c). Figure 17bshows the surface temperature differences between thesummer of 1994 and the climatology. Cold SSTAs arepresent over both the Gulf of Guinea and eastern NorthAtlantic in 1994, analogous to the cold gulf–cold easternNorth Atlantic SSTA case (Fig. 14d). Remember, how-ever, that the magnitudes of the SSTAs are much largerin the model.
Figure 18a shows the precipitation difference betweenthe summer of 1988 and the summer of 1994 from thesatellite-gauge precipitation product. Rainfall is greaterin the summer of 1988 over the Atlantic from 608W to108E between the equator and 108N. This includes theGuinean coast where precipitation rates are about 2 mmday21 larger in 1988 than 1994. Rainfall is greater inthe summer of 1994 over the northern Sahel.
Figure 18b shows the rainfall differences between thesummer of 1988 and the summer of 1994 from the
Unauthenticated | Downloaded 01/15/22 08:43 PM UTC

1 MARCH 2001 815V I Z Y A N D C O O K
FIG. 18. Summer of 1988 precipitation minus summer of 1994precipitation from the (a) satellite-gauge precipitation product fromHuffman et al. (1995) and (b) NCEP reanalysis. (c) Model rainfalldifferences between the warm Gulf of Guinea–warm eastern NorthAtlantic SSTA and the cold Gulf of Guinea–cold eastern North At-lantic SSTA simulations. Contour interval is 1 mm day21. Shadingdenotes negative perturbations.
NCEP reanalysis. Rainfall is greater in the summer of1988 than in 1994 over West Africa along 108N, andover the equatorial Atlantic. Unlike the rainfall from thesatellite-gauge product, precipitation rates in the re-analysis are greater over East Africa and northern Sahelin the summer of 1988. This discrepancy may be dueto the wet bias of the NCEP reanalysis in the lower andmiddle troposphere discussed in section 4.
Figure 18c shows the GCM simulation precipitationdifference between the warm Gulf of Guinea–warmeastern North Atlantic SSTAs case and the cold Gulf ofGuinea–cold eastern North Atlantic SSTA case. Therainfall perturbations are similar to the anomalies gen-erated in the warm Gulf of Guinea SSTA simulationdiscussed in section 5, but with magnitudes amplified.Over the Guinean coast region, the precipitation per-turbations are approximately twice as large as in theobservations (Fig. 18a) and the reanalysis (Fig. 18b).Positive precipitation anomalies over the Sahel are sim-ilar to the anomalies in the reanalysis, but magnitudesare larger in the model. The larger precipitation per-turbations over the Guinean coast and West Africa inthe model may be due to the larger SSTA magnitudes.Over the equatorial Atlantic, the positive anomalies inthe model are similar to the large-scale anomalies in theobservations, but with smaller perturbation magnitudes.Unlike the satellite-gauge rainfall observations (Fig.18a) and reanalysis (Fig. 18b), precipitation was greaterin the summer of 1988 over the Sahara in the model.This difference is most likely due to the absence ofEurope in the model. The ‘‘far-field’’ response, between108 and 408E, does not occur in the satellite-gauge rain-fall observations, and neither does the decrease overEast Africa. The former discrepancy may be due to theabsence of South America, and the latter to the lack ofEast African topography in the model. The enhancementof rainfall along 108N over the North Atlantic in theobservations is hinted at in the GCM, but again themagnitudes are subdued in the GCM despite the largerSSTA magnitudes.
The moisture budget analyses for the NCEP reanal-ysis and the GCM are shown in Fig. 19. The moistureconvergence term differences for the reanalysis and theGCM are shown in Figs. 19a and 19b, respectively. Thepresence of more small-scale structure in the reanalysisis expected, but there are features common with theGCM. Positive anomalous moisture convergence occursover the Guinean coast and along the equator betweenthe Greenwich meridian and 408W in both the reanalysisand the GCM, with larger anomaly magnitudes foundin the model. Negative anomalous moisture conver-gence also occurs in both the reanalysis and the GCMover the Congo basin. Negative anomalous moistureconvergence located over the west coast of Africa along108N in the GCM is weak in the reanalysis, and posi-tioned farther to the west. As in the model, the moistureconvergence term is responsible for most of the structureof the precipitation perturbation in the NCEP reanalysis.
Unauthenticated | Downloaded 01/15/22 08:43 PM UTC

816 VOLUME 14J O U R N A L O F C L I M A T E
Unauthenticated | Downloaded 01/15/22 08:43 PM UTC

1 MARCH 2001 817V I Z Y A N D C O O K
←
FIG. 19. Anomalous moisture convergence term for (a) the NCEP reanalysis summer of 1988 minus the summer of 1994 and (b) the warmgulf–warm eastern North Atlantic SSTA minus the cold gulf–cold eastern North Atlantic SSTA simulations. Anomalous moisture advectionterm for (c) the NCEP reanalysis summer of 1988 minus the summer of 1994 and (d) the warm gulf–warm eastern North Atlantic SSTAminus the cold gulf–cold eastern North Atlantic SSTA simulations. Anomalous evaporation for (e) the NCEP reanalysis summer of 1988minus the summer of 1994 and (f ) the warm gulf–warm eastern North Atlantic SSTA minus the cold gulf–cold eastern North Atlantic SSTAsimulations. Anomalous moisture transients for (g) the NCEP reanalysis summer of 1988 minus the summer of 1994 and (h) the warm gulf–warm eastern North Atlantic SSTA minus the cold gulf–cold eastern North Atlantic SSTA simulations. Contour interval is 0.5 mm day21,except for the moisture convergence term, where it is 1 mm day21. Shading denotes negative perturbations.
The moisture advection term differences in the re-analysis (Fig. 19c) also have features in common withthe GCM model differences (Fig. 19d). Both the re-analysis and the model produce negative perturbationsover the Gulf of Guinea and the eastern North Atlantic,and positive perturbations over the western Sahel (westof Greenwich). Magnitudes of the perturbations in thereanalysis are comparable to the modeled magnitudes.Discrepancies in the moisture advection term occur overthe rest of northern Africa due to differences in theperturbational flow. Unlike the model, the anomaloussoutherly flow from the Gulf of Guinea does not extendover the Sahel and central Africa. Note, interpretationsdrawn from the moisture budget terms dependent onmixing ratio over the Sahel and Sahara are inconclusivedue to the wet bias of the reanalysis over these regions.This bias was discussed in section 4.
Evaporation differences in the reanalysis (Fig. 19e)generally agree with the differences obtained from themodel results (Fig. 19f). Positive evaporation pertur-bations occur over the eastern North Atlantic and Gulfof Guinea SSTA regions. Magnitudes are larger in themodel, reflecting the larger SSTA magnitudes chosenfor these GCM simulations.
As in the isolated Gulf of Guinea (Fig. 7) and easternNorth Atlantic SSTA cases, the largest perturbations inthe moisture advection term and evaporation occur overthe SSTAs and downwind of the eastern North AtlanticSSTAs over the central North Atlantic Ocean. Theirperturbation fields do not resemble the structure of theprecipitation perturbation, but both terms are importantfactors in determining the anomalous rainfall over theAtlantic Ocean.
Figures 19g and 19h show the moisture transient termdifferences in the reanalysis and the model, respectively.Similar to the model differences, positive perturbationsare found along 108N, west of 108W, and negative per-turbations are located over the Guinean coast and north-western Sahel in the reanalysis. The positive perturba-tion over the Congo in the model is weaker in magnitudeand about 58 farther north in the reanalysis. In general,the magnitudes of the perturbations in the reanalysis aresmaller than the model anomalies.
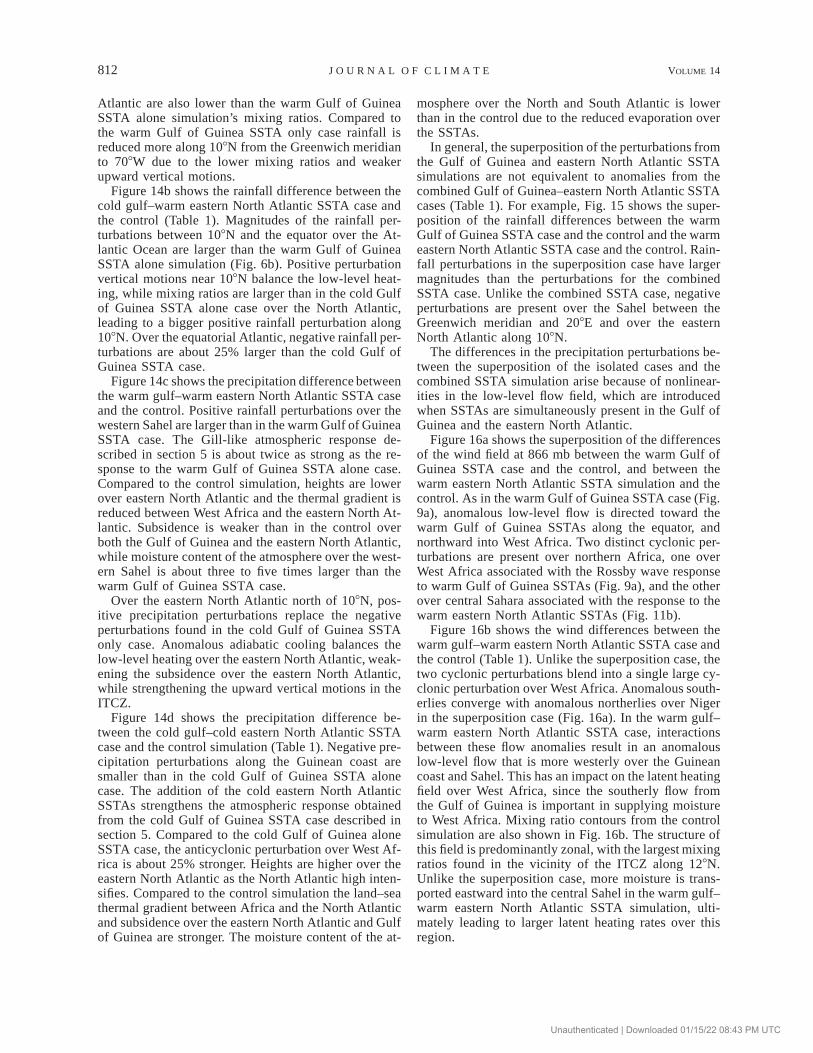
The residual term differences between the summer of1988 and 1994 for the reanalysis are shown in Fig. 20.The orographic term is included in the residual termbecause it is difficult to obtain an accurate estimate ofthis term from the reanalysis. Residual perturbations are
located along the west coast of Africa and are associatedwith the Guinean and Cameroon coastal highlands, pos-sibly suggesting the importance of the orographic termin determining the anomalous rainfall. Residual pertur-bations over the Atlantic Ocean in Fig. 20 suggest thatmaybe the convergence and/or advection term are inerror. Computing the moisture budget on sigma surfaces,which are not available for the NCEP climatology,would improve the estimate of the moisture budgetterms.
As in the GCM SSTA simulations in sections 5 and6, differences in the column moisture budget are relatedto differences in the moisture content of the atmosphereas well as the dynamical response of the atmosphere.The water vapor content of the atmosphere is greaterover the North Atlantic and West Africa in the summerof 1988. This includes the equatorial Atlantic and Gui-nean Coast, where mixing ratios are about 1 gm kg21
greater in 1988 than 1994. Over the Congo basin andequatorial Africa the water vapor content of the atmo-sphere is smaller in 1988.
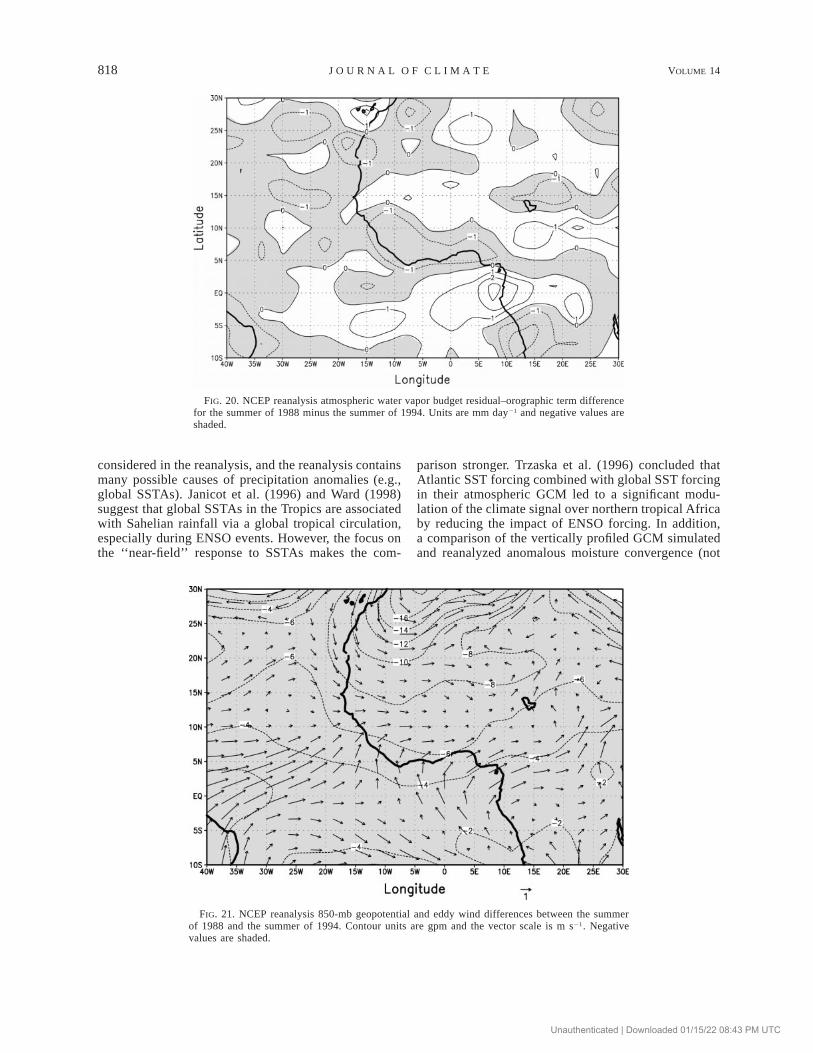
The Gill response identified in the warm Gulf ofGuinea SSTA simulation (Fig. 9a) is not discernable inthe reanalysis. Even so, perturbations over the GuineanCoast in the low-level flow field from the reanalysisresemble perturbations identified in the warm GulfSSTA case. Figure 21 shows the geopotential and eddywind differences of the reanalysis between the summerof 1988 and the summer of 1994 at 850 mb. As in thewarm Gulf of Guinea SSTA case (Fig. 9a), the pertur-bation winds indicate that flow from the Gulf of Guineaonto the Guinean coast is stronger when warm SSTAsare located in the Gulf of Guinea. Unlike in the warmGulf of Guinea SSTA simulation, the anomalous flowover the western Sahel is westerly in the reanalysis andis associated with a cyclonic perturbation over northwestAfrica. The large magnitude of this perturbation sug-gests that it may be a response to an extratropical ormidlatitude forcing, and possibly explains why theRossby response to warm Gulf of Guinea SSTAs is notdiscernable over West Africa. Over the equatorial At-lantic Ocean anomalous flow is eastward, directed to-ward the warm Gulf of Guinea SSTAs, which agreeswith results from section 5. To the east of the Gulf ofGuinea SSTA region, no Kelvin wave response is no-ticeable.
The agreement between the precipitation perturba-tions may be spurious since only two summers were
Unauthenticated | Downloaded 01/15/22 08:43 PM UTC
818 VOLUME 14J O U R N A L O F C L I M A T E
FIG. 20. NCEP reanalysis atmospheric water vapor budget residual–orographic term differencefor the summer of 1988 minus the summer of 1994. Units are mm day21 and negative values areshaded.
FIG. 21. NCEP reanalysis 850-mb geopotential and eddy wind differences between the summerof 1988 and the summer of 1994. Contour units are gpm and the vector scale is m s21. Negativevalues are shaded.
considered in the reanalysis, and the reanalysis containsmany possible causes of precipitation anomalies (e.g.,global SSTAs). Janicot et al. (1996) and Ward (1998)suggest that global SSTAs in the Tropics are associatedwith Sahelian rainfall via a global tropical circulation,especially during ENSO events. However, the focus onthe ‘‘near-field’’ response to SSTAs makes the com-
parison stronger. Trzaska et al. (1996) concluded thatAtlantic SST forcing combined with global SST forcingin their atmospheric GCM led to a significant modu-lation of the climate signal over northern tropical Africaby reducing the impact of ENSO forcing. In addition,a comparison of the vertically profiled GCM simulatedand reanalyzed anomalous moisture convergence (not
Unauthenticated | Downloaded 01/15/22 08:43 PM UTC

1 MARCH 2001 819V I Z Y A N D C O O K
shown) suggests that the dynamical support for the pre-cipitation anomalies is similar in the model and re-analysis. For example, both produce anomalous low-level moisture convergence over the Gulf of Guinea,extending over the Guinean coast and peaking at around850 mb over the ITCZ axis. The low-level southerlyonshore flow associated with the midtropospheric heat-ing and vortex stretching aloft is stronger in the summerof 1988 than 1994, feeding moisture-laden air into theITCZ from the south. The enhanced low-level flow ofrelatively ‘‘wetter’’ air is necessary to maintain the mid-tropospheric heating and the low-level flow, and resultsin the increase of moisture convergence along the Gui-nean coast.
9. Summary and conclusions
An atmospheric GCM with idealized prescribedboundary conditions is used to examine the sensitivityof West African rainfall to SSTAs in the Gulf of Guineaand the eastern North Atlantic Ocean during the borealsummer. A series of nine perpetual-July, 3600-day, R30GCM simulations are analyzed to understand the re-sponse of the precipitation field and its relationship tothe SSTAs through the large-scale circulation anoma-lies. We do not imply that Atlantic SSTAs solely explainanomalous rainfall over West Africa. Other factors, suchas global SSTAs (Folland et al. 1986; Janicot et al. 1996;Ward 1998) and land surface conditions (Nicholson1993; Cook 1997), have been associated with rainfallvariability over West Africa. However, the response toregional SSTAs is known to be an important forcing ofWest African rainfall variability (e.g., Ward 1998), andwe isolate the mechanisms of that variability in thispaper. An overview of the results from the set of GCMsimulations is summarized in three main conclusions.
a. The background circulation is an importantdeterminant of the response to SSTAs overWest Africa in summer
Rainfall increases along the Guinean coast and de-creases over the Congo basin in response to warm Gulfof Guinea SSTAs because of the nature of the back-ground circulation. These features in the precipitationperturbation can be largely understood in terms of thedynamical response to steady tropical forcing, namely,a Kelvin wave response along the equator and a Rossbywave response to the west of the SSTA. The Kelvinwave response is associated with a weakening of theequatorial Walker circulation, which has its up-branchover the Congo basin and its down-branch over the Gulfof Guinea. Anomalous low-level divergence occurs eastof the SSTAs, which results in reduced precipitationrates over the Congo basin. The Rossby wave responseis manifest as a strengthening of the West African mon-soon and anomalous (upward) vertical velocities and
increased rainfall over the Guinean coast region of WestAfrica.
The presence of the Walker circulation also has im-plications for the West African monsoon response. Sub-sidence over the Gulf of Guinea restricts deep verticaltransport of water vapor over the warmed ocean surfaceand supports the poleward transport of moisture by themonsoon flow. This is one reason why the precipitationperturbations are not located over the SSTAs. However,it is possible that a large enough positive SSTA in theGulf of Guinea could weaken the Walker circulationand subsidence enough so convection would breakthrough directly over the SSTAs. If this occurred, theresponse to warm Gulf of Guinea SSTAs may includea precipitation reduction over West Africa instead of theprecipitation increases simulated here.
Understanding the response to eastern North AtlanticSSTAs also requires a consideration of the ambient cir-culation. Rainfall over West Africa is generally insen-sitive to warm (cold) eastern North Atlantic SSTAs,except on the west coast where rainfall increases (de-creases) within the ITCZ. Even with 3600-day averages,we did not capture a significant response in the precip-itation field over land, although the precipitation re-sponse over the Atlantic was significant. There are tworeasons for this reduced sensitivity over northern Africa.One is that horizontal advection is more effective inbalancing anomalies at higher latitudes, and this typeof dynamical response does not feed into the precipi-tation field as strongly as the more typical vertical (adi-abatic) response in the Tropics. Also, the low-level flowbetween the North Atlantic and West Africa is northerlyand northeasterly, which tends to isolate the continentfrom the eastern North Atlantic. Thus, the largest pre-cipitation perturbations associated with anomalous heat-ing over the eastern North Atlantic SSTAs occur withinthe ITCZ.
b. The precipitation response to warm SSTAs is notthe negative of the precipitation response to coldSSTAs over northern Africa
The precipitation response to cold Gulf of GuineaSSTAs is opposite to the warm Gulf SSTA case, butwith weaker perturbations. According to the Clausius–Clapeyron relation, the saturation vapor pressure and,therefore, evaporation rates are less sensitive to coldsurface temperature anomalies than to warm tempera-ture anomalies, and this may account for part (;20%)of the difference in perturbation magnitudes. In addi-tion, anomalous column moisture convergence by tran-sient eddies is more influential when cold SSTAs arepresent. Compared to the warm SSTA simulation, mag-nitudes of large-scale moisture convergence anomaliesover West Africa are about 35% smaller for the coldSSTA case, while magnitudes of anomalous moistureconvergence by transient eddies are only about 15%smaller.
Unauthenticated | Downloaded 01/15/22 08:43 PM UTC

820 VOLUME 14J O U R N A L O F C L I M A T E
c. The response to eastern Atlantic and Gulf ofGuinea SSTAs together does not equal the sum ofthe responses to the SSTAs individually
Given the fact that the response to Gulf of GuineaSSTAs is much stronger than the response to easternNorth Atlantic SSTAs over West Africa, one might con-clude that a knowledge of Gulf of Guinea SSTAs alonewould be sufficient to predict precipitation anomalies(assuming the absence of other forcing). An equivalentdeduction is that a linear superposition of the anomaliesassociated with Gulf of Guinea SSTs and the anomaliesassociated with eastern North Atlantic SSTs would besimilar to the anomalies that result when both Gulf ofGuinea and eastern North Atlantic SSTAs are present.However, we find that a superposition of the anomaliesdiffers from the anomalous response to combinedSSTAs in important ways. Nonlinearities are introducedwhen the atmosphere responds to both SSTAs together,yielding a different perturbation flow field over Africathan would result from the superposition of the corre-sponding isolated SSTAs. For example, with warmSSTAs in both the Gulf of Guinea and eastern NorthAtlantic, the two cyclonic perturbations that form overWest Africa in the superposition case blend into a single,larger cyclone in the combined SSTA simulation. Theresulting perturbation low-level flow is more westerlyover the Guinean coast and Sahel in the combined SSTAcase. This has a large impact on the precipitation overWest Africa, since the southerly flow from the Gulf ofGuinea is important in supplying moisture to West Af-rica.
Acknowledgments. The authors would like to thankthe National Center for Atmospheric Research, whichis sponsored by the NSF, for computing time and ob-servational data presented in this study. Thanks to theNational Centers for Environmental Prediction for sup-plying the reanalysis output presented in this study. Spe-cial thanks to the two anonymous reviewers for theircomments. This research was supported by Grant ATM-9815419 from the NSF and represents a portion ofEKV’s M.S. thesis at Cornell University.
REFERENCES
Bah, A., 1987: Towards the prediction of Sahelian rainfall from seasurface temperatures in the Gulf of Guinea. Tellus, 39A, 39–48.
Cadet, D., and N. Nnoli, 1987: Water vapour transport over Africaand the Atlantic during the summer 1979. Quart. J. Roy. Meteor.Soc., 113, 581–602.
Cook, K. H., 1994a: Mechanisms by which surface drying perturbstropical precipitation fields. J. Climate, 7, 400–413., 1994b: Understanding perturbations of the intertropical con-vergence zone over tropical continents. Global Precipitation andClimate Change, M. Desbois and F. Desalmand, Eds., NATOASI Series I, Vol. 26, North Atlantic Treaty Organization, 349–360., 1997: Large-scale atmospheric dynamics and Sahelian precip-itation. J. Climate, 10, 1137–1152.
Druyan, L. M., 1991: The sensitivity of sub-Saharan precipitation toAtlantic SST. Climatic Change, 18, 17–36., and R. D. Koster, 1989: Sources of Sahel precipitation forsimulated drought and rainy seasons. J. Climate, 2, 1438–1446., and S. Hastenrath, 1991: Modeling the differential impact of1984 and 1950 sea surface temperatures on Sahel rainfall. Int.J. Climatol., 11, 367–380., and , 1992: GCM simulation of the Sahel 1984 droughtwith alternative specifications of observed SST. Int. J. Climatol.,12, 521–526.
Folland, C. K., T. N. Palmer, and D. E. Parker, 1986: Sahel rainfalland worldwide sea temperatures. Nature, 320, 602–607., J. A. Owen, M. N. Ward, and A. W. Coleman, 1991: Predictionof seasonal rainfall in the Sahel region of Africa using empiricaland dynamical methods. J. Forecasting, 10, 21–56.
Fontaine, B., and S. Janicot, 1992: Wind field coherence and itsvariations over West Africa. J. Climate, 5, 512–524., and S. Bigot, 1993: West African rainfall deficits and sea sur-face temperatures. Int. J. Climatol., 13, 271–285., and S. Janicot, 1996: Sea surface temperature fields associatedwith West African rainfall anomaly types. J. Climate, 9, 2935–2940.
Gill, A. E., 1982: Atmosphere–Ocean Dynamics. Academic Press,662 pp.
Hoskins, B. J., and D. J. Karoly, 1981: The steady linear responseof a spherical atmosphere to thermal and orographic forcing. J.Atmos. Sci., 38, 1179–1196.
Huffman, G. J., R. F. Alder, B. Rudolf, U. Schneider, and P. R. Keehn,1995: Global precipitation estimates based on a technique forcombining satellite-based estimates, rain gauge analysis, andNWP model precipitation information. J. Climate, 8, 1284–1295.
Janicot, S., 1992: Spatiotemporal variability of West African rainfall.Part II: Associated surface and airmass characteristics. J. Cli-mate, 5, 499–511., V. Moron, and B. Fontaine, 1996: Sahel drought and ENSOdynamics. Geophys. Res. Lett., 23, 515–518.
Janowiak, J. E., 1988: An investigation of interannual rainfall vari-ability in Africa. J. Climate, 1, 240–255.
Kalnay, E., and Coauthors, 1996: The NCEP/NCAR 40-Year Re-analysis Project. Bull. Amer. Meteor. Soc., 77, 437–471.
Lamb, P. J., 1978: Case studies of tropical Atlantic surface circulationpatterns during recent sub-Saharan weather anomalies: 1967 and1968. Mon. Wea. Rev., 106, 482–491., and R. A. Peppler, 1990: West Africa. Teleconnections: Link-ages between ENSO, Worldwide Climate Anomalies, and Soci-etal Impacts, M. H. Glantz, R. W. Katz, and N. Nicholls, Eds.,Cambridge University Press, 121–189., and , 1992: Further case studies of tropical Atlantic surfaceatmospheric and oceanic patterns associated with sub-Saharandrought. J. Climate, 5, 476–488.
Lenters, J. D., and K. H. Cook, 1995: Simulation and diagnosis ofthe regional South American precipitation climatology. J. Cli-mate, 8, 2988–3005.
Mintz, Y., and G. K. Walker, 1993: Global fields of soil moisture andland surface evapotranspiration derived from observed precip-itation and surface air temperature. J. Appl. Meteor., 32, 1305–1334.
Newell, R. E., and I. W. Kidson, 1984: African mean wind changesbetween Sahelian wet and dry periods. Int. J. Climatol., 4, 27–33.
Nicholson, S. E., 1980: The nature of rainfall fluctuations in sub-tropical West Africa. Mon. Wea. Rev., 108, 473–487., 1989: African drought: Characteristics, casual theories andglobal connections. Understanding Climate Change, Geophys.Monogr., No. 52, IUGG, 79–100., 1993: An overview of African rainfall fluctuations of the lastdecade. J. Climate, 6, 1463–1466., M. B. Ba, and J. Y. Kim, 1996: Rainfall in the Sahel during1994. J. Climate, 9, 1673–1676.
Palmer, T. N., C. Brankovic, P. Viterbo, and M. J. Miller, 1992: Mod-
Unauthenticated | Downloaded 01/15/22 08:43 PM UTC

1 MARCH 2001 821V I Z Y A N D C O O K
eling interannual variations of summer monsoons. J. Climate, 5,399–417.
Reynolds, R. W., and T. M. Smith, 1994: Improved global sea surfacetemperature analysis using optimum interpolation. J. Climate, 7,929–948.
Rowell, D. P., C. K. Folland, K. Maskell, J. A. Owen, and M. N.Ward, 1992: Modeling the influence of global sea surface tem-peratures on the variability and predictability of seasonal Sahelrainfall. Geophys. Res. Lett., 19, 905–908., , , and M. N. Ward, 1995: Variability of summerrainfall over tropical North Africa (1906–92): Observations andmodelling. Quart. J. Roy. Meteor. Soc., 121, 669–704.
Semazzi, F. H. M., N. H. Lin, Y. L. Lin, and F. Giorgi, 1993: A nestedmodel study of the Sahelian climate response to sea surfacetemperature anomalies. Geophys. Res. Lett., 20, 2897–2900.
Shea, D. J., K. E. Trenberth, and R. W. Reynolds, 1990: A globalmonthly sea surface temperature climatology. NCAR Tech. NoteNCAR/TN-345 1 STR, 167 pp. [Available from National Centerfor Atmospheric Research, P.O. Box 3000, Boulder, CO 80307-3000.]
Shinoda, M., 1990a: Long-term variability of the tropical Africanrainbelt and its relation to rainfall in the Sahel and northernKalahari. J. Meteor. Soc. Japan, 68, 19–35., 1990b: Long term Sahelian drought from the late 1960’s to themid 1980’s and its relation to the atmospheric circulation. J.Meteor. Soc. Japan, 68, 613–624., and R. Kawamura, 1994: Tropical rainbelt, circulation, and seasurface temperatures associated with Sahelian rainfall trend. J.Meteor. Soc. Japan, 72, 341–357.
Trzaska, S., V. Moron, and B. Fontaine, 1996: Global atmosphericresponse to specific linear combinations of the main SST modes.Part I: Numerical experiments and preliminary results. Ann. Geo-phys., 14, 1066–1077.
Wagner, R. G., and A. M. Da Silva, 1994: Surface conditions asso-ciated with anomalous rainfall in the Guinea coastal region. Int.J. Climatol., 14, 179–199.
Ward, M. N., 1998: Diagnosis and short-lead time prediction of sum-mer rainfall in tropical North Africa at interannual and multi-decadal timescales. J. Climate, 11, 3167–3191.
Unauthenticated | Downloaded 01/15/22 08:43 PM UTC