mechatronics design of a robot society -...
TRANSCRIPT

Helsinki University of Technology - Automation Technology Laboratory
Series A: Research Reports No. 22. November 2000
MECHATRONICS DESIGN OF A ROBOT SOCIETY- A Case Study of Minimalist Underwater Robots for Distributed
Perception and Task Execution
Pekka Appelqvist
Dissertation for the degree of Doctor of Technology to be presented with due permission for public
examination and debate in Auditorium T2 at Helsinki University of Technology (Espoo, Finland) on
the 17th of November 2000, at 12 o�clock noon.
Helsinki University of Technology
Department of Automation and Systems Technology
Automation Technology Laboratory
Teknillinen korkeakoulu
Automaatio- ja systeemitekniikan osasto
Automaatiotekniikan laboratorio

Distribution:
Helsinki University of Technology
Automation Technology Laboratory
P.O. Box 5400
FIN-02015 HUT
FINLAND
e-mail [email protected]
Tel +358-9-451 3311
Fax +358-9-451 3308
© Pekka Appelqvist
SUBMARis a registered trademark of Intelligent Submar Society Ltd.
Other product names are trademarks of their respective holder.
ISBN 951-22-5166-3
ISSN 0783-5477
Photo on the title page: SUBMAR robot travelling in a water pipe.
Pica-set Oy
Helsinki 2000

3
Abstract
This thesis describes the mechatronics design of a cooperative multi-robot system,
including systems level design, practical implementation, and testing. Two mainsubjects are integrated in this research work: the generic concept of aRobot Society as an engineering framework to control an autonomously operating
distributed multi-robot system, and the constructed prototype society consisting ofseveral sensor/actuator robots for submerged use in a liquid environment.
These novel types of prototype robots, SUBMARs, are targeted for distributedautonomous perception and task execution in the internal, three-dimensional
on-line monitoring of various flow-through processes. The Robot Society controlarchitecture implemented into SUBMAR robots supports such features as the
autonomous cooperation of the robots, multi-tasking, self-organization, and self-optimization in task execution. The mechatronics design of the robots has followeda minimalist approach, where the structure of the robot is maximally simplified. As
a solution to compensate the obvious limitations derived from minimalism, themultiplicity and the cooperation of the robots have been exploited. On a systems
level, this produces fault tolerant, flexible, and cost-effective engineering solutionsfor application.
Altogether over 90 logged experiment runs with physical robots have beencompleted to elucidate the functioning and reveal the factors affecting the
performance of the system. The testing has been performed in a laboratoryenvironment in a special demonstration process. In these experiment series, thesearching and destroying of distributed dynamic targets were tested. Furthermore,
the meaning of communication in the development of robot consciousness duringthe mission has also been analyzed.
As a result of the research work and systems development, profound knowledge hasbeen gained and new solutions presented for the required technology for a
minimalist mobile robot operating in a liquid process environment. SUBMARRobot Society forms a technological basis for the development of real-world
applications in the future.
Keywords: Multi-robot systems, robot society, mechatronics design, underwaterrobots, minimalist approach, robot cooperation, robot consciousness
4
Preface
This study concerning autonomous mobile multi-robot systems has been
carried out at the Automation Technology Laboratory of the Helsinki University ofTechnology under various research projects from 1995-2000. These projects havebeen funded mainly by the National Technology Agency (TEKES) and Academy of
Finland, which are thereby greatly acknowledged.Since I graduated in 1996, my full-time research work was ensured by
several grants from the Helsinki University of Technology, Tekniikan Edistämis-säätiö, the Finnish Society of Automation, and Automation Foundation.Furthermore, in 1999 I was accepted into the national GETA program (the
Graduate School in Electronics, Telecommunications, and Automation) to finalizemy post-graduate studies. Thus, I would like to thank all these sources for their
valuable financial support.I wish to express my gratitude to Professor Aarne Halme, who as the head
of the Automation Lab and my supervisor has guided me through the demanding
research process. His expertise and advise have been essential during the study.I am also especially thankful to my co-worker, Dr. Mika Vainio. He
originally introduced me to the exciting world of behavior-based mobile multi-robotsystems and set an example of how to proceed in the academic world. His input forthe systems development of the SUBMAR Robot Society has been of the utmost
importance; without him, the system would not be operational.I would like to extend my thanks to all the people who have been involved in
this research process: at the early phase, our research group was enriched withprofessional skills and innovations by Yan Wang, Pekka Kähkönen, and Torsten
Schönberg. Tommi Tuovila and Antti Matikainen invested a great effort in the
simulator studies, while Markku Kontio and Sami Ylönen have contributed to therobots� software development. Johanna Nikkinen and Anja Ranta have had their
share of various phases in the research projects, as in analyzing the test results.Kalle Rosenblad has been a trustworthy problem solver in complex electronicsmatters. Mechanical design and implementation have been assisted by Tapio
Leppänen and Markku Viljakainen, while Jorma Selkäinaho and Ari Kokkonen
have guaranteed smooth running of our computing facilities. In fact, almost all
have helped me in some way during the study, so many thanks to the entire staff of
Automation Lab for creating a friendly, fun, and innovative spirit in our workplace.As well, I wish to acknowledge Antti Hakala (Sofimation Oy) and Tomi Hänninen
(RTD Scandinavia Oy) for their vital credits in the design of the SUBMAR robots.Furthermore, I extend thanks to my preliminary examiners Dr. Hajime
Asama and Professor Raimo Sepponen for their reviews and valuable comments onthe thesis. Many thanks are also due to Kathleen Tipton for the language revisionof my manuscript.
Finally, I would like to thank my parents and all my good friends for theirsupport and encouragement throughout the project. I feel so happy to complete my
post-graduate studies after some four and a half years of intensive research work!From now on, I should have a life as well, but I am sure it is cool to be a doc�
Otaniemi, Espoo
September 2000 Pekka Appelqvist

5
Contents
Abstract 3
Preface 4Contents 5List of symbols and abbreviations 8
1. Introduction 11
1.1 Overview 111.2 Motivation and aims for the study 14
1.3 Scientific contribution of the dissertation 141.4 Outline of the dissertation 15
1.5 Author�s contribution within the research group 15
2. Autonomous robotic systems and mobile instrumentation 17
2.1 Introduction 17
2.2 Autonomous mobile robots 172.2.1 Robots for an underwater environment 192.2.2 In-pipe robotic vessels 19
2.2.3 Towards reactive control and minimalism 192.3 Cooperative multi-robot systems 20
2.3.1 Interactions and communication 222.3.2 Simulated multi-robot behavior 23
2.4 Intelligent and mobile instrumentation 23
3. Applying the concept of the Robot Society 25
3.1 The Robot Society as an engineering concept 253.1.1 Advantage of multiplicity 26
3.1.2 Collective consciousness 273.2 Minimalist underwater robots as a case study 28
4. Mechatronics structure of SUBMAR robots 31
4.1 Introduction 314.2 Mechanics 32
4.2.1 Casing 324.2.2 Tank-actuators 34
4.3 Electronics 364.3.1 Hardware modules 374.3.2 Sensors 39
4.3.3 Emulated instrumentation 404.4 Software 40

6
4.4.1 Control architecture 41
4.4.1.1 Behavioral layer 414.4.1.2 Task layer 43
4.4.1.3 Cooperative layer 434.4.2 Communication structure 44
4.4.2.1 Low-level protocol for communication 44
4.4.2.2 High-level handling of messages 46
5. Experiments with the SUBMAR society 47
5.1 Test environment 47
5.1.1 Demo process 475.1.2 Emulated biomass system 47
5.1.3 User interface 505.1.4 Preliminary simulator testing 52
5.2 Task definition 53
5.2.1 Task A: Mapping, positioning, and navigation 535.2.2 Task B: Emulated biomass detection and removal 56
5.3 Experiment series I: 57 Cooperation in distributed task execution
5.3.1 Single robot tests 58
5.3.2 Tests with 3 robots 585.3.3 Tests with 5 robots 59
5.3.4 Summary 625.4 Experiment series II: 63 Communication and collective consciousness of the society
5.4.1 Tests with 3 robots 645.4.2 Tests with 5 robots 65
5.4.3 Summary 665.5 Conclusions 67
6. Technological considerations 69
6.1 Enhancements and suggestions for implementation 696.1.1 Sensors 696.1.2 Actuators 706.1.3 Communication methods 716.1.4 Positioning and navigation 736.1.5 Motion and energy 74
6.2 Potential applications 756.3 Microengineering considerations 76
7. Conclusions 77
7.1 Summary and conclusions 777.2 Future work 79
References 80

7
Appendices 87
Appendix A Schematic layout of SUBMAR CPU moduleAppendix B Schematic layout of SUBMAR Power module
Appendix C Schematic layout of SUBMAR Amplifier moduleAppendix D Schematic layout of SUBMAR Motor control moduleAppendix E Schematic layout of SUBMAR Communication module
Appendix F Schematic layout of SUBMAR Infrared module
Appendix G Tests from Experiment Series I (1 robot)Appendix H Tests from Experiment Series I (3 robots, no IRC)Appendix I Tests from Experiment Series I (3 robots, C-type IRC)
Appendix J Tests from Experiment Series I (5 robots, no IRC)Appendix K Tests from Experiment Series I (5 robots, C-type IRC)
Appendix L Tests from Experiment Series I (5 robots, CC-type IRC)
Appendix M Tests from Experiment Series II (3 robots, no IRC)
Appendix N Tests from Experiment Series II (3 robots, IRC)Appendix O Tests from Experiment Series II (5 robots, no IRC)
Appendix P Tests from Experiment Series II (5 robots, IRC)

8
List of symbols and abbreviations
A biomass
c confidence valueD death rate of biomass
λ learning rate
µ growth rate of biomass
µTAS micro Total Analysis System
3D three-dimensional
AC Alternating Current
A/D Analog-to-DigitalAI Artificial IntelligenceAMR Autonomous Mobile Robot
APN Adaptive Place Network
ASCII American Standard Code for Information InterchangeASIC Application Specific Integrated CircuitAUV Autonomous Underwater Vehicle
CBM Common Basic MapCCD Charge-coupled Device
CEBOT Cellular Robotic SystemCMOS Complementary Metal Oxide Semiconductor
CPU Central Processing UnitCRC Cyclic Redundancy Check
CSMA/CD Carrier Sense Multiple Access with Collision Detection
DARS Distributed Autonomous Robotic Systems
DC Direct CurrentDIP Dual In-line Package
DSP Digital Signal ProcessingEEPROM Electrically Erasable PROM
EMC Electromagnetic CompatibilityFET Field-Effect TransistorFSA Finite State AutomataGPS Global Positioning SystemHUT Helsinki University of Technology
IDC Intelligent Data Carrier
IMU Inertial Measurement UnitI/O Input/OutputIR Infrared
IRC Inter-Robot Communication

9
LED Light Emitting Diode
LIGA Lithographie, Galvanoformung, Abformung �technology;German for lithography, electroforming, molding
MEMS MicroElectroMechanical SystemsMOSFET Metal-Oxide-Semiconductor FETMST MicroSystem Technology
NiMH Nickel Metal Hydride
ORC Operator-to-Robot CommunicationPROM Programmable ROMRAM Random-Access Memory
RF Radio frequency
ROM Read-Only MemoryROV Remote Operated VehicleRS Robot Society
SRAM Static RAMSTD Standard deviation
SUBMAR Smart Underwater Ball for Measurement and Actuation RoutinesUHF Ultra-High Frequency
URV Underwater Robotic VehicleUUV Unmanned Underwater Vehicles
UV Ultraviolet

10
This page is left intentionally blank
and dedicated to white noise.

11
Chapter 1
Introduction
1.1 Overview
This thesis deals with the mechatronics design of an experimental cooperative
multi-robot system, including systems level design, practical implementation, andtesting. Two main subjects are integrated in the research work: the generic concept
of the Robot Society as an engineering framework and control architecture tocontrol an autonomously operating cooperative mobile multi-robot system, and theconstructed prototype society consisting of several mobile sensor/actuator robots
for submerged use in a liquid environment.
As a research field, cooperative multi-robot systems is a relatively new area ofscience. Based on the previous research on mobile robotic platforms and simulatorstudies on autonomous, AI-inspired agents in the 1980s, the interest in multi-robot
systems started to grow and expand rapidly at the beginning of the 1990s. Maybethe time has not come yet, or the technological premises do not exist yet, but at
least so far, a unified or well-established theory for a control architecture tocontrol a cooperative multi-robot mission has not been formed. Therefore, researchin this field has been very experimental by nature.
The scope of potential applications for various multi-robot systems is enormously
wide, covering duties from everyday human life to micro-scale manufacturing anddistant extra-terrestrial planetary missions. Dozens of approaches have beenintroduced by leading robotics laboratories and research groups around the worldas control architectures for cooperative multi-robot systems. Many of the proposedsystems have remained more or less as theoretical simulator studies only, althoughpractical evaluation with respective physical embodiment has proven highlyimportant. Practical limitations in perception, communication, mobility, etc.encountered by the robots in the dynamic real-world environment have proved
many good ideas to be technologically infeasible.

12
Cooperative multi-robot systems cover a wide range of scientific and technological
aspects. To name a few key areas for these systems, the autonomous functioning,cooperation, self-organization, distributed perception, and distributed control of
robots have to be mentioned. As can be seen, advanced multi-robot systems turnout as a truly multi-disciplinary research area.
The required features for the intelligent behavior of the robots are all derived fromthe control architecture, which has to be understood rather as a program structure
than as any specific part of the software. The control architecture should supportparallel execution of several program processes at a low level (e.g. sensor samplingor communication) and tasks at a high level (e.g. navigation or optimization of
performance). The structure of the control architecture can be generic by nature toa certain extent, but the connections to inputs (sensors) and outputs (actuators)
attach the architecture to the application. Due to the complex system requirements,thoroughgoing systems level analysis and design is an essential process beforemoving on to the actual software and hardware design of the robots. For example,
detailed attention should be paid to the implementation of the user interface andsafety features already at the systems level design phase.
Mechatronics is an essential technology to the realization of a robotic system. Inthis context, mechatronics is understood in its most intelligent and advanced
meaning. Today�s advanced mechatronics integrates mechanics, electronics, andembedded software. In many cases, due to the integrated nature of the design, the
functioning of these elements can no longer be clearly separated. Instead,mechanics, electronics, and software augment each other, producing a functionalvalue greater than their sum alone. Autonomous mobile robots are concrete and
illustrative examples of advanced mechatronics devices.
Technological minimalism is another key aspect throughout this thesis; concerning
the entire mechatronics design process, maximally reduced and simplified, but stillfunctional and robust solutions have been sought. The limitations of this minimalistapproach are compensated for with the multiple and cooperative use of robots.
A minimalist design scheme promotes reliable and cost-effective solutions preparedfor mass production.
When multi-robot research was just underway at the HUT Automation TechnologyLaboratory in the early 1990s, various suitable platforms were considered to test
the ideas related to cooperative multi-robot behavior and control. In this context,the idea of the so-called bacterium robot society (discussed in Section 3.2) was
developed based on the concept of the Robot Society, see [Halme et al., 1993]. Inthe following year, 1994, these thoughts led to a research project, which aimed atsetting up a fully operational demonstration system of a bacterium robot society toallow multi-robot studies with physical robots.
The demonstration society consists of several cooperative robots members. Forthese purposes SUBMAR (Smart Underwater Ball for Measurement and ActuationRoutines) robots were developed. These are mobile autonomous sensor/actuator
platforms intended for the 3D internal monitoring and controlling of liquidprocesses. These underwater robots are designed by strictly following the
minimalist approach, which, for instance, results in underactuated maneuverabilityand only rough areal positioning capabilities in this case. In a real-worldapplication, the SUBMAR type of sensor/actuator robots could augment standard
13
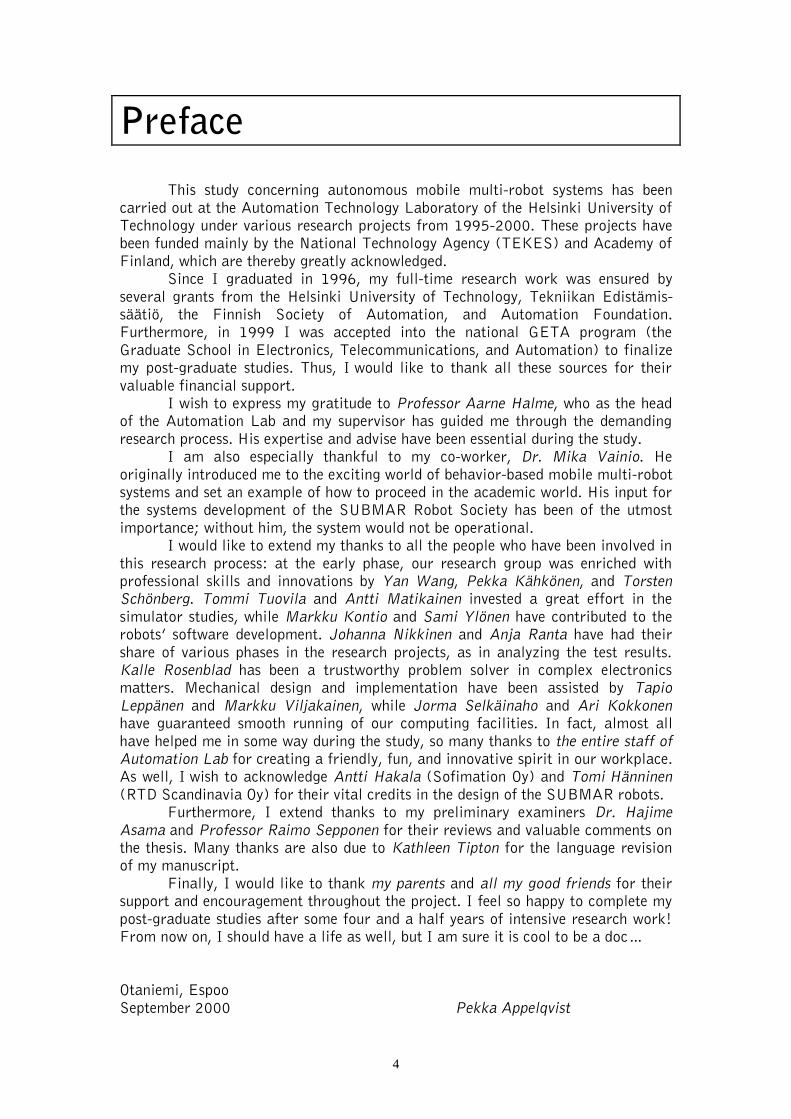
fixed process instrumentation and operate as a part of the automation system by
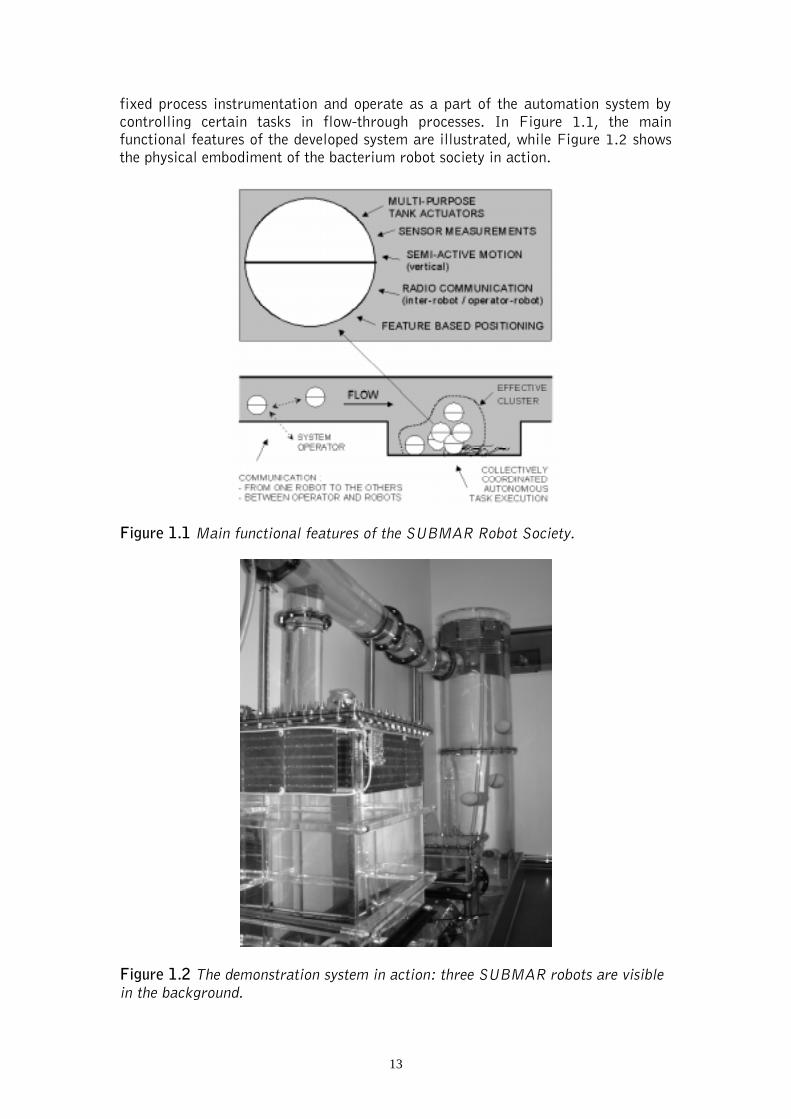
controlling certain tasks in flow-through processes. In Figure 1.1, the mainfunctional features of the developed system are illustrated, while Figure 1.2 shows
the physical embodiment of the bacterium robot society in action.
Figure 1.1 Main functional features of the SUBMAR Robot Society.
Figure 1.2 The demonstration system in action: three SUBMAR robots are visible
in the background.
14
1.2 Motivation and aims for the study
The motivation for the study behind this thesis was to research, develop, andanalyze the technology required for the novel breed of mobile underwater robotsalong with multi-robot studies in a new environment. In the mechatronics
development process of SUBMAR robot prototypes, new solutions were innovatedwhile characteristics from various types of robotic devices and intelligent
instrumentation were combined. However, the ultimate aim was to set up aprototype series of SUBMAR robots to enable practical multi-robot studies withRobot Society architecture in a 3D laboratory test environment. Research work for
this thesis has been carried out as a hands-on study to present a practicalengineering point of view on the subject.
Concerning the systems design and mechatronics design processes, the followingproblems and questions in particular have been addressed by means of a case study:
• What are the technological premises for a minimalist approach to create a
distributed robotic system in an underwater environment?
• How can simple robot units be turned into a system capable of coping with
complex missions and multi-tasking?
• How to implement the self-organizing and self-optimizing structures of these
robots?
• How to promote cooperation in simple interactions between robots?
• What mechanisms are needed in the communication structure?
• What factors affect the dynamics of the distributed multi-sensor perception and
robot consciousness?
1.3 Scientific contribution of the dissertation
The scientific contribution of this dissertation consists of the following themes:
• A novel mobile sensor/actuator robot -concept for the submerged use of various
liquid flow-through processes has been introduced. The mechatronics structureof minimalist and modular SUBMAR robot prototypes has been described in
detail including mechanics, electronics, and software solutions. Relatedtechnology and potential applications have also been surveyed.
• The concept of the Robot Society as a systems-level framework to control a
multi-robot mission has been formulated and presented from an application-
oriented engineering point of view.
• A great deal of attention was given to the practical implementation of the
complex system. As a result of this research work, the prototype system has

15
matured yielding ideas on how to combine robotics and the process industry in
automation systems monitoring liquid processes in 3D, in the future.
• The functioning of the unique SUBMAR society was analyzed with extensive
testing with the actual robots in a laboratory test environment. The
performance of the system was evaluated using a �search and destroy� �type oftask, where the robots performed against emulated dynamic targets. Thedevelopment of robot consciousness and the collective consciousness of the
whole society was also studied during the task execution. As far as is known,this has been the first distributed and cooperative multi-robot system
demonstration in a 3D-environment.
1.4 Outline of the dissertation
The chapters of this dissertation are organized as follows:
Chapter 1: Introduction. A short introduction to the research subjects of the thesis.
Chapter 2: Autonomous robotic systems and mobile instrumentation. Various robot
categories, multi-robot systems, and some novel approaches for mobile
instrumentation relevant to the scope of the thesis are reviewed.
Chapter 3: Applying the concept of the Robot Society. In this chapter, Robot
Society and its control architecture are discussed as an engineering concept. The
experimental platform, minimalist underwater robots, SUBMARs, are introduced.
Chapter 4: Mechatronics structure of SUBMAR robots. This chapter consists of a
detailed description and analysis of the mechanics, electronics, and softwaresolutions developed for SUBMAR robots.
Chapter 5: Experiments with the SUBMAR society. The test environment, task
definition, and results from the two experiment series to verify and analyze thefunctioning of the SUBMAR society are presented in this chapter. In the first series
of experiments, the searching and destroying of distributed dynamic targets weretested. The second series was performed to analyze the meaning of communicationin the development of robot consciousness during the mission.
Chapter 6: Technological considerations. The technological feasibility of various
enhancements for the SUBMAR-type of robot, as well as potential applications forsuch robots, are discussed in this chapter.
Chapter 7: Conclusions. Summary of the research and conclusions along with
suggestions for future work is presented in the last chapter.
1.5 Author�s contribution within the research group
The research work documented and presented in this thesis was carried out from1995-2000 in a dynamic research group. For a short period, this group had up to

16
seven members, although most of the time there have been just two or three persons
in the research group. The author�s main scientific contribution to the group hasbeen in the systems level design of the SUBMAR Robot Society, concerning, for
example, the communication systems design and the robots� task design.Furthermore, the author has been responsible for the robots� mechatronicsimplementation, including electronics, software, and mechanics design.
Robot Society control architecture and many high-level software features, such as
the environment mapping and navigation system, were mainly developed by Dr.Mika Vainio. His doctoral dissertation serves as a comprehensive documentation ofthose issues. Due to the tight connection between these two theses, [Vainio 1999]
is referred to frequently.
The test results presented in Experiment Series I (Section 5.3) were performedtogether with Dr. Vainio, while the results in Experiment Series II (Section 5.4)were performed solely by the author.

17
Chapter 2
Autonomous robotic systems and
mobile instrumentation
2.1 Introduction
This chapter outlines the research field concerning the concepts of the Robot
Society and the sensor/actuator robot. The background for both concepts is verycross-technical, multi-disciplinary, and versatile by nature.
The overview begins with a short review of the evolution and classification ofautonomous mobile robots. Certain specific types of robot are then discussed:underwater robots and in-pipe robotic vessels. This is followed by an introductionto reactive robot control and minimalist philosophy in robotics, which leads to theresearch of distributed cooperative multi-robot systems.
Along with the general development of microprocessors and embedded processingcapacity, wireless data communications systems, and sensor technology, differenttechnical devices and machines have become increasingly intelligent. This
development has allowed greater autonomy, spatial distribution, and mobility formany devices. As a result, the difference between robots and various types of
intelligent machines or devices is narrowing down continuously. A few examples ofthis development are reviewed as well.
2.2 Autonomous mobile robots
Autonomously operating mobile robots have fascinated people for decades. The
stereotypic concept of what the ultimate general purpose robot should do and looklike has changed relatively little from 1950s sci-fi films where, for example, the
famous anthropomorphic Robby the Robot obediently served his master,

18
Dr. Morbius, on the distant planet Altair IV (Forbidden Planet, MGM, 1956). It
has always been expected that a robot could move among people to serve us, orreplace man in difficult and dangerous environments. Despite continuously
increasing worldwide interest, developing technology, and extensive research workin the robotics field, the ultimate goal is still a long way ahead. See, for instance,[Rosheim 1994] for a nice presentation of the slow progress in the early evolution
of humanoid robots. On the other hand, it has been well understood that in order tobe useful, mobile robots do not necessarily have to have very complex structures or
share human-like forms. Despite this, truly autonomous mobile robots are stillquite a rare sight in industrial or other practical applications.
Since the 1980s, the processing capacity and the sensors needed to control anautonomously moving and navigating robot have become available in a reasonable
physical size, and at a relatively low cost. Stationary manipulator robots came ofage as a technology in the 80s and established an irrevocable position in industrialmanufacturing. As a result, the frontier of robotics research moved towards
Autonomous Mobile Robots (AMRs).
A huge number of different, although mainly wheel-based AMRs for variousapplications have been introduced in the last two decades. Proposed applications
range from indoor service robotics to distant planetary missions. The physical sizeof these robots may vary from heavy mining machinery to a micro-scale insectoid
type of robot. For a broad overview of the development of various types ofautonomous robotic vehicles in the 1990s, see, for example, the conference seriesof Intelligent Autonomous Vehicles, [IAV 1993], [IAV 1995], [IAV 1998], or
[ARS 1998]. All environments on land, in the air, and under the sea are included.However, flying robots are hard to find. Alternative solutions for wheel-based
motion, especially in walking and climbing technology, are well reviewed andclassified in [CLAWAR 1999] and [CLAWAR 2000].
Due to the wide spectrum of applications, clear and unambiguous classification ofmobile robots is very challenging. For instance, wheeled robots are usually divided
into categories depending on their physical size, whereas walking robots arenormally classified according to the number of their legs. In Figure 2.1, a roughcategorization of the existing types of mobile robot is suggested according to their
mode of mobility.
MOBILE ROBOTS
StationaryIndustrial Manipulator Robots
Walking Robots
Wheeled Robots
Underwater Robots
Robots using Alternative Motion Techniques
Flying /LevitatingRobots
AGVs Automated GuidedVehicles
Figure 2.1 Classification of mobile robots and the preceding main technologies.

19
2.2.1 Robots for an underwater environmentA generally used term for any diving robot is Underwater Robotic Vehicle (URV).These underwater robots can be truly Autonomous Underwater Vehicles (AUVs),
although the great majority of URVs are actually tethered Remote OperatedVehicles (ROVs), because of the limitations in underwater communication. This
type of robot is typically open framed, operated with multiple thrusters, andequipped with manipulator arms, cameras, sonars, and other sensors depending onthe level of autonomy of the robot. It is designed for the recovery of sunken ships or
wrecked aircraft, underwater construction or maintenance work, and otherapplications dangerous or impossible for human divers. For an overview of the
applied technology in URVs, see, for instance, [IROS/WS1 1998],[Whitcomb 2000], and [Yuh 2000].
Although terminology in this area is used relatively loosely, Unmanned UnderwaterVehicles (UUVs) mean usually larger, torpedo-shaped vessels, which are targeted
at autonomous long-range underwater cruising. Applications includeoceanographical studies, geodetical surveys of the sea bottom, submarine and minereconnaissance, etc. As examples of various UUVs, look at [Steer et al., 1993] and
[Scott and Hewish 1999].
2.2.2 In-pipe robotic vesselsAnother special application environment for mobile robots is the internal inspection
of various pipeline networks. The scope includes inspection and maintenance ofurban fresh- and waste water lines, as well as various gas and liquid pipelines inindustry and power plants. Traditionally, more or less passive cleaning devices for
pipelines have been called �pigs�, but nowadays this term is also used for moresophisticated in-pipe inspection robots.
A tight, tube-like operation environment usually requires wheeled or multi-leggedwalking locomotion, and a flexible body to advance into corners and junctions.
Most in-pipe vessels carry cameras, but ultrasonic or laser scanners are also widelyused for corrosion detection. For examples of various approaches, see
[Fujiwara et al., 1993], [Roβmann and Pfeiffer 1996], [Kawaguchi et al., 1997],
and [Moraleda et al., 1999].
Despite demand, relatively few robots are designed for submerged on-line operationin flow conditions inside pipelines. As the latest innovation in pigging technology to
respond to on-line requirements, contra-flow traction has been investigated. As isknown, turbines have the ability to pull an object against a fluid flow. Based on
this, promising demonstrations in autonomous contra-flow traction have beenreported [Cresswell 1999]. This would allow a revolutionary passive travelling withand against the flow in the pipelines.
2.2.3 Towards reactive control and minimalismIn the early phase of AMR evolution in the 1980s, in many mobile robot projects agreat deal of attention was given to the mere mechatronical development of acomplex mobile robotic platform, rather than addressing autonomous controlmechanisms or the practical application itself. Another key issue was the modelingof the unstructured operation environment. Typically, the control architectures ofthe early AMRs were complex and strongly hierarchical, derived from traditional
model-based AI research. The weak point was the lack of adaptability: unexpected,
20
non-modeled events could easily cause erroneous actions or even jam the whole
robot.
To cope with the dynamic, ever changing environment encountered by mobilerobots in real world, a revolutionary paradigm for the behavior-baseddecomposition of an autonomous robot, i.e., subsumption architecture, was
introduced as a light alternative for increasingly more complex hierarchicalarchitectures [Brooks 1986]. The idea was to decompose the traditional
hierarchical, sequential, and planning-based (Sense-Plan-Act) model of the robot�stask achieving behaviors into reactive, parallel running, but prioritized controllayers. The resulting subsumption architecture responds fast to sensor information,
and it leads to, or enables, either way, relatively simple control structures andhardware. These simplified ideas led to the boom of a new generation of
experimental robots. Typical representatives of these kind of robots could be calledbehavior-based robots or minimalist mobile robots.
A great deal of literature concerning these matters has been written. Mechatronics
design hints and practical hardware solutions for educational small-scale behavior-
based robots can be found from [McComb 1989]. Minimalist and modular robotic
structure supported by reactive control architecture is discussed in [Connell 1990].It has to be noted that minimalism does not necessarily refer to small physical size,although minimalist ideas are in many cases easier to put into practice as small-
sized. Another great mechatronics source book for a practical subsumption-approach for reactive robots is [Jones and Flynn 1993]. In this book, a detailed
analysis of computational hardware, sensors, mechanics, motors, the power system,and programming are surveyed with practical suggestions for implementation. In[Steels and Brooks 1995], background issues for the design and implementation of
autonomous robotic agents are widely discussed.
However, it is evident that complex tasks also need some high-level planning,meaning that very few real-world tasks can be successfully handled with purereactive control. Therefore, it seems that hybrid (deliberative/reactive) control
architectures provide the most feasible and reliable solutions for practicalapplications. The transition of paradigms in mobile robot control architectures is
reviewed comprehensively in [Arkin 1998] and [Vainio 1999].
2.3 Cooperative multi-robot systems
By the end of the 1980s, robotics researchers became aware of the potential and
possibilities in multi-robot systems. The challenging idea in these systems is not justto put a few robots to work in parallel in the same domain, but to achievecoordinated cooperation among the robots. Thus, in addition to lower level features
presupposed in autonomous robotic operation, some self-organization mechanismsand communication capabilities are required from the robots cooperating in a
group. Many terms are used in this context: robot colony, robot society, distributedautonomous robotic system, cellular robotics, collective robotics, or team of robots.Although the goal for these systems is ultimately the same, the definitions and
emphasis on different features vary.

21
For example, Distributed Autonomous Robotic Systems (DARS) are defined in a
general manner [Asama 1994]: �DARS are the systems which consist of multipleautonomous robotic agents into which required function is distributed. In order to
achieve given missions, the agents work cooperatively to operate and/or processtasks.� The concept of Robot Society, discussed in detail in Chapter 3., also fitswell to DARS classification. In any case, essential research issues for this field are
distributed, but collectively coordinated sensing, planning, and control, as well asself-organization, communication, and user interface.
A coherent view to the development of ideas and multi-robot systems realizationscan be obtained from the series of DARS -conferences, see [DARS 1992],
[DARS 1994], [DARS 1996], [DARS 1998], and [DARS 2000]. For practicalreasons, most of the multi-robot experiments have been carried out with wheeled
and relatively small-scale mobile robots, which are inexpensive to clone. Perhapsthe most well-known example of these small miniature robots is Khepera, for adetailed description, see [Mondada et al., 1994]. The operation environment for
this type of robots has usually been a maze or arena set in a laboratory. Because ofthe relatively similar mechanical and electrical design solutions in the robots used
for multi-robot experiments, the systems are best characterized according to theircontrol architectures. In most cases, a hybrid architecture has been implemented tocombine the best properties from both reactive and deliberative systems. See, for
example, [Cao et al., 1997] and [Vainio 1999] for a profound study of theproposed multi-robot control architectures.
Distributed autonomous robotic systems is a relatively fresh area in engineeringscience, although it is gaining increasing worldwide research interest. Therefore,
the theoretical foundation is still relatively undeveloped. Research work has beenvery experimental by nature with diverse approaches. There are no standard
procedures on how to deal with multiplicity and cooperation in a group of robots.How does it affect the hardware structure of the robots? Should the hardwaresupport the docking of robot bodies together? How should mutual communication
be arranged? The lack of established tradition in the design of multi-robot systemscomplicates the design and implementation of such systems. On the other hand, in
many cases, it has forced the introduction of new innovative solutions which mightnot have been discovered in other circumstances.
Furthermore, there exists no established formalism or method to systematicallydescribe the functioning and interaction of robots. Comparing the performance of
different control architectures is very difficult. In order to classify various DARSapproaches, [Asama 1994] suggests some viewpoints:
1. Top-down vs. Bottom-up approachIn the top-down approach, required tasks are divided and distributed into
multiple agents. In contrast, in the bottom-up approach, the available agentsare collected and organized.
2. Analytic vs. Synthetic approachIn the analytic approach, it is investigated what can be achieved if each agent is
equipped with certain mechanisms. Conversely, in the synthetic approach, inorder to achieve the requirements, it is investigated what kind of functions arerequired for each agent.

22
3. Homogenous vs. Heterogeneous systems
In homogeneous systems, every agent has the same attributes and performanceas the others. This is often the case in DARS studies. In contrast, each agent
can have individual characteristics in a heterogeneous system.
4. With vs. Without communication
If communication is assumed, it means the intentional exchange of information.Without communication, each agent should be provided with a mechanism to
infer cooperative behavior based on the information sensed. In some contexts,the latter means is called indirect communication.
5. With vs. Without centralized agentDecentralized systems have no centralized agent, while in centralized systems
the central agent can be either predetermined or determined according to thesituation. The centralized agent can be called master, leader, or coordinator.
6. High vs. Low information processing abilityThe level of the information processing ability depends on the assumption. For
example, a low information processing ability in each agent is assumed for lowlevel coordinated features, such as swarm intelligence, while high intelligence isassumed for dynamically reconfigurable robot systems.
7. Tight vs. Loose relation
Generally, if agents become more autonomous, the relations between agentsmay loosen. However, in tasks needing frequent communication orsynchronization between the agents, a tight dependence on the agents must be
assumed.
2.3.1 Interactions and communicationInteractions in cooperative multi-robot systems are mainly achieved by local inter-
robot communication. In some cases, indirect communication through environmentsensing can allow coordinated behavior without explicit communication betweenthe robot members. Because of its importance, communication issues concerning
multi-robot systems have been widely studied.
To mention a few examples of noteworthy studies on multi-robot communication,in [Fukuda and Ueyama 1994], communication protocols, estimation formulas forthe amount of communication in the system, formal representation for the
sensitivity of the total system, etc., have been presented for a complex CellularRobotic System (CEBOT) in general form. In [Balch and Arkin 1994], various
generic multi-agent tasks were evaluated with different communication modes as acomprehensive simulator study. The results can be used to determine appropriateparameter settings for communication in a reactive control system. As an
alternative way to promote local communication in a multi-robot system, anIntelligent Data Carrier (IDC) system based on tag-memories and read/write �
devices has been suggested, see [von Numers et al., 1995] and [Kurabayashi andAsama 2000].
Nevertheless, as with most subjects in a multi-robot domain, because of thediversity of choice, truly general guidelines are difficult to find. Proposed solutions
operate well in their original environment, but always require tuning andadaptation to new conditions. Good examples of such parameters are the

23
communication range, i.e., the longest distance at which robots can receive
messages from each other, and the acceptable delay related to the information ofthe messages.
2.3.2 Simulated multi-robot behaviorDue to the mechanical complexity and extensive mundane work needed inexperimental set-ups for systematic research in a multi-robot field, a large numberof simulation studies are reported. Simulations provide a useful tool to develop and
test ideas, but it is vital that the simulator results can be verified with real robotsas well. Unfortunately, many sophisticated computational ideas have not found
their way into the real embodied robots. Perhaps the best insight into thecomputational developments in a simulator domain can be obtained from theSimulation of Adaptive Behavior -conference series, see [SAB 1990],
[SAB 1992], [SAB 1994], and [SAB 1996]. A wide range of valuable backgroundmatters valid in DARS are analyzed in these issues. Ethology, biology, psychology,
artificial life, machine learning, and constraints set by robotics form themechanisms that allow artificial animals (animats) to adapt and survive in adynamic environment.
2.4 Intelligent and mobile instrumentation
The current technological megatrend drives towards smaller, lighter, decentralized,application-tailored, more intelligent and independent, but wirelessly networked
products and devices. This trend applies to instrumentation apparatuses as well,including sensors, measurement devices, data acquisition systems, and actuators.However, the sufficiently long-lasting energy supply remains consistently the
biggest limitation to most stand-alone devices. Passive mobility, miniaturized size,and wireless data transfer provide opportunities for energy saving. As examples of
recent development in the field of intelligent instrumentation, some novel passivelymobile sensor systems are considered:
Case 1. Mobile dataloggers are used to record and file sensory inputs, which can beextracted from the logger�s memory and analyzed off-line. Sometimes, dataloggersare called �micro-sniffers� or just �sniffers�. Small-sized loggers can be attachedor hidden in shipments or vehicles to validate transportation. Typical quantitiesmeasured are temperature, humidity, or selective detection of certain gases. The
operation time can extend from months up to few years, depending on the sensorsand sampling rate. For example, [Järvelä et al., 1998] reports a novel product
where micromachined three-axis accelerometers are used to detect carelesshandling of goods during transportation. Recorded shocks, vibrations, temperature,and time can be analyzed afterwards.
Case 2. The dropsonde system for weather forecasting and hurricane research is an
example of a disposable short life-time mobile sensor. Dropsondes are ejected froma high-flying aircraft. During the dropsonde�s descent to the ocean, air pressure,temperature, and relative humidity are measured on-line. Precision GPS is used for
tracking the exact location and trajectory, which also allows the calculation ofwind conditions. All data are radioed back to the airplane and then sent further to
a weather forecasting computer model via satellite connection. See [Vaisala 1999]for further details.

24
Case 3. There has been a lot of discussion on wearable or body integrated sensors
and computers for healthcare automation and telemedicine. To assist in individualhealth care, [Yang and Rhee 2000] proposes a monitoring system in a finger
wearable ring configuration. The sensor ring is equipped with optoelectriccomponents that allow the continuous long-term monitoring of the patient�sarterial blood volume waveforms and blood oxygen saturation non-invasively.
These signals are transmitted to a home computer for further analysis of thepatient�s cardiovascular condition.
Case 4. Another medical examination instrument is a wireless capsule formeasuring gastrointestinal physiological parameters. In [Iddan et al. 2000], a new
type of video-telemetry capsule endoscope has been introduced. The capsule issmall enough to be swallowed (11x30 mm) and has no external wires. It is
propelled by peristalsis through the gastrointestinal tract without need foradditional propulsion. The video images are transmitted using UHF-band radio-telemetry to antennas taped onto the body allowing image capture; video
transmission is stored on a portable recorder. Lighting comes from an onboardwhite-light LED. The strength of the video signal is used to calculate the position
of the capsule in the body. High-quality video transmission from the capsule can bemaintained altogether up to six hours. The patient need not be confined to ahospital environment during the examination; no discomfort was reported from the
first tests of the system on human volunteers.

25
Chapter 3
Applying the concept of
the Robot Society
3.1 The Robot Society as an engineering concept
Robot society is a generic technical concept to control and describe a group ofautonomous mobile robots operating together towards a common goal. The concept
of the Robot Society (RS) has been introduced originally in [Halme et al., 1993].Adapted from this paper, RS was loosely defined as follows:
�The Robot Society is a group of individuals, called members, with informationand control structures. All members of a society need not be similar. Members
having the same properties can form clusters or classes. The control structuredefines how information is spread within the members, and how an individual
member communicates with the other members of the society. The controlstructure defines the way the society affects its members. Because all workingpower is produced by the members, the control structure takes care of the taskexecution of the society.�
�and the definition was continued by some practical considerations:
�The ultimate practical goal of the Robot Society concept is to construct a kind of
"distributed robot", which can execute tasks which are defined by the user or"society controller", like in the case of a conventional individual robot. This means
that the behavior of the society must be controllable outside, and the society musthave an information connection to the controller. � Basically, communication in asociety is performed on member-to-member bases.�
Since this early conceptual definition, the experimental development process of
SUBMAR robots has given an explicit and practically verified content to the RobotSociety control architecture and communication structure. Progress and the

26
evolving of ideas during the architecture development has been reported, for
example, in [Halme et al., 1996], [Vainio et al., 1997] and [Vainio et al., 1998b].Despite the unconventional robotic embodiment and underwater target
environment, the developed RS architecture is kept generic by nature, and can beapplied to various purposes and environments. In [Vainio et al., 2000b] and[Vainio et al., 2000c] an overview of the main elements of RS architecture and a
system level description of the application are presented.
The hierarchical three-layer RS control architecture consists of both reactive anddeliberative components. Mutual communication is a key factor for the operationof the society. It can be divided into two categories: communication between the
operator and robots, and communication among the robots (inter-robotcommunication). In Section 4.4 the model of the architecture and its practical
implementation are presented.
Several control architectures suitable for controlling a distributed multi-robot
system have been introduced, as reviewed extensively in [Vainio 1999]. From thecontrol architectures found, ALLIANCE [Parker 1994] seemed to have the most
similarities with the Robot Society. From the engineering point of view, aminimalist approach is especially supported by the RS. It means that the emphasishas been in developing maximally simplified, but still effective, easy-to-implement
mechanisms for each robot to create autonomously organized functioning anddynamic interactions between the robots for the cooperative behavior to complete
the desired tasks. If intelligence is assumed to derive from combining information,then, intelligent behavior can be expected from the system. Achieved high-levelfeatures, like dynamic reconfiguration of the society, belong to this category.
The performance of the society can be evaluated in many ways, for example, by
considering qualitative mission achievement, the duration of the mission, orsurvival of the robots. Several parameters affect these characters. By altering theweight of these parameters, the operator has the ability to tune the society into a
preferred operation mode. For instance, in some missions the accomplishment ofthe task is of the utmost importance, meaning that the loss of some robots is
tolerable.
3.1.1 Advantage of multiplicityMulti-robot systems in general, as well as Robot Societies, support parallelexecution by nature. Therefore, they can be easily applied to such tasks asdistributed perception, collection or the spreading of some physical material,sorting or separation etc. At a practical level, for example, the collection ofnodules from sea beds, locating and cleaning toxic material in a hazardousenvironment, or planetary missions are suggested.
The technical advantages of a homogeneous Robot Society are clear:
1. The level of redundancy is very high in a society having a large number of
similar members, which yields fault tolerance on a system level. It does notmatter if some of the members break down, as the rest will be able to completethe original mission, although delayed.
2. The volume of the society, i.e. its operational efficiency, can be adjusted simply
by increasing or decreasing the number of robot members. Flexibility is easy to

27
achieve in an open and completely decentralized system, which does not need
any reconfiguration on a systems level.
3. Collective use of several robots enables relatively simple structures for a singlerobot member in many cases. Complex structures to ensure optimal functioningin all circumstances can be replaced by statistical assurance in a large society.Simplicity produces cost-effective solutions prepared for mass production.
4. In an optimal setup, once the structure for inter-robot communication is welltuned for the given task, the effect of collective functioning can be greater thanthe effect produced by the same number of members operating just in parallel.
Literally, 1+1 may equal more than 2.
An increase in the number of robot members in the society improves theperformance, but only up to a certain limit. If the optimal size of the society for agiven task in a given environment is exceeded, the overall performance will begin to
decline. This is due to the competition for space or other resources, like a physical�traffic jam� of the robots in a tight space or communication system overloading
situation.
3.1.2 Collective consciousnessConsciousness is generally understood as a fusion of the individual�s experiences ata certain time, including sensations, thoughts, imaginations, memories, etc. In
non-human contexts, the term animal consciousness is used by cognitive ethologists[Allen and Bekoff 1997] to mean the ability of organisms to perceive (and in this
sense be conscious or aware of) selected features of their environments.
As applied in the robotics world, without going into traditional AI subjects in a
deeper sense, the term robot consciousness seems justified to mean the conceptionor assumption of a single robot from the state of its operation environment and
task execution, as well as the robot�s internal state and mode. Robot awareness,used for example in [Parker 1994], is a synonym for robot consciousness. With aRobot Society, robot consciousness evolves based on the possible a priori
information it is given, the robot�s own measurements, and information gainedthrough communication. Consciousness is always a subjective experience, but in the
case of robots, an external system observer can find it right or wrong. Summarizedestimation of the robots� conception could respectively be called the collectiveconsciousness of the Robot Society. Thus, monitoring the development of collective
consciousness allows the system operator to obtain a general insight into thedistributed robots� achievements. If information from other sources than the robots
is also available, then the performance of the society can be easily evaluated. Thistype of testing has been documented in Section 5.4.
The fusion and combination of information from the robot�s own sensors and fromthe distributed society through mutual communication is an essential issue in
forming valid consciousness for the robot. Coherent collective consciousness isimportant for the robots� effective and coordinated operation. Basically, thevalidity and dynamics of robot consciousness derive from several factors:
1. Primary accuracy, resolution, repeatability, dynamics, etc., of the sensors used
for perception2. Sampling frequency (i.e., Shannon�s theorem, [Shannon 1948])

28
3. Statistical and spatial reliability of the sampling
4. Throughput and coverage of the inter-robot communication network5. Processing and fusion of measurement information from various sources in
function of time (e.g., handling delayed information)6. Number of robot members7. Possible a priori information
3.2 Minimalist underwater robots as a case study
In the process industry the question of monitoring the internal state of the process
in real-time, and performing local adjustments to reaction conditions are majorproblems. Normally the sensors used in monitoring are fixed and provide
information only from certain parts of the process. Local adjustments are oftendifficult to implement, if not totally impossible. Overall control of the system doesnot allow local fine-tuning, which could offer considerable savings in materials and
improvements in production quality.
In order to help the process operator with this problem, by allowing the sensors and
actuators mobility inside a process environment, a robotized submerged platformto carry instrumentation was invented and developed. Certain features have beenadapted and combined in a unique way from various types of systems: autonomous
underwater robots, in-pipe robotic vessels, conventional wheeled multi-robotinstallations, and novel mobile instruments. As a result of this synthesis, the design
of SUBMAR robots has evolved. The idea was to follow the minimalist approach,where the structure of the robot is maximally simplified. As a solution tocompensate the obvious limitations derived from minimalism, multiplicity and
cooperation of the robots were desired. Robot Society architecture wasimplemented into SUBMAR robots to verify its functioning.
The SUBMAR society consists of small-sized ball-shaped robots, which have adiameter of approximately 11 cm (see Figure 3.1). The robots are equipped with a
micro-controller CPU, several sensors, tank actuators, and a short range radio forcommunication. Energy is carried in a battery pack. The mechatronics structure of
SUBMAR robots is presented in detail in Chapter 4.
Figure 3.1 SUBMAR, minimalist underwater mobile robot.

29
SUBMAR robots feature a so-called semi-active motion system, i.e. they are
capable to active vertical motion only by controlling their specific weight,otherwise, they move passively along a liquid flow. Due to the fact that motion
energy is taken mainly from the process flow, the consumption of energy remainssmall resulting in long operation times, in practice several hours. Naturally, thiskind of relatively stochastic motion system doesn�t ensure access everywhere within
the process, but in many cases it allows the robot to pass through the differentparts of the process. Highly underactuated robots are prone to collisions,
turbulence, and non-homogeneous flow profiles, benefitting that the trajectories forseveral robots are never uniform.
As is the case in many (multi-)robot related research issues, inspiration comespartly from nature. During millions of years of biological evolution animal species
have gained astonishingly robust mechanisms and structures for locomotion,sensing, communication, interaction, and cooperation (see for example[McFarland and Bösser 1993]). Also, the Robot Society concept is influenced by
features found from simple social animals, like ants and bees. Rather simple-looking features and local interactions that produce highly complex and effective
global behaviors in insect colonies have been especially desired.
If biomimetic thinking is extended to the physical appearance of the robots,
considering the Robot Society concept in context with SUBMAR robots, thinkingcan lead to the world of bacteria. Research in the field of microbiology has shown
that even though an individual bacterium is a free-living autonomous organism,they can form complex communities, communicate with one another, and hunt prey
in clustered groups [Shapiro 1988], [Shapiro 1995]. The analogy to bacteria is
obvious, thus SUBMAR society can also be called bacterium robot society (seeFigure 3.2). Bacteria are more than just simple unicellular microbial mass. These
functional features are also sought after for SUBMAR robots, although theirphysical size is thousands of times bigger.
Figure 3.2 An agglomerate of four robots in the surface of the tank executing a
coordinated task; one individual (seen in the bottom) has left the group.

30
The functioning of the system has been verified and analyzed with extensive testing,
as presented in Chapter 5. To summarize the Robot Society approach as realizedwithin SUBMAR robots, according to the seven attributes listed in Section 2.3, the
system can be characterized as:
1. Having a top-down approach, since organization of robots is dynamic and the
robots are capable of parallel multi-tasking.2. The approach is analytic, as how a society having certain features can cope
with a predefined task, rather than optimizing the features for that particulartask, has been analyzed.
3. SUBMAR Society is homogeneous, where all robots are alike.
4. All the members are equipped with equal direct communication properties.5. The functioning is completely decentralized.
6. Due to structures that allow dynamic reconfiguration and self-optimization, thesociety�s behavior can be classified as highly intelligent.
7. The relations between members are event-based, not frequent, therefore the
society can be assumed to have loose relations.

31
Chapter 4
Mechatronics structure of
SUBMAR robots
4.1 Introduction
SUBMAR robots have been designed and developed as minimalist autonomous
underwater robots for Robot Society studies in a laboratory environment. However,the structure of the robots has not been optimized for any particular environment,but the goal has rather been to verify the potential and limitations of a Robot
Society system achieved by following the minimalist approach in robotic members.The mechatronics development process of SUBMAR robots took place in threeprototype stages, called Proto I, Proto II, and Proto III, respectively. The latest,third generation design is presented in detail in this chapter. Note that throughoutthis thesis, the term �SUBMAR robot� refers to Proto III design, unless otherwise
mentioned. Before going into the detailed analysis, the main features of thepreceding generations are briefly introduced here.
The first SUBMAR, Proto I, was designed to test basic functions and featuresneeded in this type of robot. Inmos Transputer module T222 was used as a CPU to
enable rapid prototyping based on the known components derived from a previousrobotic project. However, it was known already at the start that this processor
would only be a temporary solution for preliminary studies. Design principles of thefirst SUBMAR prototype and some early ideas for the next generation were
documented in [Appelqvist 1996]. The physical outer dimensions of the robots, i.e.
the diameter of 10.8 cm, has remained the same in all prototype generations.
The main goal for the second generation, SUBMAR Proto II, was to put up theappropriate microcontroller hardware and develop basic software. Two copies of
Proto II were constructed. The feature based environment mapping and positioningsystem was developed with these robots. Various sensors and communication

32
methods were tested, see Chapter 6 and [Vainio et al., 1996] for more detailed
information on these attempts.
SUBMAR Proto III, the latest generation design, includes all the functionalfeatures needed in an autonomous robot operating as a member of a society.A small series of ten robots were produced to form a demonstration society and an
experimental testbed for laboratory environment. Progress in Proto IIImechatronics development has been reported in [Appelqvist et al., 1997] and
[Appelqvist et al., 1998]. The whole SUBMAR society is pictured in Figure 4.1.
Figure 4.1 The SUBMAR society in a family portrait.
4.2 Mechanics
4.2.1 CasingBall-shaped casing forms a mechanically durable frame for a SUBMAR robot. Therounded form is practical, since the structure facilitates pressure resistance anddoes not get easily jammed in tubes, tanks, and so on. In addition to pressureresistance, the ball casing provides good shock and collision resistantcharacteristics as well. In industrial applications, other requirements would include
extensive thermal and chemical resistance.
The casing is made of PA6 nylon. The outer diameter is 10.8 cm, having a wall-thickness of 0.6 cm. Parts are machined from bulk plastics, which makes it veryexpensive to manufacture; a larger series would require an injection moulding
technique. The casing halves are closed with a thread of two and a half rounds,O-ring sealing, and sealant grease. Different sensors and actuators are attached
through the casing wall and ensured with thread when possible. Lead-ins are gluedand sealed from outside ensuring high pressure resistance. This construction hasbeen tested up to at least 150 kPa in a pressure chamber as well as in practice
during sea trials. Preliminary endurance testing also included boiling of the robot

33
in a kettle; the robot survived operational and kept transmitting temperature data
for hours with high temperature specified batteries in a temperature of 80 °C.
However, in boiling water, the inner temperature rises, exceeding the limit and
non-insulated batteries will lose their charge in a quarter of an hour.
Because of the internally located radio antenna, the casing had to beelectromagnetically transparent. Otherwise, a metal cover or metal coating wouldbe the easiest way to isolate the electronics from interference and
electromagnetical noise. An antenna could be integrated into the casing, orinstalled as a flexible tail.
Although the ball-shaped form is clearly advantageous, effective utilization of thespace inside can be problematic. The space, with an inner diameter of 9.6 cm,
should be sufficient for all the electronics, sensors, actuators, batteries, etc. For ahigh-density integrated product where special solutions and components can be
used the packing is not difficult, but for an experimental series of ten robots with avery limited budget the lack of space turns into a real challenge.
As a solution, the two tank-actuators are fixed to stand in the middle of the casing,so that the electronics unit can be positioned firmly around these tanks. Dual-row
board-to-board interconnectors between the electronics modules have an importantrole in the construction, and no other supporting structures for the modules areneeded. See Figure 4.2, where the schematic lay-out of a SUBMAR robot is
illustrated in section.
PLASTICCASING ELECTRONICS
MODULES:- MOTOR DRIVERS- INFRARED UNIT- SENSOR AMPLIFIERS
ELECTRONICSMODULES:- CPU & MEMORY- POWER UNIT- RADIO COMMUNICATION
EXTERNALTEMPERATURESENSOR
TANK ACTUATOR II
BATTERIES
LEADBALLAST
TANK ACTUATOR I
PISTON
PRESSURESENSOR
PISTON-ROD
WORM ANDSEALING
GEARBOX
DC MOTOR
IR RECEIVER
INTERNALTEMPERATURESENSOR
ANTENNA
IR TRANSMITTER
Figure 4.2 Cross-section of a SUBMAR Proto III robot.
Depending on the size of the battery packs used, they can be positioned in the robot
in different ways, naturally affecting the robot�s center of gravity and the weightneeded in additional ballast. If the batteries are positioned below the electronicsunit, then all the heavy components, including the pistons of the tank-actuators and
additional ballast are placed as a keel to lower the center of gravity.

34
As a result, the robot�s vertical orientation keeps relatively stabile, which is
important for certain sensors. Unfortunately, with maximal battery capacity thiswas not possible to arrange. In Figure 4.3 a SUBMAR robot is shown with casing
opened, and in Figure 4.4 the parts have been removed from the casing anddisconnected.
Figure 4.3 SUBMAR Proto III cover opened.
Figure 4.4 SUBMAR electronics unit, casing, and battery packs.
4.2.2 Tank-actuatorsBecause of the uncontrolled orientation of the robot body, traditional gripper-likeactuators or most other types of mechanical actuators are useless. Instead,SUBMAR is equipped with two multi-purpose tank-actuators.
The tank-actuator consists of a driving motor, gearbox, screw-like piston-rod,sealed stainless steel piston, and a plastic chamber. The motor-gear combinationused is a Maxon 0.5 W DC-motor united with a 200:1 reduction gearbox. This

35
provides enough torque against high outer pressure with moderate power
consumption. At a two meter depth, 0.13 W was measured for outward pistonactuation. Sealing for the piston is adopted from an automotive brake cylinder.
This type of V-profiled sealing-ring has very low slide friction against the chamberwall. The design of the tank-actuator has been illustrated in Figure 4.2; it is alsoshown in Figure 4.4.
This type of actuator can be basically used as a:
(1) Diving tank, to change the specific weight of the robot body by taking upsurrounding liquid into the cylinder or vice versa. This allows the robot toperform vertical motion or balance its weight equal to the surrounding liquid.
(2) Carrier tank, to transport and spread a small dose of a chemical substance, forexample, a reagent catalyst. The substance can be released at a certain
location or once certain conditions are detected in the process.(3) Sample extractor, to store a sample taken from the process from a certain
location.
In the case of SUBMARs, the first two functions are verified. The diving tank
function is used for moving and navigation, while the �carry and release� -task canbe demonstrated with some colored marker substance, as in Figure 4.5. Thechemical used was KMnO
4, which is not only a highly visual color in water, but in
fact, also poisonous to algae. In practice, the two latter functions would probablyrequire a controllable valve in the tank outlet.
Figure 4.5 A single Robot Society member demonstrating the carrier tank
function. The upper left picture shows how the robot has detected the target areaand lands on the bottom. In the next figure it starts to output a chemical substance.Below left, the robot spreads the substance at maximum speed, while in the lastpicture the robot has already left the tank and the chemical slowly disperses.

36
Compared to the total volume of the robot body, which is approximately 650 ml,
the volume of each tank-actuator, 4 ml, is very small. For this reason, the specificweight of the robot has to be initially set with an additional ballast relatively close
to the surrounding liquid. On the other hand, when the tank is used as a sampleextractor for an off-line analysis device, even 1 ml would be enough to serve aspectral analysator.
There are also other ways of adjusting the buoyancy than the presented tank-
actuator construction. As an alternative means, a compressed gas system could beused to empty the ballast tank. However, this solution was abandoned due to theadditional mechanical complexity.
4.3 Electronics
The main aims for the hardware design of SUBMARs have been a simple, compact,and modular structure. Furthermore, low power consumption, and reliable design
in terms of EMC characteristics have been desired. SUBMAR hardware is foundedupon an effective 16-bit microcontroller CPU, as shown in the electronics blockdiagram in Figure 4.6.
CONDUCTIVITYSENSOR(OPTIONAL)
TILT SENSOR(OPTIONAL)
INFRAREDRECEIVERS
INTERNALTEMPERATURESENSOR
EXTERNALTEMPERATURESENSOR
SIGNALAMPLIFIER
SIGNALAMPLIFIER
SIGNALAMPLIFIER
SIGNALAMPLIFIER
SIGNALAMPLIFIER
RESETLOGIC
PRESSURESENSOR
INFRAREDTRANSMITTERS
DRIVERCIRCUIT
TANK ACTUATOR I CURRENTMONITORING
CURRENTMONITORING
H-BRIDGEDRIVER
H-BRIDGEDRIVER
TANK ACTUATOR II
FLASHROM128 kB
STATICRAM128 kB
PROGRAM CODEDOWNLOADING
HALF-DUPLEXRADIO MODEM
INTERFACELOGIC
INTERFACELOGIC
BATTERY PACK3.6V NiMH
VOLTAGEMONITORING
STEP-UPPOWERCONVERTER,5V SUPPLY
SERIALI/O
PARALLELI/O
A/DCONVERT.
UTILITIES
ADDRESS &DATA BUS
CPU80C166
BACK-UPBATTERY
MEMORYDECODER
CR. OSC.32 MHz
Figure 4.6 Electronics block diagram.

37
4.3.1 Hardware modulesPhysically, the electronics unit is divided into six small separate modules:
(1) CPU module(2) Power module
(3) Amplifier module(4) Motor control module(5) Communication module
(6) Infrared module
These modules are pictured disconnected in Figure 4.7. When connected together,these cards form a rigid structure which is inserted around the tank-actuators intothe casing. Surface mounted components are installed on both sides of the circuit
boards in each module to save space, except in the Infrared module, wheretraditionally mounted components are applied. In addition to these modules, the
actual sensor elements attached to the casing (see Section 4.3.2) and two batterypacks belong to the electrical hardware.
Figure 4.7 Electronics modules disconnected.
(1) CPU module consists mainly of the processor and memory circuits. Theprocessor is a 16-bit Siemens 80C166 microcontroller. Instead of a maximal
40 MHz, this CPU is operated at a 32 MHz clock frequency as a compromisebetween power consumption and computational speed. However, even with slightly
reduced speed, the CPU is still more than capable of handling its loading.
A total memory space of 256 kBytes supported by the CPU is available. Therefore,
an 18-bit wide address bus is used, while a data bus is multiplexed to 8-bits wide.Most of the memory circuits are located in the CPU module; 128 Kb of FlashEEPROM for the program code, and 64 Kb of SRAM for the processor RAM anddata storage. I/O-functions, A/D-converters, and serial communication channels areprovided straight from the microcontroller, which enables compact design with few
external components.
(2) Power module provides a 5 V supply voltage for all the components. The inputvoltage range (2.8�4.5 V) for this DC-DC step-up converter is configured for3.6 V battery voltage. Therefore, a battery pack has three NiMH cells in series,
since the nominal voltage for each cell is 1.2 V. The remaining unoccupied space in

38
the casing allows the fitting of two parallel sets of triple AAU-size battery packs,
giving a total capacity of 2.7 Ah at 3.6 V. Operating with normal processorloading, basic sensors, actuators, and communication in modest use, the average
power consumption for a SUBMAR is approximately 1.5 W, which allows up to 6-7 hours of operation. However, depending on the nature of the task and utilizationof the actuators, the power consumption can be considerably higher.
Apart from the power supply unit, there is also an array of seven small indicator
LEDs connected to the I/O of the microcontroller. They can be used to give variousstatus signals on the robot�s setup to the user, but they are also extremely valuablewhile developing and debugging embedded software. Furthermore, an additional
64 Kb of SRAM for data storage is fitted into this module.
(3) Amplifier module has the required analog circuits for signal amplification andconditioning for each sensor output. The absolute type of pressure sensor for depthsensing, internal and external temperature sensors, as well as a conductivity sensor
are included. Excluding the internal temperature sensor, other actual sensorelements are naturally mounted as lead-ins in the SUBMAR casing.
(4) Motor driver module consists of small on/off �style MOSFET H-bridge driversfor each of the motors of the tank-actuators. They are monitored by current
sensitive detector circuits, which can be used as simple limit switches for pistonmovement. The motor current, and therefore voltage loss over a very small series
resistor, rises rapidly once either end of the cylinders is reached. This signal is usedas an interrupt source for the CPU to halt motor driving quickly. This is anespecially important feature if the motors are driven with feedback from pressure,
i.e. in depth control, when large overshoots in the piston position are inevitable dueto slow control dynamics. Otherwise, the tank-actuator pistons are driven only with
respect to time.
In the motor driver module, there are also two DIP-switches, which can be used to
select different software configurations, and an optional tilt sensor with reset logicfor navigational purposes.
(5) Communication module utilizes Radiometrix�s BIM-433-F half-duplex UHF
radio transceiver with a simple λ/4 wire antenna. With this miniature RF modem,
transmitting and receiving serial data in ASCII format is supported with a9600 Baud. The transmit frequency is 433 MHz. Only one additional logic
component is needed to connect the radio to the TTL-level serial port of themicrocontroller.
Low transmission power of 10 mW is enough to guarantee communicationdistances over 120 meters in open space in the air, and typically 30 metres inside
buildings. Surprisingly, even a radio frequency as high as 433 MHz proved toprovide reliable, power effective, and easy-to-apply connections to both the
operator interface and robot-to-robot communication in laboratory experiments infresh water. Under these conditions, the maximum underwater communicationrange is limited approximately to 1.5 meters in optimal antenna polarization. Thissupports well the desired local communication abilities for SUBMAR Societystudies. It is only appropriate that not all robots are accessible at once. However,
for conductive liquids, like sea water, the communication range drops to zero. It

39
goes without saying that the carrier frequency of the transmission is far too high to
be useful in any real world application in submerged use.
(6) Infrared module belongs to the context of the emulated biomass growth system,explained in Section 5.1.2. In this module, there is just a simple FET driver for IRLEDs and a two-stage signal amplifier for IR phototransistors. A description of the
IR components selected is in Section 4.3.3. Basically, by connecting this module tothe serial port of the CPU, IR light could also be used for local communication in
clear liquids. This type of dual-purpose IR based sensor/communication system forwheeled multi-robot experiments has been described in [Suzuki et al., 1995].
When connected together these modules form a compact and rigid structure, asillustrated in Figure 4.8. Once placed around the tank units in the casing, three
connectors are used to attach the wiring from the casing mounted sensors to theelectronics unit. A detailed schematic layout of the electronics of each module andsensor connections are presented in Appendices A-F.
Figure 4.8 Assembly of the electronics unit.
4.3.2 SensorsFor depth monitoring, SUBMAR is equipped with Siemens KPY 42A siliconpiezoresistive absolute pressure sensor. An absolute type of sensor has to be used,since the inside pressure of the casing varies depending on the position of tank-actuator pistons. The pressure range for this version is up to 60 kPa, which equals6 meters depth in water. Large deviations in bridge resistance occurring in a series
of this type of sensors make an accurate calibration process complicated, since thesmall-sized wide-range potentiometers needed for amplifier gain tuning are
relatively inaccurate. As a result, in addition to the hardware calibration to getcomparable absolute depth measurements, the pressure sensor is also softwarecalibrated during an initial calibration dive before operation.
As an external temperature sensor, the Analog Device�s AD 590KH is used. To
correct the effect of heat generation from the electronics unit, another sensor is

40
installed to monitor the internal temperature in the casing. The AD 590JH type is
being used for this purpose.
There are very few small-sized conductivity sensors available on the market, thus, asuitable conductivity sensor for liquids was simply constructed from two isolatedelectrodes. To prevent gas generation and fast electrode corrosion, an AC signal
has to be applied to the electrodes. Although the actual gold-plated electrodes wereinstalled only into a single casing for testing purposes, the oscillator and amplifier
circuits needed in conductivity measurements were included in each robot�selectronics for possible future needs.
4.3.3 Emulated instrumentationThe infrared light sources installed into the robot�s casing could be understood as
actuators in this context. IR light is used to emulate chemical substancepropagation from the robots in the emulated biomass growth system developed for
the task execution experiments (see Section 5.1.2 for details).
For that purpose, there are three Siemens SFH487P -types of IR LEDs mounted to
the robot casing. Once installed on a horizontal plane pointing in oppositedirections, just three of these LEDs connected in series provide a sufficient
transmission pattern covering a relatively wide radial sector. These LEDs have ahalf-angle of +/- 65 degrees, which, as a drawback, results in relatively low emittedIR intensity. The peak emission wavelength at 880 nm corresponds to the
respective IR phototransistors found in the emulated biomass panels.
Infrared light detectors in the robots emulate a sensor for dissolved gas whichoriginated from the artificial biomass growth. In the same omnidirectionalconfiguration, next to the IR LEDs, there are three parallel Siemens
SFH 309 PFA infrared phototransistors installed into the casing. Thesephototransistors feature a very wide half-angle of +/- 75 degrees and the same
880 nm peak wavelength for detection.
4.4 Software
All the features needed for autonomous and cooperative functioning, as well asavailable a priori information related to task execution are included in the
embedded software running in the robot�s microcontroller CPU. General reliabilityand robustness against unexpected events in the environment are the most
important aims and challenges in mobile robot software design.
The software for SUBMAR robots which enables basic functional features and
execution of the tasks described in Section 5.2 consists of some 6600 lines ofrelatively loose-written C source code. Once compiled, assembled, linked, located,
formatted to an Intel Hex -format, and downloaded into the robot�s Flash memory,the program occupies about 105 kBytes. As a software development environment,the C166 Compiler Package V5.0r5 by BSO-Tasking and SFD V2.0 debugger byRTDS have been used.
The functioning of the robots is partly stochastic by nature due to theunderactuated motion capabilities and relatively inaccurate areal positioning

41
system. Therefore, there is no need for a very high speed control or sensor
sampling. The program cycle containing sampling of the sensor inputs and updatingthe state of the whole control structure is executed only once per second.
Depending on the length of the program path and required amount of computing ateach time, it takes 70 - 80 ms for the CPU to update the state of the controlstructure with the given tasks. The faster frequent interrupt configured for 100 ms
cycle time is used mainly for motor control. With this loading the chosen 16-bitprocessor is obviously unnecessarily powerful. A lot of computational resources
remain unused for future needs and software experiments. On the other hand, morefrequent communication and/or increase in the number of robots in the society cancause considerable additional loading for the CPU.
4.4.1 Control architectureThe control architecture defines and outlines not only the functioning of a singleautonomous robot, but also the collective operation of the whole society. In the
case of the Robot Society, the functioning is represented with a hierarchical, three-layer control architecture (see Figure 4.9). The behavioral, task, and cooperativelayers of the RS architecture consist of reactive features for fast response to the
signals from the dynamic environment at a low level, as well as deliberative,tactical and strategic models for operation at higher levels. Therefore, SUBMAR
society can be said to have a so-called hybrid architecture. Development and earlierversions of the RS architecture are presented in [Vainio et al., 1998a],[Vainio et al., 1998b], and [Vainio et al., 2000a]. A profound presentation of the
architecture, analyzed in a more generic form, can be found in [Vainio 1999].
In the following, the functions of the three control layers are discussed. From thepoint of software implementation, at first, the desired tasks need to be decomposedinto subtasks, and their mutual relations have to be analyzed and structured. Then
the model of the control architecture serves also as a tool to outline the desiredfunctioning of the whole society, which should help in the practical program
coding. In an embedded, interrupt based, pseudo-parallel program code the controlstructure itself is difficult to pinpoint. It has to be understood rather as a part ofthe program structure, than some specific part of the program. After all, the
complex-looking multi-tasking behavior of the society is achieved by combiningsimple conditional rules whose priorities are well defined.
4.4.1.1 Behavioral layerThe behavioral layer manages the lowest level behaviors of the robot functioning as
an interface between the robot and the environment. This is done by continuouslymonitoring the sensor inputs and internal resources, as well as the received
communication from the other robots or the operator. Information and data fromthese various input sources is fed to a Finite State Automata (FSA), whichdetermines the respective state for the robot. For the experiments presented in
Chapter 5, five behavioral level states are implemented, but always only a singlestate is possible in one go. The active state defines the robot�s low-level behaviors
and functioning, i.e. how the actuators are used and what messages are transmittedout. Behavior level states are prioritized according to their importance in therobot�s survival. Other criteria are also possible, such as the preference of mission
accomplishment at the cost of lost robots.

42
R2
R3
R5R1
BUFFER
PERCEPTION ACTION
E N V I R O N M E N T
INTERNAL RESOURCES
BEHAVIORAL LAYER
TASK LAYER
COOPERATIVE LAYER
Task B
Task A
DATA EXCHANGE
Task A
Task B
BU
FF
ER
communication out
group_1
group_2
com
mun
icat
ion
in
from operator
from other robots
to operator & other robots
R1
R2
R5
ST1 ST2
Task AST3
R4
R3
ST4
R1
R2
R5
ST1 ST2
Task BST3
R4
R3
R4R4
group_4
group_3
attackclosestalgae
1
attacklargestalgae
2
attacksmallest
algae
3
makemap
1
use map
3
fix map
2
checkmap
4
targetdetection sensor
energy
chemical chemical tank
diving tank
pressure sensor
recover
1
load
1
tasks
2
notepad3
end
3
Figure 4.9 Robot Society control architecture as applied to SUBMAR robots.
Five behavioral level FSA states belong to current implementation: recover, tasks,load, notepad, and end. The states load and recover represent low level behaviorswith the highest priority (self-sufficiency behaviors). The actual task achieving
behavior is the tasks state. The recover state is the initial state for the robot, whenpower is turned on. It is also a kind of emergency state, active when the robot
detects that something is wrong with its mobility (e.g. its location has not changedeven though it should have). In this state the robot starts to use its tank-actuators

43
extensively. The robot changes its status to notepad, if recover has failed to make it
mobile again. In this state the robot no longer moves actively, and its only usefulfeature is to operate as a kind of message mediator until its energy runs out
(abnormal termination). When the robot enters load, it detects that either the levelof spread chemical or its energy have reached some threshold value, so it navigatesto the recharging and refilling station. Consumption of these internal resources is
modeled and realized as emulated functions, since the chemical substance carriertask is emulated itself and the real battery capacity allows longer operation time
than required in a one-hour experiment run. In the end state, the robot hascompleted the mission, the mission time is finished or the operator has given thecommand to abort the mission (normal termination). Then the robot navigates to a
defined location (home) waiting to be removed from the demo process.
4.4.1.2 Task layerSince only one state in the behavioral layer is allowed for the robot at a time, theactual missions the robot is executing in the tasks state are defined in the next
level, the task layer. In this layer, each task can be divided into subtasks and thenpresented as an independent FSA. These FSAs are executed in parallel enabling a
true higher-level multi-tasking capability for the robot. From the point of softwareimplementation, this means that various tasks are easy to isolate from each other,which supports the desired modularity for a program code level. The testing and
debugging of software, as well as managing and the allocation of hardwareresources becomes much easier.
If another state with a higher priority than tasks in the behavioral layer�s FSAbecomes active, for example, if the robot is running out of energy, the necessary
information concerning the state of each task is stored in buffers. When the robotprogram allows the performance of the actual tasks again, the robot retrieves the
needed information from the buffers. Also, data exchange between different tasksis needed, and it has to be ensured that there is only one output command for theactuators at a time.
One or more pre-programmed strategies exists to execute a certain task.
Furthermore, if there are measures to evaluate the efficiency of these strategiesaccording to some common criteria, then it is possible for the robot to optimize itsown performance. In the explore and exploit �type of mission evaluated in the
experiments described in Chapter 5, two parallel tasks were executed. One consistsof the feature-based positioning and navigation system (Task A), while the other isemulated biomass growth detection and removal (Task B). These tasks areexplained in Section 5.2.
4.4.1.3 Cooperative layerThe cooperative layer stores and utilizes the information gained from the other
robots through inter-robot communication. This information can be eithermeasurement data or some parameters related to the robots� task execution.Robots having the same strategy form a group. Individual robots can belong
maximally to as many groups as there are different tasks, while the maximalamount of members in a group correspond to the total number of robots.
Cooperation enables optimization of the task execution at the society level. Therobots commence by testing various strategies. After testing, the functioning
continues with the best combination of strategies so far. Then, a robot�s own

44
efficiency values are compared to other robots� achievement figures received from
inter-robot communication. In this way, successful robots having the rightcombination of strategies can recruit other robots to the same group. As a result
unsuccessful robots change their strategies to better combinations. Stagnation tosub-optimal combinations in a dynamic system is unlikely if the threshold fortransitions between the groups is made small enough. Instead, finding the optimal
combination in a complex system containing many possible strategy combinationscan take time.
Regardless of the type of data or its origin, the reliability of the data decreasesover time. The faster the dynamics of the process, the sooner the data becomes
unreliable. For this reason, the parameters monitored are stored into databases,i.e. to dynamic arrays, which contain rows for the parameters and columns for each
robot. Each cell in this array includes fields for the parameter value itself and therespective weight coefficient for the reliability of the data. Once new data isreceived and stored into the database, an initial value is set as a weight coefficient.
The value of the weight coefficient is decreased frequently, until it reaches zero. Atthat time, the data is also swapped away from the database. A weighted average
calculated for each parameter from the available data from the robot�s databasesrepresents the collective consciousness of the society.
In the experiments, the weight coefficient was decremented once a second, whilethe initial value was 1000. This means that a certain data is available in the
robot�s memory for about 16 minutes. In this case, weight decrementation is linear,but to emphasize fresh values, an exponential forgetting factor could be usedinstead.
4.4.2 Communication structureThe organization of the communication structure is closely related to the controlarchitecture. Low-level communication protocol is used to create a reliable
point-to-point or broadcast type of transmissions in the short-range radio network.On a higher level, the appropriate handling of the contents of the message isarranged.
4.4.2.1 Low-level protocol for communication
As mentioned earlier in Chapter 3, communication in a robot society can be dividedinto two categories: communication between the operator and robots, andcommunication among the robots (inter-robot communication). The former enablesthe user interface to control the society, while the latter is needed to turn a groupof robots into a cooperative society. Since all of the data exchange in the society iscarried out under a common radiofrequency, some sort of communication protocolis essential. As a solution, an Ethernet (CSMA/CD) inspired distributed protocoladapted for wireless communication was developed and implemented to SUBMAR
robots. A similar type of approach for a CSMA-based wireless communicationsystem for cooperative robots has been reported in [Premvuti and Wang 1994] and
[Wang and Premvuti 1994], as well as in [Hutin et al., 1998]. The aim has beento support efficient messaging with minimal loss of information. Messaging withthe protocol only requires that each robot is given an unambiguous identificationnumber (ID). The robot asks the operator for its ID number once the power isswitched on. The protocol frame is presented in Figure 4.10.

45
Each message consists of two sections according to the protocol frame: message
title and the actual information to be transmitted. The frame begins with the startbyte STX (ASCII mark �S�), which is used to synchronize the connection between
transmitter and receiver. It is followed by the protocol Version number, currently 1(0x01). The Sender ID -field in the protocol frame is for the robot�s ownidentification number. Receiver ID enables message addressing to a certain robot
member, while broadcasting to the whole society is defined by setting the receiveras 255 (0xFF). The operator�s ID is agreed to be 1, while a robot without a given
ID is 0. In protocol version 1 the number of members is limited to 253 to savebytes in the frame, but in principle there is no limitation for that number.
Item Bytes Explanation
Message title :
STX 1 Start byte
Version 1 Version number of the protocol
Receiver ID 1 Receiver�s ID-number
Sender ID 1 Sender�s own ID-number
Message type 1 CMD, INFO, ACK, NACK
Message ID 1 ID-number of each message from a certain sender
Data length 2 Length of payload
Title CRC 2 Title checksum, CRC polynomial in reverse order
Payload CRC 2 Payload checksum, CRC polynomial in reverse order
Payload :
Datamax.
65520 Actual message
Figure 4.10 Message frame for the communication protocol.
Four different Message types are supported: INFO, CMD (command), ACK(acknowledge), or NACK (no acknowledge). Info messages are intended for regular
transmissions, like a robot sending its measurement data to the process controlstation. Important messages can be sent as a command type, which means that
receiving of the message is ensured by the acknowledge request. For theseacknowledgement purposes, each message sent by a certain robot also contains aMessage ID number. If the message type is CMD, the receiver automaticallygenerates and sends back an ACK or NACK type of message to the sender. In thesecases, the payload is left blank.
Info types of messages provide no confirmation to the sender whether the messagewas received. However, for all message types CRC polynomial checksums are
calculated to protect messages from transmission errors caused by noise or otherinterference. Data length reveals the length of the following payload, which is
needed for the CRC algorithm; title length always remains constant. Title CRC andPayload CRC are calculated separately to speed up message handling. The protocolframe does not limit or determine the format of the actual payload message. The
structure of Data is left completely open in the transmission layer of the protocol,except the maximum size, 64 kBytes.
Then there are some parameters which can be adjusted to tune communication tothe existing environmental conditions. Automatic resends are used in context with

46
the INFO type of message; the probability of correctly received messages increases
radically, if each message is always resent one after another a few times. Also, thenumber of Acknowledge retries can be set, as well as Acknowledge timeouts, the
time before the next retry. Carrier signal detection is used to prevent overlappingtransmission; in very noisy environments it can be useful to switch it off. The userinterface of the society is described in Section 5.1.3.
Before running the experiment series documented in Chapter 5 the inter-robot
communication system in the SUBMAR society, as well as the user interface, wasset to a desired �realistic� throughput level. Altogether, the aim was to achieve alocal communication ability where not all the messages are received, rather than
optimizing the communication setup for the test.
During the preliminary testing it was soon realized that the CMD-type of messageshad a very poor success-rate with our radiofrequency media in an underwaterenvironment, although the system worked reliably in the air. However, this did not
affect the experiments concerning robots� mutual communication, since CMDmessages were originally specified only for the user interface for abnormal
interrupts. As a result, the user interface is realized with the INFO-type of messageas well.
4.4.2.2 High-level handling of messagesOnce a message is received correctly by a robot, as well as addressed to that
particular robot, the contents of the message are identified with the first charactersof the payload. Messages from the operator have highest priority and mainly affectthe behavioral layer. In the case of an autonomously operating robot, regardless of
the robot�s active state, the operator must always have the access to interrupt theprogram execution and give manual controls instead. For example, the command
�HO� gets the robot to navigate back to its home nest, or �UP� makes it come tothe surface, while �BL� sets the robot back at its autonomous operation mode. Theoperator can also naturally request for some status information or data, which does
not affect the robots� autonomous functioning.
Inter-robot messages are directed straight at the cooperative layer of the controlarchitecture. These messages contain measurement data related to the active tasks,or success-rate values of the executed strategies. The collective consciousness and
global optimization of the task execution in the society are based on thesemessages. As an example of an inter-robot message, �ASxxxxyyyy�, is a message
where the x-field contains the number of the chosen strategy and the y-field thesuccess-rate value for that strategy. Regardless of the values, both fields are alwaysexpressed with four digits.

47
Chapter 5
Experiments with
the SUBMAR society
5.1 Test environment
5.1.1 Demo processPractical testing of prototypes and experiments with the SUBMAR society have
been carried out in a special laboratory test environment, called here the�demo process�. This fully transparent process environment is not a model of any
existing industrial process, but consists of different types and shapes of typicalprocess parts (see Figure 5.1). The total volume of 700 liters is filled with freshwater. In order to imitate process flow, water is circulated with a jet-flow pump.
Other instrumentation includes several temperature sensors, pressure sensors, alimit switch for the liquid level, and an ultrasonic flow-speed meter. Magnetic
valves control hot and cold water inputs, which can be used to generate plug flowsand temperature gradients to be measured by the robots. The instrumentation iscontrolled from a PC-based automation system.
5.1.2 Emulated biomass systemTo enable the study of the functioning of the distributed control architecture of the
Robot Society, a dynamic multi-target mission for the robots was desired. In orderto acquire statistical data for the analysis, the mission had to be exactly repeatable
in each run. As a solution, a special emulated biomass system was developed forthe demo process environment. This system can be used to emulate the growthprocess of a biomass, for example yeast, or algae, as in our case, which tends to
occur in closed water systems.
The task for the robots is detection and removal of the unwanted algae growthagglomerates, which is achieved by distributing a poisonous chemical to the growthlocations. This task deserves some comment from a practical standpoint. Instead of

48
eliminating the unwanted microbial growth locations by raising the poison
concentration to an adequate level throughout the process volume, the same taskcan be treated with coherent local actions by carrying the minimum amount of
poison to areas where it is needed.
The behavior of the emulated growth spots, as well as the robots� sensors and
chemical substance distribution facilities, are presented by infrared LED andphototransistors, as illustrated in Figure 5.2. For the experiments, the growth
model for algae is parametrized in such a way that it is impossible for a singlerobot to remove all the growth alone; cooperation is needed. This allows theanalysis and evaluation of the parallel multi-tasking of the robots in a spatially
distributed task execution.
Figure 5.1 The demo process test environment and user interface for the operator.
Three robots are visible inside the process.
EMULATEDALGAE AGGLOMERATION
IR LED & IR phototransistormatrixUSER
INTERFACE
PROCESSCONTROLSTATION
I/O -CARD
IR LED actuators
IR photo-transistorsensors
ALGAE MODEL
GROWTHCOMPUTATIONIN REMOTE PC
Figure 5.2 An emulated biomass system describes algae growth in the demo
process. The growth agglomerates occur in locations where water stands still.

49
Light emitted from the IR LEDs of the emulated algae represent oxygen or some
other gas produced by microbial growth, which in reality could be detected byrobots with an appropriate dissolved gas sensor. Robots have IR phototransistors
as dissolved gas sensors; while lighting their IR LEDs, robots emulate thespreading of the cleaning agent for algae removal. The emulated organism reactsto the presence of the poisonous chemical, i.e. IR lighting, through its IR
phototransistors. There are three (only two were used in these tests) independentgrowth agglomerations installed at different locations in the demo process (see
Figure 5.1 for their locations) on the upper section of each tank. The electronicsdriving and sampling the IR panels are controlled from a PC via an I/O-card.Transmission of IR light can be analog or frequency modulated. In the tests, more
realistic analog modulation was used. The sensed signal level depends on themeasuring distance, which is a familiar challenge in real-world applications, too.
Calculation of the current level of biomass and its growth rate at each spot iscarried out in a remote PC. The behavior of the biomass is modeled with a
generalized growth curve typical to most biological growth processes (see, forexample, [Stanier et al., 1990]). The status of an algal growth, A, (i.e. volume of
biomass) is based on a formula which indicates how the derivative of the algae isrelated to the growth and natural death of the cells, as follows:
dA
dtD A= −( )*µ (Eq. 5.1)
where µ is the growth rate and D is the death rate of the organism. The value of µdepends on the limiting substrate (for example, nitrogen). The death rate becomes
meaningful when the age of the cells increases or when some poisonous substrates(i.e. cleaning agent) are released into the environment. The actual equation used inour model is discretized from Equation 5.1:
A t A t e D t( ) ( ) * ( )+ = −1 µ ∆ (Eq. 5.2)
The value of D is related to the concentration of the cleaning agent. This value canbe detected through the output channels from the growth agglomerate.
The generalized growth curve of a bacterial culture consists of four separatephases: lag phase, exponential phase, stationary phase and death phase. These
phases are shown in Figure 5.3, where the biomass value A, produced by the model,is plotted. During the exponential phase, there is an attack made by a single robot.As a result, the value of the biomass drops for a while, but it continues to grow
immediately after the poison is dissolved.
Each growth area consists of four IR phototransistor/LED panel sections. Themaximum concentration of cleaning agent sensed by the growth for each panelsection is represented as 4.7 V output from the phototransistors. As summed up,depending on the robots success in their orientation and distance to the targetduring a poison attack, the total effect on a growth agglomerate results in amaximal output of 18.8 V. However, to reach high concentration values,simultaneous poison attacks by several robots are needed. The duration of anattack performed by a single robot is relatively short, since the robots are allowed
to carry only a few poison dosages at a time. After computing the current level ofbiomass according to the growth model, the respective input level for the LED

50
panels is updated. Contrary to phototransistor panels, each LED panel in a certain
growth area shares the same control voltage, i.e. IR lighting is homogenousthroughout the panel area.
Sensor sensitivity
Environment restrictions
Lag
phas
e
Exp
onen
tial p
hase
Sta
tiona
ry p
hase
Dea
th p
hase
Effe
ct o
fpo
ison
ing
Bio
mas
s
Time [sec]
Figure 5.3 Growth curve of the emulated biomass, featuring the four characteristic
phases. The effect of an unsufficient poison attack is shown at about 3800 seconds.
The emulated poison refilling and energy recharging station is implemented as the
same type of IR LED panel area with a fixed lighting level in the bottom of thelarge tank.
5.1.3 User interfaceThe operator�s communication station is an important part of the test environment
system facilities. Base station software provides a user interface, which allows theoperator to control the society and get on-line information from the robots.
Figure 5.4 shows a screenshot from Base station software running in an NTworkstation. This software features protocol parameter settings, different types ofmessage transmissions, the monitoring of received messages, and the logging of all
data to the files. The protocol used in communication is described in Section 4.4.2.Physically, the Base station communicates through a small half-duplex radio
module of the same type that is used in the robots. The radio modem is connectedto a PC via an RS-232 port. The TCP/IP connection to the user interface alsoenables the running of the programs from a distant location through the Internet.
Automatic mission control is a software client for Base station software. It allows
pre-programmed mission controls for task execution, i.e. the messages will beautomatically sent to robots at a given time (see Figure 5.5). The stack of unsentmessages is in the lower frame, while transmitted commands appear in the upper
section (cursive print).

51
Figure 5.4 User interface running in an NT environment.
Figure 5.5 Automatic mission control for Base Station.

52
Basically, it is also possible that the operator could guide the robots� task
execution on a higher level. However, the user interface has not yet been integratedinto the process control system. So far, the emphasis of the research work has been
on the robots� fully autonomous functioning.
5.1.4 Preliminary simulator testingPreliminary algorithm development, testing, and parameter estimation for thetasks were performed at first as a simulator study. This is well motivated, not only
because the physical SUBMAR society was not yet in operation at the early stageof the development process, but principally, experimental work with a complex
system consisting of several autonomous robots is very time consuming (�and maysometimes turn out to be a very frustrating experience indeed�). Nevertheless, thevalue and importance of real robot testing can never be underestimated.
The 3D simulator has been realized with Silicon Graphics C++ 4.0 and
Open Inventor 2.1, which is an object-oriented 3D graphics toolkit providing aninterface for graphics processors. The control architecture of the robots and thedemo process with the complex flow dynamics are modeled as independent objects.
The actual simulator controls these separate processes. Before starting thesimulation, the properties of the robots can be adjusted as well as the
environmental condition parameters. The simulator is running under UnixX-windows in the Silicon Graphics Indigo2 workstation. A series of snapshots froma simulation where the Robot Society performs a biomass removal mission is
shown in Figures 5.6, 5.7, and 5.8. For more details about the simulator, see[Vainio et al., 1996].
Due to the simple environment sensing (i.e. only pressure and emulated optic algaedetection) and precise modeling of the flow conditions of the demo process the
�reality gap� between simulations and the real world does not grow too wide. Thebehavior of the robots scaled up pretty well and the results obtained from the
simulator have proved to be quite comparable with the real robot experiments. In[Halme et al., 1999] and [Vainio et al., 2000a] simulated results are comparedwith results from real robot tests.
Figure 5.6 Mission begins from the surface of the rounded tank.

53
Figure 5.7 The robots explore the process and map the growth areas.
Figure 5.8 The society is gathered together and looks ahead to a coordinated
poison attack.
5.2 Task definition
A dynamic, multitasking explore and exploit type of mission was specified for theSUBMAR society. Each robot runs two parallel tasks, called Task A and Task B,which are described in detail in the following sections. These tasks are implemented
in the Task layer of the robot�s control architecture in the form of an FSArepresentation, as discussed in Section 4.4.1.2.
5.2.1 Task A: Mapping, positioning, and navigationTask A includes functions which enable dynamic environment mapping, as well as arobot�s positioning and navigation facilities for a structured environment. In[Mataric 1991] a cognitive mapping system for an autonomous mobile robot was
introduced. The landmarks were defined as combinations of the robot�s motion andsensory inputs. The map produced by the robot contained nodes (i.e. landmarks)
and topological links between different nodes, which indicate their spatialadjacency. With a related method, the structured underwater operationenvironment for SUBMAR robots is described by using a strongly connected direct

54
graph. It is represented in the form of an adjacency matrix indicating the topology
of the graph. After the initial mapping of the environment, by following this graphthe robot is capable to a rough areal positioning and navigation to these locations.
This system is called the feature based positioning and navigation system.
According to the desired minimalist approach, initial mapping of an unknown
environment (as well as positioning) is based on the processing of a single variable,namely pressure. Other quantities, such as acceleration data or distance
information, could be utilized in a feature based environment mapping as well. Thepressure value and its history in a short time window are continuously monitored todetect events (i.e. nodes) when the robot�s motion character changes. Connections
between the detected nodes are called links. Four different vertical motion typescan be distinguished: (1) motion changes from a certain level in a downwards
movement, (2) from a downward motion to a certain level, (3) from a levelupwards, and (4) upwards to a level, as illustrated in Figure 5.9. The data obtainedthis way is naturally limited and open to errors. As a solution, an adaptive method
is used.
UP to LEVEL (UL)
DOWN to LEVEL (DL)
LEVEL to DOWN (LD)
LEVEL to UP (LU)
Figure 5.9 The environment mapping is based on characteristic motion features in
certain locations (nodes) and connections between these nodes (links).
In [Yamauchi 1995], a concept called APN (Adaptive Place Network) was
introduced. This provided a spatial representation and learning capability for amobile autonomous robot. A modified version of this method is implemented intoSUBMAR robots and described briefly in the following: when a new link is created
it is also assigned a confidence value c∈[0,1]. This value estimates the reliability of
the link, i.e. does it exist or is it a sort of erroneous detection due to collisions
between society members or some other reason. At the beginning, a new link isgiven a certain initial value as its confidence, value c. If the robot travels through a
link then the value of that link is increased with the following equation:
ct+1
= λ +(1-λ)*ct
(Eq.5.3)
where λ is the learning rate. After a certain number of nodes have been detected,
the values of all links are reduced according to the following formula:
ct+1
= (1-λ)*ct
(Eq.5.4)

55
When the confidence value c goes below a certain threshold, the link disappears
from the adjacency matrix. If all links connecting the node to the graph aredeleted, then the node is also removed from the graph. Collisions with other
members create nodes which, however, automatically fade away from the graph. Inorder to find all the nodes needed, i.e. the process compartments having difficultaccess, the robots need to explore the environment actively.
At a certain phase, the mapping described above reaches a stabile form, where only
small temporary changes emerge. The maturation of the map can be detected byfollowing the number of new nodes vs. old modes. In a matured stable form, themap is dominated by old nodes, while new nodes are detected only occasionally.
The size of the map stays within reasonable limits due to the reinforcementfeatures. To allow coherent cooperative functioning, the members of the robot
society should share the same map. There are various methods available to performthe fusion of information from the robots to produce a common representation ofthe environment, called the Common Basic Map (CBM). The CBM can be the
result of autonomous information sharing through inter-robot communication, or itcan be done with the help of the system operator. In Figure 5.10 the CBM
adjacency matrix representation used in the experiments is illustrated at the top ofthe demo process layout. Development of the environment mapping algorithms andfeature based positioning system are presented in [Vainio et al., 1996] and
[Halme et al., 1996].
23
7 6
12
1118
17 16
1514
13
9
type: UP-to-LEVEL(UL)depth: -33 cm
N 4
L[13][14]
type: FULL(F)lenght: 87 cmtravel time: ~20 sec
depth
0 cm
-192 cm
5
10 8
1
4
Figure 5.10 Numbered locations drawn to the demo process layout are the nodes
found by the feature based positioning system. The nodes are characterized by theirtype and depth, as shown in node 4. Links contain information related to themotion type and distance, for example, see the link connecting nodes 13 and 14.
After the initial mapping process the CBM is used for robot navigation. Since theCBM is in the form of a strongly directed graph, it means that from each nodethere is an access to all other nodes. Path planning is performed by using Floyd�salgorithm (see for instance [Sedgewick 1988]) to calculate the shortest path(node trail) between the current node and the destination node. Then, by comparing

56
the depth information of the nodes to be passed through on the node trail to the
desired destination, the actions of the diving tanks are decided.
As an example, a navigation case from node 6 to node 12 can be considered (seeFigure 5.10). The shortest node trail contains nodes 6,7,2,3, and 12. Now, bychecking the links and tracing backwards, the robot knows when to use its tank
actuators. In this case, it should dive at first to leave node 6 and move upwardsafter node 2 to reach node 12. However, the robot can fail in node 3, if it drifts to
the intake flow of the vertical pipe. Then the robot arrives at node 4 instead of thedestination node 12, and it has to re-plan its navigation to take a new attempt.Because of the robots� partly stochastic behavior due to the very limited
maneuverability, they sometimes loose the trail or detect otherwise erroneousnodes. Therefore, it may take a couple of attempts to achieve the destination.
Nevertheless, extensive testing has proved that the feature based positioning andnavigation system is a very robust and reliable method if certain limitations can beomitted. Mapping, positioning, and navigation algorithms with detailed flowcharts,
as well as complete test results are presented in [Vainio 1999].
Task A is implemented into the robot�s Task layer as an FSA with four states:make map (initial environment mapping), fix map (producing the CBM),use map (navigation), and check map (frequent checking of the map in the case of
a dynamic environment).
5.2.2 Task B: Emulated biomass detection and removalTask B consists of functions related to the detection and removal of the emulated
biomass growth in the demo process environment. The spatially distributed targets,i.e. emulated algae growth spots, have a dynamic behavior; they grow and getstronger according to their growth model. If a target is not completely destroyed,
i.e. poisoned, it will continue its growth. This leads to an interesting problem: whatis the optimal strategy for the society to accomplish this kind of dynamic task in
the minimum of time? Should the society at first try to locate all the algae growthlocations before beginning to poison them, or should it poison immediately once thefirst growth area has been detected? Other possible optimization criteria would be
the minimization of energy consumption or poison usage.
A robot gets feedback from its actions directly from its sensors, and indirectlythrough inter-robot communication. Feedback from task execution is necessary forthe robot to enable self-evaluation and optimization of its functioning.Autonomously coordinated collective poisoning of these dynamically growing spotsrequires not only adaptivity from single robot members (based on Task layer rules),but also self-configuration at the society level (Cooperative layer). This means, forexample, the forming of sub-groups to intensify some local actions.
As a practical implementation into the robots� Task layer, three alternativestrategies form the FSA states for Task B: attack the closest algae growth, attack
the largest algae growth, and attack the smallest algae growth. However, these arejust examples of possible strategies; the research concerning various strategies incooperative functioning is just in its initial phase. For example, in a more complex
scenario having a larger number of targets, �the fastest growing� and �the fastestdying� strategies might prove profitable, as well as more strict organization of the
robots into subgroups.

57
5.3 Experiment series I:
Cooperation in distributed task execution
In the first experiment series, the cooperative functioning of the robots was studiedand evaluated. The main issue was to find out how the performance of the societychanges when:
1. The volume of the society, i.e. the number of robot members, is varied
2. Inter-robot communication (IRC) is allowed or banned
Systematic testing was carried out with societies having 3 or 5 robot members,
both with and without inter-robot communication. The tasks for the mission wereexplained in Sections 5.2. and 5.1.2. The maximal duration for each test run is set
as one hour and the robots are assumed to have completed the CBM representationof the environment. Two target algae growth areas are set active. For each testrun, development curves for the biomass volume and respective successful poison
releases for the growth areas are recorded, as shown in Figure 5.11. Algae growthvolume and poison concentration values are expressed in Volts as a function of
time.
3 robo ts (C ), 1 /0 107 , g rowth 1
02468
10121416
1
106
211
316
421
526
631
736
841
946
1051
1156
1261
1366
time / 2 [s ]
volts poison
biomass
3 ro bo ts (C ), 1 /01 07 , g row th 2
0
2
4
6
8
10
12
1
106
211
316
421
526
631
736
841
946
1051
1156
1261
1366
time / 2 [s ]
volts poison
biomass
Figure 5.11 An example of test results produced by one particular experiment run.
After one hour of operation, growth location 2 is dead, while growth location 1 isabout to be eliminated.
To compare the overall result executed by the robots in each run in terms of the
total volume of living biomass, the sum of growth volumes in locations 1 and 2 wascalculated and plotted (see Figure 5.12).
3 robots (C), 1/0107, total
0123456789
10
1 93 185
277
369
461
553
645
737
829
921
1013
1105
1197
1289
1381
time [seconds / 2]
volts biomass
Figure 5.12 Exemplary summation curve for the total biomass volume.

58
5.3.1 Single robot testsThe overall average performance for separate setups, i.e. 3 or 5 robots,communication active or not, was calculated simply by taking an average of the set
of the same type of test runs. As a reference to the actual multi-robot tests, a singlerobot case was evaluated with five runs at first. The results can be seen in
Figure 5.13, which demonstrates clearly that mission completion is impossible fora single robot. Detailed test results are shown in Appendix G.
1 robot, 5 runs, average (bold)
0
2
4
6
8
10
1 96 191
286
381
476
571
666
761
856
951
1046
1141
1236
1331
1426
1521
1616
time / 2 [s]
tota
l bio
mas
s [V
]
Figure 5.13 Five attempts performed by a single robot. The average result curve is
plotted as a bold line.
5.3.2 Tests with 3 robotsThe same experiment was executed with 3 robots, but inter-robot communication
was not allowed (NC), see Figure 5.14 and Appendix H for results. The overallaverage result ended at approximately 1.7 Volts.
3 robots (NC), 10 runs, average (bold)
0
2
4
6
8
10
1 95 189
283
377
471
565
659
753
847
941
1035
1129
1223
1317
1411
1505
1599
time / 2 [s]
tota
l bio
mas
s [V
]
Figure 5.14 The total biomass removal curves for 3 robots. Out of 10 test runs, the
non-communicating society was able to remove the growth completely beforemission time was over three times.
Next, the amount of robot members was kept unchanged, while basic inter-robotcommunication (C-type) was allowed. The respective results can be seen in

59
Figure 5.15 and Appendix I. With this cooperative setup, the overall average result
ended at less than 1 Volt. Figure 5.16 shows the SUBMAR society in action.
3 robots (C), 10 runs, average (bold)
0
2
4
6
8
10
1 96 191
286
381
476
571
666
761
856
951
1046
1141
1236
1331
1426
1521
1616
time / 2 [s]
tota
l bio
mas
s [V
]
Figure 5.15 Total biomass decrease as a result of 3 robots cooperating. In half of
10 test runs, the small society was able to accomplish the mission.
Figure 5.16 A small society of 3 robots performing a simultaneous poisoning
attack against �cyber algae� in location 1. Emulated biomass growth is visiblearound the transparent tank.
5.3.3 Tests with 5 robotsThe experiments were continued by adding two more robot members to the group,
again, at first without communication (NC). As a result, each of the 10 test runswere successfully terminated (see Figure 5.17). The average mission completion
time in this case was about 42 minutes. See Appendix J for more detailed results.

60
5 robots (NC), 10 runs, average (bold)
0
2
4
6
8
10
1 78 155
232
309
386
463
540
617
694
771
848
925
1002
1079
1156
1233
1310
time / 2 [s]
tota
l bio
mas
s [V
]
Figure 5.17 Five non-communicating robots are able to accomplish the task in
every run. The average curve ends at 1267 time units.
The non-communicating tests were followed by communicative variation withotherwise the same settings. The results are illustrated in Figure 5.18 and
Appendix K.
5 robots (C), 10 runs, average (bold)
0
2
4
6
8
10
1 70 139
208
277
346
415
484
553
622
691
760
829
898
967
1036
1105
1174
time / 2 [s]
tota
l bio
mas
s [V
]
Figure 5.18 The performance curve for 5 robots with basic communication active.
Now the average curve ends at 1225 time units.
With the basic C-type IRC active, the average result was only slightly bettercompared to the case without mutual communication. To be exact, the advance inmission completion was only less than 1.5 minutes. The amount of information
exchanged by the robots with C-type IRC is rather minimal. It only includes thesuccess rate value for the performed strategy. The value is broadcast after a robot
has completed a poison attack. In the tests with more extensive CC-type IRC, inaddition to C-type, the algae levels sensed by a robot are broadcast before and aftereach poison attack. Collective information sharing concerning algae measurementvalues ensures more accurate measurements, which leads the robots to choosecorrect and coherent strategies. This improves the performance of the whole
society, as seen in Figure 5.19. See also Appendix L for these results.

61
5 robots (CC), 10 runs, average (bold)
0
2
4
6
8
10
1 61 121
181
241
301
361
421
481
541
601
661
721
781
841
901
961
1021
time / 2 [s]
tota
l bio
mas
s [V
]
Figure 5.19 The CC-type communication clearly improves the performance of the
society. On average, the mission is completed in 977 time units.
The CC-type communication improves the average result, i.e. mission completiontime, by more than 9 minutes when compared to the non-communicative case,
while the advance is approximately 8 minutes to the C-type communication. It isvery clear that the relevance of shared information for the task execution is crucial.
Once the correct type of information is shared by the robots, one might think thatthe better the IRC success rate, the faster the mission completion. The amount of
IRC broadcasting and receiving events were recorded in the log files of each robotduring the 5 robot case tests. Based on this data, the IRC success rate percentages
were calculated for each robot, i.e. the number of received IRC messages by acertain robot was divided by the total number of broadcast IRC in a particular run.The average of these values represent the IRC success rate of the whole society in
that run. However, surprisingly, no negative correlation between the IRC successrate and the respective mission completion times can be stated (see Figure 5.20).
5 robots (CC)
0
200
400
600
800
1000
1200
1 2 3 4 5 6 7 8 9 10
tests
mis
sion
tim
e [s
/2]
0
10
20
30
40
50
60
70
s
ucce
ss
rate
[%]
Mission time
IRC
Figure 5.20 Mission completion times with CC-type IRC are compared to
respective IRC success rate values. No statistical correlation could be found byapplying the T-test.

62
The specified IRC success rate values verify the throughput for the communication
system in the demo process environment. Along with IRC, the respective ORC(Operator-to-Robot Communication) figures were also recorded. Both results are
illustrated in Figure 5.21. On average, the success rates for IRC messages is53.9 %, and for ORC messages 50.2 %. No correlation between IRC and ORCthroughput figures was found, which proves that the noise and interference
disrupting the communication in the demo process environment is purelycoincidental by nature.
5 robots (CC)
01020304050607080
1 2 3 4 5 6 7 8 9 10
tests
succ
ess
rate
[%]
IRC
ORC
Figure 5.21 IRC and ORC success rate values in comparison.
5.3.4 SummaryTo summarize the results from Experiment series I, the average performance
curves from all 6 different test setups are illustrated in Figure 5.22. These curvesrepresent 55 individual test runs with the SUBMAR society.
Averages: 1 robot(5 tests), 3 robots(10 tests), 5 robots(10 tests)
time / 2 [s]
tota
l bio
mas
s [V
]
0
1
2
3
4
5
6
7
8
9
10
1 78 155
232
309
386
463
540
617
694
771
848
925
1002
1079
1156
1233
1310
1387
1464
1541
1618
1695
1 robot
3 robots (NC)
3 robots (C)
5 robots (NC)
5 robots (C)
5 robots (CC)
Figure 5.22 Summation of the mission time curves from Experiment series I. The
differences in performance between 1 and 3 robots and 3 and 5 robots are veryclear.

63
The effect caused by varying the number of robots becomes very clear. The more
robots, the faster the mission completion. To what extent though remains open.Once the number of robots exceeds a certain limit, the results begin to decline due
to the competition for space and resources. The simulator studies[Halme et al., 1999] suggested that the optimal number of robots for these tasks inthis environment would be 5. During the testing there were 7 robots in a fully
operational state, but unfortunately some robots suffered occasionally frompressure sensor calibration problems requiring constant attention. Therefore, the
maximal number of robots in the tests was limited to 5.
The other main objective for this first experiment series was to verify the effect of
inter-robot communication on the overall performance. On average, the CC-typeIRC provided perhaps an unexpectedly slight, although still significant, increase
(21.4 % in the 5 robot case) to the collective performance of the society whenmission completion times were compared with the non-communicative case. Themeaning of the results from Experiment series I concerning the decision-making
mechanisms of the control architecture of the Robot Society, and especially thechoice of strategies in Task B, are analyzed in detail in [Vainio 1999]. In spite of
this, the relevance of IRC for the overall performance of the society could not bestated comprehensively with this test series.
5.4 Experiment series II:
Communication and collective consciousness of the society
The second test series was performed to bring deeper understanding to the meaning
of inter-robot communication in dynamic multi-sensor measurements. The keyquestion is what factors affect the dynamics and accuracy in the development of the
collective consciousness. This was analyzed with a two-stage step response test. Inthese tests, robot functioning and information processing is kept exactly the sameas in the first experiment series, while the behavior of the target biomass growth
spots is changed as a fixed two-stage step function as a reference for the robots.Therefore, the robots actions against the targets have no effect on the
preprogrammed biomass level. Each experiment run takes an hour. To monitor thestate and development of the collective consciousness of the robots, the biomasslevels for the targets estimated by each robot are recorded twice per minute.
For the first 15 minutes, the biomass reference level is at its maximum, i.e.4.5 Volts. This phase is continued by a minimal (non-zero) biomass level of0.7 Volts. The last 15 minutes are again at maximal level. The maximal biomassvalue corresponds to approximately 950 units measured by the robots. Each test
run produces the curves for the assumed biomass level from each robot for the twotarget locations. To describe the collective estimate achieved by the society, the
average of these individual curves for both target areas are also plotted (seeFigure 5.23).

64
3 robots (cc), run 3, growth 1
0
1
2
3
4
5
1 8 15 22 29 36 43 50 57 64 71 78 85 92 99 106
113
120
time / 2 [min]
biom
ass
0
200
400
600
800
1000
3 robots (cc), run 3, growth 1, average
0
1
2
3
4
5
1 8 15 22 29 36 43 50 57 64 71 78 85 92 99 106
113
120
time / 2 [min]
biom
ass
0
200
400
600
800
1000
3 robots (cc), run 3, growth 2
0
1
2
3
4
5
1 8 15 22 29 36 43 50 57 64 71 78 85 92 99 106
113
120
time / 2 [min]
biom
ass
0
200
400
600
800
1000
3 robots (cc), run 3, growth 2, average
0
1
2
3
4
5
1 8 15 22 29 36 43 50 57 64 71 78 85 92 99 106
113
120
time / 2 [min]
biom
ass
0
200
400
600
800
1000
Figure 5.23 An example of test results from one particular experiment run. The
reference curve is plotted in bold.
Again, the test series were performed with 3 and 5 robots, both with and without
inter-robot communication. In tests where IRC was applied, the CC-typecommunication was used.
5.4.1 Tests with 3 robotsAt first, the experiment was carried out with 3 non-communicating robots. Resultsfrom 10 runs are shown in Figure 5.24. In the pictures on the left hand side, eachcurve represents the average of a particular run. Furthermore, the bold line in all
pictures is the average of those 10 runs. The reference curve is also visible.
3 robots (nc), 10 runs, average, growth 1
0
200
400
600
800
1000
1 11 21 31 41 51 61 71 81 91 101 111
time [min/2]
biom
ass
0
1
2
3
4
5
3 robots (nc), 10 runs, average, growth 1
0
200
400
600
800
1000
1 11 21 31 41 51 61 71 81 91 101 111
time [min/2]
biom
ass
0
1
2
3
4
5
3 robots (nc), 10 runs, average, growth 2
0
200
400
600
800
1000
1 11 21 31 41 51 61 71 81 91 101 111
time [min/2]
biom
ass
0
1
2
3
4
5
3 robots (nc), 10 runs, average, growth 2
0
200
400
600
800
1000
1 11 21 31 41 51 61 71 81 91 101 111
time [min/2]
biom
ass
0
1
2
3
4
5
Figure 5.24 The results from the 3 robot non-IRC case show that in most runs, the
detection of the second step is delayed and not complete for a given mission time.

65
Then, the same experiment was tested with IRC allowed. The results are presented
in Figure 5.25.
3 robots (cc), 10 runs, average, growth 1
0
200
400
600
800
10001 8 15 22 29 36 43 50 57 64 71 78 85 92 99 106
113
120
time [min/2]
biom
ass
0
1
2
3
4
5
3 robots (cc), 10 runs, average, growth 1
0
200
400
600
800
1000
1 8 15 22 29 36 43 50 57 64 71 78 85 92 99 106
113
120
time [min/2]
biom
ass
0
1
2
3
4
5
3 robots (cc), 10 runs, average, growth 2
0
200
400
600
800
1000
1 8 15 22 29 36 43 50 57 64 71 78 85 92 99 106
113
120
time [min/2]
biom
ass
0
1
2
3
4
5
3 robots (cc), 10 runs, average, growth 2
0
200
400
600
800
1000
1 8 15 22 29 36 43 50 57 64 71 78 85 92 99 106
113
120
time [min/2]
biom
ass
0
1
2
3
4
5
Figure 5.25 Three robots with IRC, 10 runs. Complete detection of the second step
is almost achieved in the last minutes of the mission time.
5.4.2 Tests with 5 robotsThe tests were continued with 5 robot cases. In Figure 5.26, the non-IRC case is
illustrated.
5 robots (nc), 10 runs, average, growth 1
0
200
400
600
800
1000
1 8 15 22 29 36 43 50 57 64 71 78 85 92 99 106
113
120
time [min/2]
biom
ass
0
1
2
3
4
5
5 robots (nc), 10 runs, average, growth 1
0
200
400
600
800
1000
1 8 15 22 29 36 43 50 57 64 71 78 85 92 99 106
113
120
time [min/2]
biom
ass
0
1
2
3
4
5
5 robots (nc), 10 runs, average, growth 2
0
200
400
600
800
1000
1 8 15 22 29 36 43 50 57 64 71 78 85 92 99 106
113
120
time [min/2]
biom
ass
0
1
2
3
4
5
5 robots (nc), 10 runs, average, growth 2
0
200
400
600
800
1000
1 8 15 22 29 36 43 50 57 64 71 78 85 92 99 106
113
120
time [min/2]
biom
ass
0
1
2
3
4
5
Figure 5.26 Five robot cases without IRC, 10 runs. Again, the second step is not
completely detected, and in spot 2 the estimated values go to zero for a long time.
Finally, 5 robots were tested with IRC allowed, and the results from those 10 runsare shown in Figure 5.27.

66
5 robots (CC), 10 runs, average, growth 1
0
200
400
600
800
1000
1 8 15 22 29 36 43 50 57 64 71 78 85 92 99 106
113
120
time [min/2]
biom
ass
0
1
2
3
4
5
5 robots (CC), 10 runs, average, growth 1
0
200
400
600
800
1000
1 8 15 22 29 36 43 50 57 64 71 78 85 92 99 106
113
120
time [min/2]
biom
ass
0
1
2
3
4
5
5 robots (CC), 10 runs, average, growth 2
0
200
400
600
800
1000
1 8 15 22 29 36 43 50 57 64 71 78 85 92 99 106
113
120
time [min/2]
biom
ass
0
1
2
3
4
5
5 robots (CC), 10 runs, average, growth 2
0
200
400
600
800
1000
1 8 15 22 29 36 43 50 57 64 71 78 85 92 99 106
113
120
time [min/2]
biom
ass
0
1
2
3
4
5
Figure 5.27 IRC-case, 5 robots. The second step is quite well recognized, although,
in growth 2 two individual runs end at an exceptionally low level.
5.4.3 SummaryAt first glance, the curves for different cases resemble each other quite a lot. Themeasurement task for the robots became very difficult to carry out reliably, since
the varying distance to the target strongly affect the acquired value. Even if specialmeasurement procedures were always used to acquire the most correct, i.e. largest,
measurement value, the results are still very inaccurate and sometimes evenmisleading.
However, once these results are analyzed in a more detailed way, differentcharacteristics of the two target areas have to be noted. In growth area number 1,
there exists some turbulence in the water flow. This means that the robots changetheir orientation and position during the measurement procedure, which yieldsmore reliable measurement values. In contrast, in growth area number 2, where thewater stands still, greater measurement errors are more likely to occur. In Figure5.28, the average correlation between the biomass reference curve and therespective collectively assumed biomass levels in various cases are shown.
Average correlation, Growth location 1
0 0.05 0.1 0.15 0.2 0.25 0.3 0.35 0.4
3 robots IRC
3 robots
5 robots IRC
5 robots
Average correlation, Growth location 2
0.44 0.46 0.48 0.5 0.52 0.54 0.56 0.58 0.6
3 robots IRC
3 robots
5 robots IRC
5 robots
Figure 5.28 Average correlation coefficients, 10 runs in each case.
As can be seen from the results, for growth area 1, the 5 robot case with IRC
produces the best correlation. For the more difficult area, location 2, the best

67
correlation results are archived surprisingly by 3 robots with IRC. Correlation
coefficients are relatively low, although all values are statistically notable
according to the T-test (α=0.05) except the 5 robot case without IRC at location
1. One main reason for the low level of correlation is the fact that the referencecurve and the measurements are basically non-scaled. However, a linear match
where 1 Volt corresponds to 200 units for the robots� measurements yields asatisfactory match. Because of various characteristics in growth locations, theperformance curves and figures between different growth areas cannot be directly
compared.
Then, in the same manner, standard deviations (STD) for the robots�measurements are calculated and the results from the 10 runs averaged. Theresults are illustrated in Figure 5.29. In location 1, as one might intuitively expect,
the STDs are the smallest for the IRC-cases when compared with non-IRC cases. Inother words, once the measurements provide reliable results, the smallest STD
value verifies the most effective setup. For some unknown reason, in location 2, inthe cases where 3 robots were applied with IRC, the largest STD for thecollectively acquired information was developed. In this case, where measurements
are known to be very unreliable, this explains the best result in the respectivecorrelation analysis. For the other setups, the measured and broadcast information
contained more uniform, but incorrect values. One explanation can be that for thisarea, 5 robots were already too large population, shadowing and blocking out eachother during the IR-light measurement procedure.
Average STD, Growth location 1
0 50 100 150 200 250
3 robots IRC
3 robots
5 robots IRC
5 robots
biomass volume [non-scaled]
Average STD, Growth location 2
115 120 125 130 135 140 145
3 robots IRC
3 robots
5 robots IRC
5 robots
biomass volume [non-scaled]
Figure 5.29 Averaged standard deviations for the measurements.
5.5 Conclusions
Two different extensive test series have been carried out to verify the functioning ofthe multi-robot system designed and its control architecture while executing adistributed multi-task mission. Altogether, data from 95 experiment runs withphysical robots have been recorded, documented, and analyzed. An optimallyperformed collective task execution consists of the right combination of perception,actuation, and communication. The relations and parametrization of theseelements are highly case-dependent. Therefore, the results presented apply only tothe given test environment and tasks; generalization of the results achieved
requires extra precaution.
The Experiment series I was carried out to analyze the performance of theSUBMAR society by using a different number of robots with variouscommunication setups. These tests were followed by Experiment series II, since the

68
primary effect of inter-robot communication required further analysis. As a whole,
the results from these tests indicate that basically the system functions well, prettymuch in an expected way. The performance of the system can be upgraded up to its
saturation level by increasing the number of robots and their communicativeinteractions. This rather intuitive result assumes that the available and sharedmeasurement information is reliable enough. On the other hand, clear system
robustness against sensor errors was also demonstrated, although poor qualitymeasurements diminished the obvious advantages of inter-robot communication.
From the point of the development in collective consciousness, the quality andreliability of broadcast IRC information is essential.
When analyzed task-wise, Task A, which consists of environment mapping,positioning, and navigation procedures, proved to work very reliably giving a rough
areal accuracy in the closed structured environment used in the tests. When itcomes to the actual utility task, Task B, it is clear that better results could havebeen achieved if the functioning of the system had been more optimized for the
particular properties of the demo process. This applies to the transitions in statebetween strategies and biomass measurement procedures in particular. As
implemented, the strategies in Task B could obviously better handle much morecomplicated missions having a larger number of target areas and robots. However,the motivation for these Robot Society studies has been rather to test and develop
more generic than strictly application addressed ideas and structures.
In a complex autonomous system having reactive components, when the overallstate of the system cannot be predicted unambiguously, there is always a risk orchance to produce completely unintended actions as a side effect. These type of
sometimes useful emergent features did not really occur while testing theSUBMAR society, although interesting and unexpected phenomena were seen, as
shown in Figure 5.30. Nevertheless, to guarantee safe autonomous operation incomplex practical installations, the systems designer should always be aware ofpotential emergent behaviors and ensure manual emergency control over the system
in every imaginable situation.
Figure 5.30 Unexpected self-organization. Three robot members forming a stack.

69
Chapter 6
Technological considerations
6.1 Enhancements and suggestions for implementation
This section discusses various technological considerations to enhance thefunctional properties of the sensor/actuator robots with existing technology and
components. Additional sensors and actuators, more efficient methods forcommunication and positioning, as well as alternative means to perform active
horizontal motion would enable a wide range of various real-world applications andupgraded performance.
6.1.1 SensorsFor many applications the key question is to find a suitable sensor for the quantitymeasured. In the case of small mobile robotic devices, such as SUBMARs, thesensor should be small enough to fit into a SUBMAR casing, but still meet thespecified needs in terms of accuracy, resolution, dynamics, repeatability, andstability. Nowadays, novel small-sized high-quality sensor products are emergingfrom a fast developing microtechnology area, which is under an extensive research
boom. As mentioned in Chapter 4, the functioning of internal and externaltemperature-, pressure-, orientation-, and conductivity sensors has been verified
already. In the following, some other possible sensors applicable to SUBMARrobots are discussed.
Acceleration sensors mounted axially in an orthogonal XYZ-configuration couldprovide useful additional information for a feature-based positioning system,
especially if the robot�s horizontal-plane orientation can be maintained.Acceleration data can also serve a robot�s self-diagnostics by detecting collisions,shocks, or vibrations which are known to be too excessive for the mechanicalstructure. To set up a complete Inertial Measurement Unit (IMU) for inertialnavigation purposes, in addition to acceleration sensors, three orthogonal gyros are
needed to measure angular rates. Arbitrary motion consists of six-degrees-of-freedom: three for translation and another three for rotation. However, in the

70
context of omnidirectional and spinning motion characteristics, the actual benefits
of the gyros are questionable, and remain untested. Because of the cumulativenature of errors in gyro-based systems, additional and especially the absolute type
of sensor information is needed. Even the state-of-the-art small micromechanicallymanufactured piezo-electric gyros are still relatively inaccurate for navigationalpurposes. The compass heading from an electric magnetometer compass corrected
with tilt-angle information from inclinometers can be used to provide an absolutetype of information from the robot�s orientation, at least in non-metallic
environments. In some cases and for proximity sensing, sonar could be applied. Thedetection of the near-field environment by electromagnetic means might provideuseful information in certain cases. A speed sensor would be useful both as a
navigational aid and as a mean to get information from prevailing flow conditions.However, if the robot mainly drifts along the flow and spins omnidirectionally, true
speed measurement is not straightforward to arrange.
In the monitoring of different types of biological processes, like environmental
water quality analysis or fermentation processes, the amount of dissolved oxygen,redox potential, and pH value are important quantities. However, the size of those
sensors is reasonably large and service-life short. Luckily, sensor technology is avery fast developing area and there are already some ion-selective semiconductortechnology based sensors emerging on the market. Turbidity, irradiance, photo-
fluorescence, and particle size are quantities which can be measured optically. Inthose measurements, the level of light transmittance or back-scattering is measured
in various ways. Semiconductor components can be used, which basically allowssmall-sized sensor devices. The viscosity of the surrounding liquid can be calculatedfrom vertical velocity, i.e. from a pressure signal, while diving.
A video camera for visual inspection and navigational aids is a tempting idea in an
AUV. Nowadays, CCD video cameras come in surprisingly small sizes with lowlight requirements. On board on-line image-processing would require a highcomputational capacity from the robot. Wireless transmission is also very
problematic, since video signals requires considerably wider bandwidth thanunderwater acoustic channels can provide. For example, the transmission of a
monochrome TV quality video signal would require a compression rate in the orderof 1250:1. Recent advances in signal and information processing technology haveshown that the low-contrast and low-detailed nature of underwater imagery allows
the utilization of massively compressing algorithms. A completely darkenvironment requires some lighting as well. The results indicate that good visual
quality can be achieved by a very low-bit rate coding of an underwater video signal[Hoag et al., 1997]. An alternative solution for visual data extraction would be astill-image camera with a flashlight. Voice recording with a sensitive microphone is
also possible along with on-line acoustic analysis methods, if enough DSP capacityis incorporated into the robot.
A humidity sensor or condensation point sensor mounted into the casing interiorcould be used for the robot�s self-diagnostics to warn itself about leakage or
condensation in the cover.
6.1.2 ActuatorsThe ability to agglomerate, i.e. form clusters, is a typical functional feature forliving organisms. In the same biologically inspired way, the robots could

71
agglomerate in order to focus and strengthen their collective effect, for example,
while spreading some chemical substance.
Magnetic pads in the robot casing could be used to attach closely positioned robotstogether. If the magnetic force of a permanent magnet was weak enough, it wouldbe easy for the robots to separate again just by changing their directions of motion
to the opposite, i.e. one diving down, the other going upwards or maintaining thecurrent depth. In the case of a stronger permanent magnet some mechanical
solution should be used to disconnect the robots.
On/off control and a stronger contact force could be achieved by applying anelectrical magnet. This kind of magnetic gripper could also allow the �anchoring�of the robots to metallic surfaces. However, a strong electrical magnet requires a
relatively high current for the coil meaning considerable power loss. In addition,strong magnetic fields have a harmful effect on unshielded electronics, includingthe robot itself.
6.1.3 Communication methodsThere are several applicable methods for wireless communication in a liquidenvironment: ultrasonic-, infrared-, radio-, inductive-, and chemical
communication. The communication protocol for the SUBMAR society wasdeveloped as a higher level protocol for ASCII character transmission via serialport. Therefore, the same protocol could basically support other types of
transmitters/receivers than the UHF radiomodule used.
1. Ultrasonic communication is definitely the most applicable for underwatercommunication purposes. Acoustic signals propagate well in conductive non-homogeneous liquids containing even considerable amounts of solid substance.
Audibility depends strongly on the frequency used. In contrast to radio frequencies,no legislation exists for the use of acoustic frequency bands underwater. The
complex problematics with acoustic underwater signals and data processing arerelated to multi-path propagation effects, damping, rough boundaries in seasurface/bottom, and inhomogeneities in the water volume caused by changes in
temperature and pressure. These phenomena are thoroughly analyzed in[Hassab 1989].
In recent years, underwater acoustic communications technology has received agreat deal of research attention. Efficient signal processing algorithms and
modulation techniques have been introduced. Nowadays, for example, anacoustic communication system operating in the sea over several kilometers has a
bandwidth in the order of 10 kHz, while a shorter range system operating overseveral dozens of meters may have a few hundred kHz available. The low frequencytransducers designed for long-range communications are physically too large to be
used in small-scale mobile applications. Nevertheless, recent advances in ultrasoniccommunication are encouraging for robotics applications [Stojanovic 1996],
[Yuh 2000].
2. Infrared light communication can be applied only in clear liquids for a limited
visible range, meaning that this method is useless in most real-world environments.With SUBMAR robots, infrared communication has been basically demonstrated
within the emulated biomass system, presented in Section 5.1.2.

72
3. Radio frequency communication has been successfully used in SUBMAR robots
for local short-range communication in the laboratory test environment. This wasachieved in the electrically transparent plastic demo process filled with fresh water
that was only somewhat conductive. Propagation of the RF signal in liquid mediadepends highly on the frequency used and the conductivity of the liquid. In moreconductive liquids, like seawater, the RF signal will be completely blocked.
Radically lower frequency than the UHF used would result wider range. An antennacould be integrated into the cover or left outside as a tail if longer antenna is
required. But in any case, RF communication is far from the optimal solution insubmerged applications.
4. Inductive communication is based on mutual inductance between two coils. Thismethod was tested in the earlier SUBMAR prototype generations. The system is
pictured in Figure 6.1. with the radio communication module. Since thecommunication range compared to energy consumption is relatively small for theinductive connection, a tag memory can be utilized as a temporary data storage to
minimize energy consumption within the robot. The robot�s own energy isconsumed only while the contents of the onboard tag memory is read or written.
The energy required for the actual transmission over a wider communicationdistance can be provided from the similar read/write -unit located outside theprocess, where a larger coil antenna can be wrapped around the pipe. Testing of
the system proved that the inductive method is very difficult to apply to inter-robotcommunication, where a wider omnidirectional communication distance is
required. However, as an operator interface for relatively narrow pipelines, thesystem seems to work well. Further details can be found in [Appelqvist 1996].
5 cm
Figure 6.1 Radiometrix BIM-433-F UHF-band radio communication module on
the left; inductive communication system on the right consists of the Micrologread/write -unit, Antenna element 022, and an IDC 05008 Tag memory supplied by
Idesco.
5. Chemical communication through environment sensing is mentioned mainly as a
theoretical possibility. Marker substances could be used to leave traces in theenvironment as signals. This function is partly demonstrated in Chapter 4, see
Figure 4.5. Such primitive communication methods could be motivated only bystrictly biomimetic research interests, emulating pheromones excreted by insects.In addition, signal detection with this method is obviously problematic, since
markers dissolve and fade fast in liquid.

73
6.1.4 Positioning and navigationThe required accuracy and feasibility for a positioning system depend on theapplication. The robot�s navigation strategy is closely related to the positioning
task. Although motion control would remain underactuated, and navigationtherefore partly stochastic, on-line in situ measurements and other actions benefit
from accurate positioning. In the following, four different basic methods forpositioning are discussed: the feature-based approach, odometry, active beacons,and an inertial measurement system.
Desired specifications for positioning accuracy are difficult to meet in a submerged
environment, although, in unpressurized environments, the pressure value gives theZ-component (depth) explicitly. The best results can be achieved by creativelycombining various methods and applying advanced statistical estimation methods,
such as Kalman filtering, for data fusion from different sources when needed.
1. Feature-based positioning and navigation in its most minimalist form has beendiscussed in Chapter 4. Relying on the processing of the pressure sensor signal andits history information in a short time-window only, the method provides rough but
robust areal positioning for structured environments having enough characteristicdifferences in depth. Additional sensors are required to bring horizontal positioning
information.
The strength of the feature-based approach lies in the fact that additional
information from different types of sources in various measures can be easilycombined. For example, acceleration sensors reveal turbulent locations and
collisions, while visual landmarks can be detected optically. In a process havinglong horizontal pipelines, the addition of the time dimension to measure timestraveled for the links connecting the nodes can improve accuracy in mapping and
navigation. Drawbacks are related to the constraints in accuracy set by thegeometrical layout of the environment, especially in the XY-direction. Another
limitation is that positioning and navigation require an initial a priori mappingprocess and structured operation environment on the whole.
2. An odometry based positioning method could be used to provide missinghorizontal location information in certain environments. This requires that water-
speed data and compass heading information are available. However, as in the caseof SUBMAR, without any active horizontal propulsion a robot�s true water-speed isdifficult to sense and measure. In a restricted tank compartment this would
require, for example, multi-directional sonar information. An omni-directionalsonar would be a stand-alone positioning system itself.
3. Active beacons installed in the process can be used to create artificial landmarksfor augmented feature-based positioning, or as a stand-alone 3D positioning
system. In the latter case, in theory, at least three beacons should be installed intothe space in a wide spatial configuration to guarantee unambiguous positioning.
From a practical point of view, each compartment in the process volume requiresits own beacons. Whether the distances from the beacons are detected as time offlight measurements or just based on the signal level analysis, it is, nevertheless,very challenging to realize an accurate 3D positioning system in a liquidenvironment. Beacons transmitting modulated acoustic ultrasonic signals would
probably be the best solution for large compartments. Difficulties can be expectedfrom echoing and multi-path transmission. Optical methods require clear liquids,

74
but signal fading still remains a major problem. Inductive beacons coiled around
non-metallic pipes would be simple and cost-effective solutions to installcomplementary beacons for a pipeline network.
4. Inertial positioning can be basically utilized in the open and unstructuredsubmerged environments in the same way as in airborne applications. Theoretical
foundation and filtering techniques for advanced inertial navigation are well knownand widely used (see for example, [Chatfield 1997]). The problems related to
inertial positioning within the SUBMAR-type of robots has been discussed inSection 6.1.1. In outdoor underwater applications, the position correction from aGPS signal can be considered by coming up to the surface on a regular basis. In
[Yun et al., 1999], such integrated GPS/inertial navigation systems assisted withwater-speed sensor and compass is suggested for AUV navigation. The low cost and
small size have been addressed in particular.
6.1.5 Motion and energyVertical motion can be achieved by varying the specific weight of the robot bodycompared to the surrounding liquid. In SUBMAR robots, multi-purpose inboard
tank-actuators are used as diving tanks. To cope with greater alternations in theliquid density which can, for example, be caused simply by temperature variation,
the capacity of the diving tank has to be relatively large compared to the totalvolume of the robot body. Alternative mechanisms are pictured in Figure 6.2.
By using the proposed mechanism based on axial movement between the casinghalves, even a small axial adjustment will result in considerable change in the total
volume because of the large cross-section area. Extensive reduction gearing isrequired for the motor shaft to provide enough torque for operation against outerpressure. A prototype of this construction was prepared and tested, shown in
[Appelqvist et al., 1997], but water-resistant sealing and a rigid enoughmechanical structure proved challenging to arrange with a very limited budget.
LIQUID IN / OUT
a) INTERNAL DIVING TANK
b) OPEN PISTON c) AXIAL MOVEMENT BETWEEN THE HALVES
Figure 6.2 Possible solutions to perform vertical movement.
In some applications, the capability to perform active horizontal motion would berequired. The desired motion may be more or less controlled. There are cases
where any motion, even in random directions, can be highly useful. The idea is notto lose energy by trying to struggle against the process flow, but to provide acertain level of maneuverability to access locations where the liquid stands still,

75
like in large tanks or reservoirs. It also serves as an emergency safety feature for
the robot if it gets stuck somewhere.
Horizontal motion capability could be achieved, for instance, by installingpropulsion tunnels through the casing. As an alternative motion mechanism forconventional propulsion, a flapping fishtail and/or fins could be added to the robot
body. Fish swimming modes which generate robotic motion in an aquaticenvironment were studied in [Mason and Burdick 2000], while an example of a
practical approach to robot swimming is presented in [Sfakiotakis et al., 1999]. Atlow speeds, these alternative thruster mechanisms are known to provide energy-efficient motion compared to propeller solutions. In [Arena et al., 1999], another
biomimetic swimming mechanism, the undulatory-like motion of a sea-lamprey, hasbeen studied for a robotic vehicle.
The capacity of stored energy will definitely remain the ultimate limitation in allmobile devices, including autonomous mobile robots. The level of energy
consumption is closely related to the amount of motion characteristics needed; bareinformation processing, a sampling of sensors, and local communication is very
energy efficient compared to motion generation. Therefore, passive motion ispreferable. In an environment where the robots have access to a certain location(s)from time to time, the continuous autonomous functioning of the robots can be
arranged by installing recharging stations in such locations. The design of awireless recharging station supplying energy to the robots inductively inside the
process has been suggested in [Appelqvist 1996]. Specific problems related to theautonomous recharging of NiMH-cells in mobile robots are well analyzed in[Birk 1997].
6.2 Potential applications
Having correct instrumentation on board, the SUBMAR type of sensor/actuator
robots can be utilized in various real-world applications. The ability to acquiremobile on-line 3D measurement data from inside the process provides moreaccurate information than conventional fixed sensors. However, the idea is not to
replace existing process instrumentation, but to provide a complementary source ofinformation for automation systems controlling the processes. For instance, non-
laminar flow profiles or concentration gradients could be analyzed with greaterease. Furthermore, certain on board actuators could be used for local control.
Potential applications can be found from the monitoring of flow-through processesin the petrochemical industry, pulp mills, water purifying plants, etc. Hightemperatures and other aggressive environmental conditions require innovativesolutions and rugged materials. The validation and control of batch processes infood processing, fermentation, or the chemical and pharmaceutical industry could
also be considered. For example, certain residual chemicals could be measured andwatched over to indicate that the reaction has reached an end. Leakage detection
and localization in long pipelines could be performed in the robots with spectralanalysis based methods and sensitive on board microphones, as suggested in[Halme et al., 1997].
Environmental surveillance is discovered as another possible application domain
for multiple small-sized mobile sensor/actuator platforms. The concept is well-

76
suited to pollution monitoring and water quality analysis in river and lake
waterways. Various oceanographical studies, such as the mapping of sea currentsare also possible. Nowadays, the GPS signal provides an excellent positioning
reference for these outdoor applications while the robot is afloat.
6.3 Microengineering considerations
Although the existing size of the SUBMAR prototype robots (∅ ~11 cm) are
already small enough for many useful applications, it is clear that the smaller sizeof the robot units would bring a completely new type of application to the scope. Itcan be estimated roughly, that with today�s standard electronics assembly and
component technology, by keeping the basic solutions, structure, and specificationsof SUBMAR robots unaltered, it could be easily packed into the size of a tennis
ball (∅ ~6.5 cm). With a considerably larger investment in the initial costs of
production, and given that markets were open to a mass product, by applying ASIC
technology and other customized solutions, the size of golf ball (∅ ~4.3 cm) would
probably be a good target size for the robot.
However, to achieve something radically smaller, other technologies are required.MicroSystem Technology (MST) or MicroElectroMechanical Systems (MEMS)
mean functional integration of mechanical, electronic, fluidic, optical, or any otherelements by using special microengineering techniques to create highly integratedcomponents or devices. Bulk and surface micromachining of silicon, LIGA, and
laser micromachining techniques can be utilized to create 3D forms in siliconsubstrate. As a result of the research activity in the MST area, very small and
accurate sensors, micro-actuators, as well as micro Total Analysis Systems (µTAS)
have been manufactured. Concerning robotics applications, the most important
achievements so far have been various mass produced sensors, for example,accelerometers and gyros for inertial navigation purposes. For further readingabout MST and robotics, see [Fatikow and Rembold 1997] and [Will 2000].
A good example of an applicable µTAS component is a spectrometer manufactured
by microParts, which is packed into an almost standard 24-pin DIP componentpackage, making the whole package fit into a space smaller than 32x29x6 mm.
With a custom package or installed as a bare chip, the size could even be radicallysmaller. In [Fukuda et al. 1995], a swimming microrobot platform is introduced.The motion mechanism is obtained by piezoactuator vibrated fins. The size of the
platform is 34x19 mm.
By applying massive monolithic MST integration combining sensors, actuators,processor, supporting electronics, mechanics, etc., into a single chip, basicallya true microrobot could be produced. Now, the targeted diameter for a robot couldprobably be in the order of a centimeter, depending of the functionalities. However,due to the different scaling of various forces in the micro domain, the operationalprinciples of the robot would need complete reconsideration and redesign. The costof a monolithic integration process is tremendously high, meaning that aproduction series should be extremely large. Although there are no theoretical
restraints for a monolithic integration, a hybrid, modular, component-based MSTintegration is a more realistic approach with the existing technology.

77
Chapter 7
Conclusions
7.1 Summary and conclusions
In this thesis, the achievements from systems level design leading to mechatronicsdesign, implementation, and the testing of a Robot Society system have been
presented in the form of a case study. Naturally, the setup of only one particularsystem has been analyzed, while each application and installation will require
specific solutions. However, on a more general level the basic problems andpotential are common to all autonomous mobile multi-robot systems. It has to benoted also, that the starting point for the design process of the whole system has
been strongly research oriented, rather than any specifically targeted application.Therefore, a classical engineering design process with accurate definition of
technical specifications and user requirements at the beginning of the project havebeen impossible. Although the original targets and tasks have changed slightlyduring the process, the ultimate goal and aims for the study have been clearly
reached.
Research work with SUBMAR robots verified that even from very minimalist robotunits it is possible to build up an effective system capable of coping autonomouslywith relatively complex tasks. Minimalism is often thought to be attractive from
the engineering point of view. The fewer the parts, the fewer the potentialproblems. In many cases, this applies both to mechanical and electrical hardware,
while for software the situation is not so straightforward. The length of a programcode cannot be used to estimate the reliability of the software. Besides thatwatertight testing of complex embedded software systems has proven virtually
impossible, potential emergent features due to reactive software componentsincrease the risk of unwanted effects in functioning. Therefore, the safety aspects
of an autonomously functioning robotic system have to obtain a very highprioritization in the design process.

78
The testing of the SUBMAR society was affected by limitations and difficulties
with the sensing of the emulated biomass growth. Actually, the emulated biomasssystem became a very realistic case partly by mistake; it would have been possible
to ensure correct measurement values for the robots just by applying modulatedcoding for the emitted IR signals. The resulting erroneous robot consciousnessdegraded the performance of the control architecture. The benefits of inter-robot
communication and the functioning of self-optimizing features were disturbed quitesignificantly. Nevertheless, despite perception problems, the robots managed to
accomplish their tasks successfully, which proved obvious system robustness. Theselessons provided a well-grounded reminder of the problems related to 3Ddistributed measurements encountered by robots in real-world situations.
The communication system itself seemed to perform well. Even with the most
efficient communication protocol, nevertheless, it is evident that some part of theinformation will be lost in a spatially decentralized system. However, if thecommunication structure is well designed, some loss of information will not harm
the functioning of the society. In the worst case, some actions will just be delayed.
As a result of continuous research work and systems development for five years andthree prototype generations, profound knowledge has been gained and newsolutions presented as the required technology for minimalist mobile robots
operating in liquid process environments. The SUBMAR Robot Society, shown inFigure 7.1, forms a technological basis for the development of real-world
applications which may combine robotics and process automation systems in anovel way in the future.
Figure 7.1 SUBMAR Robot Society on standby for a new mission�

79
7.2 Future work
Concerning mobile robotics research in general, sheer computational capacity forembedded processing seems to have reached a sufficient level for quite a variety oftasks. Instead, a great deal of unused potential can be found from a more efficient
processing of the acquired sensor information and sensor development itself. Thisapplies to SUBMAR robots as well.
In the future, attention will be paid to the quality of perception to enhance robotconsciousness and thereby the performance of the whole system. More advanced
processing of the measurement information from various sources, along with moreaccurate positioning information will be the main objectives for further
development of the SUBMAR society. Furthermore, the development of a userinterface for the Robot Society is important. It should allow the robots� connectionto automated process control systems as a standard instrumentation and support
3D visualization of the collectively acquired information. Another interestingchallenge requiring further effort would be the more theoretical formulation of the
Robot Society control architecture and statistical modeling of the functioning ofthe system.
To conclude, research work with the SUBMAR society will continue in a moreapplication-oriented direction. In the near future, the feasibility of an application
to environmental monitoring and surveillance in the sea environment will becarefully explored.

80
References
[Allen and Bekoff 1997] Allen C., Bekoff M.: Species of Mind: The Philosophy
and Biology of Cognitive Ethology, Bradford (MITPress), Cambridge, MA, 1997.
[Appelqvist 1996] Appelqvist P.: Design of an Intelligent Sensor/Actuator Robot
for Process Control and Robot Society Studies, Master�s Thesis, HelsinkiUniversity of Technology, Finland, 1996.
[Appelqvist et al., 1997] Appelqvist P., Halme A., Schönberg T., Vainio M.,
Wang Y.: Designing simple cooperative sensor/actuator robots for liquid processenvironments, IEEE/ASME International Conference on Advanced IntelligentMechatronics AIM�97 (CD-ROM), Tokyo, Japan, 1997.
[Appelqvist et al., 1998] Appelqvist P., Vainio M., Halme A.: Mechatronical
design of underwater sensor/actuator robots for cooperative task execution,Mechatronics�98, Proceedings of the 6th UK Mechatronics Forum InternationalConference, Adolfsson J., Karlsen J. (eds.), Pergamon, The Netherlands,
pp. 249-254, 1998.
[Arena et al., 1999] Arena P., Fortuna L., Finocchiaro M., Sultana R.:A mechatronic lamprey controlled by analog circuits, CLAWAR 99, Virk G.S.,Randall M., Howard D. (eds.), Professional Engineering Publishing Limited, Bury
St Edmunds and London, UK, 1999.
[Arkin 1998] Arkin R.C: Behavior-Baser Robotics, The MIT Press, Cambridge,Massachusetts, USA, 1998.
[ARS 1998] Autonomous Robotic Systems, de Almeida A.T., Khatib O. (eds.),Lecture Notes in Control and Information Sciences; no. 236, Springer, London,
Great Britain, 1998.
[Asama 1994] Asama H.: Trends of Distributed Autonomous Robotic Systems,
Distributed Autonomous Robotic Systems, Asama H., Fukuda T., Arai T., Endo I.,Asama, (eds.),. Springer-Verlag, Tokyo, pp. 3-8, 1994.
[Balch and Arkin 1994] Balch T., Arkin R.C.: Communication in ReactiveMultiagent Robotic Systems, Autonomous Robots, Vol. 1, No. 1, pp. 27-52, 1994.
[Birk 1997] Birk A.: Autonomous Recharging of Mobile Robots, Proceedings of
the International Symposium on Automotive Technology and Automation(ISATA '97), Florence, Italy, 1997.
[Brooks 1986] Brooks R. A.: A Robust Layered Control System For a MobileRobot, IEEE Journal of Robotics and Automation, Vol. RA-2, No.1, pp. 14-23,
1986.

81
[Cao et al., 1997] Cao Y.U., Fukunaga A.S., Kahng A.B.: Cooperative Mobile
Robotics: Antecedents and Directions, Autonomous Robots, Vol. 4, No. 1,pp. 7-28, 1997.
[Chatfield 1997] Chatfield A.B.: Fundamentals of High Accuracy InertialNavigation, Progress in Astronautics and Aeronautics, Vol. 174, American
Institute of Aeronautics and Astronautics, USA, 1997.
[CLAWAR 1999] Proceedings of the 2nd International Conference on Climbingand Walking Robots and the Support Technologies for Mobile Machines,CLAWAR 99, Virk G.S., Randall M., Howard D. (eds.), Professional Engineering
Publishing Limited, UK, 1999.
[CLAWAR 2000] Proceedings of the 3rd International Conference on Climbingand Walking Robots and the Support Technologies for Mobile Machines,CLAWAR 2000, Amada M., Gonzalez de Santos P. (eds.), The Cromwell Press
Limited, UK, 2000.
[Connell 1990] Connel J.H.: Minimalist Mobile Robotics - A Colony-style
Architecture for an Artificial Creature, Academic Press, Inc., USA, 1990.
[Cresswell 1999] Cresswell J.: Pigging pipeline: Peaks and troughs, OffshoreInternational, Issue 4, pp. 74-79, 1999.
[DARS 1992] Proceedings of International Symposium on Distributed
Autonomous Robotic Systems, Saitama, Japan, Sep. 21-22, 1992.
[DARS 1994] Distributed Autonomous Robotic Systems, Asama H., Fukuda T.,
Arai T., Endo I. (eds.), Springer-Verlag, Tokyo, 1994.
[DARS 1996] Distributed Autonomous Robotic Systems 2, Asama H., Fukuda T.,Arai T., Endo I. (eds.), Springer-Verlag, Tokyo, 1996.
[DARS 1998] Distributed Autonomous Robotic Systems 3, Lueth T., Dillmann R.,Dario P., Wörn H. (eds.), Springer-Verlag, Berlin, 1998.
[DARS 2000] Distributed Autonomous Robotic Systems 4, Parker L.E., Bekey G.,Barhen J. (eds.), Springer-Verlag, Tokyo, 2000.
[Fatikow and Rembold 1997] Fatikow S., Rembold U.: Microsystems Technology
and Microrobotics, Springer-Verlag, Germany, 1997.
[Fujiwara et al., 1993] Fujiwara S., Kanehara R., Okada T., Sanemori T.: An
articulated multi-vehicle robot for inspection and testing of pipeline interiors,Proceedings of the IEEE/RSJ International Conference on Intelligent Robots and
Systems, Yokohama, Japan, pp. 509-516, 1993.
[Fukuda and Ueyama 1994] Fukuda T., Ueyama T.: Cellular Robotics and Micro
Systems, World Scientific Series in Robotics and Automated Systems � Vol. 10,World Scientific, Utopia Press, Singapore, 1994.

82
[Fukuda et al. 1995] Fukuda T., Kawamoto A., Arai F., Matsuura H.: Steering
Mechanism of Underwater Micro Mobile Robot, Proceedings of IEEEInternational Conference on Robotics and Automation ICRA�95, Vol. 1,
pp. 363-368, Nagoya, Japan, 1995.
[Halme et al., 1993] Halme A., Jakubik P., Schönberg T., Vainio M.: The concept
of robot society and its utilization, Proceedings of the 1993 IEEE InternationalWorkshop on Advanced Robotics, Tsukuba, Japan, pp. 29-35, 1993.
[Halme et al., 1996] Halme A., Appelqvist P., Jakubik P., Kähkönen P.,Schönberg T., Vainio M.: Bacterium Robot Society - A Biologically Inspired
Multi-Agent Concept for Internal Monitoring and Controlling of Processes,Proceedings of the 1996 IEEE/RSJ International Conference on Intelligent Robots
and Systems (IROS�96), Osaka, Japan, pp. 1707-1714, 1996.
[Halme et al., 1997] Halme A., Vainio M., Appelqvist P., Jakubik P.,
Schönberg T., Visala A.: Underwater robot society doing internal inspection andleak monitoring of water systems, Proceedings of SPIE Sensor Fusion and
Decentralized Control in Autonomous Robotic Systems (vol. 3209), Pittsburgh,USA, pp.190-199, 1997.
[Halme et al., 1999] Halme A., Appelqvist P., Vainio M.: Underwater RobotSociety for Distributed Operations, in Proceedings of the 1999 Scandinavian
Symposium on Robotics SSR�99, TTKK-Paino, Robotic Society in Finland,pp. 184-191, 1999.
[Hassab 1989] Hassab J.C.: Underwater signal and data processing, CRC PressInc., USA, 1989.
[Hoag et al., 1997] Hoag D.F., Ingle V.K., Gaudette R.J.: Low-Bit-Rate Coding ofUnderwater Video Using Wawelet-Based Compression Algorithms, IEEE Journal
of Oceanic Engineering, Vol. 22, No. 2, April, pp. 393-400, 1997.
[Hutin et al., 1998] Hutin N., Pegard C., Brassart E.: A Communication Strategyfor Cooperative Robots, Proceedings of the 1998 IEEE/RSJ InternationalConference on Intelligent Robots and Systems IROS�98 (vol.2), Omnipress, USA,
pp. 114-119, 1998.
[IAV 1993] Preprints of the 1st IFAC International Workshop on IntelligentAutonomous Vehicles, Charnley d. (ed.), Pergamon Press, Great Britain, 1993.
[IAV 1995] Preprints of the 2nd IFAC Conference on Intelligent AutonomousVehicles, Halme A., Koskinen K. (eds.), Finnish Society of Automation, Helsinki,
1995.
[IAV 1998] Preprints of the 3rd IFAC Symposium on Intelligent Autonomous
Vehicles, Salichs M.A., Halme A. (eds.), IFAC, 1998.
[Iddan et al. 2000] Iddan G., Meron G., Glukhovsky A., Swain P.: Wirelesscapsule endoscopy, Nature, Vol. 405, 25 May, p. 417, 2000.

83
[IROS/WS1 1998] Proceedings of IROS�98 Workshop on Recent Trends in
Intelligent Underwater Robotics, Battle J., Yuh Y. (eds.), NRC-CNRC, IRAP,Canada, 1998.
[Jones and Flynn 1993] Jones J.L., Flynn A.M.: Mobile Robots - Inspiration toImplementation, AK Peters, Ltd., Wellesley, MA, USA, 1993.
[Järvelä et al., 1998] Järvelä V-M., Sillanpää T., Lehtinen H., Mäkelä H.,
Merin P.: Quality of paper roll transportation monitored, Automation TechnologyReview (ISSN 1238-8688), December, pp. 69-73, 1998.
[Kawaguchi et al., 1997] Kawaguchi Y., Yoshida I., Iwao K., Kikuta T.: Sensorsand Crabbing for an In-pipe Magnetic-wheeled Robot, IEEE/ASME International
Conference on Advanced Intelligent Mechatronics AIM�97 (CD-ROM), Tokyo,Japan, 1997.
[Kurabayashi and Asama 2000] Kurabayashi D., Asama H.: Knowledge Sharingand Cooperation of Autonomous Robots by Intelligent Data Carrier System,
Proceedings of the 2000 IEEE International Conference on Robotics andAutomation, Omnipress, USA, pp. 464-469, 2000.
[Mason and Burdick 2000] Mason R., Burdick J.W.: Experiments in CarangiformRobotic Fish Locomotion, Proceedings of the 2000 IEEE International Conference
on Robotics and Automation, Omnipress, USA, pp. 428-435, 2000.
[Mataric 1991] Mataric M.J.: Navigating With a Rat Brain: A Neurobiologically-
Inspired Model for Robot Spatial Representation, From Animals to Animats (FirstInternational Conference on Simulation of Adaptive Behavior), Meyer J-A. and
Wilson S.(Eds.), The MIT Press, Cambridge, Mass., pp. 169-175, 1991.
[McComb 1989] McComb G.: The robot builder�s bonanza: 99 inexpensive
robotics projects, Tab Books Inc., USA, 1987.
[McFarland and Bösser 1993] McFarland D., Bösser T.: Intelligent Behavior inAnimals and Robots, A Bradford book, The MIT Press, USA, 1993.
[Mondada et al., 1994] Mondada F., Franzi E., Ienne P.: Mobile robotminiaturisation: A tool for investigation in control algorithms, Experimental
Robotics III, Proceedings of the 3rd International Symposium on ExperimentalRobotics, Springer Verlag, London, UK, pp. 501-513, 1994.
[Moraleda et al., 1999] Moraleda J., Ollero A., Orte M.: A Robotic system forinternal inspection of water pipelines, IEEE Robotics & Automation Magazine,
September, pp. 30-41, 1999.
[von Numers et al., 1995] von Numers T., Asama H., Fujita T., Kotosaka S.,Miyao S., Kaetsu H., Endo I.: An Intelligent Data Carrier System for LocalCommunication Between Cooperative Multiple Robots and Environment, Preprints
of the 2nd IFAC Conference on Intelligent Autonomous Vehicles IAV�95, FinnishSociety of Automation, Helsinki, Finland, pp. 366-371, 1995.

84
[Parker 1994] Parker L.E.: Heterogeneous Multi-Robot Cooperation, PhD Thesis,
Massachusetts Institute of Technology, Artificial Intelligence Laboratory,MIT-AI-TR 1465, February, 1994.
[Parker 1996] Parker L.E.: Multi-Robot Team Design for Real-WorldApplications, Distributed Autonomous Robotic Systems 2, Asama H., Fukuda T.,
Arai T., Endo I., Asama, (Eds.), Springer-Verlag, Tokyo, pp. 91 - 103, 1996.
[Premvuti and Wang 1994] Premvuti S., Wang J.: A Medium Access Protocol(CSMA/CD-W) Supporting Wireless Inter-Robot Communication in DistributedRobotic Systems, Distributed Autonomous Robotic Systems, Asama H., Fukuda T.,
Arai T., Endo I. (eds.), Springer-Verlag, Tokyo, pp. 165-175, 1994.
[Rosheim 1994] Rosheim M.E.: Robot Evolution -The Development ofAnthrobotics, John Wiley & Sons Inc., New York, NY, 1994.
[Roβmann and Pfeiffer 1996] Roβmann T., Pfeiffer F.: Control and Design of a
Pipe Crawling Robot, Proceedings of the 13th World Conference of Automatic
Control, San Francisco, USA, 1996.
[SAB 1990] From Animals to Animats: Proceedings of the First InternationalConference on Simulation of Adaptive Behavior, Meyer J.A., Wilson S.W. (eds.),The MIT Press / Bradford Books, 1991.
[SAB 1992] From Animals to Animats 2: Proceedings of the Second International
Conference on Simulation of Adaptive Behavior, Meyer J.A., Roitblat H.L.,Wilson S.W. (eds.), The MIT Press / Bradford Books, 1993.
[SAB 1994] From Animals to Animats 3: Proceedings of the Third InternationalConference on Simulation of Adaptive Behavior, Cliff D., Husbands P., Meyer J.A.,
Wilson S.W. (eds.), The MIT Press / Bradford Books, 1994.
[SAB 1996] From Animals to Animats 4: Proceedings of the Fourth International
Conference on Simulation of Adaptive Behavior, Maes P., Mataric H.J.,Meyer J.A., Pollack J., Wilson S.W. (eds.), The MIT Press / Bradford Books,
1996.
[Scott and Hewish 1999] Scott R., Hewish M.: Remote hunting key to littoral
waters, Minehunting and mine reconnaissance under remote control, Jane�sInternational Defence Review, Vol. 32, November, pp. 48-54, 1999.
[Sedgewick 1988] Sedgewick R.: Algorithms (2nd edition), Addison-Wesley, NewYork, USA, 1988.
[Sfakiotakis et al., 1999] Sfakiotakis M., Lane D.M., Davies J.B.C.: Review of
Fish Swimming Modes for Aquatic Locomotion, IEEE Journal of OceanicEngineering, Vol. 24, No. 2, pp. 237-252, 1999.
[Shannon 1948] Shannon C.E.: A mathematical theory of communication, BellSys. Tech. Journal, Vol. 27, pp. 379-423, 623-656, 1948.

85
[Shapiro 1988] Shapiro J. A.: Bacteria as Multicellular Organisms, Scientific
American, Vol. 258, No. 6, pp. 62 - 69, 1988.
[Shapiro 1995] Shapiro J. A.: The Significances of Bacterial Colony Patterns,BioEssays, Vol. 17, No. 7, pp. 597 - 607, 1995.
[Stanier et al., 1990] Stanier R.Y., Ingraham J.L., Wheelis M.L., Painter P.R.:General Microbiology (5th Ed.), London, Macmillan Education Ltd., 1990.
[Steels and Brooks 1995] Steels L., Brooks R. (eds.): The Artificial Life Route toArtificial Intelligence: Building Embodied, Situated Agents, Lawrence Erlbaum
Associates Inc., Publishers, Hillsdale, New Jersey, USA, 1995.
[Steer et al., 1993] Steer B., Cuschieri J., Dunn S., Ganesan K., Kloske J.,LeBlanc L., Pandaya A., Schock S., Shein A., Smith S.: Step towards autonomoussensor based robotic systems in the ocean, Preprints of the 1st IFAC International
Workshop on Intelligent Autonomous Vehicles, Charnley d. (ed.), Pergamon Press,Great Britain, pp. 199-204, 1993.
[Stojanovic 1996] Stojanovic M.: Recent Advances in High-Speed UnderwaterAcoustic Communications, IEEE Journal of Oceanic Engineering, Vol. 21, No. 2,
pp. 125-136, 1996.
[Suzuki et al., 1995] Suzuki S., Asama H., Uegaki A., Kotosaka S., Fujita T.,Matsumoto A., Kaetsu H., Endo I.: An Infra-Red Sensory System with LocalCommunication for Cooperative Multiple Mobile Robots, Proceedings of the 1995
IEEE/RSJ International Conference on Intelligent Robots and Systems, IEEEComputer Society, CA, USA, pp. 220-225, 1995.
[Vainio 1999] Vainio M.: Intelligence Through Interactions � Underwater RobotSociety for Distributed Operations in Closed Aquatic Environment,
Doctoral Thesis, Laboratory of Automation Technology, Helsinki University ofTechnology, 1999.
[Vainio et al., 1996] Vainio M., Halme A., Appelqvist P., Kähkönen P.,Jakubik P., Schönberg T., Wang Y.: An Application Concept of an Underwater
Robot Society, Distributed Autonomous Robotic Systems 2 (DARS�96), Asama H.,Fukuda T., Arai T., Endo I., (eds.), Springer-Verlag, Tokyo, Japan, pp. 103-114,
1996.
[Vainio et al., 1997] Vainio M., Halme A., Jakubik P., Schönberg T.,
Appelqvist P.: Robot Societies - From Simulator Studies towards a Real WorldApplication, AAAI Fall Symposium Technical Report FS-97-02 (SociallyIntelligent Agents), Cambridge, USA, pp. 137-139, 1997.
[Vainio et al., 1998a] Vainio M., Appelqvist P., Schönberg T., Halme A.: Group
behavior of a mobile underwater robot society destroying distributed targets in aclosed process environment, Proceedings of the 3rd IFAC Symposium on
Intelligent Autonomous Vehicles IAV�98, Madrid, Spain, pp. 112-117, 1998.
86
[Vainio et al., 1998b] Vainio M., Appelqvist P., Halme A.: Generic Control
Architecture for a Cooperative Robot System, Proceedings of the 1998 IEEE/RSJInternational Conference on Intelligent Robots and Systems IROS�98 (vol.2),
Omnipress, USA, pp. 1119-1125, 1998.
[Vainio et al., 2000a] Vainio M., Appelqvist P., Halme A.: Mobile Robot Society
for Distributed Operations in Closed Aquatic Environment, Robotica, Vol. 18,Issue 3, pp. 235-250, 2000.
[Vainio et al., 2000b] Vainio M., Appelqvist P., Halme A.: Underwater RobotSociety for Closed Aquatic Environment, Proceedings of the 31st International
Symposium on Robotics ISR 2000, Montreal, Canada, pp. 238-243, 2000.
[Vainio et al., 2000c] Vainio M., Appelqvist P., Halme A.: Control architecturefor an underwater robot society, in Distributed Autonomous Robotic Systems 4(DARS 2000), Parker L.E., Bekey G., Barhen J., (Eds.), Springer-Verlag, Tokyo,
Japan, pp. 15-24, 2000.
[Vaisala 1999] Advanced AVAPS System for Airborne Weather Research, VaisalaNews (ISSN 1238-2388), No. 149, pp. 4-9, 1999.
[Wang and Premvuti 1994] Wang J., Premvuti S.: Resource Sharing inDistributed Robotic Systems Based on a Wireless Medium Access Protocol
(CSMA/CD-W), Distributed Autonomous Robotic Systems, Asama H., Fukuda T.,Arai T., Endo I. (eds.), Springer-Verlag, Tokyo, pp. 211-223, 1994.
[Whitcomb 2000] Whitcomb L.L.: Underwater Robotics: Out of the ResearchLaboratory and Into the Field, Proceedings of the 2000 IEEE International
Conference on Robotics and Automation, Omnipress, USA, pp. 709-716, 2000.
[Will 2000] Will P.: MEMS and Robotics: Promises and Problems, Proceedings
of the 2000 IEEE International Conference on Robotics and Automation,Omnipress, USA, pp. 938-946, 2000.
[Yamauchi 1995] Yamauchi B.M.: Exploration and Spatial Learning in DynamicEnvironments, Case Western Reserve University, PhD Thesis, 1995.
[Yang and Rhee 2000] Yang B-H., Rhee S.: Development of the ring sensor for
healthcare automation, Robotics and Autonomous Systems, Vol. 30, No. 3,February, pp. 273-281, 2000.
[Yuh 2000] Yuh J.: Design and Control of Autonomous Underwater Robots:A Survey, Autonomous Robots, Vol. 8, No. 1, January, pp. 7-24, 2000.
[Yun et al., 1999] Yun X., Bachmann E.R., McGhee R.B., Whalen R.H.,Roberts R.L., Knapp R.G., Healey A.J., Zyda M.J.: Testing and Evaluation of an
Integrated GPS/INS System for Small AUV Navigation, IEEE Journal of OceanicEngineering, Vol. 24, No. 3, July, pp. 396-404, 1999.

87
Appendices
Appendix A Schematic layout of SUBMAR CPU module
Appendix B Schematic layout of SUBMAR Power moduleAppendix C Schematic layout of SUBMAR Amplifier moduleAppendix D Schematic layout of SUBMAR Motor control module
Appendix E Schematic layout of SUBMAR Communication moduleAppendix F Schematic layout of SUBMAR Infrared module
Appendix G Tests from Experiment Series I (1 robot)Appendix H Tests from Experiment Series I (3 robots, no IRC)
Appendix I Tests from Experiment Series I (3 robots, C-type IRC)Appendix J Tests from Experiment Series I (5 robots, no IRC)
Appendix K Tests from Experiment Series I (5 robots, C-type IRC)Appendix L Tests from Experiment Series I (5 robots, CC-type IRC)
Appendix M Tests from Experiment Series II (3 robots, no IRC)Appendix N Tests from Experiment Series II (3 robots, IRC)
Appendix O Tests from Experiment Series II (5 robots, no IRC)Appendix P Tests from Experiment Series II (5 robots, IRC)

Appendix A Schematic layout of SUBMAR CPU module

Appendix B Schematic layout of SUBMAR Power module

Appendix C Schematic layout of SUBMAR Amplifier module

Appendix D Schematic layout of SUBMAR Motor control module

Appendix E Schematic layout of SUBMAR Communication module

Appendix F Schematic layout of SUBMAR Infrared module

Appendix G Tests from Experiment Series I (1 robot) 1/2
1 robot, 1/0807, growth 1
0
2
4
6
8
10
1
127
253
379
505
631
757
883
1009
1135
1261
1387
1513
1639
time / 2 [s]
volts poison
biomass
1 robot, 1/0807, growth 2
0
1
2
3
4
5
6
1
124
247
370
493
616
739
862
985
1108
1231
1354
1477
1600
time / 2 [s]
volts poison
biomass
1 robot, 2/0807, growth 1
0
2
4
6
8
10
12
1
130
259
388
517
646
775
904
1033
1162
1291
1420
1549
1678
time / 2 [s]
volts poison
biomass
1 robot, 2/0807, growth 2
0
1
2
3
4
5
6
7
1
127
253
379
505
631
757
883
1009
1135
1261
1387
1513
1639
time / 2 [s]
volts poison
biomass
1 robot, 3/0807, growth 1
0
2
4
6
8
10
12
1
130
259
388
517
646
775
904
1033
1162
1291
1420
1549
1678
time / 2 [s]
volts poison
biomass
1 robot, 3/0807, growth 2
0123456789
1
128
255
382
509
636
763
890
1017
1144
1271
1398
1525
1652
time / 2 [s]
volts poison
biomass
1 robot, 4/0807, growth 1
0
2
4
6
8
10
12
1
132
263
394
525
656
787
918
1049
1180
1311
1442
1573
1704
time / 2 [s]
volts poison
biomass
1 robot, 4/0807, growth 2
0
1
2
3
4
5
6
1
129
257
385
513
641
769
897
1025
1153
1281
1409
1537
1665
time / 2 [s]
volts poison
biomass
1 robot, 5/0807, growth 1
0
2
4
6
8
10
1
129
257
385
513
641
769
897
1025
1153
1281
1409
1537
1665
time / 2 [s]
volts poison
biomass
1 robot, 5/0807, growth 2
0
1
2
3
4
5
6
1
126
251
376
501
626
751
876
1001
1126
1251
1376
1501
1626
time / 2 [s]
volts poison
biomass

Appendix G Tests from Experiment Series I (1 robot) 2/2
1 robot, 1/0807, total
0
2
4
6
8
10
1
127
253
379
505
631
757
883
1009
1135
1261
1387
1513
1639
time / 2 [s]
volts poison
biomass
1 robot, 2/0807, total
0
2
4
6
8
10
12
1
130
259
388
517
646
775
904
1033
1162
1291
1420
1549
1678
time / 2 [s]
volts poison
biomass
1 robot, 3/0807, total
0
2
4
6
8
10
12
1
130
259
388
517
646
775
904
1033
1162
1291
1420
1549
1678
time / 2 [s]
volts poison
biomass
1 robot, 4/0807, total
0
2
4
6
8
10
12
1
132
263
394
525
656
787
918
1049
1180
1311
1442
1573
1704
time / 2 [s]
volts poison
biomass
1 robot, 5/0807, total
0
2
4
6
8
10
1
129
257
385
513
641
769
897
1025
1153
1281
1409
1537
1665
time / 2 [s]
volts poison
biomass

Appendix H Tests from Experiment Series I (3 robots, no IRC) 1/3
3 robots (NC), 1/0207, growth 1
0
2
4
6
8
10
12
14
16
1
112
223
334
445
556
667
778
889
1000
1111
1222
1333
1444
time / 2 [s]
volts poison
biomass
3 robots (NC), 1/0207, growth 2
0
2
4
6
8
10
12
14
1
112
223
334
445
556
667
778
889
1000
1111
1222
1333
1444
time / 2 [s]
volts poison
biomass
3 robots (NC), 2/0207, growth 1
0
2
4
6
8
10
12
14
16
1
130
259
388
517
646
775
904
1033
1162
1291
1420
1549
1678
time / 2 [s]
volts poison
biomass
3 robots (NC), 2/0207, growth 2
0
2
4
6
8
10
12
14
16
1
130
259
388
517
646
775
904
1033
1162
1291
1420
1549
1678
time / 2 [s]
volts poison
biomass
3 robots (NC), 3/0207, growth 1
02468
101214161820
1
129
257
385
513
641
769
897
1025
1153
1281
1409
1537
1665
time / 2 [s]
volts poison
biomass
3 robots (NC), 3/0207, growth 2
0
2
4
6
8
10
12
14
1
129
257
385
513
641
769
897
1025
1153
1281
1409
1537
1665
time / 2 [s]
volts poison
biomass
3 robots (NC), 4/0407, growth 1
0
2
4
6
8
10
12
14
1
126
251
376
501
626
751
876
1001
1126
1251
1376
1501
1626
time [seconds / 2]
volts poison
biomass
3 robots (NC), 4/0407, growth 2
0
2
4
6
8
10
12
1
126
251
376
501
626
751
876
1001
1126
1251
1376
1501
1626
time [seconds / 2]
volts poison
biomass
3 robots (NC), 5/0407, growth 1
0
2
4
6
8
10
12
1
128
255
382
509
636
763
890
1017
1144
1271
1398
1525
1652
time / 2 [s]
volts poison
biomass
3 robots (NC), 5/0407, growth 2
0
2
4
6
8
10
12
14
16
1
128
255
382
509
636
763
890
1017
1144
1271
1398
1525
1652
time / 2 [s]
volts poison
biomass

Appendix H Tests from Experiment Series I (3 robots, no IRC) 2/3
3 robots (NC), 6/0507, growth 1
0
2
4
6
8
10
12
14
16
1
135
269
403
537
671
805
939
1073
1207
1341
1475
1609
1743
time / 2 [s]
volts poison
biomass
3 robots (NC), 6/0507, growth 2
0
2
4
6
8
10
12
1
135
269
403
537
671
805
939
1073
1207
1341
1475
1609
1743
time / 2 [s]
volts poison
biomass
3 robots (NC), 7/0607 , growth 1
02
468
1012
1416
1 86 171
256
341
426
511
596
681
766
851
936
1021
1106
time / 2 [s]
volts poison
biomass
3 robots (NC), 7/0607 , growth 2
0
2
4
6
8
10
12
14
1 86 171
256
341
426
511
596
681
766
851
936
1021
1106
time / 2 [s]
volts poison
biomass
3 robots (NC), 8/0507, growth 1
0
2
4
6
8
10
12
14
16
1
129
257
385
513
641
769
897
1025
1153
1281
1409
1537
1665
time / 2 [s]
volts poison
biomass
3 robots (NC), 8/0507, growth 2
0
2
4
6
8
10
12
1
129
257
385
513
641
769
897
1025
1153
1281
1409
1537
1665
time / 2 [s]
volts poison
biomass
3 robots (NC), 9/0507, growth 1
0
2
4
6
8
10
12
14
1
115
229
343
457
571
685
799
913
1027
1141
1255
1369
1483
time / 2 [s]
volts poison
biomass
3 robots (NC), 9/0507, growth 2
0123456789
10
1
115
229
343
457
571
685
799
913
1027
1141
1255
1369
1483
time / 2 [s]
volts poison
biomass
3 robots (NC), 10/0507, growth 1
0
5
10
15
20
25
1
129
257
385
513
641
769
897
1025
1153
1281
1409
1537
1665
time / 2 [s]
volts poison
biomass
3 robots (NC), 10/0507, growth 2
0
2
4
6
8
10
12
14
1
129
257
385
513
641
769
897
1025
1153
1281
1409
1537
1665
time / 2 [s]
volts poison
biomass

Appendix H Tests from Experiment Series I (3 robots, no IRC) 3/3
3 robots (NC), 1/0207, total
0
2
4
6
8
10
12
14
16
1
112
223
334
445
556
667
778
889
1000
1111
1222
1333
1444
time / 2 [s]
volts poison
biomass
3 robots (NC), 2/0207, total
0
5
10
15
20
25
1
130
259
388
517
646
775
904
1033
1162
1291
1420
1549
1678
time / 2 [s]
volts poison
biomass
3 robots (NC), 3/0207, total
02468
101214161820
1
129
257
385
513
641
769
897
1025
1153
1281
1409
1537
1665
time / 2 [s]
volts poison
biomass
3 robots (NC), 4/0407, total
0
2
4
6
8
10
12
14
16
1
126
251
376
501
626
751
876
1001
1126
1251
1376
1501
1626
time [seconds / 2]
volts poison
biomass
3 robots (NC), 5/0407, total
0
2
4
6
8
10
12
14
16
1
128
255
382
509
636
763
890
1017
1144
1271
1398
1525
1652
time / 2 [s]
volts poison
biomass
3 robots (NC), 6/0507, total
0
2
4
6
8
10
12
14
16
1
135
269
403
537
671
805
939
1073
1207
1341
1475
1609
1743
time / 2 [s]
volts poison
biomass
3 robots (NC), 7/0607 , total
02
468
1012
1416
1 86 171
256
341
426
511
596
681
766
851
936
1021
1106
time / 2 [s]
volts poison
biomass
3 robots (NC), 8/0507, total
02468
1012141618
1
129
257
385
513
641
769
897
1025
1153
1281
1409
1537
1665
time / 2 [s]
volts poison
biomass
3 robots (NC), 9/0507, total
0
2
4
6
8
10
12
14
1
115
229
343
457
571
685
799
913
1027
1141
1255
1369
1483
time / 2 [s]
volts poison
biomass
3 robots (NC), 10/0507, total
0
5
10
15
20
25
1
129
257
385
513
641
769
897
1025
1153
1281
1409
1537
1665
time / 2 [s]
volts poison
biomass

Appendix I Tests from Experiment Series I (3 robots, C-type IRC) 1/3
3 robots (C), 1/0107, growth 1
0
2
4
6
8
10
12
14
16
1
106
211
316
421
526
631
736
841
946
1051
1156
1261
1366
time / 2 [s]
volts poison
biomass
3 robots (C), 1/0107, growth 2
0
2
4
6
8
10
12
1
106
211
316
421
526
631
736
841
946
1051
1156
1261
1366
time / 2 [s]
volts poison
biomass
3 robots (C), 2/0107, growth 1
0
2
4
6
8
10
12
14
16
1
133
265
397
529
661
793
925
1057
1189
1321
1453
1585
1717
time / 2 [s]
volts poison
biomass
3 robots (C), 2/0107, growth 2
0
2
4
6
8
10
12
1
133
265
397
529
661
793
925
1057
1189
1321
1453
1585
1717
time / 2 [s]
volts poison
biomass
3 robots (C), 3/0107, growth 1
0
2
4
6
8
10
12
1
129
257
385
513
641
769
897
1025
1153
1281
1409
1537
1665
time / 2 [s]
volts poison
biomass
3 robots (C), 3/0107, growth 2
0
2
4
6
8
10
12
1
129
257
385
513
641
769
897
1025
1153
1281
1409
1537
1665
time / 2 [s]
volts poison
biomass
3 robots (C), 4/02.07, growth 1
02468
1012141618
1
150
299
448
597
746
895
1044
1193
1342
1491
1640
1789
1938
time / 2 [s]
volts poison
biomass
3 robots (C), 4/02.07, growth 2
0
2
4
6
8
10
12
14
1
150
299
448
597
746
895
1044
1193
1342
1491
1640
1789
1938
time / 2 [s]
volts poison
biomass
3 robots (C), 5/0207, growth 1
0
2
4
6
8
10
12
14
16
1
129
257
385
513
641
769
897
1025
1153
1281
1409
1537
1665
time / 2 [s]
volts poison
biomass
3 robots (C), 5/0207, growth 2
0
2
4
6
8
10
12
1
129
257
385
513
641
769
897
1025
1153
1281
1409
1537
1665
time / 2 [s]
volts poison
biomass
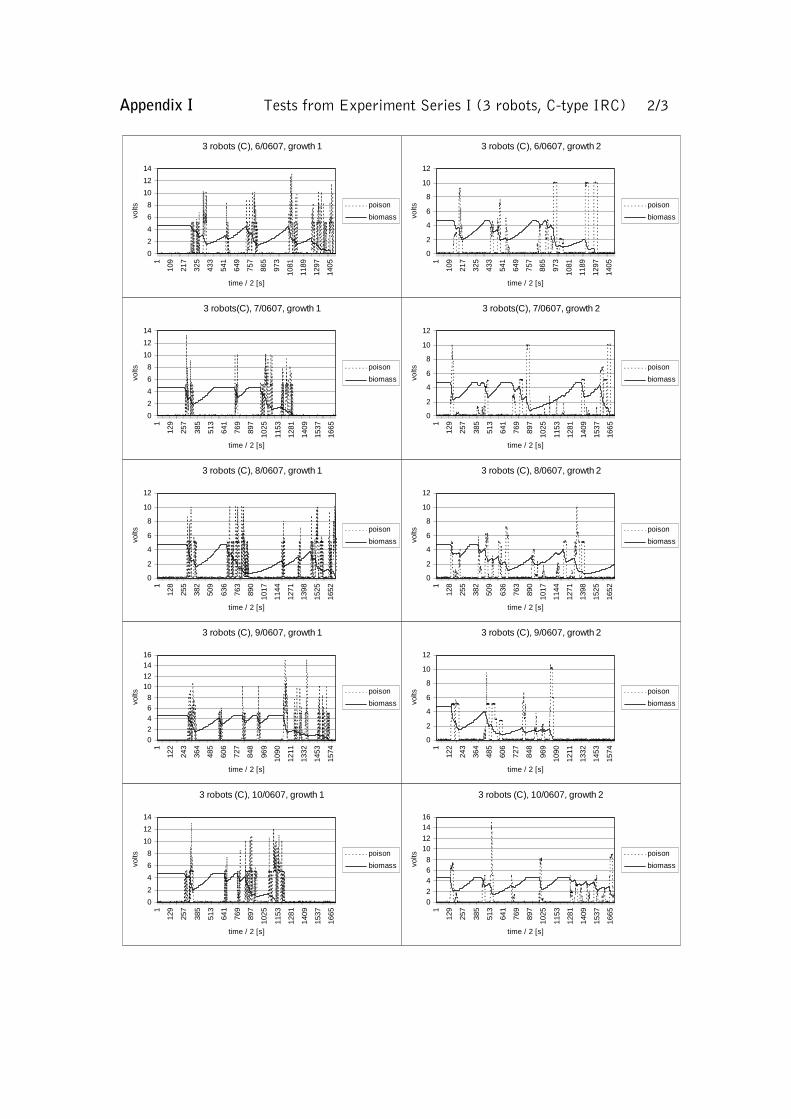
Appendix I Tests from Experiment Series I (3 robots, C-type IRC) 2/3
3 robots (C), 6/0607, growth 1
0
2
4
6
8
10
12
14
1
109
217
325
433
541
649
757
865
973
1081
1189
1297
1405
time / 2 [s]
volts poison
biomass
3 robots (C), 6/0607, growth 2
0
2
4
6
8
10
12
1
109
217
325
433
541
649
757
865
973
1081
1189
1297
1405
time / 2 [s]
volts poison
biomass
3 robots(C), 7/0607, growth 1
0
2
4
6
8
10
12
14
1
129
257
385
513
641
769
897
1025
1153
1281
1409
1537
1665
time / 2 [s]
volts poison
biomass
3 robots(C), 7/0607, growth 2
0
2
4
6
8
10
12
1
129
257
385
513
641
769
897
1025
1153
1281
1409
1537
1665
time / 2 [s]
volts poison
biomass
3 robots (C), 8/0607, growth 1
0
2
4
6
8
10
12
1
128
255
382
509
636
763
890
1017
1144
1271
1398
1525
1652
time / 2 [s]
volts poison
biomass
3 robots (C), 8/0607, growth 2
0
2
4
6
8
10
12
1
128
255
382
509
636
763
890
1017
1144
1271
1398
1525
1652
time / 2 [s]
volts poison
biomass
3 robots (C), 9/0607, growth 1
02
468
1012
1416
1
122
243
364
485
606
727
848
969
1090
1211
1332
1453
1574
time / 2 [s]
volts poison
biomass
3 robots (C), 9/0607, growth 2
0
2
4
6
8
10
12
1
122
243
364
485
606
727
848
969
1090
1211
1332
1453
1574
time / 2 [s]
volts poison
biomass
3 robots (C), 10/0607, growth 1
0
2
4
6
8
10
12
14
1
129
257
385
513
641
769
897
1025
1153
1281
1409
1537
1665
time / 2 [s]
volts poison
biomass
3 robots (C), 10/0607, growth 2
02
468
1012
1416
1
129
257
385
513
641
769
897
1025
1153
1281
1409
1537
1665
time / 2 [s]
volts poison
biomass

Appendix I Tests from Experiment Series I (3 robots, C-type IRC) 3/3
3 robots (C), 1/0107, total
0
2
4
6
8
10
12
14
16
1
106
211
316
421
526
631
736
841
946
1051
1156
1261
1366
time / 2 [s]
volts poison
biomass
3 robots (C), 2/0107, total
0
2
4
6
8
10
12
14
16
1
133
265
397
529
661
793
925
1057
1189
1321
1453
1585
1717
time / 2 [s]
volts poison
biomass
3 robots (C), 3/0107, total
02468
101214161820
1
129
257
385
513
641
769
897
1025
1153
1281
1409
1537
1665
time / 2 [s]
volts poison
biomass
3 robots (C), 4/02.07, total
02468
1012141618
1
150
299
448
597
746
895
1044
1193
1342
1491
1640
1789
1938
time / 2 [s]
volts poison
biomass
3 robots (C), 5/0207, total
02468
1012141618
1
129
257
385
513
641
769
897
1025
1153
1281
1409
1537
1665
time / 2 [s]
volts poison
biomass
3 robots (C), 6/0607, total
0
5
10
15
20
1
109
217
325
433
541
649
757
865
973
1081
1189
1297
1405
time / 2 [s]
volts poison
biomass
3 robots(C), 7/0607, total
02
468
1012
1416
1
129
257
385
513
641
769
897
1025
1153
1281
1409
1537
1665
time / 2 [s]
volts poison
biomass
3 robots (C), 8/0607, total
02
468
1012
1416
1
128
255
382
509
636
763
890
1017
1144
1271
1398
1525
1652
time / 2 [s]
volts poison
biomass
3 robots (C), 9/0607, total
02
468
1012
1416
1
122
243
364
485
606
727
848
969
1090
1211
1332
1453
1574
time / 2 [s]
volts poison
biomass
3 robots (C), 10/0607, total
02
468
1012
1416
1
129
257
385
513
641
769
897
1025
1153
1281
1409
1537
1665
time / 2 [s]
volts poison
biomass

Appendix J Tests from Experiment Series I (5 robots, no IRC) 1/3
5 robots (NC), 1/1307, growth 1
0
2
4
6
8
10
12
14
16
1 70 139
208
277
346
415
484
553
622
691
760
829
898
time / 2 [s]
volts poison
biomass
5 robots (NC), 1/1307, growth 2
0
2
4
6
8
10
12
14
1 70 139
208
277
346
415
484
553
622
691
760
829
898
time / 2 [s]
volts poison
biomass
5 robots (NC), 2/1307, growth 1
0
2
4
6
8
10
12
14
1 67 133
199
265
331
397
463
529
595
661
727
793
859
time / 2 [s]
volts poison
biomass
5 robots (NC), 2/1307, growth 2
0
2
4
6
8
10
12
1 67 133
199
265
331
397
463
529
595
661
727
793
859
time / 2 [s]
volts poison
biomass
5 robots (NC), 3/1307, growth 1
0
2
4
6
8
10
12
14
1 61 121
181
241
301
361
421
481
541
601
661
721
781
time / 2 [s]
volts poison
biomass
5 robots (NC), 3/1307, growth 2
0
2
4
6
8
10
12
1 61 121
181
241
301
361
421
481
541
601
661
721
781
time / 2 [s]
volts poison
biomass
5 robots (NC), 4/1307, growth 1
02468
1012141618
1 85 169
253
337
421
505
589
673
757
841
925
1009
1093
time / 2 [s]
volts poison
biomass
5 robots (NC), 4/1307, growth 2
02468
1012141618
1 85 169
253
337
421
505
589
673
757
841
925
1009
1093
time / 2 [s]
volts poison
biomass
5 robots (NC), 5/1407, growth 1
02468
1012141618
1 65 129
193
257
321
385
449
513
577
641
705
769
833
time / 2 [s]
volts poison
biomass
5 robots (NC), 5/1407, growth 2
02468
1012141618
1 65 129
193
257
321
385
449
513
577
641
705
769
833
time / 2 [s]
volts poison
biomass

Appendix J Tests from Experiment Series I (5 robots, no IRC) 2/3
5 robots (NC), 6/1407, growth 1
0
2
4
6
8
10
12
14
16
1 69 137
205
273
341
409
477
545
613
681
749
817
885
time / 2 [s]
volts poison
biomass
5 robots (NC), 6/1407, growth 2
02468
1012141618
1 69 137
205
273
341
409
477
545
613
681
749
817
885
time / 2 [s]
volts poison
biomass
5 robots (NC), 7/1407, growth 1
0
5
10
15
20
1
100
199
298
397
496
595
694
793
892
991
1090
1189
1288
time / 2 [s]
volts poison
biomass
5 robots (NC), 7/1407, growth 2
0
5
10
15
20
25
1
100
199
298
397
496
595
694
793
892
991
1090
1189
1288
time / 2 [s]
volts poison
biomass
5 robots (NC), 8/1407, growth 1
0
2
4
6
8
10
12
14
16
1 75 149
223
297
371
445
519
593
667
741
815
889
963
time / 2 [s]
volts poison
biomass
5 robots (NC), 8/1407, growth 2
0
2
4
6
8
10
12
14
1 75 149
223
297
371
445
519
593
667
741
815
889
963
time / 2 [s]
volts poison
biomass
5 robots (NC), 9/1407, growth 1
0
2
4
6
8
10
12
1 58 115
172
229
286
343
400
457
514
571
628
685
742
time / 2 [s]
volts poison
biomass
5 robots (NC), 9/1407, growth 2
0
2
4
6
8
10
12
1 58 115
172
229
286
343
400
457
514
571
628
685
742
time / 2 [s]
volts poison
biomass
5 robots (NC), 10/1407, growth 1
0
2
4
6
8
10
12
14
16
1 59 117
175
233
291
349
407
465
523
581
639
697
755
time / 2 [s]
volts poison
biomass
5 robots (NC), 10/1407, growth 2
02468
1012141618
1 59 117
175
233
291
349
407
465
523
581
639
697
755
time / 2 [s]
volts poison
biomass

Appendix J Tests from Experiment Series I (5 robots, no IRC) 3/3
5 robots (NC), 1/1307, total
0
2
4
6
8
10
12
14
16
1 70 139
208
277
346
415
484
553
622
691
760
829
898
time / 2 [s]
volts poison
biomass
5 robots (NC), 2/1307, total
0
5
10
15
20
1 67 133
199
265
331
397
463
529
595
661
727
793
859
time / 2 [s]
volts poison
biomass
5 robots (NC), 3/1307, total
0
2
4
6
8
10
12
14
1 61 121
181
241
301
361
421
481
541
601
661
721
781
time / 2 [s]
volts poison
biomass
5 robots (NC), 4/1307, total
02468
1012141618
1 85 169
253
337
421
505
589
673
757
841
925
1009
1093
time / 2 [s]
volts poison
biomass
5 robots (NC), 5/1407, total
02468
1012141618
1 65 129
193
257
321
385
449
513
577
641
705
769
833
time / 2 [s]
volts poison
biomass
5 robots (NC), 6/1407, total
02468
1012141618
1 69 137
205
273
341
409
477
545
613
681
749
817
885
time / 2 [s]
volts poison
biomass
5 robots (NC), 7/1407, total
0
5
10
15
20
25
1
100
199
298
397
496
595
694
793
892
991
1090
1189
1288
time / 2 [s]
volts poison
biomass
5 robots (NC), 8/1407, total
0
2
4
6
8
10
12
14
16
1 75 149
223
297
371
445
519
593
667
741
815
889
963
time / 2 [s]
volts poison
biomass
5 robots (NC), 9/1407, total
0
2
4
6
8
10
12
1 58 115
172
229
286
343
400
457
514
571
628
685
742
time / 2 [s]
volts poison
biomass
5 robots (NC), 10/1407, total
02468
1012141618
1 59 117
175
233
291
349
407
465
523
581
639
697
755
time / 2 [s]
volts poison
biomass

Appendix K Tests from Experiment Series I (5 robots, C-type IRC) 1/3
5 robots (C), 1/0707, growth 1
0
2
4
6
8
10
12
14
1 92 183
274
365
456
547
638
729
820
911
1002
1093
1184
time / 2 [s]
volts poison
biomass
5 robots (C), 1/0707, growth 2
02468
1012141618
1 92 183
274
365
456
547
638
729
820
911
1002
1093
1184
time / 2 [s]
volts poison
biomass
3 robots (C), 2/0707, growth 1
0
2
4
6
8
10
12
14
16
1 59 117
175
233
291
349
407
465
523
581
639
697
755
time / 2 [s]
volts poison
biomass
3 robots (C), 2/0707, growth 2
0
2
4
6
8
10
12
1 59 117
175
233
291
349
407
465
523
581
639
697
755
time / 2 [s]
volts poison
biomass
5 robots (C), 3/1207, growth 1
0
2
4
6
8
10
12
14
1
105
209
313
417
521
625
729
833
937
1041
1145
1249
1353
time / 2 [s]
volts poison
biomass
5 robots (C), 3/1207, growth 2
0
2
4
6
8
10
12
1
105
209
313
417
521
625
729
833
937
1041
1145
1249
1353
time / 2 [s]
volts poison
biomass
5 robots, (C), 4/11.07, growth 1
0
2
4
6
8
10
12
14
1 47 93 139
185
231
277
323
369
415
461
507
553
599
time / 2 [s]
volts poison
biomass
5 robots, (C), 4/11.07, growth 2
02468
1012141618
1 47 93 139
185
231
277
323
369
415
461
507
553
599
time / 2 [s]
volts poison
biomass
5 robots (C), 5/1207, growth 1
02
468
1012
1416
1 88 175
262
349
436
523
610
697
784
871
958
1045
1132
time / 2 [s]
volts poison
biomass
5 robots (C), 5/1207, growth 2
0
2
4
6
8
10
12
1 88 175
262
349
436
523
610
697
784
871
958
1045
1132
time / 2 [s]
volts poison
biomass

Appendix K Tests from Experiment Series I (5 robots, C-type IRC) 2/3
5 robots (C), 6/1207, growth 1
0
2
4
6
8
10
12
1 54 107
160
213
266
319
372
425
478
531
584
637
690
time / 2 [s]
volts poison
biomass
5 robots (C), 6/1207, growth 2
0
2
4
6
8
10
12
1 54 107
160
213
266
319
372
425
478
531
584
637
690
time / 2 [s]
volts poison
biomass
5 robots (C), 7/1207, growth 1
02
468
1012
1416
1 84 167
250
333
416
499
582
665
748
831
914
997
1080
time / 2 [s]
volts poison
biomass
5 robots (C), 7/1207, growth 2
0
2
4
6
8
10
12
1 84 167
250
333
416
499
582
665
748
831
914
997
1080
time / 2 [s]
volts poison
biomass
5 robots (C), 8/1207, growth 1
0
2
4
6
8
10
12
14
1 67 133
199
265
331
397
463
529
595
661
727
793
859
time / 2 [s]
volts poison
biomass
5 robots (C), 8/1207, growth 2
0
2
4
6
8
10
12
14
16
1 67 133
199
265
331
397
463
529
595
661
727
793
859
time / 2 [s]
volts poison
biomass
5 robots (C), 9/1307, growth 1
02
468
1012
1416
1 93 185
277
369
461
553
645
737
829
921
1013
1105
1197
time / 2 [s]
volts poison
biomass
5 robots (C), 9/1307, growth 2
02
468
1012
1416
1 93 185
277
369
461
553
645
737
829
921
1013
1105
1197
time / 2 [s]
volts poison
biomass
5 robots (C), 10/1307, growth 1
0
2
4
6
8
10
12
14
16
1 66 131
196
261
326
391
456
521
586
651
716
781
846
time / 2 [s]
volts poison
biomass
5 robots (C), 10/1307, growth 2
0
2
4
6
8
10
12
14
1 66 131
196
261
326
391
456
521
586
651
716
781
846
time / 2 [s]
volts poison
biomass
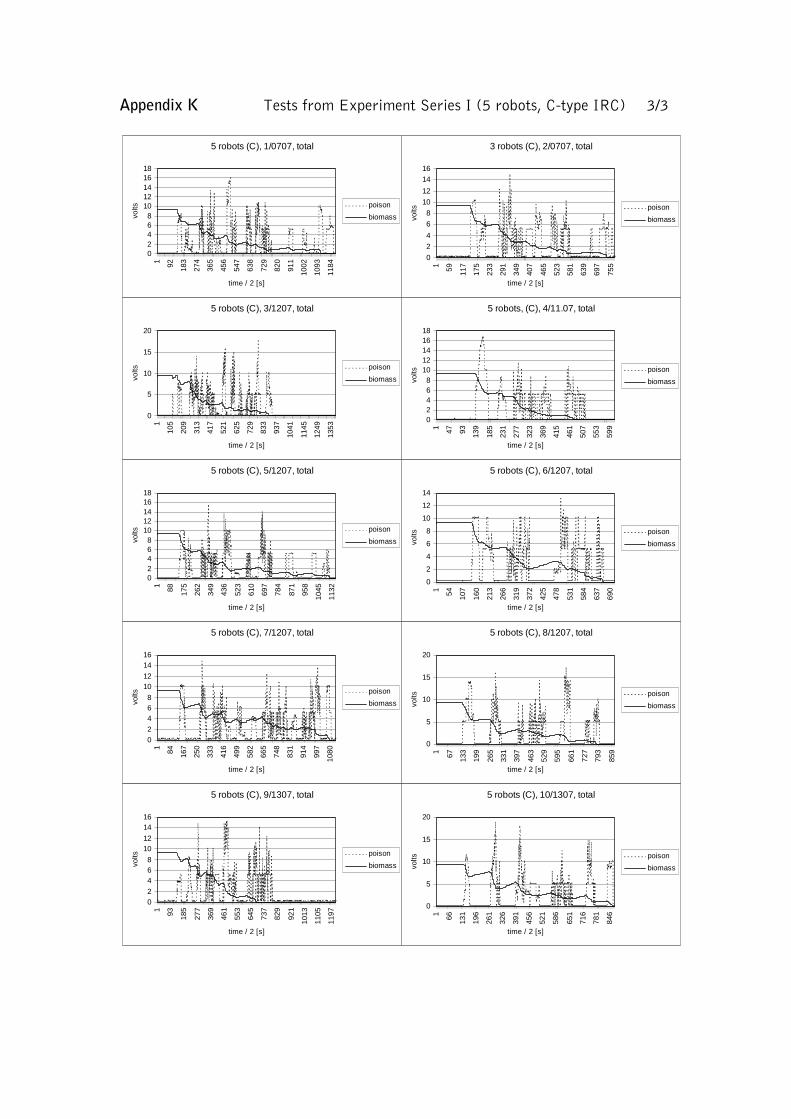
Appendix K Tests from Experiment Series I (5 robots, C-type IRC) 3/3
5 robots (C), 1/0707, total
02468
1012141618
1 92 183
274
365
456
547
638
729
820
911
1002
1093
1184
time / 2 [s]
volts poison
biomass
3 robots (C), 2/0707, total
0
2
4
6
8
10
12
14
16
1 59 117
175
233
291
349
407
465
523
581
639
697
755
time / 2 [s]
volts poison
biomass
5 robots (C), 3/1207, total
0
5
10
15
20
1
105
209
313
417
521
625
729
833
937
1041
1145
1249
1353
time / 2 [s]
volts poison
biomass
5 robots, (C), 4/11.07, total
02468
1012141618
1 47 93 139
185
231
277
323
369
415
461
507
553
599
time / 2 [s]
volts poison
biomass
5 robots (C), 5/1207, total
02468
1012141618
1 88 175
262
349
436
523
610
697
784
871
958
1045
1132
time / 2 [s]
volts poison
biomass
5 robots (C), 6/1207, total
0
2
4
6
8
10
12
14
1 54 107
160
213
266
319
372
425
478
531
584
637
690
time / 2 [s]
volts poison
biomass
5 robots (C), 7/1207, total
02
468
1012
1416
1 84 167
250
333
416
499
582
665
748
831
914
997
1080
time / 2 [s]
volts poison
biomass
5 robots (C), 8/1207, total
0
5
10
15
20
1 67 133
199
265
331
397
463
529
595
661
727
793
859
time / 2 [s]
volts poison
biomass
5 robots (C), 9/1307, total
02
468
1012
1416
1 93 185
277
369
461
553
645
737
829
921
1013
1105
1197
time / 2 [s]
volts poison
biomass
5 robots (C), 10/1307, total
0
5
10
15
20
1 66 131
196
261
326
391
456
521
586
651
716
781
846
time / 2 [s]
volts poison
biomass

Appendix L Tests from Experiment Series I (5 robots, CC-type IRC) 1/3
5 robots (CC), 1/2007, growth 1
0
5
10
15
20
25
1 57 113
169
225
281
337
393
449
505
561
617
673
729
time / 2 [s]
volts poison
biomass
5 robots (CC), 1/2007, growth 2
02468
10121416
1 57 113
169
225
281
337
393
449
505
561
617
673
729
time / 2 [s]
volts poison
biomass
5 robots (CC), 2/2107, growth 1
0
2
4
6
8
10
12
14
1 54 107
160
213
266
319
372
425
478
531
584
637
690
time / 2 [s]
volts poison
biomass
5 robots (CC), 2/2107, growth 2
0
2
4
6
8
10
12
14
1 54 107
160
213
266
319
372
425
478
531
584
637
690
time / 2 [s]
volts poison
biomass
5 robots (CC), 3/2007, growth 1
0
5
10
15
20
1 71 141
211
281
351
421
491
561
631
701
771
841
911
time / 2 [s]
volts poison
biomass
5 robots (CC), 3/2007, growth 2
0
2
4
6
8
10
12
1 71 141
211
281
351
421
491
561
631
701
771
841
911
time / 2 [s]
volts poison
biomass
5 robots (CC), 4/2007, growth 1
0
5
10
15
1 68 135
202
269
336
403
470
537
604
671
738
805
872
time / 2 [s]
volts poison
biomass
5 robots (CC), 4/2007, growth 2
02468
10
1214
1 68 135
202
269
336
403
470
537
604
671
738
805
872
time / 2 [s]
volts poison
biomass
5 robots (CC), 5/2107, growth 1
02468
101214
1 45 89 133
177
221
265
309
353
397
441
485
529
573
time / 2 [s]
volts poison
biomass
5 robots (CC), 5/2107, growth 2
02468
10
1214
1 45 89 133
177
221
265
309
353
397
441
485
529
573
time / 2 [s]
volts poison
biomass

Appendix L Tests from Experiment Series I (5 robots, CC-type IRC) 2/3
5 robots (CC), 6/21.07, growth 1
0
5
10
15
20
1 91 181
271
361
451
541
631
721
811
901
991
1081
1171
time / 2 [s]
volts poison
biomass
5 robots (CC), 6/21.07, growth 2
02468
10121416
1 91 181
271
361
451
541
631
721
811
901
991
1081
1171
time / 2 [s]
volts poison
biomass
5 robots (CC), 7/2107, growth 1
0
2
4
6
8
10
12
1 68 135
202
269
336
403
470
537
604
671
738
805
872
time / 2 [s]
volts poison
biomass
5 robots (CC), 7/2107, growth 2
02468
10121416
1 68 135
202
269
336
403
470
537
604
671
738
805
872
time / 2 [s]
volts poison
biomass
5 robots (CC), 8/2107, growth 1
0
2
4
6
8
10
12
14
16
1 72 143
214
285
356
427
498
569
640
711
782
853
924
time / 2 [s]
volts poison
biomass
5 robots (CC), 8/2107, growth 2
0
2
4
6
8
10
12
1 72 143
214
285
356
427
498
569
640
711
782
853
924
time / 2 [s]
volts poison
biomass
5 robots (CC), 9/2207, growth 1
0
2
4
6
8
10
12
1 63 125
187
249
311
373
435
497
559
621
683
745
807
time / 2 [s]
volts poison
biomass
5 robots (CC), 9/2207, growth 2
0
2
4
6
8
10
12
1 63 125
187
249
311
373
435
497
559
621
683
745
807
time / 2 [s]
volts poison
biomass
5 robots (CC), 10/2307, growth 1
0
2
4
6
8
10
12
14
16
1 74 147
220
293
366
439
512
585
658
731
804
877
950
time / 2 [s]
volts poison
biomass
5 robots (CC), 10/2307, growth 2
0
2
4
6
8
10
12
1 74 147
220
293
366
439
512
585
658
731
804
877
950
time / 2 [s]
volts poison
biomass

Appendix L Tests from Experiment Series I (5 robots, CC-type IRC) 3/3
5 robots (CC), 1/2007, total
0
5
10
15
20
25
1 57 113
169
225
281
337
393
449
505
561
617
673
729
time / 2 [s]
volts poison
biomass
5 robots (CC), 2/2107, total
0
2
4
6
8
10
12
14
1 54 107
160
213
266
319
372
425
478
531
584
637
690
time / 2 [s]
volts poison
biomass
5 robots (CC), 3/2007, total
02468
10121416
1 71 141
211
281
351
421
491
561
631
701
771
841
911
time / 2 [s]
volts poison
biomass
5 robots (CC), 4/2007, total
0
5
10
15
20
1 68 135
202
269
336
403
470
537
604
671
738
805
872
time / 2 [s]
volts poison
biomass
5 robots (CC), 5/2107, total
0
5
10
15
20
1 45 89 133
177
221
265
309
353
397
441
485
529
573
time / 2 [s]
volts poison
biomass
5 robots (CC), 6/21.07, total
02468
10121416
1 91 181
271
361
451
541
631
721
811
901
991
1081
1171
time / 2 [s]
volts poison
biomass
5 robots (CC), 7/2107, total
02468
10121416
1 68 135
202
269
336
403
470
537
604
671
738
805
872
time / 2 [s]
volts poison
biomass
5 robots (CC), 8/2107, total
0
5
10
15
20
25
1 72 143
214
285
356
427
498
569
640
711
782
853
924
time / 2 [s]
volts poison
biomass
5 robots (CC), 9/2207, total
0
5
10
15
20
1 63 125
187
249
311
373
435
497
559
621
683
745
807
time / 2 [s]
volts poison
biomass
5 robots (CC), 10/2307, total
02468
1012141618
1 74 147
220
293
366
439
512
585
658
731
804
877
950
time / 2 [s]
volts poison
biomass

Appendix M Tests from Experiment Series II (3 robots, no IRC) 1/4
3 robots (nc), run 1, growth 1
0
1
2
3
4
5
1 8 15 22 29 36 43 50 57 64 71 78 85 92 99 106
113
120
time / 2 [min]
biom
ass
0
200
400
600
800
1000
3 robots (nc), run 1, growth 2
0
1
2
3
4
5
1 8 15 22 29 36 43 50 57 64 71 78 85 92 99 106
113
120
time / 2 [min]
biom
ass
0
200
400
600
800
1000
3 robots (nc), run 2, growth 1
0
1
2
3
4
5
1 8 15 22 29 36 43 50 57 64 71 78 85 92 99 106
113
120
time / 2 [min]
biom
ass
0
200
400
600
800
1000
3 robots (nc), run 2, growth 2
0
1
2
3
4
5
1 8 15 22 29 36 43 50 57 64 71 78 85 92 99 106
113
120
time / 2 [min]
biom
ass
0
200
400
600
800
1000
3 robots (nc), run 3, growth 1
0
1
2
3
4
5
1 8 15 22 29 36 43 50 57 64 71 78 85 92 99 106
113
120
time / 2 [min]
biom
ass
0
200
400
600
800
1000
3 robots (nc), run 3, growth 2
0
1
2
3
4
5
1 8 15 22 29 36 43 50 57 64 71 78 85 92 99 106
113
120
time / 2 [min]
biom
ass
0
200
400
600
800
1000
3 robots (nc), run 4, growth 1
0
1
2
3
4
5
1 8 15 22 29 36 43 50 57 64 71 78 85 92 99 106
113
120
time / 2 [min]
biom
ass
0
200
400
600
800
1000
3 robots (nc), run 4, growth 2
0
1
2
3
4
5
1 8 15 22 29 36 43 50 57 64 71 78 85 92 99 106
113
120
time / 2 [min]
biom
ass
0
200
400
600
800
1000
3 robots (nc), run 5, growth 1
0
1
2
3
4
5
1 8 15 22 29 36 43 50 57 64 71 78 85 92 99 106
113
120
time / 2 [min]
biom
ass
0
200
400
600
800
1000
3 robots (nc), run 5, growth 2
0
1
2
3
4
5
1 8 15 22 29 36 43 50 57 64 71 78 85 92 99 106
113
120
time / 2 [min]
biom
ass
0
200
400
600
800
1000

Appendix M Tests from Experiment Series II (3 robots, no IRC) 2/4
3 robots (nc), run 6, growth 1
0
1
2
3
4
5
1 8 15 22 29 36 43 50 57 64 71 78 85 92 99 106
113
120
time / 2 [min]
biom
ass
0
200
400
600
800
1000
3 robots (nc), run 6, growth 2
0
1
2
3
4
5
1 8 15 22 29 36 43 50 57 64 71 78 85 92 99 106
113
120
time / 2 [min]
biom
ass
0
200
400
600
800
1000
3 robots (nc), run 7, growth 1
0
1
2
3
4
5
1 8 15 22 29 36 43 50 57 64 71 78 85 92 99 106
113
120
time / 2 [min]
biom
ass
0
200
400
600
800
1000
3 robots (nc), run 7, growth 2
0
1
2
3
4
5
1 8 15 22 29 36 43 50 57 64 71 78 85 92 99 106
113
120
time / 2 [min]
biom
ass
0
200
400
600
800
1000
3 robots (nc), run 8, growth 1
0
1
2
3
4
5
1 8 15 22 29 36 43 50 57 64 71 78 85 92 99 106
113
120
time / 2 [min]
biom
ass
0
200
400
600
800
1000
3 robots (nc), run 8, growth 2
0
1
2
3
4
5
1 8 15 22 29 36 43 50 57 64 71 78 85 92 99 106
113
120
time / 2 [min]
biom
ass
0
200
400
600
800
1000
3 robots (nc), run 9, growth 1
0
1
2
3
4
5
1 8 15 22 29 36 43 50 57 64 71 78 85 92 99 106
113
120
time / 2 [min]
biom
ass
0
200
400
600
800
1000
3 robots (nc), run 9, growth 2
0
1
2
3
4
5
1 8 15 22 29 36 43 50 57 64 71 78 85 92 99 106
113
120
time / 2 [min]
biom
ass
0
200
400
600
800
1000
3 robots (nc), run 10, growth 1
0
1
2
3
4
5
1 8 15 22 29 36 43 50 57 64 71 78 85 92 99 106
113
120
time / 2 [min]
biom
ass
0
200
400
600
800
1000
3 robots (nc), run 10, growth 2
0
1
2
3
4
5
1 8 15 22 29 36 43 50 57 64 71 78 85 92 99 106
113
120
time / 2 [min]
biom
ass
0
200
400
600
800
1000
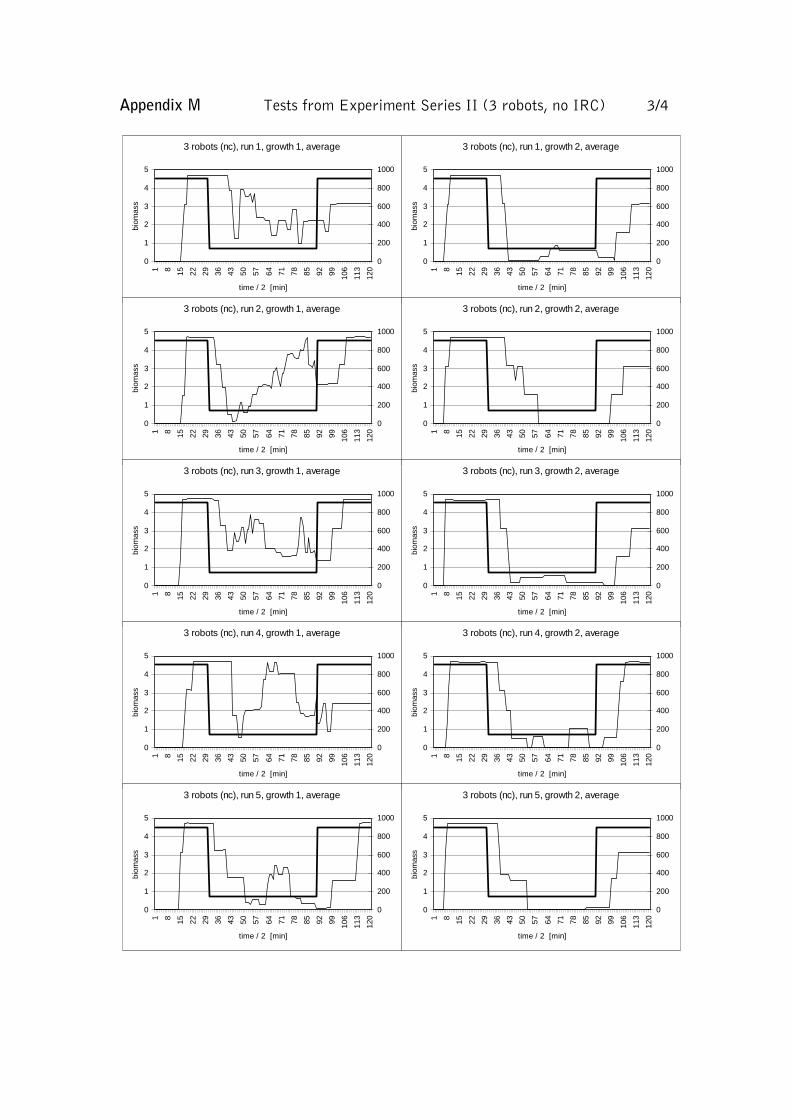
Appendix M Tests from Experiment Series II (3 robots, no IRC) 3/4
3 robots (nc), run 1, growth 1, average
0
1
2
3
4
5
1 8 15 22 29 36 43 50 57 64 71 78 85 92 99 106
113
120
time / 2 [min]
biom
ass
0
200
400
600
800
1000
3 robots (nc), run 1, growth 2, average
0
1
2
3
4
5
1 8 15 22 29 36 43 50 57 64 71 78 85 92 99 106
113
120
time / 2 [min]
biom
ass
0
200
400
600
800
1000
3 robots (nc), run 2, growth 1, average
0
1
2
3
4
5
1 8 15 22 29 36 43 50 57 64 71 78 85 92 99 106
113
120
time / 2 [min]
biom
ass
0
200
400
600
800
1000
3 robots (nc), run 2, growth 2, average
0
1
2
3
4
5
1 8 15 22 29 36 43 50 57 64 71 78 85 92 99 106
113
120
time / 2 [min]
biom
ass
0
200
400
600
800
1000
3 robots (nc), run 3, growth 1, average
0
1
2
3
4
5
1 8 15 22 29 36 43 50 57 64 71 78 85 92 99 106
113
120
time / 2 [min]
biom
ass
0
200
400
600
800
1000
3 robots (nc), run 3, growth 2, average
0
1
2
3
4
5
1 8 15 22 29 36 43 50 57 64 71 78 85 92 99 106
113
120
time / 2 [min]
biom
ass
0
200
400
600
800
1000
3 robots (nc), run 4, growth 1, average
0
1
2
3
4
5
1 8 15 22 29 36 43 50 57 64 71 78 85 92 99 106
113
120
time / 2 [min]
biom
ass
0
200
400
600
800
1000
3 robots (nc), run 4, growth 2, average
0
1
2
3
4
5
1 8 15 22 29 36 43 50 57 64 71 78 85 92 99 106
113
120
time / 2 [min]
biom
ass
0
200
400
600
800
1000
3 robots (nc), run 5, growth 1, average
0
1
2
3
4
5
1 8 15 22 29 36 43 50 57 64 71 78 85 92 99 106
113
120
time / 2 [min]
biom
ass
0
200
400
600
800
1000
3 robots (nc), run 5, growth 2, average
0
1
2
3
4
5
1 8 15 22 29 36 43 50 57 64 71 78 85 92 99 106
113
120
time / 2 [min]
biom
ass
0
200
400
600
800
1000

Appendix M Tests from Experiment Series II (3 robots, no IRC) 4/4
3 robots (nc), run 6, growth 1, average
0
1
2
3
4
5
1 8 15 22 29 36 43 50 57 64 71 78 85 92 99 106
113
120
time / 2 [min]
biom
ass
0
200
400
600
800
1000
3 robots (nc), run 6, growth 2, average
0
1
2
3
4
5
1 8 15 22 29 36 43 50 57 64 71 78 85 92 99 106
113
120
time / 2 [min]
biom
ass
0
200
400
600
800
1000
3 robots (nc), run 7, growth 1, average
0
1
2
3
4
5
1 8 15 22 29 36 43 50 57 64 71 78 85 92 99 106
113
120
time / 2 [min]
biom
ass
0
200
400
600
800
1000
3 robots (nc), run 7, growth 2, average
0
1
2
3
4
5
1 8 15 22 29 36 43 50 57 64 71 78 85 92 99 106
113
120
time / 2 [min]
biom
ass
0
200
400
600
800
1000
3 robots (nc), run 8, growth 1, average
0
1
2
3
4
5
1 8 15 22 29 36 43 50 57 64 71 78 85 92 99 106
113
120
time / 2 [min]
biom
ass
0
200
400
600
800
1000
3 robots (nc), run 8, growth 2, average
0
1
2
3
4
5
1 8 15 22 29 36 43 50 57 64 71 78 85 92 99 106
113
120
time / 2 [min]
biom
ass
0
200
400
600
800
1000
3 robots (nc), run 9, growth 1, average
0
1
2
3
4
5
1 8 15 22 29 36 43 50 57 64 71 78 85 92 99 106
113
120
time / 2 [min]
biom
ass
0
200
400
600
800
1000
3 robots (nc), run 9, growth 2, average
0
1
2
3
4
5
1 8 15 22 29 36 43 50 57 64 71 78 85 92 99 106
113
120
time / 2 [min]
biom
ass
0
200
400
600
800
1000
3 robots (nc), run 10, growth 1, average
0
1
2
3
4
5
1 8 15 22 29 36 43 50 57 64 71 78 85 92 99 106
113
120
time / 2 [min]
biom
ass
0
200
400
600
800
1000
3 robots (nc), run 10, growth 2, average
0
1
2
3
4
5
1 8 15 22 29 36 43 50 57 64 71 78 85 92 99 106
113
120
time / 2 [min]
biom
ass
0
200
400
600
800
1000

Appendix N Tests from Experiment Series II (3 robots, IRC) 1/4
3 robots (cc), run 1, growth 1
0
1
2
3
4
5
1 8 15 22 29 36 43 50 57 64 71 78 85 92 99 106
113
120
time / 2 [min]
biom
ass
0
200
400
600
800
1000
3 robots (cc), run 1, growth 2
0
1
2
3
4
5
1 8 15 22 29 36 43 50 57 64 71 78 85 92 99 106
113
120
time / 2 [min]
biom
ass
0
200
400
600
800
1000
3 robots (cc), run 2, growth 1
0
1
2
3
4
5
1 8 15 22 29 36 43 50 57 64 71 78 85 92 99 106
113
120
time / 2 [min]
biom
ass
0
200
400
600
800
1000
3 robots (cc), run 2, growth 2
0
1
2
3
4
5
1 8 15 22 29 36 43 50 57 64 71 78 85 92 99 106
113
120
time / 2 [min]
biom
ass
0
200
400
600
800
1000
3 robots (cc), run 3, growth 1
0
1
2
3
4
5
1 8 15 22 29 36 43 50 57 64 71 78 85 92 99 106
113
120
time / 2 [min]
biom
ass
0
200
400
600
800
1000
3 robots (cc), run 3, growth 2
0
1
2
3
4
5
1 8 15 22 29 36 43 50 57 64 71 78 85 92 99 106
113
120
time / 2 [min]
biom
ass
0
200
400
600
800
1000
3 robots (cc), run 4, growth 1
0
1
2
3
4
5
1 8 15 22 29 36 43 50 57 64 71 78 85 92 99 106
113
120
time / 2 [min]
biom
ass
0
200
400
600
800
1000
3 robots (cc), run 4, growth 2
0
1
2
3
4
5
1 8 15 22 29 36 43 50 57 64 71 78 85 92 99 106
113
120
time / 2 [min]
biom
ass
0
200
400
600
800
1000
3 robots (cc), run 5, growth 1
0
1
2
3
4
5
1 8 15 22 29 36 43 50 57 64 71 78 85 92 99 106
113
120
time / 2 [min]
biom
ass
0
200
400
600
800
1000
3 robots (cc), run 5, growth 2
0
1
2
3
4
5
1 8 15 22 29 36 43 50 57 64 71 78 85 92 99 106
113
120
time / 2 [min]
biom
ass
0
200
400
600
800
1000

Appendix N Tests from Experiment Series II (3 robots, IRC) 2/4
3 robots (cc), run 6, growth 1
0
1
2
3
4
5
1 8 15 22 29 36 43 50 57 64 71 78 85 92 99 106
113
120
time / 2 [min]
biom
ass
0
200
400
600
800
1000
3 robots (cc), run 6, growth 2
0
1
2
3
4
5
1 8 15 22 29 36 43 50 57 64 71 78 85 92 99 106
113
120
time / 2 [min]
biom
ass
0
200
400
600
800
1000
3 robots (cc), run 7, growth 1
0
1
2
3
4
5
1 8 15 22 29 36 43 50 57 64 71 78 85 92 99 106
113
120
time / 2 [min]
biom
ass
0
200
400
600
800
1000
3 robots (cc), run 7, growth 2
0
1
2
3
4
5
1 8 15 22 29 36 43 50 57 64 71 78 85 92 99 106
113
120
time / 2 [min]
biom
ass
0
200
400
600
800
1000
3 robots (cc), run 8, growth 1
0
1
2
3
4
5
1 8 15 22 29 36 43 50 57 64 71 78 85 92 99 106
113
120
time / 2 [min]
biom
ass
0
200
400
600
800
1000
3 robots (cc), run 8, growth 2
0
1
2
3
4
5
1 8 15 22 29 36 43 50 57 64 71 78 85 92 99 106
113
120
time / 2 [min]
biom
ass
0
200
400
600
800
1000
3 robots (cc), run 9, growth 1
0
1
2
3
4
5
1 8 15 22 29 36 43 50 57 64 71 78 85 92 99 106
113
120
time / 2 [min]
biom
ass
0
200
400
600
800
1000
3 robots (cc), run 9, growth 2
0
1
2
3
4
5
1 8 15 22 29 36 43 50 57 64 71 78 85 92 99 106
113
120
time / 2 [min]
biom
ass
0
200
400
600
800
1000
3 robots (cc), run 10, growth 1
0
1
2
3
4
5
1 8 15 22 29 36 43 50 57 64 71 78 85 92 99 106
113
120
time / 2 [min]
biom
ass
0
200
400
600
800
1000
3 robots (cc), run 10, growth 2
0
1
2
3
4
5
1 8 15 22 29 36 43 50 57 64 71 78 85 92 99 106
113
120
time / 2 [min]
biom
ass
0
200
400
600
800
1000
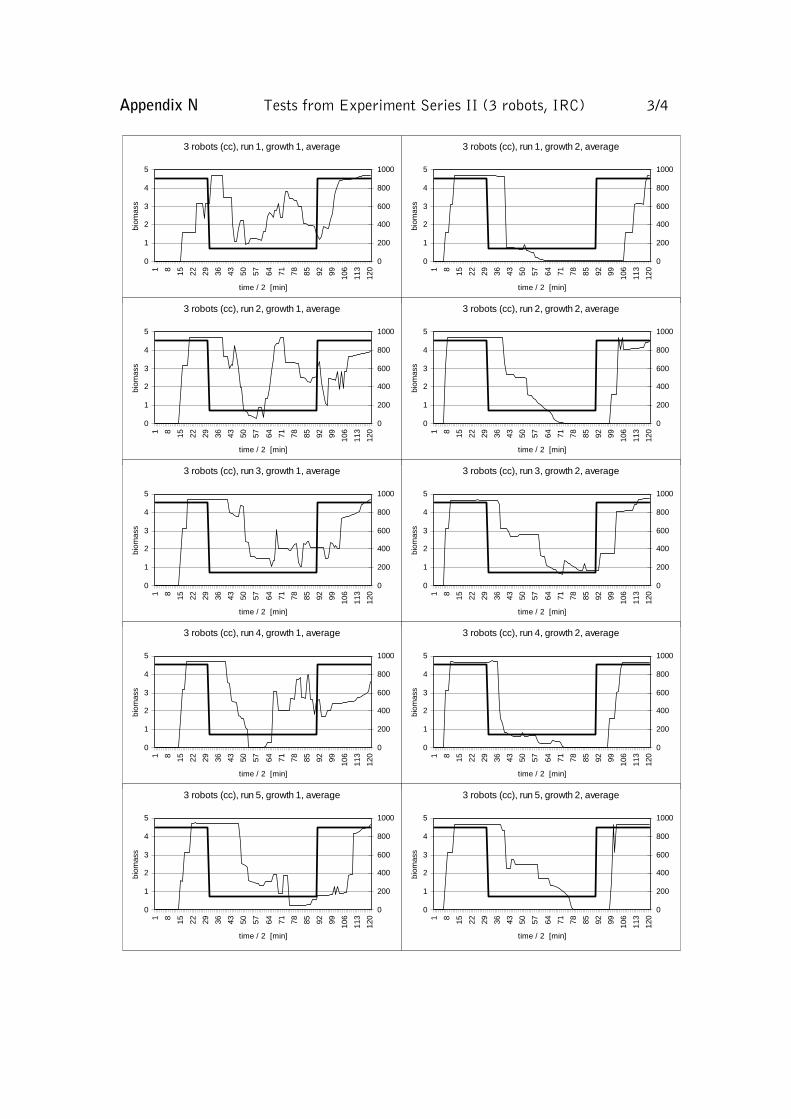
Appendix N Tests from Experiment Series II (3 robots, IRC) 3/4
3 robots (cc), run 1, growth 1, average
0
1
2
3
4
5
1 8 15 22 29 36 43 50 57 64 71 78 85 92 99 106
113
120
time / 2 [min]
biom
ass
0
200
400
600
800
1000
3 robots (cc), run 1, growth 2, average
0
1
2
3
4
5
1 8 15 22 29 36 43 50 57 64 71 78 85 92 99 106
113
120
time / 2 [min]
biom
ass
0
200
400
600
800
1000
3 robots (cc), run 2, growth 1, average
0
1
2
3
4
5
1 8 15 22 29 36 43 50 57 64 71 78 85 92 99 106
113
120
time / 2 [min]
biom
ass
0
200
400
600
800
1000
3 robots (cc), run 2, growth 2, average
0
1
2
3
4
5
1 8 15 22 29 36 43 50 57 64 71 78 85 92 99 106
113
120
time / 2 [min]
biom
ass
0
200
400
600
800
1000
3 robots (cc), run 3, growth 1, average
0
1
2
3
4
5
1 8 15 22 29 36 43 50 57 64 71 78 85 92 99 106
113
120
time / 2 [min]
biom
ass
0
200
400
600
800
1000
3 robots (cc), run 3, growth 2, average
0
1
2
3
4
5
1 8 15 22 29 36 43 50 57 64 71 78 85 92 99 106
113
120
time / 2 [min]
biom
ass
0
200
400
600
800
1000
3 robots (cc), run 4, growth 1, average
0
1
2
3
4
5
1 8 15 22 29 36 43 50 57 64 71 78 85 92 99 106
113
120
time / 2 [min]
biom
ass
0
200
400
600
800
1000
3 robots (cc), run 4, growth 2, average
0
1
2
3
4
5
1 8 15 22 29 36 43 50 57 64 71 78 85 92 99 106
113
120
time / 2 [min]
biom
ass
0
200
400
600
800
1000
3 robots (cc), run 5, growth 1, average
0
1
2
3
4
5
1 8 15 22 29 36 43 50 57 64 71 78 85 92 99 106
113
120
time / 2 [min]
biom
ass
0
200
400
600
800
1000
3 robots (cc), run 5, growth 2, average
0
1
2
3
4
5
1 8 15 22 29 36 43 50 57 64 71 78 85 92 99 106
113
120
time / 2 [min]
biom
ass
0
200
400
600
800
1000

Appendix N Tests from Experiment Series II (3 robots, IRC) 4/4
3 robots (cc), run 6, growth 1, average
0
1
2
3
4
5
1 8 15 22 29 36 43 50 57 64 71 78 85 92 99 106
113
120
time / 2 [min]
biom
ass
0
200
400
600
800
1000
3 robots (cc), run 6, growth 2, average
0
1
2
3
4
5
1 8 15 22 29 36 43 50 57 64 71 78 85 92 99 106
113
120
time / 2 [min]
biom
ass
0
200
400
600
800
1000
3 robots (cc), run 7, growth 1, average
0
1
2
3
4
5
1 8 15 22 29 36 43 50 57 64 71 78 85 92 99 106
113
120
time / 2 [min]
biom
ass
0
200
400
600
800
1000
3 robots (cc), run 7, growth 2, average
0
1
2
3
4
5
1 8 15 22 29 36 43 50 57 64 71 78 85 92 99 106
113
120
time / 2 [min]
biom
ass
0
200
400
600
800
1000
3 robots (cc), run 8, growth 1, average
0
1
2
3
4
5
1 8 15 22 29 36 43 50 57 64 71 78 85 92 99 106
113
120
time / 2 [min]
biom
ass
0
200
400
600
800
1000
3 robots (cc), run 8, growth 2, average
0
1
2
3
4
5
1 8 15 22 29 36 43 50 57 64 71 78 85 92 99 106
113
120
time / 2 [min]
biom
ass
0
200
400
600
800
1000
3 robots (cc), run 9, growth 1, average
0
1
2
3
4
5
1 8 15 22 29 36 43 50 57 64 71 78 85 92 99 106
113
120
time / 2 [min]
biom
ass
0
200
400
600
800
1000
3 robots (cc), run 9, growth 2, average
0
1
2
3
4
5
1 8 15 22 29 36 43 50 57 64 71 78 85 92 99 106
113
120
time / 2 [min]
biom
ass
0
200
400
600
800
1000
3 robots (cc), run 10, growth 1, average
0
1
2
3
4
5
1 8 15 22 29 36 43 50 57 64 71 78 85 92 99 106
113
120
time / 2 [min]
biom
ass
0
200
400
600
800
1000
3 robots (cc), run 10, growth 2, average
0
1
2
3
4
5
1 8 15 22 29 36 43 50 57 64 71 78 85 92 99 106
113
120
time / 2 [min]
biom
ass
0
200
400
600
800
1000

Appendix O Tests from Experiment Series II (5 robots, no IRC) 1/4
5 robots (nc), run 1, growth 1
0
1
2
3
4
5
1 8 15 22 29 36 43 50 57 64 71 78 85 92 99 106
113
120
time / 2 [min]
biom
ass
0
200
400
600
800
1000
5 robots (nc), run 1, growth 2
0
1
2
3
4
5
1 8 15 22 29 36 43 50 57 64 71 78 85 92 99 106
113
120
time / 2 [min]
biom
ass
0
200
400
600
800
1000
5 robots (nc), run 2, growth 1
0
1
2
3
4
5
1 8 15 22 29 36 43 50 57 64 71 78 85 92 99 106
113
120
time / 2 [min]
biom
ass
0
200
400
600
800
1000
5 robots (nc), run 2, growth 2
0
1
2
3
4
5
1 8 15 22 29 36 43 50 57 64 71 78 85 92 99 106
113
120
time / 2 [min]
biom
ass
0
200
400
600
800
1000
5 robots (nc), run 3, growth 1
0
1
2
3
4
5
1 8 15 22 29 36 43 50 57 64 71 78 85 92 99 106
113
120
time / 2 [min]
biom
ass
0
200
400
600
800
1000
5 robots (nc), run 3, growth 2
0
1
2
3
4
5
1 8 15 22 29 36 43 50 57 64 71 78 85 92 99 106
113
120
time / 2 [min]
biom
ass
0
200
400
600
800
1000
5 robots (nc), run 4, growth 1
0
1
2
3
4
5
1 8 15 22 29 36 43 50 57 64 71 78 85 92 99 106
113
120
time / 2 [min]
biom
ass
0
200
400
600
800
1000
5 robots (nc), run 4, growth 2
0
1
2
3
4
5
1 8 15 22 29 36 43 50 57 64 71 78 85 92 99 106
113
120
time / 2 [min]
biom
ass
0
200
400
600
800
1000
5 robots (nc), run 5, growth 1
0
1
2
3
4
5
1 8 15 22 29 36 43 50 57 64 71 78 85 92 99 106
113
120
time / 2 [min]
biom
ass
0
200
400
600
800
1000
5 robots (nc), run 5, growth 2
0
1
2
3
4
5
1 8 15 22 29 36 43 50 57 64 71 78 85 92 99 106
113
120
time / 2 [min]
biom
ass
0
200
400
600
800
1000

Appendix O Tests from Experiment Series II (5 robots, no IRC) 2/4
5 robots (nc), run 6, growth 1
0
1
2
3
4
5
1 8 15 22 29 36 43 50 57 64 71 78 85 92 99 106
113
120
time / 2 [min]
biom
ass
0
200
400
600
800
1000
5 robots (nc), run 6, growth 2
0
1
2
3
4
5
1 8 15 22 29 36 43 50 57 64 71 78 85 92 99 106
113
120
time / 2 [min]
biom
ass
0
200
400
600
800
1000
5 robots (nc), run 7, growth 1
0
1
2
3
4
5
1 8 15 22 29 36 43 50 57 64 71 78 85 92 99 106
113
120
time / 2 [min]
biom
ass
0
200
400
600
800
1000
5 robots (nc), run 7, growth 2
0
1
2
3
4
5
1 8 15 22 29 36 43 50 57 64 71 78 85 92 99 106
113
120
time / 2 [min]
biom
ass
0
200
400
600
800
1000
5 robots (nc), run 8, growth 1
0
1
2
3
4
5
1 8 15 22 29 36 43 50 57 64 71 78 85 92 99 106
113
120
time / 2 [min]
biom
ass
0
200
400
600
800
1000
5 robots (nc), run 8, growth 2
0
1
2
3
4
5
1 8 15 22 29 36 43 50 57 64 71 78 85 92 99 106
113
120
time / 2 [min]
biom
ass
0
200
400
600
800
1000
5 robots (nc), run 9, growth 1
0
1
2
3
4
5
1 8 15 22 29 36 43 50 57 64 71 78 85 92 99 106
113
120
time / 2 [min]
biom
ass
0
200
400
600
800
1000
5 robots (nc), run 9, growth 2
0
1
2
3
4
5
1 8 15 22 29 36 43 50 57 64 71 78 85 92 99 106
113
120
time / 2 [min]
biom
ass
0
200
400
600
800
1000
5 robots (nc), run 10, growth 1
0
1
2
3
4
5
1 8 15 22 29 36 43 50 57 64 71 78 85 92 99 106
113
120
time / 2 [min]
biom
ass
0
200
400
600
800
1000
5 robots (nc), run 10, growth 2
0
1
2
3
4
5
1 8 15 22 29 36 43 50 57 64 71 78 85 92 99 106
113
120
time / 2 [min]
biom
ass
0
200
400
600
800
1000

Appendix O Tests from Experiment Series II (5 robots, no IRC) 3/4
5 robots (nc), run 1, growth 1, average
0
1
2
3
4
5
1 8 15 22 29 36 43 50 57 64 71 78 85 92 99 106
113
120
time / 2 [min]
biom
ass
0
200
400
600
800
1000
5 robots (nc), run 1, growth 2, average
0
1
2
3
4
5
1 8 15 22 29 36 43 50 57 64 71 78 85 92 99 106
113
120
time / 2 [min]
biom
ass
0
200
400
600
800
1000
5 robots (nc), run 2, growth 1, average
0
1
2
3
4
5
1 8 15 22 29 36 43 50 57 64 71 78 85 92 99 106
113
120
time / 2 [min]
biom
ass
0
200
400
600
800
1000
5 robots (nc), run 2, growth 2, average
0
1
2
3
4
5
1 8 15 22 29 36 43 50 57 64 71 78 85 92 99 106
113
120
time / 2 [min]
biom
ass
0
200
400
600
800
1000
5 robots (nc), run 3, growth 1, average
0
1
2
3
4
5
1 8 15 22 29 36 43 50 57 64 71 78 85 92 99 106
113
120
time / 2 [min]
biom
ass
0
200
400
600
800
1000
5 robots (nc), run 3, growth 2, average
0
1
2
3
4
5
1 8 15 22 29 36 43 50 57 64 71 78 85 92 99 106
113
120
time / 2 [min]
biom
ass
0
200
400
600
800
1000
5 robots (nc), run 4, growth 1, average
0
1
2
3
4
5
1 8 15 22 29 36 43 50 57 64 71 78 85 92 99 106
113
120
time / 2 [min]
biom
ass
0
200
400
600
800
1000
5 robots (nc), run 4, growth 2, average
0
1
2
3
4
5
1 8 15 22 29 36 43 50 57 64 71 78 85 92 99 106
113
120
time / 2 [min]
biom
ass
0
200
400
600
800
1000
5 robots (nc), run 5, growth 1, average
0
1
2
3
4
5
1 8 15 22 29 36 43 50 57 64 71 78 85 92 99 106
113
120
time / 2 [min]
biom
ass
0
200
400
600
800
1000
5 robots (nc), run 5, growth 2, average
0
1
2
3
4
5
1 8 15 22 29 36 43 50 57 64 71 78 85 92 99 106
113
120
time / 2 [min]
biom
ass
0
200
400
600
800
1000

Appendix O Tests from Experiment Series II (5 robots, no IRC) 4/4
5 robots (nc), run 6, growth 1, average
0
1
2
3
4
5
1 8 15 22 29 36 43 50 57 64 71 78 85 92 99 106
113
120
time / 2 [min]
biom
ass
0
200
400
600
800
1000
5 robots (nc), run 6, growth 2, average
0
1
2
3
4
5
1 8 15 22 29 36 43 50 57 64 71 78 85 92 99 106
113
120
time / 2 [min]
biom
ass
0
200
400
600
800
1000
5 robots (nc), run 7, growth 1, average
0
1
2
3
4
5
1 8 15 22 29 36 43 50 57 64 71 78 85 92 99 106
113
120
time / 2 [min]
biom
ass
0
200
400
600
800
1000
5 robots (nc), run 7, growth 2, average
0
1
2
3
4
5
1 8 15 22 29 36 43 50 57 64 71 78 85 92 99 106
113
120
time / 2 [min]
biom
ass
0
200
400
600
800
1000
5 robots (nc), run 8, growth 1, average
0
1
2
3
4
5
1 8 15 22 29 36 43 50 57 64 71 78 85 92 99 106
113
120
time / 2 [min]
biom
ass
0
200
400
600
800
1000
5 robots (nc), run 8, growth 2, average
0
1
2
3
4
5
1 8 15 22 29 36 43 50 57 64 71 78 85 92 99 106
113
120
time / 2 [min]
biom
ass
0
200
400
600
800
1000
5 robots (nc), run 9, growth 1, average
0
1
2
3
4
5
1 8 15 22 29 36 43 50 57 64 71 78 85 92 99 106
113
120
time / 2 [min]
biom
ass
0
200
400
600
800
1000
5 robots (nc), run 9, growth 2, average
0
1
2
3
4
5
1 8 15 22 29 36 43 50 57 64 71 78 85 92 99 106
113
120
time / 2 [min]
biom
ass
0
200
400
600
800
1000
5 robots (nc), run 10, growth 1, average
0
1
2
3
4
5
1 8 15 22 29 36 43 50 57 64 71 78 85 92 99 106
113
120
time / 2 [min]
biom
ass
0
200
400
600
800
1000
5 robots (nc), run 10, growth 2, average
0
1
2
3
4
5
1 8 15 22 29 36 43 50 57 64 71 78 85 92 99 106
113
120
time / 2 [min]
biom
ass
0
200
400
600
800
1000
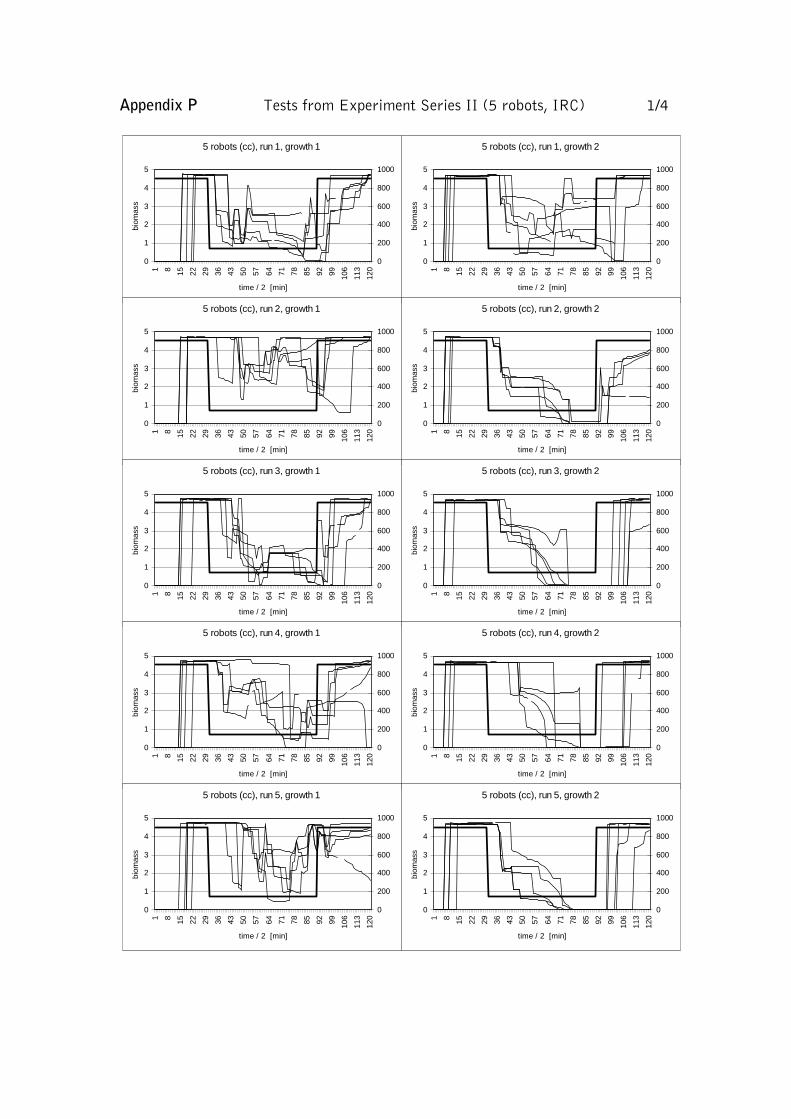
Appendix P Tests from Experiment Series II (5 robots, IRC) 1/4
5 robots (cc), run 1, growth 1
0
1
2
3
4
5
1 8 15 22 29 36 43 50 57 64 71 78 85 92 99 106
113
120
time / 2 [min]
biom
ass
0
200
400
600
800
1000
5 robots (cc), run 1, growth 2
0
1
2
3
4
5
1 8 15 22 29 36 43 50 57 64 71 78 85 92 99 106
113
120
time / 2 [min]
biom
ass
0
200
400
600
800
1000
5 robots (cc), run 2, growth 1
0
1
2
3
4
5
1 8 15 22 29 36 43 50 57 64 71 78 85 92 99 106
113
120
time / 2 [min]
biom
ass
0
200
400
600
800
1000
5 robots (cc), run 2, growth 2
0
1
2
3
4
5
1 8 15 22 29 36 43 50 57 64 71 78 85 92 99 106
113
120
time / 2 [min]
biom
ass
0
200
400
600
800
1000
5 robots (cc), run 3, growth 1
0
1
2
3
4
5
1 8 15 22 29 36 43 50 57 64 71 78 85 92 99 106
113
120
time / 2 [min]
biom
ass
0
200
400
600
800
1000
5 robots (cc), run 3, growth 2
0
1
2
3
4
5
1 8 15 22 29 36 43 50 57 64 71 78 85 92 99 106
113
120
time / 2 [min]
biom
ass
0
200
400
600
800
1000
5 robots (cc), run 4, growth 1
0
1
2
3
4
5
1 8 15 22 29 36 43 50 57 64 71 78 85 92 99 106
113
120
time / 2 [min]
biom
ass
0
200
400
600
800
1000
5 robots (cc), run 4, growth 2
0
1
2
3
4
5
1 8 15 22 29 36 43 50 57 64 71 78 85 92 99 106
113
120
time / 2 [min]
biom
ass
0
200
400
600
800
1000
5 robots (cc), run 5, growth 1
0
1
2
3
4
5
1 8 15 22 29 36 43 50 57 64 71 78 85 92 99 106
113
120
time / 2 [min]
biom
ass
0
200
400
600
800
1000
5 robots (cc), run 5, growth 2
0
1
2
3
4
5
1 8 15 22 29 36 43 50 57 64 71 78 85 92 99 106
113
120
time / 2 [min]
biom
ass
0
200
400
600
800
1000

Appendix P Tests from Experiment Series II (5 robots, IRC) 2/4
5 robots (cc), run 6, growth 1
0
1
2
3
4
5
1 8 15 22 29 36 43 50 57 64 71 78 85 92 99 106
113
120
time / 2 [min]
biom
ass
0
200
400
600
800
1000
5 robots (cc), run 6, growth 2
0
1
2
3
4
5
1 8 15 22 29 36 43 50 57 64 71 78 85 92 99 106
113
120
time / 2 [min]
biom
ass
0
200
400
600
800
1000
5 robots (cc), run 7, growth 1
0
1
2
3
4
5
1 8 15 22 29 36 43 50 57 64 71 78 85 92 99 106
113
120
time / 2 [min]
biom
ass
0
200
400
600
800
1000
5 robots (cc), run 7, growth 2
0
1
2
3
4
5
1 8 15 22 29 36 43 50 57 64 71 78 85 92 99 106
113
120
time / 2 [min]
biom
ass
0
200
400
600
800
1000
5 robots (cc), run 8, growth 1
0
1
2
3
4
5
1 8 15 22 29 36 43 50 57 64 71 78 85 92 99 106
113
120
time / 2 [min]
biom
ass
0
200
400
600
800
1000
5 robots (cc), run 8, growth 2
0
1
2
3
4
5
1 8 15 22 29 36 43 50 57 64 71 78 85 92 99 106
113
120
time / 2 [min]
biom
ass
0
200
400
600
800
1000
5 robots (cc), run 9, growth 1
0
1
2
3
4
5
1 8 15 22 29 36 43 50 57 64 71 78 85 92 99 106
113
120
time / 2 [min]
biom
ass
0
200
400
600
800
1000
5 robots (cc), run 9, growth 2
0
1
2
3
4
5
1 8 15 22 29 36 43 50 57 64 71 78 85 92 99 106
113
120
time / 2 [min]
biom
ass
0
200
400
600
800
1000
5 robots (cc), run 10, growth 1
0
1
2
3
4
5
1 8 15 22 29 36 43 50 57 64 71 78 85 92 99 106
113
120
time / 2 [min]
biom
ass
0
200
400
600
800
1000
5 robots (cc), run 10, growth 2
0
1
2
3
4
5
1 8 15 22 29 36 43 50 57 64 71 78 85 92 99 106
113
120
time / 2 [min]
biom
ass
0
200
400
600
800
1000

Appendix P Tests from Experiment Series II (5 robots, IRC) 3/4
5 robots (cc), run 1, growth 1, average
0
1
2
3
4
5
1 8 15 22 29 36 43 50 57 64 71 78 85 92 99 106
113
120
time / 2 [min]
biom
ass
0
200
400
600
800
1000
5 robots (cc), run 1, growth 2, average
0
1
2
3
4
5
1 8 15 22 29 36 43 50 57 64 71 78 85 92 99 106
113
120
time / 2 [min]
biom
ass
0
200
400
600
800
1000
5 robots (cc), run 2, growth 1, average
0
1
2
3
4
5
1 8 15 22 29 36 43 50 57 64 71 78 85 92 99 106
113
120
time / 2 [min]
biom
ass
0
200
400
600
800
1000
5 robots (cc), run 2, growth 2, average
0
1
2
3
4
5
1 8 15 22 29 36 43 50 57 64 71 78 85 92 99 106
113
120
time / 2 [min]
biom
ass
0
200
400
600
800
1000
5 robots (cc), run 3, growth 1, average
0
1
2
3
4
5
1 8 15 22 29 36 43 50 57 64 71 78 85 92 99 106
113
120
time / 2 [min]
biom
ass
0
200
400
600
800
1000
5 robots (cc), run 3, growth 2, average
0
1
2
3
4
5
1 8 15 22 29 36 43 50 57 64 71 78 85 92 99 106
113
120
time / 2 [min]
biom
ass
0
200
400
600
800
1000
5 robots (cc), run 4, growth 1, average
0
1
2
3
4
5
1 8 15 22 29 36 43 50 57 64 71 78 85 92 99 106
113
120
time / 2 [min]
biom
ass
0
200
400
600
800
1000
5 robots (cc), run 4, growth 2, average
0
1
2
3
4
5
1 8 15 22 29 36 43 50 57 64 71 78 85 92 99 106
113
120
time / 2 [min]
biom
ass
0
200
400
600
800
1000
5 robots (cc), run 5, growth 1, average
0
1
2
3
4
5
1 8 15 22 29 36 43 50 57 64 71 78 85 92 99 106
113
120
time / 2 [min]
biom
ass
0
200
400
600
800
1000
5 robots (cc), run 5, growth 2, average
0
1
2
3
4
5
1 8 15 22 29 36 43 50 57 64 71 78 85 92 99 106
113
120
time / 2 [min]
biom
ass
0
200
400
600
800
1000

Appendix P Tests from Experiment Series II (5 robots, IRC) 4/4
5 robots (cc), run 6, growth 1, average
0
1
2
3
4
5
1 8 15 22 29 36 43 50 57 64 71 78 85 92 99 106
113
120
time / 2 [min]
biom
ass
0
200
400
600
800
1000
5 robots (cc), run 6, growth 2, average
0
1
2
3
4
5
1 8 15 22 29 36 43 50 57 64 71 78 85 92 99 106
113
120
time / 2 [min]
biom
ass
0
200
400
600
800
1000
5 robots (cc), run 7, growth 1, average
0
1
2
3
4
5
1 8 15 22 29 36 43 50 57 64 71 78 85 92 99 106
113
120
time / 2 [min]
biom
ass
0
200
400
600
800
1000
5 robots (cc), run 7, growth 2, average
0
1
2
3
4
5
1 8 15 22 29 36 43 50 57 64 71 78 85 92 99 106
113
120
time / 2 [min]
biom
ass
0
200
400
600
800
1000
5 robots (cc), run 8, growth 1, average
0
1
2
3
4
5
1 8 15 22 29 36 43 50 57 64 71 78 85 92 99 106
113
120
time / 2 [min]
biom
ass
0
200
400
600
800
1000
5 robots (cc), run 8, growth 2, average
0
1
2
3
4
5
1 8 15 22 29 36 43 50 57 64 71 78 85 92 99 106
113
120
time / 2 [min]
biom
ass
0
200
400
600
800
1000
5 robots (cc), run 9, growth 1, average
0
1
2
3
4
5
1 8 15 22 29 36 43 50 57 64 71 78 85 92 99 106
113
120
time / 2 [min]
biom
ass
0
200
400
600
800
1000
5 robots (cc), run 9, growth 2, average
0
1
2
3
4
5
1 8 15 22 29 36 43 50 57 64 71 78 85 92 99 106
113
120
time / 2 [min]
biom
ass
0
200
400
600
800
1000
5 robots (cc), run 10, growth 1, average
0
1
2
3
4
5
1 8 15 22 29 36 43 50 57 64 71 78 85 92 99 106
113
120
time / 2 [min]
biom
ass
0
200
400
600
800
1000
5 robots (cc), run 10, growth 2, average
0
1
2
3
4
5
1 8 15 22 29 36 43 50 57 64 71 78 85 92 99 106
113
120
time / 2 [min]
biom
ass
0
200
400
600
800
1000