medford townsillp board of education medford, new jersey ... · pdf filebotil the municipal...
TRANSCRIPT
MEDFORD TOWNSIllP BOARD OF EDUCATION
Medford, New Jersey
County of Burlington
COMPREHENSIVE ANNUAL FINANCIAL REPORT FOR THE FISCAL YEAR ENDED JUNE 30, 2013

COMPREHENSIVE ANNUAL FINANCIAL REPORT
OF THE
MEDFORD TOWNSHIP BOARD OF EDUCATION
MEDFORD, NEW JERSEY
FOR THE FISCAL YEAR ENDED JUNE 30, 2013
Prepared by
Medford Township Board of Education
Finance Department

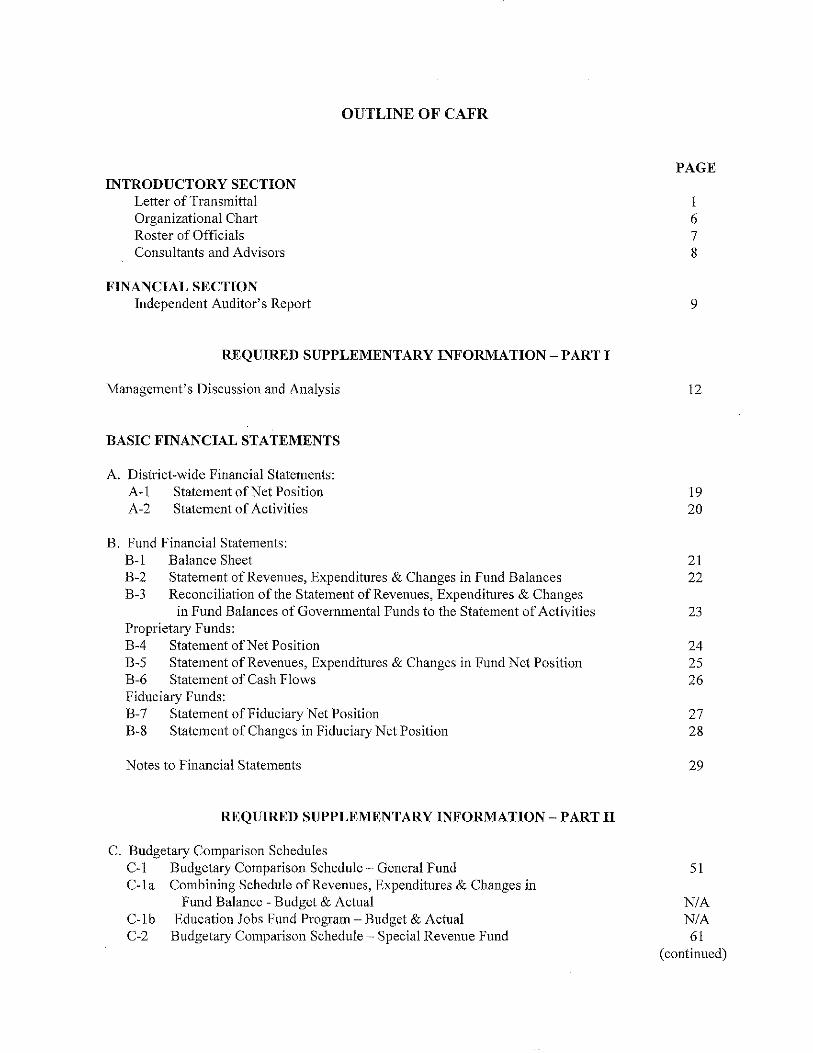
INTRODUCTORY SECTION Letter of Transmittal Organizational Chart Roster of Officials Consultants and Advisors
FINANCIAL SECTION Independent Auditor's Report
OUTLINE OF CAFR
REQUIRED SUPPLEMENTARY INFORMATION - PART I
Management's Discussion and Analysis
BASIC FINANCIAL STATEMENTS
A. District-wide Financial Statements: A-I Statement of Net Position A-2 Statement of Activities
B. Fund Financial Statements: B-1 Balance Sheet B-2 Statement of Revenues, Expenditures & Changes in Fund Balances B-3 Reconciliation of the Statement of Revenues, Expenditures & Changes
in Fund Balances of Governmental Funds to the Statement of Activities Proprietary Funds: B-4 Statement of Net Position B-5 Statement of Revenues, Expenditures & Changes in Fund Net Position B-6 Statement of Cash Flows Fiduci31'y Funds: B-7 Statement of Fiduciary Net Position B-8 Statement of Changes in Fidnciary Net Position
Notes to Fin311cial Statements
REQUIRED SUPPLEMENTARY INFORMATION - PART II
C. Budgetary Comparison Schedules C-I BudgetalY Comparison Schedule - General Fund C-l a Combining Schedule of Revenues, Expenditures & Changes in
Fund Balance - Budget & Actual C-I b Education Jobs Fund Program - Budget & Actual C-2 Budgetary Comparison Schedule - Special Revenue Fund
PAGE
I 6 7 8
9
12
19 20
21 22
23
24 25 26
27 28
29
51
N/A N/A 61
(continued)
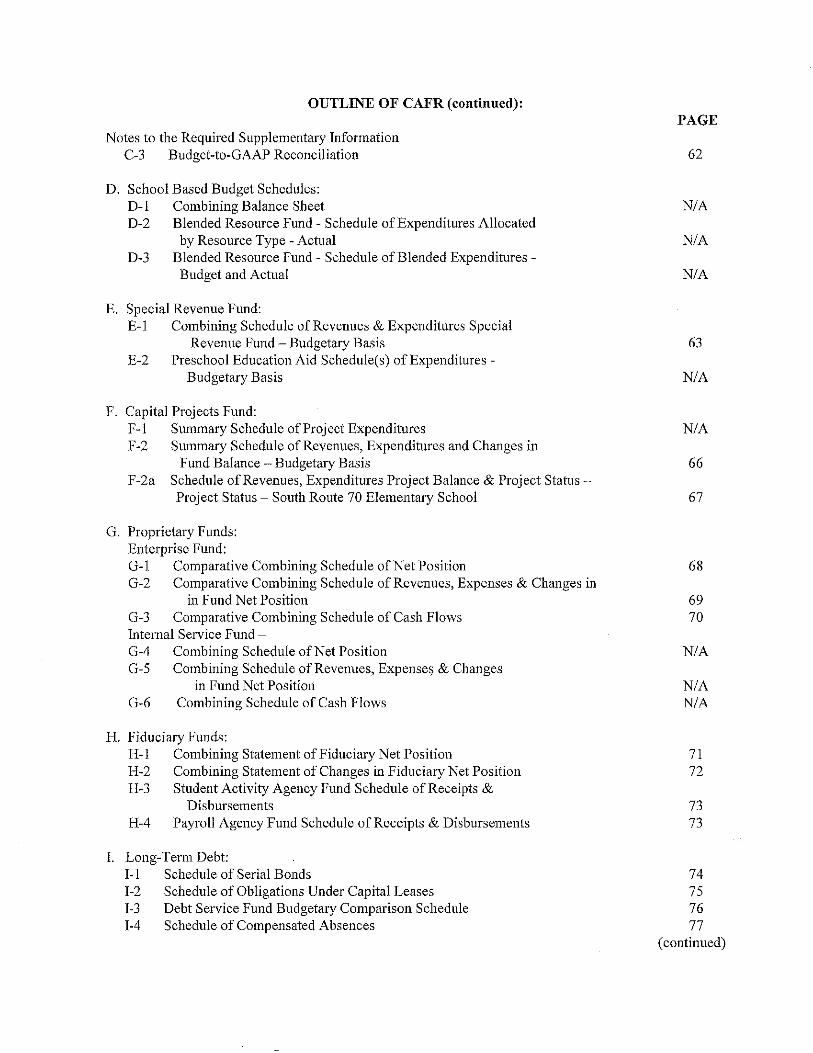
OUTLINE OF CAFR (continued):
Notes to the Required Supplementary Information C-3 Budget-to-GAAP Reconciliation
D. School Based Budget Schedules: 0-1 Combining Balance Sheet D-2 Blended Resource Fund - Schedule of Expenditures Allocated
by Resource Type - Actnal 0-3 Blended Resource Fund - Schedule of Blended Expenditures -
Budget and Actual
E. Special Revenue Fund: E-I Combining Schedule of Revennes & Expenditures Special
Revenne Fund - Budgetary Basis E-2 Preschool Edncation Aid Schednle(s) of Expenditures -
Bndgetary Basis
F. Capital Projects Fnnd: F-I Summary Schednle of Project Expenditnres F-2 Summary Schednle of Revenues, Expenditnres and Changes in
Fnnd Balance - Budgetary Basis F-2a Schedule of Revenues, Expenditures Project Balance & Project Statns
Project Status - South Ronte 70 Elementary School
G. Proprietary Funds: Enterprise Fund: G-I Comparative Combining Schedule of Net Position G-2 Comparative Combining Schedule of Revennes, Expenses & Changes in
in Fund Net Position G-3 Comparative Combining Schedule of Cash Flows Internal Service Fund -G-4 Combining Schedule of Net Position G-5 Combining Schedule of Revennes, Expensq & Changes
in Fund Net PositiOlj G-6 Combining Schedule of Cash Flows
H. Fiduciary Funds: H-I Combining Statement of Fidnciary Net Position H-2 Combining Statement of Changes in Fiduciary Net Position H-3 Student Activity Agency Fnnd Schedule of Receipts &
Disbursements H-4 Payroll Agency Fund Schedule of Receipts & Disbursements
I. Long-Term Debt: I-I Schedule of Serial Bonds I-2 Schedule of Obligations Under Capital Leases I-3 Debt Service Fund Bndgetary Comparison Schedule I-4 Schedule of Compensated Absences
PAGE
62
N/A
N/A
N/A
63
N/A
N/A
66
67
68
69 70
N/A
N/A N/A
71 72
73 73
74 75 76 77
(continued)
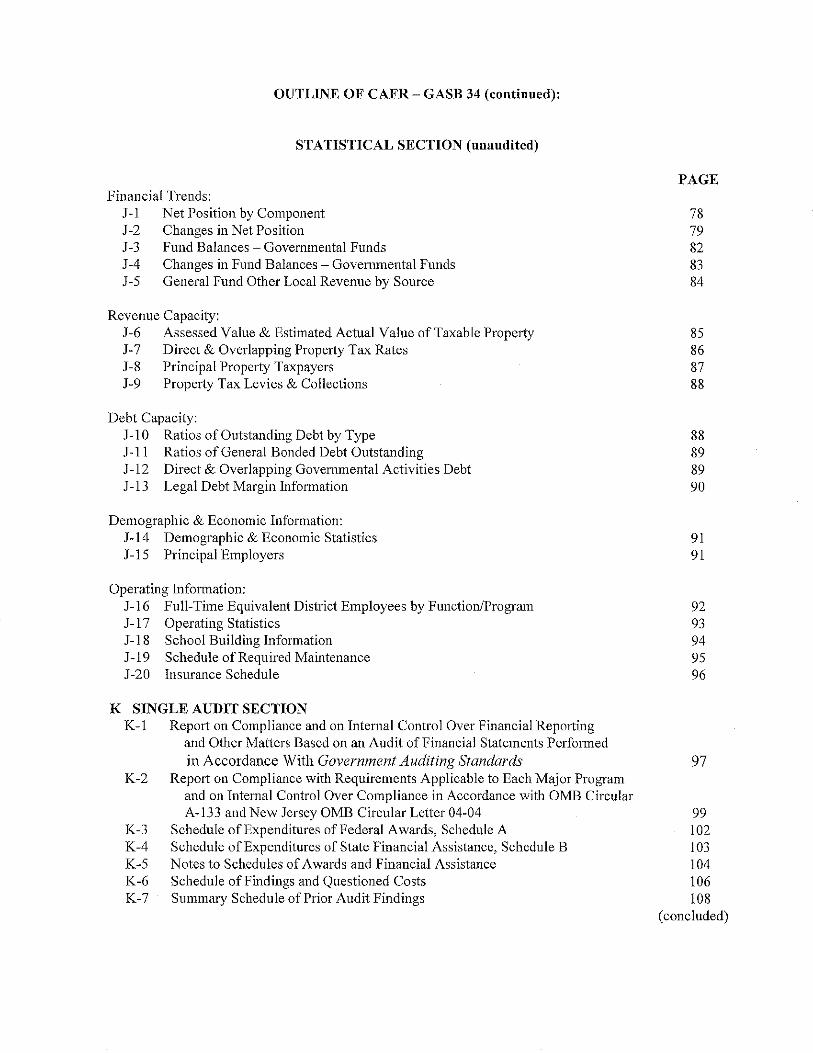
OUTLINE OF CAFR - GASB 34 (continued):
STATISTICAL SECTION (nuandited)
Financial Trends: J-I Net Position by Component J-2 Changes in Net Position J -3 Fund Balances - Governmental Funds J -4 Changes in Fund Balances - Governmental Funds J-5 General Fund Other Local Revenue by Source
Revenue Capacity:
PAGE
78 79 82 83 84
J-6 Assessed Value & Estimated Actual Value of Taxable Property 85 J-7 Direct & Overlapping Property Tax Rates 86 J-8 Principal Property Taxpayers 87 J-9 Property Tax Levies & Collections 88
Debt Capacity: J-IO Ratios of Ontstanding Debt by Type 88 J -II Ratios of General Bonded Debt Outstanding 89 J -12 Direct & Overlapping Governmental Activities Debt 89 J -13 Legal Debt Margin Information 90
Demographic & Economic Information: J-14 Demographic & Economic Statistics 91 J -15 Principal Employers 91
Operating Information: J-16 Full-Time Equivalent District Employees by FunctionlProgram 92 J-17 Operating Statistics 93 J-18 School Building Information 94 J-19 Schedule of Required Maintenance 95 J-20 Insurance Schedule 96
K SINGLE AUDIT SECTION K-I Report on Compliance and on Internal Control Over Financial Reporting
and Other Matters Based on an Audit of Financial Statements Performed in Accordance With Government Auditing Standards 97
K-2 Report on Compliance with Requirements Applicable to Each Major Program and on Internal Control Over Compliance in Accordance with OMB Circular A-133 and New Jersey OMB Circular Letter 04-04 99
K-3 Schedule of Expenditures of Federal Awards, Schedule A 102 K -4 Schedule of Expenditures of State Financial Assistance, Schedule B 103 K-5 Notes to Schedules of Awards and Financial Assistance 104 K-6 Schedule of Findings and Questioned Costs 106 K-7 Summary Schedule ofprior Audit Findings 108
(concluded)

INTRODUCTORY SECTION

I
I
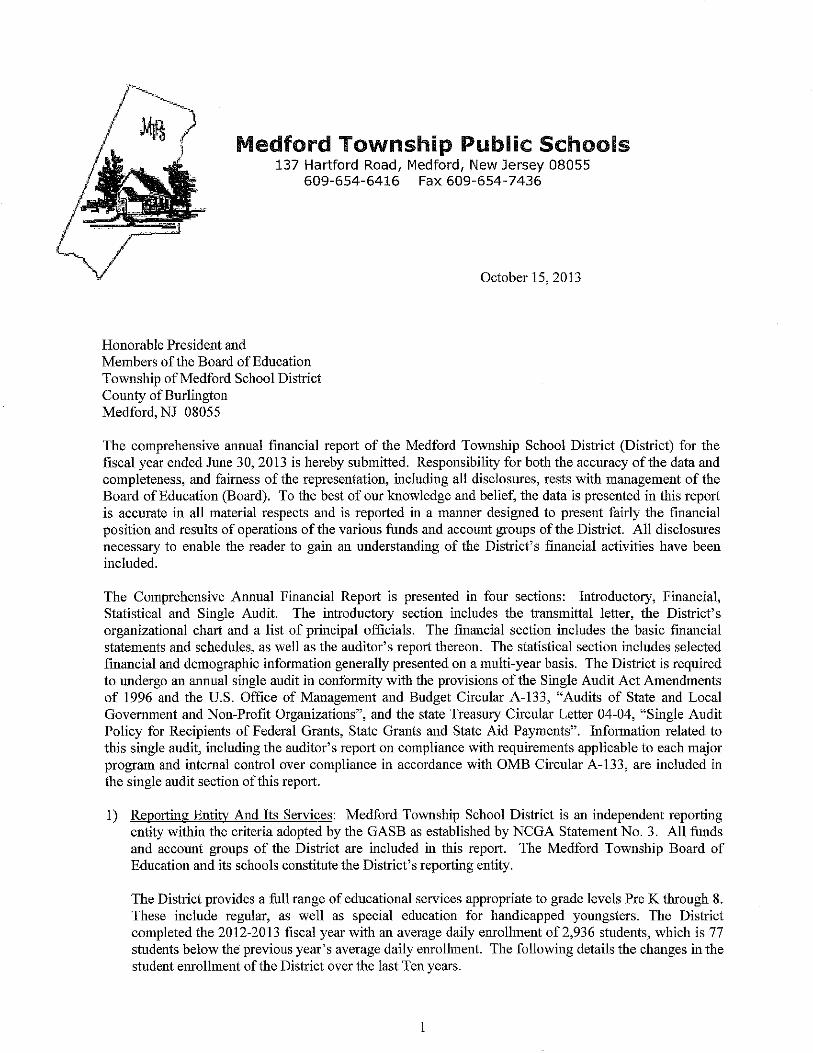
Medford Township Public Schools 137 Hartford Road, Medford, New Jersey 08055
609-654-6416 Fax 609-654-7436
Honorable President and Members of the Board of Education Township of Medford School District County of Burlington Medford, NJ 08055
October 15, 2013
The comprehensive annual [mancial report of the Medford Township School District (District) for the fiscal year ended June 30, 2013 is hereby submitted. Responsibility for both the accuracy of the data and completeness, and fairness of the representation, including all disclosures, rests with management of the Board of Education (Board). To the best of our knowledge and belief, the data is presented in this report is accurate in all material respects and is reported in a manner designed to present fairly the [mancial position and results of operations of the various funds and account groups of the District. All disclosures necessary to enable the reader to gain an understanding of the District's financial activities have been included.
The Comprehensive Annual Financial Report is presented in four sections: Introductory, Financial, Statistical and Single Audit. The introductory section includes the transmittal letter, the District's organizational chart and a list of principal officials. The financial section includes the basic financial statements and schedules, as well as the auditor's report thereon. The statistical section includes selected financial and demographic information generally presented on a multi-year basis. The District is required to undergo an annual single audit in conformity with the provisions of the Single Audit Act Amendments of 1996 and the U.S. Office of Management and Budget Circular A-133, "Audits of State and Local Government and Non-Profit Organizations", and the state Treasury Circular Letter 04-04, "Single Audit Policy for Recipients of Federal Grants, State Grants and State Aid Payments". Information related to this single audit, including the auditor's report on compliance with requirements applicable to each major program and internal control over compliance in accordance with OMB Circular A-l33, are included in the single audit section ofthis report.
1) Reporting Entity And Its Services: Medford Township School District is an independent reporting entity within the criteria adopted by the GASB as established by NCGA Statement No.3. All funds and account groups of the District are included in this report. The Medford Township Board of Education and its schools constitute the District's reporting entity.
The District provides a full range of educational services appropriate to grade levels Pre K through 8. These include regular, as well as special education for handicapped youngsters. The District completed the 2012-2013 fiscal year with an average daily enrollment of2,936 students, which is 77 students below the previous year's average daily enrollment. The following details the changes in the student enrollment of the District over the last Ten years.
I
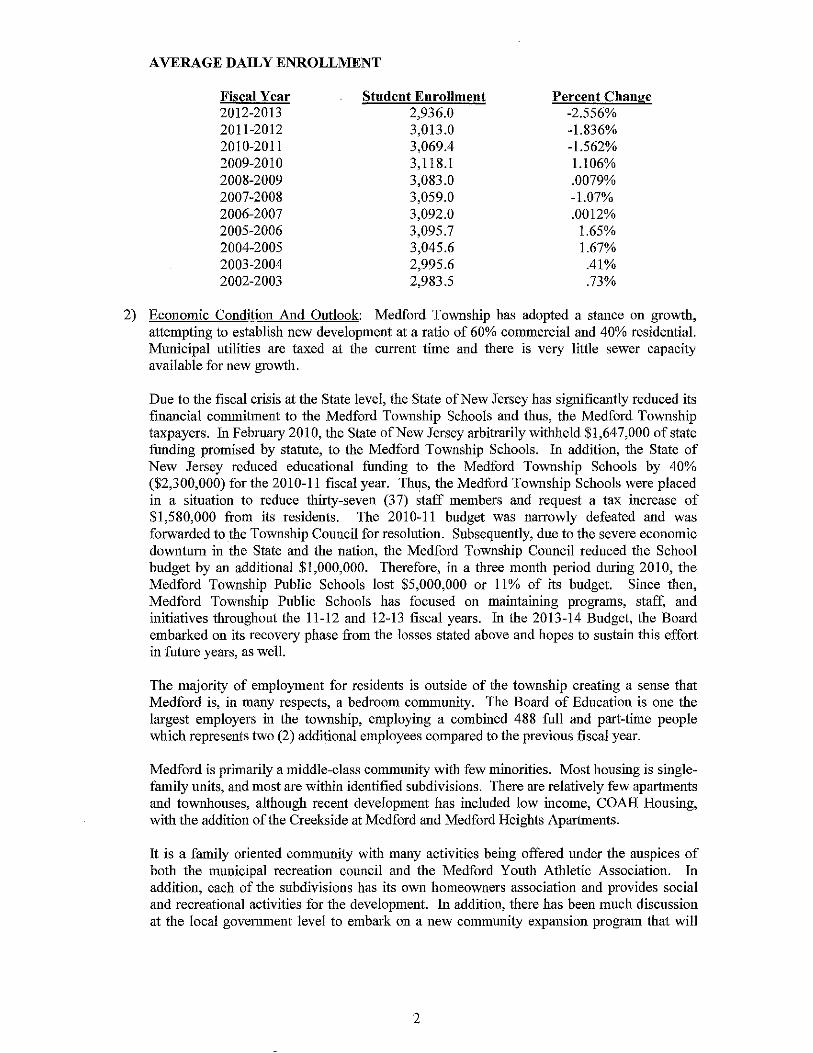
AVERAGE DAILY ENROLLMENT
Fiscal Year Stndent Enrollment Percent Change 2012-2013 2,936.0 -2.556% 2011-2012 3,013.0 -1.836% 2010-2011 3,069.4 -1.562% 2009-2010 3,118.1 1.106% 2008-2009 3,083.0 .0079% 2007-2008 3,059.0 -1.07% 2006-2007 3,092.0 .0012% 2005-2006 3,095.7 1.65% 2004-2005 3,045.6 1.67% 2003-2004 2,995.6 .41% 2002-2003 2,983.5 .73%
2) Economic Condition And Ontlook: Medford Township has adopted a stance on growth, attempting to establish new development at a ratio of 60% commercial and 40% residential. Municipal utilities are taxed at tlle current time and tilere is very little sewer capacity available for new growth.
Due to tile fiscal crisis at tile State level, tile State of New Jersey has significantly reduced its financial commitment to the Medford Township Schools and thus, the Medford Township taxpayers. In February 2010, the State of New Jersey arbitrarily witilheld $1,647,000 of state funding promised by statute, to the Medford Township Schools. In addition, tile State of New Jersey reduced educational funding to the Medford Township Schools by 40% ($2,300,000) for tile 2010-11 fiscal year. Thus, the Medford Township Schools were placed in a situation to reduce tilirty-seven (37) staff members and request a tax increase of $1,580,000 from its residents. The 2010-11 budget was narrowly defeated and was forwarded to the Township Council for resolution. Subsequently, due to the severe economic downturn in tile State and the nation, the Medford Township Council reduced tile School budget by an additional $1,000,000. Therefore, in a three month period during 2010, the Medford Township Public Schools lost $5,000,000 or 11% of its budget. Since then, Medford Township Public Schools has focused on maintaining programs, staff, and initiatives tluoughout the 11-12 and 12-13 fiscal years. In the 2013-14 Budget, the Board embarked on its recovery phase from tile losses stated above and hopes to sustain tilis effort in future years, as well.
The majority of employment for residents is outside of tile township creating a sense tilat Medford is, in many respects, a bedroom commmlity. The Board of Education is one the largest employers in the township, employing a combined 488 full and part-time people which represents two (2) additional employees compared to the previous fiscal year.
Medford is primarily a middle-class commmlity with few minorities. Most housing is singlefamily units, and most are within identified subdivisions. There are relatively few apartments and townhouses, although recent development has included low income, COAH Housing, witil tile addition of the Creekside at Medford and Medford Heights Apartments.
It is a family oriented community with many activities being offered mlder tile auspices of botil the municipal recreation council and the Medford Youth Athletic Association. In addition, each of tile subdivisions has its own homeowners association and provides social and recreational activities for the development. In addition, there has been much discussion at the local government level to embark on a new commmlity expansion program that will
2
include a combination of commercial properties, residential single family homes, townhomes and apartments.
3) Major Initiatives: The 2012-2013 budget provided for maintenance of the existing curriculum with the following four initiatives: (A) Achieve New Jersey Mandate; (B) Grades K-6 Language Arts Common Core revision and implementation; (C) Grades K-5 Math Common Core revision and implementation; (D) Grades 6-8 Common Core revision. Continued staff instruction on Inclusion Strategies and a wide variety oftopics designed to keep performance high on standardized test scores as our population changes, aud new staff members become familiar with the expectations and culture of our town. We continued to improve upon the development of staff training materials and courses to educate all teachers on the use of the Internet throughout curricular areas in spite of significant budgetary reductions.
4) Internal Accounting Controls: Management of the District is responsible for establishing and maintaining an internal control structure desigued to ensure that the assets of the District are protected from loss, theft or misuse and to ensure that adequate accounting data are compiled to allow for the preparation of financial statement in conformity with generally accepted accounting principles (GAAP). The internal control structure is desigued to provide reasonable, but not absolute, assurance that these objectives are met. The concept of reasonable assurance recognizes that (1) the cost of a control should not exceed the benefits likely to be derived; and (2) the valuation of costs and benefits requires estimates and judgments by management.
As a recipient of federal and state financial assistance, the District also is responsible for ensuring that an adequate internal control structure is in place to ensure compliance with applicable laws and regulations related to those programs. This internal control structure is also subject to periodic evaluation by the District Management.
As part of the District's single audit described earlier, tests are made to determine the adequacy of the internal control structure, including that portion related to federal and state financial assistance programs, as well as to determine that the District has compiled with applicable laws and regulations.
5) Budgetary Controls: In addition to internal accounting controls, the District maintains budgetary controls. The objective of these budgetary controls is to ensure compliance with legal provisions embodied in the annual appropriated budget approved by the voters of the municipality. Annual appropriated budgets are adopted for the general fund, the special revenue fund, and the debt service fund. Project-length budgets are approved for the capital improvements accounted for in the capital projects fund. The final budget amount as amended for the fiscal year is reflected in the fmancial section.
An encumbrance accounting system is used to record outstanding purchase commitments on a line item basis. Open encumbrances at year-end are either canceled or are included as reappropriations of fund balance in the subsequent year. Those amounts to be re-appropriated are reported as reservations of fund balance at June 30, 2013.
6) Accounting System And Reports: The District's accounting records reflect generally accepted accounting principles, as promUlgated by the Governmental Accounting Standards Board (GASB). The accounting system of the District is organized on the basis of funds and account groups. These funds and account groups are explained in "Notes to the Financial Statements", Note 1.
3
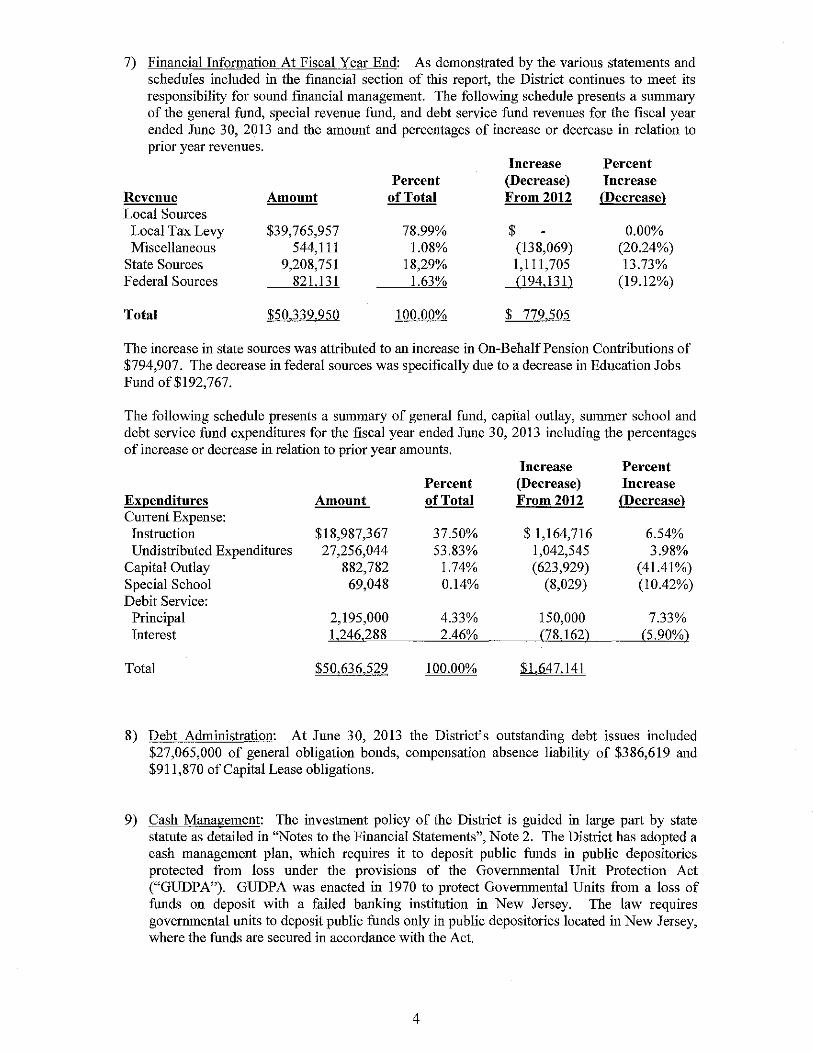
7) Financial Information At Fiscal Year End: As demonstrated by the various statements and schedules included in the financial section of this report, the District continues to meet its responsibility for sound financial management. The following schedule presents a summary of the general fund, special revenue fund, and debt service fund revenues for the fiscal year ended June 30, 2013 and the amount and percentages of increase or decrease in relation to pnor year revenues.
Increase Percent Percent (Decrease) Increase
Revenue Amount of Total From 2012 /Decrease} Local Sources
Local Tax Levy $39,765,957 78.99% $ 0.00% Miscellaneous 544,111 1.08% (138,069) (20.24%)
State Sources 9,208,751 18,29% 1,111,705 13.73% Federal Sources 821,131 1.63% (194,131) (19.12%)
Total $50332,950 100.00% $ 779505
The increase in state sources was attributed to an increase in On-Behalf Pension Contributions of $794,907. The decrease in federal sources was specifically due to a decrease in Education Jobs Fund of$192,767.
The following schedule presents a summary of general fund, capital outlay, summer school and debt service fund expenditures for the fiscal year ended June 30, 2013 including the percentages of increase or decrease in relation to prior year amounts.
Increase Percent Percent (Decrease) Increase
Expenditures Amount of Total From 2012 {Decrease} Current Expense: Instruction $18,987,367 37.50% $ 1,164,716 6.54% Undistributed Expenditures 27,256,044 53.83% 1,042,545 3.98%
Capital Outlay 882,782 1.74% (623,929) (41.41%) Special School 69,048 0.14% (8,029) (10.42%) Debit Service:
Principal 2,195,000 4.33% 150,000 7.33% Interest 1,246,288 2.46% (78,162) (5.90%)
Total $50.636529 100.00% $1,647,141
8) Debt Administration: At June 30, 2013 the District's outstanding debt issues included $27,065,000 of general obligation bonds, compensation absence liability of $386,619 and $911,870 of Capital Lease obligations.
9) Cash Management: The investment policy of the District is guided in large part by state statute as detailed in "Notes to the Financial Statements", Note 2. The District has adopted a cash management plan, which requires it to deposit public funds in public depositories protected from loss under the provisions of the Governmental Unit Protection Act ("GUDPA"). GUDPA was enacted in 1970 to protect Governmental Units from a loss of funds on deposit with a failed banking institution in New Jersey. The law requires govermnental units to deposit public funds only in public depositories located in New Jersey, where the funds are secured in accordance with the Act.
4
10) Risk Management: The Board carries various forms of insurance, including but not limited to general liability, automobile liability and comprehensive/collision, hazard and theft insurance on property and contents, and fidelity bonds. In addition, the District's long standing participation in the Burlington County Insurance Pool Joint Insurance Fund (BCIPJIF) has resnlted in continued premium savings throngh enhanced Risk Management emphasis, policies and practices adopted by the JIF.
11) Other Information: State statutes require an annual audit by independent certified public accountants or registered municipal accountants. The accounting firm of Holman Frenia Allison, P.C., was selected by the Board. In addition to meeting the requirements set forth in state statutes, the audit was also designed to meet the reqnirement of the Single Audit Act Amendments of 1996 and the related OMB Circular A-l33 and state Treasury Circular Letter 04-04. The auditor's report on the basic financial statements and combining and individual fund statements and schedules is included in the financial section of this report. The auditor's reports related specifically to the single audit are included in the single section of this report.
12) Acknowledgements: We would like to express our appreciation to the members of the Medford Township Board of Education for their concern and guidance in providing fiscal accountability to the citizens and taxpayers of the Medford School District and thereby contributing their full support to the development and maintenance of our financial operation. The preparation of this report could not have been accomplished without the efficient and dedicated services of our [mancial and accounting staff.
Respectively submitted,
~ fl. vee ~04Ji Dr. Joseph J. Del Rossi Superintendent
Chad Fires, Business AdministratorlBoard Secretary
5

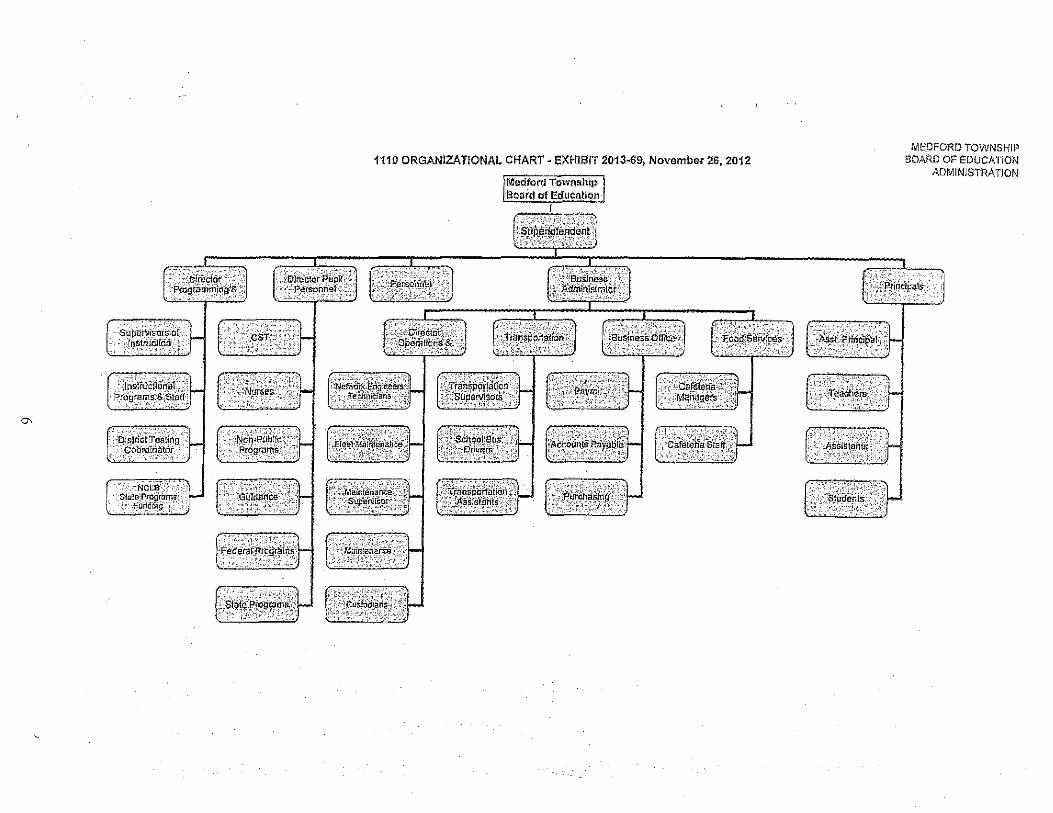
1110 ORGANIZATIONAL CHART· eXHIBIT 2013·69, November 26, 2012
0,
ME;OFORD TOWNSKIP BOARD OF EDUCATION
ADMINISTRATION

I
I
I
I
I
I
I
I
I
I
I
I
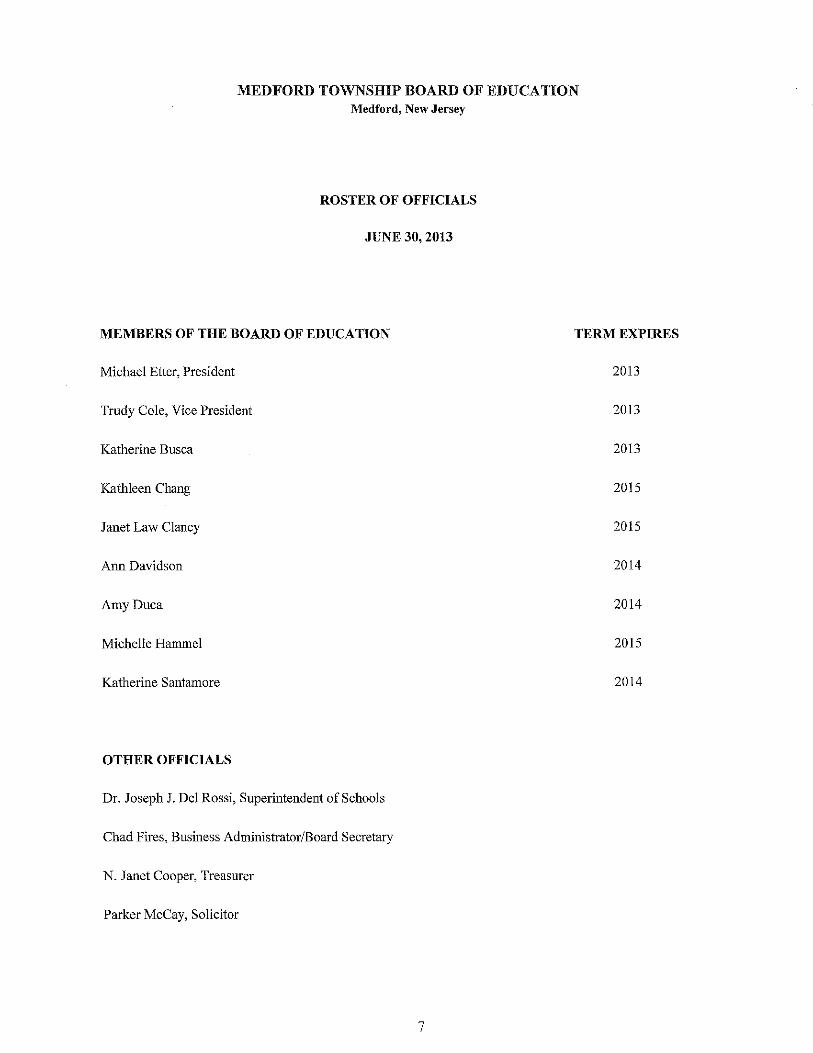
MEDFORD TOWNSHIP BOARD OF EDUCATION Medford, New Jersey
ROSTER OF OFFICIALS
JUNE 30, 2013
MEMBERS OF THE BOARD OF EDUCATION TERM EXPIRES
Michael Etter, President 2013
Trudy Cole, Vice President 2013
Katherine Busca 2013
Kathleen Chang 2015
Janet Law Clancy 2015
Ann Davidson 2014
Amy Duca 2014
Michelle Hanunel 2015
Katherine Santamore 2014
OTHER OFFICIALS
Dr. Joseph J. Del Rossi, Superintendent of Schools
Chad Fires, Business AdministratorlBoard Secretary
N. Janet Cooper, Treasurer
Parker McCay, Solicitor
7
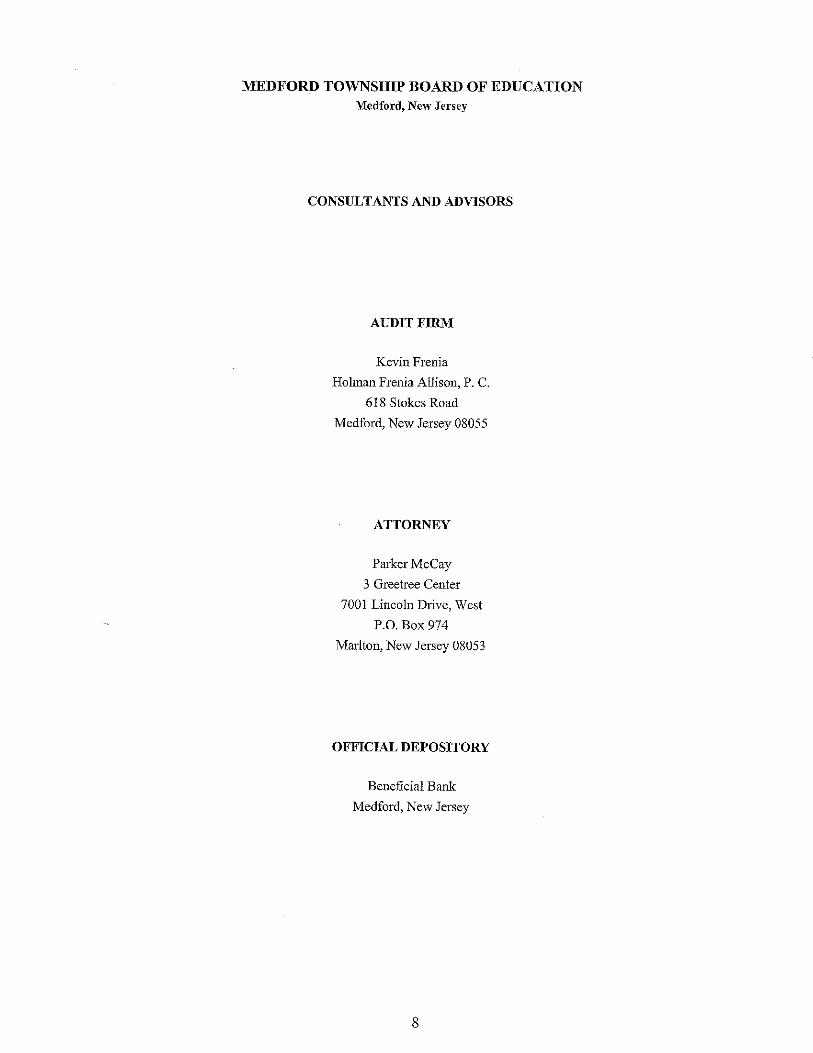
MEDFORD TOWNSHIP BOARD OF EDUCATION Medford, New Jersey
CONSULTANTS AND ADVISORS
AUDIT FIRM
Kevin Frenia
Holman Frenia Allison, P. C.
618 Stokes Road
Medford, New Jersey 08055
ATTORNEY
Parker McCay
3 Greetree Center
7001 Lincoln Drive, West
P.O. Box 974
Marlton, New Jersey 08053
OFFICIAL DEPOSITORY
Beneficial Bank
Medford, New Jersey
8

FINANCIAL SECTION

HF HOLMAN I FRENlA
ALLISON, P.c. Certified Public Accountants & Consultants
£££&
10 Alien Sllesi.. Swite 28, roms 1"{iv8I', NJ 08703 Tel: .'i333 618 Stokss ::Zoad, MBGfo(cL NJ 08055, Tel: G09,953.cS'i2
8'12 Highway 33. Suite Freehold, NJ 07(21) ,. Tel: 7:52A09,Q80Q 795 Canier; Str881, Troy, PA 16941''' lei: 570):97
926 Main Street Suite 103, f:Zoms, PA ~8837" Tel: ,,~.?".'"'" www.hfacpas.com
INDEPENDENT AUDITOR'S REPORT
Honorable President and Members of the Board of Education
Medford Township County of Burlington Medford, New Jersey 08055
Report on the Financial Statements
We have audited the accompauying financial statements of the governmental activities, the business-type activities, each major fund and the aggregate remaining fund information of Medford Township Board of Education, County of Burlington, State of New Jersey, as of and for the fiscal year ended June 30, 2013, and the related notes to the financial statements, which collectively comprise the District's basic financial statements as listed in the table of contents.
Management's Responsibility for the Financial Statements
Management is responsible for the preparation and fair presentation of these financial statements in accordance with accounting principles generally accepted in the United States of America; this includes the design, implementation, and maintenance of internal control relevant to the preparation and fair presentation of financial statements that are free from material misstatement, whether due to fraud or error.
Auditor's Responsibility
Our responsibility is to express opinions on these financial statements based on our audit. We conducted our audit in accordance with auditing standards generally accepted in the United States of America; and the standards applicable to financial audits contained in Governmental Auditing Standards, issued by the Comptroller General of the United States; and audit requirements as prescribed by the Office of School Finance, Department of Education, State of New Jersey. Those standards require that we plan and perform the audit to obtain reasonable assurance about whether the financial statements are free from material misstatement.
An audit involves performing procedures to obtain audit evidence about the amounts and disclosures in the financial statements. The procedures selected depend on the auditor's judgment, including the assessment of the risks of material misstatement of the financial statements, whether due to fraud or error. In making those risk assessments, the auditor considers internal control relevant to the entity's preparation and fair presentation of the financial statements in order to design audit procedures that are appropriate in the circumstances, but not for the purpose of expressing an opinion on the effectiveness of the entity's internal control. Accordingly, we express no such opinion. An audit also includes evaluating the appropriateness of accounting policies used and the reasonableness of significant accounting estimates made by management, as well as evaluating the overall presentation of the financial statements.
We believe that the audit evidence we have obtained is sufficient and appropriate to provide a basis for our audit opinions.
9
Opinions
In our opinion, the financial statements referred to above present fairly, in all material respects, the respective fmancial position of the governmental activities, the business-type activities, each major fund, and the aggregate remaining fund information of the Medford Township Board of Education, Couuty of Burlington, State of New Jersey, as of June 30, 2013, and the respective changes in financial position and, where applicable, cash flows thereof for the year then ended in accordance with accounting principles generally accepted in the United States of America.
Other Matters
Required Supplementary Information
Accounting principles generally accepted in the United States of America require that the management's discussion and analysis and budgetary comparison information on pages 12 through 18 and 51 through 61 be presented to supplement the basic financial statements. Such information, although not a part of the basic financial statements, is required by the Governmental Accounting Standards Board who considers it to be an essential part of financial reporting for placing the basic financial statements in an appropriate operational, economic, or historical context. We have applied certain limited procedures to the required supplementary information in accordance with aUditing standards generally accepted in the United States of America, which consisted of inquiries of management about the methods of preparing the information and comparing the information for consistency with management's responses to our inquiries, the basic financial statements, and other knowledge we obtained dnring our audit of the basic financial statements. We do not express an opinion or provide any assurance on the information because the limited procedures do not provide us with sufficient evidence to express an opinion or provide any assurance.
Other Information
Our audit was conducted for the purpose of forming opinions on the financial statements that collectively comprise the Medford Township Board of Education's basic financial statements. The accompanying introductory section, comparative totals for June 30, 2012, and other supplementary infOImation such as the combining and individual fund financial statements, long-term debt schedules and statistical information are presented for purposes of additional analysis and are not a required part of the financial statements. The accompanying schedule of expenditures of federal and state financial assistance are presented for purposes of additional analysis as required by U.S. Office of Management and Budget Circular A-133, Audits of States, Local Governments, and Non-Profit Organizations and New Jersey OMB's Circular 04-04, Single Audit Policy for Recipients of Federal Grants, State Grants and State Aid respectively, and is also not a required part of the financial statements.
The combining and individual fund financial statements, long-term debt schedules and the accompanying schedule of expenditures of federal and state financial assistance is the responsibility of management and was derived from and relates directly to the tmderlying accounting and other records used to prepare the basic financial statements. Such information has been subjected to the auditing procedures applied in the audit of the basic financial statements and ceJiain additional procedures, including comparing and reconciling such information directly to the underlying accounting other records used to prepare the basic financial statements or to the basic financial statements themselves, and other additional procedures in accordance with auditing standal'ds generally accepted in the United States of America. In our opinion, the combining and individual fund financial statements, long-term debt schedules and the accompanying schedule of expenditures of federal and state financial assistance are fairly stated in all material respects in relation to the basic financial statements taken as a whole.
10
The introductory section, comparative totals for June 30, 2012, and statistical information have not been subjected to the auditing procedures applied in the audit of the basic financial statements and, accordingly, we express no opinion or provide any assurance on them.
Other Reporting Reqnired by Government Auditing Standards
In accordance with Government Auditing Standards, we have also issued our report dated October 15, 2013 on our consideration of the Medford Township Board of Education's internal control over financial reporting and on our tests of its compliance with certain provisions of laws, regulations, contracts, and grant agreements and other matters. The purpose of that report is to describe the scope of our testing of internal control over financial reporting and compliance and the results of that testing, and not to provide an opinion on internal control over financial reporting or on compliance. That report is an integral part of an audit performed in accordance with Government Auditing Standards in considering Medford Township Board of Education' s internal control over financial reporting and compliance.
Medford, New Jersey October 15, 2013
Respectfully Submitted,
HOLMAN FRENIA ALLISON, P.c.
) ~~
Ke, 111 FrerJi , Public School Accountant Certified Public Accountant No. 1011
11

REQUIRED SUPPLEMENTARY INFORMATION - PART I
Management's Discnssion and Analysis

I
I
I
I
I
I
I
I
MEDFORD TOWNSHIP BOARD OF EDUCATION
MANAGEMENT'S DISCUSSION AND ANALYSIS Fiscal Year Ended June 30, 2013
This section of the Medford Township Board of Education's Comprehensive Annual Financial Report presents our discussion and analysis of the District's financial performance during the fiscal year that ended on June 30, 2013. Please read it in conjunction with the transmittal letter at the front of' this report and the District's financial statements, which immediately follow this section.
Management's Discussion and Analysis (MD&A) is an element of Required Supplementary information specified in the Governmental Accouuting Standards Board's (GASB) Statement No. 34 - Basic Financial Statements - Managements Discussion and Analysis for State and Local Governments issued in June 1999 that is required by the New Jersey State Department of Education. Comparative information between the completed fiscal year (2012 -2013) and the prior fiscal year (2011-2012) is required and is presented in the MD&A.
OVERVIEW OF THE FINANCIAL STATEMENTS
This discussion and analysis is intended to serve as an introduction to the District's basic fmancial statements. The District's basic financial statements comprise three components: I) District-wide financial statements, 2) Fund financial statements, and 3) Notes to the financial statements. This report also contains required supplementary information and other supplementary information in addition to the basic financial statements themselves.
District-wide financial statements
The district-wide financial statements are designed to provide readers with a broad overview of the District's finances, in a manner similar to a private-sector business.
The statement of net position (A-I) presents information on all of the assets and liabilities of the District, with the difference between the two reported as net position. Over time, increases or decreases in net position may serve as a useful indicator of whether the financial position of the District is improving or deteriorating.
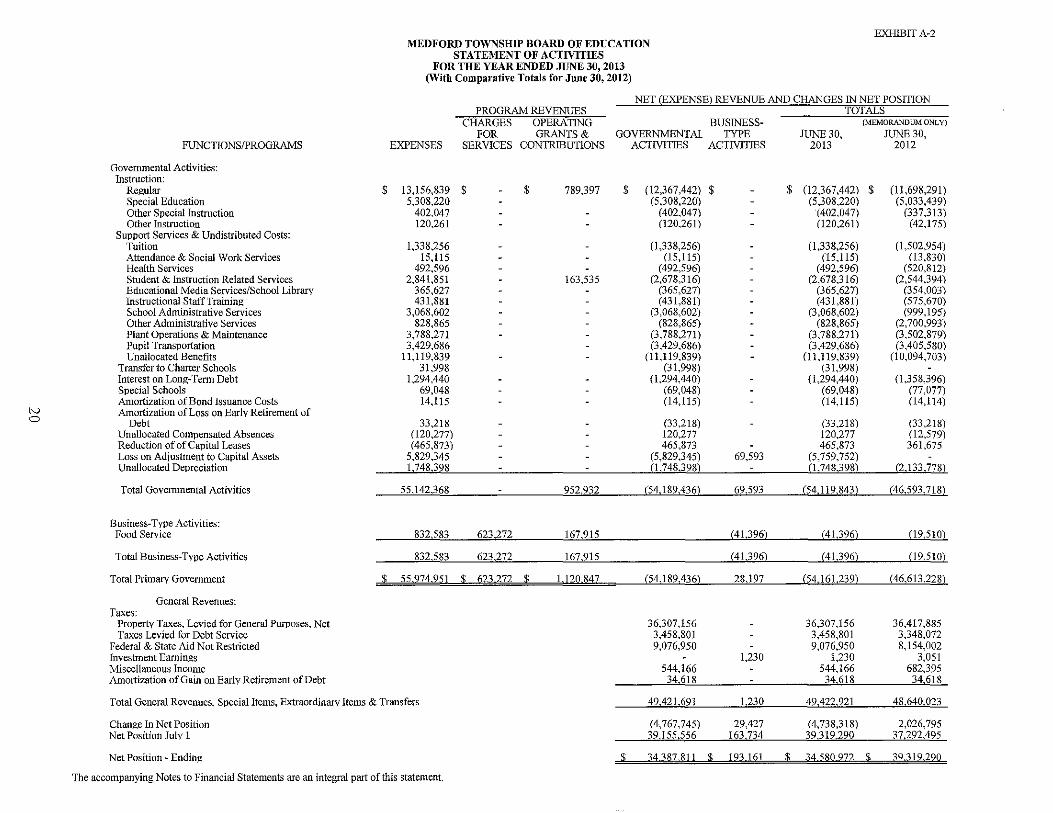
The statement of activities (A-2) presents information showing how the net position of the District changed during the most recent fiscal year. All changes in net position are reported as soon as the underlying event giving rise to the change occurs, regardless of the timing of related cash flows. Thus, revenues and expenses are reported in this statement for some items that will only result in cash flows in future fiscal periods.
The district-wide financial statements can be found as Exhibits A-I and A-2 in this report.
Fnnd Financial Statements
A fund is a group of related accounts that is used to maintain control over resources that have been segregated for specific activities or objectives. The District, like other state and local governments, uses fund accounting to ensure and demonstrate compliance with finance-related legal requirements. All of the funds of the District can be divided into three categories: governmental funds, proprietary funds and fiduciary funds.
12
Governmental Funds
Government funds are used to account for essentially the same functions reported as governmental activities in the district-wide financial statements. However, unlike the district-wide financial statements, governmental fund financial statements focus on the near-term inflows and outflows of spendable resources, as well as on balances of spendable resources available at the end of the fiscal year. Such information may be useful in evaluating the District's near term financing requirements.
Because of the focus of governmental funds is narrower than that ofthe district-wide financial statements, it is useful to compare the information presented for governmental funds with similar information presented for governmental activities in the district-wide financial statements. By doing so, readers may better understand the long-ternl inlpact of the District's near-term financing decision. Both the governmental funds balance sheet and the governmental fund statement of revenues, expenditures, and changes in fund balance provide a reconciliation to facilitate this comparison between governmental funds and governmental activities.
The District maintains five individual governmental funds. Information is presented separately in the governmental fund balance sheet and the governmental fund statements of revenues, expenditures and changes in fund balance for the general fund, special revenue fund, capital projects fund, debt service fund and permanent fund, all of which are considered to be major funds.
The general and special revenue funds utilize a legally adopted ammal budget. A budgetary comparison statement has been provided for the general fund and special revenue fund to demonstrate compliance with this budget.
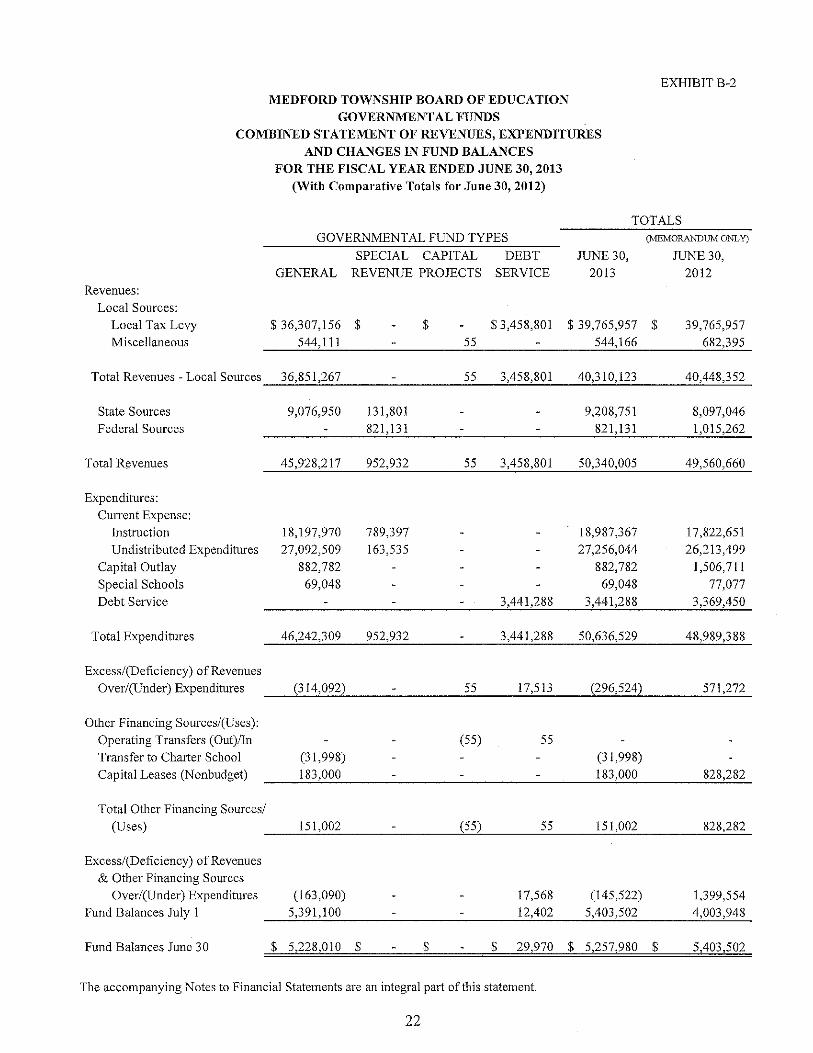
The basic governmental fund fmancial statements can be found as Exhibit B-1 through B-3 in this report.
Proprietary Funds
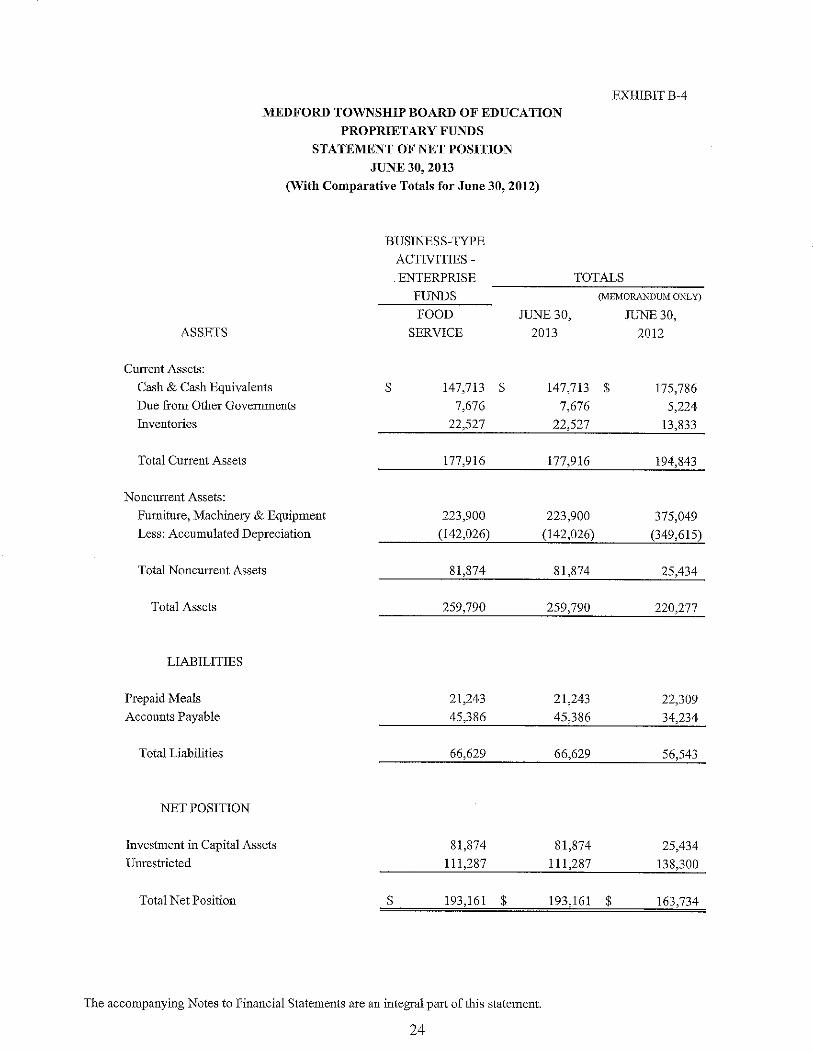
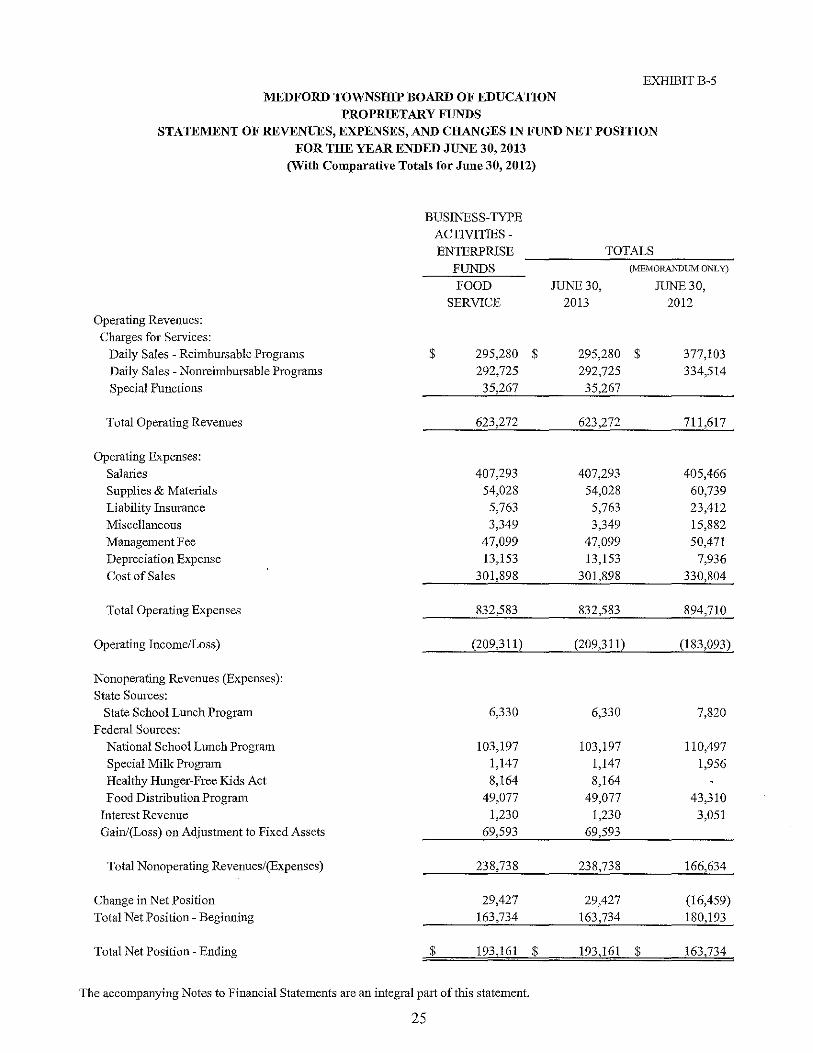
The District maintains one proprietary fund type, an enterprise fund. The enterprise fund is used to account for operations that are financed and operated in a marmer similar to private business enterprises, where the intent of the District is that the costs of providing goods or services be financed through user charges. The food services enterprise fund provides for the operation of food services in all schools, within the District. The proprietary fund has been included within the business-type activities in the district-wide financial statements.
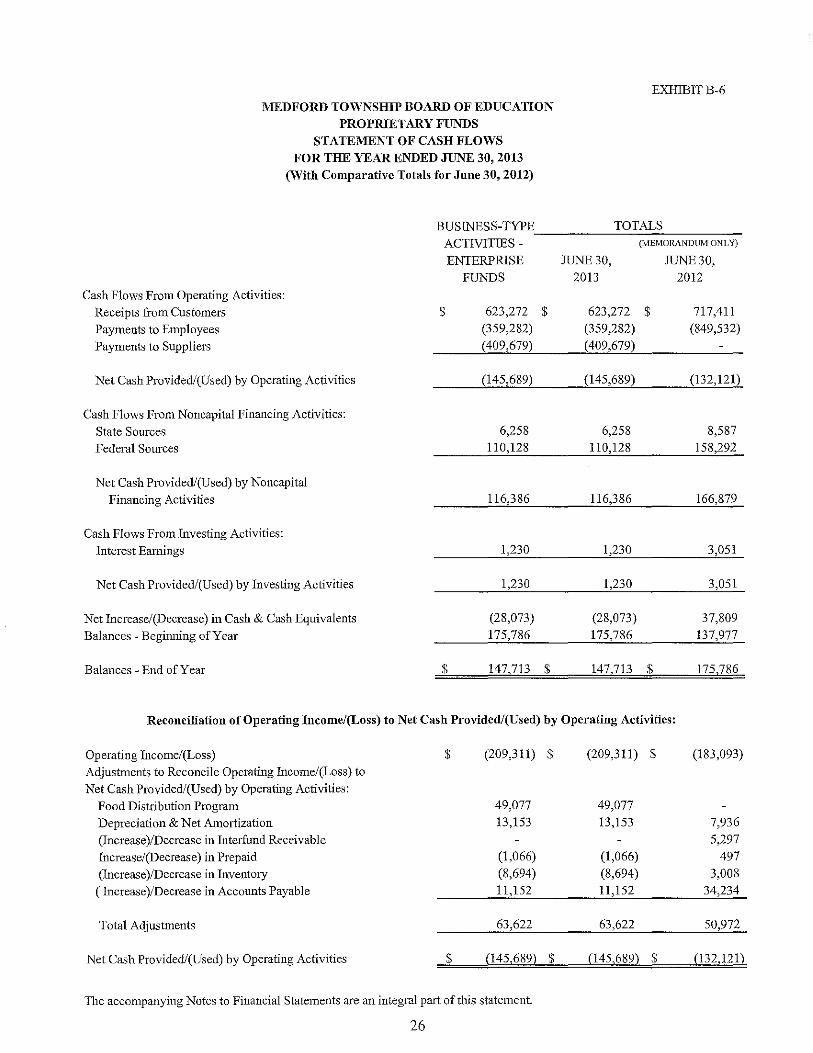
The food services fund detail financial statements can be found as Exhibits B-4 through B-6 in this report.
Fiduciary funds
Fiduciary funds are used to account for resources held for the benefit of parties outside the government entity. Fiduciary funds are not reflected in the district-wide fmancial statement because the resources of those funds are not available to support the District's own programs.
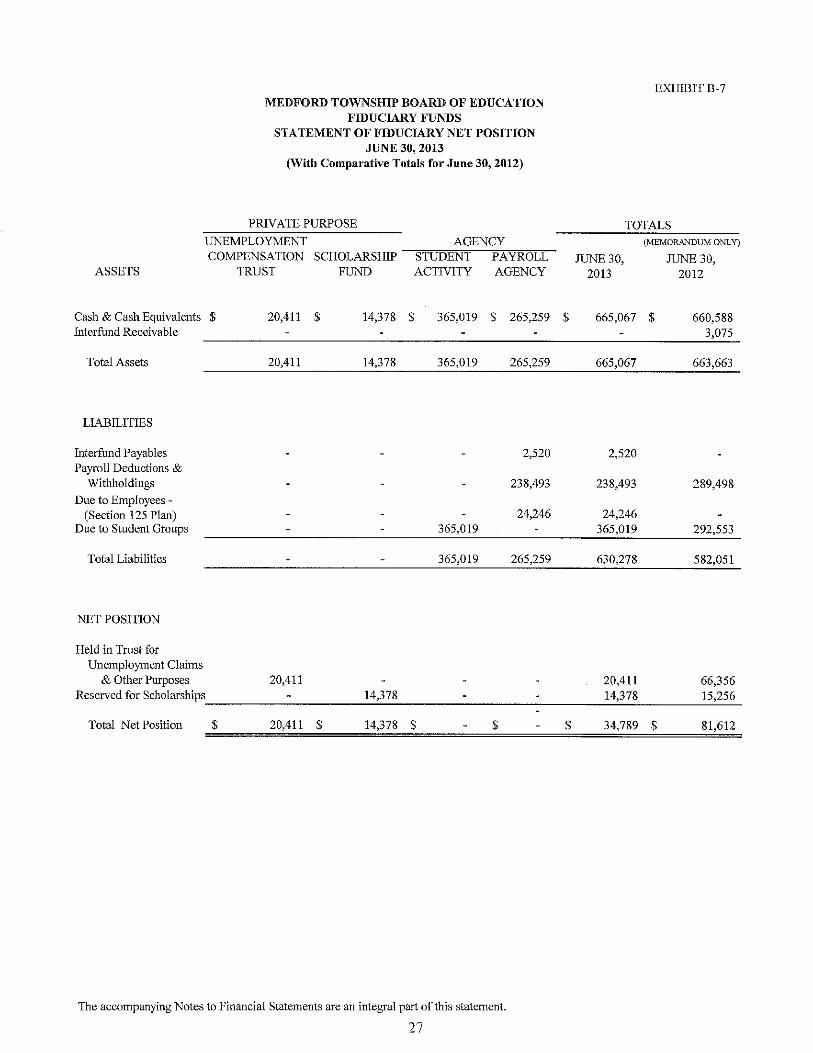
The District uses trust and agency funds to account for resources held for student activities and groups, for payroll transactions, and for the District's unemployment trust fund. The basic fiduciary fund financial statements can be found as Exhibits B-7 and B-8 in this report.
13
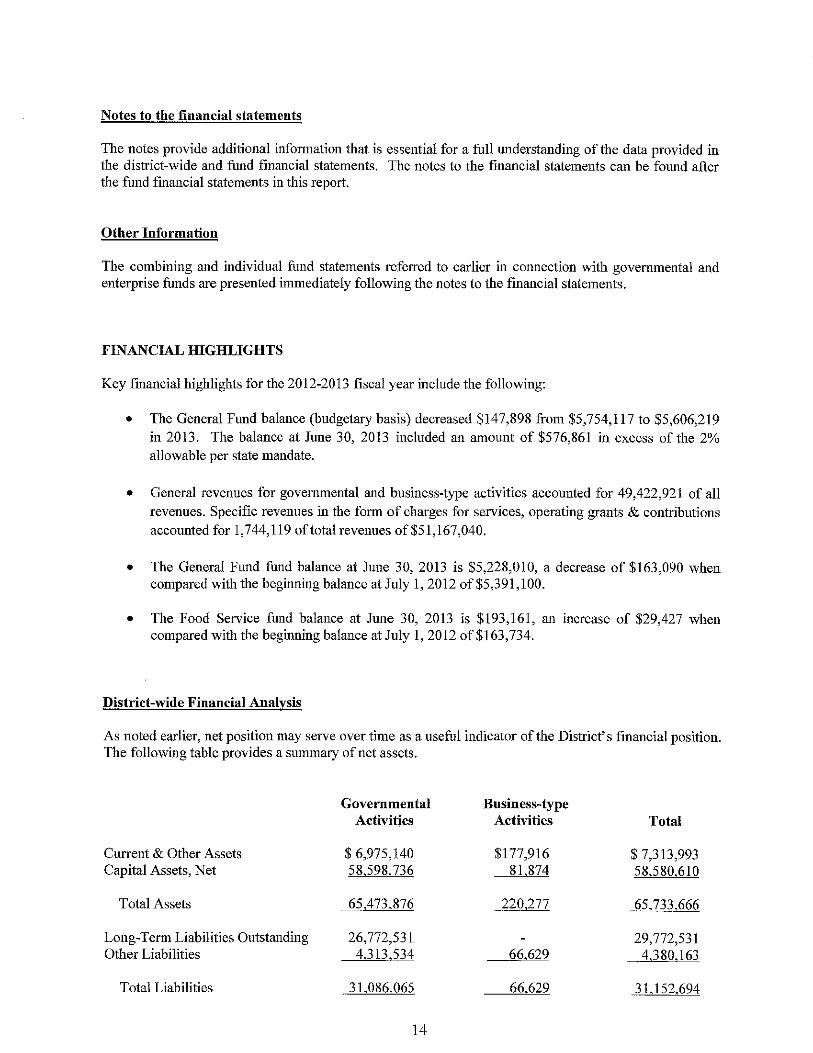
Notes to the financial statements
The notes provide additional infonnation that is essential for a full understanding of the data provided in the district-wide and fund financial statements. The notes to the financial statements can be found after the fund fmancial statements in this report.
Other Information
The combining and iodividual fund statements referred to earlier in connection with governmental and enterprise funds are presented immediately following the notes to the financial statements.
FINANCIAL IDGHLIGHTS
Key fmancial highlights for the 2012-2013 fiscal year ioclude the following:
• The General Fund balance (budgetary basis) decreased $147,898 from $5,754,117 to $5,606,219 in 2013. The balance at June 30, 2013 included an amount of $576,861 in excess of the 2% allowable per state mandate.
• General revenues for governmental and business-type activities accounted for 49,422,921 of all revenues. Specific revenues in the fonn of charges for services, operating grants & contributions accounted for 1,744,119 of total revenues of$51,167,040.
• The General Fund fund balance at June 30, 2013 is $5,228,010, a decrease of $163,090 when compared with the beginning balance at July 1,2012 of$5,391,100.
• The Food Service fund balance at June 30, 2013 is $193,161, an increase of $29,427 when compared with the beginning balance at July I, 2012 of$163,734.
District-wide Financial Analysis
As noted earlier, net position may serve over time as a useful indicator of the District's financial position. The following table provides a summary of net assets.
Governmental Business-type Activities Activities Total
Current & Other Assets $ 6,975,140 $177,916 $ 7,313,993 Capital Assets, Net 58,598,736 81,874 58,580,610
Total Assets 65,473,876 220,277 65,733,666
Long-Tenn Liabilities Outstandiog 26,772,531 29,772,531 Other Liabilities 4,313,534 66,629 4,380,163
Total Liabilities 31,086,065 66,629 31,152,694
14
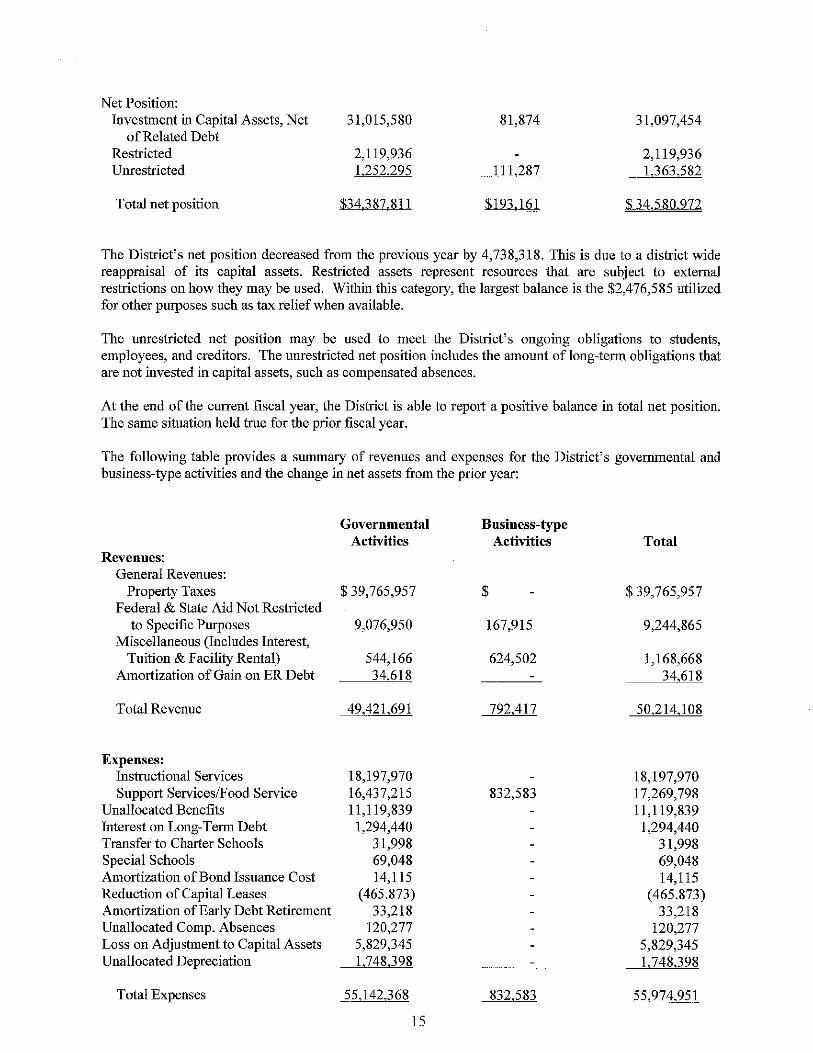
Net Position: Investment in Capital Assets, Net 31,015,580 81,874 31,097,454
of Related Debt Restricted 2,119,936 2,119,936 Unrestricted 1,252,295 111,287 1,363,582
Total net position $34,387,811 $193.161 $34,580972
The District's net position decreased from the previous year by 4,738,318. This is due to a district wide reappraisal of its capital assets. Restricted assets represent resources that are subject to external restrictions on how they may be used. Within this category, the largest balance is the $2,476,585 utilized for other purposes such as tax relief when available.
The unrestricted net position may be used to meet the District's ongoing obligations to students, employees, and creditors. The nnrestricted net position includes the amount of long-term obligations that are not invested in capital assets, such as compensated absences.
At the end of the current fiscal year, the District is able to report a positive balance in total net position. The same situation held true for the prior fiscal year.
The following table provides a suuunary of revenues and expenses for the District's governmental and business-type activities and the change in net assets from the prior year:
Governmental Business-type Activities Activities Total
Revenues: General Revenues:
Property Taxes $ 39,765,957 $ $ 39,765,957 Federal & State Aid Not Restricted
to Specific Purposes 9,076,950 167,915 9,244,865 Miscellaneous (Includes Interest,
Tuition & Facility Rental) 544,166 624,502 1,168,668 Amortization of Gain on ER Debt 34.618 34,618
Total Revenue 49,421,691 792,417 50,214,108
Expenses: Instructional Services 18,197,970 18,197,970 Support Services/Food Service 16,437,215 832,583 17,269,798
Unallocated Benefits 11,119,839 11,119,839 Interest on Long-Term Debt 1,294,440 1,294,440 Transfer to Charter Schools 31,998 31,998 Special Schools 69,048 69,048 Amortization of Bond Issuance Cost 14,115 14,115 Reduction of Capital Leases (465.873) (465.873) Amortization of Early Debt Retirement 33,218 33,218 Unallocated Compo Absences 120,277 120,277 Loss on Adjustment to Capital Assets 5,829,345 5,829,345 Unallocated Depreciation 1,748,398 1,748,398
Total Expenses 55,142,368 832,583 55,974,951
15
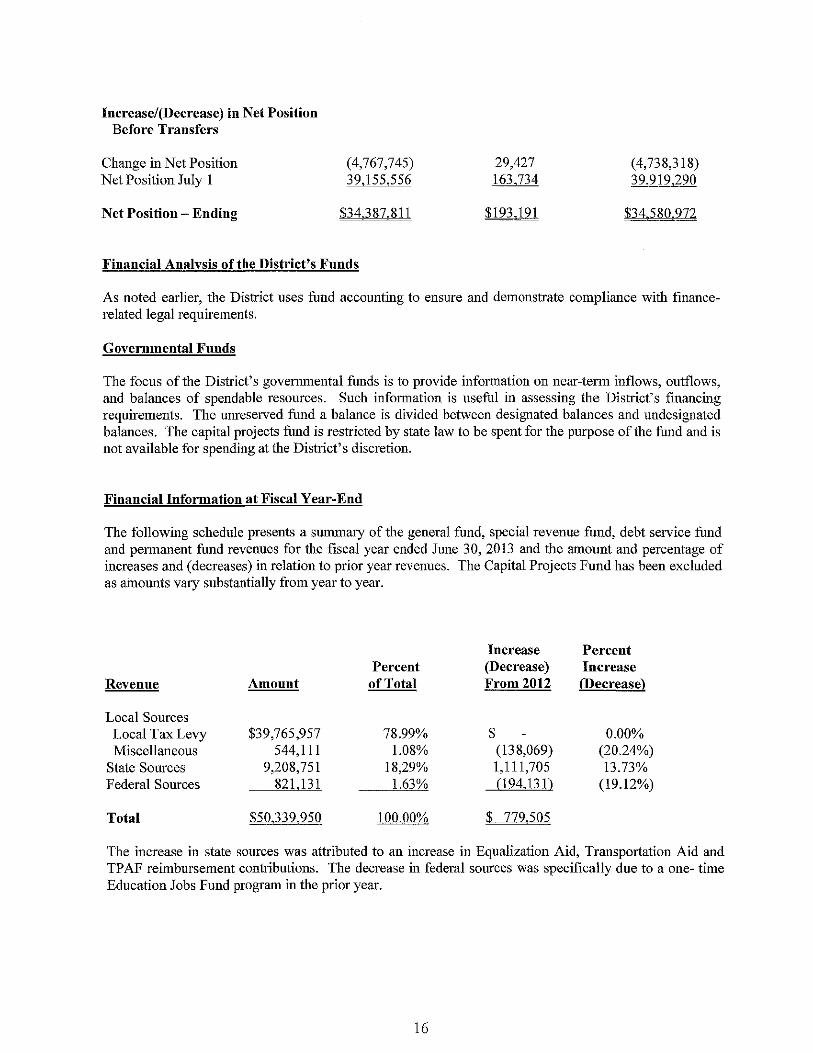
Increase/(Decrease) in Net Position Before Transfers
Change in Net Position Net Position July 1
Net Position - Ending
(4,767,745) 39,155,556
$34,387.811
Financial Analysis of the District's Funds
29,427 163,734
$193.191
(4,738,318) 39,919,290
$34580972
As noted earlier, the District uses fund accounting to ensure and demonstrate compliance with financerelated legal requirements.
Governmental Funds
The focus of the District's govermnental funds is to provide information on near-term inflows, outflows, and balances of spendable resources. Such information is useful in assessing the District's financing requirements. The unreserved fund a balance is divided between designated balances and undesignated balances. The capital projects fund is restricted by state law to be spent for the purpose of the fund and is not available for spending at the District's discretion.
Financial Information at Fiscal Year-End
The foIIowiug schedule presents a summary of the general fund, special revenue fund, debt service fund and permanent fund revenues for the fiscal year ended June 30, 2013 and the amount and percentage of increases and (decreases) in relation to prior year revennes. The Capital Projects Fnnd has been excluded as amounts vary substantially from year to year.
Increase Percent Percent (Decrease) Increase
Revenue Amount of Total From 2012 (Decrease)
Local Sources Local Tax Levy $39,765,957 78.99% $ 0.00% Miscellaneous 544,111 1.08% (138,069) (20.24%)
State Sources 9,208,751 18,29% 1,11 1,705 13.73% Federal Sources 821,131 1.63% (194,131) (19.12%)
Total $50,339,950 100.00% $ 779,505
The iucrease in state sources was attributed to an increase in Equalization Aid, Transportation Aid and TP AF reimbursement contributions. The decrease in federal sources was specifically dne to a one- time Education Jobs Fund program in the prior year.
16
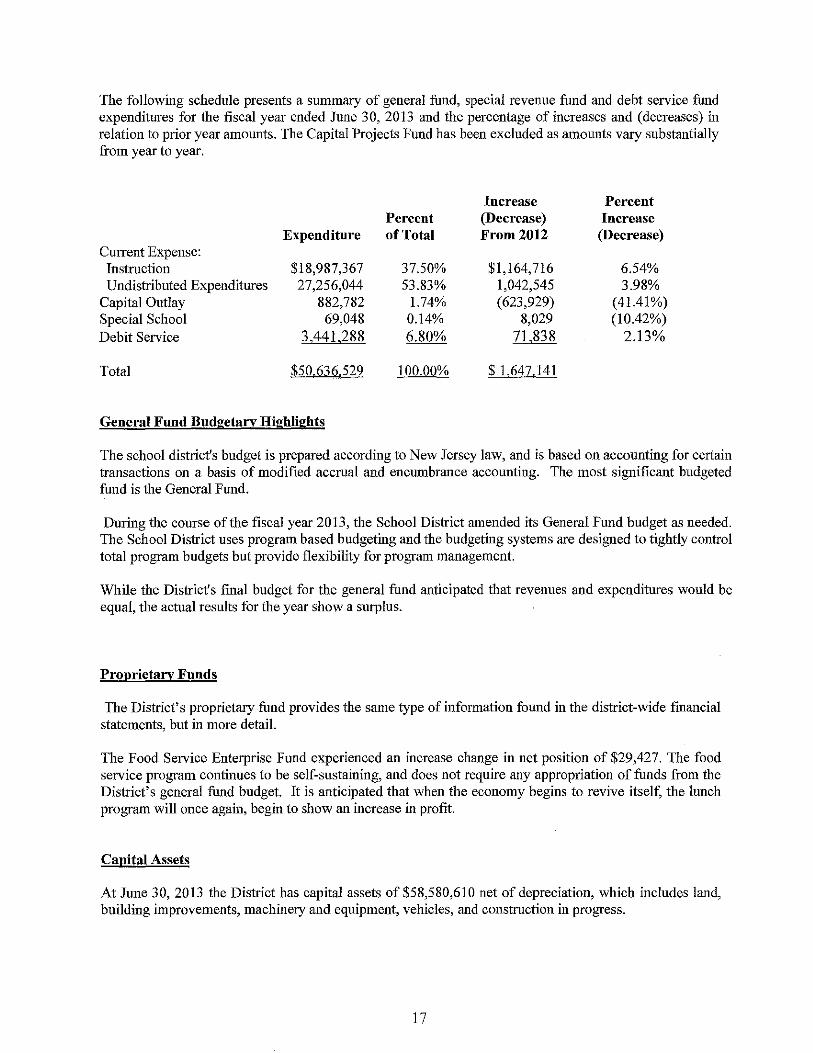
The following schedule presents a summary of general fund, special revenue fund and debt service fund expenditures for the fiscal year ended June 30, 2013 and the percentage of increases and (decreases) in relation to prior year amounts. The Capital Projects Fund has been excluded as amounts vary substantially from year to year.
Increase Percent Percent (Decrease) Increase
Expenditure of Total From 2012 (Decrease) Current Expense: Instruction $18,987,367 37.50% $1,164,716 6.54% Undistributed Expenditures 27,256,044 53.83% 1,042,545 3.98%
Capital Outlay 882,782 1.74% (623,929) (41.41%) Special School 69,048 0.14% 8,029 (10.42%) Debit Service 3,441,288 6.80% 71,838 2.13%
Total $50.636529 100.00% $ l.647.141
General Fnnd Budgetan: Highlights
The school district's budget is prepared according to New Jersey law, and is based on accounting for certain transactions on a basis of modified accrual and encumbrance accounting. The most significant budgeted fund is the General Fund.
During the course of the fiscal year 2013, the School District amended its General Fund budget as needed. The School District uses program based budgeting and the budgeting systems are designed to tightly control total program budgets but provide flexibility for program management.
While the District's [mal budget for the general fnnd anticipated that revenues and expenditures would be equal, the actual results for the year show a surplus.
Proprietan: Funds
The District's proprietary fund provides the same type of information found in the district-wide financial statements, but in more detail.
The Food Service Enterprise Fund experienced an increase change in net position of $29,427. The food service program continues to be self-sustaining, and does not require any appropriation of funds from the District's general fund budget. It is anticipated that when the economy begins to revive itself, the lunch program will once again, begin to show an increase in profit.
Capital Assets
At June 30, 2013 the District has capital assets of $58,580,610 net of depreciation, which includes land, building improvements, machinery and equipment, vehicles, and construction in progress.
17
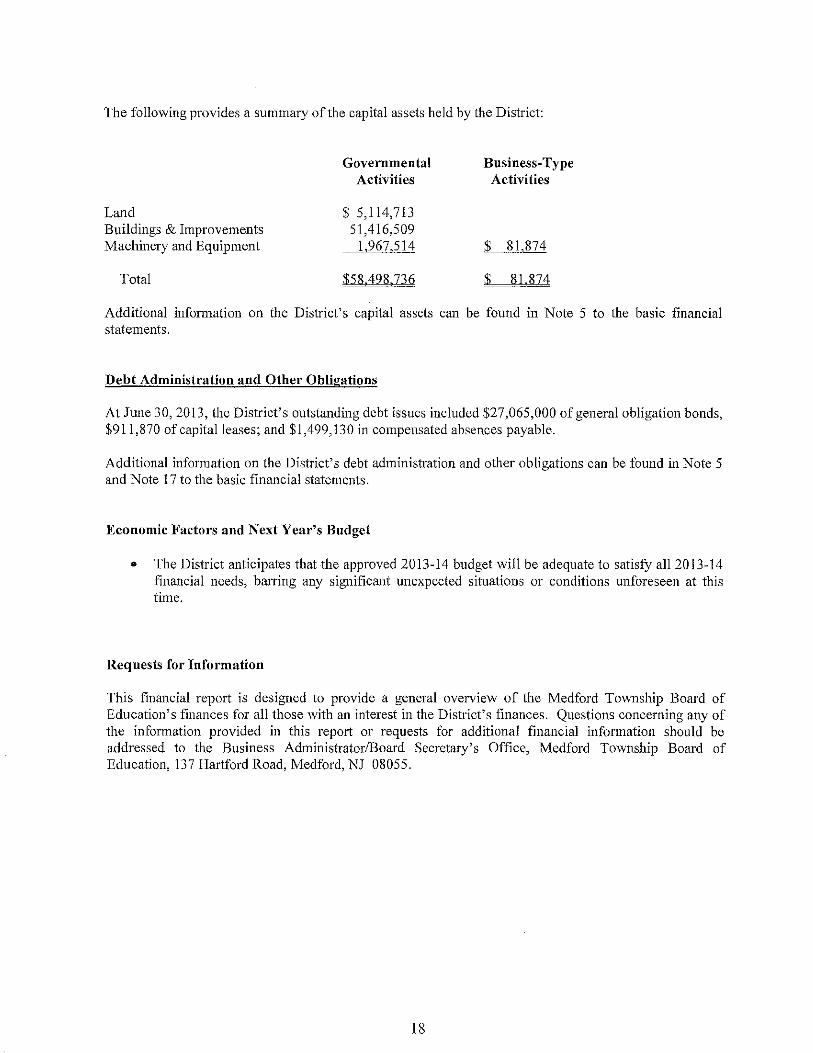
The following provides a summary of the capital assets held by the District:
Land Buildings & Improvements Machinery and Equipment
Total
Governmental Activities
$ 5,114,713 51,416,509
1,967,514
$58498736
Business-Type Activities
$ 81,874
$ 81 874
Additional information on the District's capital assets can be found in Note 5 to the basic financial statements.
Debt Administration and Other Obligations
At Jillle 30, 2013, the District's outstanding debt issues included $27,065,000 of general obligation bonds, $911,870 of capital leases; and $1,499,130 in compensated absences payable.
Additional information on the District's debt administration and other obligations can be fonnd in Note 5 and Note 17 to the basic financial statements.
Economic Factors and Next Year's Budget
• The District anticipates that the approved 2013-14 budget will be adequate to satisty all 2013-14 financial needs, barring any significant unexpected situations or conditions unforeseen at this time.
Reqnests for Information
This financial report is designed to provide a general overview of the Medford Township Board of Education's finances for all those with an interest in the District's finances. Questions concerning any of the information provided in this report or requests for additional financial information should be addressed to the Business AdministratorlBoard Secretary's Office, Medford Township Board of Education, 137 Hartford Road, Medford, NJ 08055.
18

I I
I I
I
I
I I
I
I
I I
I I
I I
I
I
I I
I
I
I I
BASIC FINANCIAL STATEMENTS

I
I
I
I
A. District-Wide Financial Statements

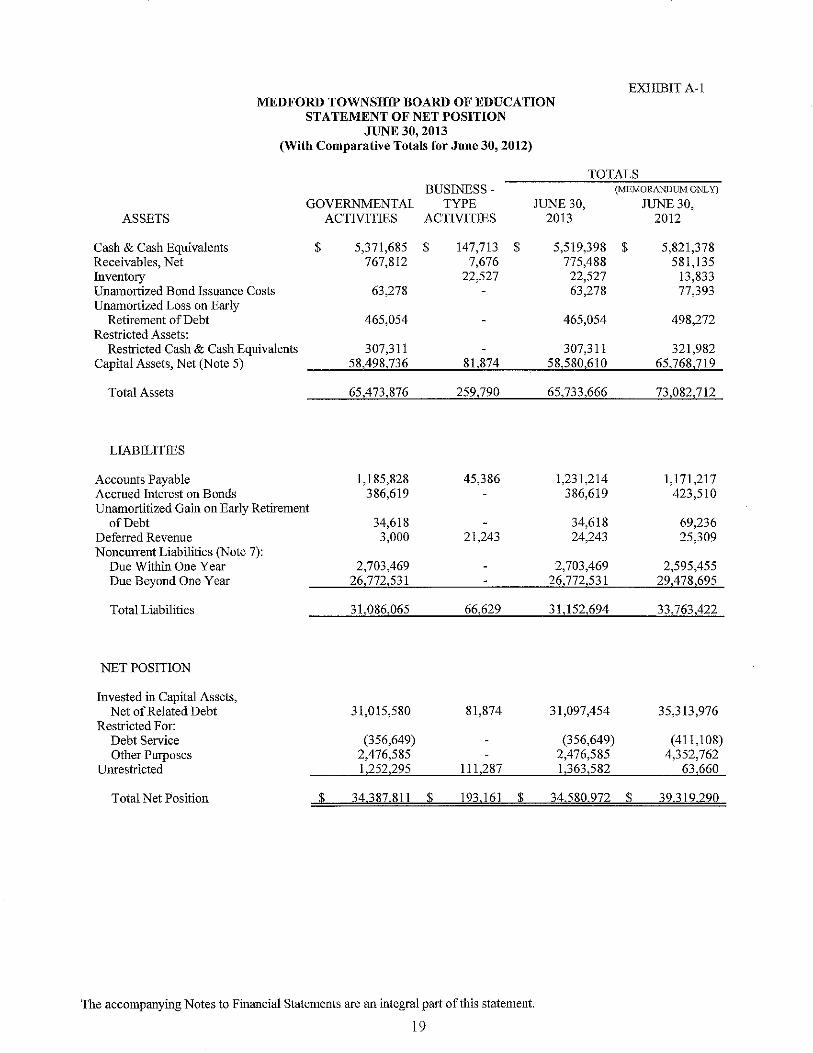
MEDFORD TOWNSHIP BOARD OF EDUCATION STATEMENT OF NET POSITION
JUNE 30, 2013 (With Comparative Totals for June 30, 2012)
EXHIBIT A-I
TOTALS BUSINESS - (MEMORANDUM ONLY)
GOVERNMENTAL TYPE JUNE 30, JUNE 30, ASSETS ACTIVITIES ACTIVITIES 2013 2012
Cash & Cash Equivalents $ 5,371,685 $ 147,713 $ 5,519,398 $ 5,821,378 Receivables, Net 767,812 7,676 775,488 581,135 Inventory 22,527 22,527 13,833 Unamortized Bond Issuance Costs 63,278 63,278 77,393 Unamortized Loss on Early
Retirement of Debt 465,054 465,054 498,272 Restricted Assets:
Restricted Cash & Cash Equivalents 307,311 307,311 321,982 Capital Assets, Net (Note 5) 58,498,736 81,874 58,580,610 65,768,719
Total Assets 65,473,876 259,790 65,733,666 73,082,712
LIABILITIES
Accounts Payable 1,185,828 45,386 1,231,214 1,171,217 Accrued Interest on Bouds 386,619 386,619 423,510 Unamortitized Gain on Early Retirement
of Debt 34,618 34,618 69,236 Deferred Revenue 3,000 21,243 24,243 25,309 Noncurrent Liabilities (Note 7):
Due Within One Year 2,703,469 2,703,469 2,595,455 Due Beyond One Year 26,772,531 26,772,531 29,478,695
Total Liabilities 31,086,065 66,629 31,152,694 33,763,422
NET POSITION
Invested in Capital Assets, Net of Related Debt 31,015,580 81,874 31,097,454 35,313,976
Restricted For: Debt Service (356,649) (356,649) (411,108) Other Purposes 2,476,585 2,476,585 4,352,762
Unrestricted 1,252,295 111,287 1,363,582 63,660
Total Net Position $ 34,387811 $ 193,161 $ 34,580972 $ 39319290
The accompanying Notes to Financial Statements are an integral part ofthis statement.
19
N o
FUNCTIONSIPROGRAMS
Governmental Activities: Instruction:
Regular Special Education Other Special Instruction Other Instruction
Support Services & Undistributed Costs: Tuition Attendance & Social Work Services Health Services Student & Instruction Related Services Educational Media Services/School Library Instructional Staff Training School Administrative Services Other Administrative Services Plant Operations & Maintenance Pupil Transportation Unallocated Benefits
Transfer to Charter Schools Interest on Long~Term Debt Special Schools Amortization of Band Issuance Costs Amortization of Loss on Early Retirement of
Debt Unallocated Compensated Absences Reduction of of Capital Leases Loss on Adiustment to Capital Assets Unallocated Depreciation
Total Governmental Activities
Business-Type Activities: Food Service
Total Business-Type Activities
Total Primary Government
General Revenues: Taxes:
Property Taxes, Levied for General Purposes, Net Taxes Levied for Debt Service
Federal & State Aid Not Restricted Investment Earnings Miscellaneous Income Amortization of Gain on Early Retirement of Debt
$
MEDFORD TOWNSHIP BOARD OF EDUCATION STATEMENT OF ACTIVITIES
FOR mE YEAR ENDED JUNE 30, 2013 (With Comparative Totals for June 30, 2012)
EXHIBIT A-2
PROGRAM REVENUES NET (EXPENSE) REVENUE ANDgJjANGES IN NET POSITION
TOTALS CHARGES OPERATING
FOR GRANTS & EXPENSES SERVICES CONTRIBUTIONS
13,156,839 $ $ 789,397 5,308,220
402,047 120,261
1,338,256 15,115
492,596 2,841,851 163,535
365,627 431,881
3,068,602 828,865
3,788,271 3,429,686
11,119,839 31,998
1,294.440 69,048 14,115
33,218 (120,277) (465,873)
5,829,345 1,748,398
BUSINESS-GOVERN~TAl TYPE
ACTMTIES ACTMTIES
$ (12,367,442) $ $ (5,308,220)
(402,047) (120,261 )
(1,338,256) (15,115)
(492,596) (2,678,316)
(365,627) (431,88!)
(3,068,602) (828,865)
(3,788,271) (3,429,686)
(11,119,839) (31,998)
(1,294,440) (69,048) (14,115)
(33,218) 120,277 465,873
(5,829,345) 69,593 (1,748,398)
JUNE 30, 2013
(MEMORANDUM ONLY)
JUNE 30, 2012
(12,367,442) $ (11,698,291) (5,308,220) (5,033,439)
(402,047) (337,313) (120,261) (42,175)
(1,338,256) (1,502,954) (15,115) ([3,830)
(492,596) (520,812) (2,678,316) (2,544,394)
(365,627) (354,003) (431,88!) (575,670)
(3,068,602) (999,195) (828,865) (2,700,993)
(3,788,271) (3,502,879) (3,429,686) (3,405,580)
(11,119,839) (10,094,703) (31,998)
(1,294,440) (1,358,396) (69,048) (77,077) (14,115) (14,114)
(33,218) (33,218) 120,277 (12,579) 465,873 361,675
(5,759,752) (1,748,398) (2,133,778)
55,142,368 952,932 (54,189,436) 69,593 , (54,119,843) (46,593,718)
832,583 623272 167,915 (4[,396) (41,396) (19,510)
832,583 623,272 167,915 (41,396) (41,396) (19,510)
$ 55974951 $ 07.3 272 $ 1120847 (54,189,436) 28,197 (54161.239) (46,613,228)
36,307,156 3,458,801 9,076,950
36,307,156 36,417,885 3,458,801 3,348,072 9,076,950 8,154,002
1,230 1,230 3,051 544,166 544,166 682,395 34,618 34,618 34,618
Total General Revenues, Special Items, Extraordinary Items & Transfers 49,421,691 1,230 49,422,921 48,640,023
Change In Net Position Net Position July 1
Net Position - Ending
The accompanying Notes to Financial Statements are an integral part of this statement.
(4,767,745) 29,427 (4,738,318) 2,026,795 39,155,556 163,734 39,319,290 37,292,495
$ 34387811 $ 193161 $ 34580972 $ 39319290

B. Fund Financial Statements


Govemmental Funds

I
I
I
I
I
I
I
I
I
I
I
I
I
I
I
I
I
I
I
I
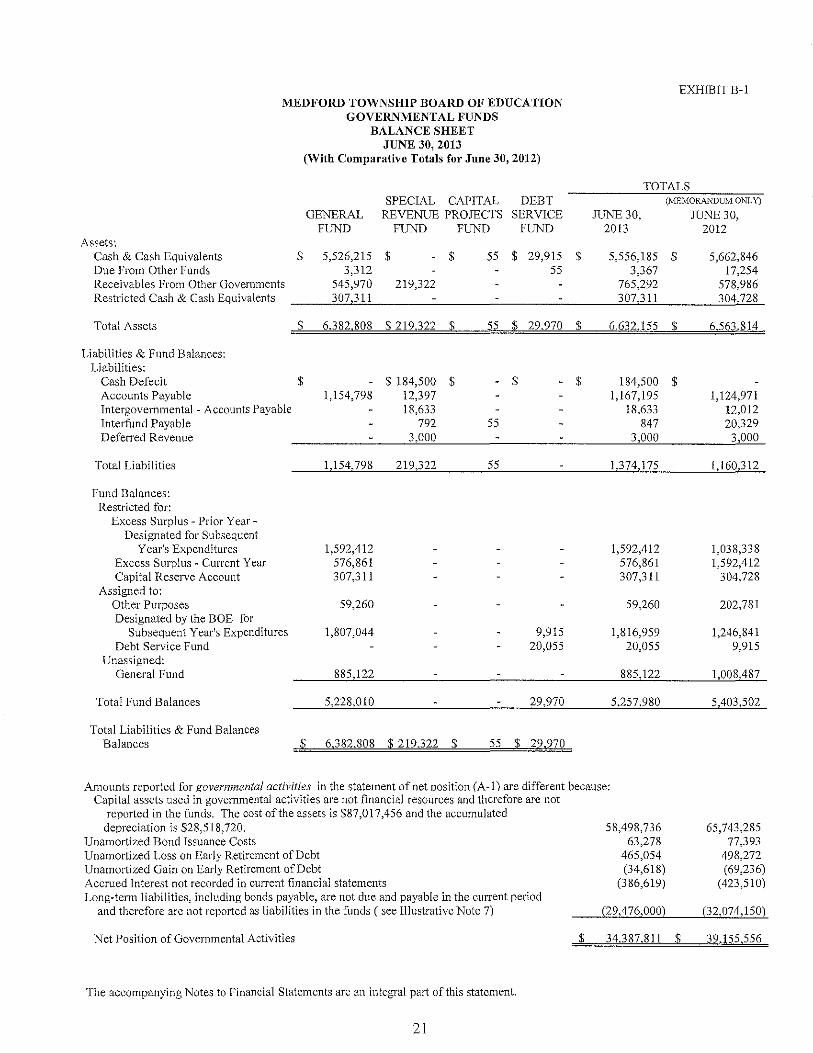
EXHIBIT B-1 MEDFORD TOWNSHIP BOARD OF EDUCA nON
GOVERNMENTAL FUNDS BALANCE SHEET
JUNE 30, 2013 (With Comparative Totals for June 30, 2012)
TOTALS SPECIAL CAPITAL DEBT (MEMORANDUM ONLy)
GENERAL REVENUE PROJECTS SERVICE JUNE 30, JUNE 30, FUND FUND FUND FUND 2013 2012
Assets', Cash & Cash Equivalents $ 5,526,215 $ $ 55 $ 29,915 $ 5,556,185 $ 5,662,846 Due From Other Funds 3,312 55 3,367 17,254 Receivables From Other Governments 545,970 219,322 765,292 578,986 Restricted Cash & Cash Equivalents 307,311 307,311 304,728
Total Assets $ 6382,808 $ 219 322 $ 55 $ 29,970 $ 6,632,155 $ 6563,814
Liabilities & Fund Balances: Liabilities:
Cash Defecit $ $ 184,500 $ $ $ 184,500 $ Accounts Payable 1,154,798 12,397 1,167,195 1,124,971 Intergovernmental - Accounts Payable 18,633 18,633 12,012 Interfund Payable 792 55 847 20,329 Deferred Revenue 3,000 3,000 3,000
Total Liabilities 1,154,798 219,322 55 1,374,175 1,160,312
Fund Balances: Restricted for:
Excess Surplus - Prior Year-Designated for Subsequent
Year's Expenditures 1,592,412 1,592,412 1,038,338 Excess Surplus - Current Year 576,861 576,861 1,592,412 Capital Reserve Account 307,311 307,311 304,728
Assigned to: Other Purposes 59,260 59,260 202,781 Designated by the BOE for
Subsequent Year1s Expenditures 1,807,044 9,915 1,816,959 1,246,841 Debt Service Fund 20,055 20,055 9,915
Unassigned: General Fund 885,122 885,122 1,008,487
Total Fund Balances 5,228,010 29,970 5,257,980 5,403,502
Total Liabilities & Fund Balances Balances $ 6382,808 $ 219322 $ 55 $ 29,970
Amounts reported for ~overnmental activities in the statement of net position (A~l) are different because: Capital assets used in governmental activities are not financial resources and therefore are not
reported in the funds. The cost of the assets is $87,017,456 and the accumulated depreciation is $28,518,720. 58,498,736 65,743,285
Unamortized Bond Issuance Costs 63,278 77,393 Unamortized Loss on Early Retirement of Debt 465,054 498,272 Unamortized Gain on Early Retirement of Debt (34,618) (69,236) Accrued Interest not recorded in current financial statements (386,619) (423,510) Long~tenn liabilities, including bonds payable, are 110t due and payable in the current period
and therefore are not reported as liabilities in the funds ( see Illustrative Note 7) (29,476,000) (32,074,150)
Net Position of Governmental Activities $ 34387,811 $ 39,155,556
The accompanying Notes to Financial Statements are an integral part of this statement.
21
MEDFORD TOWNSHIP BOARD OF EDUCATION GOVERNMENTAL FUNDS
EXHIBIT B-2
COMBINED STATEMENT OF REVENUES, EXPENDITURES AND CHANGES IN FUND BALANCES
Revenues: Local Sources:
Local Tax Levy Miscellaneous
FOR THE FISCAL YEAR ENDED JUNE 30, 2013 (With Comparative Totals for June 30, 2012)
GOVERNMENTAL FUND TYPES
SPECIAL CAPITAL DEBT
GENERAL REVENUE PROJECTS SERVICE
JUNE 30,
2013
TOTALS (MEMORANDUM ONLY)
JUNE 30, 2012
$ 36,307,156 $ 544,111
$ $ 3,458,801 $ 39,765,957 $ 39,765,957 682,395 55 544,166
Total Revenues - Local Sources_~3.:::.6,,,,8~5-,,1,.:::.2.:::.67,-______ --,5::.:5,--.....::3,-,,4~5.:::.8,,,,8~0-,,1 __ 4-"0""3,-,1::.:0,,,,1::.:2:::3 ___ 4..::0,,-,,..::44.::8::.:,3::.:5::.:2:...
State Sources Federal Sources
T ota} Revenues
Expenditures: Current Expense:
Instruction Undistributed Expenditures
Capital Outlay Special Schools Debt Service
Total Expenditures
Excess!(Deficiency) of Revenues Over/(Under) Expenditures
Other Financing Sources!(Uses): Operating Transfers (Out)1In Transfer to Charter School Capital Leases (Nonbudget)
Total Other Financing Sources!
(Uses)
Excess!(Deficiency) of Revenues & Other Financing Sources
Over!(Under) Expenditures Fund Balances July 1
Fund Balances June 30
9,076,950
45,928,217
18,197,970 27,092,509
882,782
69,048
46,242,309
(314,092)
(31,998) 183,000
151,002
(163,090) 5,391,100
$ 5,228,010 $
131,801 821,131
952,932
789,397 163,535
952,932
$
55
55
(55)
(55)
3,458,801
3,441,288
3,441,288
17,513
55
55
17,568 12,402
9,208,751 821,131
50,340,005
18,987,367 27,256,044
882,782
69,048 3,441,288
50,636,529
(296,524)
(31,998) 183,000
151,002
(145,522) 5,403,502
$ 29,970 $ 5,257,980 $
The accompanying Notes to Financial Statements are an integral part of this statement.
22
8,097,046 1,015,262
49,560,660
17,822,651 26,213,499
1,506,711 77,077
3,369,450
48,989,388
571,272
828,282
828,282
1,399,554 4,003,948
5,403,502
MEDFORD TOWNSHIP BOARD OF EDUCATION RECONCILIATION OF THE STATEMENT OF REVENUES, EXPENDITURES,
AND CHANGES IN FUND BALANCES OF GOVERNMENTAL FUNDS TO THE STATEMENT OF ACTIVITIES FOR THE YEAR ENDED JUNE 30, 2013
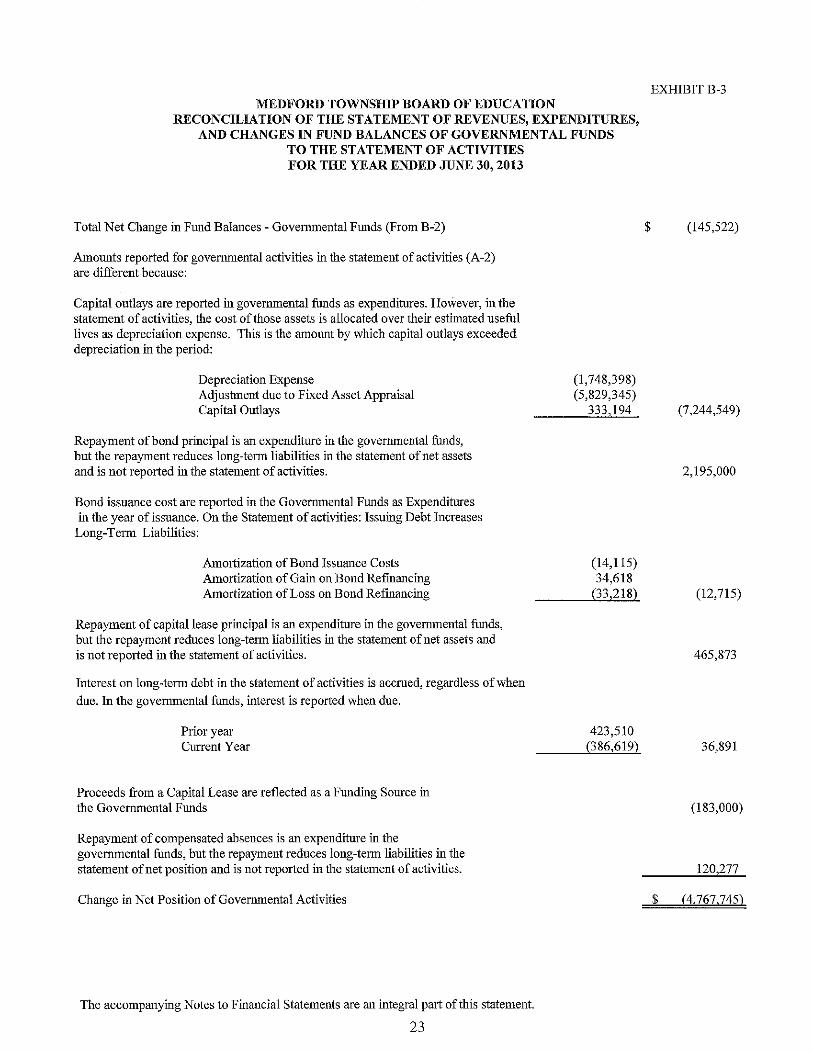
Total Net Change in Fund Balances - Governmental Funds (From B-2)
Amounts reported for governmental activities in the statement of activities (A-2) are different because:
Capital outlays are reported in governmental funds as expenditures. However, in the statement of activities, the cost ofthose assets is allocated over their estimated useful lives as depreciation expense. This is the amount by which capital outlays exceeded depreciation in the period:
Depreciation Expense Adjustment due to Fixed Asset Appraisal Capital Outlays
Repayment of bond principal is an expenditure in the governmental funds, but the repayment reduces long-term liabilities in the statement of net assets and is not reported in the statement of activities.
Bond issuance cost are reported in the Governmental Funds as Expenditures in the year of issuance. On the Statement of activities: Issuing Debt Increases
Long-Term Liabilities:
Amortization of Bond Issuance Costs Amortization of Gain on Bond Refmancing Amortization of Loss on Bond Refinancing
Repayment of capital lease principal is an expenditure in the govermuental funds, but the repayment reduces long-term liabilities in the statement of net assets and is not reported in the statement of activities.
Interest on long-term debt in the statement of activities is accrued, regardless of when
due. In the governmental funds, interest is reported when due.
Prior year Current Year
Proceeds from a Capital Lease are reflected as a Funding Source in the Governmental Funds
Repayment of compensated absences is an expenditure in the governmental funds, but the repayment reduces long-term liabilities in the statement of net position and is not reported in the statement of activities.
Change in Net Position of Governmental Activities
The accompanying Notes to Financial Statements are an integral part of this statement.
23
(1,748,398) (5,829,345)
333,194
(14,115) 34,618
(33,218)
423,510 (386,619)
EXHffiITB-3
$ (145,522)
(7,244,549)
2,195,000
(12,715)
465,873
36,891
(183,000)
120,277
$ (4,767,745)

I
I
I
I
I
I
I
I
I
I
I
I
I
I
I
I
I
I

Proprietary Funds

MEDFORD TOWNSHIP BOARD OF EDUCATION
PROPRIETARY FUNDS
STATEMENT OF NET POSITION
JUNE 30, 2013
(With Comparative Totals for June 30, 2012)
BUSINESS-TYPE
ACTIVITIES -
EXHIBITB-4
ENTERPRISE TOTALS
ASSETS
Cunent Assets:
Cash & Cash Equivalents
Due from Other Governments
Inventories
Total Current Assets
Noncurrent Assets:
Fumiture, Machinery & Equipment
Less: Accumulated Depreciation
Total Noncurrent Assets
Total Assets
LIABILITIES
Prepaid Meals
Accounts Payable
Total Liabilities
NET POSITION
Investment in Capital Assets
Unrestricted
Total Net Position
$
$
FUNDS
FOOD
SERVICE
147,713
7,676
22,527
177,916
223,900
(142,026)
81,874
259,790
21,243
45,386
66,629
81,874
111,287
$
193,161 $
(MEMORANDUM ONLY)
JUNE 30,
2013
147,713
7,676
22,527
177,916
223,900
(142,026)
81,874
259,790
21,243
45,386
66,629
81,874
111,287
$
193,161 $
JUNE 30,
2012
175,786
5,224
13,833
194,843
375,049
(349,615)
25,434
220,277
22,309
34,234
56,543
25,434
138,300
163,734
The accompanying Notes to Financial Statements are an integral pmt of this statement.
24
EXHIBITB-5 MEDFORD TOWNSIDP BOARD OF EDUCATION
PROPRIETARY FUNDS STATEMENT OF REVENUES, EXPENSES, AND CHANGES IN FUND NET POSITION
FOR THE YEAR ENDED JUNE 30, 2013 (With Comparative Totals for June 30, 2012)
BUSINESS-TYPE ACTIVITIES -ENTERPRISE TOTALS
FUNDS (MEMORANDUM ONLY)
FOOD JUNE 30, JUNE 30, SERVICE 2013 2012
Operating Revenues: Charges for Services:
Daily Sales - Reimbursable Programs $ 295,280 $ 295,280 $ 377,103 Daily Sales - Nonreimbursable Programs 292,725 292,725 334,514 Special Functions 35,267 35,267
Total Operating Revenues 623,272 623,272 711,617
Operating Expenses: SalIDies 407,293 407,293 405,466 Supplies & Materials 54,028 54,028 60,739 Liability Insurance 5,763 5,763 23,412 Miscellaneous 3,349 3,349 15,882 Management Fee 47,099 47,099 50,471 Depreciation Expense 13,153 13,153 7,936 Cost of Sales 301,898 301,898 330,804
Total Operating Expenses 832,583 832,583 894,710
Operating Income/Loss) (209,311) (209,311) (183,093)
Nonoperating Revenues (Expenses):
State Sources:
State School Lunch Program 6,330 6,330 7,820 Federal Sources:
National School Lunch Program 103,197 103,197 110,497 Special Milk Program 1,147 1,147 1,956 Healthy Hunger-Free Kids Act 8,164 8,164 Food Distribution ProgrIDu 49,077 49,077 43,310
Interest Revenue 1,230 1,230 3,051 Gain/(Loss) on Adjustment to Fixed Assets 69,593 69,593
Total Nonoperating Revenues/(Expenses) 238,738 238,738 166,634
Change in Net Position 29,427 29,427 (16,459) Total Net Position - Beginning 163,734 163,734 180,193
Total Net Position - Ending $ 193,161 $ 193,161 $ 163,734
The accompanying Notes to Financial Statements are an integral part of this statement.
25
EXHIBITB-6
MEDFORD TOWNSHIP BOARD OF EDUCATION
PROPRIETARY FUNDS
STATEMENT OF CASH FLOWS
FOR THE YEAR ENDED JUNE 30, 2013
(With Comparative Totals for June 30, 2012)
BUSINESS-TYPE TOTALS
ACTIVITIES - (MEMORANDUM ONLy)
ENTERPRISE JUNE 30, JUNE 30,
FUNDS 2013 2012
Cash Flows From Operating Activities:
Receipts from Customers $ 623,272 $ 623,272 $ 717,411
Payments to Employees (359,282) (359,282) (849,532)
Payments to Suppliers (409,679) (409,679)
Net Cash Provided/(Used) by Operating Activities (145,689) (145,689) (132,121)
Cash Flows From Noncapital Financing Activities:
State Sources 6,258 6,258 8,587
Federal Sources 110,128 110,128 158,292
Net Cash Provided/(Used) by Noncapital
Financing Activities 116,386 116,386 166,879
Cash Flows From Investing Activities:
Interest Earnings 1,230 1,230 3,051
Net Cash Provided/(Used) by Investing Activities 1,230 1,230 3,051
Net Increase/(Decrease) in Cash & Cash Equivalents (28,073) (28,073) 37,809
Balances - Begimling of Year 175,786 175,786 137,977
Balances - End of Year $ 147,713 $ 147,713 $ 175,786
Reconciliation of Operating Income/(Loss) to Net Cash Provided/(Used) by Operating Activities:
Operating Income/(Loss) $ (209,311) $ (209,311) $ (183,093)
Adjustments to Reconcile Operating Income/(Loss) to
Net Cash Provided/(Used) by Operating Activities:
Food Distribution Program 49,077 49,077
Depreciation & Net AmOliization 13,153 13,153 7,936
(Increase)/Decrease in Interfund Receivable 5,297
Increase/(Decrease) in Prepaid (1,066) (1,066) 497
(Increase )lDecrease in Inventory (8,694) (8,694) 3,008
(Increase)lDecrease in Accounts Payable 11,152 11,152 34,234
Total Adjustments 63,622 63,622 50,972
Net Cash Provided/(Used) by Operating Activities $ (145,689) $ (145,689) $ (132,121)
The accompanying Notes to Financial Statements are an integral part of this statement.
26

I
I I
I I
I I
I I
I I
I I
I I
I I
I I
I I
I

Fiduciary Fund

MEDFORD TOWNSHIP BOARD OF EDUCATION FIDUCIARY FUNDS
STATEMENT OF FIDUCIARY NET POSITION JUNE 30, 2013
(With Comparative Totals for June 30, 2012)
PRIVATE PURPOSE
UNEMPLOYMENT AGENCY COMPENSATION SCHOLARSHIP STUDENT PAYROLL
ASSETS TRUST FUND ACTNITY AGENCY
Cash & Cash Equivalents $ 20,411 $ 14,378 $ 365,019 $ 265,259 Interfund Receivable
Total Assets 20,411 14,378 365,019 265,259
LIABILrrIES
Interfund Payables 2,520 Payroll Deductions &
Witbboldings 238,493
Due to Employees -(Section 125 Plan) 24,246
Due to Student Groups 365,019
Total Liabilities 365,019 265,259
NETPOSrrION
Held in Trust for Unemployment Claims
& Other Purposes 20,411 Reserved for Scholarships 14,378
Total Net Position $ 20,411 $ 14,378 $ $
The accompanying Notes to Financial Statements are an integral part of this statement.
27
EXHIBITB-7
TOTALS (MEMORf\NDUM ONLY)
JUNE 30, JUNE 30, 2013 2012
$ 665,067 $ 660,588 3,075
665,067 663,663
2,520
238,493 289,498
24,246 365,019 292,553
630,278 582,051
20,411 66,356 14,378 15,256
$ 34,789 $ 81,612
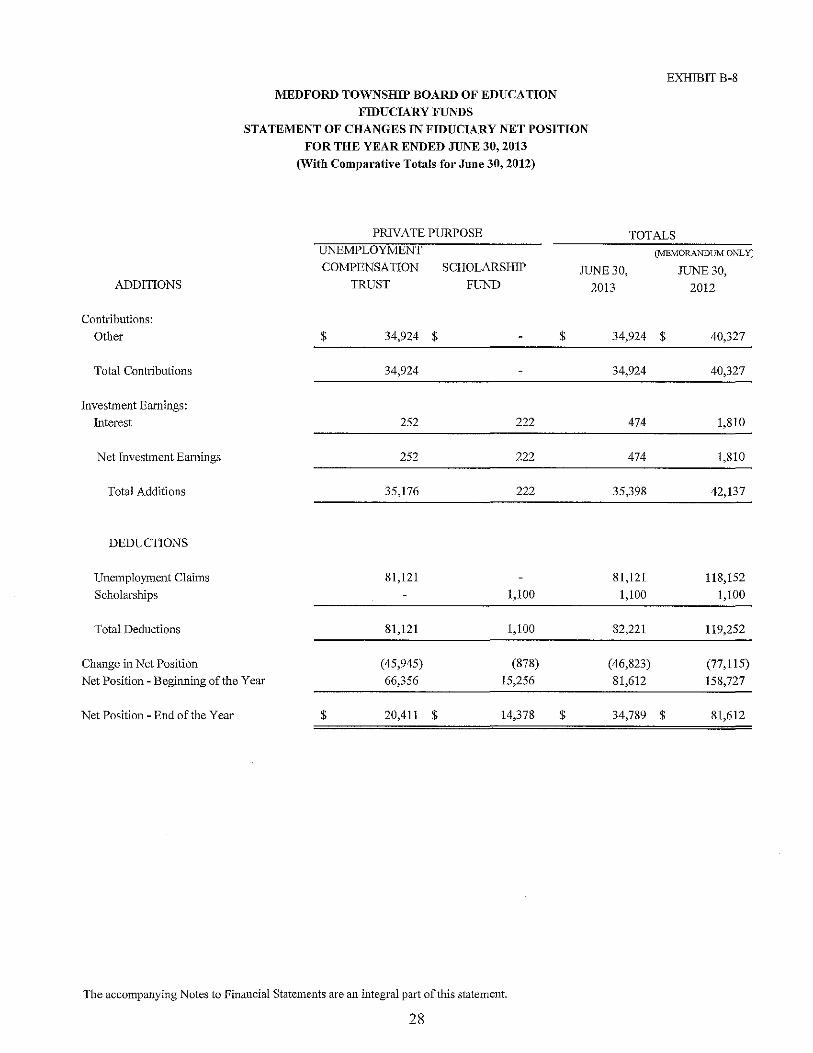
MEDFORD TOWNSHIP BOARD OF EDUCATION
FIDUCIARY FUNDS
STATEMENT OF CI-IANGES IN FIDUCIARY NET POSITION
FOR THE YEAR ENDED JUNE 30, 2013
(With Comparative Totals for June 30, 2012)
PRIVATE PURPOSE
UNEMPLOYMENT
EXHIBITB-8
TOTALS
(1vfEMORANDU1vl: ONLY:
COMPENSATION SCHOLARSHIP JUNE 30, JUNE 30, ADDITIONS TRUST FUND 2013 2012
Contributions:
Other $ 34,924 $ $ 34,924 $ 40,327
Total Contributions 34,924 34,924 40,327
Investment Eamings:
Interest 252 222 474 1,810
Net Investment Eamings 252 222 474 1,810
Total Additions 35,176 222 35,398 42,137
DEDUCTIONS
Unemployment Claims 81,121 81,121 118,152
Scholarships 1,100 1,100 1,100
Total Deductions 81,121 1,100 82,221 119,252
Change in Net Position (45,945) (878) (46,823) (77,115)
Net Position - Beginning of the Year 66,356 15,256 81,612 158,727
Net Positioll- End of the Year $ 20,411 $ 14,378 $ 34,789 $ 81,612
The accompanying Notes to Financial Statements are an integral part of this statement.
28
MEDFORD TOWNSHIP BOARD OF EDUCATION
NOTES TO THE FINANCIAL STATEMENTS JUNE 30, 2013

MEDFORD TOWNSHIP BOARD OF EDUCATION
NOTES TO THE FINANCIAL STATEMENTS JUNE 30, 2013
Note 1. Summary of Siguificaut Accounting Policies
The accompanying financial statements of the Medford Township Board of Education have been prepared in conformity with generally accepted accounting principles as prescribed by the Governmental Acconnting Standards Board (GASB). In Jnne 1999 the GASB issued Statement 34 Basic Financial Statements - and Management's Discussion and Analysis - for State and Local Governments. This statement established new financial reporting reqnirements for state and local governmental entities throughout the United States. It also required new information and restructured much of the information that govenunents have presented in the past. Comparability with reports issued in prior years is affected.
The District implemented these standards for the fiscal year-ending June 30, 2003, with the implementation of GASB Statement 34; the District has prepared required supplementary information titled Management's Discussion and Analysis, which precedes the basic financial statements.
Other GASB Statements are required to be implemented in conjunction with GASB Statement 34. The District has implemented the followiug GASB Statements in the current fiscal year: Statement 63 -Financial Reporting of Deferred Outflows of Resources, Deferred Inflows of Resources, and Net Position.
In March 2012, the GASB issued Statement No. 65, Items Previously Reported as Assets and Liabilities. GASB Statement No. 65 reclassifies, as deferred outflows of resources or deferred inflows of resources, certain items that were previously reported as assets and liabilities and recognizes, as outflows of resources or inflows of resources, certain items that were previously reported as assets and liabilities. This Statement also provides other financial reporting guidance related to the impact of the financial statement elements deferred outflows of resources and deferred inflows of resources, such as changes in tl,e determination of the major fund calculations and limiting the use of the term deferred in financial statement presentations. The provisions of tl,is Statement are effective for financial statements for periods beginning after December 15, 2012. Management is currently evaluating the impact of the adoption of this Statement but it is expected to have a material impact on the financial statements for tlle year ended June 30, 2014.
The accompanying [mancial statements present the financial position of the District and the various funds and fund types, the results of operations of the District and the various funds and fund types, and the cash flows of the proprietary funds. The financial statements are presented as of June 30,2013 and for the year then ended with comparative totals as of and for the year ended June 30, 2012 (Memorandum Only).
A. Reporting Entity:
The Medford Township Board of Education is a Type II district located in the County of Burlington, State of New Jersey. As a Type II district, tl,e School District functions independently through a Board of Education. The operations of the District include five elementary schools located in Medford Township. The Medford Township Board of Education has an approximate enrollment at June 30, 2013 of2,933 students.
29
MEDFORD TOWNSHIP BOARD OF EDUCATION
NOTES TO THE FINANCIAL STATEMENTS (continued): JUNE 30, 2013
Note 1. Summary of Significant Accounting Policies (continued):
A. Reporting Entity (continued):
The primary criterion for including activities within the District's reporting entity, as set forth in Section 2100 of the GASB Codification of Governmental Accounting and Financial Reporting Standards, is whether:
• • • • • •
the organization is legally separate (can sue or be sued in their own name); the District holds the corporate powers of the organization; the District appoints a voting majority of the organization's board the District is able to impose its will on the organization; the organization has the potential to impose a [mancial benefitlburden on the District there is a fiscal dependency by the organization on the District.
Based on the aforementioned criteria, the District has no component units.
B. District-Wide and Fund Financial Statements
The district-wide financial statements (the statement of net position and the statement of activities) report information of all of the nonfiduciary activities of the District. For the most part, the effect of interfund activity has been removed from these district-wide statements. District activities, which normally are supported by taxes and intergovernmental revenues, are reported separately from business-type activities, which rely to a significant extent on fees and charges for support.
The statement of activities demonstrates the degree to which the direct expenses of a given function, segment or component unit are offset by program revennes. Direct expenses are those that are clearly identifiable with a specific function, segment, or component unit. Program revenues include charges to customers who purchase, use or directly benefit from goods or services provided by a given function, segment or component unit. Program revenues also include grants and contributions that are restricted to meeting the operational or capital requirements of a particular function, segment, or component unit. Taxes and other items not properly included among program revenues are reported instead as general revenues. The District does not allocate general government (indirect) expenses to other functions.
Net position are restricted when constraints placed on them are either externally imposed or are imposed by constitutional provisions or enabling legislation. Internally imposed designations of resources are not presented as restricted net position. When both restricted and unrestricted resources are available for use, generally it is the District's policy to use restricted resources first, and then unrestricted resources as they are needed.
Separate [mancial statements are provided for governmental funds, proprietary funds, fiduciary funds and similar component units, and major component units. However, the fiduciary funds are not included in the district-wide statements. Major individual governmental funds and major individual enterprise funds are reported as separate columns in the fund [mancial statements.
30
MEDFORD TOWNSHIP BOARD OF EDUCATION
NOTES TO THE FINANCIAL STATEMENTS (continued): JUNE 30, 2013
Note 1. Summary of Significant Acconnting Policies (continned):
C. Measnrement Focns, Basis of Acconnting and Financial Statement Presentation
District-Wide Financial Statements - The governmental fund financial statements are reported nsing the economic resources measurement focus and the accrual basis of accounting. Revenues are recorded when earned and expenses are recorded when a liability is incurred, regardless of the timing of related cash flows. Grants and similar items are recognized as revenue as soon as all eligibility requirements imposed by the provider have been met.
Governmental Fund Financial Statements - The Govermnental fund financial statements are reported using the current financial resources measurement focus and the modified accrual basis of accounting. Revenues are recognized as soon as they are both measurable and available. Revenues are considered to be available when they are collectible within the current period or soon enough thereafter to pay liabilities of the current period. For this purpose, the District considers revenues to be available if they are collected within 60 days of the end of the current fiscal year-end. Principal revenue sources considered susceptible to accrual include federal and state grants, interest on investments, tuition and transportation. Other revenues are considered to be measurable and available only when cash is received by the state.
Expenditures generally are recorded when a liability is incurred, as under accrual accounting.
D. Fund Accounting:
The acconnts of Medford Township Board of Education are maintained in accordance with the principles of fund acconnting to ensure observance of limitations and restrictions on the resources available. The principles of fund accounting require that resources be classified for accounting and reporting purposes into funds or account groups in accordance with activities or objectives specified for the resources. The operations of each fund are accounted for with a separate set of self-balancing accounts that comprise its assets, liabilities, fund equity, revenues and expenditures or expenses, as appropriate. Goverrunent resources are allocated to and accounted for in individual funds based upon the purposes for which they are to be spent and the means by which spending activities are controlled. The various funds are grouped, in the financial statements in this report, into seven fund types within three broad fund categories.
Governmental Funds
General Fund - The general fund is the general operating fund of the Medford Township Board of Education and is used to account for all financial resources except those required to be accounted for in another fund. Included are certain expenditures for vehicles and movable instructional or noninstructional equipment which are classified in the Capital Outlay subfund.
As required by the New Jersey Department of Education Medford Township Board of Education includes budgeted Capital Outlay in this fund. Generally accepted accounting principles as they pertain to governmental entities state that General Fund resources may be nsed to directly finance capital outlays for long-lived improvements as long as the resources in such cases are derived exclusively from unrestricted revenues.
31
MEDFORD TOWNSHIP BOARD OF EDUCATION
NOTES TO THE FINANCIAL STATEMENTS (continued): JUNE 30, 2013
Note 1. Summary of Significant Accounting Policies (continued):
D. Fund Accounting (continued):
Governmental Fnnds (continned):
Resources for budgeted capital outlay purposes are nonually derived from State of New Jersey Aid, interest earnings and appropriated fund balance. Expenditures are those that result in the acquisition of or additions to fixed assets for land, existing buildings, improvements of grounds, construction of buildings, additions to or remodeling of buildings and the purchase of built-in equipment. These resources can be transferred from and to Current Expense by board resolution.
Special Revenue Fund - The Special Revenue Fund is used to account for the proceeds of specific revenue from State and Federal Government, (other than major capital projects, Debt Service or the Enterprise Funds) and local appropriations that are legally restricted to expenditures for specified purposes.
Capital Projects Fund - The capital projects fund is used to account for all financial resources to be used for the acquisition or construction of major capital facilities (other than those financed by proprietary funds).
Debt Service Fund - The debt service fund is used to account for the accumulation of resources for, and the payment of principal and interest on bonds issued to finance major property acquisition, construction and improvement programs.
Proprietary Fund
The focus of Proprietary Fund measurement is upon detenuination of net income, financial position and cash flows. The generally accepted accounting principles applicable are those similar to businesses in the private sector. The following is a description of the Proprietary Funds of the District:
Enterprise - The enterprise fund is used to account for the operations that are financed and operated in a manner similar to a private business enterprise. The costs of providing goods or services are financed primarily through user charges; or, where the District has decided that periodic detenuination of reveuues earned, expeuses incurred, and/or net income is appropriate for capital maintenance, public policy, management control, accountability or other purposes.
All Proprietary funds are accounted for on a cost of services or "capital maintenance" measurement focus. This means that all assets and all liabilities, whether current or noncurrent, associated with their activity are included on their balance sheets. Their reported fund equity (net position) is segregated into contributed capital and unreserved retained earnings, if applicable. Proprietary fund type operating statements present increases (revenues) and decreases (expenses) in net total position.
32
MEDFORD TOWNSHIP BOARD OF EDUCATION
NOTES TO THE FINANCIAL STATEMENTS (continned): JUNE 30, 2013
Note 1. Summary of Significant Accounting Policies (continned):
D. Fund Accounting (continned):
Proprietary Fund (continued)
Depreciation of all exhaustive fixed assets used by proprietary funds is charged as an expense against their operations. Accumulated depreciation is reported on proprietary fmld balance sheets. Depreciation has been provided over the estimated useful lives using the straight-line-method.
The District's enterprise fund is comprised of the following:
• Food Service Fund - This fund accounts for the revenues and expenses pertaining to the District's cafeteria operations.
Fiduciary Fnnd
Fiduciary funds are used to account for assets held by a governmental entity for other parties (either as trustee or as an agent) and that cannot be used to finance the governmental entity's own operating programs which includes private purpose trust funds and agency funds
Private Purpose Trust Funds are used to account for the principal and income for trust arrangements that benefit individuals, private organizations, or other governments. The district currently maintains an Unemployment Trust Fund and a Scholarship Fund as private purpose trusts.
Agency Funds are assets held by a governmental entity (either as trustee or as an agent) for other parties that camlOt be used to finance the govermnental entity's own operating programs. The district currently maintains Payroll funds and Student Activity Funds as Agency Fwds.
E. Basis of Accounting
The accounting and financial reporting treatment applied to a fund is deteffilined by its measurement focus. All govermnental funds and private purpose trust funds are accounted for using a current financial resources measurement focus. With this measurement focns, only current assets and current liabilities generally are included on tlle balance sheet. Operating statemeuts of these funds present increases (i.e., revenues and other financing sources) and decreases (i.e., expenditures and other fmancing uses) in net current assets.
All proprietary funds are accounted for on a flow of economic resources measurement focus. With this measurement focus, all assets and all liabilities associated with the operation of these funds are included on the balance sheet. Fund equity (i.e., net total position) is segregated into contributed capital and retained eamings components. Proprietary fmld-type operating statements present increases (i.e., revenues) and decreases (i.e., expenses) in net total position.
33
MEDFORD TOWNSHIP BOARD OF EDUCATION
NOTES TO THE FINANCIAL STATEMENTS (continued): JUNE 30, 2013
Note 1. Summary of Significant Accounting Policies (continued):
E. Basis of Accounting (continued):
The modified accrual basis of accounting is used for measuring financial position and operating results of all governmental fund types, private purpose trust funds and agency funds. Under the modified accrual basis of accounting, revenues are recognized when they become both measurable and available. "Measurable" means the amount of the transaction can be determined and "available" means collectible within the current period or soon enough thereafter to be used to pay liabilities of the current period. State equalization monies are recognized as revenue during the period in which they are appropriated. A one-year availability period is used for revenue recognition for all other governmental fund revenues. Expenditures are recognized in the accounting period in which the fund liability is incurred, except for principal and interest on general long-term debt which are recorded when due.
In its accounting and financial reporting, the Medford Township Board of Education follows the pronouncements of the Governmental Accounting Standards Board (GASB) and the pronouncements of the Financial Accounting Standards Board (FASB) and its predecessor organizations issued on or before November 30, 1989, unless they conflict with or contradict GASB pronouncements. The Medford Township Board of Education's proprietary funds have elected not to apply the standards issued by FASB after November 30,1989.
The accrual basis of accounting is used for measuring financial position and operating results of proprietary fund types and private purpose trust funds. Under this method, revennes are recognized in the accounting period in which they are earned and expenses are recognized when they are incurred.
F. Budgets/Budgetary Control
Annual appropriated budgets are prepared in the spring of each year for the general, special revenue and debt service funds. The budgets are submitted to the county office and are voted upon at the annual school election on the third Tnesday in April. Effective January 17, 2012, P.L.2011 c.202 eliminated the annual voter referendum on budgets which met the statutory tax levy cap limitations and the board of education members are elected at the November general election. Budgets are prepared using the modified accrual basis of accounting. The legal level of budgetary control is established at line item accounts within each fund. Line item accounts are defined as the lowest (most specific) level of detail as established pursuant to the minimum chart of accounts referenced in NJA.C.6:20-2A(m)1. All budget amendments must be approved by School Board resolution.
Formal budgetary integration into the accounting system is employed as a management control device during the year. For governmental funds there are no substantial differences between the budgetary basis of accounting and generally accepted accounting principles with the exception of the legally mandated revenue recognition of the last state aid payment for budgetary purposes only and the special revenue fund as noted below. Encumbrance accounting is also employed as an extension of formal budgetary integration in the governmental fund types. Unencumbered appropriations lapse at fiscal year-end.
34
MEDFORD TOWNSHIP BOARD OF EDUCATION
NOTES TO THE FINANCIAL STATEMENTS (continued): JUNE 30, 2013
Note 1. Summary of Significant Accountiug Policies (continued):
F. BudgetslBudgetary Control (continued):
The accounting records of the special revenue fund are maintained on the grant accounting budgetary basis. The grant accounting budgetary basis differs from GAAP in that the grant accounting budgetary basis recognizes encumbrances as expenditures and also recognizes the related revenues, whereas the GAAP basis does not. Sufficient supplemental records are maintained to allow for the presentation of GAAP basis financial reports.
The budget, as detailed on Exhibit C-l, includes all amendments to the adopted budget, if any.
G. Encumbrances
Under encumbrance accounting purchase orders, contracts and other commitments for the expenditure of resources are recorded to reserve a portion of the applicable appropriation. Open encumbrances in governmental funds other than the special revenue fund are reported as reservations of fund balances at fiscal year-end as they do not constitute expenditures or liabilities but rather commitments related to unperformed contracts for goods and services.
Open encumbrances in the special revenue fund for which the Medford Township Board of Education has received advances are reflected in the balance sheet as deferred revenues at fiscal year-end.
The encumbered appropriation authority carries over into the next fiscal year. An entry will be made at the beginning of the next fiscal year to increase the appropriation reflected in the certified budget by the outstanding encumbrance amount as of the current fiscal year-end.
H. Cash and Cash Equivalents
Cash and Cash equivalents include petty cash, change funds, cash in banks and all highly liquid investments with a maturity of three months or less at the time of purchase and are stated at cost plus accrued interest. U.S. Treasury and agency obligations and certificates of deposit with maturities of one year or less when purchased are stated at cost.
New Jersey School Districts are limited as to the types of investments and types of financial institutions they may invest in. NJS.lSA:20-37 provides a list of permissible investments that may be purchased by New Jersey school districts.
Additionally, the District has adopted a cash management plan that reqnires it to deposit public fmlds in public depositories protected from loss nnder the provisions of the Governmental Unit Deposit Protection Act ("GUDPA"). GUDPA was enacted in 1970 to protect Governmental Units from loss of funds on deposit with a failed banking institution in New Jersey.
35
MEDFORD TOWNSHIP BOARD OF EDUCATION
NOTES TO THE FINANCIAL STATEMENTS (continued): JUNE 30, 2013
Note 1. Summary of Significant Acconnting Policies (continued):
H. Cash and Cash Equivalents (continued):
NJS.A.17:9-41 et. Seq. establishes the requirements for the security of deposits of governmental units. The statute requires that no governmental unit shall deposit public funds in a public depository unless such funds are secured in accordance with the Act. Public depositories include Savings and Loan institutions, banks (both state and national banks) and savings banks the deposits of which are federally insured. All public depositories must pledge collateral, having a market value at least equal to five percent of the average daily balance of collected public funds, to secure the deposits of Governmental Units. If a public depository fails, the collateral it has pledged, plus the collateral of all other public depositories, is available to pay the full amount of their deposits to the Governmental Units.
I. Tuition ReceivablelPayable
Tuition charges were established by the Board of Education based on estimated costs. The charges are snbject to adjustment when the fmal costs have been determined.
These adjustments are recorded upon certification by the State Board of Education, which is nonnally three years following the contract year. The cumulative adjustments through June 30, 2013, which have not been recorded, are not determinable.
The tuition rate adjustments for the years 2010-2011 have been established. According to the School District's records, these amounts of adjustments are immaterial to the financial statements.
J. Inventories & Prepaid Expenses
Inventories are valued at cost, which approximates market. The costs are determined on a first-in, firstout method.
The cost of inventories in governmental fund types is recorded as expenditures when purchased rather than when consumed.
Prepaid expenses, which benefit future periods, other than those recorded in the enterprise funds, are recorded as expenditures during the year of purchase. Prepaid expenses in the enterprise fund represent payments made to vendors for services that will benefit periods beyond June 30, 2013.
K. Short-Term Interfund ReceivabJeslPayables
Short-term interfund receivables/payables represent amounts that are owed, other than charges for goods or services rendered to/from a particular fund in the Medford Township Board of Education and that are due within one year.
36
MEDFORD TOWNSHIP BOARD OF EDUCATION
NOTES TO THE FINANCIAL STATEMENTS (continued): JUNE 30, 2013
Note 1. Snmmary of Significant Accountiug Policies (continued):
L. Capital Assets
General fixed assets acquired or constructed during the year are reported in the applicable governmental or business-type activities columns in the district-wide financial statements. Fixed assets are defined by the District as assets, which have a cost in excess of $2,000 at the date of acquisition and a useful life of one year Of more. Donated fixed assets are valued at their estimated fair market value ou the date received. The general fixed assets acquired or coustructed were valued by an independent appraisal company. General fixed assets, such as land and buildings, are valued at the historical cost basis and through estimated procedures performed by an independent appraisal company, respectively.
General fixed assets are reflected as expenditures in the applicable governmental funds. Depreciation expense is recorded in the district-wide fmancial statements as well as the proprietary fund. Capital assets are depreciated on the straight-line method over the assets' estimated useful life. There is no depreciation recorded for land and construction in progress. Generally estimated useful lives are as follows:
Machinery & Equipment Building & Other Improvements
M. Accrued Salaries and Wages
3 -20 Years 7 - 60 Years
District employees, who provide services to the District over the ten-month academic year and extended eleven-month calendar, do not have the option to have their salaries disbursed during the entire twelvemonth year. Therefore, there is no accrual as of June 30, 2013 for such salaries.
N. Compensated Absences
Compensated absences are those absences for which employees will be paid, such as vacation, sick leave and sabbatical leave. A liability for compensated absences that are attributable to services already rendered, and that are not contingent on a specific event that is outside the control of the District and its employees, is accrued as the employees earn the rights to the benefits. Compensated absences that relate to future services, or that are contingent on a specific event that is outside the control of the District and its employees, are accounted for in the period in which such services are rendered or in which such events take place.
In the District-Wide financial statements, under governmental activities, compensated absences are reported as an expenditure and noncurrent liabilities.
O. Unearned Revenue
Deferred revenue in the special revenue fund represeuts cash, which has been received but not yet earned.
37
MEDFORD TOWNSmP BOARD OF EDUCATION
NOTES TO THE FINANCIAL STATEMENTS (continued): JUNE 30, 2013
Note 1. Summary ofSiguificaut Accouutiug Policies (coutiuued):
P. Loug-term Obligations
In district-wide financial statements, under governmental activities, long-term debt is recognized as a liability in the general fund as debt is incurred.
Q. Fnnd Balance
In accordance with Government Accounting Standards Board 54, Fund Balance Reporting and Governmental Fund Type Definitions, the Medford Township Board of Education classifies governmental fund balances as follows:
• Non-spendable - includes fund balance amounts that camlOt be spent either because it is not in spendable form or because legal or contractual constraints.
o Restricted - includes fund balance amounts that are constrained for specific purposes which are externally imposed by external parties, constitutional provision or enabling legislation.
• Committed - includes fund balance amounts that are constrained for specific purposes that are internally imposed by the govermnent through formal action of the highest level of decision making authority and does not lapse at year-end.
e Assigned - includes fund balance amonnts that are intended to be nsed for specific purposes that are neither considered restricted or committed. Fund Balance may be assigned by the Business Administrator.
• Unassigned - inclndes balance within the General Fund which has not been classified within the above mentioned categories and negative fund balances in other governmental funds.
The Medford Township Board of Education uses restricted/committed amounts to be spent first when both restricted and unrestricted fund balance is available, unless prohibited by law or regnlation. Additionally, the Medford Township Board of Education would first use committed, then assigned and lastly unassigned amounts of unrestricted fund balance when expenditures are made.
R. Management's Estimates
The preparation of financial statements in conformity with generally accepted accounting principles requires management to make estimates and assumptions that affect the reported amounts of revenues and expenditures/expenses during the reporting period. Actual results could differ from those estimates
S. Subsequent Events
Medford Township Board of Education has evaluated subsequent events occurring after June 30, 2013 through the date of October 15, 2013, which is the date the financial statements were available to be issued.
Note 2. Cash and Cash Equivalents
The District is governed by the deposit limitations of New Jersey state law. The Deposits held at June 30,2013 and reported at fair value are as follows:
38
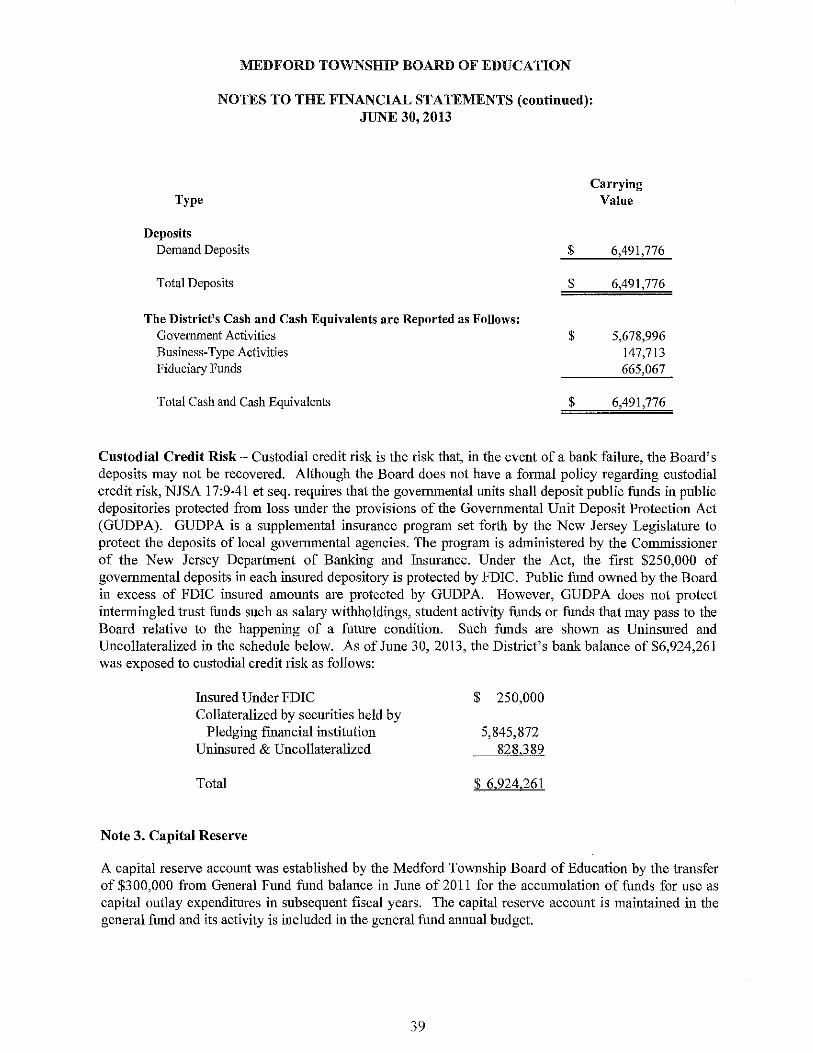
MEDFORD TOWNSHIP BOARD OF EDUCATION
NOTES TO THE FINANCIAL STATEMENTS (continned): JUNE 30, 2013
Type
Deposits Demand Deposits
Total Deposits
The District's Cash and Cash Equivalents are Reported as Follows: Government Activities Business· Type Activities Fiduciary Funds
Total Cash and Cash Equivalents
$
$
$
$
Carrying Value
6,491,776
6,491,776
5,678,996 147,713 665,067
6,491,776
Cnstodial Credit Risk - Custodial credit risk is the risk that, in the event of a bank failure, the Board's deposits may not be recovered. Although the Board does not have a formal policy regarding custodial credit risk, NJSA 17:9·41 et seq. requires that the governmental units shall deposit public funds in public depositories protected from loss under the provisions of the Governmental Uuit Deposit Protection Act (GUDPA). GUDPA is a supplemental insurance program set forth by the New Jersey Legislature to protect the deposits of local governmental agencies. The program is administered by the Commissioner of the New Jersey Department of Banking and h,surance. Under the Act, the fIrst $250,000 of governmental deposits in each insured depository is protected by FDIC. Public fund owned by the Board in excess of FDIC insured amounts are protected by GUDP A. However, GUDPA does not protect intermingled trnst funds such as salary withho Idings, student activity funds or funds that may pass to the Board relative to the happening of a future condition. Such funds are shown as Uninsured and Uncollateralized in the schedule below. As of June 30,2013, the District's bank balance of $6,924,261 was exposed to custodial credit risk as follows:
Insured Under FDIC Collateralized by securities held by
Pledging fInancial institution Uninsured & Uncollateralized
Total
Note 3. Capital Reserve
$ 250,000
5,845,872 828,389
$ 6.924.261
A capital reserve account was established by the Medford Township Board of Education by the transfer of $300,000 from General Fund fund balance in June of 2011 for the accumulation of fnnds for use as capital outlay expenditures in subsequent fiscal years. The capital reserve account is maintained in the general fund and its activity is included in the general fund annual budget.
39
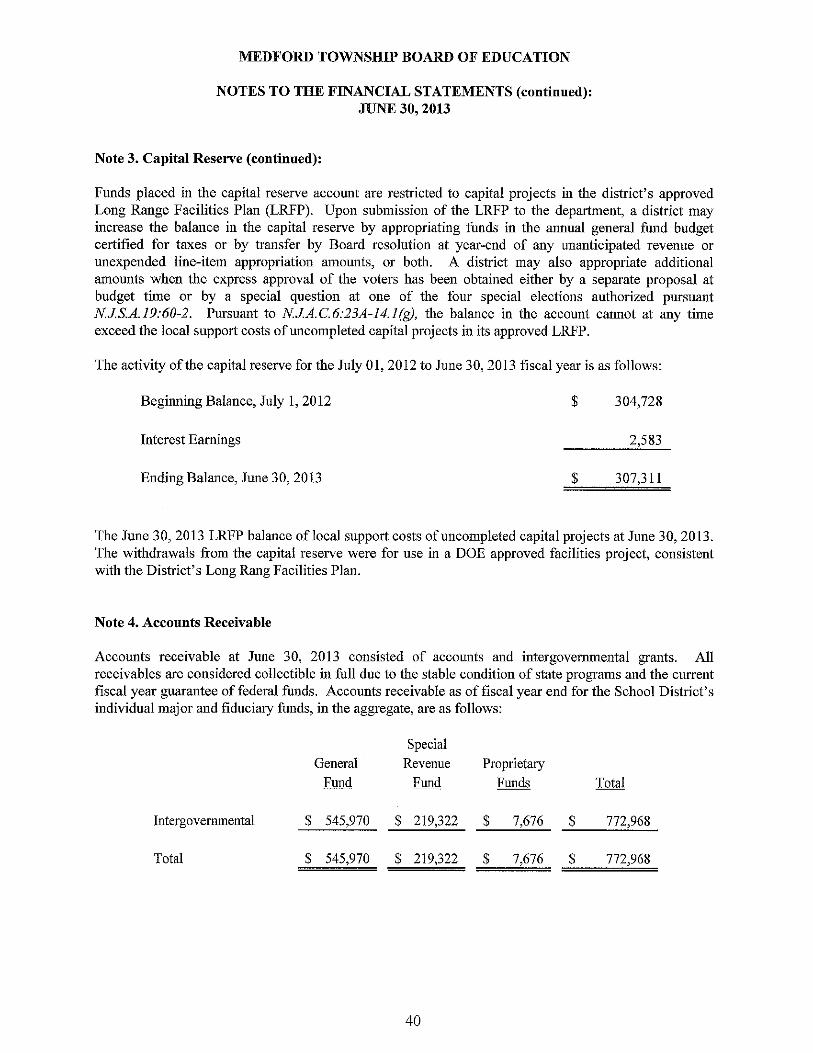
MEDFORD TOWNSHIP BOARD OF EDUCATION
NOTES TO THE FINANCIAL STATEMENTS (continned): JUNE 30, 2013
Note 3. Capital Reserve (continued):
Funds placed in the capital reserve account are restricted to capital projects in the district's approved Long Range Facilities Plan (LRFP). Upon submission of the LRFP to the department, a district may increase the balance in the capital reserve by appropriating funds in the annual general fund budget certified for taxes or by transfer by Board resolution at year-end of any unanticipated revenue or unexpended line-item appropriation amounts, or both. A district may also appropriate additional amounts when the express approval of the voters has been obtained either by a separate proposal at budget time or by a special question at one of the four special elections authorized pursuant NJS.A.19:60-2. Pursuant to NJA.C6:23A-14.1(g), the balance in the account cannot at any time exceed the local support costs of uncompleted capital projects in its approved LRFP.
The activity of the capital reserve for the July 01, 2012 to June 30, 2013 fiscal year is as follows:
Beginning Balance, July 1,2012 $ 304,728
Interest Earnings 2,583
Ending Balance, June 30, 2013 $ 307,311
The June 30, 2013 LRFP balance oflocal support costs of uncompleted capital projects at June 30, 2013. The withdrawals from the capital reserve were for use in a DOE approved facilities project, consistent with the District's Long Rang Facilities Plan.
Note 4. Accounts Receivable
Accounts receivable at June 30, 2013 consisted of accounts and intergovernmental grants. All receivables are considered collectible in full due to the stable condition of state programs and the current fiscal year guarantee of federal funds. Accounts receivable as of fiscal year end for the School District's individual major and fiduciary funds, in the aggregate, are as follows:
Special General Revenue Proprietary
Fund Fund Funds Total
Intergovernmental $ 545,970 $ 219,322 $ 7,676 $ 772,968
Total $ 545,970 $ 219,322 $ 7,676 $ 772,968
40
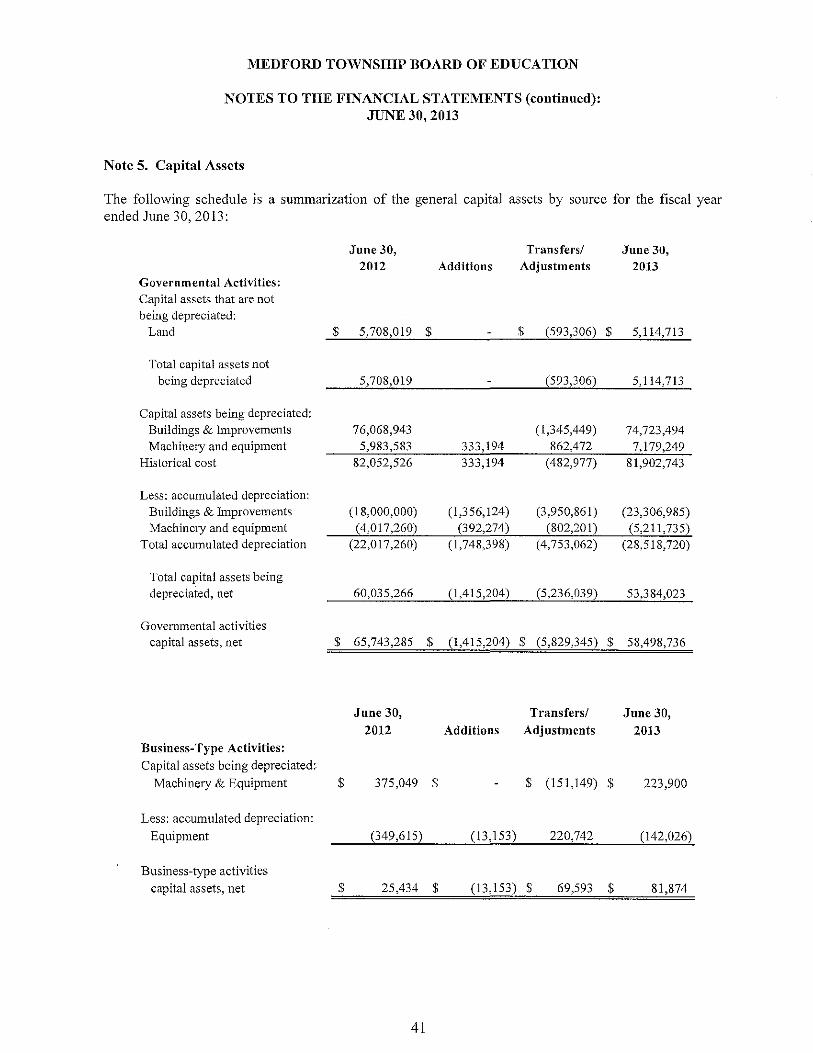
MEDFORD TOWNSHIP BOARD OF EDUCATION
NOTES TO THE FINANCIAL STATEMENTS (continued): JUNE 30, 2013
Note 5. Capital Assets
The following schedule is a summarization of the general capital assets by source for the fiscal year ended June 30, 2013:
June 30, Transfers/ June 30, 2012 Additions Adjustments 2013
Governmental Activities: Capital assets that are not being depreciated:
Land $ 5,708,019 $ $ (593,306) $ 5,114,713
Total capital assets not being depreciated 5,708,019 (593,306) 5,114,713
Capital assets being depreciated: Buildings & Improvements 76,068,943 (1,345,449) 74,723,494 Machinery and equipment 5,983,583 333,194 862,472 7,179,249
Historical cost 82,052,526 333,194 (482,977) 81,902,743
Less: accumulated depreciation: Buildings & Improvements (18,000,000) (1,356,124) (3,950,861) (23,306,985) Machinery and equipment (4,017,260) (392,274) (802,201) (5,211,735)
Total accumulated depreciation (22,017,260) (1,748,398) (4,753,062) (28,518,720)
Total capital assets being depreciated, net 60,035,266 (1,415,204) (5,236,039) 53,384,023
Governmental activities capital assets, net $ 65,743,285 $ (1,415,204) $ (5,829,345) $ 58,498,736
June 30, Transfersl June 30, 2012 Additions Adjustments 2013
Business-Type Activities: Capital assets being depreciated:
Machinery & Equipment $ 375,049 $ $ (151,149) $ 223,900
Less: accumulated depreciation:
Equipment (349,615) (13,153) 220,742 (142,026)
Business-type activities capital assets, net $ 25,434 $ (13,153) $ 69,593 $ 81,874
41
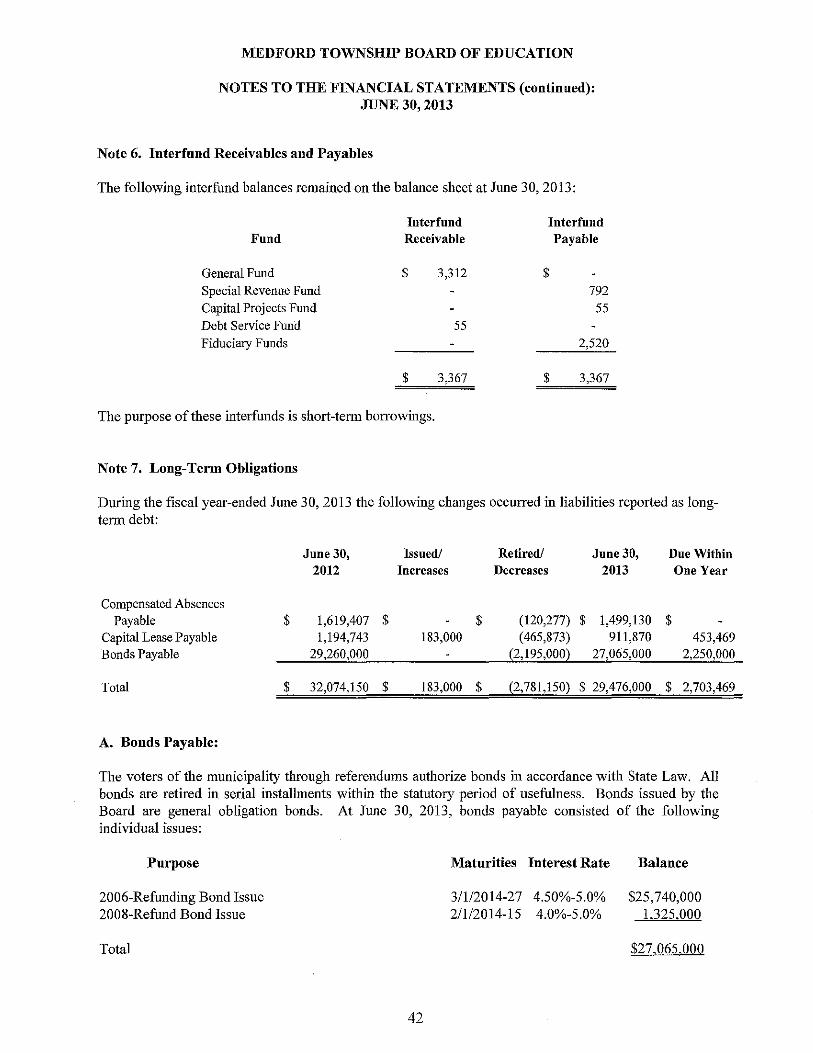
MEDFORD TOWNSHIP BOARD OF EDUCATION
NOTES TO THE FINANCIAL STATEMENTS (continued): JUNE 30, 2013
Note 6. Interfund Receivables and Payables
The following interfund balances remained on the balance sheet at June 30, 2013:
Interfund Interfund Fund Receivable Payable
General Fund $ 3,312 $ Special Revenue Fund 792 Capital Projects Fund 55 Debt Service Fund 55 Fiduciary Funds 2,520
$ 3,367 $ 3,367
The purpose of these interfunds is short-tenn borrowings.
Note 7. Long-Term Obligations
During the fiscal year-ended June 30, 2013 the following changes occurred in liabilities reported as longtenn debt:
June 30, Issued! Retired! June 30, Due Within 2012 Increases Decreases 2013 One Year
Compensated Absences Payable $ 1,619,407 $ $ (120,277) $ 1,499,130 $
Capital Lease Payable 1,194,743 183,000 (465,873) 911,870 453,469 Bonds Payable 29,260,000 (2,195,000) 27,065,000 2,250,000
Total $ 32,074,150 $ 183,000 $ (2,781,150) $ 29,476,000 $ 2,703,469
A. Bonds Payable:
The voters of the municipality through referendums authorize bonds in accordance with State Law. All bonds are retired in serial installments within the statutory period of nsefulness. Bonds issued by the Board are general obligation bonds. At June 30, 2013, bonds payable consisted of the following individual issues:
Pnrpose
2006-Refunding Bond Issue 200S-Refund Bond Issue
Total
42
Maturities Interest Rate
3/1/2014-27 4.50%-5.0% 2/1/2014-15 4.0%-5.0%
Balance
$25,740,000 1,325,000
$27 065,000
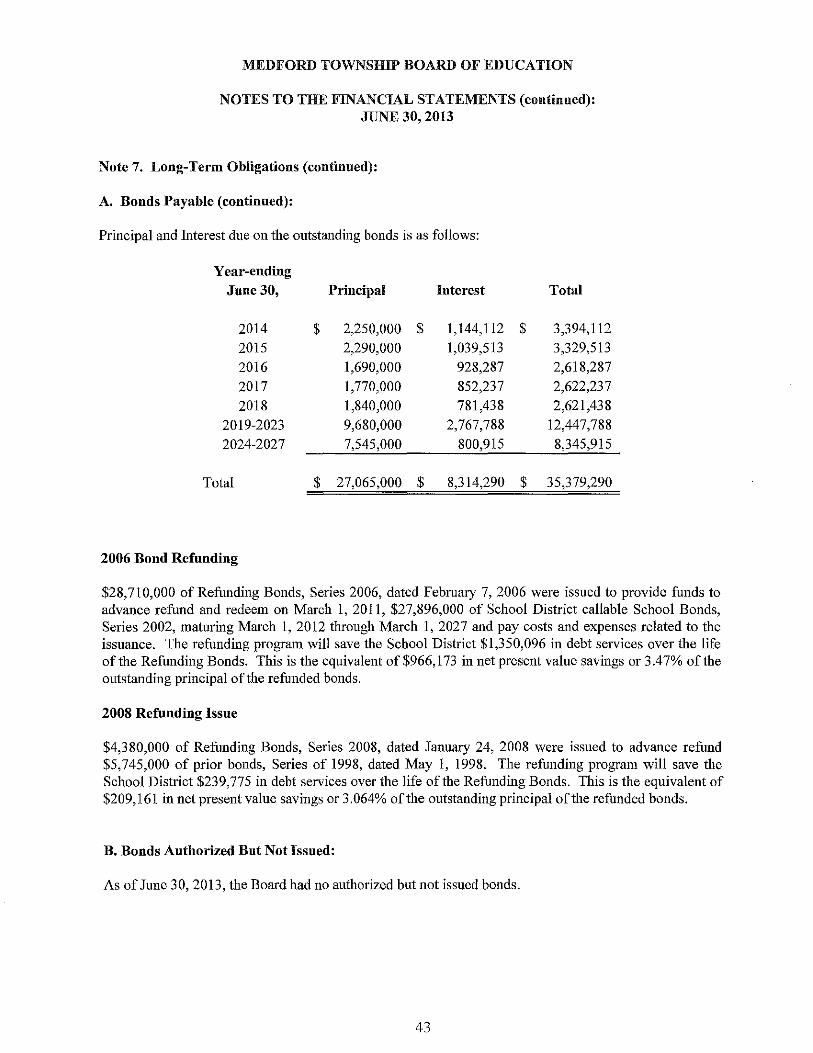
MEDFORD TOWNSHIP BOARD OF EDUCATION
NOTES TO THE FINANCIAL STATEMENTS (continned): JUNE 30, 2013
Note 7. Long-Term Obligations (continued):
A. Bonds Payable (continued):
Principal and futerest due on the outstanding bonds is as follows:
Year-ending Jnne 30, Principal Interest Total
2014 $ 2,250,000 $ 1,144,112 $ 3,394,112 2015 2,290,000 1,039,513 3,329,513 2016 1,690,000 928,287 2,618,287 2017 1,770,000 852,237 2,622,237 2018 1,840,000 781,438 2,621,438
2019-2023 9,680,000 2,767,788 12,447,788 2024-2027 7,545,000 800,915 8,345,915
Total $ 27,065,000 $ 8,314,290 $ 35,379,290
2006 Bond Refunding
$28,710,000 of Refunding Bonds, Series 2006, dated February 7, 2006 were issued to provide funds to advance refuud and redeem on March 1, 2011, $27,896,000 of School District callable School Bonds, Series 2002, maturing March I, 2012 through March 1, 2027 and pay costs and expenses related to the issuance. The refunding program will save the School District $1,350,096 in debt services over the life of the Refunding Bonds. This is the equivalent of $966,173 in net present value savings or 3.47% of the outstanding principal of the refunded bonds.
2008 Refunding Issue
$4,380,000 of Refunding Bonds, Series 2008, dated January 24, 2008 were issued to advance refund $5,745,000 of prior bonds, Series of 1998, dated May I, 1998. The refunding program will save the School District $239,775 in debt services over the life of the Refuuding Bonds. This is the equivalent of $209,161 in net present value savings or 3.064% of the outstanding principal ofthe refunded bonds.
B. Bonds Authorized But Not Issued:
As of June 30, 2013, the Board had no authorized but not issued bonds.
43
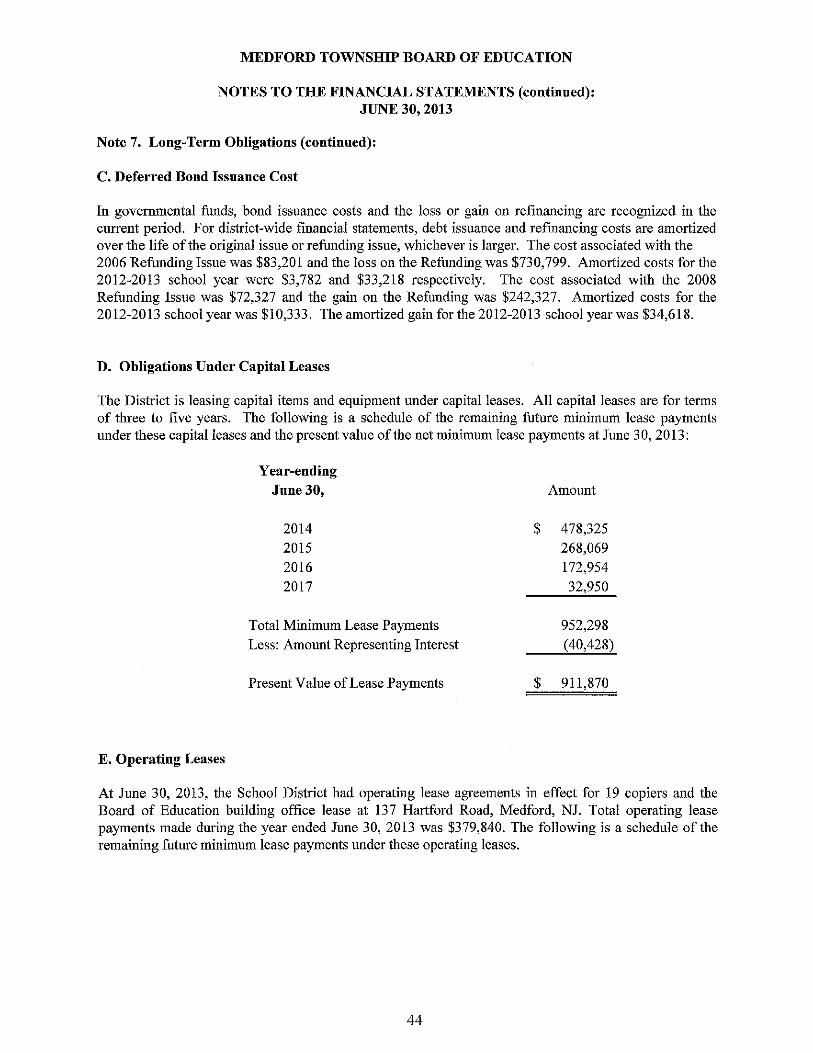
MEDFORD TOWNSHIP BOARD OF EDUCATION
NOTES TO THE FINANCIAL STATEMENTS (continued): JUNE 30, 2013
Note 7. Long-Term Obligations (continued):
C. Deferred Bond Issuance Cost
In govennnental funds, bond issuance costs aud the loss or gain on refinaucing are recognized in the cunent period. For district-wide financial statements, debt issuauce and refinancing costs are amortized over the life of the original issue or refunding issue, whichever is larger. The cost associated with the 2006 Refunding Issue was $83,201 and the loss on the Refunding was $730,799. Amortized costs for the 2012-2013 school year were $3,782 aud $33,218 respectively. The cost associated with the 2008 Refunding Issue was $72,327 and the gain on the Refunding was $242,327. Amortized costs for the 2012-2013 school year was $10,333. The amortized gain for the 2012-2013 school year was $34,618.
D. Obligations Under Capital Leases
The District is leasing capital items and eqnipment nnder capital leases. All capital leases are for tenus of three to five years. The following is a schedule of the remaining future minimum lease payments under these capital leases aud the present value of the net minimum lease payments at June 30, 2013:
Year-ending Jnne 30, Amount
2014 $ 478,325 2015 268,069 2016 172,954 2017 32,950
Total Minimum Lease Payments 952,298 Less: Amount Representing Interest (40,428)
Present Value of Lease Payments $ 911,870
E. Operating Leases
At June 30, 2013, the School District had operating lease agreements in effect for 19 copiers and the Board of Education building office lease at 13 7 Hartford Road, Medford, NJ. Total operating lease payments made during the year ended June 30, 2013 was $379,840. The following is a schedule of the remaining future minimum lease payments under these operating leases.
44
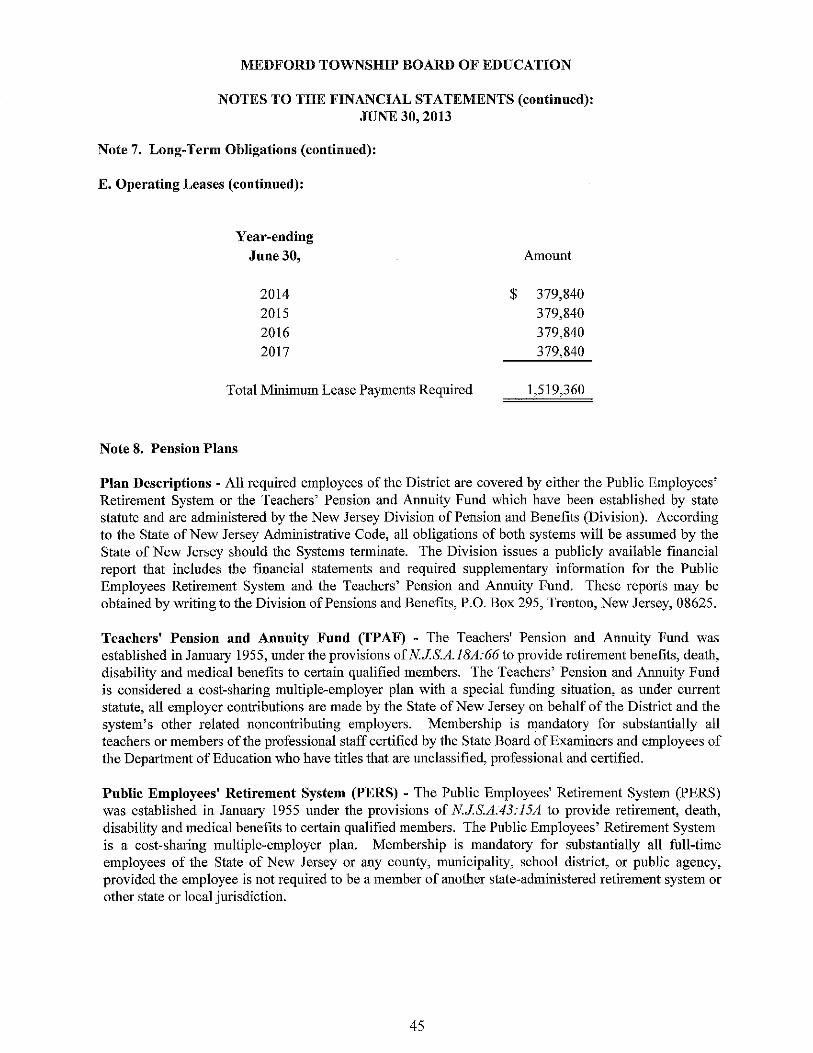
MEDFORD TOWNSHIP BOARD OF EDUCATION
NOTES TO THE FINANCIAL STATEMENTS (continued): JUNE 30, 2013
Note 7. Long-Term Obligations (continued):
E. Operating Leases (continned):
Year-ending Jnne 30,
2014 2015 2016 2017
Total Minimum Lease Payments Required
Note 8. Pension Plans
Amount
$ 379,840 379,840 379,840 379,840
1,519,360
Plan Descriptions - All required employees of the District are covered by either the Public Employees' Retirement System or the Teachers' Pension and Annuity Fund which have been established by state statute and are administered by the New Jersey Division of Pension and Benefits (Division). According to the State of New Jersey Administrative Code, all obligations of both systems will be assumed by the State of New Jersey should the Systems terminate. The Division issues a publicly available fmancial report that includes the financial statemeuts and required supplementary information for the Public Employees Retirement System and the Teachers' Pension and Annuity Fund. These reports may be obtained by writing to the Division of Pensions and Benefits, P.O. Box 295, Trenton, New Jersey, 08625.
Teachers' Pension and Annnity Fnnd (TPAF) - The Teachers' Pension and Annuity Fund was established in January 1955, under the provisions of NJS.A.18A:66 to provide retirement benefits, death, disability and medical benefits to certain qualified members. The Teachers' Pension and Arumity Fund is considered a cost-sharing multiple-employer plan with a special funding situation, as under current statute, all employer contributions are made by the State of New Jersey on behalf of the District and the system's other related noncontributing employers. Membership is mandatory for substantially all teachers or members of the professional staff certified by the State Board of Examiners and employees of the Department of Education who have titles that are unclassified, professional and certified.
Public Employees' Retirement System (PERS) - The Public Employees' Retirement System (PERS) was established iu January 1955 under the provisions of NJS.A.43:15A to provide retirement, death, disability and medical benefits to certain qualified members. The Public Employees' Retirement System is a cost-sharing multiple-employer plan. Membership is mandatory for substantially all full-time employees of the State of New Jersey or any county, municipality, school district, or public agency, provided the employee is not required to be a member of another state-administered retirement system or other state or local jurisdiction.
45
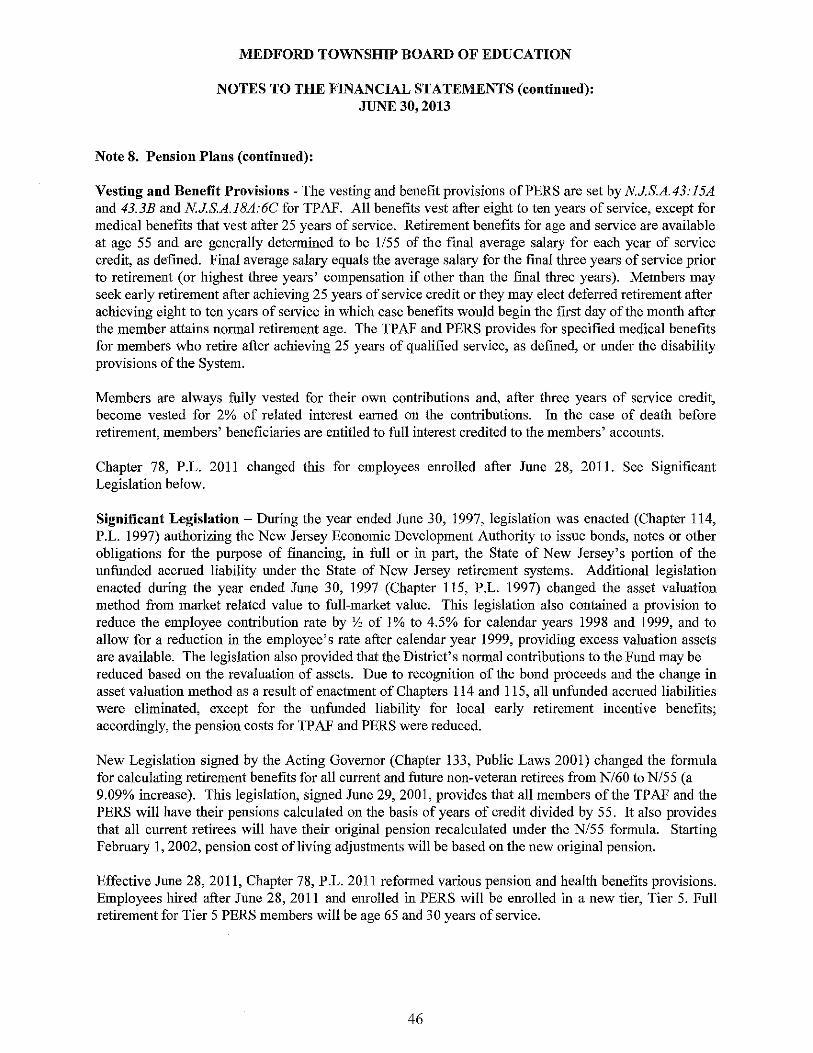
MEDFORD TOWNSHIP BOARD OF EDUCATION
NOTES TO THE FINANCIAL STATEMENTS (continued): JUNE 30, 2013
Note 8. Pensiou Plans (continued):
Vesting and Benefit Provisions - The vesting and benefit provisions ofPERS are set by NJS.A.43:15A and 43.3B and NJS.A.1SA:6C for TPAF. All benefits vest after eight to ten years of service, except for medical benefits that vest after 25 years of service. Retirement benefits for age and service are available at age 55 and are generally determined to be 1155 of the final average salary for each year of service credit, as defmed. Final average salary equals the average salary for the final three years of service prior to retirement (or highest three years' compensation if other than the fmal three years). Members may seek early retirement after achieving 25 years of service credit or they may elect deferred retirement after achieving eight to ten years of service in which case benefits would begin the first day of the month after the member attains normal retirement age. The TP AF and PERS provides for specified medical benefits for members who retire after achieving 25 years of qualified service, as defined, or under the disability provisions of the System.
Members are always fully vested for their own contributions and, after three years of service credit, become vested for 2% of related interest earned on the contributions. In the case of death before retirement, members' beneficiaries are entitled to full interest credited to the members' accounts.
Chapter 78, P.L. 2011 changed this for employees enrolled after June 28, 2011. See Significant Legislation below.
Significant Legislation - During the year ended June 30, 1997, legislation was enacted (Chapter 114, P.L. 1997) authorizing the New Jersey Economic Development Authority to issue bonds, notes or other obligations for the purpose of financing, in full or in part, the State of New Jersey's portion of the unfunded accrued liability under the State of New Jersey retirement systems. Additional legislation enacted during the year ended June 30, 1997 (Chapter 115, P.L. 1997) changed the asset valuation method from market related value to fnIl-market value. This legislation also contained a provision to reduce the employee contribution rate by Y, of I % to 4.5% for calendar years 1998 and 1999, and to allow for a reduction in the employee's rate after calendar year 1999, providing excess valuation assets are available. The legislation also provided that the District's normal contributions to the Fund may be reduced based on the revaluation of assets. Due to recognition of the bond proceeds and the change in asset valuation method as a result of enactment of Chapters 114 and 115, all unfnnded accrued liabilities were eliminated, except for the unfunded liability for local early retirement incentive benefits; accordingly, the pension costs for TP AF and PERS were reduced.
New Legislation signed by the Acting Governor (Chapter 133, Public Laws 2001) changed the formula for calculating retirement benefits for all current and future non-veteran retirees from N/60 to N/55 (a 9.09% increase). This legislation, signed June 29, 2001, provides that all members of the TPAF and the PERS will have their pensions calculated on the basis of years of credit divided by 55. It also provides that all current retirees will have their original pension recalculated under the N/55 formula. Starting February 1,2002, pension cost ofliving adjustments will be based on the new original pension.
Effective June 28, 2011, Chapter 78, P.L. 20 II reformed various pension and health benefits provisions. Employees hired after June 28, 2011 and enrolled in PERS will be enrolled in a new tier, Tier 5. Full retirement for Tier 5 PERS members will be age 65 and 30 years of service.
46
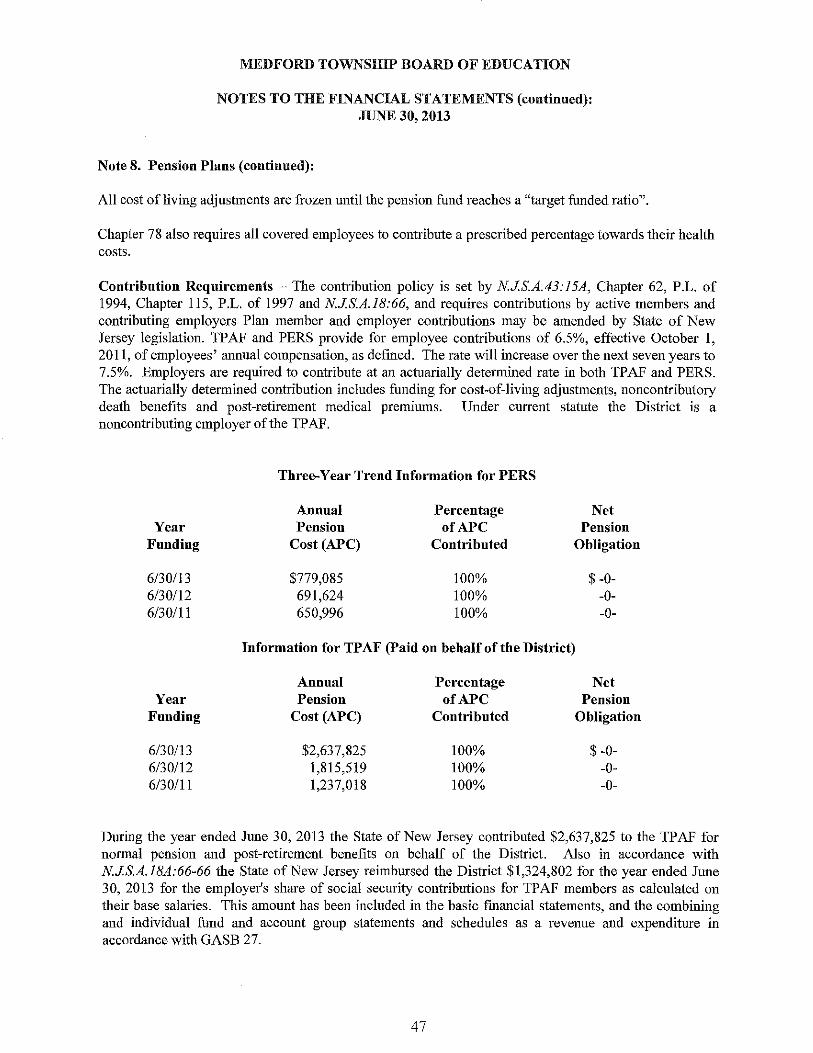
MEDFORD TOWNSHIP BOARD OF EDUCATION
NOTES TO THE FINANCIAL STATEMENTS (continned): JUNE 30, 2013
Note 8. Pension Plans (continned):
All cost of living adjustments are frozen until the pension fund reaches a "target funded ratio".
Chapter 78 also requires all covered employees to contribute a prescribed percentage towards their health costs.
Contribution Requirements - The contribution policy is set by NJ.S.A.43:15A, Chapter 62, P.L. of 1994, Chapter 115, P.L. of 1997 and NJ.8.A.18:66, and requires contributions by active members and contributing employers Plan member and employer contributions may be amended by State of New Jersey legislation. TPAF and PERS provide for employee contributions of 6.5%, effective October 1, 2011, of employees' annual compensation, as defined. The rate will increase over the next seven years to 7.5%. Employers are required to contribute at an actuarially determined rate in both TPAF and PERS. The actuariaIIy determiued contribution includes funding for cost-of-living adjustments, noncontribntory death benefits and post-retirement medical premmms. Under current statute the District is a noncontributing employer of the TPAF.
Three-Year Trend Information for PERS
Annual Percentage Net Year Pension ofAPC Pension
Funding Cost (APC) Contributed Obligation
6/30113 $779,085 100% $ -0-6/30112 691,624 100% -0-6/30/11 650,996 100% -0-
Information for TP AF (Paid on behalf of the District)
Annual Percentage Net Year Pension ofAPC Pension
Funding Cost (APC) Contributed Obligation
6/30113 $2,637,825 100% $ -0-6/30/12 1,815,519 100% -0-6/30/11 1,237,018 100% -0-
During the year ended June 30, 2013 the State of New Jersey contributed $2,637,825 to the TPAF for normal pension and post-retirement benefits on behalf of the District. Also in accordance with NJ.S.A.18A:66-66 the State of New Jersey reimbursed the District $1,324,802 for the year ended June 30,2013 for the employer's share of social security contributions for TPAF members as calculated on their base salaries. This amount has been included in the basic financial statements, and the combining and individual fund and account group statements and schedules as a revenue and expenditure in accordance with GASB 27.
47
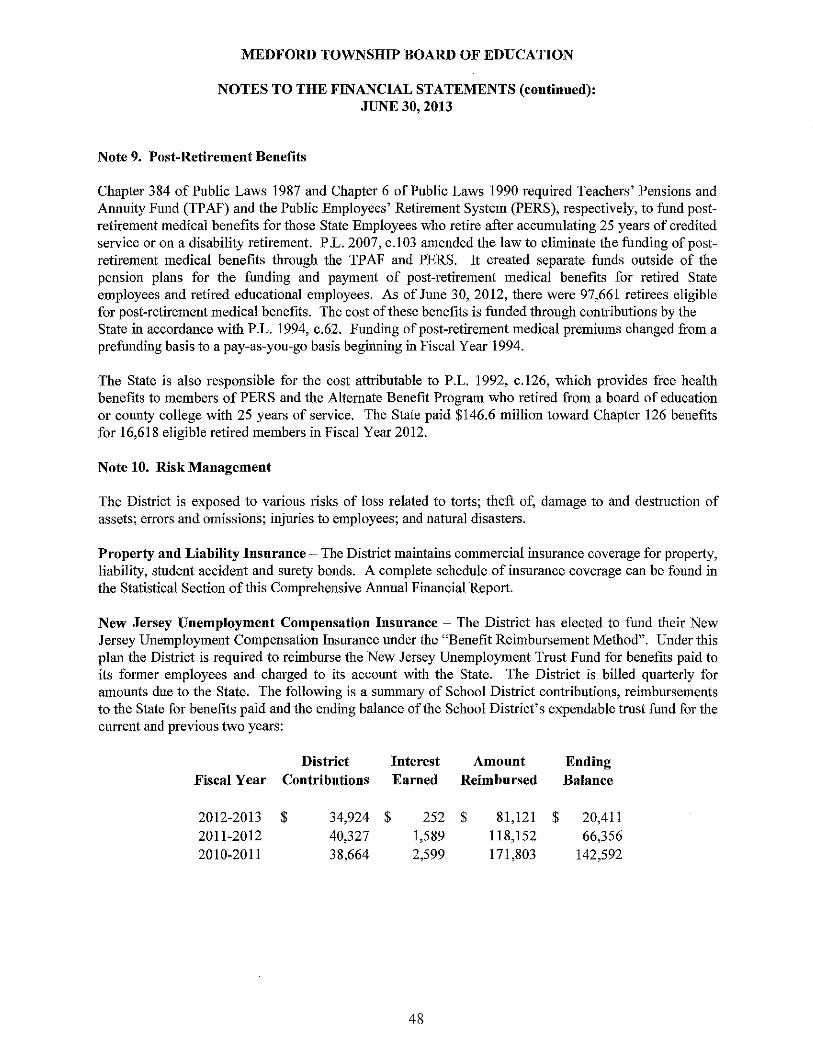
MEDFORD TOWNSHIP BOARD OF EDUCATION
NOTES TO THE FINANCIAL STATEMENTS (continned): JUNE 30, 2013
Note 9. Post-Retirement Benefits
Chapter 384 of Public Laws 1987 and Chapter 6 of Public Laws 1990 required Teachers' Pensions and Annuity Fund (TPAP) and the Public Employees' Retirement System (PERS), respectively, to fund postretirement medical benefits for those State Employees who retire after accumulating 25 years of credited service or on a disability retirement. P.L. 2007, c.I03 amended the law to eliminate the funding of postretirement medical benefits through the TPAP and PERS. It created separate funds outside of the pension plans for the funding and payment of post-retirement medical benefits for retired State employees and retired educational employees. As of June 30, 2012, there were 97,661 retirees eligible for post-retirement medical benefits. The cost of these benefits is funded through contributions by the State in accordance with P.L. 1994, c.62. Funding of post-retirement medical premiums changed from a prefunding basis to a pay-as-you-go basis beginning in Fiscal Year 1994.
The State is also responsible for the cost attributable to P.L. 1992, c.126, which provides free health benefits to members of PERS and the Alternate Benefit Program who retired from a board of education or county college with 25 years of service. The State paid $146.6 million toward Chapter 126 benefits for 16,618 eligible retired members in Fiscal Year 2012.
Note 10. Risk Management
The District is exposed to various risks of loss related to torts; theft of, damage to and destruction of assets; errors and omissions; injuries to employees; and natural disasters.
Property and Liability Insnrance - The District maintains commercial insurance coverage for property, liability, student accident and surety bonds. A complete schedule of insurance coverage can be found in the Statistical Section of this Comprehensive Annual Financial Report.
New Jersey Unemployment Compensation Insnrance - The District has elected to fund their New Jersey Unemployment Compensation Insurance under the "Benefit Reimbursement Method". Under this plan the District is required to reimburse the New Jersey Unemployment Trust Fund for benefits paid to its former employees and charged to its account with the State. The District is billed quarterly for amounts due to the State. The following is a summary of School District contributions, reimbursements to the State for benefits paid and the ending balance of the School District's expendable trust fund for the current and previous two years:
District Interest Amount Ending Fiscal Year Contributions Earned Reimbursed Balance
2012-2013 $ 34,924 $ 252 $ 81,121 $ 20,411 2011-2012 40,327 1,589 118,152 66,356 2010-2011 38,664 2,599 171,803 142,592
48
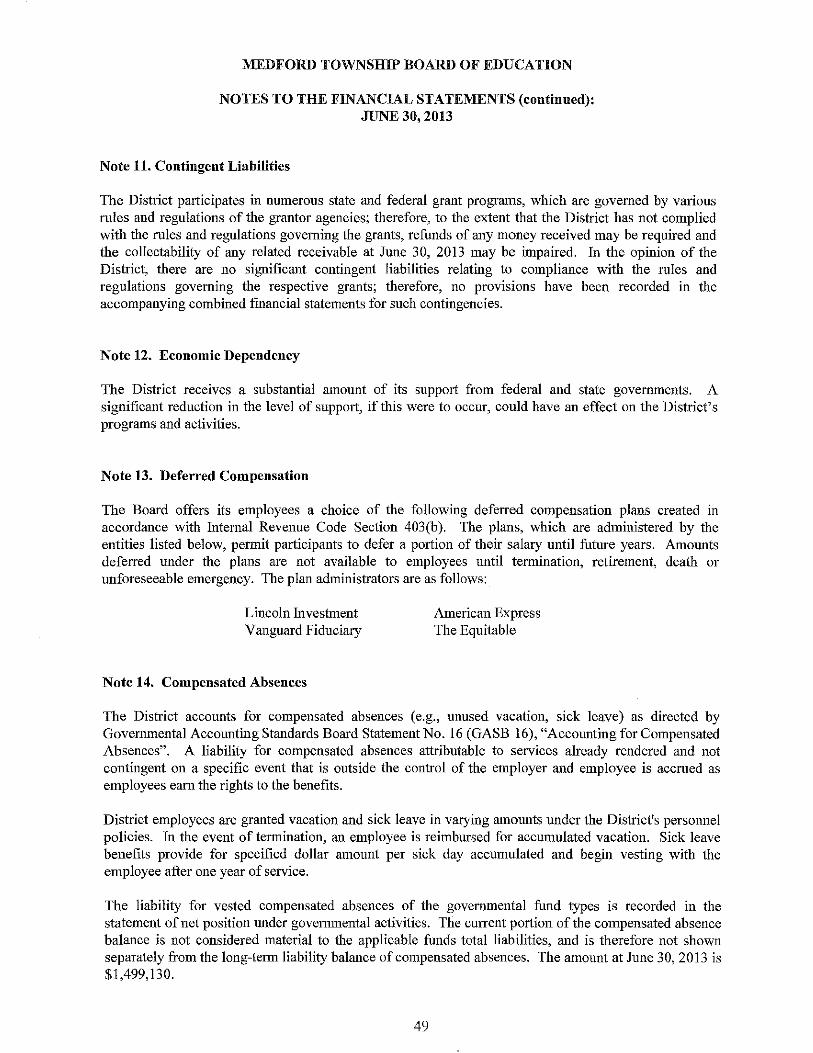
MEDFORD TOWNSHIP BOARD OF EDUCATION
NOTES TO THE FINANCIAL STATEMENTS (continued): JUNE 30, 2013
Note 11. Coutingeut Liabilities
The District participates in numerous state and federal grant programs, which are governed by various rules and regulations of the grantor agencies; therefore, to the extent that the District has not complied with the rules and regulations governing the grants, refunds of any money received may be required and the collectability of any related receivable at June 30, 2013 may be impaired. In the opinion of the District, there are no significant contingent liabilities relating to compliance with the rules and regulations governing the respective grants; therefore, no provisions have been recorded in the accompanying combined [mancial statements for such contingencies.
Note 12. Ecouomic Dependency
The District receives a substantial amount of its support from federal and state governments. A significant reduction in the level of support, if this were to occur, could have an effect on the District's programs and activities.
Note 13. Deferred Compensation
The Board offers its employees a choice of the following deferred compensation plans created in accordance with Internal Revenue Code Section 403(b). The plans, which are administered by the entities listed below, permit participants to defer a portion of their salary until future years. Amounts deferred under the plans are not available to employees until termination, retirement, death or unforeseeable emergency. The plan administrators are as follows:
Lincoln Investment Vanguard Fiduciary
Note 14. Compensated Absences
American Express The Equitable
The District accounts for compensated absences (e.g., unused vacation, sick leave) as directed by Governmental Accounting Standards Board Statement No. 16 (GASB 16), "Accounting for Compensated Absences". A liability for compensated absences attributable to services already rendered and not contingent on a specific event that is outside the control of the employer and employee is accrued as employees earn the rights to the benefits.
District employees are granted vacation and sick leave in varying amounts under the District's personnel policies. In the event of tennination, an employee is reimbursed for accumulated vacation. Sick leave benefits provide for specified dollar amonnt per sick day accumulated and begin vesting with the employee after one year of service.
The liability for vested compensated absences of the governmental fund types is recorded in the statement of net position under governmental activities. The current portion of the compensated absence balance is not considered material to the applicable funds total liabilities, and is therefore not shown separately from the long-term liability balance of compensated absences. The amount at June 30, 2013 is $1,499,130.
49
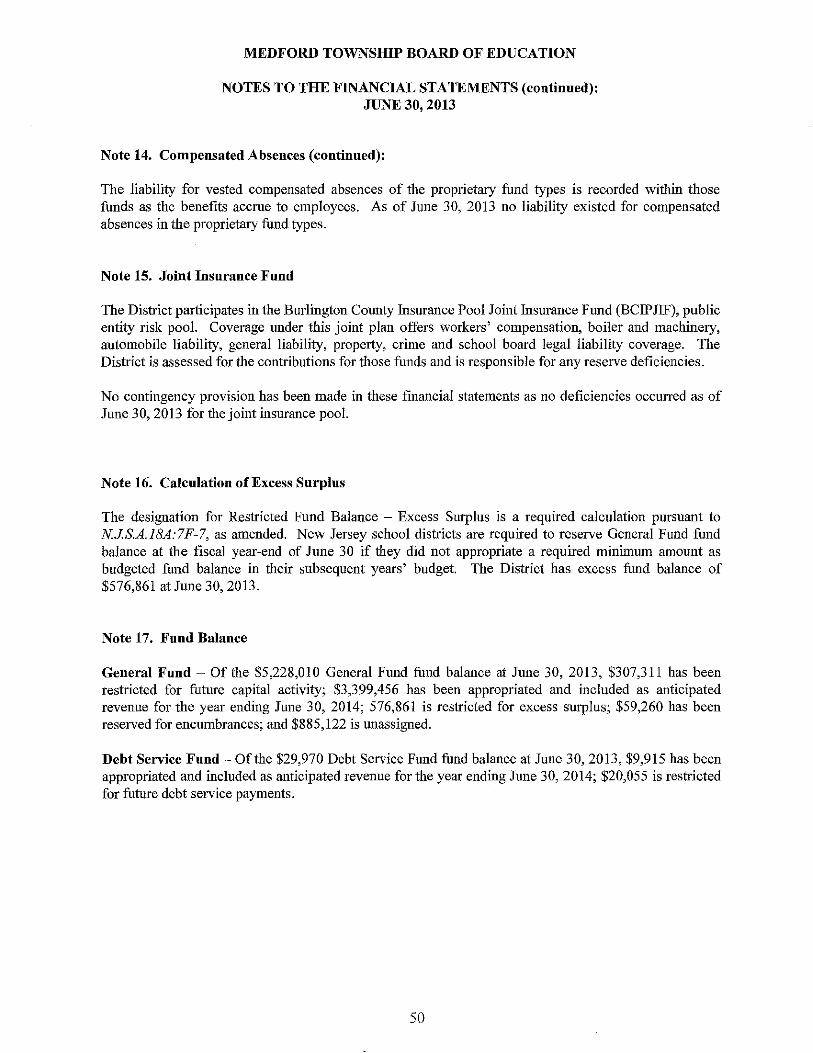
MEDFORD TOWNSHlP BOARD OF EDUCATION
NOTES TO THE FINANCIAL STATEMENTS (continned): JUNE 30, 2013
Note 14. Compensated Absences (continned):
The liability for vested compensated absences of tbe proprietary fund types is recorded within those funds as the benefits accrue to employees. As of June 30, 2013 no liability existed for compensated absences in the proprietary fund types.
Note 15. Joint Insurance Fuud
The District participates in the Burlington County Insurance Pool Joint Insurance Fund (BCIPJIF), public entity risk pool. Coverage under this joint plan offers workers' compensation, boiler and machinery, automobile liability, general liability, property, crime and school board legal liability coverage. The District is assessed for the contributions for those fuuds and is responsible for any reserve deficiencies.
No contingency provision has been made in these financial statements as no deficiencies occurred as of June 30, 2013 for the joint insurance pool.
Note 16. Calculatiou of Excess Surplus
The designation for Restricted Fund Balance - Excess Surplus is a required calculatiou pursuant to NJ.S.A.18A:7F-7, as amended. New Jersey school districts are required to reserve General Fund fund balance at the fiscal year-end of June 30 if they did not appropriate a required minimum amount as budgeted fund balance in their subsequent years' budget. The District has excess fund balance of $576,861 at June 30, 2013.
Note 17. Fuud Balauce
General Fund - Of the $5,228,010 General Fund fund balance at June 30, 2013, $307,311 has been restricted for future capital activity; $3,399,456 has been appropriated and included as anticipated revenue for the year ending June 30, 2014; 576,861 is restricted for excess surplus; $59,260 has been reserved for encumbrances; and $885,122 is unassigned.
Debt Service Fund - Of the $29,970 Debt Service Fund fund balance at June 30, 2013, $9,915 has been appropriated and included as anticipated revenue for the year ending Jnne 30, 2014; $20,055 is restricted for future debt service payments.
50
REQUIRED SUPPLEMENTARY INFORMATION - PART II


C. Budgetmy Compm'ison Schedules

I
I
I
I
I
I
I
I
I
I
I
I
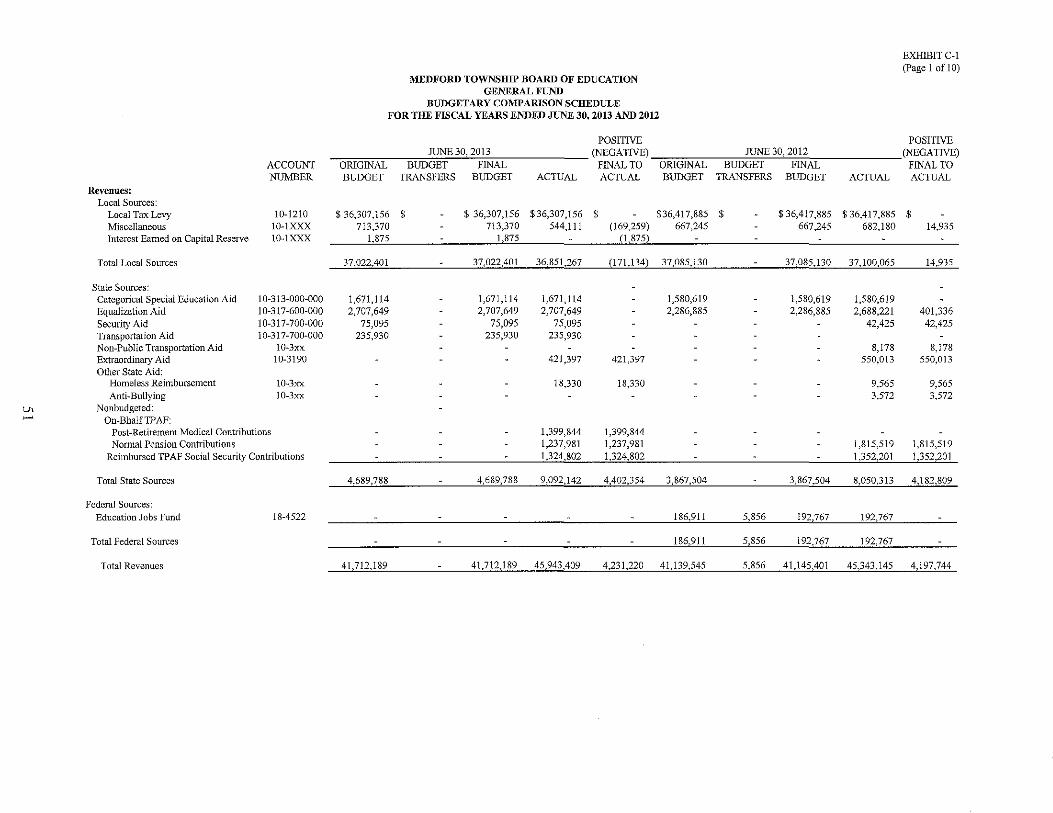
U> ~
Revenues: Local Sources:
Local Tax Levy Miscellaneous Interest Earned on Capital Reserve
Total Local Sources
State Sources: Categorical Special Education Aid Equalization Aid Security Aid Transportation Aid Non-Public Transportation Aid Extraordinary Aid Other State Aid:
Homeless Reimbursement Anti-Bullying
Nonbudgeted: On-BhalfTPAF:
ACCOUNT NUMBER
10-1210 10-IXXX 10-1 XXX
10-313-000-000 10-317-600-000 10-317-700-000 10-317-700-000
10-3xx 10-3190
1O~3xx
10-3xx
Post-Retirement Medical Contributions Nonnal Pension Contributions
Reimbursed TPAF Social Security Contributions
Total State Sources
Federal Sources: Education Jobs Fund 18-4522
Total Federal Sources
Total Revenues
MEDFORD TOWNSHIP BOARD OF EDUCATION GENERAL FUND
BUDGETARY COI\fl>ARISON SCHEDULE FOR THE FISCAL YEARS ENDED JUNE 30, 2013 AND 2012
EXHIBIT C-l (Page 1 of 1 0)
POSITIVE POSITIVE JUNE 30, 2013 (NEGATIVE) JUNE 30, 2012 (NEGATIVE)
ORIGINAL BUDGET FINAL FINAL TO ORIGINAL BUDGET FINAL FINAL TO BUDGET TRANSFERS BUDGET ACTUAL ACTUAL BUDGET TRANSFERS BUDGET ACTUAL ACTUAL
$ 36,307,156 $ 713,370
1,875
$ 36,307,156 713,370
1,875
$36,307,156 $ 544,111 (169,259)
(1,875)
$36,417,885 $ 667,245
37,022,401 3?,Q~~,±QL 36,851,267 (171,134) 37,085,130
1,671,l14 1,671,114 1,671,114 1,580,619 2,707,649 2,707,649 2,707,649 2,286,885
75,095 75,095 75,095 235,930 235,930 235,930
421,397 421,397
18,330 18,330
1,399,844 1,399,844 1,237,981 1,237,981 1,324,802 1,324,802
4,689,788 4,689,788 9,092,142 4,402,354 3,867,504
186,911
186,911
41,Z12,189 41,712,189 45,943409 4,231,220 41,139,545
$36,417,885 $36,417,885 $ 667,245 682,180 14,935
37,085,130 37,100,065 14,935
1,580,619 1,580,619 2,286,885 2,688,221 401,336
42,425 42,425
8,178 8,178 550,013 550,013
9,565 9,565 3,572 3,572
1,815,519 1,815,519 1,352,201 1,352,201
3,867,504 8,050,313 4,182,809
5,856 192,767 192,767
5,856 192,767 192,767
5,856 41,145,401 45,343,145, 4,197,744
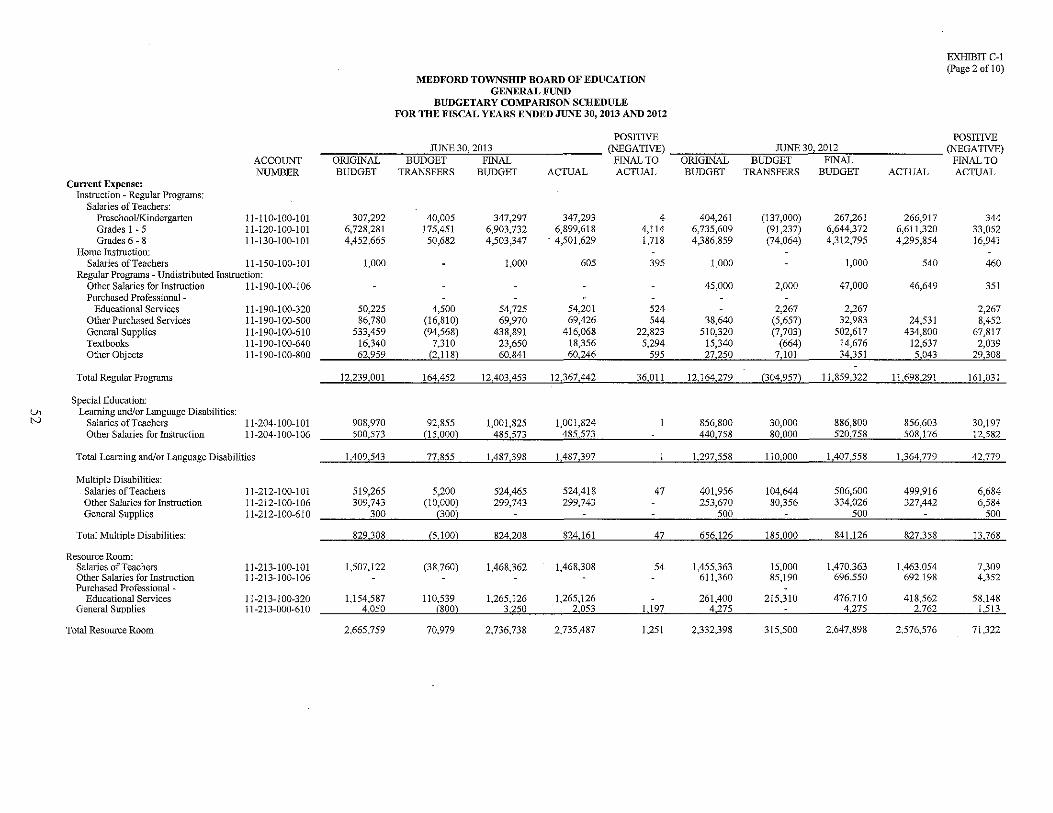
'-" N
Current Expense: Instruction ~ Regular Programs:
Salaries of Teachers: Preschool/Kindergarten Grades I ~ 5 Grades 6 ~ 8
Home Instruction:
ACCOUNT NUMBER
11-110-100-101 11~120-100~10l
11-130-100-101
Salaries of Teachers 11~150-100-101
Regular Programs - Undistributed Instruction: Other Salaries for Instruction 11-190-100-106 Purchased Professional-
Educational Services Other Purchased Services General Supplies Textbooks Other Objects
Total Regular Programs
Special Education: Leaming and/or Language Disabilities:
11-190-100-320 11-190-100-500 11-190-100-610 11-190~100-640
11-190-100-800
Salaries of Teachers 11-204-100-101 Other Salaries for Instruction 11-204-100-106
Total Learning and/or Language Disabilities
Multiple Disabilities: Salaries of Teachers Other Salaries for Instruction General Supplies
Total Multiple Disabilities:
Resource Room: Salaries of Teachers Other Salaries for Instruction Purchased Professional -
Educational Services General Supplies
Total Resource Room
11-212-100-101 11-212-100-106 11-212-100-610
11-213-100-101 11-213-100-106
11-213-100-320 11-213-000-610
ORIGINAL BUDGET
307,292 6,728,281 4,452,665
1,000
MEDFORD TOWNSHIP BOARD OF EDUCATION GENERAL FUND
BUDGETARY COMPARISON SCHEDULE FOR THE FISCAL YEARS ENDED JUNE 30, 2013 AND 2012
EXHIBIT C-l (Page 2 of 1 0)
POSlTlVE POSITIVE JUNE 30, 2013
BUDGET FINAL TRANSFERS BUDGET
40,005 175,451
50,682
347,297 6,903,732 4,503,347
1,000
ACTUAL
347,293 6,899,618
. 4,501,629
605
(NEGATIVE) JUNE 30, 2012 (NEGATIVE) FINAL TO ORIGINAL BUDGET FINAL FINAL TO ACTUAL BUDGET TRANSFERS BUDGET ACTUAL ACTUAL
4 404,261 (137,000) 267,261 266,917 344 4,114 6,735,609 (91,237) 6,644,372 6,611,320 33,052 1,718 4,386,859 (74,064) 4,312,795 4,295,854 16,941
395 1,000 1,000 540 460
45,000 2,000 47,000 46,649 351
50,225 4,500 54,725 54,201 524 2,267 2,267 2,267 86,780 (16,810) 69,970 69,426 544 38,640 (5,657) 32,983 24,531 8,452
533,459 (94,568) 438,891 416,068 22,823 510,320 (7,703) 502,617 434,800 67,817 16,340 7,310 23,650 18,356 5,294 15,340 (664) 14,676 12,637 2,039 62,959 (2,118) 60.841 60,246 595 27,250 7,101 34,351 5,043 29,308
12,239,001 164,452 12,403,453 12,367,442 36,011 12,164,279 (304,957) 11,859,322 11,698,291 161,031
908,970 92,855 1,001,825 1,001,824 856,800 30,000 886,800 856,603 30,197 500,573 (15,000) 485,573 485,573 440,758 80,000 520,758 508,176 12,582
1,409,543 77,855 1,487,398 1.487,397 1,297,558 110,000 _. _ 1,407,558 1,364,779 42,779
519,265 309,743
300
5,200 (10,000)
(300)
524,465 299,743
524,418 299,743
47 401,956 253,670
500
104,644 80,356
506,600 334,026
500
499,916 327,442
6,684 6,584
500
829308 (5100) 824208 824161 47 656126 185000 841 126 827358 13,768
1,507,122 (38,760) 1,468,362 1,468,308 54 1,455,363 611,360
15,000 85,190
1,470,363 696,550
1,463,054 692,198
7,309 4,352
1,154,587 110,539 l,265,126 1,265,126 261,400 215,310 476,710 418,562 58,148 4.050 (800) 3.250 2,053 1.197 4,275 4,275 2,762 1513
2,665,759 70,979 2,736,738 2,735,487 1,251 2,332,398 315,500 2,647,898 2,576,576 7l,322
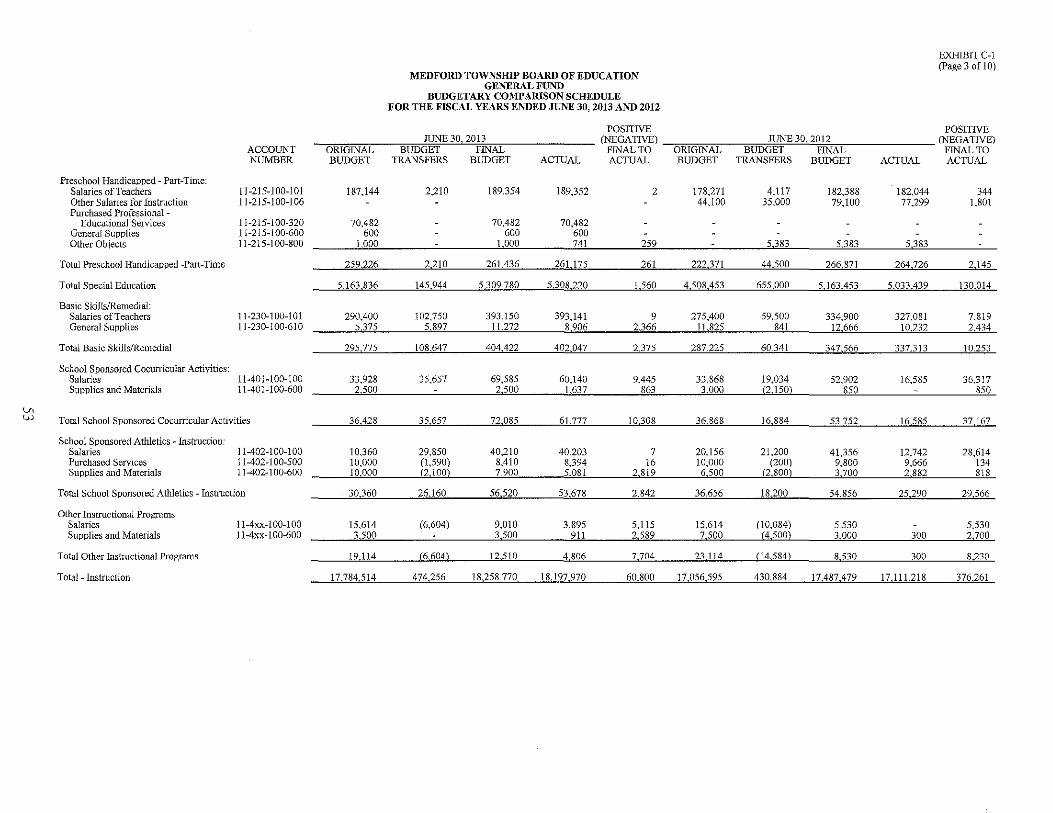
V> W
Preschool Handicapped - Part-Time: Salaries of Teachers Other Salaries for Instruction Purchased Professional -
Educational Services General Supplies Other Objects
Total Preschool Handicapped -Part-Time
Total Special Education
Basic SkillslRemedial: Salaries of Teachers General Supplies
Total Basic Skills/Remedial
School Sponsored Cocurricular Activities:
ACCOUNT NUMBER
11-215-100-101 11-215-100-106
11-215-100-320 11-215-100-600 11-215-100-800
11-230-100-101 11-230-100-610
Salaries 11-401-100-100 Supplies and Materials 11-401-100-600
Total School Sponsored Cocurricular Activities
School Sponsored Athletics - Instruction: Salaries Purchased Services Supplies and Materials
11-402-100-100 11-402-100-500 11-402-100-600
Total School Sponsored Athletics - Instruction
Other Instructional Programs Salaries Supplies and Materials
Total Other Instructional Programs
Total - Instruction
11-4xx-100-100 11-4xx-l00-600
MEDFORD TOWNSHIP BOARD OF EDUCATION GENERAL FUND
BUDGETARY COMPARISON SCHEDULE FOR THE FISCAL YEARS ENDED JUNE 30, 2013 AND 2012
EXHIBIT C-1 (Page 3 of 10)
POSITIVE POSITIVE JUNE 30. 2013 (NEGATIVE) JUNE 30, 2012 (NEGATIVE)
ORIGINAL BUDGET
BUDGET FINAL FINAL TO ORIGINAL BUDGET FTNAL FINAL TO TRANSFERS BUDGET ACTUAL ACTUAL BUDGET TRANSFERS BUDGET ACTUAL ACTUAL
187,144 2,210 189,354 189,352 2 178,271 4,117 182,388 182,044 44,100 35,000 79,100 77,299
70,482 70,482 70,482 600 600 600
1000 1,000 741 259 5383 5383 5383
259226 2210 261,436 26L175 261 222.371 44.500 266.871 264.726
5.163,836 145,944 5J.P5U80 5308,220 1,560 4.508,453 655,000 5,1 63,453 5.033,439
344 1,801
2.145
130.014
290.400 102,750 393.150 393.141 9 275.400 59,500 334,900 327,081 7,819 5.375 5.897 11,272 8,906 2.366 11,825 841 12.666 10.232 2,434
295775 108647 404422 402047 2375 287225 60341 347566 337.313 10 253
33,928 35,657 69.585 60.140 9,445 33,868 19,034 52.902 16.585 36.317 2500 2500 1,637 863 3 000 (2 150) 850 850
36.428 35,657 72 085 61.777 10,308 36,868 16,884 53,752 16.585 37,167
10.360 29.850 40,210 40,203 7 20.156 21.200 10,000 (1,590) 8,410 8,394 16 10,000 (200) 10.000 (2.100) 7.900 5.081 2.819 6.500 (2.800)
41.356 9,800 3.700
12.742 9,666 2.882
28,614 134 818
30,360 26.160 56520 53678 2842 36656 18,200 54856 25290 29566
15,614 (6,604) 9,010 3,895 5,115 15,614 (10,084) 5,530 5,530 3500 3500 911 2,589 7500 (4500) 3000 300 2700
19,114 (6,604) 12,510 4.806 7.704 23.1 14 (14,584) 8.530 300 8.230
17,784,514 474256 18,258770 18,197,970 60800 17056595 430884 17,487,479 17,111,218 376,261
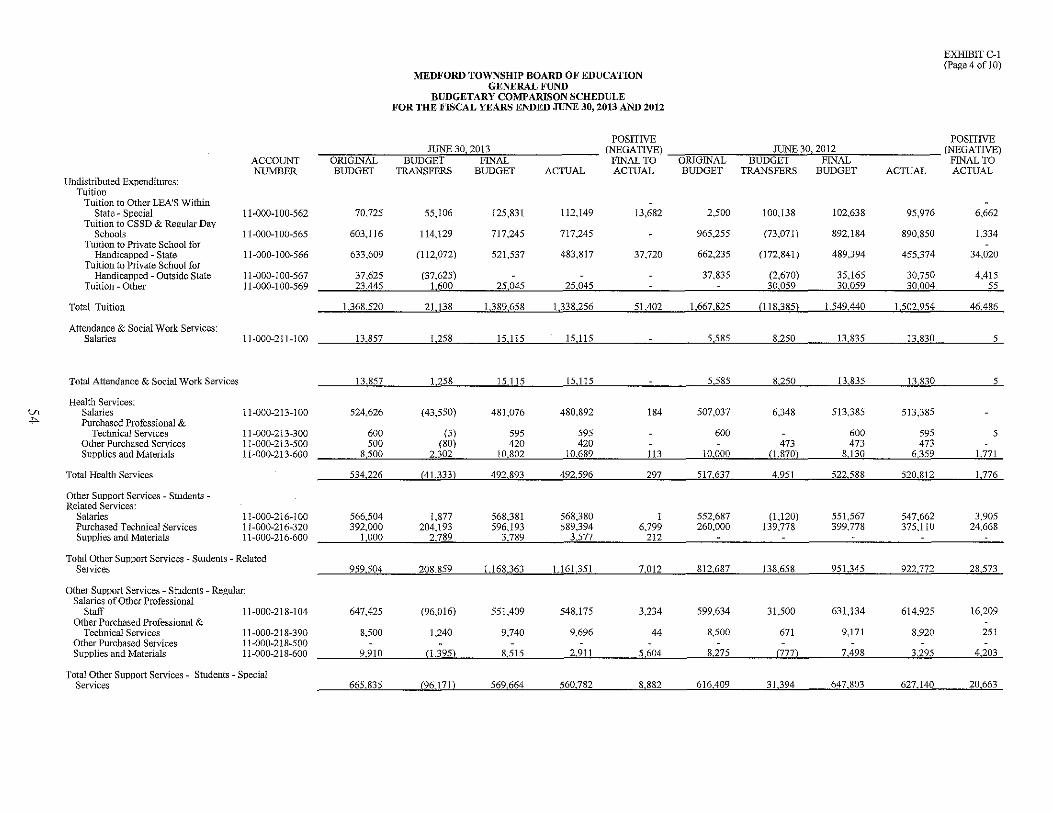
V> ...
Undistributed Expenditures: Tuition
Tuition to Other LEA'S Within State ~ Special
Tuition to CSSD & Regular Day Schools
Tuition to Private School for Handicapped ~ State
Tuition to Private School for Handicapped ~ Outside State
Tuition ~ Other
Total Tuition
Attendance & Social Work Services: Salaries
Total Attendance & Social Work Services
Health Services: Salaries Purchased Professional &
Technical Services Other Purchased Services Supplies and Materials
Total Health Services
Other Support Services ~ Students ~ Related Services:
Salaries Purchased Technical Services Supplies and Materials
ACCOUNT NUMBER
11-000-100-562
11~000~100~565
11-000~ 100~566
1l-OOO~1O0-567
II ~OOO~ 1 00~569
11-000-211-100
11-000-213-100
11-000-213~300 11~000~213~500
11-000-213-600
11~OOO~216~100
11~000~216~320
11-000-216-600
Total Other Support Services - Students - Related Services
Other Support Services - Students - Regular: Salaries of Other Professional
Staff 11-000-218-104 Other Purchased Professional &
Technical Services Other Purchased Services Supplies and Materials
11-000-218-390 11-000-218-500 11~OOO~218~600
Total Other Support Services - Students ~ Special Services
MEDFORD TOWNSHIP BOARD OF EDUCATION GENERAL FUND
BUDGETARY COMPARISON SCHEDULE FOR THE FISCAL YEARS ENDED JUNE 30, 2013 AND 2012
EXHIBIT C-l (Page 4 of10)
POSITIVE POSITIVE JUNE 30, 2013 (NEGATIVE) JUNE 30, 2012 (NEGATIVE)
ORIGINAL BUDGET
BUDGET FINAL FINAL TO ORIGINAL BUDGET FINAL FINAL TO lRANSFERS BUDGET ACTUAL ACTUAL BUDGET TRANSFERS BUDGET ACTUAL ACTUAL
70,725
603,116
633,609
55,106
114,129
(112,072)
125,831
717,245
521,537
112,149
717,245
483,817
13,682
37,720
2,500
965,255
662,235
100,138
(73,071)
(172,841)
102,638
892,184
489,394
95,976
890,850
455,374
37,625 (37,625) 37,835 (2,670) 35,165 30,750 23 445 1 600 25 045 25 045 30 059 30 059 30 004
6,662
1,334
34,020
4,415 55
1.368,520 21.138 1,389,658 1.338,256 51,402 1,667,825 (118,385) _1549,440 1,502,954.. 46,486
13,857 1.258 15,115 15,115 5,585 8,250 ____ 13,835 13,830 5
13.857 1,258 15_115 15.115 5.585 8.250 13,835 13.830 5
524,626 (43,550) 481,076 480,892 184 507,037 6,348 513,385 513,385
600 (5) 595 595 600 600 595 5 500 (80) 420 420 473 473 473
8500 2302 10 802 10 689 113 10 000 (1,870) 8130 6359 1771
534.226 (41.333) 492,893 492,596 297 517.637 4.951 522,588 520.812 1.776
566,504 1,877 568.381 568,380 392,000 204,193 596,193 589,394
1,000 2.789 3.789 3,577
1 6,799
212
552,687 260,000
(1,120) 139,778
551,567 399.778
547,662 375,110
959,504 208.859 1.168.363 LLQ1.3SJ 7.012 812687 138,658 951345 922,772
647,425
8,500
(96,016)
1,240
551,409
9,740
548,175
9,696
3,234
44
599,634 31,500
8.500 671
631,134
9,171
614,925
8,920
3.905 24,668
28,573
16,209
251
9310 (1.395) 8.515 2.911 5,604 8.275 (777) 7,498 3.295____ 4,203
665.835 (96,171) 569.664 560,782 8.882 616,409 31,394 ____ 647.803 627,140______ 20,663
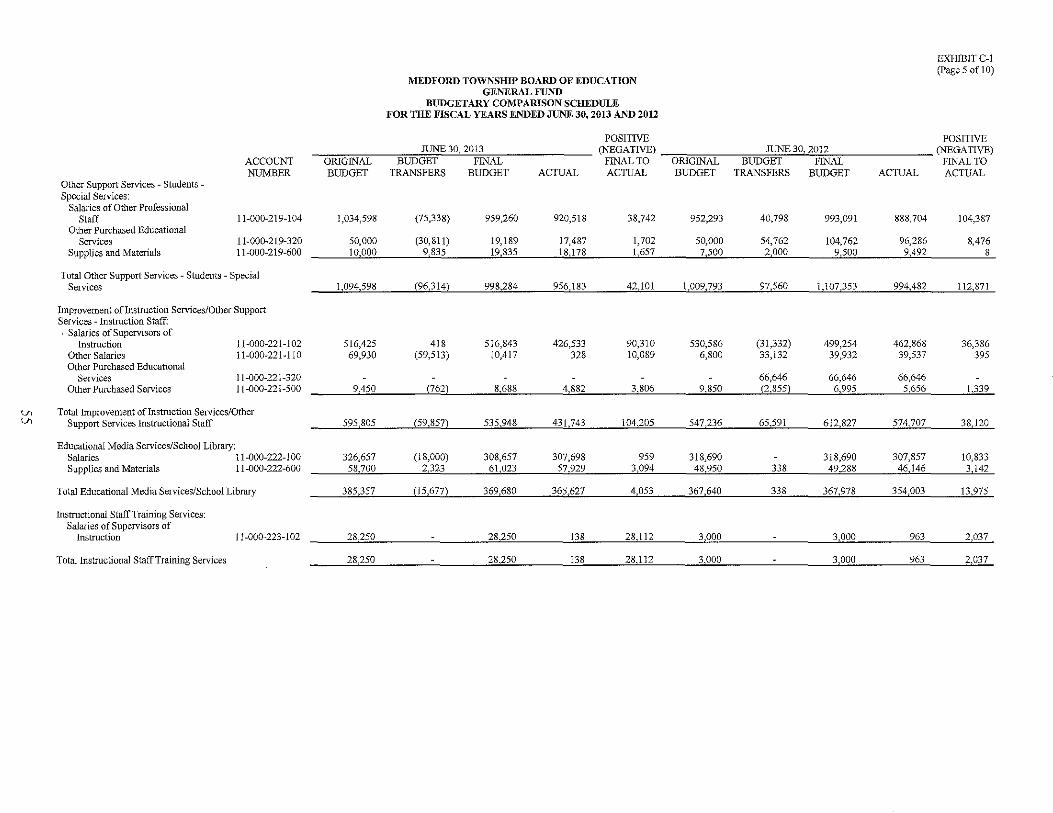
th th
Other Support Services - Students -Special Services:
Salaries of Other Professional Staff
Other Purchased Educational Services
Supplies and Materials
ACCOUNT NUMBER
11-000-219-104
1l-OOQ..2J9-320 11-000-219-600
Total Other Support Services - Students - Special Services
Improvement of Instruction Services/Other Support Services - Instruction Staff:
Salaries of Supervisors of Instruction 11-000-221-102
Other Salaries 11-000-221-110 Other Purchased Educational
Services Other Purchased Services
11-000-221-320 11-000-221-500
Total Improvement ofInstruction Services/Other Support Services Instructional Staff
Educational Media Services/School Library: Salaries 11-000-222-100 Supplies and Materials 11-000-222-600
Total Educational Media Services/School Library
Instructional Staff Training Services: Salaries of Supervisors of
Instruction
Total Instructional Staff Training Services
11-000-223-102
ORIGINAL BUDGET
1,034,598
EXHIBIT C-1 (Page50fl0)
MEDFORD TOWNSHIP BOARD OF EDUCATION GENERAL FUND
BUDGETARY COMPARISON SCHEDULE FOR THE FISCAL YEARS ENDED JUNE 30, 2013 AND 2012
POSITIVE POSITIVE JUNE 30, 2013 (NEGATIVE) JUNE 30, 2012 (NEGATIVE)
BUDGET FINAL FlNAL TO ORIGINAL BUDGET FINAL FINAL TO TRANSFERS BUDGET ACTUAL ACTUAL BUDGET TRANSFERS BUDGET ACTUAL ACTUAL
(75,338) 959,260 920,518 38,742 952,293 40,798 993,091 888,704 104,387
50,000 (30,811) 19,189 17,487 1,702 50,000 54,762 104,762 96,286 8,476 8 10,000 9,835 19,835 18,178 1,657 7,500 2,000 9,500 9,492
1,094,598 (96,314) 998,284 956,183 42,101 1,009,793 97,560 1,107,353 994,482 112,871
516,425 69,930
418 (59,513)
516,843 10,417
426,533 328
90,310 10,089
530,586 6,800
(31,332) 33,132
499,254 39,932
462,868 39,537
66,646 66,646 66,646
36,386 395
9,450 (762) 8)688 4,882 3,806 9,850 (2,855) 6,995 5,656 1,339
595,805 (59,857) 535.948 431,743 104,205 547,236 65,591 612,827 574,707 38,120
326,657 (18,000) 308,657 307,698 959 318,690 318,690 307,857 10,833 58,700 2,323 61,023 57,929 3,094 48,950 338 49.288 46,146 3,142
385,357 (15,677) 369,680 :?~5,627 4,053 ____ 367,640 338 367,978 354,003 13,975
28,250 28,250 138 28,112 3,000 3,000 963 2,037
28,250 28,250 138 28,112 3,000 3,000 963 2,037
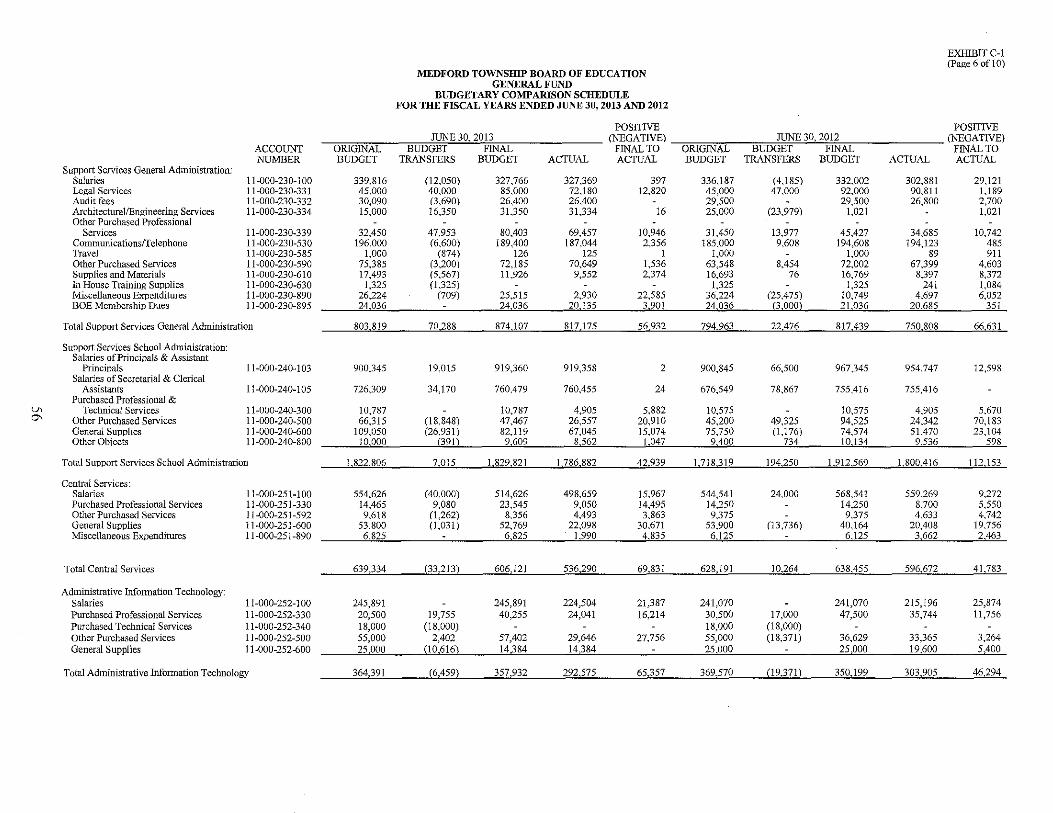
lh 0\
Support Services General Administration: Salaries Legal Services Audit fees ArchitecturallEngineering Services Other Purchased Professional
Services CommunicationslTelephone Travel Other Purchased Services Supplies and Materials In House Training Supplies Miscellaneous Expenditures BOE Membership Dues
ACCOUNT NUMBER
11-000-230-100 11-000-230-331 11-000-230-332 11-000-230-334
11-000-230-339 11-000-230-530 11-000-230-585 11-000-230-590 11-000-230-610 11-000-230-630 11-000-230-890 11-000-230-895
Total SUpport Services General Administration
Support Services School Administration: Salaries of Principals & Assistant
Principals Salaries of Secretarial & Clerical
Assistants Purchased Professional &
Technical Services Other Purchased Services General Supplies Other Objects
11-000-240-103
11-000-240-105
11-000-240-300 11-000-240-500 11-000-240-600 11-000-240-800
Total Support Services School Administration
Central Services: Salaries Purchased Professional Services Other Purchased Services General Supplies Miscellaneous Expenditures
Total Central Services
Administrative Information Technology: Salaries Purchased Professional Services Purchased Technical Services Other Purchased Services General Supplies
11-000-251-100 11-000-251-330 11-000-251-592 11-000-251-600 11-000-251-890
11-000-252-100 11-000-252-330 11-000-252-340 11-000-252-500 11-000-252-600
Total Administrative Infonnation Technology
EXHIBIT C-1 (Page 6 oft 0)
MEDFORD TOWNSHIP BOARD OF EDUCATION GENERAL FUND
BUDGETARY COMPARISON SCHEDULE FOR THE FISCAL YEARS ENDED JUNE 30,2013 AND 2012
POSITIVE POSITIVE JUNE 30, 2013 (NEGATIVE) JUNE 30, 2012 (NEGATIVE)
ORIGINAL BUDGET FINAL FINAL TO ORIGINAL BUDGET FINAL FINAL TO BUDGET TRANSFERS BUDGET ACTUAL ACTUAL BUDGET TRANSFERS BUDGET ACTUAL ACTUAL
339,816 02,050) 327,766 327,369 397 336,187 (4,185) 332,002 302,881 29,121 45,000 40,000 85,000 72,180 12,820 45,000 47,000 92,000 90,811 1.189 30,090 (3,690) 26,400 26,400 29,500 29,500 26,800 2,700 15,000 16,350 31.350 31,334 16 25,000 (23,979) 1,021 1,021
32,450 47,953 80,403 69,457 10,946 31,450 13,977 45,427 34,685 10,742 196,000 (6,600) 189,400 187,044 2,356 185,000 9,608 194,608 194,123 485
1,000 (874) 126 125 1 1,000 1,000 89 911 75,385 (3,200) 72,185 70,649 1,536 63,548 8,454 72,002 67,399 4,603 17,493 (5,567) 11,926 9,552 2,374 16,693 76 16,769 8,397 8,372 1,325 0,325) 1,325 1,325 241 },084
26,224 (709) 25,515 2,930 22,585 36,224 (25,475) 10,749 4,697 6,052 24036 24036 20135 3,901 24036 (300O} 21036 20685 351
803,819 70288 874107 817175 56932 794,963 22476 817,439 750,808 66,631
900,345 19,015 919,360 919,358 2 900,845 66,500 967,345 954,747 12,598
726,309 34,170 760,479 760,455 24 676,549 78,867 755,416 755,416
10,787 10,787 4,905 5,882 10,575 10,575 4,905 5,670 66,315 (18,848) 47,467 26,557 20,910 45,200 49,325 94,525 24,342 70,183
109,050 (26,931) 82.119 67,045 15,074 75,750 (1,176) 74,574 51,470 23,104 10,000 (391) 9,609 8,562 1.047 9,400 734 10,134 9536 598
1.822,806 7,015 1,829,821 1.786.882 42.939 1.718.319 194250 1.912569 1.800,416 112.153
554,626 (40,000) 514,626 498,659 15,967 544,541 24,000 568,541 559,269 9272 14,465 9,080 23,545 9,050 14,495 14,250 14,250 8,700 5,550 9,618 (1,262) 8,356 4,493 3,863 9,375 9,375 4,633 4,742
53,800 (1,031) 52.769 22,098 30,671 53,900 (13,736) 40,164 20,408 19,756 6,825 6,825 1,990 4,835 6,125 6.125 3,662 2,463
639,334 (33,213) 606,121 536,290 69,831 628,191 10,264 638,455 596,672 41,783
245,891 245,891 224,504 21,387 241,070 20,500 19,755 40,255 24,041 16,214 30,500 17,000 18,000 (18,000) 18,000 (18,000)
241,070 47,500
215,196 35,744
25,874 11,756
55,000 2,402 57,402 29,646 27,756 55,000 (18,371) 36,629 33,365 3,264 25,000 (10,616) 14,384 14,384 25,000 25,000 19,600 5,400
364,391 (6,459) 357,932 292,575 65,357 369,570 (19,371) 350,199 303,905 46,294
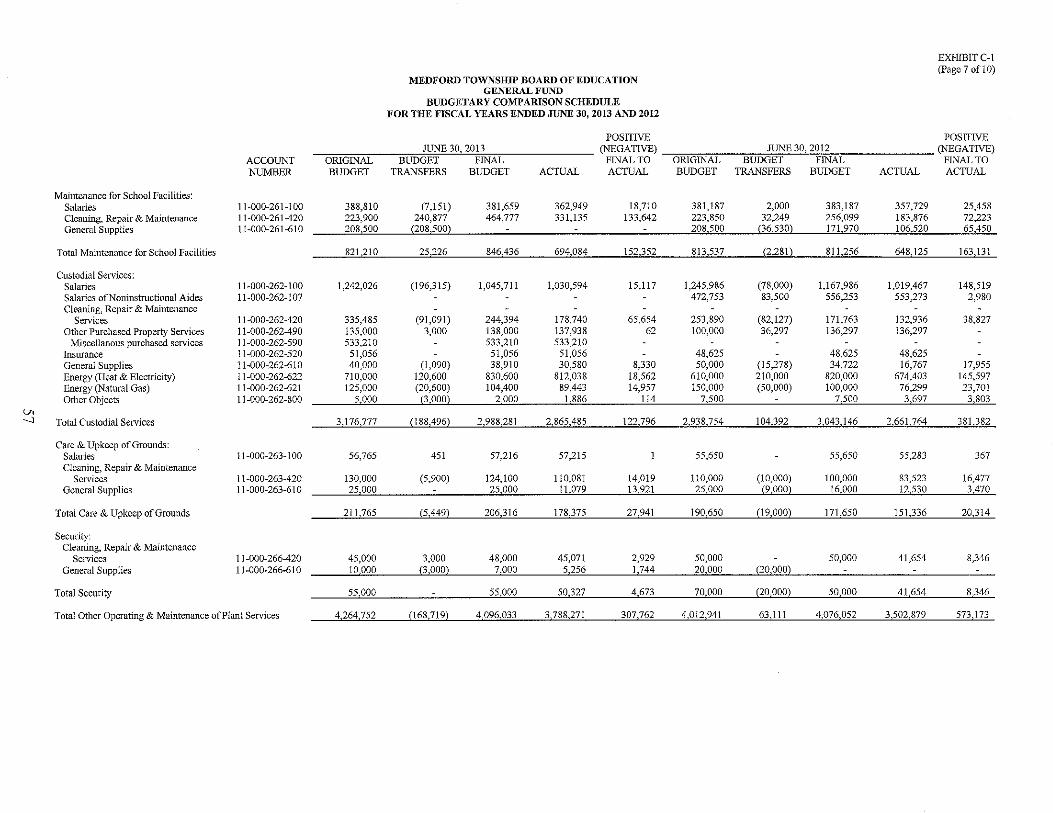
U> --.)
Maintenance for School Facilities: Salaries Cleaning, Repair & Maintenance General Supplies
Total Maintenance for School Facilities
Custodial Services: Salaries Salaries of Non instructional Aides Cleaning, Repair & Maintenance
Services Other Purchased Property Services
Miscellanous purchased services Insurance General Supplies Energy (Heat & Electricity) Energy (Natural Gas) Other Objects
Total Custodial Services
Care & Upkeep of Grounds: Salaries Cleaning, Repair & Maintenance
Services General Supplies
Total Care & Upkeep of Grounds
Security: Cleaning, Repair & Maintenance
Services General Supplies
Total Security
ACCOUNT NUMBER
11-000-261-100 11-000-261-420 11-000-261-610
11-000-262-100 11-000-262-107
11-000-262-420 11-000-262-490 11-000-262-590 11-000-262-520 11-000-262-61 ° 11-000-262-622 11-000-262-621 11-000-262-800
11-000-263-100
11-000-263-420 11-000-263-610
11-000-266-420 11-000-266-610
Total Other Operating & Maintenance of Plant Services
MEDFORD TOWNSHIP BOARD OF EDUCATION GENERAL FUND
BUDGETARY COMPARISON SCHEDULE FOR THE FISCAL YEARS ENDED JUNE 30, 2013 AND 2012
EX1-11BlT C-l (Page 7 of 1 0)
POSITIVE POSITIVE JUNE 30, 2013 (NEGATIVE) JUNE 30, 2012 (NEGATIVE)
ORIGINAL BUDGET
BUDGET FINAL FINAL TO ORIGINAL BUDGET FINAL FINAL TO TRANSFERS BUDGET ACTUAL ACTUAL BUDGET TRANSFERS BUDGET ACTUAL ACTUAL
388,810 (7,151) 381,659 362,949 18,710 381,187 2,000 383,187 357,729 25,458 223,900 240,877 464,777 331,135 133,642 223,850 32,249 256,099 183,876 72,223 208,500 (208,500) 208,500 (36,530) 171,970 106,520 65,450
821.210 25,226 846,436 694,084 152,352 813,537 (2,281) 811,256 648,125 163,131
1,242,026 (196,315) 1,045,711 1,030,594 15,117 1,245,986 472,753
(78,000) 83,500
1,167,986 556,253
1,019,467 553,273
148,519 2,980
335,485 (91,091) 244,394 178,740 65,654 253,890 (82,127) 171,763 132,936 38,827 135,000 3,000 138,000 137,938 62 100,000 36,297 136,297 136,297 533,210 533,210 533,210
51,056 51,056 51,056 48,625 48,625 48,625 40,000 (1,090) 38,910 30,580 8,330 50,000 (15,278) 34,722 16,767 17,955
710,000 120,600 830,600 812,038 18,562 610,000 210,000 820,000 674,403 145,597 125,000 (20,600) 104,400 89,443 14,957 150,000 (50,000) 100,000 76,299 23,701
5,000 (3,000) 2,000 1,886 114 7,500 7,500 3,697 3,803
3.176,777 (188,496) 2,988,281 2,865,485 122,796 2,938,754 104,392 3,043,146 2,661,764 381,382
56,765 451 57,216 57,215 55,650 55,650 55,283 367
130,000 (5,900) 124,100 110,081 14,019 110,000 (10,000) 100,000 83,523 16,477 25,000 25,000 11,079 13,921 25,000 (9,000) 16,000 12,530 3,470
211,765 (5,449) 206,316 178,375 27,941 190,650 (19,000) 171,650 151,336 20,314
45,000 3,000 48,000 45,071 2,929 50,000 50,000 41,654 8,346 10_000 (3,000) 7,000 5,256 1,744 20,000 (20,000)
55,000 55,000 50,327 4,673 70,000 (20,000) 50,000 41,654 8,346
4,264,752 (168,719) 4,096,033 3,788,271 307,762 4,012,941 63,111 4,076,052 3,502,879 573,173
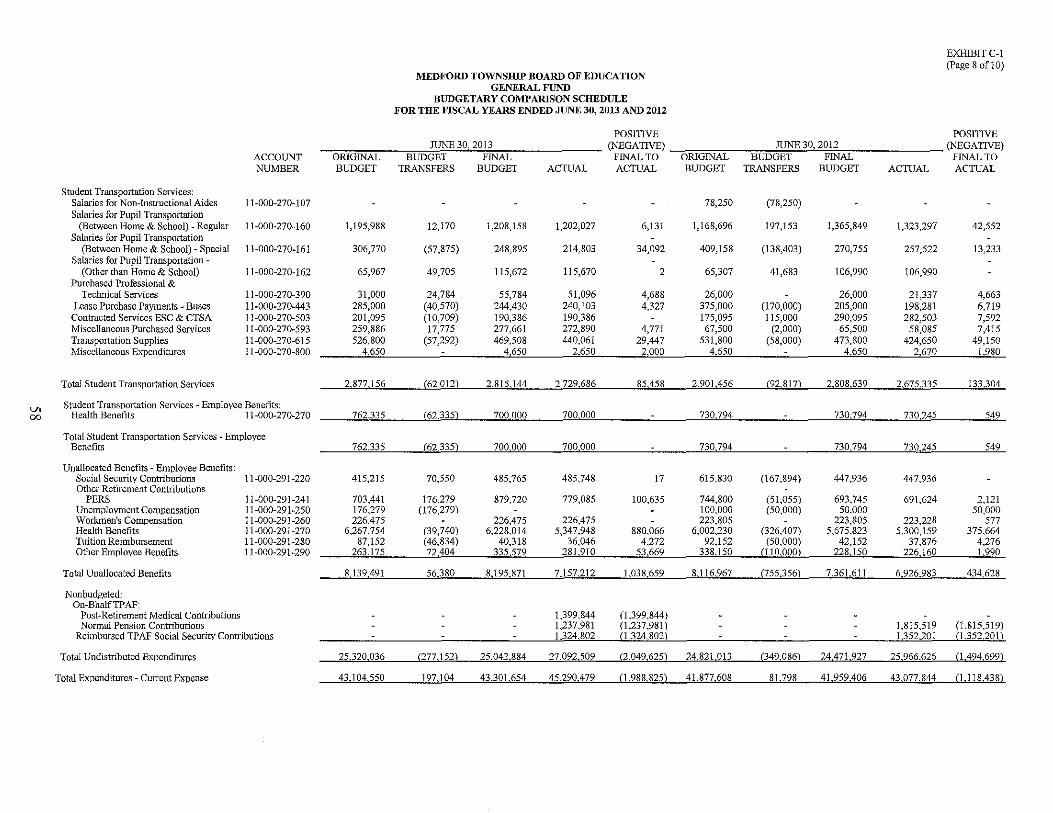
'-" 00
Student Transportation Services:
ACCOUNT NUMBER
Salaries for Non-Instructional Aides 11-000-270-107 Salaries for Pupil Transportation
(Between Home & School) - Regular 11-000-270-160 Salaries for Pupil Transportation
(Between Home & School) - Special 11-000-270-161 Salaries for Pupil Transportation-
(Other than Home & School) 11-000-270-162 Purchased Professional &
Technical Services Lease Purchase Payments - Buses Contracted Services ESC & CTSA Miscellaneous Purchased Services Transportation Supplies Miscellaneous Expenditures
Total Student Transportation Services
11-000-270-390 11-000-270-443 11-000-270-503 11-000-270-593 11-000-270-615 11-000-270-800
Student Transportation Services - Employee Benefits: Health Benefits 11-000-270-270
Total Student Transportation Services - Employee Benefits
Unallocated Benefits - Employee Benefits: Social Security Contributions Other Retirement Contributions
PERS Unemployment Compensation Workmen's Compensation Health Benefits Tuition Reimbursement Other Employee Benefits
Total Unallocated Benefits
Nonbudgeted: On-BhalfTPAF:
Post-Retirement Medical Contributions Normal Pension Contributions
11-000-291-220
11-000-291-241 11-000-291-250 11-000-291-260 11-000-291-270 11-000-291-280 11-000-291-290
Reimbursed TPAF Social Security Contributions
Total Undistributed Expenditures
Total Expenditures - Current Expense
MEDFORD TOWNSHIP BOARD OF EDUCATION GENERAL FUND
BUDGETARYCOMPAIUSONSCHEDULE FOR THE FISCAL YEARS ENDED JUNE 30, 2013 AND 2012
EXIllBIT C-l (Page 8 ofl0)
POSITIVE POSITIVE JUNE 30, 2013 (NEGATIVE) JUNE 30, 2012 (NEGATIVE)
ORIGINAL BUDGET FINAL FINAL TO ORIGINAL BUDGET FINAL FINAL TO BUDGET TRANSFERS BUDGET ACTUAL ACTUAL BUDGET TRANSFERS BUDGET ACTUAL ACTUAL
1,195,988
306,770
65,967
12,170
(57,875)
49,705
1,208,158
248,895
115,672
1,202,027
214,803
115,670
6,131
34,092
2
78,250
1,168,696
409,158
65,307
(78,250)
197,153
(138,403)
41,683
1,365,849
270,755
106,990
1,323,297 42,552
257,522 13,233
106,990
31,000 24,784 55,784 51,096 4,688 26,000 26,000 21,337 4,663 285,000 (40,570) 244,430 240,103 4,327 375,000 (170,000) 205,000 198,281 6,719 201,095 (10,709) 190,386 190,386 175,095 115,000 290,095 282,503 7,592 259,886 17,775 277,661 272,890 4,771 67,500 (2,000) 65,500 58,085 7,415 526,800 (57,292) 469,508 440,061 29,447 531,800 (58,000) 473,800 424,650 49,150
4,650 4,650 2,650 2,000 4,650 4,650 2,670 1,980
2,877,156 (62,012) 2,815,144 2,729,686 85,458 2,901,456 (92,817) ___ 2,808,639 2,675,335 133,304
762.335 (62,335) 700,000 700,000 730,794 730,794 730245 549
762335 (62335) 700000 700000 730794 730794 730,245 549
415,215 70,550 485,765 485,748 17 615,830 (167,894) 447,936 447,936
703,441 176,279 879,720 779,085 100,635 744,800 (51,055) 693,745 691,624 2,121 176,279 (176,279) 100,000 (50,000) 50,000 50,000 226,475 226,475 226,475 223,805 223,805 223,228 577
6,267,754 (39,740) 6,228,014 5,347,948 880,066 6,002,230 (326,407) 5,675,823 5,300,159 375,664 87,152 (46,834) 40,318 36,046 4,272 92,152 (50,000) 42,152 37,876 4,276
263,175 72.404 335.579 281,910 53,669 338,150 (110,000) 228,150 226.160 1.990
8139491 56380 8,19587171572121,0386598116967 (755,356) 73616116926983 434628
1,399,844 (1,399,844) 1,237,981 (1,237,981) 1,815,519 (1,815,519) 1.324,802 (1,324,802) 1,352,201 (1,352,201)
25,320036 (277152) 25042884 27092509 (2049625) 24821013 (349086) 24471927 25966626 (1494,699)
43104550 197,104 43301654 45290479 (1988825) 41877,608 81798 41959,406 43077844 (1118438)
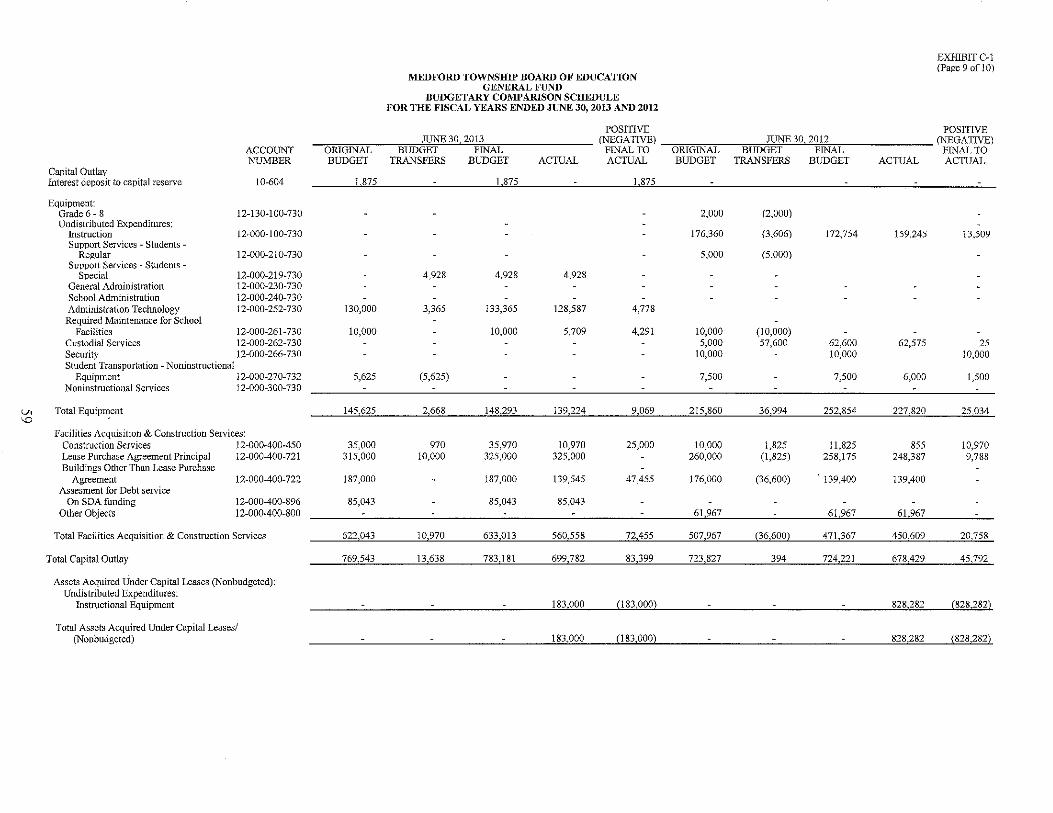
U> 'D
Capital Outlay Interest deposit to capital reserve
Equipment: Grade 6 - 8 Undistributed Expenditures;
Instruction Support Services - Students
Regular Support Services - Students -
Special General Administration School Administration Administration Technology Required Maintenance for School
Facilities Custodial Services Security Student Transportation - Noninstructional
ACCOUNT NUMBER
10-604
12-130-100-730
12-000-100-730
12-000-210-730
12-000-219-730 12-000-230-730 12-000-240-730 12-000-252-730
12-000-261-730 12-000-262-730 12-000-266-730
Equipment 12-000-270-732 Noninstructional Services 12-000-300-730
Total Equip~ent
Facilities Acquisition & Construction Services: Construction Services 12-000-400-450 Lease Purchase Agreement Principal 12-000-400-721 Buildings Other Than Lease Purchase
Agreement 12-000-400-722 Assesment for Debt service
On SDA funding 12-000-400-896 Other Objects 12-000-400-800
Total Facilities Acquisition & Construction Services
Total Capital Outlay
Assets Acquired Under Capital Leases (Nonbudgeted): Undistributed Expenditures:
Instructional Equipment
Total Assets Acquired Under Capital Leases! (Nonbudgeted)
EXHIBIT C-1 (Page90fI0)
MEDFORD TOWNSHIP BOARD OF EDUCATION GENERAL FUND
BUDGETARY COMPARISON SCHEDULE FOR THE FISCAL YEARS ENDED JUNE 30, 2013 AND 2012
POSITIVE POSITIVE JUNE 30 2013 (NEGATIVE) JUNE 30, 2012 (NEGATIVE)
ORIGINAL BUDGET FINAL FINAL TO ORIGINAL BUDGET FINAL FINAL TO BUDGET TRANSFERS BUDGET ACTUAL ACTUAL BUDGET TRANSFERS BUDGET ACTUAL ACTUAL
1875 t 875 1 875
2,000 (2,000)
176,360 (3,606) 172,754 159,245 13,509
5,000 (5,000)
4,928 4,928 4,928
130,000 3,365 133,365 128,587 4,778
10,000 10,000 5,709 4,291 10,000 (10,000) 5,000 57,600 62,600 62,575 25
10,000 10,000 10,000
5,625 (5,625) 7,500 7,500 6,000 1,500
145,625 2668 148,293 139224 9,069 215,860 36,994 252,854 227,820 25034
35,000 970 35,970 10,970 25,000 10,000 1,825 11,825 855 10,970 315,000 10,000 325,000 325,000 260,000 (1,825) 258,175 248,387 9,788
187,000 187,000 139,545 47,455 176,000 (36,600) , 139,400 139,400
85,043 85,043 85,043 61,967 61,967 61,967
622,043 10,970 633,013 560,558 72,455 507,967 (36,600) 471,367 450,609 20,758
769,543 13,638 783,181 699,782 83,399 723,827 394 724,221 678,429 45,792
183,000 (183,000) 828,282 (828,282)
183,000 (183,000) 828,282 (828,282)
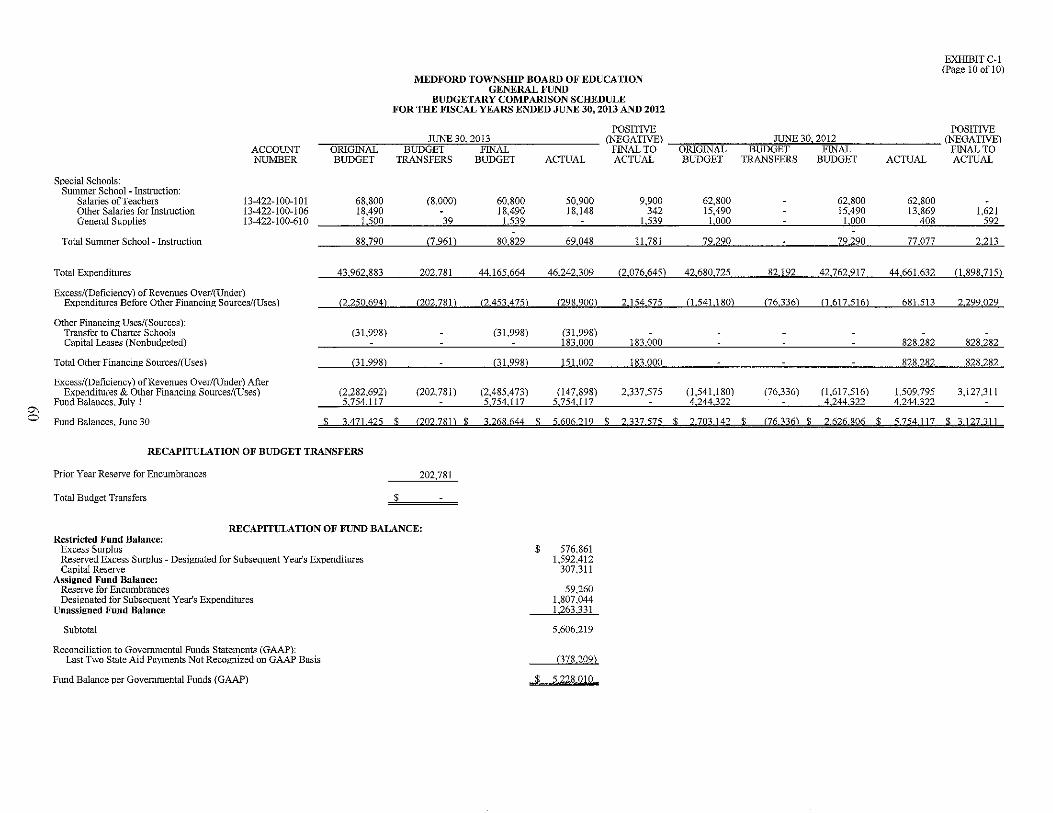
0\ o
Special Schools: Summer School- Instruction:
Salaries of Teachers Other Salaries for Instruction General Supplies
Total Summer School- Instruction
Total Expenditures
ACCOUNT NUMBER
13-422-100-101 13-422-100-106 13-422-100-610
Excess/(DeficiencY) of Revenues Over/(Under) Expenditures Before Other Financing Sources/(Uses)
Other Financing Uses/(Sources): Transfer to Charter Schools Capital Leases (Nonbudgeted)
Total Other Financing Sources/(Uses)
Excess/(Deficiency) of Revenues Over/(Uuder) After Expenditures & Other Financing Sources/(Uses)
Fund Balances. July I
Fund Balances, June 30
ORIGINAL BUDGET
68,800 18,490 1.500
EXHIBIT C-l (Page 10 of 10)
MEDFORD TOWNSHIP BOARD OF EDUCATION GENERAL FUND
BUDGETARYCOMPAJUSONSCHEDULE FOR THE FISCAL YEARS ENDED JUNE 30, 2013 AND 2012
JUNE 30, 2013 BUDGET FINAL
TRANSFERS BUDGET
(8,000)
39
60,800 18,490
1.539
ACTUAL
50,900 18,148
POSITIVE POSITIVE (NEGATIVE) ruNE 30, 2012 (NEGATIVE)
FINAL TO ORIGINAL BUDGET FINAL FINAL TO ACTUAL BUDGET TRANSFERS BUDGET ACTUAL ACTUAL
9,900 342
1.539
62,800 15,490
1.000
62,800 15.490
1,000
62.800 13,869
408 1,621
592
88,790 (7,961) 80,829 69,048 11,781 79,290 79,290 77,077 2,213
43962883 202781 44165664 46242309 (2076645) 42680725 82192 42762917 44661632 (1898715)
(2.250,694) (202.781) (2.453.475) (298.900) 2.154.575 (1.541.180) (76.336) 0.617,516) 681.513 2,299,029
(31,998) (31,998) (31,998) 183.000 183,000 828,282 828.282
(31,998) (31,998) 151,002 183,000 828,282 828,282
(2,282,692) 5.754.117
(202,781) (2,485,473) 5.754.117
047,898) 5,754.117
2)37,575 0,541,180) 4.244.322
(76,336) (1,617,516) 4.244.322
1,509,795 4.244.322
3,127,311
$ 3471425 $ (202781) $ 3268644 $ 5606219 $ 2337575 $ 2703142 $ (76336) $ 2626806 $ 57541]7 $ 3127311
RECAPITULATION OF BUDGET TRANSFERS
Prior Year Reserve for Encumbrances 202,781
Total Budget Transfers $
RECAPITULATION OF FUND BALANCE: Restricted Fund Balance:
Excess Sumlus Reserved Excess Sumlus - Designated for Subsequent Year's Expenditures Capital Reserve
Assiened Fund Balance: Reserve for Encumbrances Designated for Subsequent Year's Expenditures
Unassiened Fund Balance
Subtotal
Reconciliation to Governmental Funds Statements (GAAP): Last Two State Aid Payments Not Recognized on GAAP Basis
Fund Balance per Governmental Funds (GAAP)
$ 576,861 1,592,412
307,311
59.260 1,807,044 1,263,331
5.606.219
(378,209)
$ 5228010
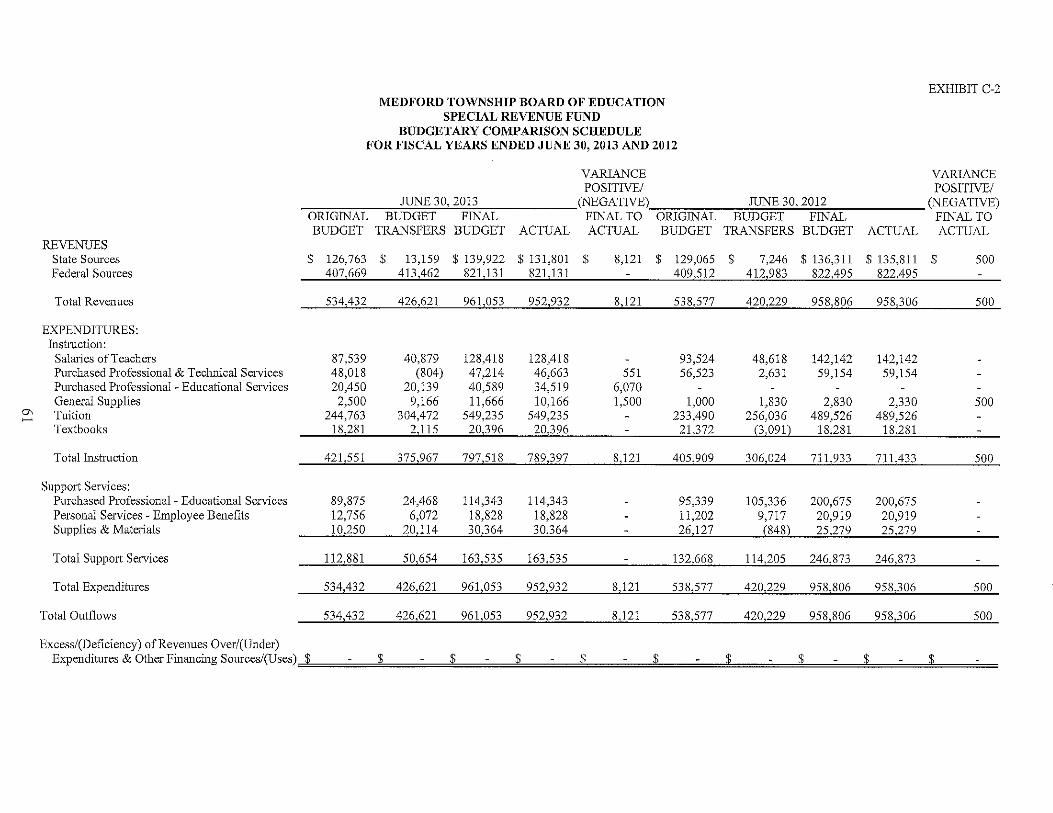
0-, ~
REVENUES State Sources Federal Sources
Total Revenues
EXPENDITURES: Inst11lction:
Salaries of Teachers Purchased Professional & Tec1mical Services Purchased Professional - Educational Services General Supplies Tuition Textbooks
Total Instruction
Support Services: Purchased Professional - Educational Services Personal Services - Employee Benefits Supplies & Materials
Total Support Services
T ota! Expenditures
Total Outflows
Excess/(Deficiency) ofReveuues Over/(Uuder)
MEDFORD TOWNSHIP BOARD OF EDUCATION SPECIAL REVENUE FUND
BUDGETARY COMPARISON SCHEDULE FOR FISCAL YEARS ENDED JUNE 30, 2013 AND 2012
VARIANCE POSITIVE/
JUNE 30, 2013 (NEGATIVE) JUNE 30, 2012 ORIGINAL BUDGET FINAL FINAL TO ORIGINAL BUDGET FINAL
EXHIBIT C-2
VARIANCE POSITIVE/
(NEGATIVE) FINAL TO
BUDGET TRANSFERS BUDGET ACTUAL ACTUAL BUDGET TRANSFERS BUDGET ACTUAL ACTUAL
$ 126,763 $ 13,159 $ 139,922 $ 131,801 $ 8,121 $ 129,065 $ 7,246 $ 136,311 $ 135,811 $ 500 407,669 413,462 821,131 821,131 409,512 412,983 822,495 822,495
534,432 426,621 961,053 952,932 8,121 538,577 420,229 958,806 958,306 500
87,539 40,879 128,418 128,418 93,524 48,618 142,142 142,142 48,018 (804) 47,214 46,663 551 56,523 2,631 59,154 59,154 20,450 20,139 40,589 34,519 6,070
2,500 9,166 11,666 10,166 1,500 1,000 1,830 2,830 2,330 500 244,763 304,472 549,235 549,235 233,490 256,036 489,526 489,526
18,281 2,115 20,396 _2Q,3J6 21,372 (3,091) 18,281 18,281
421,551 375,967 797,518 789,397 8,121 405,909 306,024 711,933 711,433 500
89,875 24,468 114,343 114,343 95,339 105,336 200,675 200,675 12,756 6,072 18,828 18,828 11,202 9,717 20,919 20,919 10,250 20,114 30,364 30,364 26,127 (848) 25,279 25,279
112,881 50,654 163,535 163,535 132,668 114,205 246,873 246,873
534,432 426,621 961,053 952,932 8,121 538,577 420,229 958,806 958,306 500
534,432 426,621 961,053 952,932 8,121 538,577 420,229 958,806 958,306 500
Expenditures & Other Financing Sources/(Uses) $ $ $ $ $ $ $ $ $ $

I
I
NOTES TO REQUIRED SUPPLEMENTARY INFORMATION

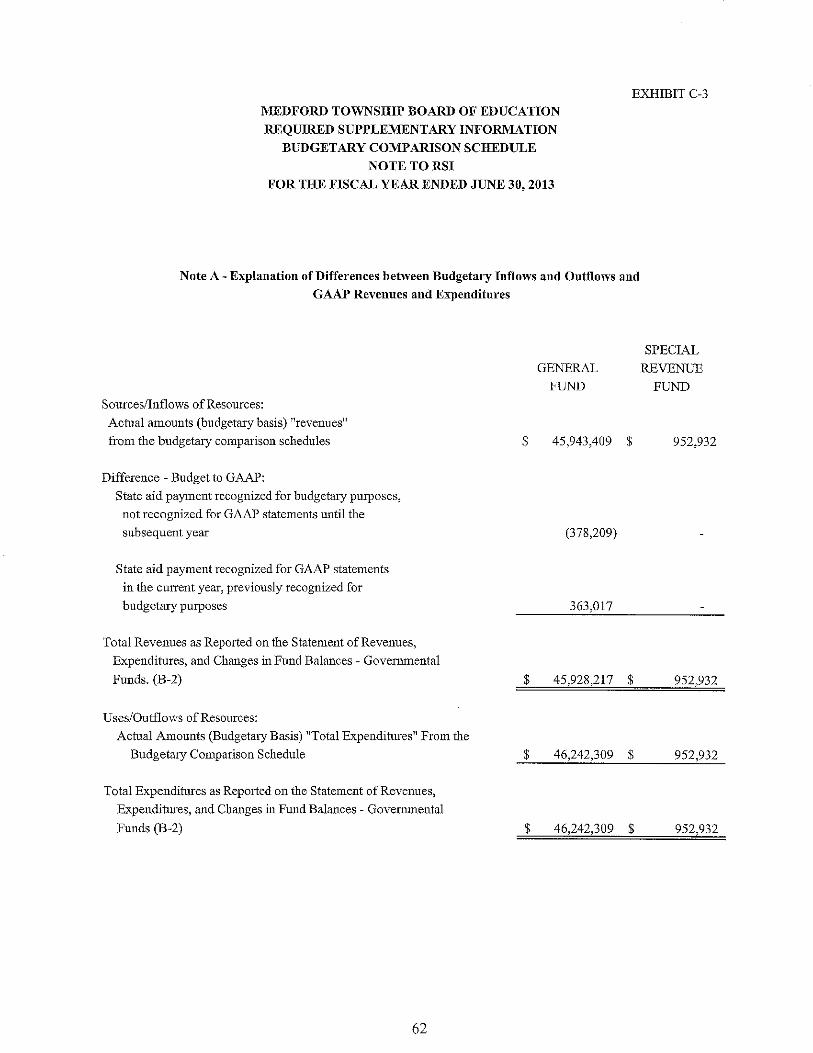
EXI:!IBIT C-3
MEDFORD TOWNSHIP BOARD OF EDUCATION
REQUIRED SUPPLEMENTARY INFORMATION
BUDGETARY COMPARISON SCHEDULE
NOTE TO RSI
FOR THE FISCAL YEAR ENDED JUNE 30, 2013
Note A - Explanation of Differences between Budgetary Inflows and Outflows and
GAAP Revenues and Expenditures
GENERAL
FUND
SourceslInflows of Resources:
Actual amounts (budgetary basis) !!revenuesll
from the budgetary comparison schedules $ 45,943,409 $
Difference - Budget to GAAP:
State aid payment recognized for budgetary pU1l'oses,
not recognized for GAAP statements until the
subsequent year (378,209)
State aid payment recognized for GAAP statements
in the current year, previously recognized for
budgetary purposes 363,017
Total Revenues as Reported on the Statement of Revenues,
Expenditures, and Changes in Fund Balances - Govermnental
Funds. (B-2) $ 45,928,217 $
Uses/Outflows of Resources:
Actual Amounts (Budgetary Basis) "Total Expenditures" From the
Budgetary Comparison Schedule $ 46,242,309 $
Total Expenditures as Reported on the Statement of Revenues,
Expenditures, and Changes in Fund Balances - Governmental
Funds (B-2) $ 46,242,309 $
62
SPECIAL
REVENUE
FUND
952,932
952,932
952,932
952,932

I
I
I
I
OTHER SUPPLEMENTARY INFORMATION


D. School Based Budget Schedules
Not Applicable

I
I
I
I
I
I
I
I
I
I

E. Special Revenue Fund

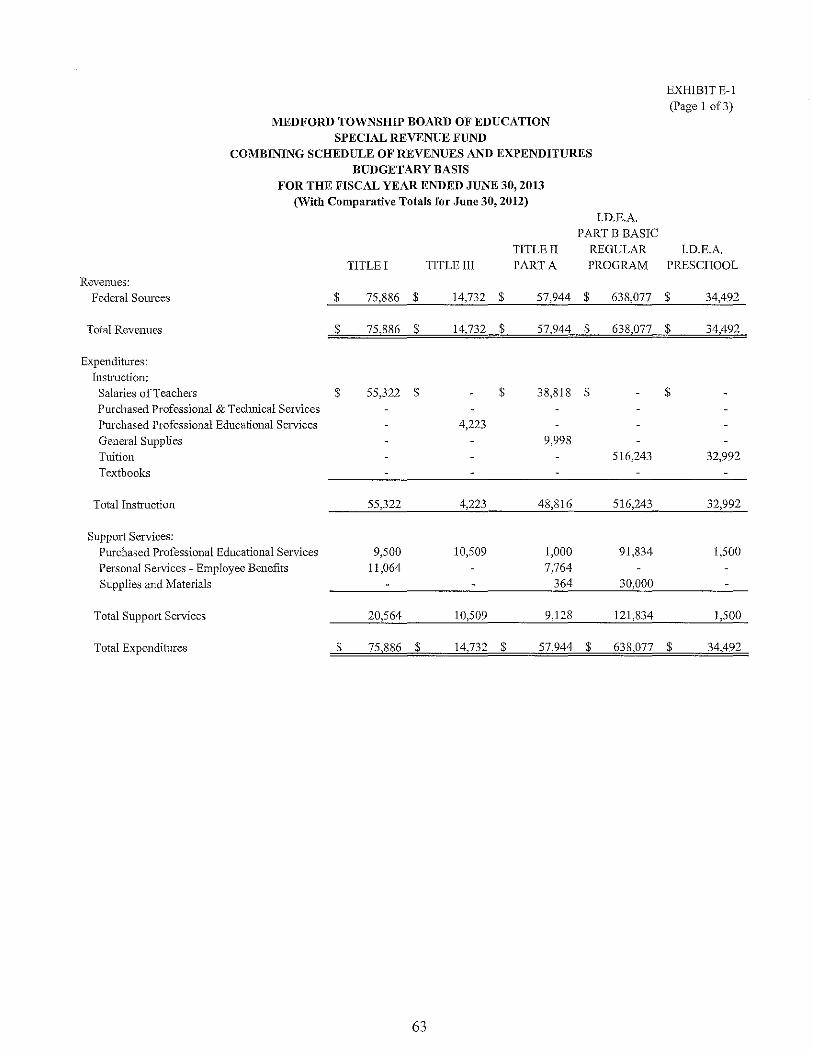
EXHIBIT E-l
(Page 1 of3) MEDFORD TOWNSHIP BOARD OF EDUCATION
SPECIAL REVENUE FUND
COMBINING SCHEDULE OF REVENUES AND EXPENDITURES BUDGETARY BASIS
FOR THE FISCAL YEAR ENDED JUNE 30, 2013
(With Comparative Totals for June 30, 2012) I.D.E.A.
PARTB BASIC
TITLE II REGULAR I.D.E.A.
TITLE I TITLE III PART A PROGRAM PRESCHOOL
Revenues: Federal Sources $ 75,886 $ 14,732 $ 57,944 $ 638,077 $ 34,492
Total Revenues $ 75,886 $ 14,732 $ 57,944 $ 638,077 $ 34,492
Expenditures: Instmction:
Salaries of Teachers $ 55,322 $ $ 38,818 $ $
Purchased Professional & Teclmical Services Purchased Professional Educational Services 4,223
General Supplies 9,998
Tuition 516,243 32,992
Textbooks
Total Instruction 55,322 4,223 48,816 516,243 32,992
Support Services: Purchased Professional Educational Services 9,500 10,509 1,000 91,834 1,500
Personal Services - Employee Benefits 11,064 7,764
Supplies and Materials 364 30,000
Total Support Services 20,564 10,509 9,128 121,834 1,500
Total Expenditures $ 75,886 $ 14,732 $ 57,944 $ 638,077 $ 34,492
63
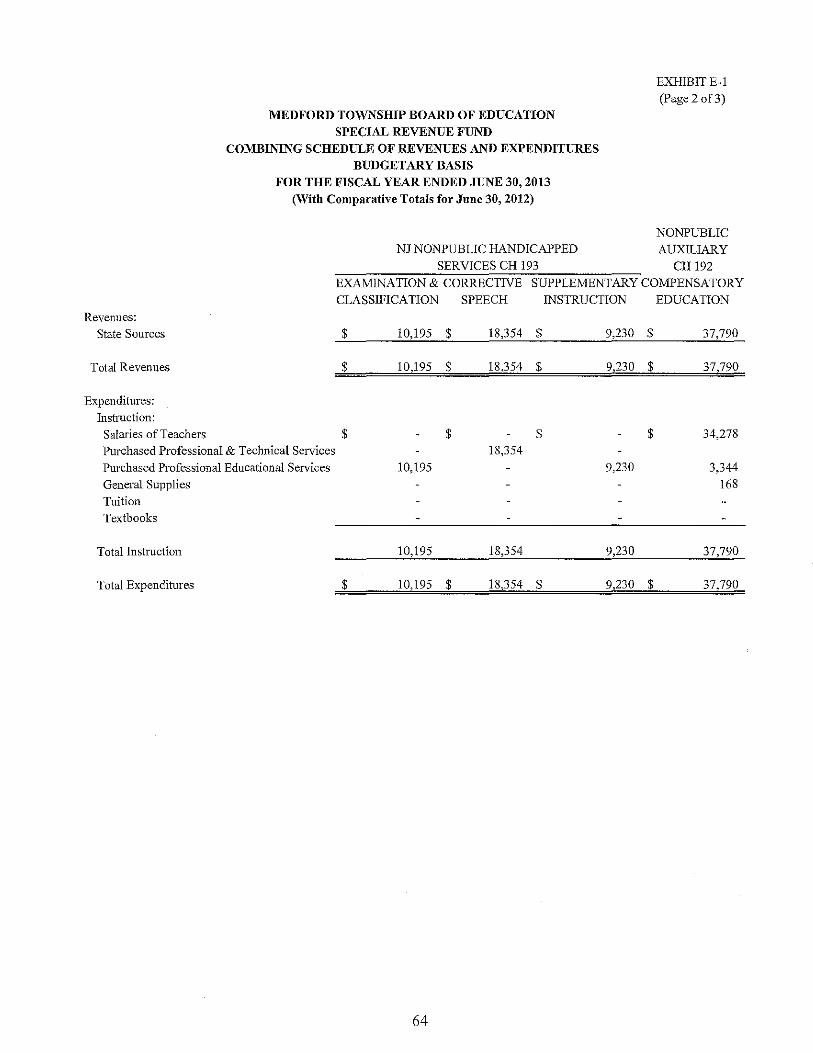
EXHIBIT E-l
(page 2 of3) MEDFORD TOWNSHIP BOARD OF EDUCATION
SPECIAL REVENUE FUND
COMBINING SCHEDULE OF REVENUES AND EXPENDITURES
BUDGETARY BASIS
FOR THE FISCAL YEAR ENDED JUNE 30, 2013
(With Comparative Totals for June 30, 2012)
NONPUBLIC NJ NONPUBLIC HANDICAPPED AUXILIARY
SERVICES CH 193 CH 192 EXAMINATION & CORRECTIVE SUPPLEMENTARY COMPENSATORY
CLASSIFICATION SPEECH INSTRUCTION EDUCATION
Revenues:
State Sources $ 10,195 $ 18,354 $ 9,230 $ 37,790
Total Revenues $ 10,195 $ 18,354 $ 9,230 $ 37,790
Expenditures:
Instruction:
Salaries of Teachers $ $ $ $ 34,278
Purchased Professional & Technical Services 18,354
Purchased Professional Educational Services 10,195 9,230 3,344
General Supplies 168
Tuition
Textbooks
Total Instruction 10,195 18,354 9,230 37,790
Total Expenditures $ 10,195 $ 18,354 $ 9,230 $ 37,790
64
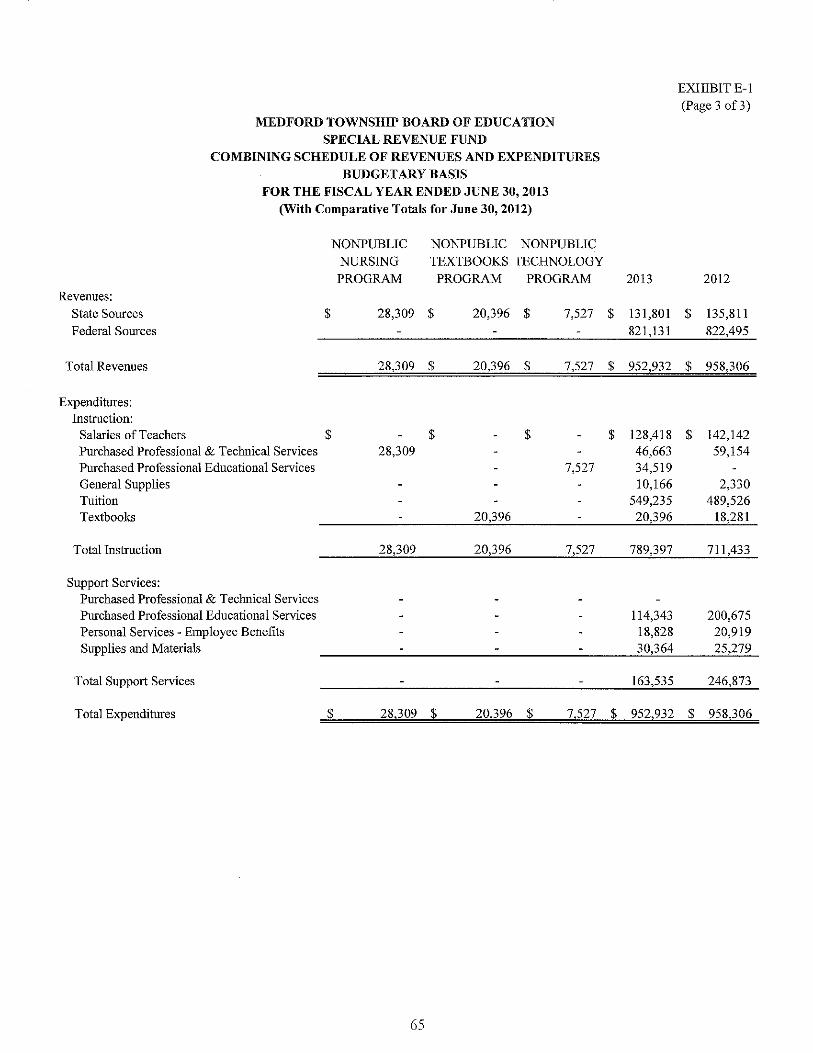
EXHIBIT E-I (Page 3 on)
MEDFORD TOWNSHIP BOARD OF EDUCATION SPECIAL REVENUE FUND
COMBINING SCHEDULE OF REVENUES AND EXPENDITURES BUDGETARY BASIS
FOR THE FISCAL YEAR ENDED JUNE 30, 2013 (With Comparative Totals for June 30, 2012)
NONPUBLIC NONPUBLIC NONPUBLIC NURSING TEXTBOOKS rECHNOLOGY PROGRAM PROGRAM PROGRAM 2013 2012
Revenues: State Sources $ 28,309 $ 20,396 $ 7,527 $ 131,801 $ 135,8 II Federal Sources 821,131 822,495
Total Revenues 28,309 $ 20,396 $ 7,527 $ 952,932 $ 958,306
Expenditures: Instruction:
Salaries of Teachers $ $ $ $ 128,418 $ 142,142 Purchased Professional & Technical Services 28,309 46,663 59,154 Purchased Professional Educational Services 7,527 34,519 General Supplies 10,166 2,330 Tuition 549,235 489,526 Textbooks 20,396 20,396 18,281
Total Instruction 28,309 20,396 7,527 789,397 711,433
Support Services: Purchased Professional & Technical Services Purchased Professional Educational Services 114,343 200,675 Personal Services - Employee Benefits 18,828 20,919 Supplies and Materials 30,364 25,279
Total Support Services 163,535 246,873
T olal Expenditures $ 28,309 $ 20,396 $ 7,527 $ 952,932 $ 958,306
65


F. Capital Projects Fund

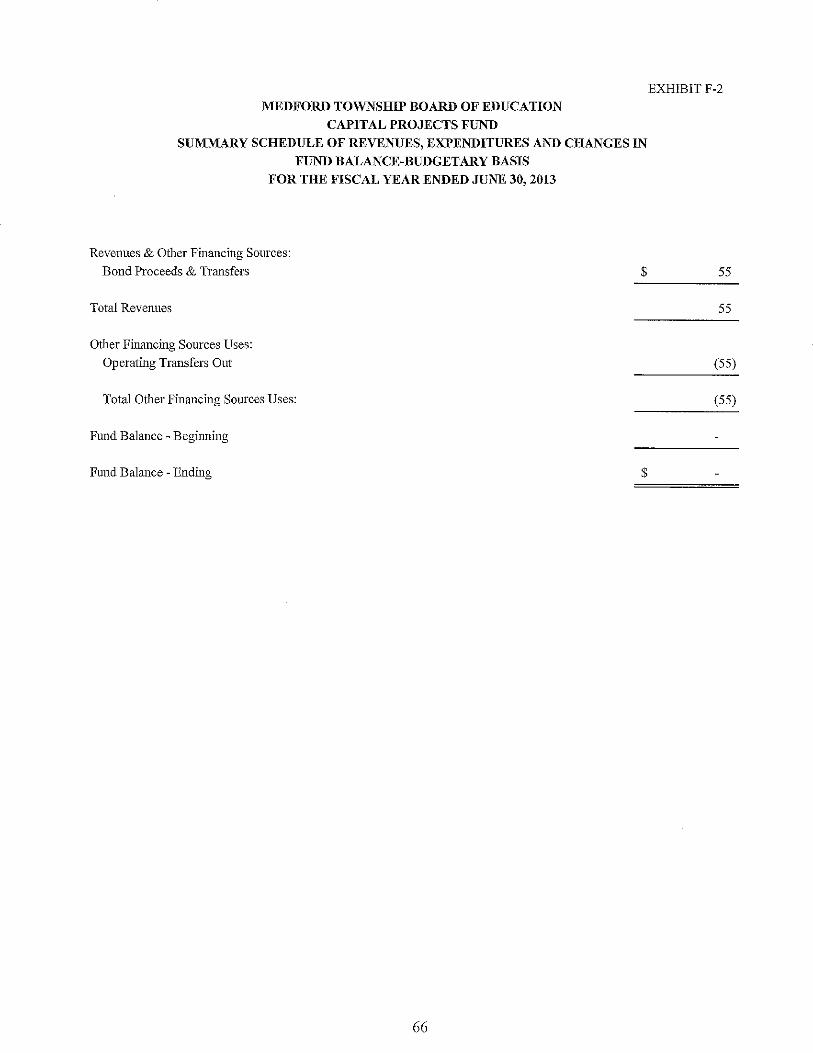
MEDFORD TOWNSHIP BOARD OF EDUCATION
CAPITAL PROJECTS FUND SUMMARY SCHEDULE OF REVENUES, EXPENDITURES AND CHANGES IN
FUND BALANCE-BUDGETARY BASIS
FOR THE FISCAL YEAR ENDED JUNE 30, 2013
Revennes & Other Financing Somces:
Bond Proceeds & Transfers $
Total Revenues
Other Financing Somces Uses:
Operating Transfers Out
Total Other Financing Sources Uses:
Fund Balance - Beginning
Fund Balance - Ending $
66
EXHIBITF-2
55
55
(55)
(55)
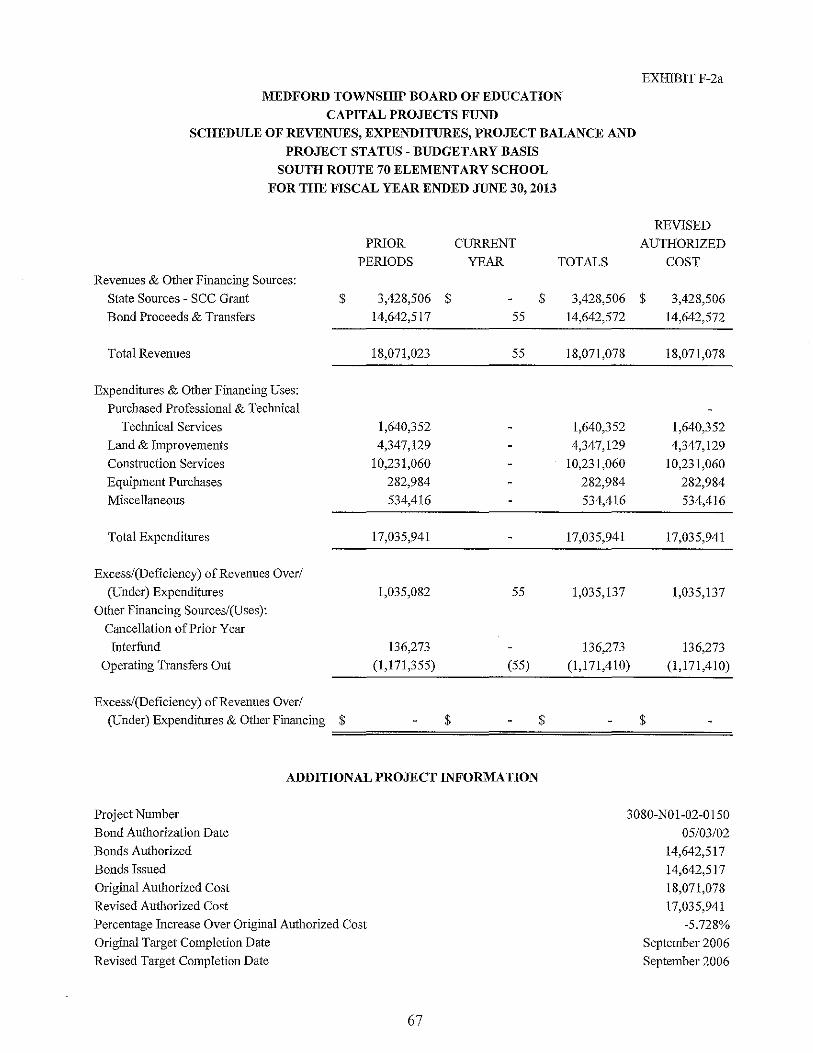
MEDFORD TOWNSIllP BOARD OF EDUCATION
CAPITAL PROJECTS FUND
SCHEDULE OF REVENUES, EXPENDITURES, PROJECT BALANCE AND
PROJECT STATUS - BUDGETARY BASIS
SOUTH ROUTE 70 ELEMENTARY SCHOOL
FOR THE FISCAL YEAR ENDED JUNE 30, 2013
Revenues & Other Financing Sources:
PRIOR
PERIODS
CURRENT
YEAR TOTALS
EXHIBIT F-2a
REVISED
AUTHORIZED
COST
State Sources - SCC Grant
Bond Proceeds & Transfers $ 3,428,506 $
14,642,517 $ 3,428,506 $ 3,428,506
Total Revenues
Expenditures & Other Financing Uses:
Purchased Professional & Technical
Technical Services
Land & Improvements
ConstnlCtion Services Equipment Purchases
Miscellaneous
Total Expenditures
Excess/(Deficiency) of Revenues Over/
(Under) Expenditures
Other Financing Sources/(Uses):
Cancellation of Prior Year
Interfimd
Operating Transfers Out
Excess/(Deficiency) of Revenues Over/
(Under) Expenditures & Other Financing $
18,071,023
1,640,352
4,347,129
10,231,060
282,984
534,416
17,035,941
1,035,082
136,273
(1,171,355)
$
55 14,642,572 14,642,572
55
55
(55)
$
18,071,078
1,640,352
4,347,129
10,231,060
282,984
534,416
17,035,941
1,035,137
136,273
(1,171,410)
$
18,071,078
1,640,352
4,347,129
10,231,060
282,984
534,416
17,035,941
1,035,137
136,273
(1,171,410)
==============================
ADDITIONAL PROJECT INFORMATION
Project Number
Bond Authorization Date
Bonds Authorized
Bonds Issued
Original Authorized Cost
Revised Anthorized Cost
Percentage Increase Over Original Authorized Cost
Original Target Completion Date
Revised Target Completion Date
67
3080-NOI-02-0150
05/03/02
14,642,517
14,642,517
18,071,078
17,035,941
-5.728%
September 2006
September 2006

G, Proprietary Funds


Enterprise Funds

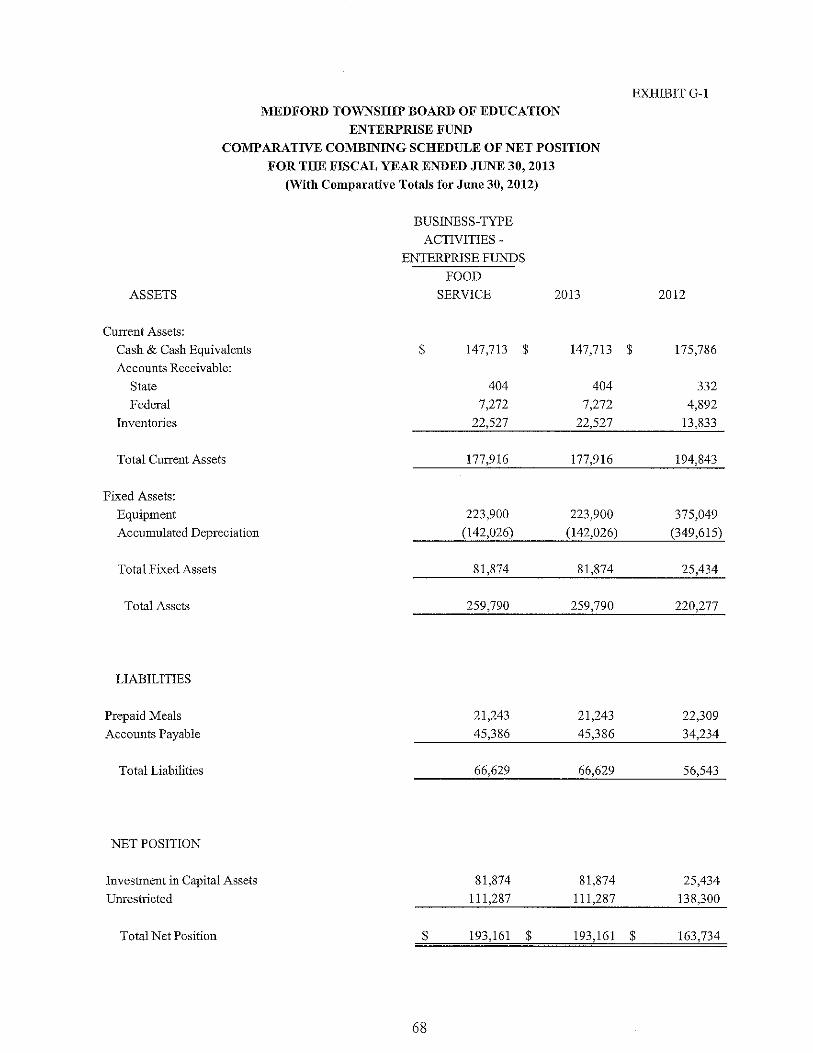
MEDFORD TOWNSHIP BOARD OF EDUCATION
ENTERPRISE FUND
COMPARATIVE COMBINING SCHEDULE OF NET POSITION
FOR THE FISCAL YEAR ENDED JUNE 30, 2013
ASSETS
Current Assets:
Cash & Cash Equivalents
Accounts Receivable:
State
Federal
Inventories
Total Current Assets
Fixed Assets:
Equipment
Accumulated Depreciation
Total Fixed Assets
Total Assets
LIABILITIES
Prepaid Meals
Accounts Payable
Total Liabilities
NET POSITION
Investment in Capital Assets
Unrestricted
(With Comparative Totals for June 30, 2012)
BUSINESS-TYPE
ACTIVITIES -
ENTERPRISE FUNDS
FOOD
SERVICE
$ 147,713
404
7,272
22,527
177,916
223,900
(142,026)
81,874
259,790
21,243
45,386
66,629
81,874
111,287
$
2013
147,713
404
7,272
22,527
177,916
223,900
(142,026)
81,874
259,790
21,243
45,386
66,629
81,874
111,287
EXHIBIT G-I
$
2012
175,786
332
4,892
13,833
194,843
375,049
(349,615)
25,434
220,277
22,309
34,234
56,543
25,434
138,300
Total Net Position $ 193,161 $ 193,161 $ 163,734
68
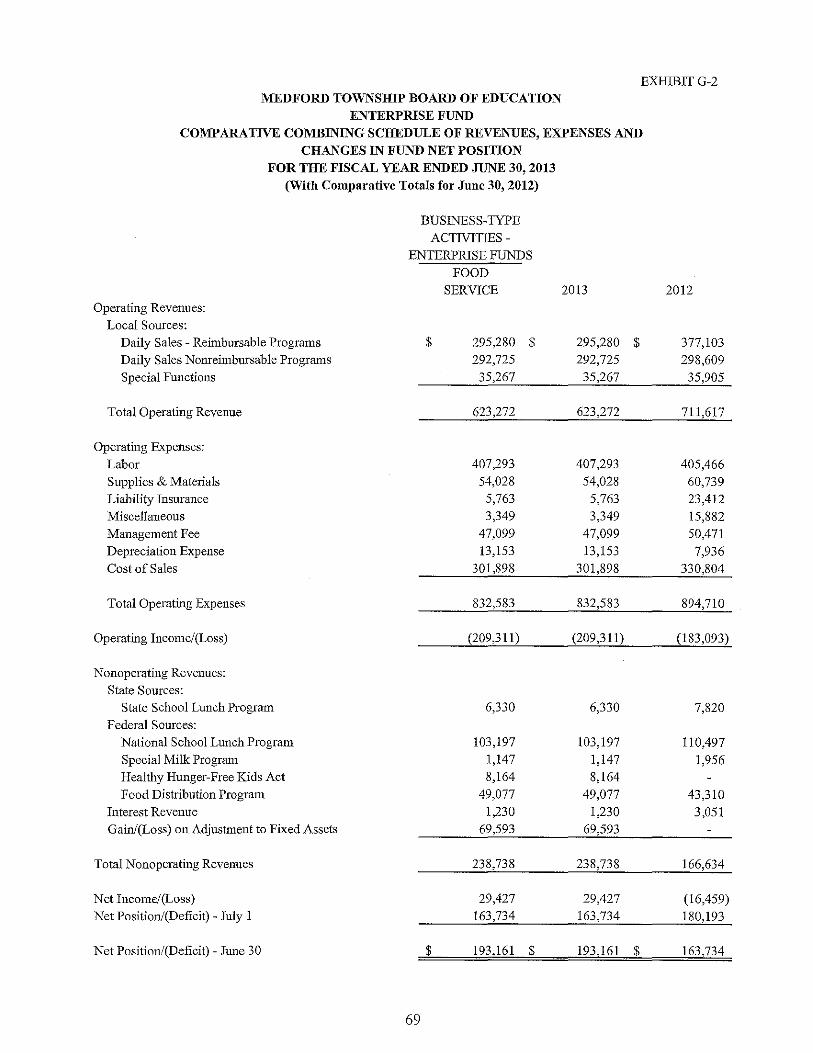
EXHIBITG-2 MEDFORD TOWNSHIP BOARD OF EDUCATION
ENTERPRISE FUND COMPARATIVE COMBINING SCHEDULE OF REVENUES, EXPENSES AND
CHANGES IN FUND NET POSITION FOR THE FISCAL YEAR ENDED JUNE 30, 2013
(With Comparative Totals for June 30,2012)
BUSINESS-TYPE ACTIVITIES -
ENTERPRISE FUNDS
FOOD SERVICE 2013 2012
Operating Revenues: Local Sources:
Daily Sales - Reimbursable Programs $ 295,280 $ 295,280 $ 377,103 Daily Sales Nonreimbursable Programs 292,725 292,725 298,609 Special Fuuctions 35,267 35,267 35,905
Total Operating Revenue 623,272 623,272 711,617
Operating Expenses: Labor 407,293 407,293 405,466 Supplies & Materials 54,028 54,028 60,739 Liability Insurance 5,763 5,763 23,412 Miscellaneous 3,349 3,349 15,882 Management Fee 47,099 47,099 50,471 Depreciation Expense 13,153 13,153 7,936 Cost of Sales 301,898 301,898 330,804
Total Operating Expenses 832,583 832,583 894,710
Operating Income/(Loss) (209,311) (209,311) (183,093)
Nonoperating Revenues: State Sources:
State School Lunch Program 6,330 6,330 7,820 Federal Sources:
National School Lunch Program 103,197 103,197 110,497 Special Milk Program 1,147 1,147 1,956 Healthy Huuger-Free Kids Act 8,164 8,164 Food Distribution Program 49,077 49,077 43,310
Interest Revenue 1,230 1,230 3,051 Gain/(Loss) on Adjustment to Fixed Assets 69,593 69,593
Total Nonoperating Revenues 238,738 238,738 166,634
Net Income! (Loss) 29,427 29,427 (16,459) Net Positiou/(Deficit) - July 1 163,734 163,734 180,193
Net Positiou/(Deficit) - June 30 $ 193,161 $ 193,161 $ 163,734
69
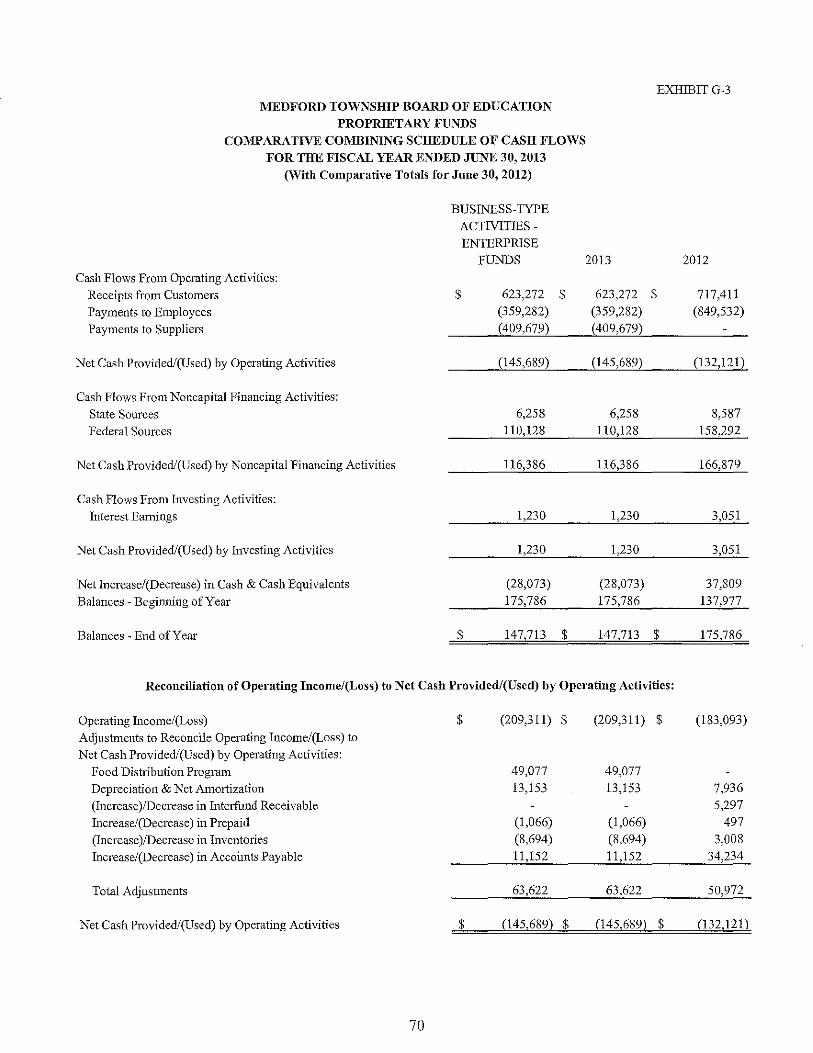
EXHIBITG-3 MEDFORD TOWNSIDP BOARD OF EDUCATION
PROPRIETARY FUNDS COMPARATIVE COMBINING SCHEDULE OF CASH FLOWS
FOR THE FISCAL YEAR ENDED JUNE 30, 2013 (With Comparative Totals for June 30, 2012)
BUSINESS-TYPE
ACTIVITIES -ENIERPRISE
FUNDS 2013 2012
Cash Flows From Operating Activities:
Receipts from Customers $ 623,272 $ 623,272 $ 717,411
Payments to Employees (359,282) (359,282) (849,532)
Payments to Suppliers (409,679) (409,679)
Net Cash Provided/(Used) by Operating Activities (145,689) (145,689) (132,121)
Cash Flows From Noncapital Financing Activities:
State Sources 6,258 6,258 8,587
Federal Sources 110,128 110,128 158,292
Net Cash Provided/(Used) by Noncapital Financing Activities 116,386 116,386 166,879
Cash Flows From Investing Activities:
Interest Earnings 1,230 1,230 3,051
Net Cash Provided/(Used) by Investing Activities 1,230 1,230 3,051
Net Increase/(Decrease) in Cash & Cash Equivalents (28,073) (28,073) 37,809
Balances - Beginning of Year 175,786 175,786 137,977
Balances - End o[Year $ 147,713 $ 147,713 $ 175,786
Reconciliation of Operating Income/(Loss) to Net Cash Providedl(Used) by Operating Activities:
Operating Income/(Loss) $ (209,311) $ (209,311) $ (183,093)
Adjustments to Reconcile Operating Income/(Loss) to Net Cash Provided/(Used) by Operating Activities:
Food Distribution Program 49,077 49,077
Depreciation & Net AmOliization 13,153 13,153 7,936
(Increase)/Decrease in Intelfund Receivable 5,297
Increase/(Decrease) in Prepaid (1,066) (1,066) 497
(Increase)/Decrease in Inventories (8,694) (8,694) 3,008
Increase/(Decrease) in Accounts Payable 11,152 11,152 34,234
Total Adjustments 63,622 63,622 50,972
Net Cash Provided/(Used) by Operating Activities $ (145,689) $ (145,689) $ (132,121)
70

Intemal Service Fnnd
Not Applicable


H. Fiduciary Fund

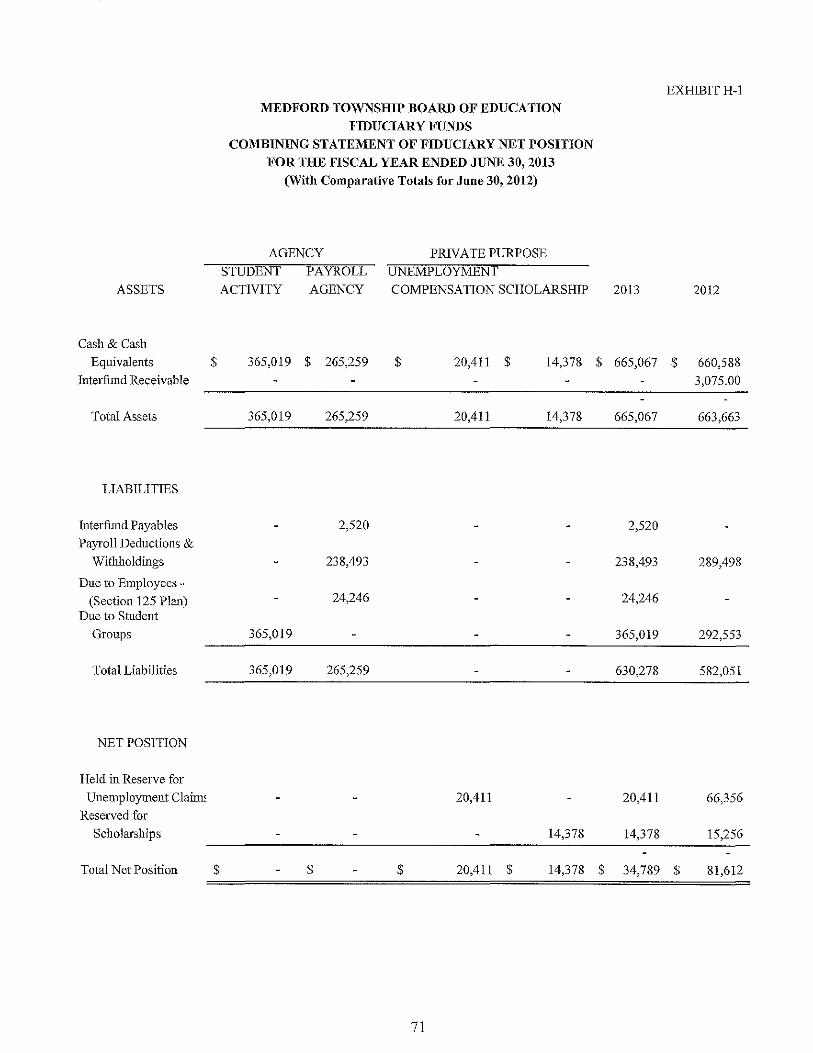
ASSETS
Cash & Cash Equivalents $
Interfund Receivable
Total Assets
LIABILITIES
Interfund Payables
Payroll Deductions &
Withboldings
Due to Employees -(Section 125 Plan)
Due to Student
Groups
Total Liabilities
NET POSITION
Held in Reserve for Unemployment Claim,
Reserved for Scholarships
Total Net Position $
MEDFORD TOWNSHIP BOARD OF EDUCATION
FIDUCIARY FUNDS
COMBINING STATEMENT OF FIDUCIARY NET POSITION
FOR THE FISCAL YEAR ENDED JUNE 30, 2013 (With Comparative Totals for June 30, 2012)
AGENCY PRIVATE PURPOSE
STUDENT PAYROLL UNEMPLOYMENT
ACTIVITY AGENCY COMPENSATION SCHOLARSHIP
EXHIBITH-l
2013 2012
365,019 $ 265,259 $ 20,411 $ 14,378 $ 665,067 $ 660,588
3,075.00
365,019 265,259 20,411 14,378 665,067 663,663
2,520 2,520
238,493 238,493 289,498
24,246 24,246
365,019 365,019 292,553
365,019 265,259 630,278 582,051
20,411 20,411 66,356
14,378 14,378 15,256
$ $ 20,411 $ 14,378 $ 34,789 $ 81,612
71
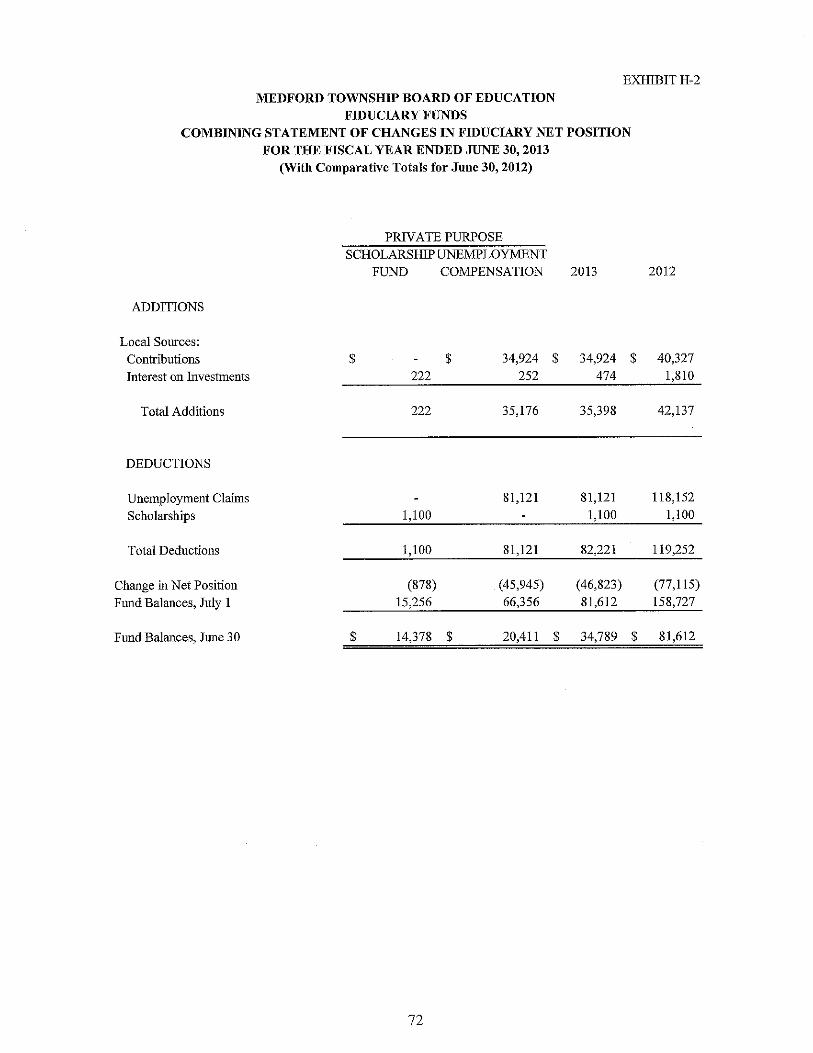
EXIITBIT H-2
MEDFORD TOWNSHIP BOARD OF EDUCATION FIDUCIARY FUNDS
COMBINING STATEMENT OF CHANGES IN FIDUCIARY NET POSITION FOR THE FISCAL YEAR ENDED JUNE 30, 2013
(With Comparative Totals for June 30, 2012)
PRN ATE PURPOSE SCHOLARSHIP UNEMPLOYMENT
FUND COMPENSATION 2013
ADDITIONS
Local Sources: Contributions $ $ 34,924 $ 34,924 $
Interest on Investments 222 252 474
Total Additions 222 35,176 35,398
DEDUCTIONS
Unemployment Claims 81,121 81,121
Scholarships 1,100 1,100
Total Deductions 1,100 81,121 82,221
Change in Net Position (878) (45,945) (46,823)
Fnnd Balances, July I 15,256 66,356 81,612
Fnnd Balances, Jnne 30 $ 14,378 $ 20,411 $ 34,789 $
72
2012
40,327 1,810
42,137
118,152 1,100
119,252
(77,115) 158,727
81,612
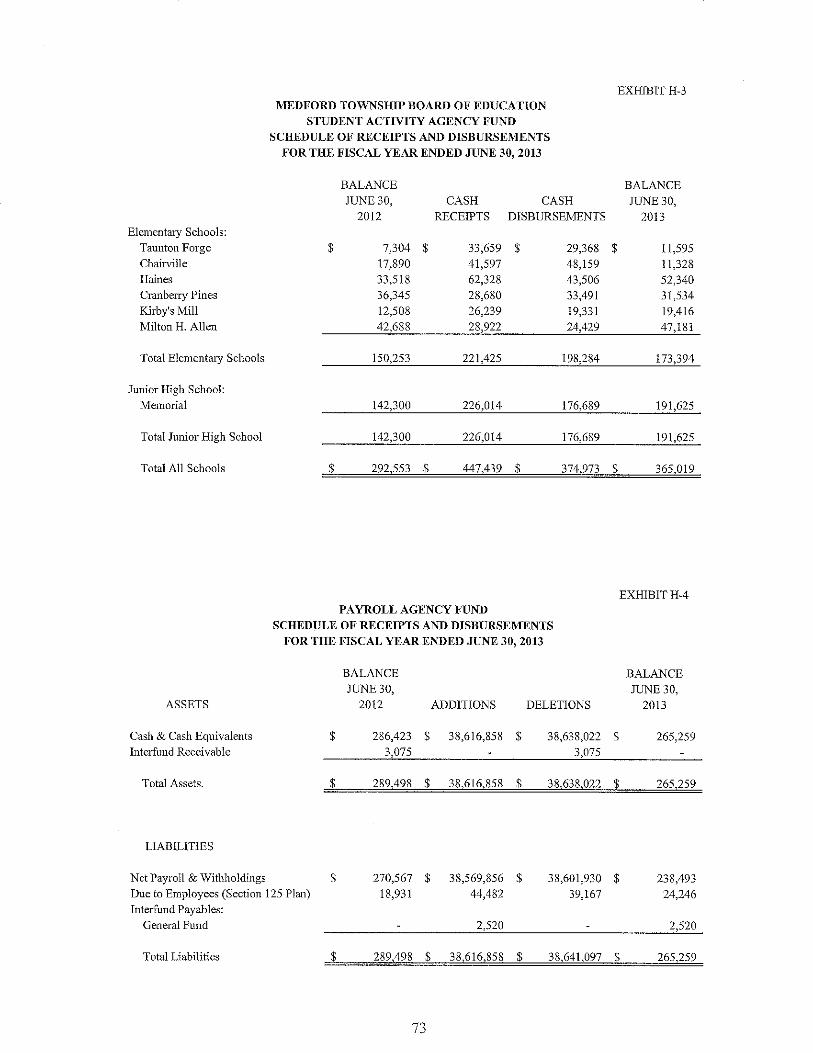
Elementary Schools:
Taunton Forge Chairville
Haines
Cranberry Pines
Kirby's Mill
Milton H. Allen
Total Elementmy Schools
Junior High School:
Memorial
Total Junior High School
Total All Schools
ASSETS
Cash & Cash Equivalents
Interfund Receivable
Total Assets.
LIABILITIES
Net Payroll & Withholdings
MEDFORD TOWNSHIP BOARD OF EDUCA nON
STUDENT ACTIVITY AGENCY FUND
SCHEDULE OF RECEIPTS AND DISBURSEMENTS
FOR THE FISCAL YEAR ENDED JUNE 30, 2013
BALANCE
JUNE 30, CASH CASH
2012 RECEIPTS DISBURSEMENTS
$ 7,304 $ 33,659 $ 29,368
17,890 41,597 48,159
33,518 62,328 43,506
36,345 28,680 33,491 12,508 26,239 19,331 42,688 28,922 24,429
150,253 221,425 198,284
142,300 226,014 176,689
142,300 226,014 176,689
$ 292,553 $ 447,439 $ 374,973
PAYROLL AGENCY FUND
SCHEDULE OF RECEIPTS AND DISBURSEMENTS
FOR THE FISCAL YEAR ENDED JUNE 30, 2013
BALANCE
JUNE 30, 2012 ADDITIONS DELETIONS
$ 286,423 $ 38,616,858 $ 38,638,022 3,075 3,075
$ 289,498 $ 38,616,858 $ 38,638,022
$ 270,567 $ 38,569,856 $ 38,601,930 Due to Employees (Section 125 Plan) 18,931 44,482 39,167 Interfund Payables:
General Fund 2,520
Total Liabilities $ 289,498 $ 38,616,858 $ 38,641.097
73
EXHlBITH-3
BALANCE
JUNE 30,
2013
$ 11,595 11,328
52,340
31,534
19,416
47,181
173,394
191,625
191,625
$ 365,019
EXHlBITH-4
BALANCE
JUNE 30,
2013
$ 265,259
$ 265,259
$ 238,493
24,246
2,520
$ 265,259

I
I
I
I

1. Long-Tenn Debt

I
I
I
I
I
I I
I
I
I
I
I
I
I
I
I
I
I
I
I
I I
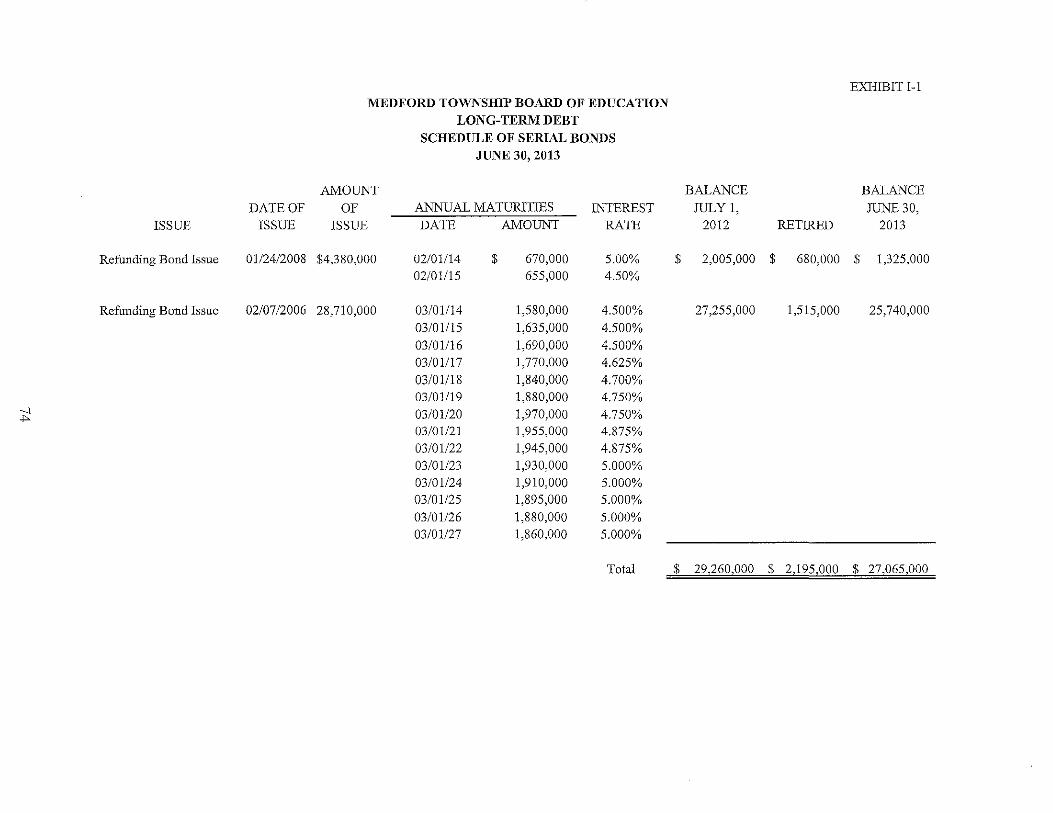
ISSUE
Refunding Bond Issue
Refunding Bond Issue
--J -""
MEDFORD TOWNSHIP BOARD OF EDUCATION LONG-TERM DEBT
SCHEDULE OF SERIAL BONDS JUNE 30, 2013
AMOUNT DATE OF OF ANNUAL MATURlTIES INTEREST
ISSUE ISSUE DATE AMOUNT RATE
01124/2008 $4,380,000 02/01/14 $ 670,000 5.00% 02/01/15 655,000 4.50%
02/07/2006 28,710,000 03/01114 1,580,000 4.500%
03/01115 1,635,000 4.500% 03/01116 1,690,000 4.500% 03/01117 1,770,000 4.625% 03/01118 1,840,000 4.700% 03/01/19 1,880,000 4.750% 03/01/20 1,970,000 4.750% 03/01/21 1,955,000 4.875% 03/01/22 1,945,000 4.875% 03/01/23 1,930,000 5.000% 03/01/24 1,910,000 5.000% 03/01125 1,895,000 5.000% 03/01126 1,880,000 5.000% 03/01/27 1,860,000 5.000%
Total
EXHIBIT 1-1
BALANCE BALANCE JULy 1, JUNE 30,
2012 RETIRED 2013
$ 2,005,000 $ 680,000 $ 1,325,000
27,255,000 1,515,000 25,740,000
$ 29,260,000 $ 2,195,000 $ 27,065,000

EXHIBIT 1-2
MEDFORD TOWNSHIP BOARD OF EDUCATION
LONG-TERlVI DEBT SCHEDULE OF OBLIGATIONS UNDER CAPITAL LEASES
JUNE 30, 2013
AMOUNT AMOUNT AMOUNT LAST INTEREST OF OUTSTANDING ISSUED RETIRED OUTSTANDING
DATE OF PAYMENT RATE ORIGINAL JUNE 30, CURRENT CURRENT JUNE 30, DESCRIPTION LEASE TERM DUE PAYAELE ISSUE 2012 YEAR YEAR 2013
School Buses, Textbooks, Technology Equipment & Kitchen Equipment 7/1/2008 5 YEARS 711/2013 3.27% $ 650,000 $ 275,000 $ $ 135,000 $ 140,000
Copiers for Chairville, Kirby's Mill, Allen
Business, Memorial 2/15/2010 5 YEARS 2/15/2014 7.00% 246,451 104,472 50,895 53,577 Copiers for Chairville, Allen
Business, Memorial 7/1512010 4 YEARS 7/1512014 6.40% 42,396 21,698 10,508 11,190 --.l Canon Copiers for Haines & V> TaLmton Forge 7/1512010 5 YEARS 7115/2015 4.00% 124,445 78,309 24,828 53,481
Canon Copiers for Haines & Taunton Forge 101112010 5 YEARS 9/112015 5.84% 42,465 26,949 8,464 18,485
Networking Equipment 1/1012012 5 YEARS 9/10/2016 2.79% 553,577 501,018 112,606 388,412 201054 Passenger School Buses (3) 8/112011 4 YEARS 8/1/2014 2.90% 246,000 162,376 52,841 109,535
Copiers for Memorial Media Center & Haines Guidance 10/15/2011 5 YEARS 9115/2016 5.93% 28,705 24,921 5,313 19,608
2010/200554 Passenger School Buses c: 7/10/2012 4 YEARS 811/2015 2.48% 183,000 183,000 65,418 117,582
Total $ 1,194,743 $ 183,000 $ 465,873 $ 911,870
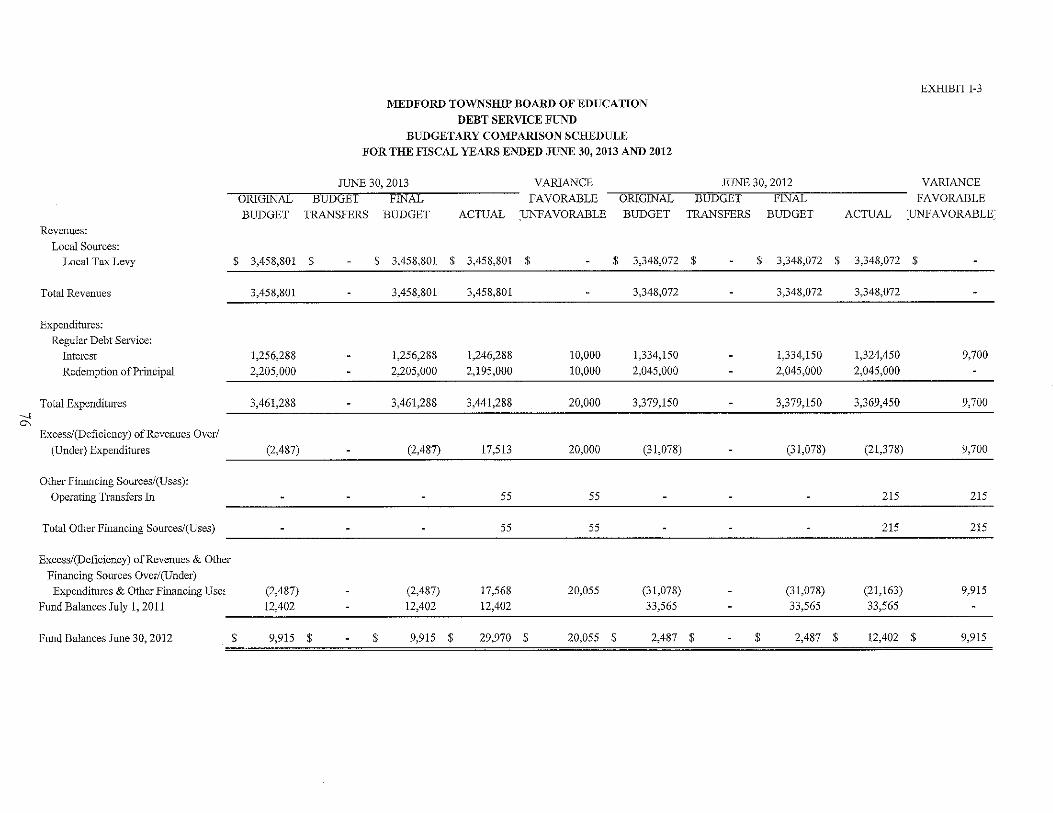
EXHIBIT 1-3
MEDFORD TOWNSHIP BOARD OF EDUCATION
DEBT SERVICE FUND
BUDGETARY COMPARISON SCHEDULE
FOR THE FISCAL YEARS ENDED JUNE 30, 2013 AND 2012
JUNE 30, 2013 VARIANCE JUNE 30, 2012 VARIANCE
ORIGINAL BUDGET FINAL FAVORABLE ORIGINAL BUDGET FINAL FAVORABLE
BUDGET TRANSFERS BUDGET ACTUAL :tJNFAVORABLE BUDGET TRANSFERS BUDGET ACTUAL :urrFAVORABLE:
Revenues:
Local Sources: Local Tax Levy $ 3,458,801 $ $ 3,458,801 $ 3,458,801 $ $ 3,348,072 $ $ 3,348,072 $ 3,348,072 $
Total Revenues 3,458,801 3,458,801 3,458,801 3,348,072 3,348,072 3,348,072
Expenditures:
Regular Debt Service:
Interest 1,256,288 1,256,288 1,246,288 10,000 1,334,150 1,334,150 1,324,450 9,700
Redemption of Principal 2,205,000 2,205,000 2,195,000 10,000 2,045,000 2,045,000 2,045,000
Total Expenditures 3,461,288 3,461,288 3,441,288 20,000 3,379,150 3,379,150 3,369,450 9,700 ---l 0;
Excess/(DcficicllCY) of Revenues Over! (Under) Expenditures (2,487) (2,487) 17,513 20,000 (31,078) (31,078) (21,378) 9,700
Other Financing Sources/(Uses):
Operating Transfers In 55 55 215 215
Total Other Financing Sources/(Uses) 55 55 215 215
Excess/(Deficiency) of Revenues & Other
Financing Sources Ovcr/(Under)
Expenditures & Other Financing Use~ (2,487) (2,487) 17,568 20,055 (31,078) (31,078) (21,163) 9,915
Fund Balances July 1,2011 12,402 12,402 12,402 33,565 33,565 33,565
FlmdBalances June 30, 2012 $ 9,915 $ $ 9,915 $ 29,970 $ 20,055 $ 2,487 $ $ 2,487 $ 12,402 $ 9,915
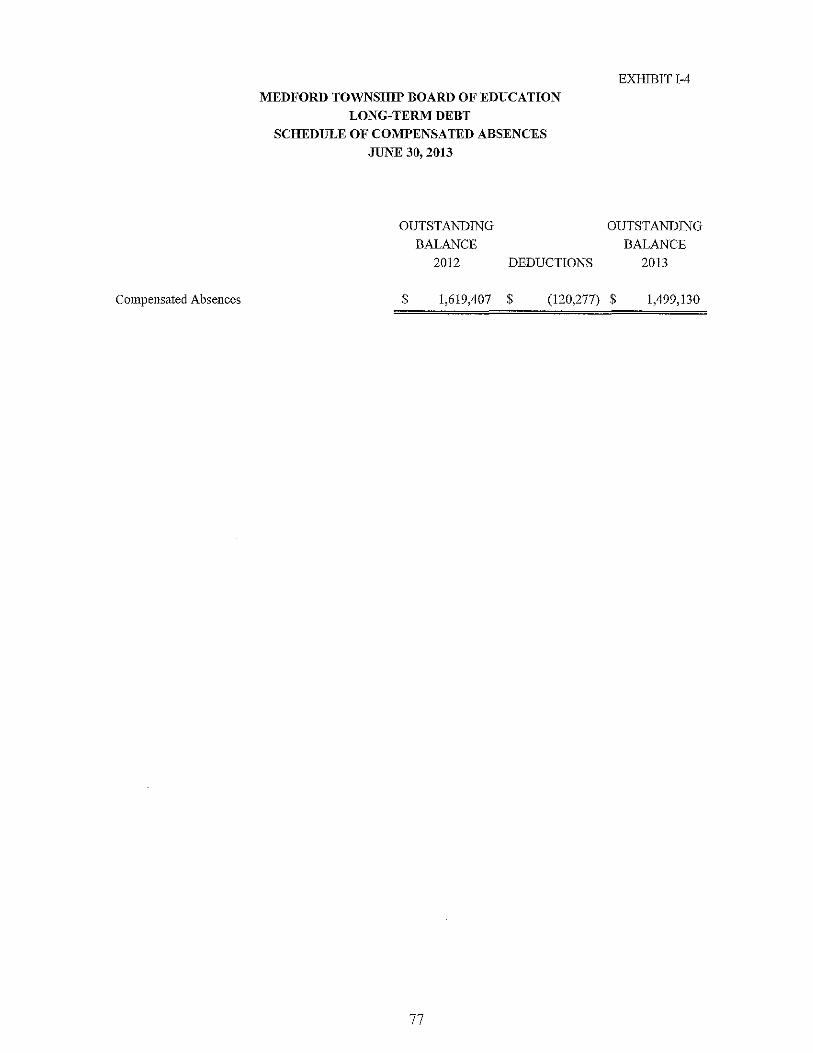
Compensated Absences
MEDFORD TOWNSHIP BOARD OF EDUCATION LONG-TERM DEBT
SCHEDULE OF COMPENSATED ABSENCES
JUNE 30, 2013
OUTSTANDING
BALANCE
2012 DEDUCTIONS
EXHIBIT 1-4
OUTSTANDING
BALANCE
2013
$ 1,619,407 $ (120,277) $ 1,499,130
77
STATISTICAL SECTION (Unaudited)

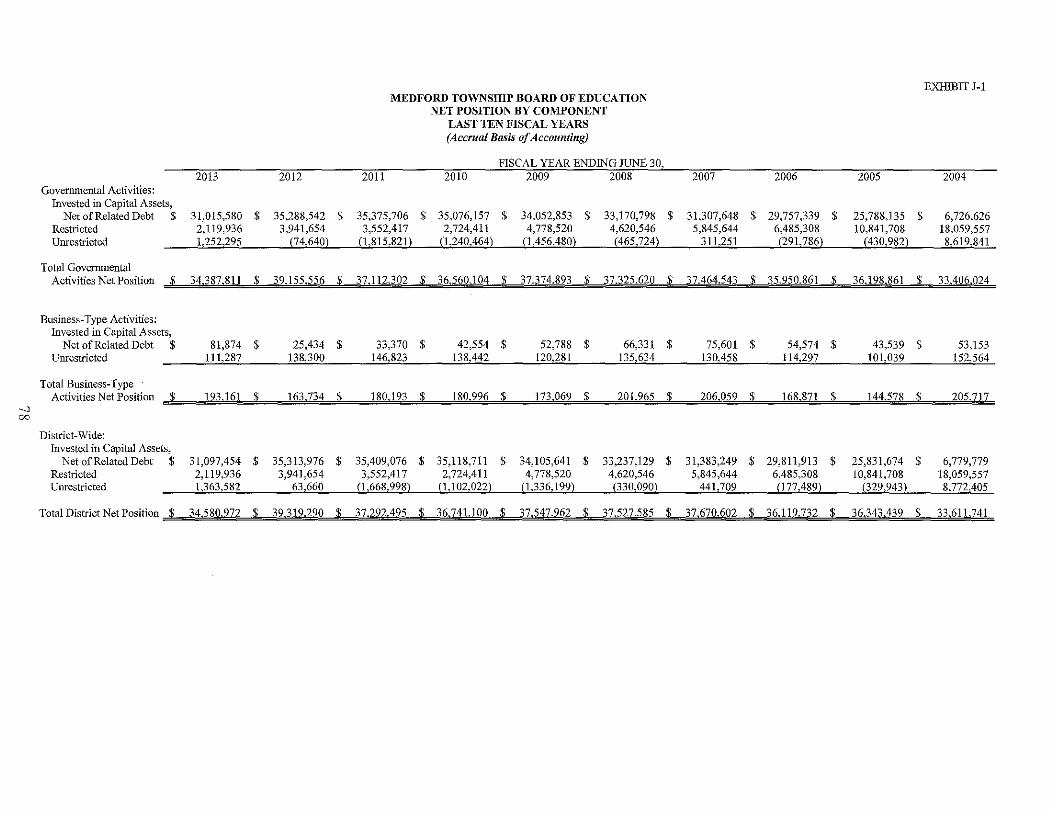
--.] DO
2013 2012 2011 Govenullental Activities:
Invested in Capital Assets,
MEDFORD TOWNSlliP BOARD OF EDUCATION NET POSITION BY COMPONENT
LAST TEN FISCAL YEARS (Accrual Basis of Accounting)
FISCAL YEAR ENDING JUNE 30, 2010 2009 2008
EXIllBIT I-I
2007 2006 Z005 2004
Net of Related Debt $ 31,015,580 $ 35,288,542 $ 35,375,706 $ 35,076,157 $ 34,052,853 $ 33,170,798 $ 31,307,648 $ 29,757,339 $ 25,788,135 $ 6,726,626 Restricted 2,119,936 3,941,654 3,552,417 2,724,41I 4,778,520 4,620,546 5,845,644 6,485,308 10,841,708 18,059,557 Unrestricted 1,252,295 (74,640) (1,815.821) (1,240,464) (1.456,480) (465,724) 311,251 (291,786) (430,982) 8,619,841
Total Governmental Activities Net Position $ 34387.81! $ 39155,556 $ 37.112,302 $ 36,560104 $ 37.374.893 $ 37.325.620 $ 37.464,543 $ 35,950.861 $ 36.198.861 $ 33.406024
Business~ Type Activities: Invested in Capital Assets,
Net of Related Debt $ Unrestricted
Total Business-Type
81,874 $ 25,434 $ 33,370 $ 42,554 $ 52,788 $ 66,331 $ 75,601 $ 54,574 $ 43,539 $ 53,153 111,287 138,300 146,823 138,"<12 120,2JII 135,634 _ 130,458 114,297 101,039 152,564
Activities Net Position $ 193,161 $ 163.734 $ 180,193 $ 180996 $ 173,069 $ 201965 $ 206059 $ 168,871 $ 144.578 $ 205.717
District-Wide: Invested in Capital Assets,
Net of Related Debt $ 31,097,454 $ 35,313,976 $ 35,409,076 $ 35,118,711 $ 34,105,641 $ 33,237,129 $ 31,383,249 $ 29,81!,913 $ 25,831,674 $ 6,779,779 Restricted 2,119,936 3,941,654 3,552,417 2,724,41! 4,778,520 4,620,546 5,845,644 6,485,308 10,841,708 18,059,557 Unrestricted 1,363,582 63,660 (1,668,998) (1,102,022) (1,336,199) (330,090) 441,709 (177,489) (329,943) 8,772,405
TotalDistrictNelPosition $ 34.580,972 $ 39.319,290 $ 37.292.495 $ 36.741,100 $ 37,547962 $ 37,527,585 $ 37,670,602 $ 36.119.732 $ 36.343,439 $ 33.611,741
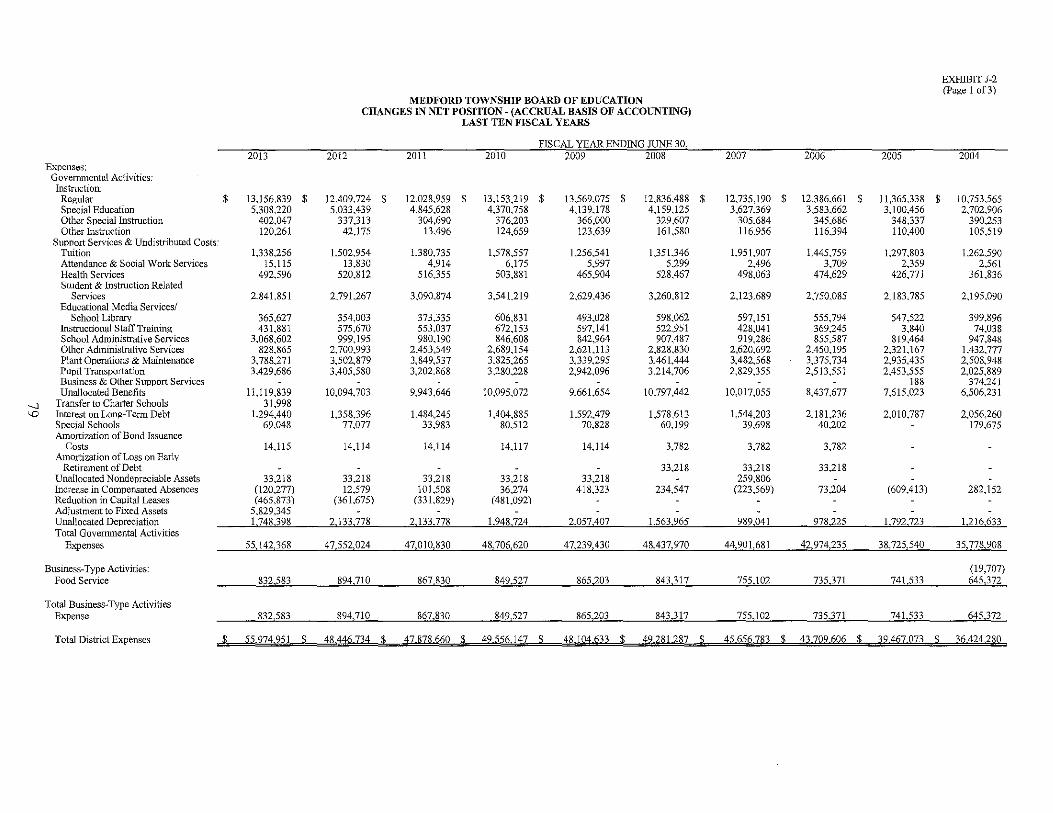
Expenses: Governmental Activities: Instruction:
Regular $ Special Education Other Special Instruction Other Instruction
SUPPort Services & Undistributed Costs: Tuition Attendance & Social Work Services Health Services Student & Instruction Related
Services Educational Media Services/
School Library Instructional Staff Training School Administrative Services Other Administrative Services Plant Operations & Maintenance Pupil Transportation Business & Other Support Services Unallocated Benefits
-...l Transfer to Charter Schools '-.D Interest on Long-Term Debt
Special Schools Amortization of Bond Issuance
Co,,", Amortization of Loss on Early
Retirement of Debt Unallocated Nondepreciable Assets Increase in Compensated Absences Reduction in Capital Leases Adjustment to Fixed Assets Unallocated Depreciation Total Governmental Activities
Expenses
Business-Type Activities: Food Service
Total Business-Type Activities Expense
EXIDBIT 1-2 (page 1 of3)
MEm'ORD TOWNSIllP BOARD OF EDUcATION CHANGES IN NET POSITION - (ACCRUAL BASIS OF ACCOUNTING)
LAST TEN FISCAL YEARS
FISCAL YEAR ENDING JUNE 30, 2013 -iOI2 2011 2010 2009 2008 2007 2006 2005 2004
13.156,839 $ 12,409.724 $ 12.028.959 $ 13.153.219 $ 13.569.075 $ 12.836,488 $ 12.735.190 $ 12.386.661 $ 11.365.338 $ 10.753.565 5.308.220 5.033.439 4.845.628 4.370.758 4.139.178 4.159.125 3.627.369 3.583.662 3,100,456 2.702.906
402.047 337.313 304.690 376.203 366.000 329.607 305,684 345.686 348.337 390.253 120.261 42.175 13,496 124.659 123.639 161.580 116.956 116.394 110,400 105.519
1.338.256 1.502.954 1.380.735 1.578.557 1.256.541 1,351,346 1,951,907 1,445.759 1,297,803 1.262.590 15.115 13.830 4.914 6.175 5.997 5.299 2.496 3.709 2.359 2.561
492,596 520.812 516.355 503.881 465.904 528,467 498.063 474.629 426.771 361.836
2.841.851 2,791.267 3.090.874 3.54U19 2.629,436 3.260.812 2.123.689 2.750.085 2.183.785 2.195.090
365.627 354.003 373.335 606.831 493.028 598.062 597)51 555.794 547.522 399.896 431.881 575.670 553,037 672.153 597.141 522.951 428.041 369.245 3.840 74.038
3.068.602 999.195 980.190 846.608 842.964 907,487 919.286 855.587 819,464 947,848 828.865 2.700.993 2,453,549 2.689.154 2,621,113 2,828,830 2,620,692 2,450.195 2.321.167 1,432.777
3.788.271 3.502.879 3.849.537 3.825.265 3.339.295 3,461.444 3.482.568 3.375.734 2.935,435 2.508.948 3.429.686 3.405.580 3.202.868 3.280.228 2.942.096 3.214.706 2.829.355 2.513.551 2.453.555 2.025.889
188 374,241 11.1 19.839 10.094.703 9.943.646 10.095.072 9.661.654 10.797.442 10.017.055 8.437.677 7.615.023 6.506.231
31.998 1.294.440 1.358.396 1.484.245 1.404.885 1.592.479 1.578.613 1.544.203 2.181.236 2.010.787 2.056.260
69.048 77.077 33.983 80.512 70.828 60.199 39.698 40.202 179.675
14.115 14,114 14,114 14,117 14.114 3.782 3.782 3.782
33.218 33.218 33.218 33.218 33.218 33.218 33.218 33.218 259.806
(120.277) 12.579 101.508 36.274 418.323 234.547 (223.569) 73.204 (609.413) 282.152 (465.873) (361.675) (331.829) (481.092)
5.829.345 1,748 398 2133,778 2 133.778 1948724 2.057,407 1,563965 989,041 978225 1792 723 1216633
55.142.368 47.552.024 47.010.830 48.706.620 47.239.430 48.437,970 44,901.681 -±2,974,235 38.725,5~ 35,77JL908
(19,707) 832.583 894.710 867.830 849.527 865.203 843.317 755.102 735.371 741.533 645.372
832.583 894.710 867.830 849.527 865.203 843.317 755.102 735.371 741.533 645.372
Total District Expenses $ 55974951 $ 48446734 $ 47878660 $ 49556147 $ 48 104,633 $ 49281287 $ 45656783 $ 43709606 $ 39467073 $ 36424280
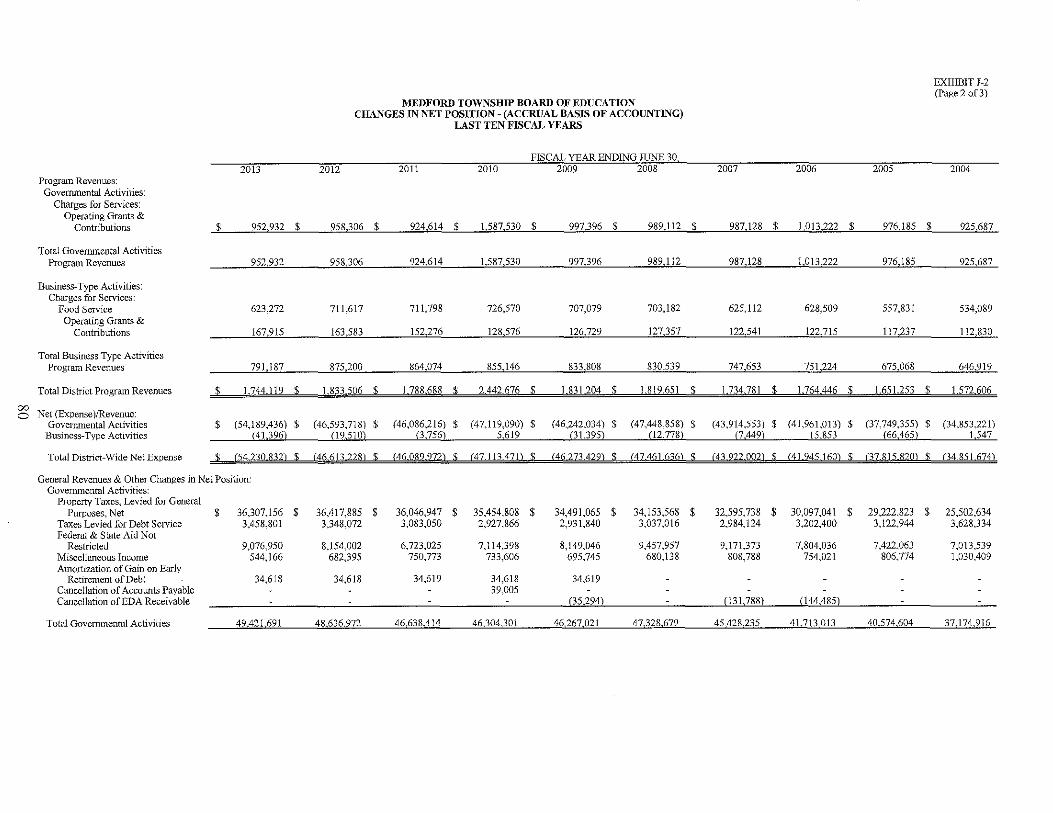
Program Revenues: Governmental Activities:
Charges for Services: Operating Grants &
Contributions
T ota! Governmental Activities Program Revenues
Business-Type Activities: Charges for Services:
Food Service Operating Grants &
Contributions
Total Business Type Activities Program Revenues
Total District Program Revenues
gg Net (Expense )lRevenue: Govel11mental Activities
Business-Type Activities
Total District~Wide Net Expense
$
2013 2012
MEDFORD TOWNSHiP BOARD OF EDUCATION CHANGES IN NET POSITION - (ACCRUAL BASIS OF ACCOUNTING)
LAST TEN FISCAL YEARS
FISCAL YEAR ENDING JUNE 30, 2011 2010 2009 2008 2007 2006 2005
EXHIBIT J-2 (Page 2 of3)
2004
952,932 $ 958,306 $ 924,614 $ 1,587,530 $ 997,396 $ 989,11:L $ 987,128 $ 1,013,222 $ 976,185 $ 925,687
952,932 958,306 924,614 1,587,530 _ 997,396 989,112 987,128 1,013,222 976,185_ 925,687
623,272 711,617 711,798 726,570 707,079 703,182 625,112 628,509 557,831 534,089
167,915 163,583 152,276 128,576 126,729 127357 122,541 122,715 117,237 112,830
791,187 875,200 864,074 855,146 833,808 83,Q,53L 747,653 751,224 675,068 646,919
$ 1744,119 $ 1833506 $ 1788688 $ 2442676 $ 1831204 $ 1819651 $ 1734781 $ 1764446 $ 1651253 $ 1572606
$ (54,189,436) $ (46,593,718) $ (46,086,216) $ (47,119,090) $ (46,242,034) $ (47,448,858) $ (43,914,553) $ (41,961,013) $ (37,749,355) $ (34,853,221) (41,396) (19,510) (3756) 5619 (31395) (12778) (7449) 15853 (66,465) 1 547
$ (54230832) $ (46613228) $ (46089972) $ (47.113471) $ (46273.429) $ (47461636) $ (43922002) $ (41945160) $ (7815820) $ (4851674)
General Revenues & Other Changes in Net Position: Governmental Activities:
Property Taxes, Levied for General Purposes, Net
Taxes Levied for Debt Service Federal & State Aid Not
Restricted Miscellaneous Income Amortization of Gain on Early
Retirement of Debt Cancellation of Accounts Payable Cancellation of ED A Receivable
Total Governmental Activities
$ 36,307,156 3,458,801
9,076,950 544,166
34,618
$ 36,417,885 3,348,072
8,154,002 682,395
34,618
$ 36,046,947 3,083,050
6,723,025 750,773
34,619
$ 35,454,808 $ 34,491,065 $ 2,927,866 2,931,840
7,114,398 8,149,046 733,606 695,745
34,618 34,619 39,005
(35,294)
34,153,568 $ 32,595,738 $ 30,097,04\ $ 29,222,823 $ 25,502,634 3,037,016 2,984,124 3,202,400 3,122,944 3,628,334
9,457,957 9,171,373 7,804,036 7,422,063 7,013,539 680,138 808,788 754,021 806,774 1,030,409
(131,788) (144,485)
49421 691 48,636972 46638,414 46,304301 46267021 47,328,679 45428,235 41 713 013 40574604 37,174,916
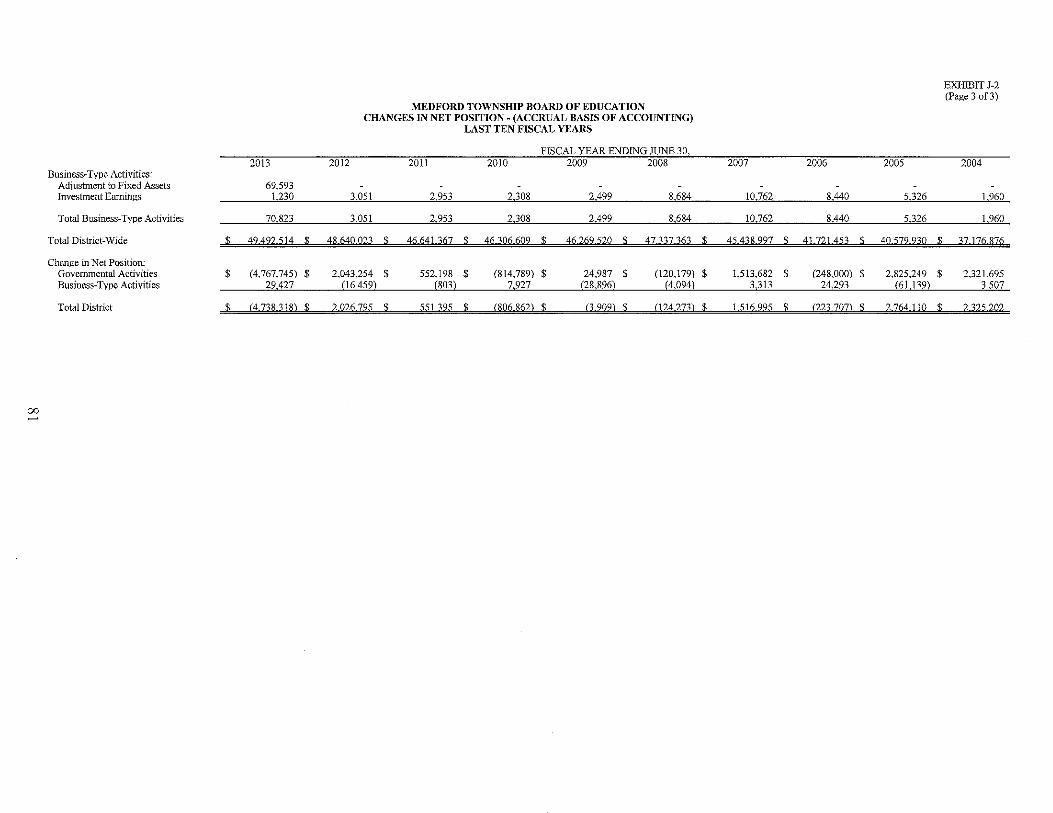
00 ~
Business~Type Activities: Adjustment to Fixed Assets Investment Earnings
Total Busjness~Type Activities
Total District~Wide
Change in Net Position: Governmental Activities Business~Type Activities
Total District
2013 2012
69,593
MEDFORD TOWNSIllP BOARD OF EDUCATION CHANGES IN NET POSITION - (ACCRUAL BASIS OF ACCOUNTING)
LAST TEN FISCAL YEARS
FISCAL YEAR ENDING JUNE 30, 2011 2010 2009 2008 2007 2006 2005
EXHIBIT J-2 (Page 3 of3)
2004
1,230 3,051 2,953 2,308 2,499 8,684 10,762 8,440 5,326 1,960
70,823 3,051 2,953 2,308 2,499 8,684 10,762 8,440 5,326 1,960
$ 49492514 $ 48640023 $ 46641367 $ 46306609 $ 46269520 $ 47337363 $ 45438997 $ 41721453 $ 40579930 $ 37176876
$ (4,767,745) $ 2,043,254 $ 552,198 $ (814,789) $ 24,987 $ (120,179) $ 1,513,682 $ (248,000) $ 2,825,249 $ 2,321,695 29,427 (16,459) (803) 7,927 (28,896) (4,094) 3,313 24,293 (61,]39) 3,507
$ (4738318) $ 2026795 $ 551395 $ (806862) $ (3909) $ (124273) $ 1516995 $ (223707) $ 2764110 $ 2325202
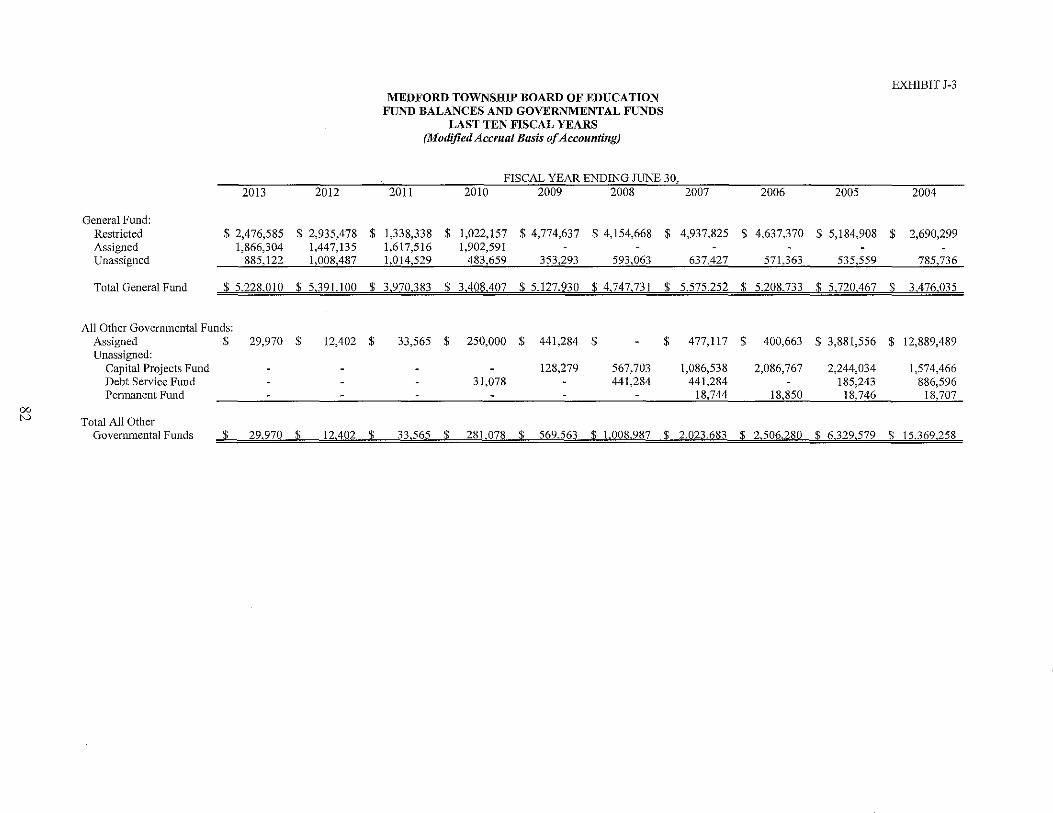
00 tv
General Fund: Restricted Assigned Unassigned
Total General Fund
2013
$ 2,476,585 1,866,304
885,122
2012
MEDFORD TOWNSHIP BOARD OF EDUCATION FUND BALANCES AND GOVERNMENTAL FUNDS
LAST TEN FISCAL YEARS (Modified Accrual Basis of Accounting)
FISCAL YEAR ENDING JUNE 30, 2011 2010 2009 2008 2007
EXHIBIT J-3
2006 2005 2004
$ 2,935,478 $ 1,338,338 $ 1,022,157 $ 4,774,637 $ 4,154,668 $ 4,937,825 $ 4,637,370 $ 5,184,908 $ 2,690,299 1,447,135 1,617,516 1,902,591 1,008,487 1,014,529 483,659 353,293 593,063 637,427 571,363 535,559 785,736
$ 5,228,010 $ 5,391J00 $ 3,970,383 $ 3,408,407 $ 5127,930 $ 4,747,731 $ 5,575,252 $ 5,208733 $ 5,720,467 $ 3476,035
All Other Governmental Funds: Assigned Unassigned:
Capital Projects Fund Debt Service Fund Permanent Fund
Total All Other Governmental Funds
$ 29,970 $ 12,402 $ 33,565 $ 250,000 $ 441,284 $ $ 477,117 $ 400,663 $ 3,881,556 $ 12,889,489
128,279 567,703 1,086,538 2,086,767 2,244,034 1,574,466 31,078 441,284 441,284 185,243 886,596
18,744 18,850 18,746_ 18,707
$ 29,970 $ 12,402 $ 33,565 $ 281,078 $ 569563 $ 1,008987 $ 2,023,683 $ 2,506,280 $ 6329,579 $ 15.369,258
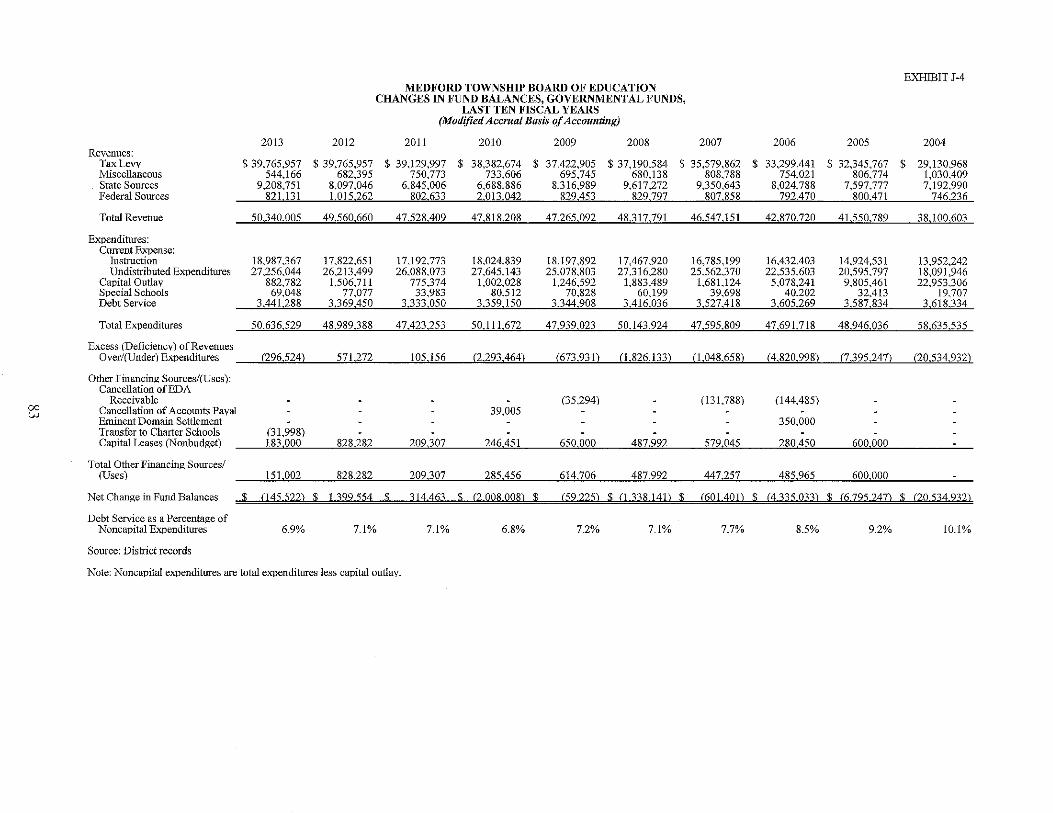
00 w
Revenues: TaxLevv Miscellaneous State Sources Federal Sources
Total Revenue
ExPenditures: Current ExPense:
Instruction Undistributed ExPenditures
Capital Outlay Special Schools Debt Service
Total ExPenditures
Excess (Deficiency) of Revenues Over/(Under) ExPenditures
Other Financing Sources/(Dscs): Cancellation of ED A
Receivable Cancellation of Accounts Payal Eminent Domain Settlement Transfer to Charter Schools Capital Leases (Nonbudget)
Total Other Financing Sources/
2013 2012
MEDFORD TOWNSHIP BOARD OF EDUCATION CHANGES IN FUND BALANCES, GOVERl"lMENTAL FUNDS,
LAST TEN FISCAL YEARS (Mod?{ied Acc1'Uai Basis of Accounting)
2011 2010 2009 2008
EXHIBIT J-4
2007 2006 2005 2004
$ 39_765_957 $ 39_765,957 $ 39,129,997 $ 38,382,674 $ 37,422,905 $ 37,190,584 $ 35,579,862 $ 33,299,441 $ 32,345,767 $ 29,130,968 544,166 682,395 750,773 733,606 695,745 680,138 808,788 754,021 806,774 1,030,409
9,208,751 8,097,046 6,845,006 6,688,886 8,316,989 9,617,272 9,350,643 8,024,788 7,597,777 7,192,990 8211311015262 802,63320]3,042 829,453 829797 807,858 792470 800471 746236
50340,005 49560,660 47528409 47818208 47265092 48317,791 46547151 42870720 41550,789 38,100,603
18,987.367 17,822,651 17,192,773 18,024,839 18,197,892 17,467,920 16,785,199 16,432,403 14,924,531 13,952,242 27,256,044 26,213,499 26,088,073 27,645,143 25,078,803 27,316,280 25,562,370 22,535,603 20,595,797 18,091,946
882,782 1,506,711 775,374 1,002,028 1,246,592 1,883,489 1,681,124 5,078,241 9,805,461 22,953,306 69,048 77,077 33,983 80,512 70,828 60,199 39,698 40,202 32,413 19,707
3.441288 3.369450 3333,050 3,359150 3,344908 3416036 3527418 3605269 3.587,834 3,618,334
50636529 48989388 47423253 50111672 47939023 50,143924 47595809 47691718 48946,036 58,635,535
(296,524) 571,272 105,156 (2,293,464) (673,931) (1,826,133) (1,048,658) (4,820,998) (7.395,247) (20,534,932)
(35,294) 39,005
(31,998)
(131,788) (144,485)
350,000
183,000 828.282 209,307 246.451 650,000 487,992 579,045 280.450 600,000
(Uses) 151,002 828,282 209,307 285,456 614,706 487,992 447,257 485,965 600,000
Net Change in Fund Balances $ (] 45 522) $ J 399 554 $ 314463 $ (2 00& 00&) $ (59225) $ (] 33& 14]) $ (601 40]) $ (4 335 Q33) $ (6795 24]) $ (20 534 932)
Debt Service as a Percentage of Noncapital Expenditures
Source: District records
6.9% 7.1%
Note: Noncapital exPenditures are total exPenditures less capital outlay.
7.1% 6.8% 7.2% 7.1% 7.7% 8.5% 9.2% 10.1%
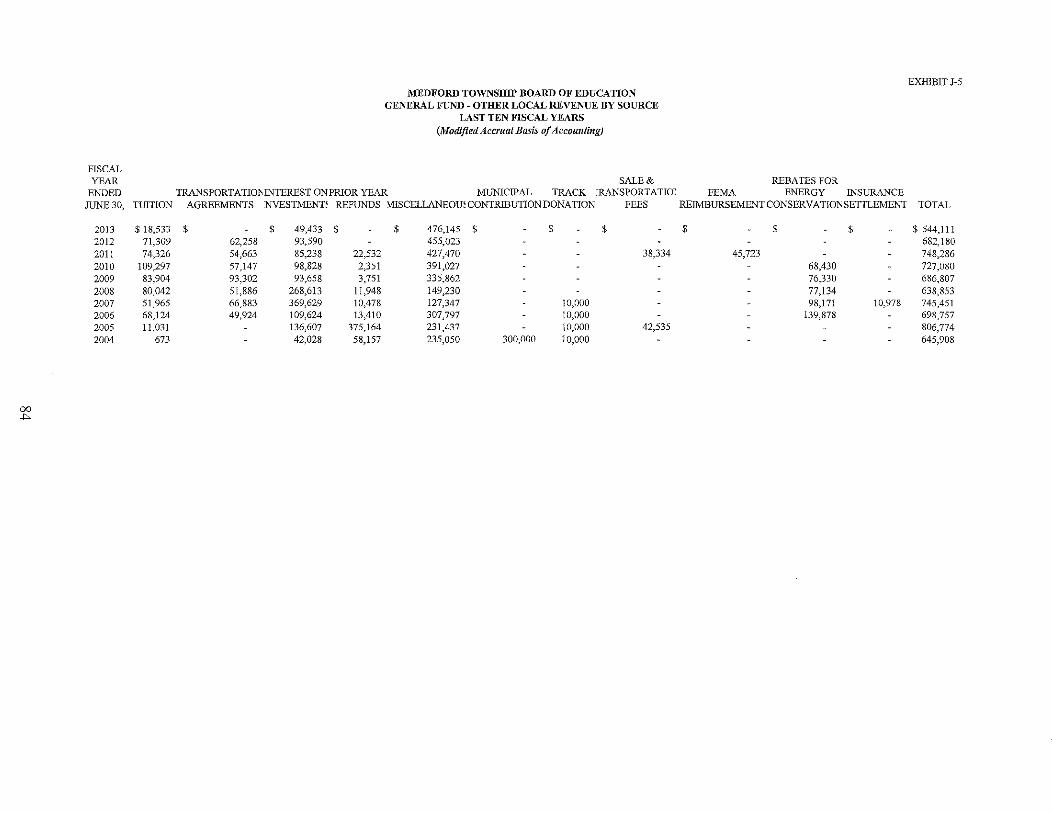
00 -""
FISCAL YEAR
MEDFORD TOWNSHIP BOARD OF EDUCATION GENERALFUND~OTHERLOCALREVENUEBYSOURCE
LAST TEN FISCAL YEARS (Modified Accrual Basis of Accounting)
SALE & REBATES FOR ENDED TRANSPORTATIO:r-.INTEREST ON PRIOR YEAR MUNICIPAL TRACK ~RANSPORTATIOl FEMA ENERGY INSURANCE
JUNE 30, TUITION AGREEMENTS NVESTMENT~ REFUNDS \1ISCELLANEOmCONTRIBUTIONDONATION FEES RElMBURSEMENT CONSERV A TI01\ SETTLEMENT
$ 18,533 $ $ 49,433 $ $ 476,145 $ $ $ $ $ $ 71,309 62,258 93,590 455,023 74,326 54,663 85,238 22,532 427,470 38,334 45,723
109,297 57,147 98,828 2,351 391,027 83,904 93,302 93,658 3,751 335,862 80,042 51,886 268,613 11,948 149,230
EXIllBIT J~5
TOTAL
$ 544,111 682,180 748,286 727,080 686,807 638,853
2013 2012 2011 2010 2009 2008 2007 2006 2005 2004
51,965 66,883 369,629 10,478 127,347 10,000
68,430 76,330 77,134 98,171
139,878 10,978 745,451
68,124 49,924 109,624 13,410 11,031 136,607 375,164
673 42,028 58,157
307,797 231,437 235,050 300,000
10,000 10,000 10,000
42,535 698,757 806,774 645,908
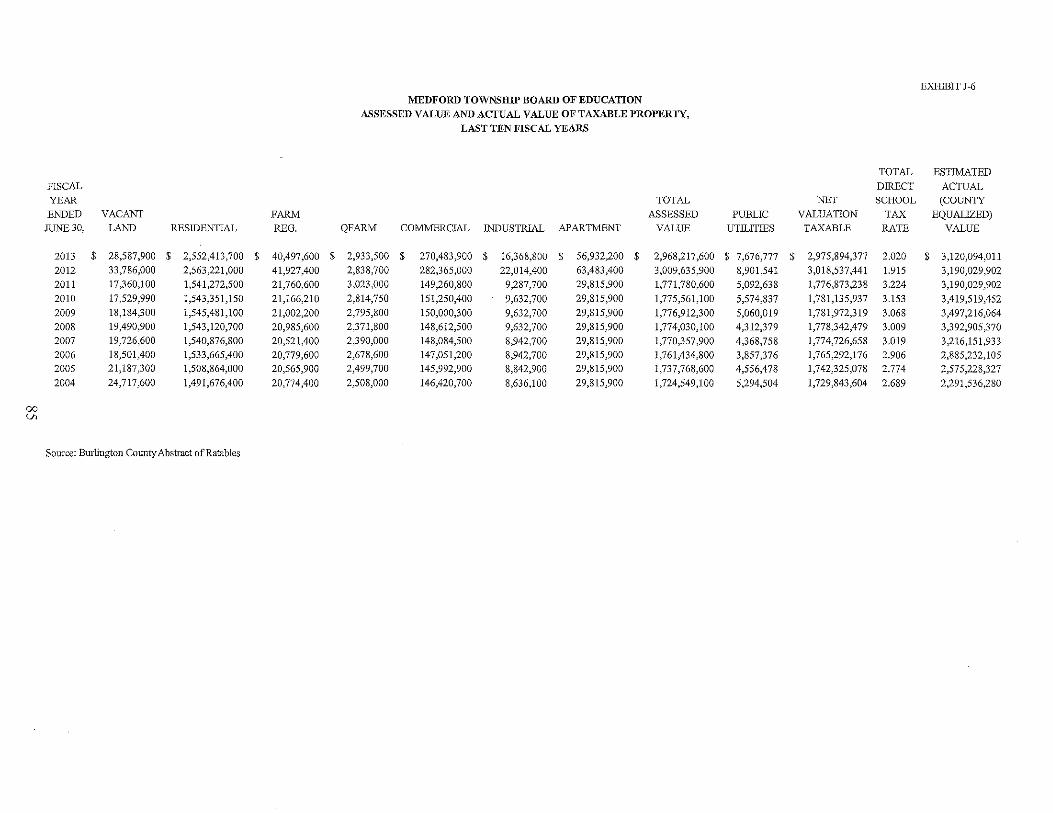
FISCAL
YEAR ENDED VACANT FARM
JUNE 30, LAND RESIDENTIAL REG,
2013 $ 28,587,900 $ 2,552,413,700 $ 40,497,600 $
2012 33,786,000 2,563,221,000 41,927,400
2011 17,360,100 1,541,272,500 21,760,600
2010 17,529,990 1,543,351,150 21,166,210
2009 18,184,300 1,545,481,100 21,002,200
2008 19,490,900 1,543,120,700 20,985,600
2007 19,726,600 1,540,876,800 20,521,400
2006 18,501,400 1,533,665,400 20,779,600
2005 21,187,300 1,508,864,000 20,565,900
2004 24,717,600 1,491,676,400 20,774,400
00 u.
Source: Burlington County Abstract ofRatables
MEDFORD TOWNSHIP BOARD OF EDUCATION
ASSESSED VALUE AND ACTUAL VALUE OF TAXABLE PROPERTY,
LAST TEN FISCAL YEARS
TOTAL
ASSESSED QFARM COMMERCIAL INDUSTRIAL APARTMENT VALUE
2,933,500 $ 270,483,900 $ 16,368,800 $ 56,932,200 $ 2,968,217,600
2,838,700 282,365,000 22,014,400 63,483,400 3,009,635,900
3,023,000 149,260,800 9,287,700 29,815,900 1,771,780,600
2,814,750 151,250,400 9,632,700 29,815,900 1,775,561,100
2,795,800 150,000,300 9,632,700 29,815,900 1,776,912,300 2,371,800 148,612,500 9,632,700 29,815,900 1,774,030,100
2,390,000 148,084,500 8,942,700 29,815,900 1,770,357,900
2,678,600 147,051,200 8,942,700 29,815,900 1,761,434,800 2,499,700 145,992,900 8,842,900 29,815,900 1,737,768,600
2,508,000 146,420,700 8,636,100 29,815,900 1,724,549,100
EXHIBIT J-6
TOTAL ESTIMATED
DIRECT ACTUAL NET SCHOOL (COUNTY
PUELIC VALUATION TAX EQUALIZED)
UTIlITIES TAXABLE RATE VALUE
$ 7,676,777 $ 2,975,894,377 2,020 $ 3,120,094,011
8,901,541 3,018,537,441 1,915 3,190,029,902
5,092,638 1,776,873,238 3,224 3,190,029,902
5,574,837 1,781,135,937 3,153 3,419,519,452
5,060,019 1,781,972,319 3,068 3,497,216,064
4,312,379 1,778,342,479 3,009 3,392,905,370
4,368,758 1,774,726,658 3,019 3,216,151,933
3,857,376 1,765,292,176 2,906 2,885,232,105
4,556,478 1,742,325,078 2,774 2,575,228,327
5,294,504 1,729,843,604 2,689 2,291,536,280
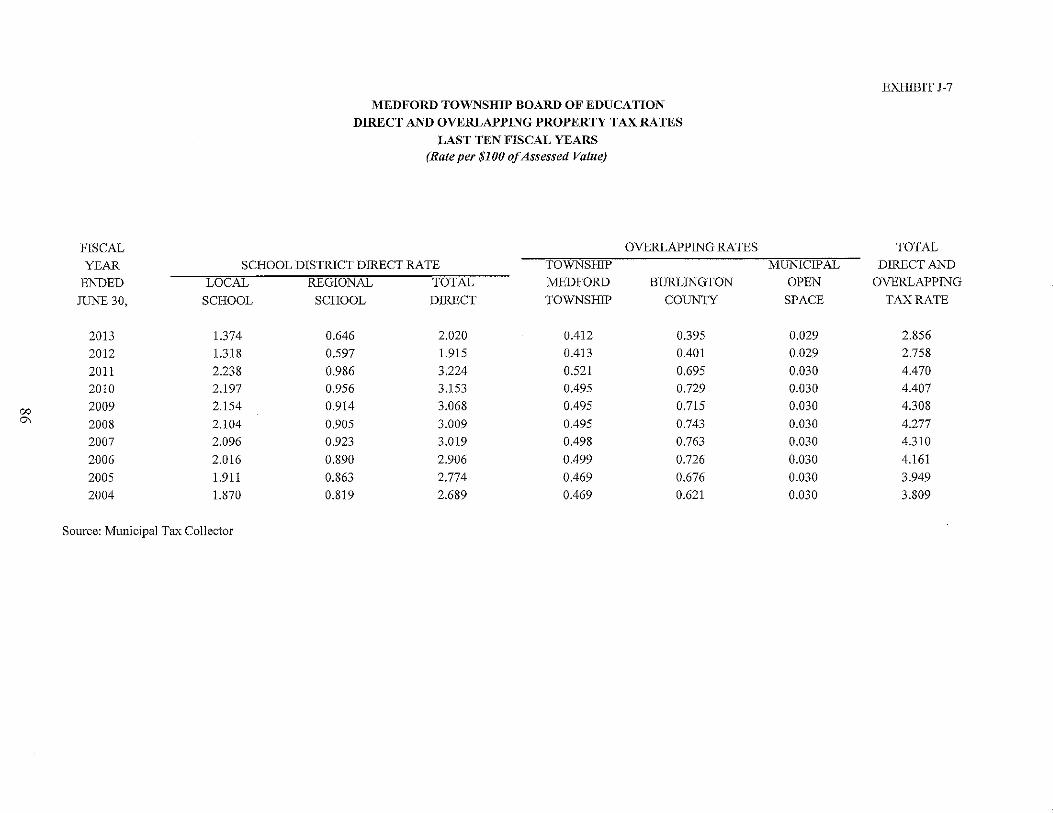
00 0\
FISCAL
MEDFORD TOWNSHIP BOARD OF EDUCATION DIRECT AND OVERLAPPING PROPERTY TAX RATES
LAST TEN FISCAL YEARS (Rate per $100 of Assessed Value)
OVERLAPPING RATES
YEAR SCHOOL DISTRICT DnmCT RATE TOWNSHIP
ENDED LOCAL REGIONAL TOTAL MEDFORD BURLINGTON
JUNE 30, SCHOOL SCHOOL Dll<ECT TOWNSHIP COUNTY
2013 1.374 0.646 2.020 0.412 0.395
2012 1.318 0.597 1.915 0.413 0.401
2011 2.238 0.986 3.224 0.521 0.695
2010 2.197 0.956 3.153 0.495 0.729
2009 2.154 0.914 3.068 0.495 0.715
2008 2.104 0.905 3.009 0.495 0.743
2007 2.096 0.923 3.019 0.498 0.763
2006 2.016 0.890 2.906 0.499 0.726
2005 1.911 0.863 2.774 0.469 0.676
2004 1.870 0.819 2.689 0.469 0.621
Source: Municipal Tax Collector
EXHIBIT J-7
TOTAL MUNICIPAL Dll<ECTAND
OPEN OVERLAPPING
SPACE TAX RATE
0.029 2.856
0.029 2.758
0.030 4.470
0.030 4.407
0.030 4.308
0.030 4.277
0.030 4.310
0.030 4.161
0.030 3.949
0.030 3.809
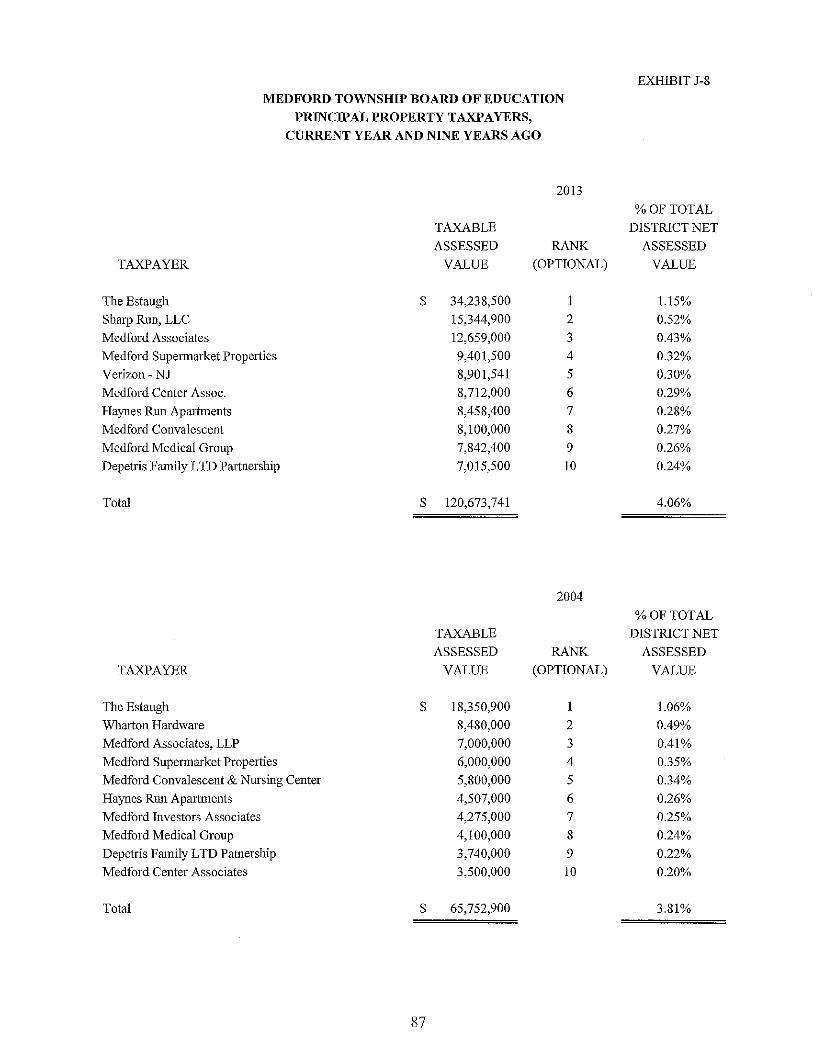
MEDFORD TOWNSHIP BOARD OF EDUCATION PRINCIPAL PROPERTY TAXPAYERS,
CURRENT YEAR AND NINE YEARS AGO
2013
TAXABLE
ASSESSED RANK
TAXPAYER VALUE (OPTIONAL)
The Estaugh $ 34,238,500 1
Sharp Ruu, LLC 15,344,900 2
Medford Associates 12,659,000 3
Medford Supe1market Properties 9,401,500 4
Verizou- NJ 8,901,541 5
Medford Center Assoc. 8,712,000 6
I-laynes Run Apartments 8,458,400 7
Medford Convalescent 8,100,000 8
Medford Medical Group 7,842,400 9
Depetris Family LTD Partnership 7,015,500 10
Total $ 120,673,741
2004
TAXABLE
ASSESSED RANK TAXPAYER VALUE (OPTIONAL)
The Estaugh $ 18,350,900 1
Wharton Hardware 8,480,000 2
Medford Associates, LLP 7,000,000 3
Medford Supennarket Properties 6,000,000 4
Medford Convalescent & Nursing Center 5,800,000 5
Haynes Run Apartments 4,507,000 6
Medford Investors Associates 4,275,000 7
Medford Medical Group 4,100,000 8
Depetris Family LTD Patnership 3,740,000 9
Medford Center Associates 3,500,000 10
Total $ 65,752,900
87
EXHIBIT J-8
%OFTOTAL
DISTRICT NET
ASSESSED
VALUE
1.15%
0.52%
0.43%
0.32%
0.30%
0.29%
0.28%
0.27%
0.26%
0.24%
4.06%
%OFTOTAL
DISTRICT NET
ASSESSED
VALUE
1.06%
0.49%
0.41%
0.35%
0.34%
0.26%
0.25%
0.24%
0.22%
0.20%
3.81%
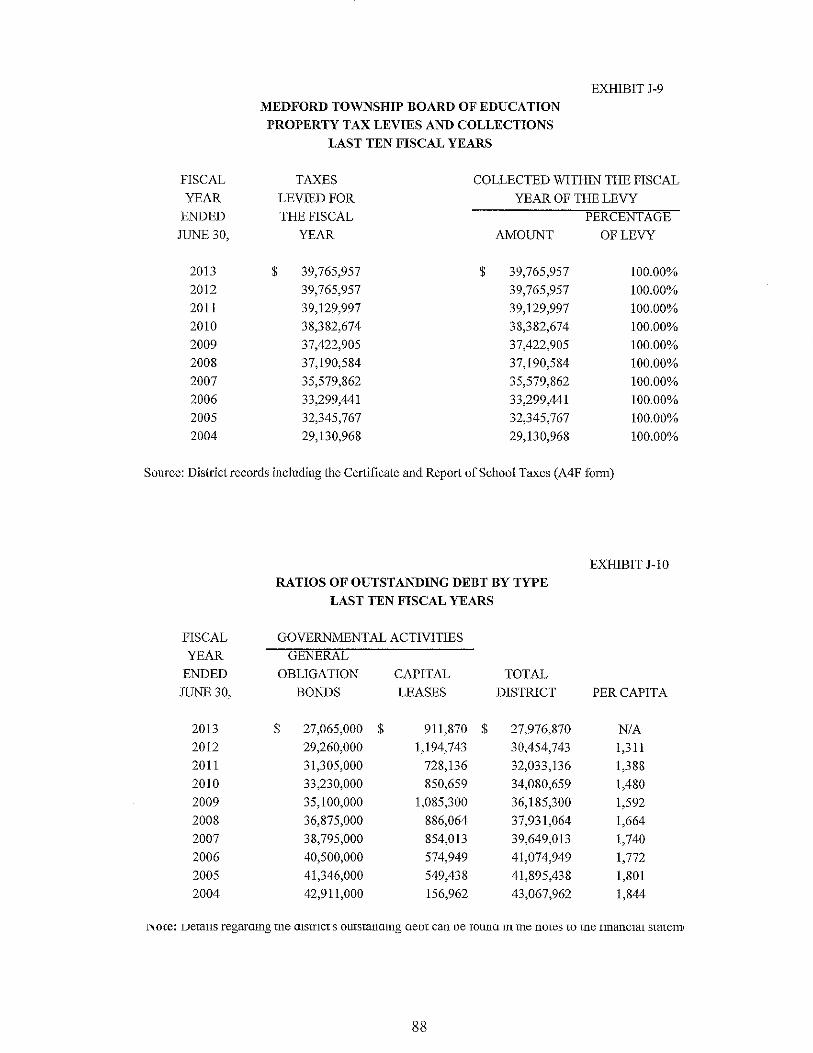
FISCAL
YEAR
ENDED
JUNE 30,
2013
2012
2011
2010
2009
2008
2007
2006
2005
2004
MEDFORD TOWNSHIP BOARD OF EDUCATION
PROPERTY TAX LEVIES AND COLLECTIONS
LAST TEN FISCAL YEARS
EXIllBIT J-9
TAXES COLLECTED WITHIN THE FISCAL
LEVIED FOR YEAR OF THE LEVY
THE FISCAL PERCENTAGE
YEAR AMOUNT OF LEVY
$ 39,765,957 $ 39,765,957 100.00%
39,765,957 39,765,957 100.00%
39,129,997 39,129,997 100.00%
38,382,674 38,382,674 100.00%
37,422,905 37,422,905 100.00%
37,190,584 37,190,584 100.00%
35,579,862 35,579,862 100.00%
33,299,441 33,299,441 100.00%
32,345,767 32,345,767 100.00%
29,130,968 29,130,968 100.00%
Source: District records including the Certificate and Report of School Taxes (A4F fonu)
EXHIBIT J-IO
RATIOS OF OUTSTANDING DEBT BY TYPE
LAST TEN FISCAL YEARS
FISCAL GOVERNMENTAL ACTIVITIES
YEAR GENERAL
ENDED OBLIGATION CAPITAL TOTAL
JUNE 30, BONDS LEASES DISTRICT PER CAPITA
2013 $ 27,065,000 $ 911,870 $ 27,976,870 N/A 2012 29,260,000 1,194,743 30,454,743 1,311
2011 31,305,000 728,136 32,033,136 1,388
2010 33,230,000 850,659 34,080,659 1,480
2009 35,100,000 1,085,300 36,185,300 1,592
2008 36,875,000 886,064 37,931,064 1,664
2007 38,795,000 854,013 39,649,013 1,740
2006 40,500,000 574,949 41,074,949 1,772
2005 41,346,000 549,438 41,895,438 1,801
2004 42,911,000 156,962 43,067,962 1,844
l'1OIe: VeraIIS regaramg me mSlncrs oUIslanamg Gem can oe TOUnG m me nmes TO me rmanClal SIaleITII
88
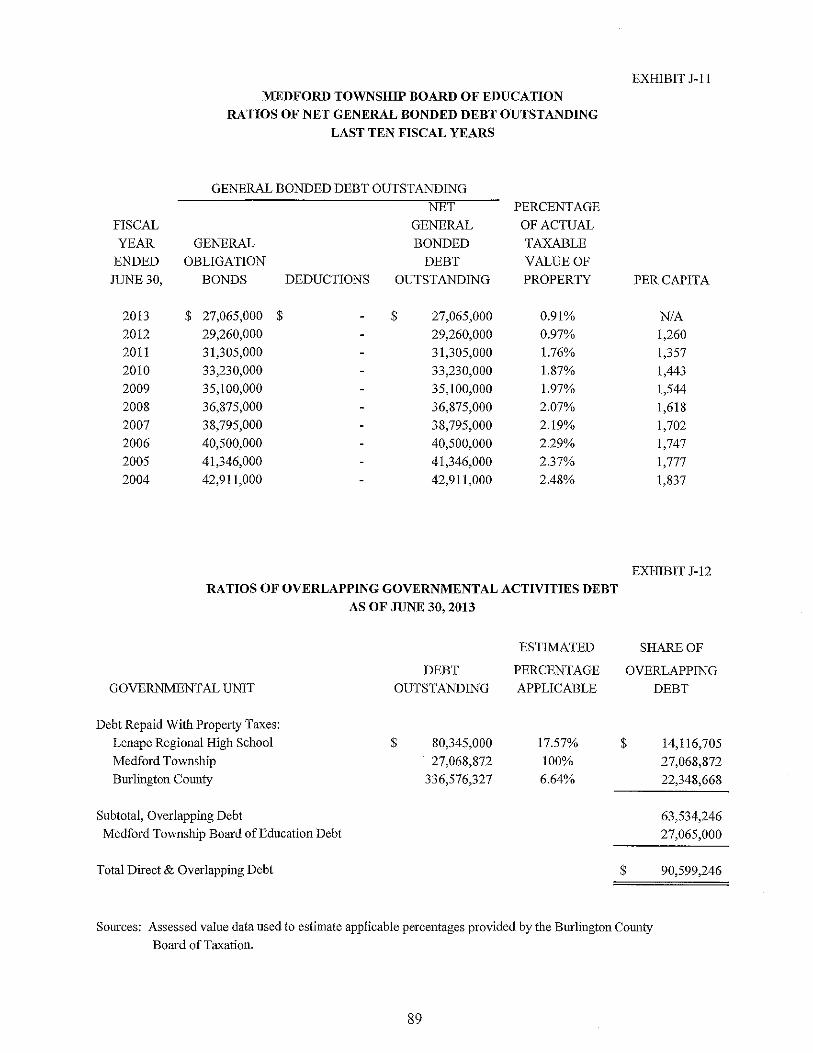
MEDFORD TOWNSHIP BOARD OF EDUCATION
RATIOS OF NET GENERAL BONDED DEBT OUTSTANDING
LAST TEN FISCAL YEARS
GENERAL BONDED DEBT OUTSTANDING
NET PERCENTAGE
FISCAL GENERAL OF ACTUAL
YEAR GENERAL BONDED TAXABLE
ENDED OBLIGATION DEBT VALUE OF
JUNE 30, BONDS DEDUCTIONS OUTSTANDING PROPERTY
2013 $ 27,065,000 $ $ 27,065,000 0.91%
2012 29,260,000 29,260,000 0.97%
2011 31,305,000 31,305,000 1.76%
2010 33,230,000 33,230,000 1.87% 2009 35,100,000 35,100,000 1.97% 2008 36,875,000 36,875,000 2.07%
2007 38,795,000 38,795,000 2.19%
2006 40,500,000 40,500,000 2.29%
2005 41,346,000 41,346,000 2.37% 2004 42,911,000 42,911,000 2.48%
RATIOS OF OVERLAPPING GOVERNMENTAL ACTIVITIES DEBT
AS OF JUNE 30, 2013
GOVERNMENTAL UNIT
Debt Repaid With Property Taxes: Lenape Regional High School
Medford Township
Burlington County
Subtotal, Overlapping Debt Medford Township Board of Education Debt
Total Direct & Overlapping Debt
DEBT OUTSTANDING
$ 80,345,000
27,068,872
336,576,327
ESTIMATED
PERCENTAGE
APPLICABLE
17.57%
100%
6.64%
EXHIBIT J-ll
PER CAPITA
N/A
1,260
1,357
1,443 1,544
1,618
1,702
1,747
1,777
1,837
EXHIBIT J-12
SHARE OF
OVERLAPPING
DEBT
$
$
14,116,705
27,068,872
22,348,668
63,534,246
27,065,000
90,599,246
Sources: Assessed value data used to estimate applicable percentages provided by the Burlington County
Board of Taxation.
89
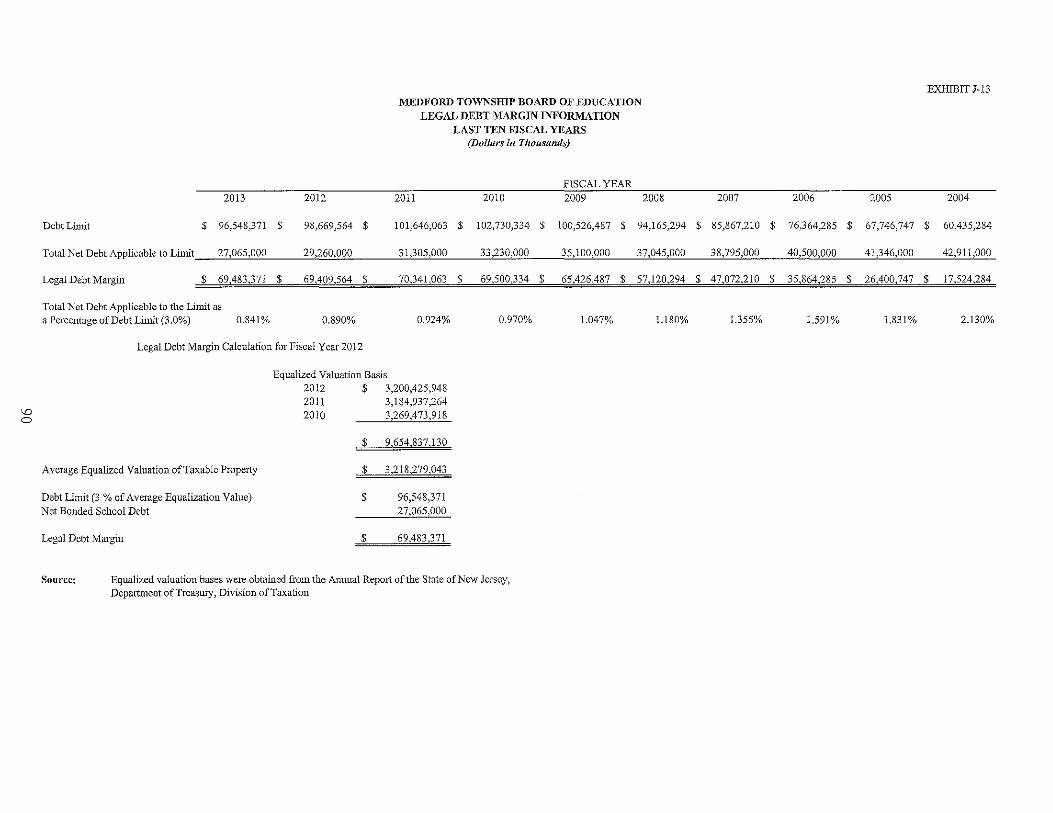
'-D o
2013 2012
MEDFORD TOWNSIDP BOARD OF EDUCATION LEGAL DEBT MARGIN INFORMATION
LAST TEN FISCAL YEARS (Dollars ill Thousands)
FISCAL YEAR 2011 2010 2009 2008
EXHIDIT J-13
2007 2006 2005 2004
Debt Limit $ 96,548,371 $ 98,669,564 $ 101,646,063 $ 102,730,334 $ 100,526,487 $ 94,165,294 $ 85,867,210 $ 76,364,285 $ 67,746,747 $ 60,435,284
Total Net Debt Applicable to Limit 27,065,000 29,260,000 31,305,000 33,230,000 35,100,000 37,045,000 38,795,000 40,500,000 41,346,000 42,911,000
Legal Debt Margin $ 69,483,371 $ 69,409,564 $ 70,341,063 $ 69,500,334 $ 65,426,487 $ 57,120,294 $ 47,072,210 $ 35,864,285 $ 26,400,747 $ 17,524,284
Total Net Debt Applicable to the Limit as a Percentage of Debt Limit (3.0%) 0.841 % 0.890% 0.924%
Legal Debt Margin Calculation for Fiscal Year 2012
Average Equalized Valuation of Taxable Property
Debt Limit (3 % of Average Equalization Value) Net BOJlded School Debt
Legal Debt Margin
Equalized Valuation Basis 2012 $ 3,200,425,948 2011 3,184,937,264 2010 3,269,473,918
$ 9,654,837,130
$ 3,218,279,043
$ 96,548,371 27,065,000
$ 69,483,371
0.970%
Source: Equalized valuation bases were obtained from the Annual RepOlt ofthe State of New Jersey, Depmiment ofTreasmy, Division of Taxation
1.047% 1.180% 1.355% 1.591 % 1.831 % 2.130%
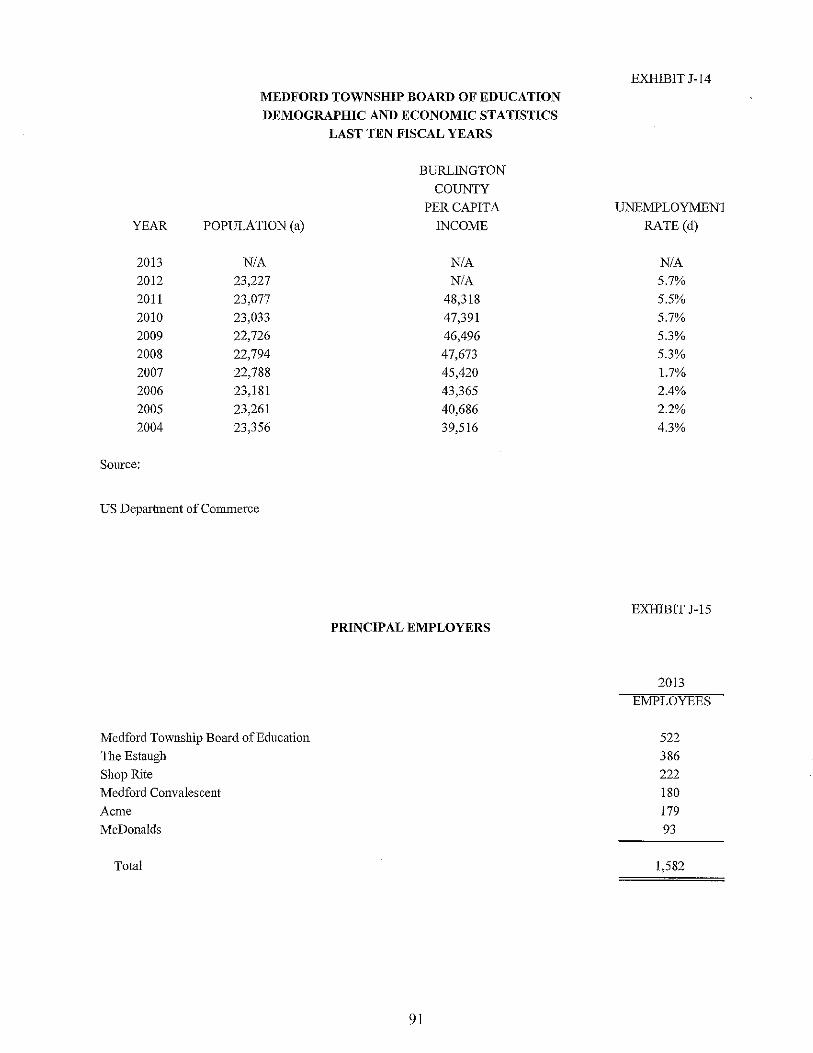
MEDFORD TOWNSHIP BOARD OF EDUCATION DEMOGRAPHIC AND ECONOMIC STATISTICS
LAST TEN FISCAL YEARS
YEAR POPULATION (a)
2013 N/A 2012 23,227
2011 23,077
2010 23,033
2009 22,726
2008 22,794
2007 22,788
2006 23,181
2005 23,261
2004 23,356
Source:
US Department of Commerce
Medford Township Board ofEduc.tion
The Estaugh
Shop Rite
Medford Convalescent
Acme
McDona1ds
Total
BURLINGTON
COUNTY
PER CAPITA
INCOME
NlA
N/A 48,318
47,391
46,496
47,673
45,420
43,365
40,686
39,516
PRINCIPAL EMPLOYERS
91
EXHIBIT J-14
UNEMPLOYMEN1
RATE (d)
N/A 5.7%
5.5%
5.7%
5.3%
5.3%
1.7%
2.4%
2.2%
4.3%
EXHIBIT J-15
2013
EMPLOYEES
522
386
222
180
179 93
1,582
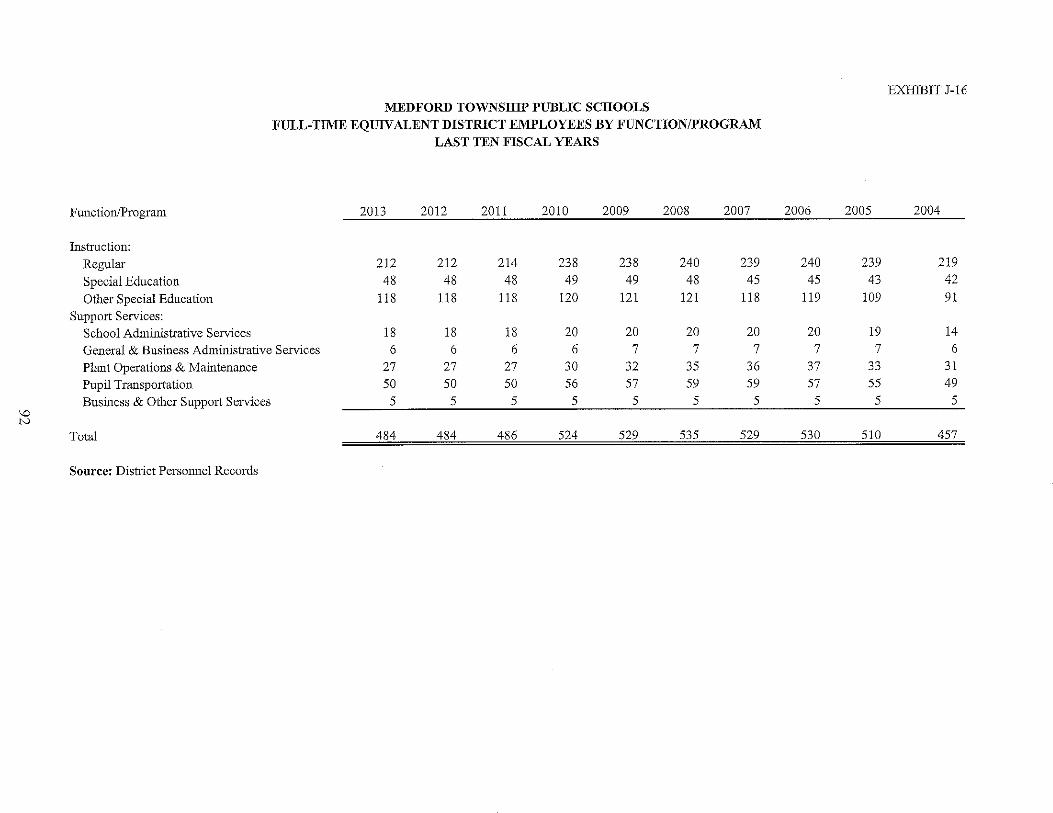
'-0 tv
Function/Program
Instruction: Regular Special Education Other Special Education
Support Services: School Administrative Services
MEDFORD TOWNSHIP PUBLIC SCHOOLS FULL-TIME EQUIVALENT DISTRICT EMPLOYEES BY FUNCTION/PROGRAM
LAST TEN FISCAL YEARS
2013 2012 2011 2010 2009 2008 2007
212 212 214 238 238 240 239 48 48 48 49 49 48 45
118 118 118 120 121 121 118
18 18 18 20 20 20 20 General & Business Administrative Services 6 6 6 6 7 7 7 Plant Operations & Maintenance 27 27 27 30 32 35 36 Pupil Transp0l1ation 50 50 50 56 57 59 59 Business & Other Support Services 5 5 5 5 5 5 5
Total 484 484 486 524 529 535 529
Source: District Personnel Records
EXHIBIT J-16
2006 2005 2004
240 239 219 45 43 42
119 109 91
20 19 14 7 7 6
37 33 31 57 55 49 5 5 5
530 510 457
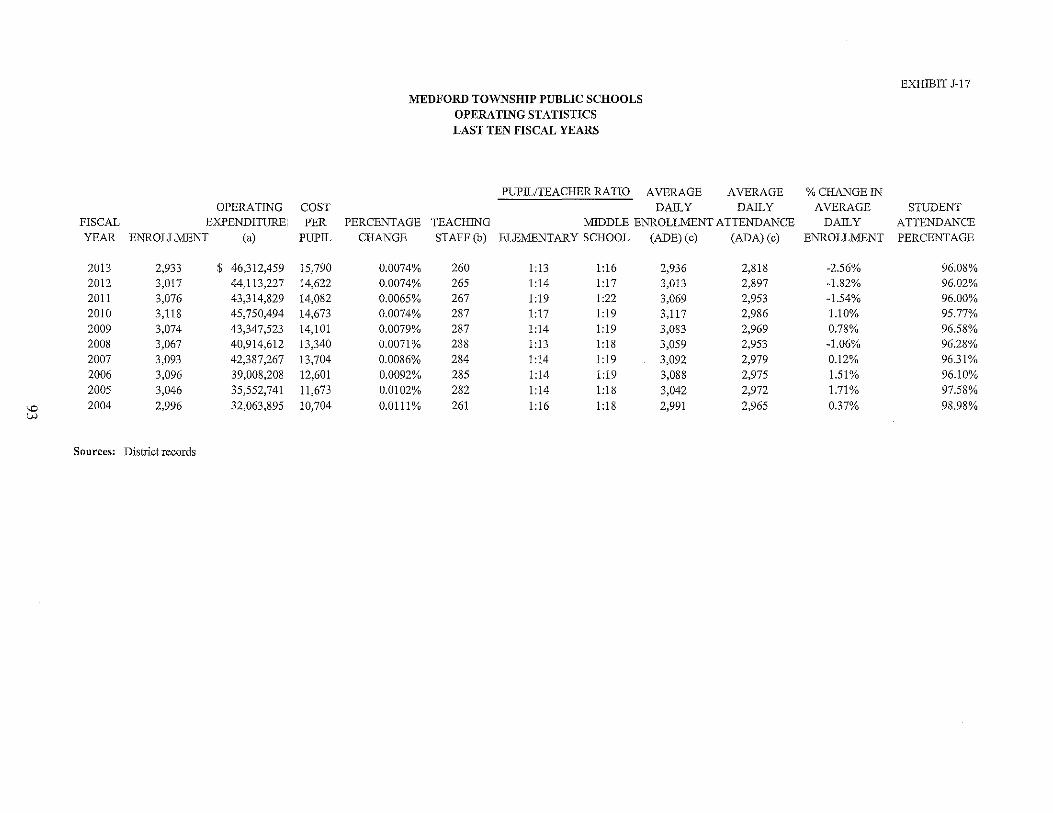
OPERATING COST FISCAL EXPENDITURE: PER YEAR ENROLLMENT (a) PUPIL
2013 2,933 $ 46,312,459 15,790 2012 3,017 44,113,227 14,622 2011 3,076 43,314,829 14,082 2010 3,118 45,750,494 14,673 2009 3,074 43,347,523 14,101 2008 3,067 40,914,612 13,340 2007 3,093 42,387,267 13,704 2006 3,096 39,008,208 12,601 2005 3,046 35,552,741 11,673
'-0 2004 2,996 32,063,895 10,704 w
Sources: District records
MEDFORD TOWNSHIP PUBLIC SCHOOLS
OPERATING STATISTICS
LAST TEN FISCAL YEARS
PUPIL/TEACHER RATIO AVERAGE AVERAGE DAILY DAILY
PERCENTAGE TEACHING MIDDLE ENROLLMENT ATTENDANCE CHANGE STAFF (b) ELEMENTARY SCHOOL (ADE) (c) (ADA) (c)
0.0074% 260 1;13 1:16 2,936 2,818 0.0074% 265 1:14 1:17 3,013 2,897
0.0065% 267 1:19 1:22 3,069 2,953 0.0074% 287 1:17 1:19 3,117 2,986 0.0079% 287 1:14 1:19 3,083 2,969 0.0071% 288 1:13 1 :18 3,059 2,953
0.0086% 284 1:14 1:19 3,092 2,979 0.0092% 285 1:14 1:19 3,088 2,975
0.0102% 282 1: 14 1: 18 3,042 2,972
0.0111% 261 1: 16 1 :18 2,991 2,965
EXHIBIT J-17
% CHANGE IN AVERAGE STUDENT
DAILY ATTENDANCE ENROLLMENT PERCENTAGE
-2.56% 96.08% -1.82% 96.02% -1.54% 96.00%
1.10% 95.77%
0.78% 96.58% -1.06% 96.28% 0.12% 96.31 % 1.51% 96.10% 1.71% 97.58%
0.37% 98.98%
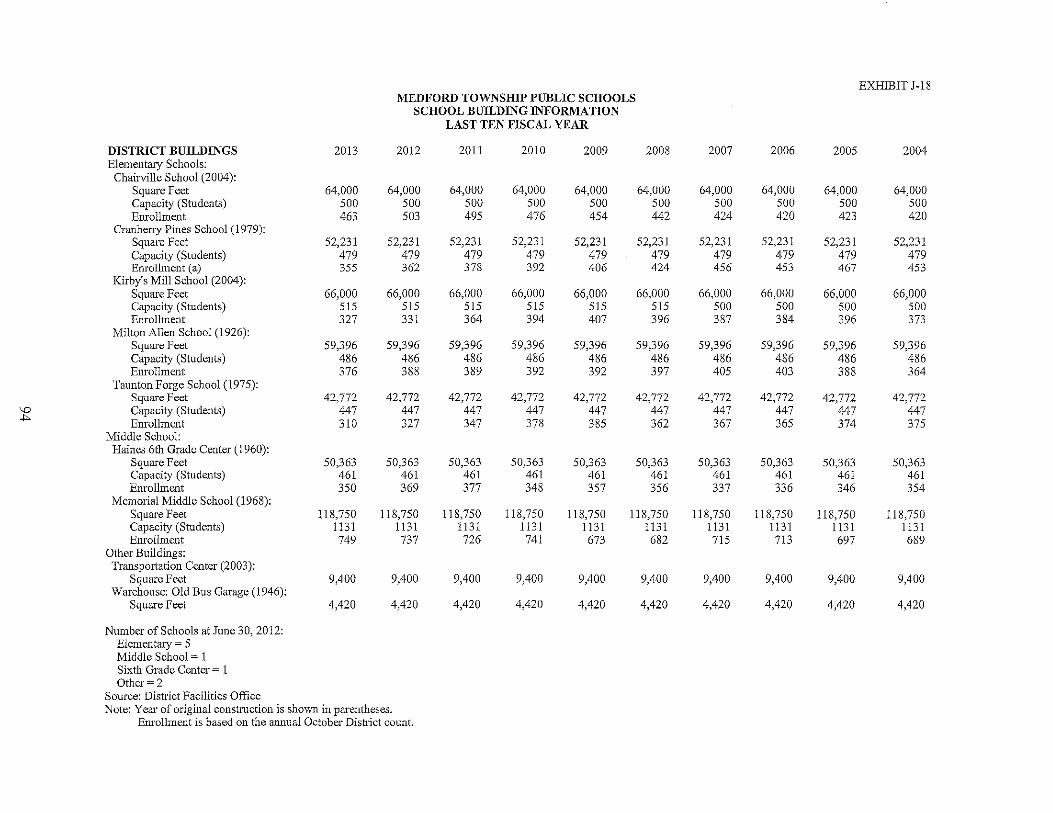
EXHIBIT J-18 MEDFORD TOWNSIDP PUBLIC SCHOOLS
SCHOOL BUILDING INFORMATION LAST TEN FISCAL YEAR
DISTRICT BUILDINGS 2013 2012 2011 2010 2009 2008 2007 2006 2005 2004 Elementm.y Schools:
Chairville School (2004): Square Feet 64,000 64,000 64,000 64,000 64,000 64,000 64,000 64,000 64,000 64,000 Capacity (Studcnts) 500 500 500 500 500 500 500 500 500 500 Enrollment 463 503 495 476 454 442 424 420 423 420
Cranbeny Pines School (1979): Square Feet 52,231 52,231 52,231 52,231 52,231 52,231 52,231 52,231 52,231 52,231 Capacity (Students) 479 479 479 479 479 479 479 479 479 479 Enrollment (a) 355 362 378 392 406 424 456 453 467 453
Kirby's Mill School (2004): Square Feet 66,000 66,000 66,000 66,000 66,000 66,000 66,000 66,000 66,000 66,000 Capacity (Students) 515 515 515 515 515 515 500 500 500 500 Enrollment 327 331 364 394 407 396 387 384 396 373
Milton Allen School (1926): Square Feet 59,396 59,396 59,396 59,396 59,396 59,396 59,396 59,396 59,396 59,396 Capacity (Students) 486 486 486 486 486 486 486 486 486 486 Enrollment 376 388 389 392 392 397 405 403 388 364
Taunton Forge School (1975): Square Feet 42,772 42,772 42,772 42,772 42,772 42,772 42,772 42,772 42,772 42,772
\0 Capacity (Students) 447 447 447 447 447 447 447 447 447 447 .. Enrollment 310 327 347 378 385 362 367 365 374 375
Middle School: Haines 6tll Gradc Center (1960):
Square Feet 50,363 50,363 50,363 50,363 50,363 50,363 50,363 50,363 50,363 50,363 Capacity (Students) 461 461 461 461 461 461 461 461 461 461 Enrollment 350 369 377 348 357 356 337 336 346 354
Memorial Middle School (1968): Square Feet 118,750 118,750 118,750 118,750 118,750 118,750 118,750 118,750 118,750 118,750 Capacity (Students) 1131 1131 1131 1131 1131 1131 1131 1131 1131 1131 Emollmcnt 749 737 726 741 673 682 715 713 697 689
Other Buildings: Transportation Center (2003):
Square Feet 9,400 9,400 9,400 9,400 9,400 9,400 9,400 9,400 9,400 9,400 Warehouse: Old Bus Garage (1946):
Square Feet 4,420 4,420 4,420 4,420 4,420 4,420 4,420 4,420 4,420 4,420
Number of Schools at June 30, 2012: Elementary = 5 Middle School ~ 1 Sixth Grade Center = 1 Other~ 2
Source: DistTict Facilities Office Note: Year of original construction is shuwn in parentheses.
Enrollment is based on the annual October Dish;ct count.
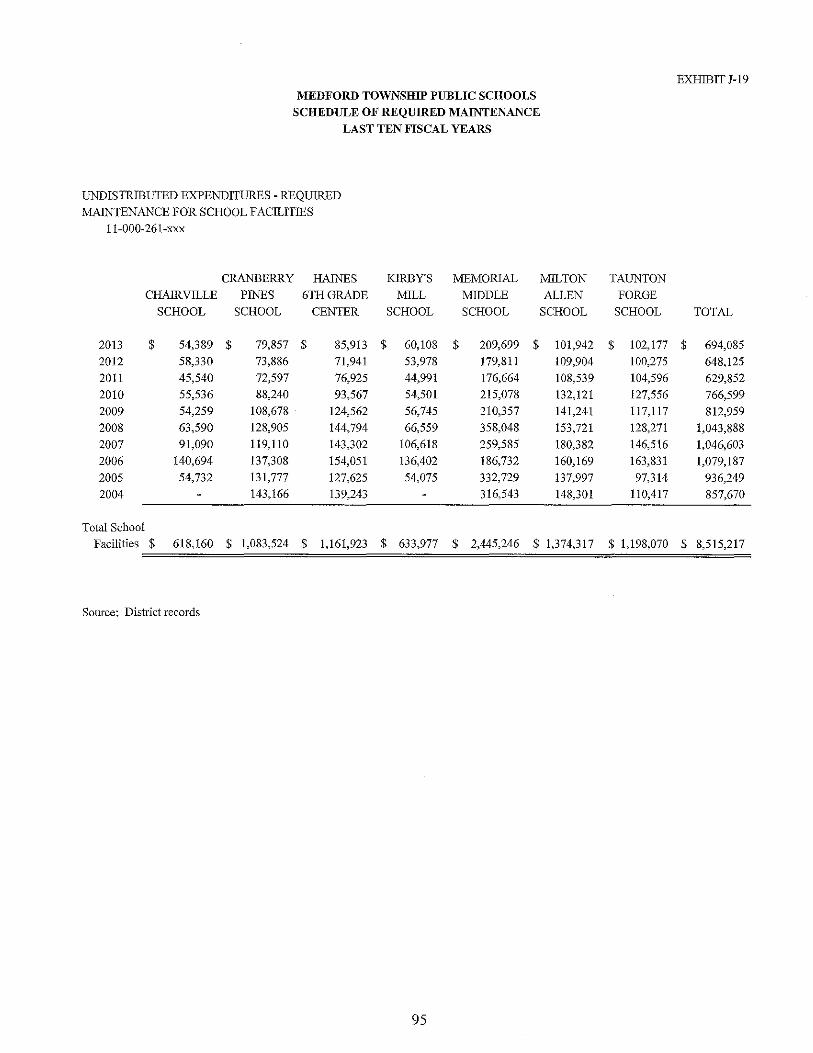
MEDFORD TOWNSIllP PUllLIC SCHOOLS
SCHEDULE OF REQUIRED MAINTENANCE
LAST TEN FISCAL YEARS
UNDISTRIBUTED EXPENDITURES - REQmRED
MAINTENANCE FOR SCHOOL FACILITIES
11-000-261-xxx
CRANBERRY HAINES KIRBY'S MEMORIAL MILTON
CHAlRVILLE PINES 6TI{GRADE MILL MIDDLE ALLEN
SCHOOL SCHOOL CENTER SCHOOL SCHOOL SCHOOL
2013 $ 54,389 $ 79,857 $ 85,913 $ 60,108 $ 209,699 $ 101,942
2012 58,330 73,886 71,941 53,978 179,811 109,904
2011 45,540 72,597 76,925 44,991 176,664 108,539
2010 55,536 88,240 93,567 54,501 215,078 132,121
2009 54,259 108,678 124,562 56,745 210,357 141,241
2008 63,590 128,905 144,794 66,559 358,048 153,721
2007 91,090 119,110 143,302 106,618 259,585 180,382
2006 140,694 137,308 154,051 136,402 186,732 160,169
2005 54,732 131,777 127,625 54,075 332,729 137,997
2004 143,166 139,243 316,543 148,301
Total School
Facilities $ 618,160 $ 1,083,524 $ 1,161,923 $ 633,977 $ 2,445,246 $ 1,374,317
Source: District records
95
EXHIBIT J-19
TAUNTON
FORGE
SCHOOL TOTAL
$ 102,177 $ 694,085
100,275 648,125
104,596 629,852
127,556 766,599
117,117 812,959
128,271 1,043,888
146,516 1,046,603
163,831 \,079,187
97,314 936,249
110,417 857,670
$ 1,198,070 $ 8,515,217
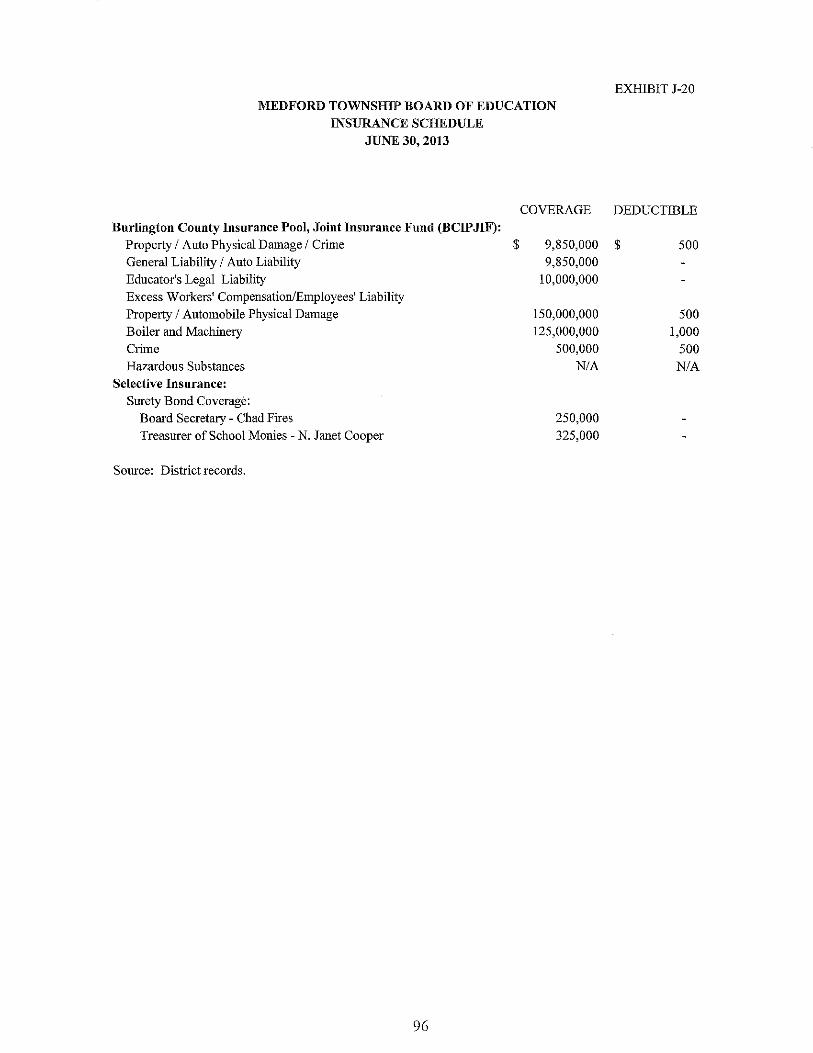
MEDFORD TOWNSHIP BOARD OF EDUCATION
INSURANCE SCHEDULE
JUNE 30, 2013
Burlington County Insurance Pool, Joint Insurance Fund (BeIP JIFJ: Property I Auto Physical Damage I Crime General Liability I Auto Liability
Educator's Legal Liability Excess Workers' Compensation/Employees' Liability Property I Automobile Physical Damage
Boiler and Machinery Crime Hazardous Substances
Selective Insurance: Surety Bond Coverage:
Board Secretary - Chad Fires Treasurer ofScbool Monies - N. Janet Cooper
Source: District records.
96
$
COVERAGE
9,850,000
9,850,000 10,000,000
150,000,000 125,000,000
500,000 N/A
250,000 325,000
EXHIBIT J-20
DEDUCTIBLE
$ 500
500 1,000
500 N/A

SINGLE AUDIT SECTION

I
I
I
I
I
I
I
I
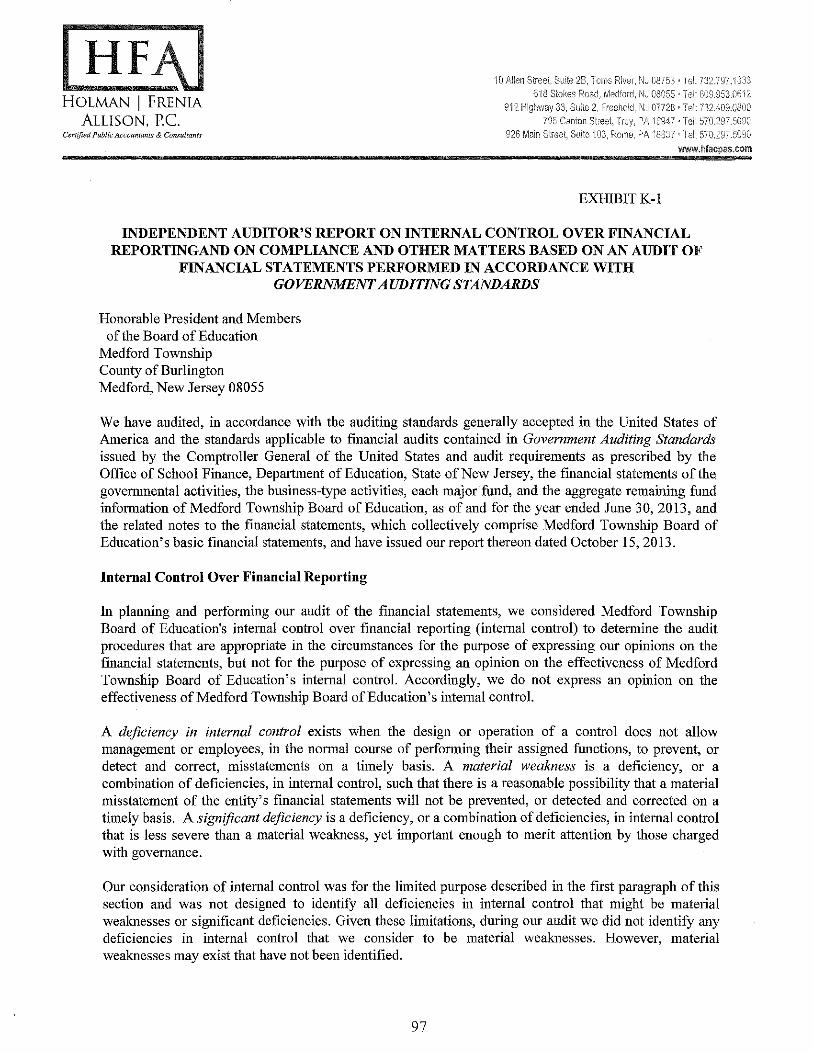
HF HOLMAN I FRENlA
ALLISON, Pc. Certified Public Accountants & Consultants
10 Allen Street SUite 2B, Terns RIV0(, NJ C8IS:} , lsI: 732.797,'1333 B"iS Stokes Road, Medford, N~ 08G55 , Tel: 608.%J0612
9"12 Highway 33, Suite 2, FreellOld,)\jJ 07723' Tel: 732.409.0300 795 Cantcn Street, TroY,?A 169L17 ' Tel: ;'70.297.5090
826 Main Street, Suite 103, Roms, H\ '8837' Tel: 570,297.5090 www.hfacpas.com
EXHIBlTK-I
INDEPENDENT AUDITOR'S REPORT ON INTERNAL CONTROL OVER FINANCIAL REPORTINGAND ON COMPLIANCE AND OTHER MATTERS BASED ON AN AUDIT OF
FINANCIAL STATEMENTS PERFORMED IN ACCORDANCE WITH GOVERNMENT AUDITING STANDARDS
Honorable President and Members of the Board of Education
Medford Township County of Burlington Medford, New Jersey 08055
We have audited, in accordance with the auditing standards generally accepted in the United States of America and the standards applicable to financial audits contained in Government Auditing Standards issued by the Comptroller General of the United States and audit requirements as prescribed by the Office of School Finance, Department of Education, State of New Jersey, the fmancial statements of the govenllllental activities, the business-type activities, each major fund, and the aggregate remaining fund infonnation of Medford Township Board of Education, as of and for the year elided June 30, 2013, and the related notes to the financial statements, which collectively comprise Medford Township Board of Education's basic financial statements, and have issued our report thereon dated October IS, 2013.
Internal Control Over Financial Reporting
hl planning and perfonning our audit of the financial statements, we considered Medford Township Board of Education's internal control over financial reporting (internal control) to detennine the audit procedures that are appropriate in the circumstances for the purpose of expressing our opinions on the financial statements, but not for the purpose of expressing an opinion on the effectiveness of Medford Township Board of Education's internal control. Accordingly, we do not express an opinion on the effectiveness of Medford Township Board of Education's internal control.
A deficiency in internal control exists when the design or operation of a control does not allow management or employees, in the nonnal course of perfonning their assigned functions, to prevent, or detect and correct, misstatements on a timely basis. A material weakness is a deficiency, or a combination of deficiencies, in internal control, such that there is a reasonable possibility that a material misstatement of the entity's financial statements will not be prevented, or detected and corrected on a timely basis. A Significant deficiency is a deficiency, or a combination of deficiencies, in internal control that is less severe than a material weakness, yet important enough to merit attention by those charged with governance.
Our consideration of internal control was for the limited purpose described in the first paragraph of this section and was not designed to identify all deficiencies in internal control that might be material weaknesses or significant deficiencies. Given these limitations, during our audit we did not identify any deficiencies in internal control that we consider to be material weaknesses. However, material weaknesses may exist that have not been identified.
97

Compliance and Other Matters
As part of obtaining reasonable assnrance about whether Medford Township Board of Education's financial statements are free from material misstatement, we performed tests of its compliance with certain provisions of laws, regulations, contracts, and grant agreements, noncompliance with which could have a direct and material effect on the determination of financial statement amounts. However, providing an opinion on compliance with those provisions was not an objective of our audit, and accordingly, we do not express such an opinion. The resnlts of our tests disclosed no instances of noncompliance or other matters that are required to be reported under Government Auditing Standards and audit requirements as prescribed by the Office of School Finance, Department of Education, State of New Jersey
Purpose of this Report
The pnrpose of this report is solely to describe the scope of our testing of internal control and compliance and the results of that testing, and not to provide an opinion on the effectiveness of the entity's internal control or on compliance. This report is an integral part of an audit PreFf~rmed in accordance with Government Auditing Standards in considering the entity's internal contrql and compliance. Accordingly, this communication is not suitable for any other purpose.
This report is intended solely for the information of the audit committee, management, the Medford Township Board of Education, the New Jersey State Department of Education and other state and federal awarding agencies and pass-through entities and is not intended to be and should not be used by anyone other than these specified parties.
Medford, New Jersey October 15, 2013
Respectfully Submitted,
HOLMAN FRENIA ALLISON, P.C.
evin Frenia, Public School Accountant Certified Public Accountant No. 1011
98
HF HOLMAN I FRENIA
ALLISON, P.c. Certified Public Accounrants & Consultants
.aE
10 .lIlien Si!'eet. Suite 28, Toms River, NJ 081:13 ' 'j e!: 732,787 . '1333 6"18 STOkGS Road, Medford. NJ 08055 ¢ Tei: 609.953.08'[2
9'12 Highway 33, Suite 2, Freehold, NJ 07728" Tel: liOD.CGO:) 795 Cadon Sires\, Troy, P.!:' Hl947 0 Tei: 570.29!}-iOUO
926 Main Street, Suite 103, r-<;ome. PA '18837 0 Tel: 570.297.5090 www.hfacpas.com
£& £ .~_2!£,~ _
EXHIBITK-2
INDEPENDENT AUDITOR'S REPORT ON COMPLIANCE FOR EACH MAJOR PROGRAM AND ON INTERNAL CONTROL OVER COMPLIANCE REQUIRED BY OMB CIRCULAR A-
133 AND NEW JERSEY OMB CIRCULAR 04-04.
Honorable President and Members of the Board of Education
Medford Township County of Burlington Medford, New Jersey 08055
Report on Compliance for Each Major Federal and State Program
We have audited Medford Township Board of Education's compliance with the types of compliance requirements described in the OMB Circular A-J33 Compliance Supplement and the New Jersey Aid/Grant Compliance Supplement that could have a direct and material effect on each of the District's major federal and state programs for the year ended June 30, 2013. Medford Township Board of Education's major federal and state programs are identified in the summary of auditor's results section of the accompanying schedule of findings and questioned costs.
Management's Responsihility
Management is responsible for compliance with the requirements of laws, regulations, contracts, and grants applicahle to its federal and state programs.
Anditor's Responsihility
Our responsihility is to express an opinion on compliance for each of Medford Township Board of Education's major federal and state programs based on our audit of the types of compliance requirements referred to above. We conducted our audit of compliance in accordance with auditing standards generally accepted in the United States of America; the standards applicable to financial audits contained in Government Auditing Standards, issued by the Comptroller General of the United States; and OMB Circular A-133, Audits of States, Local Governments, and Non-Profit Organizations; the New Jersey State Aid/Grant Compliance Supplement; the audit requirements prescribed by the Office of School Finance, Department of Education, State of New Jersey; and New Jersey OMB's Circular 04-04, Single Audit Policy for Recipients of Federal Grants, State Grants and State Aid. Those standards, OMB Circular A-133 and New Jersey OMB's Circular 04-04, require that we plan and perform the audit to obtain reasonable assurance about whether noncompliance with the types of compliance requirements referred to above that could have a direct and material effect on a major federal or state program occurred. An audit includes examining, on a test basis, evidence about Medford Township Board of Education's compliance with those requirements and performing such other procedures as we considered necessmy in the circumstances.
99
We believe that our audit provides a reasonable basis for our opinion on compliance for each major federal or state program. However, our audit does not provide a legal determination of Medford Township Board of Education's compliance with those requirements.
Opinion on Each Major Federal or State Program
In our opinion, Medford Township Board of Education complied, in all material respects, with the types of compliance requirements referred to above that could have a direct and material effect on each of its major federal or state programs for the year ended June 30, 2013.
Other Matters
The results of our auditing procedures disclosed instances of noncompliance, which are required to be reported in accordance with OMB Circular A-l33 or New Jersey OMB's Circular 04-04.
Report on Internal Control Over Compliance
Management of Medford Township Board of Education is responsible for establishing and maintaining effective internal control over compliance with the types of compliance requirements referred to above. In planning and performing our audit of compliance, we considered Medford Township Board of Education's internal control over compliance with the types of requirements that could have a direct and material effect on each major federal or state program to determine the auditing procedures that are appropriate in the circumstances for the purpose of expressing an opinion on compliance for each major federal or state program and to test and report on internal control over compliance in accordance with OMB Circular A-133 or New Jersey OMB's Circular 04-04, but not for the purpose of expressing an opinion on the effectiveness of internal control over compliance. Accordingly, we do not express an opmlOn on the effectiveness of Medford Township Board of Education's internal control over compliance.
A deficiency in internal control over compliance exists when the design or operation of a control over compliance does not allow management or employees, in the normal course of performing their assigned functions, to prevent, or detect and correct, noncompliance with a type of compliance requirement of a federal or state program on a timely basis. A material weakness in internal control over compliance is a deficiency, or combination of deficiencies, in internal control over compliance, such that there is a reasonable possibility that material noncompliance with a type of compliance requirement of a federal or state program will not be prevented, or detected and corrected, on a timely basis. A significant deficiency in internal control over compliance is a deficiency, or a combination of deficiencies, in internal control over compliance with a type of compliance reqnirement of a federal or state program that is less severe than a material weakness in internal control over compliance, yet important enough to merit attention by those charged with governance.
Our consideration of internal control over compliance was for the limited purpose described in the first paragraph of this section and was not designed to identifY all deficiencies in internal control over compliance that might be material weaknesses or significant deficiencies. We did not identifY any deficiencies in internal control over compliance that we consider to be material weaknesses. However, material weaknesses may exist that have not been identified.
100
The purpose of this report on internal control over compliance is solely to describe the scope of our testing of internal control over compliance and the results of that testing based on the requirements of OMB Circular A-133 and New Jersey OMB's Circular 04-04. Accordingly, this report is not suitable for any other purpose.
This report is intended for the information of the management of the Medford Township Board of Education, the New Jersey State Department of Education, other state and federal awarding agencies and pass-through entities and is not intended to be and should not be used by anyone other than these specified parties.
Medford, New Jersey October 15, 2013
Respectfully Submitted,
HOL~ FRE~) ALLISON, P.C.
Certified Public Accmmtant No. lOll
101

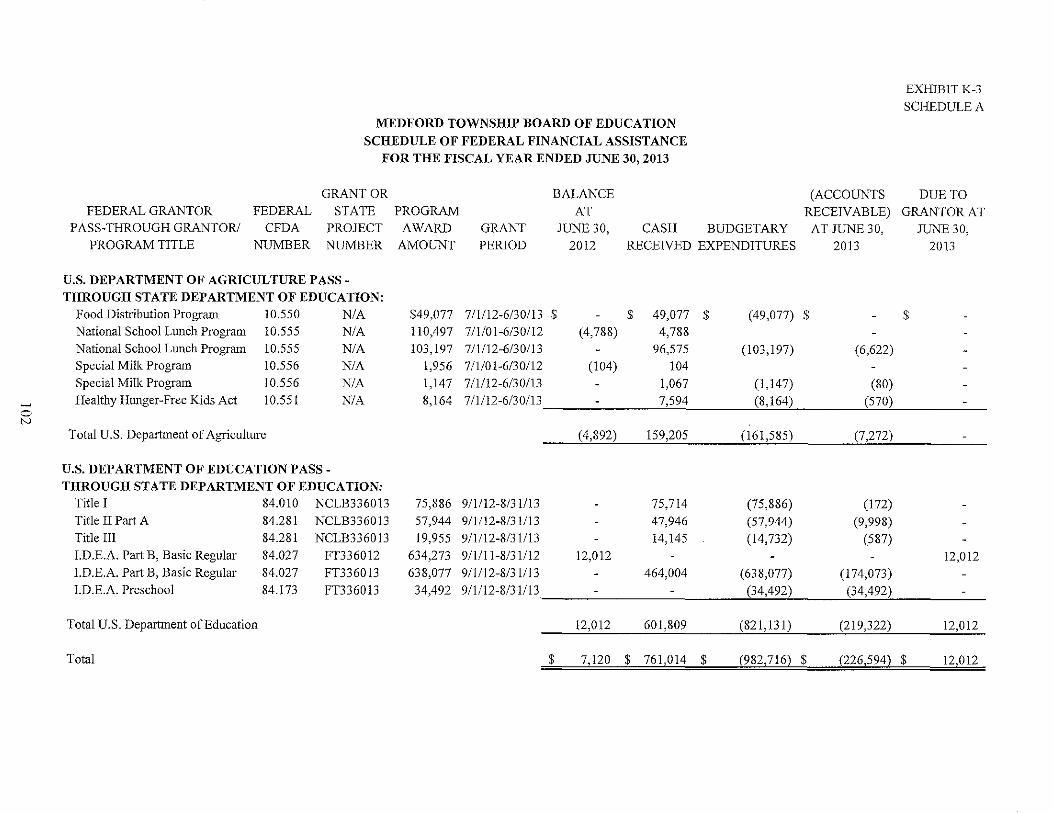
EXHIBIT K-3
SCHEDULE A MEDFORD TOWNSHIP BOARD OF EDUCATION
SCHEDULE OF FEDERAL FINANCIAL ASSISTANCE FOR THE FISCAL YEAR ENDED JUNE 30, 2013
GRANTOR BALANCE (ACCOUNTS DUE TO FEDERAL GRANTOR FEDERAL STATE PROGRAM AT RECEIVABLE) GRANTOR AT
PASS-THROUGH GRANTOR! CFDA PROJECT AWARD GRANT JUNE 30, CASH BUDGETARY AT JUNE 30, JUNE 30, PROGRAM TITLE NUMBER NUMBER AMOUNT PERlOD 2012 RECEIVED EXPENDITURES 2013 2013
U.S. DEPARTMENT OF AGRICULTURE PASS-THROUGH STATE DEPARTMENT OF EDUCATION:
Food Distribution Program 10.550 NIA $49,077 711112-6/30/13 $ $ 49,077 $ (49,077) $ $ National School Lunch Program 10.555 NIA 110,497 711101-6/30/12 (4,788) 4,788 National School Lunch Program 10.555 N/A 103,197 7/1112-6/30113 96,575 (103,197) (6,622) Special Milk Program 10.556 N/A 1,956 711101-6/30/12 (104) 104 Special Milk Program 10.556 N/A 1,147 711/12-6130113 1,067 (1,147) (80)
- Healthy Hunger-Free Kids Act 10.551 NIA 8,164 711/12-6/30113 7,594 (8,164) (570) 0 N
Total U.S. Department of Agriculture (4,892) 159,205 (161,585) (7,272)
U.S. DEPARTMENT OF EDUCATION PASS-THROUGH STATE DEPARTMENT OF EDUCATION:
Title I 84.010 NCLB336013 75,886 911/12-8/31113 75,714 (75,886) (172) Title II Part A 84.281 NCLB336013 57,944 911/12-8/31113 47,946 (57,944) (9,998) TitJelII 84.281 NCLB336013 19,955 911112-8/31113 14,145 (14,732) (587) LD.E.A. Part B, Basic Regular 84.027 FT336012 634,273 911111-8/31112 12,012 12,012 LD.E.A. Part B, Basic Regular 84.027 FT336013 638,077 911112-8/31/13 464,004 (638,077) (174,073) LD.E.A. Preschool 84.173 FT336013 34,492 911112-8/31113 (34,492) (34,492)
Total U.S. Department of Education 12,012 601,809 (821,131) (219,322) 12,012
Total $ 7,120 $ _1<51014 $ (982,716) $ (226,594) $ 12,012
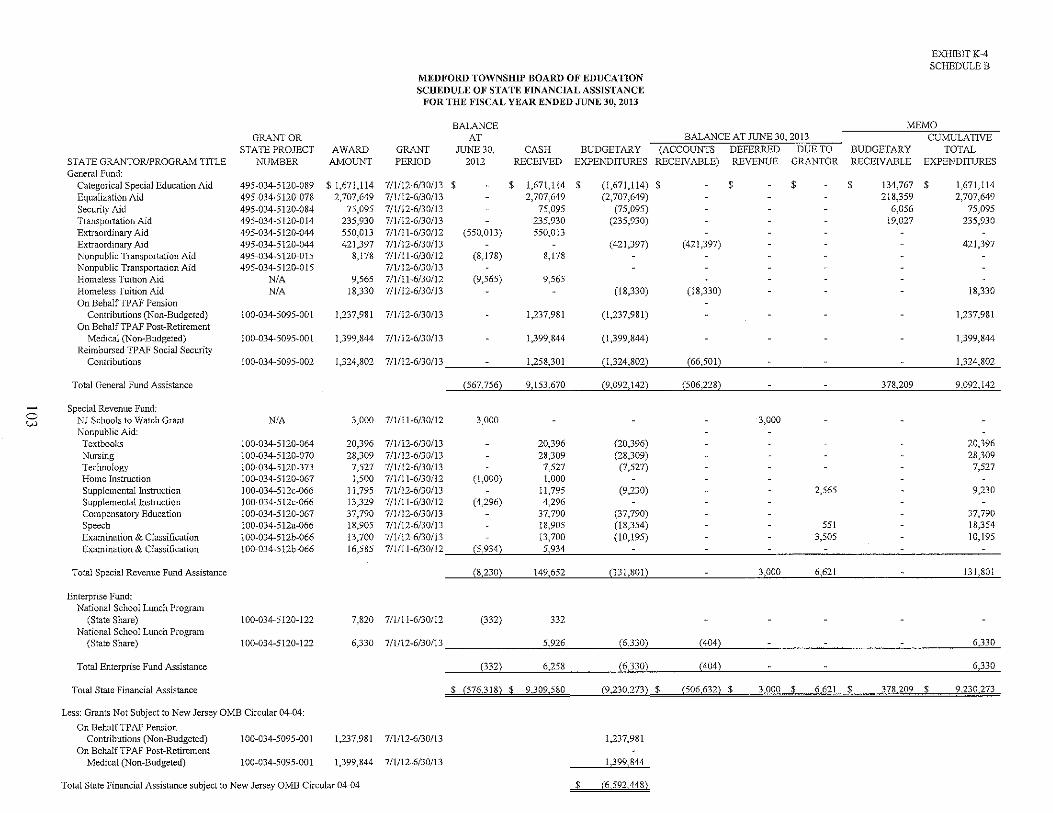
-0 w
GRANTOR STATE PROJECT
STATE GRANTOR/PROGRAM TITLE NUMBER General Fund:
Categorical Special Education Aid 495-034-5120-089 Equalization Aid 495-034-5120-078 Security Aid 495-034-5120-084 Transportation Aid 495-034-5120-014 Extraordinary Aid 495-034-5120-044 Extraordinary Aid 495-034-5120-044 Nonpublic Transportation Aid 495-034-5120-0 J 5 Nonpublic Transportation Aid 495-034-5120-015 Homeless Tuition Aid N/A Homeless Tuition Aid N/A On BehalfTP AF Pension
Contributions (Non-Budgeted) 100-034-5095-001 On Behalf TP AF Post-Retirement
Medical (Non-Budgeted) 1 00-034-5095~00 I Reimbursed TP AF Social Security
Contributions JOO-034-5095-002
Total General Fund Assistance
Special Revenue Fund: NJ Schools to Watch Grant N/A Nonpublic Aid:
Textbooks 100-034-5120-064 Nursing 100-034-5120-070 Technology 100-034-5120-373 Home Instruction 100-034-5120~067
Supplemental Instruction 100-034-512c-066 Supplemental Instruction 100-034-5J2c-066 Compensatory Education 100-034-5120-067 Speech 100-034-512a-066 Examination & Classification 100-034-512b-066 Examination & Classification 100+034-512b-066
Total Special Revenue Fund Assistance
Enterprise Fund: National School LlU1ch Program
(State Share) 100-034-5120-122 National School LlU1ch Program
(State Share) 100-034-5120-122
Total Enterprise Fund Assistance
Total State Financial Assistance
Less: Grants Not Subject to New Jersey OMB Circular 04-04:
On Behalf TF AF Pension Contributions (Non-Budgeted)
On BehalfTPAF Post-Retirement Medical (Non-Budgeted)
100-034-5095-001
100-034-5095-001
MEDFORD TOWNSHIP BOARD OF EDUCATION SCHEDULE OF STATE FINAl"VCIALASSISTANCE
FOR THE FISCAL YEAR ENDED JUNE 30, 2013
BALANCE AT BALANCE AT JUNE 30, 2013
AWARD GRANT JUNE 30, CASH BUDGETARY (ACCOUNTS DEFERRED DUE TO AMOUNT PERIOD 2012 RECENED EXPENDITURES RECEN ABLE) REVENUE GRANTOR
$ 1,671,114 711112-6/30113 $ $ 1,671,114 $ (I,67I,1l4) $ $ $ 2,707,649 711112-6/30/13 2,707,649 (2,707,649)
75,095 7/1/12-6/30/13 75,095 (75,095) 235,930 7/1112-6/30/13 235,930 (235,930) 550,013 711111-6/30/12 (550,013) 550,013 421,397 711112-6/30/13 (421,397) (421,397)
8,178 711111-6/30/12 (8,178) 8,178 711112-6/30/13
9,565 711111-6130/12 (9,565) 9,565 18,330 711112-6/30113 (18,330) (18,330)
1,237,981 711112-6/30113 1,237,981 (1,237,981)
l,399,844 7/1/12-6/30/13 1,399,844 (1,399,844)
1,324,802 711112-6/30/13 1,258,301 [l,324,802} (66,501)
(567.756) 9,153,670 (9,092,142) (506,228)
3,000 7/1111-6/30/12 3,000 3,000
20,396 711/12-6/30113 20,396 (20,396) 28,309 7/1112-6/30/13 28,309 (28,309)
7,527 7/1/12-6/30/13 7,527 (7,527) 1,500 711111-6/30/12 (1,000) 1,000
11,795 7/1/12-6/30/13 11,795 (9,230) 2,565 13,329 7/1/11-6/30/12 (4,296) 4,296 37,790 711112-6/30/13 37,790 (37,790) 18,905 711112-6/30/13 18,905 (18,354) 551 13,700 7/1/12+6130113 13,700 (10,195) 3,505 16,585 711/11-6/30/12 (5,934) 5,934
(8,230} 149,652 (131,801) 3,000 6,621
7,820 7/1111-6/30/12 (332) 332
6,330 711112-6/30/13 5,926 (6,3302 ~4042
(332) 6,258 (6,330) (404)
$ (5763182 $ 9309580 (9,230,273) $ (5066322 $ 3000 $ 6621
1,237,981 711/12-6/30/13 1,237,981
1,399,844 7/1112-6/30113 1,399,844
Total State Financial Assistance subject to New Jersey OMB Circular 04-04 $ (6592A48)
EXHIBIT K-4 SCHEDULEB
MEMO CUMULATIVE
BUDGETARY TOTAL RECEIVABLE EXPENDITURES
$ 134,767 $ 1,671,114 218,359 2,707,649
6,056 75,095 19,027 235,930
421,397
18,330
1,237,981
1,399,844
1,324,802
378,209 9,092,142
20,396 28,309
7,527
9,230
37,790 18,354 10,195
131,801
6,330
6,330
$ 378209 $ 9230273
1. General
MEDFORD TOWNSHIP BOARD OF EDUCATION NOTES TO THE SCHEDULES OF FINANCIAL ASSISTANCE
FOR THE YEAR ENDED JUNE 30, 2013
EXHIBITK-5 (Page 1 of2)
The accompanying schedules of expenditures of federal awards and state financial assistance include federal awards and state financial assistance programs of the Board of Education, Medford Township Board of Education. The Board of Education is defined in Note 1 to the District's basic financial statements. All Federal and State awards received directly from Federal and State agencies, as well as federal awards and state fmancial assistance passed through other government agencies is included on the schedule of expenditures of federal awards and state financial assistance.
2. Basis of Acconnting
The accompanying schedules of expenditures of awards and financial assistance are presented on the budgetary basis of accounting with the exception of programs recorded in the food service fund, which are presented using the accrual basis of accounting. This basis of accounting is described in Note I to the District's basic fmancial statements.
3. Relationship to Basic Financial Statements
The basic fmancial statements present the general fund and special revenue fund on a GAAP basis. Budgetary comparison statements or schedules (RSI) are presented for the general fund and special revenue fund to demonstrate finance related legal compliance in which certain revenue is permitted by law or grant agreement to be recognized in the audit year, whereas for GAAP reporting, revenue is not recognized until the subsequent year or when expenditures have been made.
The general fund is presented in the accompanying schedules on the modified accrual basis with the exception of the revenue recognition of the last state aid payment in the cunent budget year, which is mandated pursuant to NJ.S.A.lSA:22-44.2. For GAAP purposes that payment is not recognized until the subsequent budget year due to the state deferral and recording of the last state aid payment in the subsequent year. The special revenue fund is presented in the accompanying schedules on the grant accounting budgetary basis, which recognizes encumbrances as expenditures and also recognizes the related revenues, whereas the GAAP basis does not. The special revenue fund also recognizes the last state aid payment in the current budget year, consistent withNJ.S.A.lSA:22-4.2.
The net adjustment to reconcile from the budgetary basis to the GAAP basis is ($15,192) for the general fund and $-0- for the special revenue fund. See Note 1 for a reconciliation of the budgetary basis to the modified accrual basis of accounting for the general and special revenue funds. Awards and fmancial assistance revenues are reported in the District's basic financial statements on a GAAP basis as presented as follows:
104
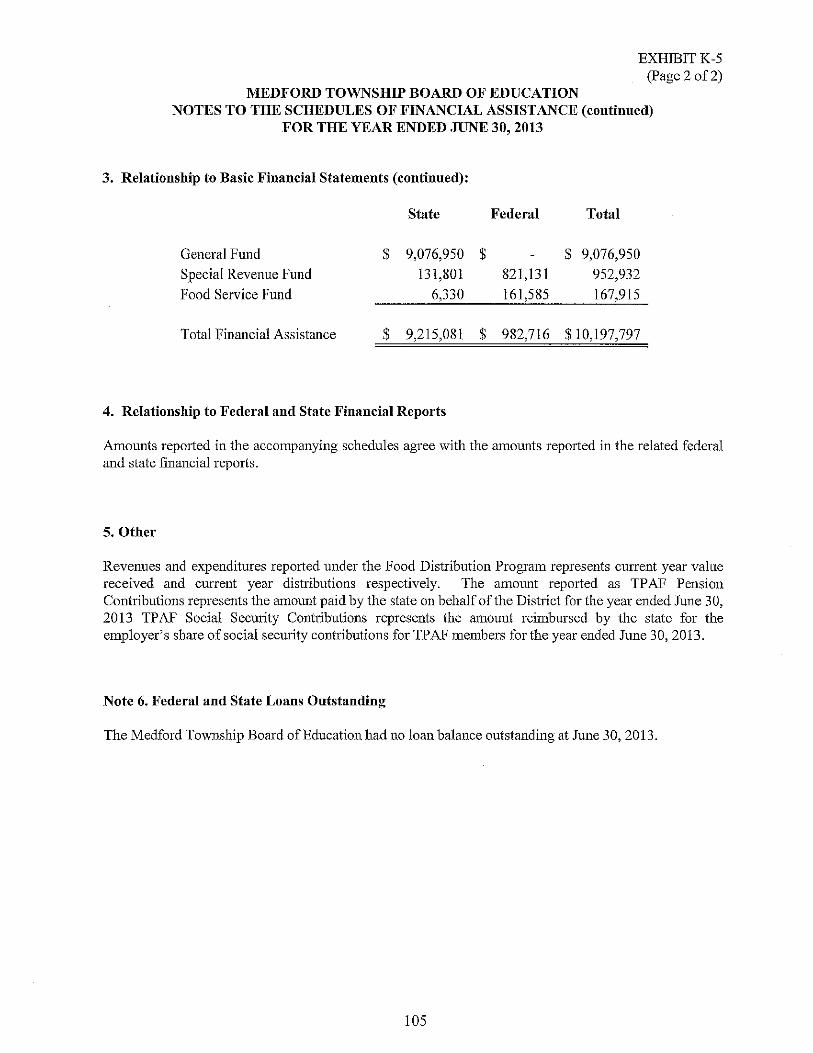
EXHIBITK-5 (page 2 of2)
MEDFORD TOWNSHIP BOARD OF EDUCATION NOTES TO THE SCHEDULES OF FINANCIAL ASSISTANCE (continued)
FOR THE YEAR ENDED JUNE 30, 2013
3. Relationship to Basic Financial Statements (continued):
State Federal Total
General Fund $ 9,076,950 $ $ 9,076,950 Special Revenue Fund 131,801 821,131 952,932 Food Service Fund 6,330 161,585 167,915
Total Financial Assistance $ 9,215,081 $ 982,716 $10,197,797
4. Relationship to Federal and State Financial Reports
Amounts reported in the accompanying schedules agree with the amounts reported in the related federal and state fmancial reports.
5. Other
Revenues and expenditures reported under the Food Distribution Program represents current year value received and current year distributions respectively. The amount reported as TP AF Pension Contributions represents the amount paid by the state on behalf of the District for the year ended June 30, 2013 TPAF Social SecUlity Contributions represents the amount reimbursed by the state for the employer's share of social security contributions for TP AF members for the year ended June 30, 2013.
Note 6. Federal and State Loans Outstanding
The Medford Township Board of Education had no loan balance outstanding at June 30, 2013.
105
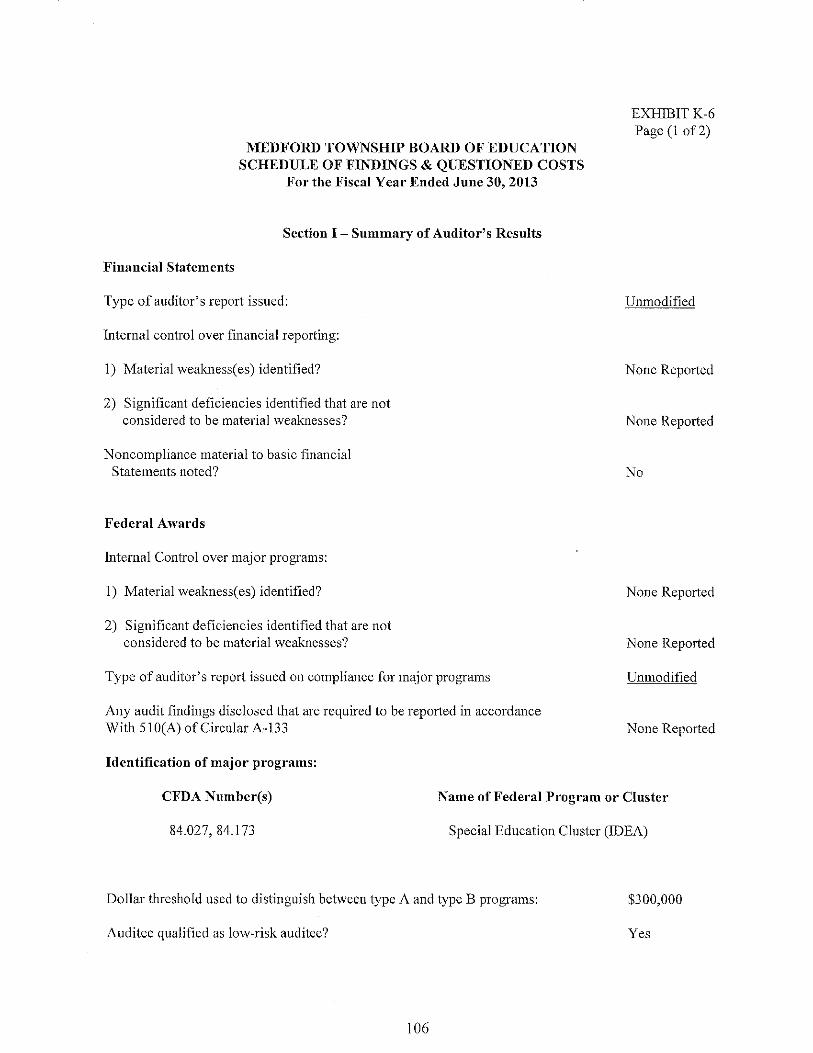
Financial Statements
MEDFORD TOWNSHIP BOARD OF EDUCATION SCHEDULE OF FINDINGS & QUESTIONED COSTS
For the Fiscal Year Ended June 30, 2013
Section I - Summary of Auditor's Results
Type of auditor's report issued:
Internal control over financial reporting:
1) Material weakl1ess(es) identified?
2) Significant deficiencies identified that are not considered to be material weaknesses?
Noncompliance material to basic financial Statements noted?
Federal Awards
Internal Control over major programs:
1) Material weakness(es) identified?
2) Significant deficiencies identified that are not considered to be material weaknesses?
Type of auditor's report issued on compliance for major programs
Any audit findings disclosed that are required to be reported in accordance With S10(A) of Circular A-133
Identification of major programs:
EXHIBITK-6 Page (1 of2)
Unmodified
None Reported
None Reported
No
None Reported
None Reported
Unmodified
None Reported
CFDA Number(s) Name of Federal Program or Cluster
84.027,84.173 Special Education Cluster (IDEA)
Dollar threshold used to distinguish between type A and type B programs: $300,000
Auditee qualified as low-risk auditee? Yes
106
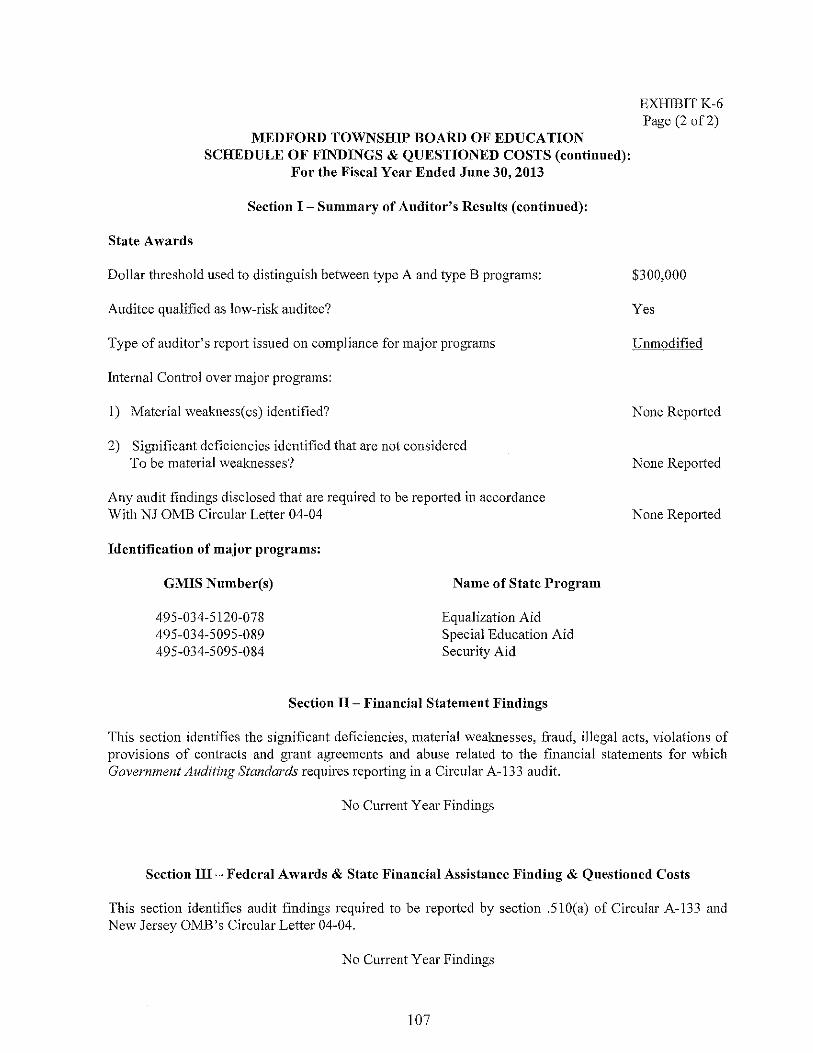
MEDFORD TOWNSIDP BOARD OF EDUCATION SCHEDULE OF FINDINGS & QUESTIONED COSTS (continued):
For the Fiscal Year Ended Jnne 30, 2013
Section I - Summary of Auditor's Results (continned):
State Awards
Dollar threshold used to distinguish between type A and type B programs:
Auditee qualified as low-risk auditee?
Type of auditor's report issued on compliance for major programs
Internal Control over major programs:
I) Material weakness(es) identified?
2) Significant deficiencies identified that are not considered To be material weaknesses?
Any audit findings disclosed that are required to be reported in accordance With NJ OMB Circnlar Letter 04-04
Identification of major programs:
GMIS Number(s)
495-034-5120-078 495-034-5095-089 495-034-5095-084
Name of State Program
Equalization Aid Special Education Aid Security Aid
Section II - Financial Statement Findings
EXHIBITK-6 Page (2 of2)
$300,000
Yes
Unmodified
None Reported
None Reported
None Reported
This section identifies the significant deficiencies, material weaknesses, fraud, illegal acts, violations of provisions of contracts and grant agreements and abnse related to the financial statements for which Government Auditing Standards requires reporting in a Circular A-133 audit.
No Current Year Findings
Section III - Federal Awards & State Financial Assistance Finding & Qnestioned Costs
This section identifies audit findings required to be reported by section .510(a) of Circular A-133 and New Jersey OMB's Circular Letter 04-04.
No Current Year Findings
107
MEDFORD TOWNSHIP BOARD OF EDUCATION SUMMARY SCHEDULE OF PRIOR AUDIT FINDINGS
AND QUESTIONED COSTS AS PREPARED BY MANAGEMENT For the Fiscal Year Ended Jnne 30, 2013
EXHIBlTK-7
This section identifies the status of prior-year findings related to the basic financial statements and federal and state awards that are required to be reported in accordance with Chapter 6.12 of Government Auditing Standards, U.S. OMB Circular A-133 (section .315 (a)(h» and New Jersey OMB's Circular 04-04.
Finding 2012-02:
Condition:
It was noted during our audit that an analysis of capital asset additions, deletions and depreciation is not being properly updated and maintained on an ongoing basis.
Current Status:
Finding has been corrected.
108