media market digest jan-oct'16
TRANSCRIPT

Media Market Digest October 2016
Zenith Worldwide predicts growth of mobile Internet

2

Jan-Oct’2016 in term
of EqTRP’s vs Jan-
Oct’2015
3 Source: GFK/Nielsen, Direct Advertising, excl. Social & Media, TA: 18-50 50k+. Data owner is ITC. Processed by “CCM”
Subsidiary Enterprise
Key facts
SOR average 86% In Oct’2016
It stays close to critical 90% level since 23 week
Oct’16 vs Sep’16
in EqTRP’s
1 + 1 Media organized the second Media Hack Weekend - the largest in Eastern Europe Hackathon

298,2
97,4
72,2
68,7
59,1
55,9
45,3
42,9
42,
33,4
Pharma
Food
Telecom
Hygiene
Trade
Cosmetics
Cold AFB
Entertainment
Confectionery
Auto
15%
9%
2%
24%
97%
52%
2%
7%
-3%
-6%
4 Source: GFK/Nielsen, Direct Advertising, excl. Social & Media, TA: 18-50 50k+. ‘000EqTRPs. Data owner is ITC.
Processed by “CCM” Subsidiary Enterprise
35%
0%
36%
60%
62%
16%
-11%
-5%
-21%
-16%
TOP Categories 2016 vs 2015 Oct’16 vs Sep’16
Finance category decreased due to Privatbank activity drop by 7 times vs prev. Year
Ferrero drove Confectionery growth vs prev. Month and vs prev. Year.
West oil group and Shell became the main reason of Auto category growth vs prev. Month while Ford drove category increase vs prev. Year

43,5
42,1
35,3
31,4
26,1
24,0
22,6
21,9
21,6
21,3
Procter&Gamble
Nestle
Pharmak
Reckitt Benckiser
L'Oreal
GlaxoSmithKline
Kyivstar
Vodafone
Unilever
Sanofi
16%
24%
18%
105%
4%
35%
-15%
-3%
-4%
-18%
5 Source: GFK/Nielsen, Direct Advertising, excl. Social & Media, TA: 18-50 50k+. ‘000EqTRPs. Data owner is ITC.
Processed by “CCM” Subsidiary Enterprise
14%
72%
25%
18%
3%
-10%
-32%
-8%
-49%
-4%
TOP Advertisers 2016 vs 2015 Oct’16 vs Sep’16
Factor stopped its activity in October but that didn’t led to fall of Food category
Omega Pharma started activity of its brand Lactacyd but that didn’t stop Hygiene drop vs prev. Month
Kari and Lamoda.ua cut their investments and drove Trade category decrease vs 2015
L'Oreal decreased activity of 3 out of 4 active brands vs prev. Month

6 Source: http://goo.gl/XLBKNV
Activity of commercial TOP-categories have increased by 12% on TV market in the first nine months in 2016 compared with similar period of the last year. At the same time, activity of «Medicine» category has increased by 14%. Nestle & L'Oreal – unchangeable leaders for the second consecutive year. P&G is following by them, by increasing their activity. Pharmaceutical companies «Farmak», Reckitt Benckiser and Sanofi are in the TOP-15 Ukrainian advertisers according to the results of the first nine months of 2016 year.
Medicine commercial has increased on Ukrainian TV

“Segmentation of target audience – I’m rarely using thus thing on market. Because it doesn’t matter how to determine TA for TV commercial, it will be seen by practically all viewers anyway, especially older part of population. At the same time there are enough channels for the young segment of TA on the market, but sale system encourages package placement on the wide range of channels. Very slight amount of advertisers and agencies are planning with taking TA preferences into account, by abandoning unnecessary channels…”
Svetlana Kalinina about television audiences
Source: http://goo.gl/1Coc86
7

STB became the leader in three audiences at the same time in MB Top Channel research according to the October results*. «Ukraine» channel – at the head of TOP in another one. «Novyi Kanal» has the most noticeable growth of share.
TOP channels of October: three times STB & “Ukraine"
8
Research department of StarLightMedia group – StarLight Marketing – has done survey about viewers request for genres and topics of movies and soap operas. Response options weren’t offered to respondents, they named genres and topics themselves. Answers were encoded into appropriate category. The research results have shown, that Ukrainians are waiting comedies, historical and love movies from producers.
Comedy, history and love: StarLight Marketing has studied requests of
Ukrainians
Source: http://goo.gl/9JaLmF
Source: http://goo.gl/DIytuK
Main reasons of STB and Novyi growth: new season of TV shows launched. Thus it provides additional inventory for Alliance, which they are trying to sell to Advertisers.
Maxim Pozhar, TV Buying Group Head Zenith Ukraine

9

10
235,5
183,7
153,5
136,3
127,0
109,1
102,5
91,7
88,1
87,4
Carlsberg Group
Citrus
Nestle
Douwe Egberts
Kyivstar
Reckitt Benckiser
L'Oreal
Allo
Mondelez
Wargaming
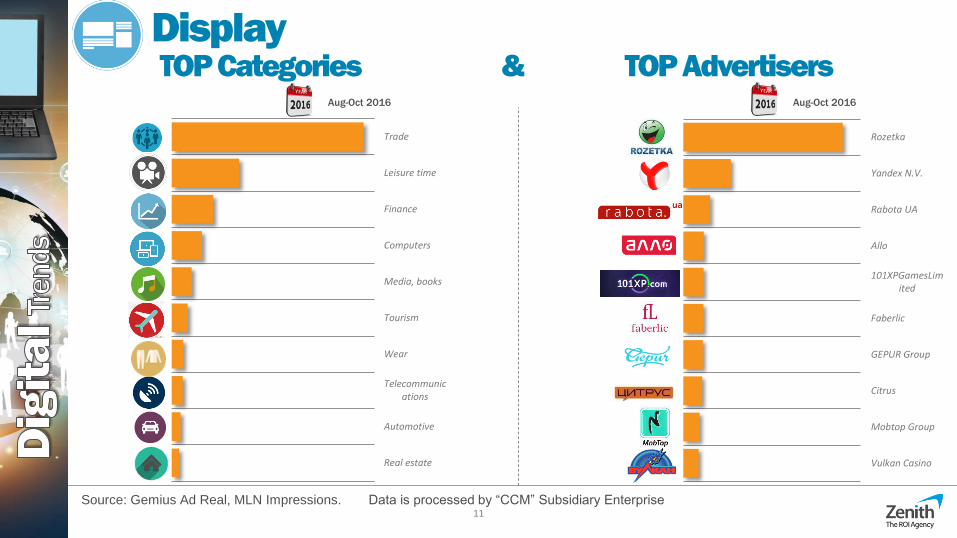
570,7
333,7
264,1
257,4
249,9
211,3
195,6
177,5
173,5
171,3
Trade
Leisure time
Alcohol
Hygiene
Telecommunications
Cold AFB
Culinary
Hot Beverages
Pharma
Confectionary
Apr-Oct 2016
Source: Gemius Ad Real, MLN Impressions. Data is processed by “CCM” Subsidiary Enterprise
Apr-Oct 2016
TOP Categories TOP Advertisers & VOD
11
Rozetka
Yandex N.V.
Rabota UA
Allo
101XPGamesLimited
Faberlic
GEPUR Group
Citrus
Mobtop Group
Vulkan Casino
Trade
Leisure time
Finance
Computers
Media, books
Tourism
Wear
Telecommunications
Automotive
Real estate
Aug-Oct 2016
Source: Gemius Ad Real, MLN Impressions. Data is processed by “CCM” Subsidiary Enterprise
Aug-Oct 2016
TOP Categories TOP Advertisers & Display

12
The most effective PPC channels have been announced
Source: https://goo.gl/9PPizq
Pinterest’s monthly user base hits 150 million people, up 50% from last year
Source: https://goo.gl/2CaxHf
Pinterest's audience base is growing and diversifying, but it still has a ways to go to catch up to Facebook, Instagram, Snapchat and Twitter.
Text ads are the most effective advertising PPC-channel, says a recent study made by Hanapin Marketing

13
Introducing Marketplace: Buy and Sell with Your Local Community
Source: http://newsroom.fb.com/news/2016/10/introducing-marketplace-buy-and-sell-with-your-local-community/
Digital-marketing in 2016. Infographics
Source: https://goo.gl/KJMjap
Authors presented a global image of user consumption, benchmarks and review of the most effective digital-marketing methods.
Facebook is where people connect, and in recent years more people have been using Facebook to connect in another way: buying and selling with each other. This activity started in Facebook Groups and has grown substantially. More than 450 million people visit buy and sell groups each month — from families in a local neighborhood to collectors around the world.

Trustpilot surveyed over 1,000 customers in the US about the importance of reading, writing and trusting online reviews.
14
How consumers use reviews and what you can learn from them
Source: https://goo.gl/WjVJ4U
7 hacks of new Adwords redactor
Source: https://goo.gl/dkFmqr
Author explores the potential impact of some new AdWords features.
It has become easier to load and update data, create filters; there are several new opportunities.

15

22,5
18,9
16,7
11,5
11,0
10,2
9,8
9,7
9,6
8,2
Fozzy Group
Epicenter
Sport Life
Lifecell
Riel
Vodafone
Privatbank
Samsung
Metro
K.A.N.Development
38%
0%
30%
57%
143%
8%
56%
-7%
-16%
-4%
223,5
149,7
88,7
66,6
46,8
40,1
27,1
27,1
24,2
16,9
Trade
Realty
Entertainment
Auto
Telecom
Finance
Sport
Restaurants
Medicine
Tourism
25%
80%
38%
53%
7%
24%
27%
26%
43%
62%
Fozzy Group drive Trade category growth vs prev. Year while Metro and Ashan vs prev. Month
Lifecell is the leader and the main driver of Telecom category growth vs prev. Year
Food category switched from 10th to 13th position driven by Snack Production fall
16 Source: Communication Alliance-OOH, Budget, Mln UAH. Data is processed by “CCM” Subsidiary
Enterprise
TOP Categories 2016 vs 2015 2016 vs 2015 TOP Advertisers
OOH market grew by 34% vs Jan-Oct’15

The operator of outdoor advertising "Prime Group" has entered into commercial operation online platform for planning and buying outdoor advertising OUTHUB.ONLINE. The new platform allows owners of out-of-home automation equipment sales and develop business in the intelligent ERP-system. OUTHUB.ONLINE brings together the operators of outdoor advertising with advertising agencies and advertisers who are interested in promoting their brands, products and services.
17
OUTHUB.ONLINE: the new reality of planning and buying outdoor advertising
Source: https://goo.gl/xXIGw5
Cherkassy hosted the 2nd International Conference on outdoor advertising
Modern trends in the advertising market and the steps that need to go to improve the visual appearance of the city, discussed in Cherkassy on the 2nd International Conference " Outdoor3 ." For the second consecutive year it collects dozens of leading national and international experts in the industry, business and government. As a result, group work, worked out joint proposals which plans to send to the Cabinet of Ministers of Ukraine.
Source: https://goo.gl/76VJdJ

The £20m of founding from the OHH industry is part of a new contract which will begin in April 2017. Over the six year period data will be collected from 43,200 people who will carry a bespoke multi-sensory tracking travel meter for 14 days to reveal how people move in all public spaces.
18
Route has renewed its out of home (OOH) advertising research project for another six years to enable the industry to access its insights and data to help better plan campaigns
Source: https://goo.gl/4a9yoZ
Is digital dumbing down out-of-home Working with similar technology as Google Goggles, it produces heat maps and allows advertisers to see which components of the poster are most likely to be noticed. Subsequent changes vary from minor brand logo or text edits to full scale revamping of the design, as happened with Mastercard where the original poster design, resembling a print ad, was completely replaced by a poster with genuine impact.
Source: https://goo.gl/qslVSR
19
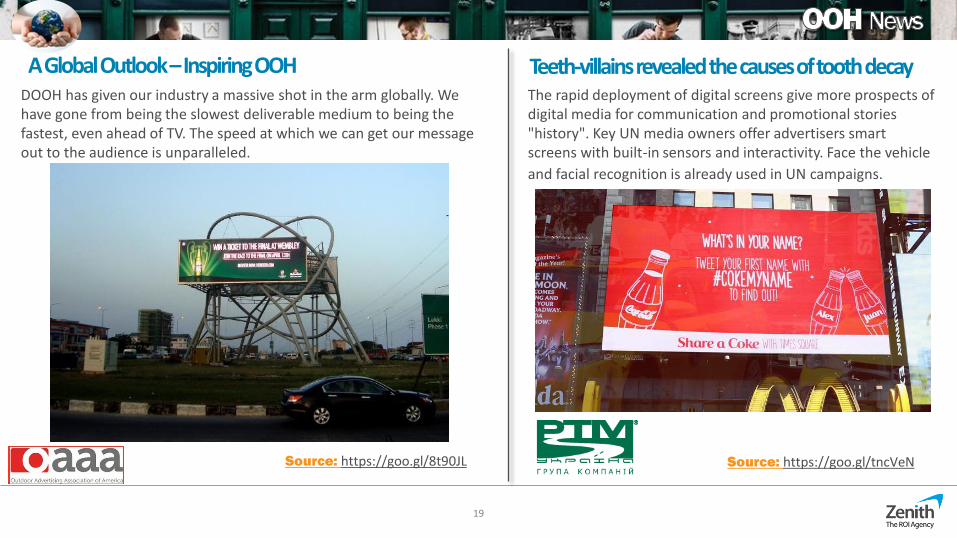
A Global Outlook – Inspiring OOH
Teeth-villains revealed the causes of tooth decay
Source: https://goo.gl/tncVeN
The rapid deployment of digital screens give more prospects of digital media for communication and promotional stories "history". Key UN media owners offer advertisers smart screens with built-in sensors and interactivity. Face the vehicle
and facial recognition is already used in UN campaigns.
DOOH has given our industry a massive shot in the arm globally. We have gone from being the slowest deliverable medium to being the fastest, even ahead of TV. The speed at which we can get our message out to the audience is unparalleled.
Source: https://goo.gl/8t90JL

20

20,6
12,9
8,8
8,5
8,0
5,8
5,3
4,9
4,8
4,7
L'Oreal
Seldiko
Olaynfarm
Hexagone
ChaneL
Fitobiotehnologii
UkrainianNational Lotery
Dalgakiran
Toyota
Procter&Gamble
39%
60%
269%
129%
38%
121%
85%
208%
343%
-34%
78,7
61,3
57,6
54,0
30,4
30,0
17,1
15,0
14,2
12,5
Trade
Entertainment
Cosmetics
Pharma
Wear
Auto
Finance
Perfumes
Jewellery
Restaurants
10%
16%
35%
56%
58%
20%
57%
-1%
-8%
-4%
New Zealand Auckland is new advertiser in Wear category.
This advertiser with Dirk Bikkembergs became the main drivers of category increase in October
OTP Bank drove Finance category drop vs prev. Year.
Obolon growth didn’t stop Alcohol activity decrease vs prev. Year.
Bayadera Logistik drove category growth vs prev. Month
21 Source: Communication Alliance, Budget, Mln UAH. Data is processed by “CCM” Subsidiary Enterprise
2016 vs 2015 2016 vs 2015 TOP Categories TOP Advertisers
Print market grew by 16% vs Jan-Oct’15
22
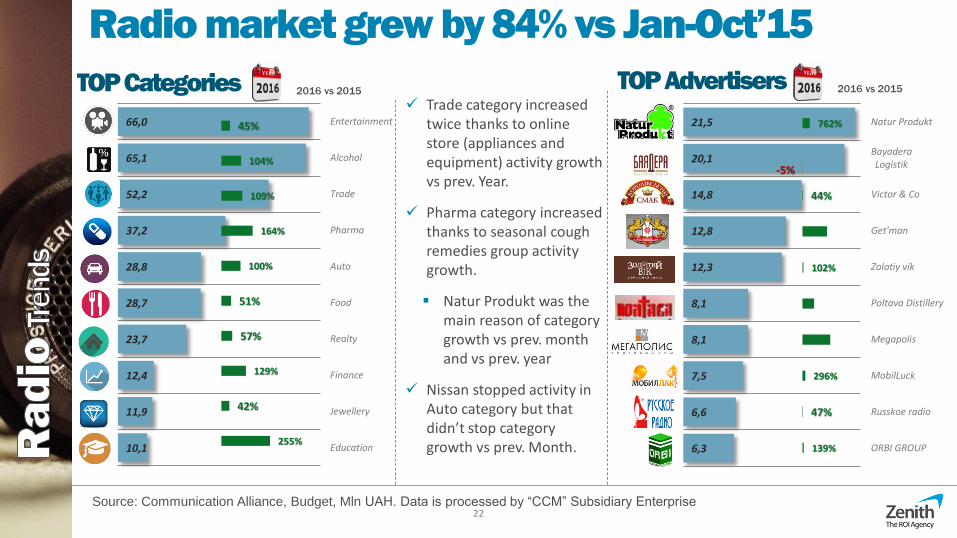
21,5
20,1
14,8
12,8
12,3
8,1
8,1
7,5
6,6
6,3
Natur Produkt
BayaderaLogistik
Victor & Co
Get'man
Zolotiy vik
Poltava Distillery
Megapolis
MobilLuck
Russkoe radio
ORBI GROUP
762%
44%
102%
296%
47%
139%
-5%
66,0
65,1
52,2
37,2
28,8
28,7
23,7
12,4
11,9
10,1
Entertainment
Alcohol
Trade
Pharma
Auto
Food
Realty
Finance
Jewellery
Education
45%
104%
109%
164%
100%
51%
57%
129%
42%
255%
Trade category increased twice thanks to online store (appliances and equipment) activity growth vs prev. Year.
Pharma category increased thanks to seasonal cough remedies group activity growth.
Natur Produkt was the main reason of category growth vs prev. month and vs prev. year
Nissan stopped activity in Auto category but that didn’t stop category growth vs prev. Month.
Source: Communication Alliance, Budget, Mln UAH. Data is processed by “CCM” Subsidiary Enterprise
2016 vs 2015 2016 vs 2015 TOP Categories TOP Advertisers
Radio market grew by 84% vs Jan-Oct’15

Under the new regulations, started from November 8, 2016, the share of Ukrainian songs broadcasted in the national language should be not less than 25% of the total time. Songs in the official languages of the European Union should be not less than 60% of all songs.
23
A law on quotas came into force
Source: https://goo.gl/Kg69U4

24

25
According to the results of Nielsen retail audit (RMS) in Ukraine, the market of non-food consumer goods (FMCG) shows the first signs of recovery in the first half of 2016 (+5% in May-Jun’16 vs May-Jun’15).
Ukrainian non-food FMCG market is showing growth for the first time
during the last 2 years
Source: https://goo.gl/aiX2yu
More than half of Ukrainian consumers claim that they feel anxious when their mobile device is not near them and 72% of consumers say that mobile device makes their lives better, reported Nielsen Mobile shopping, banking and payment research.
51% of consumers in Ukraine can not live without a mobile device
Source: https://goo.gl/25Lyuj
iVOX Ukraine conducted an online survey with 1075 respondents to figure out how Ukrainians use their credit cards.
74% of Ukrainian Internet audience use credit cards for online payments
Source: https://goo.gl/pCVwuX
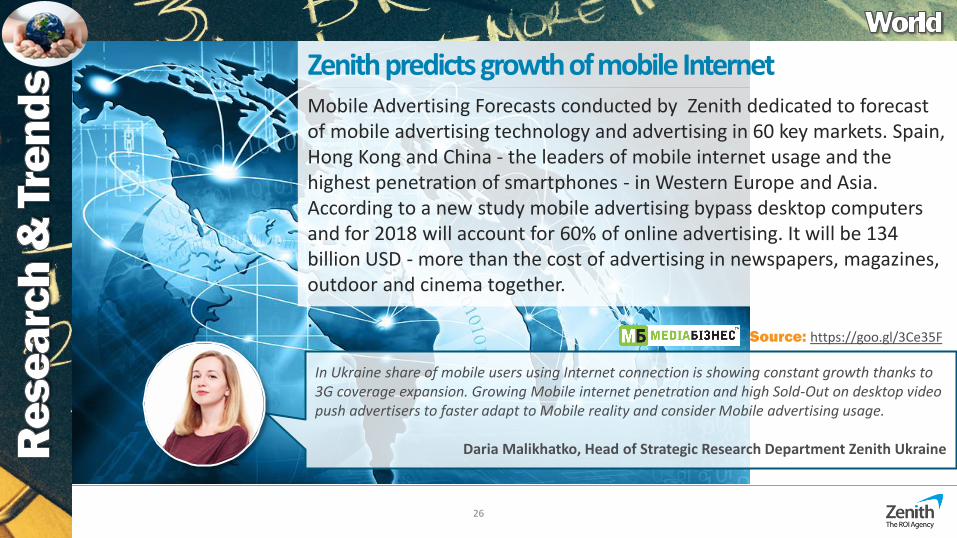
Mobile Advertising Forecasts conducted by Zenith dedicated to forecast of mobile advertising technology and advertising in 60 key markets. Spain, Hong Kong and China - the leaders of mobile internet usage and the highest penetration of smartphones - in Western Europe and Asia. According to a new study mobile advertising bypass desktop computers and for 2018 will account for 60% of online advertising. It will be 134 billion USD - more than the cost of advertising in newspapers, magazines, outdoor and cinema together.
.
26
Zenith predicts growth of mobile Internet
Source: https://goo.gl/3Ce35F
In Ukraine share of mobile users using Internet connection is showing constant growth thanks to 3G coverage expansion. Growing Mobile internet penetration and high Sold-Out on desktop video push advertisers to faster adapt to Mobile reality and consider Mobile advertising usage.
Daria Malikhatko, Head of Strategic Research Department Zenith Ukraine

27
Marketing before and after a digital transformation revolves around how customers see some business. Daniel Newman, Principal Analyst of Futurum Research and CEO of Broadsuite Media Group, tells how to stay focused, to create dialogue and increase conversion in 2017.
Top 10 trends of marketing in 2017
Source: https://goo.gl/BgxeIm
The main challenge for most marketers today is the need to develop SMM-promotion strategy. The article describes the main events and launches, which took place in social media and had a marked influence on the development of the industry.
Top 10 SMM trends for 2017
Source: https://goo.gl/4WxEPp
7 impending PPC trends This year there are new trends in audience targeting, helping companies to communicate with the target audience and more effectively promote products and services. Paid search is still in favor with the organizations that want to assert themselves on the world's largest market - the Internet. This article describes the top-7 PPC trends that will help brands to stay afloat.
Source: https://goo.gl/Nta1WP

28
Mobile devices are the most rapidly growing advertising channel Advertising spending on mobile will grow by 47.1% this year and by 34.2% in 2017. Mobile devices will become the third largest global advertising channel at the end of 2016
https://goo.gl/5j3EYu
https://goo.gl/Kg9dvU
https://goo.gl/QvLNC1
https://goo.gl/EHJgDf
How do consumers relate to the brand’s Emoji? Based on Emogi platform infographics, 59% of consumers would like to use branded beer Emoji. And 43% would prefer to use Pepsi Emoji instead of the standard smile
Plurals: Things marketers need to know about Gen Z A survey conducted last year by digital agency Deep Focus found that 63 percent of Gen Z prefers to see “real” people in ads, while just 37 percent favor celebrities
Number of mobile users exceeded the number of desktop users According to the StatCounter, number of mobile connections to sites all over the world for the first time exceeded the number of desktop in October 2016 .

29 * Click on the image works as direct link to the Source

30
Thank You!