mediated reality and location awareness to facilitate ... · mediated reality and location...
TRANSCRIPT
Mediated reality and location awareness to facilitate
topographical orientation
by
Jorge Torres-Solis
A thesis submitted in conformity with the requirementsfor the degree of Doctor of Philosophy
Graduate Department of Electrical and computing engineeringUniversity of Toronto
Copyright c© 2009 by Jorge Torres-Solis
Abstract
Mediated reality and location awareness to facilitate topographical orientation
Jorge Torres-Solis
Doctor of Philosophy
Graduate Department of Electrical and computing engineering
University of Toronto
2009
Topographical orientation is the ability to orient oneself within the environment and to
navigate through it to specific destinations. Topographical disorientation (TD) refers to
deficits in orientation and navigation in the real environment, and is a common sequela
of brain injuries. People with TD often have difficulties interacting with and perceiving
the surrounding environment. The literature suggests that patients with TD are likely to
benefit from research leading to clinical standards of practice and technology to facilitate
topographical orientation.
In the light of the above, the objectives of this thesis were to investigate methods of
realizing a context-aware, wearable mediated environment system for indoor navigation,
and to develop a standard method of quantifying the impact of such a system on indoor
navigation task performance.
In realizing these objectives, we first conducted an extensive literature review of in-
door localization systems. This review served to identify potential technologies for an
indoor, in-situ wayfinding assistive device. Subsequently, an automated navigation algo-
rithm was designed. Our algorithm reduced the navigational effort of simulated patients
with topographical disorientation while accounting for the physical abilities of the patient,
environmental barriers and dynamic building changes. We introduced and demonstrated
a novel energy-based wayfinding metric, which is independent of route complexity. An
experiment was conducted to identify preferred graphical navigation tools for mediated
ii
reality wayfinding guidance. Different combinations of spatial knowledge, graphical pre-
sentations and reference frames were considered in the experiment. The data suggested
that the locator and minimap are the preferred navigational tools. Two unique optical-
inertial localization systems for real-time indoor human tracking were created. The first
localization system was oriented to pedestrians, while the second was implemented on
a wheelchair. Empirical tests produced localization accuracies comparable to those re-
ported in literature. Finally, a fully operational mediated reality location aware system
for indoor navigation was realized. Tests with human participants indicated a significant
reduction in physical effort in comparison to the no-tool condition, during wayfinding
tasks in an unfamiliar indoor environment. Collectively, the findings and developments
of this thesis lay the foundation for future research on wearable, location-based naviga-
tional assistance for individuals with wayfinding difficulties.
iii
Dedication
To my parents Jorge and Lucila, and to my sisters Judith, Yareni and Lucila, who have
always supported any endeavor that I decide to embark myself into. To my extended
family, who have always been enthusiastic followers of my academic progress. Thanks to
Sergio Torres, Pilar Fernandez, Fernando Solıs, Susana Paz, just to mention a few of my
relatives who deserve to be mentioned here.
To my friends in Canada. Jorge Silva, Ana Cano, Manuel Saldana and Claudia
Sanchez, who have been a little piece of Mexico outside of Mexico, making me feel at
home when I have most needed it. And Ela Beres, Hugo Bonilla, Sophie Constancias,
Carolina Rouleau, Clayton Oliver, Stefanie Blain and Chris Moraes, among a long list of
people who should be mentioned here, and I greatly regret to make tacit in the face of
space constraints. Thank you all for being my family away from home.
To Rebecca Studin, who has been an enthusiast witness of my life, sharing good
and bad moments in the last months prior to the completion of this thesis, which were
challenging and exciting.
To my laboratory peers, who have greatly supported this work and whose contribu-
tions and input have been extremely important for its successful completion, but more
importantly, whose friendship has been invaluable during difficult moments.
To my former work collaborators. Alvaro Arroyo and Marc Javnozon, two of my
early mentors from whom I learned not only about engineering and business, but about
friendship. To Leon Colon, who has been a work peer, but more importantly a loyal
friend. To Ignacio Mejia, who has always believed in me, extending his support whenever
needed.
To my supervisor, Tom Chau, from whom I have learned important communication
and research skills, and whose enthusiasm and energy are a source of inspiration.
To all the people listed here, and many more that I would like to mention, thank you.
This work would not have been accomplished without you.
iv

Jorge
v
Contents
0.1 Acronyms used in the thesis . . . . . . . . . . . . . . . . . . . . . . . . . xii
1 Introduction 1
1.1 Topographical orientation . . . . . . . . . . . . . . . . . . . . . . . . . . 1
1.2 Deficits in topographical orientation . . . . . . . . . . . . . . . . . . . . . 1
1.3 Literature review of existing studies on topographical disorientation reha-
bilitation and treatment . . . . . . . . . . . . . . . . . . . . . . . . . . . 3
1.3.1 Motivation . . . . . . . . . . . . . . . . . . . . . . . . . . . . . . . 3
1.3.2 Article selection and inclusion/exclusion criteria . . . . . . . . . . 3
1.3.3 Review of selected studies . . . . . . . . . . . . . . . . . . . . . . 4
1.3.4 Conclusion . . . . . . . . . . . . . . . . . . . . . . . . . . . . . . . 8
1.4 Objectives . . . . . . . . . . . . . . . . . . . . . . . . . . . . . . . . . . . 9
1.5 Roadmap . . . . . . . . . . . . . . . . . . . . . . . . . . . . . . . . . . . 9
2 A review of indoor localization technologies 11
2.1 Abstract . . . . . . . . . . . . . . . . . . . . . . . . . . . . . . . . . . . . 11
2.2 Introduction . . . . . . . . . . . . . . . . . . . . . . . . . . . . . . . . . . 12
2.3 Literature selection . . . . . . . . . . . . . . . . . . . . . . . . . . . . . . 13
2.3.1 Taxonomy of localization technologies . . . . . . . . . . . . . . . . 14
2.4 Radio Frequency . . . . . . . . . . . . . . . . . . . . . . . . . . . . . . . 17
2.4.1 Personal and local area network-based solutions . . . . . . . . . . 18
vi
2.4.2 Broadcast and wide area network solutions . . . . . . . . . . . . . 22
2.4.3 Solutions based on RFID tags . . . . . . . . . . . . . . . . . . . . 23
2.4.4 Solutions based on a radio frequency radar . . . . . . . . . . . . . 25
2.4.5 Limitations . . . . . . . . . . . . . . . . . . . . . . . . . . . . . . 26
2.5 Photonic energy . . . . . . . . . . . . . . . . . . . . . . . . . . . . . . . . 27
2.5.1 Image analysis, natural feature extraction and recognition . . . . 28
2.5.2 Image analysis, fiducial markers . . . . . . . . . . . . . . . . . . . 33
2.5.3 Other photonic sensors . . . . . . . . . . . . . . . . . . . . . . . . 35
2.5.4 Limitations . . . . . . . . . . . . . . . . . . . . . . . . . . . . . . 37
2.6 Localization detection based on sonic waves . . . . . . . . . . . . . . . . 39
2.6.1 Limitations . . . . . . . . . . . . . . . . . . . . . . . . . . . . . . 41
2.7 Localization detection based on inertial or mechanical sensors . . . . . . 42
2.7.1 Localization detection based on mechanical coupling or activation 43
2.7.2 Localization detection based on inertial sensors . . . . . . . . . . 44
2.7.3 Limitations . . . . . . . . . . . . . . . . . . . . . . . . . . . . . . 45
2.8 Other localization technologies . . . . . . . . . . . . . . . . . . . . . . . . 46
2.9 Discussion . . . . . . . . . . . . . . . . . . . . . . . . . . . . . . . . . . . 46
2.9.1 Recommendations . . . . . . . . . . . . . . . . . . . . . . . . . . . 46
3 A flexible routing scheme 50
3.1 abstract . . . . . . . . . . . . . . . . . . . . . . . . . . . . . . . . . . . . 50
3.2 Background . . . . . . . . . . . . . . . . . . . . . . . . . . . . . . . . . . 51
3.2.1 Selective routing . . . . . . . . . . . . . . . . . . . . . . . . . . . 53
3.3 Proposed method . . . . . . . . . . . . . . . . . . . . . . . . . . . . . . . 54
3.3.1 Database . . . . . . . . . . . . . . . . . . . . . . . . . . . . . . . 54
3.3.2 Generation of a weighted connected graph . . . . . . . . . . . . . 55
3.3.3 Routing scheme . . . . . . . . . . . . . . . . . . . . . . . . . . . . 58
3.4 Simulations . . . . . . . . . . . . . . . . . . . . . . . . . . . . . . . . . . 59
vii
3.4.1 Patient simulator . . . . . . . . . . . . . . . . . . . . . . . . . . . 59
3.4.2 Simulation of patients with topographical disorientation . . . . . 60
3.4.3 Simulation of patients with physical disabilities . . . . . . . . . . 61
3.4.4 Simulation of changing building conditions . . . . . . . . . . . . . 62
3.4.5 Simulation of a complex scenario . . . . . . . . . . . . . . . . . . 62
3.5 Results . . . . . . . . . . . . . . . . . . . . . . . . . . . . . . . . . . . . . 63
3.6 Discussion . . . . . . . . . . . . . . . . . . . . . . . . . . . . . . . . . . . 65
3.6.1 Potential clinical applications . . . . . . . . . . . . . . . . . . . . 65
3.6.2 Limitations and future work . . . . . . . . . . . . . . . . . . . . . 67
3.7 Conclusions . . . . . . . . . . . . . . . . . . . . . . . . . . . . . . . . . . 68
3.8 Acknowledgements . . . . . . . . . . . . . . . . . . . . . . . . . . . . . . 68
3.9 Competing interests . . . . . . . . . . . . . . . . . . . . . . . . . . . . . . 69
3.10 Authors contributions . . . . . . . . . . . . . . . . . . . . . . . . . . . . 69
4 Navigation in smart environments 72
4.1 abstract . . . . . . . . . . . . . . . . . . . . . . . . . . . . . . . . . . . . 72
4.2 Introduction . . . . . . . . . . . . . . . . . . . . . . . . . . . . . . . . . . 73
4.2.1 Topographical Disorientation . . . . . . . . . . . . . . . . . . . . 73
4.2.2 Spatial knowledge . . . . . . . . . . . . . . . . . . . . . . . . . . . 74
4.2.3 Navigation tools . . . . . . . . . . . . . . . . . . . . . . . . . . . . 75
4.2.4 Mediated reality location aware system . . . . . . . . . . . . . . . 76
4.3 Methods . . . . . . . . . . . . . . . . . . . . . . . . . . . . . . . . . . . . 79
4.3.1 Participants . . . . . . . . . . . . . . . . . . . . . . . . . . . . . . 79
4.3.2 Test environment . . . . . . . . . . . . . . . . . . . . . . . . . . . 80
4.3.3 Navigation tool design . . . . . . . . . . . . . . . . . . . . . . . . 81
4.3.4 Experiment design . . . . . . . . . . . . . . . . . . . . . . . . . . 84
4.3.5 Objective navigation metric . . . . . . . . . . . . . . . . . . . . . 85
4.4 Results . . . . . . . . . . . . . . . . . . . . . . . . . . . . . . . . . . . . . 89
viii

4.5 Discusion . . . . . . . . . . . . . . . . . . . . . . . . . . . . . . . . . . . 93
4.5.1 Key Findings . . . . . . . . . . . . . . . . . . . . . . . . . . . . . 93
4.5.2 Study limitations . . . . . . . . . . . . . . . . . . . . . . . . . . . 94
4.6 Conclusions . . . . . . . . . . . . . . . . . . . . . . . . . . . . . . . . . . 95
4.7 Acknowledgements . . . . . . . . . . . . . . . . . . . . . . . . . . . . . . 95
5 Pedestrian dead reckoning system 96
5.1 abstract . . . . . . . . . . . . . . . . . . . . . . . . . . . . . . . . . . . . 96
5.2 Introduction . . . . . . . . . . . . . . . . . . . . . . . . . . . . . . . . . . 97
5.2.1 Motivation . . . . . . . . . . . . . . . . . . . . . . . . . . . . . . . 98
5.3 System Design . . . . . . . . . . . . . . . . . . . . . . . . . . . . . . . . . 100
5.3.1 Hardware set-up . . . . . . . . . . . . . . . . . . . . . . . . . . . 100
5.3.2 Reference frames . . . . . . . . . . . . . . . . . . . . . . . . . . . 101
5.3.3 Software . . . . . . . . . . . . . . . . . . . . . . . . . . . . . . . . 102
5.4 Experiments . . . . . . . . . . . . . . . . . . . . . . . . . . . . . . . . . . 104
5.4.1 Experiment initialization . . . . . . . . . . . . . . . . . . . . . . . 104
5.4.2 Sensor calibration . . . . . . . . . . . . . . . . . . . . . . . . . . . 104
5.4.3 Walking tasks . . . . . . . . . . . . . . . . . . . . . . . . . . . . . 105
5.5 Position and orientation estimation . . . . . . . . . . . . . . . . . . . . . 106
5.5.1 Emulation of uniform data sampling . . . . . . . . . . . . . . . . 107
5.5.2 Acceleration, velocity and distance travelled by the ankle . . . . . 108
5.5.3 Zero-velocity updates for accelerometry signals . . . . . . . . . . . 109
5.5.4 User bearing . . . . . . . . . . . . . . . . . . . . . . . . . . . . . . 110
5.5.5 Position update rule . . . . . . . . . . . . . . . . . . . . . . . . . 111
5.6 Analysis of empirical data . . . . . . . . . . . . . . . . . . . . . . . . . . 112
5.6.1 Performance metrics . . . . . . . . . . . . . . . . . . . . . . . . . 112
5.7 Results . . . . . . . . . . . . . . . . . . . . . . . . . . . . . . . . . . . . . 114
5.8 Discussion . . . . . . . . . . . . . . . . . . . . . . . . . . . . . . . . . . . 117
ix
5.8.1 Key findings . . . . . . . . . . . . . . . . . . . . . . . . . . . . . . 117
5.8.2 Study limitations . . . . . . . . . . . . . . . . . . . . . . . . . . . 117
5.9 Conclusions . . . . . . . . . . . . . . . . . . . . . . . . . . . . . . . . . . 119
5.10 Acknowledgements . . . . . . . . . . . . . . . . . . . . . . . . . . . . . . 119
6 Mediated Reality Location Aware System (MERLA) 121
6.1 abstract . . . . . . . . . . . . . . . . . . . . . . . . . . . . . . . . . . . . 121
6.2 Introduction . . . . . . . . . . . . . . . . . . . . . . . . . . . . . . . . . . 122
6.3 Methods . . . . . . . . . . . . . . . . . . . . . . . . . . . . . . . . . . . . 124
6.3.1 Participants . . . . . . . . . . . . . . . . . . . . . . . . . . . . . . 124
6.3.2 Reference frames . . . . . . . . . . . . . . . . . . . . . . . . . . . 124
6.3.3 Localization system . . . . . . . . . . . . . . . . . . . . . . . . . . 125
6.3.4 Mediated reality navigation tools . . . . . . . . . . . . . . . . . . 127
6.3.5 Test environment . . . . . . . . . . . . . . . . . . . . . . . . . . . 127
6.3.6 Experiment design . . . . . . . . . . . . . . . . . . . . . . . . . . 129
6.3.7 Data analysis . . . . . . . . . . . . . . . . . . . . . . . . . . . . . 132
6.4 Results . . . . . . . . . . . . . . . . . . . . . . . . . . . . . . . . . . . . . 132
6.5 Discussion . . . . . . . . . . . . . . . . . . . . . . . . . . . . . . . . . . . 136
6.5.1 Merits of location-based navigational assistance . . . . . . . . . . 136
6.5.2 Spatial learning effects . . . . . . . . . . . . . . . . . . . . . . . . 136
6.5.3 Head versus body referencing . . . . . . . . . . . . . . . . . . . . 137
6.5.4 System limitations . . . . . . . . . . . . . . . . . . . . . . . . . . 137
6.5.5 Study limitations . . . . . . . . . . . . . . . . . . . . . . . . . . . 138
6.5.6 Future work . . . . . . . . . . . . . . . . . . . . . . . . . . . . . . 139
6.6 Conclusion . . . . . . . . . . . . . . . . . . . . . . . . . . . . . . . . . . . 139
6.7 Acknowledgements . . . . . . . . . . . . . . . . . . . . . . . . . . . . . . 139
x

7 Contributions 140
7.1 Publications . . . . . . . . . . . . . . . . . . . . . . . . . . . . . . . . . . 141
Bibliography 142
xi
0.1 Acronyms used in the thesis
AoA angle of arrival
BLUPS Bluetooth and Ultrasound Positioning System
DS/CDM Direct Sequence Code Division Multiplexing
DToA difference of time of arrival
ERATIO Energy expenditure ratio
GPS Global Positioning System
HMD Head Mounted Display
IR Infrared
IrDA Infrared Data Association
LOS Line-of-sight
MERLA Mediated Reality Location Aware system
MR Mediated Reality
NLOS Non-Line-of-sight
OSPF Open Shortest Path First
PC Probability of confusion
PDA Personal Digital Assistant
RDS root-mean-square delay spread
RF Radio Frequency
xii
RFID Radio-frequency Identification
RSS Received Signal Strength
ToA time of arrival
ToF time of flight
TD Topographical Disorientation
TV television
UWB Ultra-Wideband
WLAN Wireless Local Area Network
xiii
Chapter 1
Introduction
1.1 Topographical orientation
Topographical orientation is the ability to orient oneself within the environment and to
navigate through it to specific destinations [13]. Through recent magnetic resonance
imaging studies, specific structures such as the parahippocampal gyrus [163], parietal
cortex [99] and temporal cortical areas [178] have been implicated as neural mechanisms
for topographical orientation.
It is generally agreed that in normative way-finding, humans employ a number of
different way-finding strategies, including landmark recognition, route learning and map-
like (also known as survey) representations of the environment [3]. The particular choice
of strategy is dependent on the individualal’s developmental age, the familiarity with the
environment, the manner by which the environment was introduced, the level of detail
in the environment and the specific navigational task at hand.
1.2 Deficits in topographical orientation
Topographical disorientation (TD) generally refers to the family of deficits in orientation
and navigation in the real environment. Aguirre and D’Esposito (1999) [3] note that
1
Chapter 1. Introduction 2
difficulties in way-finding may arise from a variety of different cognitive impairments and
provide a well-accepted taxonomy of TD. Many different types of lesions and injuries
may result in topographical disorientation.
People living with post-traumatic effects of brain injury often have symptoms such
as weakness in visual scanning skills, complex attention, prospective memory and se-
quential processing [90]. These symptoms can lead to problems of interaction with and
perception of the surrounding environment, even several years post-injury [36, 145]. It
is well recognized that topographical disorientation [179] and spatial navigation deficits
[156] are common sequelae of brain injury.
The interruption of blood flow to the brain due to a blood clot (ischemic stroke)
or uncontrolled bleeding in the brain (hemorrhagic stroke) is another common cause of
diminished cognitive abilities such as memory, attention and topographical orientation
[75, 107, 178, 91].
In addition to patients with stroke or brain injuries, topographical disorientation has
been reported in patients with Alzheimer’s disease [111], transient topographical amnesia
[161], unilateral temporal lobe lesions [92], brain tumours such as glioblastomas in the
right hemisphere [29] and posterior cortical atrophy [70].
The literature suggests that deficits in topographical orientation can lead to spatial
anxiety conditions or wandering behaviours [19, 161, 179]. Consequently, research focused
on the development of tools that can be beneficial to patients with TD is required.
Wayfinding assistive technologies are examples of such tools.
Chapter 1. Introduction 3
1.3 Literature review of existing studies on topo-
graphical disorientation rehabilitation and treat-
ment
1.3.1 Motivation
From a survey of the literature, we observed that several research articles in topographical
disorientation focus on its etiology, classification or the identification of its neuroanatom-
ical correlates [178, 20, 14, 3, 13, 179], while others present case studies [54, 176, 98].
However, we noticed a paucity of literature on the rehabilitation and treatment of
topographical disorientation. Our findings were supported by observations by other au-
thors. Barrash et al. (2000) [14] state that most case studies in topographical disori-
entation do not assess the patient’s condition over time, thereby limiting the capability
of analyzing the long-term persistence of topographical disorientation. Brunsdon et al.
(2007) [19] remark that aside from their own work, they could only locate one other
article, namely a case study by Davis & Coltheart (1999) [33], in which the topic of
rehabilitation for topographical disorientation is addressed.
Therefore we decided to conduct a survey of the existing literature on the field of TD
rehabilitation to confirm the suspicion that there is at present paucity of literature on
the rehabilitation and treatment of topographical disorientation.
1.3.2 Article selection and inclusion/exclusion criteria
A search was conducted, looking for peer reviewed articles related to 1) topographical dis-
orientation, topographical amnesia or topographical agnosia, which presented evidence of
rehabilitation after one year, or 2) research presenting systematic treatment and rehabil-
itation techniques for topographical disorientation. To this end, we defined the following
inclusion criteria, the article must:
Chapter 1. Introduction 4
1. Focus on topographical disorientation or any condition related to it (for instance,
spatial perception or wayfinding difficulties); and
2. Present evidence towards the development of a treatment of the condition, and
3. Have been written in or translated into English, French or Spanish.
We conducted a literature search for articles published after 1998 in three academic
databases, namely PubMed, Scopus and MedLine. Specifically, we searched for the words
“topographical”, “(dis)orientation”, “wayfindig” and “navigation” in proximity to the
words “rehabilitation”, “treatment” and “therapy”. In combination, this search returned
108 articles (up to June, 2007). However, many of the retrieved articles did not have
any relationship with topographical disorientation or any related conditions, and some of
them were related to topographical disorientation, but they did not address the rehabil-
itation or treatment for topographical disorientation. Hence, only five articles matched
the inclusion criteria. In the next section we present a survey of the articles selected.
1.3.3 Review of selected studies
Grossie et al. (2007) [56] report a case study of a patient with difficulties navigating
in unfamiliar outdoor environments. The patient was known to be clever at selecting
optimal driving routes prior to onset of the condition. At onset, the patient did not
present with any other cognitive disability other than mild deficits in spatial and con-
structional abilities. The patient’s condition was monitored for three years, accompanied
by psychometric tests and MRI, PET and EEG studies on the patient at different stages.
The condition of the patient degenerated over time, initially presenting difficulties to
navigate in unfamiliar environments, progressing to difficulties in navigating familiar en-
vironments, and finally reaching a point in which the patient could no longer navigate
through his own house, other than by trial and error. The condition eventually evolved
into a case of Alzheimer’s disease. The authors suggest that topographical disorienta-
Chapter 1. Introduction 5
tion can result from neurodegenerative processes in brain structures and therefore can
be progressive.
Brunsdon et al. (2007) [19] present the case of a six year old infant with topographical
disorientation named CA in the study. CA was trained in route finding and recognition of
landmarks and buildings in his school. The authors noticed that although CA presented
severe impairments in spatial learning and topographical skills, and moderate visual ag-
nosia (difficulty recognizing familiar landmarks or objects), CA was able to follow verbal
cues consisting of few steps between familiar landmarks (i.e. go to the red wall and then
downstairs). However, he was unable to follow directional verbal instructions (i.e. turn
left and walk two steps). The treatment for CA was designed in several steps to allow
measurement of treatment effects independent of spontaneous recovery or other devel-
opmental factors. Four variables were measured during route-following tasks at school,
namely, the percentage of routes failed, the percentage of steps failed (intermediate steps
to reach the final destination), total number of hesitations (stopping in confusion for
more than 2 seconds), and the total time taken to reach the desired destination. A
set of routes at CA’s school was defined. CA received training for half of these routes
and no training for the remaining routes (control condition). CA showed improvement
in route navigation (in terms of the four wayfinding metrics identified above) for the
group of routes for which he was trained, but not for the routes in the control condition.
These results suggest beneficial effects of the reported treatment in the rehabilitation of
topographical disorientation in the pediatric population.
Antonakos (2004) [8] conducted a study on the compensatory techniques used by
people with topographical disorientation in daily life situations. The rationale was that
these compensatory strategies might be incorporated into a suitable treatment for TD.
Antonakos emphasized the importance of real world wayfinding tests over tests of ab-
stract spatial abilities, which do not yield information about compensatory techniques.
The author selected three individuals who experienced navigational difficulties in familiar
Chapter 1. Introduction 6
environments due to visuo-spatial impairments. The individuals included in the study
could navigate independently and communicate clearly. The author visited the individ-
uals at home, and had them to complete a set of structured tasks, the first being a
navigation task. Participants were asked to navigate inside their homes, while the ex-
aminer followed closely, taking notes of navigational strategies. The second task was an
object location task. The examiner affixed a piece of red paper at eye level in a room.
Participants were asked to locate this piece of paper. The examiner subsequently ques-
tioned the participants about the strategies deployed. The third task was a mapping
task. The examiner had the participants describe what they saw when they imagined
coming home through the front door. The fourth task was a recall task about places
frequented outside of the home. Participants listed places they could visit independently,
and the strategies used to find these places and navigate within them. Participants were
also asked about the usefulness of maps and their map-drawing abilities.
Based on the above test battery, the author observed differences in the severity of
topographical disorientation among participants. Consequently, individual wayfinding
strategies varied, consisting of different combinations of landmark detection, visual scan-
ning, landmark sequencing, and body position reconfiguration. The author concluded
that: navigational independence and the severity of topographical disorientation is case-
dependent; compensatory strategies of choice vary according to individual capacity and
needs; and, visual scanning and the use of landmarks seem to be strategies of choice. An-
tonakos recommended further studies, in order to develop means to support independent
navigation for people with topographical disorientation.
Stracciari et al. (2002) [161] studied twelve patients with isolated cases of temporary
topographical amnesia (TTA). Temporary topographical amnesia refers to the temporary
inability to recall the route or spatial relationships among elements in the environment,
while retaining the capability of recognizing the individual elements themselves. These
patients did not present any signs of neurological deterioration. The authors performed
Chapter 1. Introduction 7
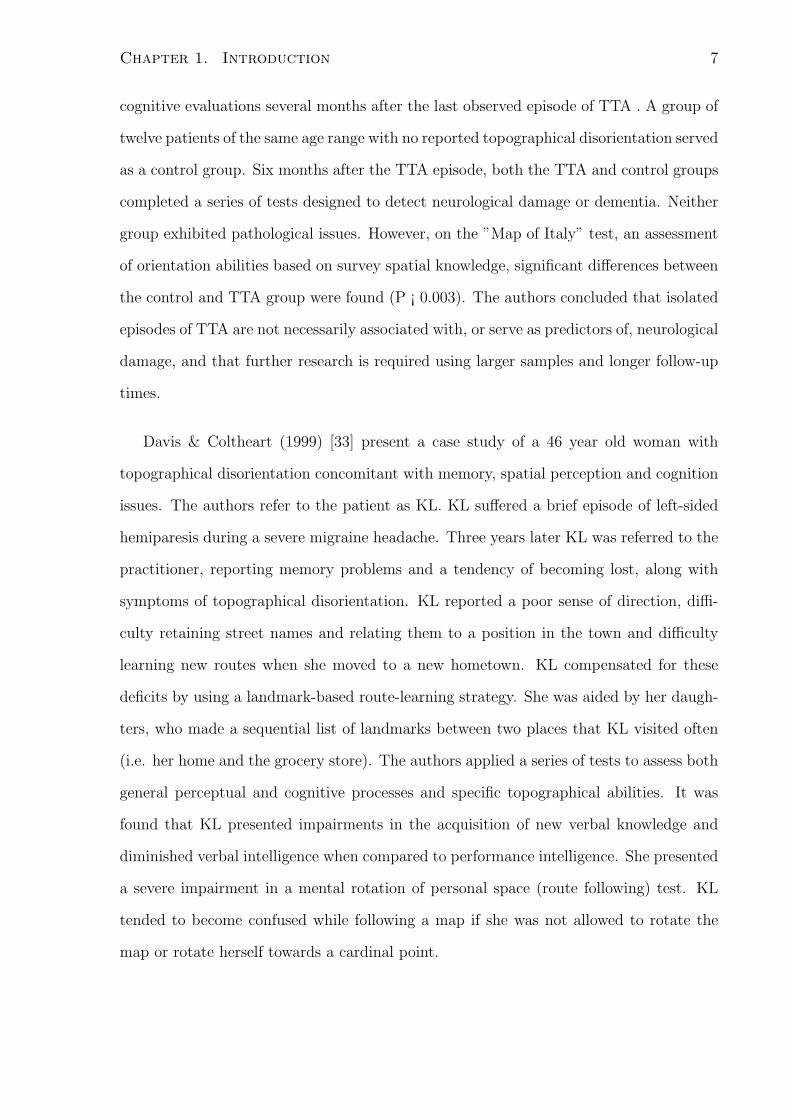
cognitive evaluations several months after the last observed episode of TTA . A group of
twelve patients of the same age range with no reported topographical disorientation served
as a control group. Six months after the TTA episode, both the TTA and control groups
completed a series of tests designed to detect neurological damage or dementia. Neither
group exhibited pathological issues. However, on the ”Map of Italy” test, an assessment
of orientation abilities based on survey spatial knowledge, significant differences between
the control and TTA group were found (P ¡ 0.003). The authors concluded that isolated
episodes of TTA are not necessarily associated with, or serve as predictors of, neurological
damage, and that further research is required using larger samples and longer follow-up
times.
Davis & Coltheart (1999) [33] present a case study of a 46 year old woman with
topographical disorientation concomitant with memory, spatial perception and cognition
issues. The authors refer to the patient as KL. KL suffered a brief episode of left-sided
hemiparesis during a severe migraine headache. Three years later KL was referred to the
practitioner, reporting memory problems and a tendency of becoming lost, along with
symptoms of topographical disorientation. KL reported a poor sense of direction, diffi-
culty retaining street names and relating them to a position in the town and difficulty
learning new routes when she moved to a new hometown. KL compensated for these
deficits by using a landmark-based route-learning strategy. She was aided by her daugh-
ters, who made a sequential list of landmarks between two places that KL visited often
(i.e. her home and the grocery store). The authors applied a series of tests to assess both
general perceptual and cognitive processes and specific topographical abilities. It was
found that KL presented impairments in the acquisition of new verbal knowledge and
diminished verbal intelligence when compared to performance intelligence. She presented
a severe impairment in a mental rotation of personal space (route following) test. KL
tended to become confused while following a map if she was not allowed to rotate the
map or rotate herself towards a cardinal point.
Chapter 1. Introduction 8
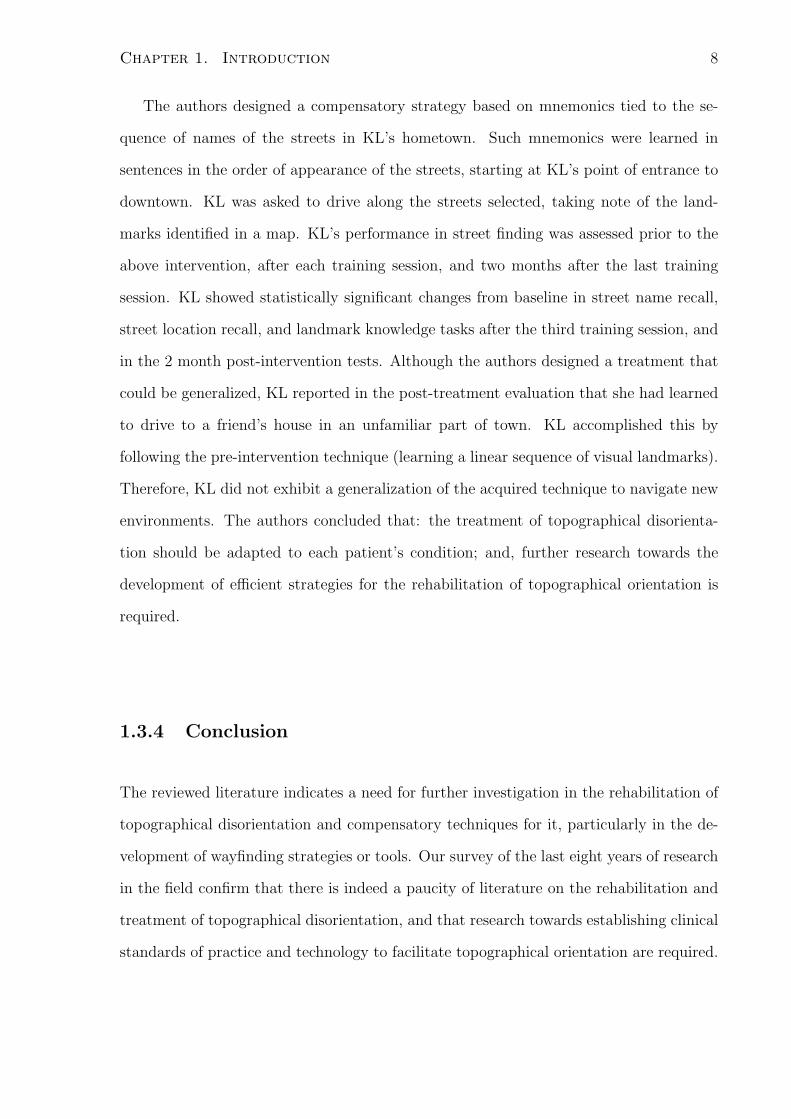
The authors designed a compensatory strategy based on mnemonics tied to the se-
quence of names of the streets in KL’s hometown. Such mnemonics were learned in
sentences in the order of appearance of the streets, starting at KL’s point of entrance to
downtown. KL was asked to drive along the streets selected, taking note of the land-
marks identified in a map. KL’s performance in street finding was assessed prior to the
above intervention, after each training session, and two months after the last training
session. KL showed statistically significant changes from baseline in street name recall,
street location recall, and landmark knowledge tasks after the third training session, and
in the 2 month post-intervention tests. Although the authors designed a treatment that
could be generalized, KL reported in the post-treatment evaluation that she had learned
to drive to a friend’s house in an unfamiliar part of town. KL accomplished this by
following the pre-intervention technique (learning a linear sequence of visual landmarks).
Therefore, KL did not exhibit a generalization of the acquired technique to navigate new
environments. The authors concluded that: the treatment of topographical disorienta-
tion should be adapted to each patient’s condition; and, further research towards the
development of efficient strategies for the rehabilitation of topographical orientation is
required.
1.3.4 Conclusion
The reviewed literature indicates a need for further investigation in the rehabilitation of
topographical disorientation and compensatory techniques for it, particularly in the de-
velopment of wayfinding strategies or tools. Our survey of the last eight years of research
in the field confirm that there is indeed a paucity of literature on the rehabilitation and
treatment of topographical disorientation, and that research towards establishing clinical
standards of practice and technology to facilitate topographical orientation are required.
Chapter 1. Introduction 9
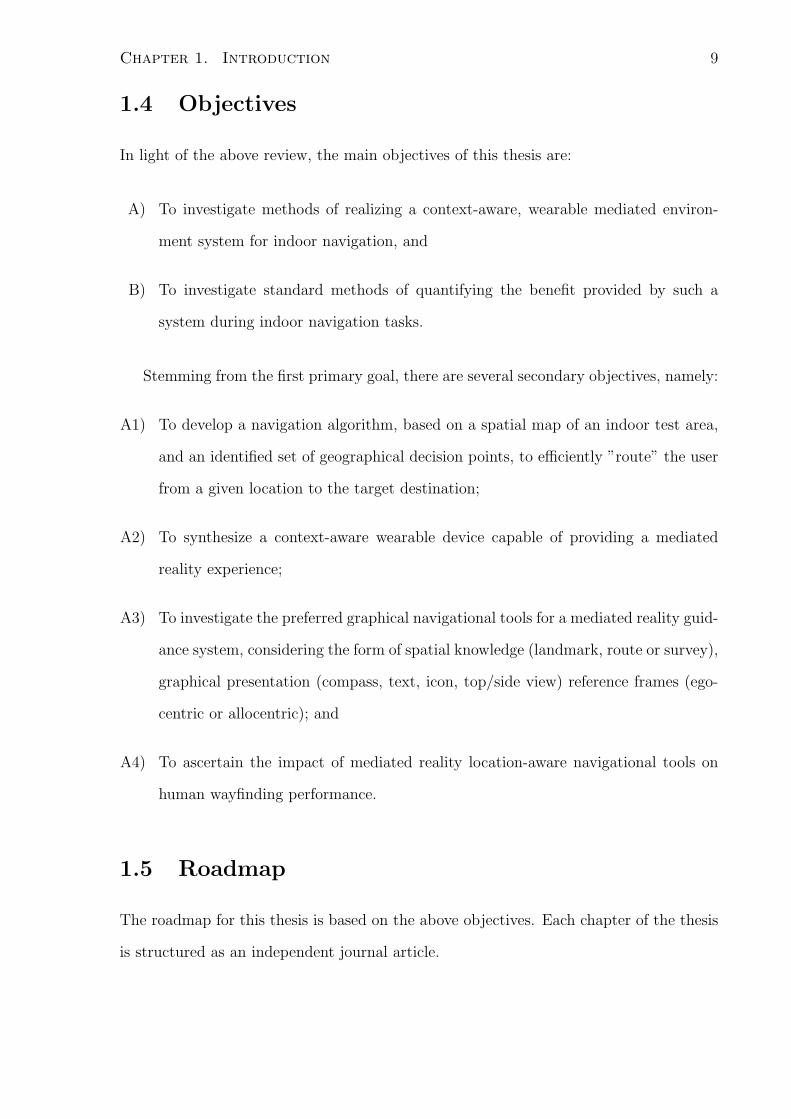
1.4 Objectives
In light of the above review, the main objectives of this thesis are:
A) To investigate methods of realizing a context-aware, wearable mediated environ-
ment system for indoor navigation, and
B) To investigate standard methods of quantifying the benefit provided by such a
system during indoor navigation tasks.
Stemming from the first primary goal, there are several secondary objectives, namely:
A1) To develop a navigation algorithm, based on a spatial map of an indoor test area,
and an identified set of geographical decision points, to efficiently ”route” the user
from a given location to the target destination;
A2) To synthesize a context-aware wearable device capable of providing a mediated
reality experience;
A3) To investigate the preferred graphical navigational tools for a mediated reality guid-
ance system, considering the form of spatial knowledge (landmark, route or survey),
graphical presentation (compass, text, icon, top/side view) reference frames (ego-
centric or allocentric); and
A4) To ascertain the impact of mediated reality location-aware navigational tools on
human wayfinding performance.
1.5 Roadmap
The roadmap for this thesis is based on the above objectives. Each chapter of the thesis
is structured as an independent journal article.
Chapter 1. Introduction 10
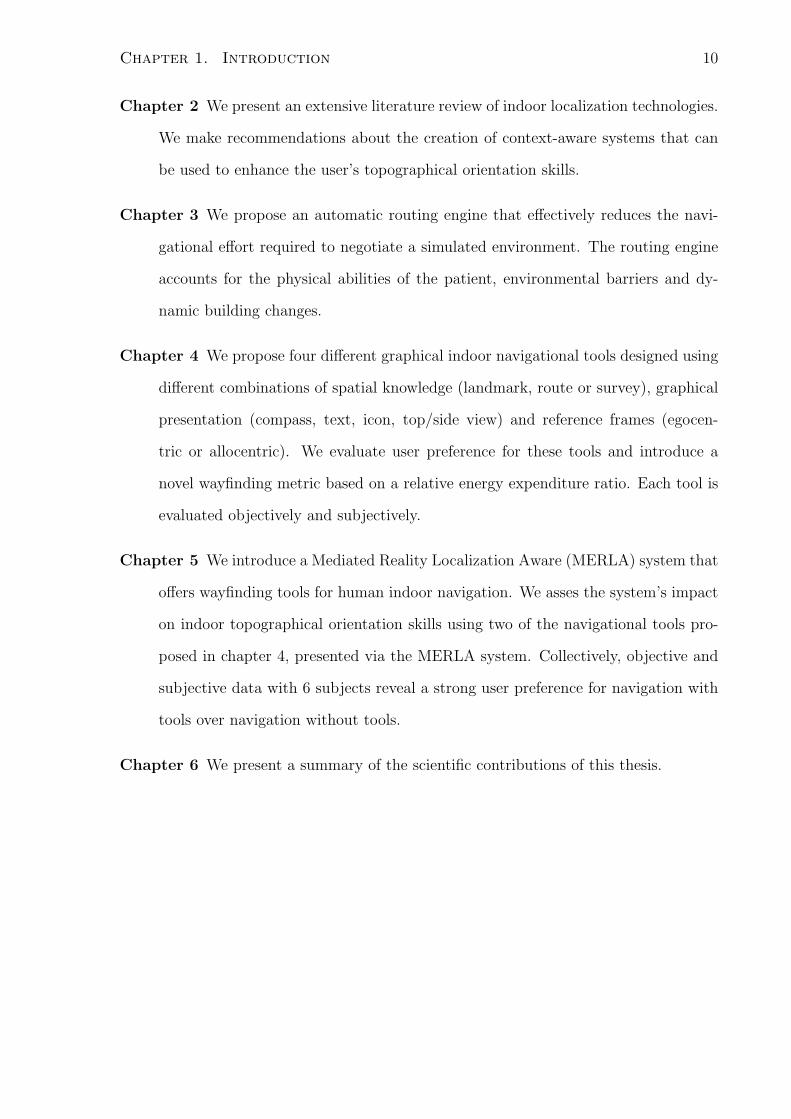
Chapter 2 We present an extensive literature review of indoor localization technologies.
We make recommendations about the creation of context-aware systems that can
be used to enhance the user’s topographical orientation skills.
Chapter 3 We propose an automatic routing engine that effectively reduces the navi-
gational effort required to negotiate a simulated environment. The routing engine
accounts for the physical abilities of the patient, environmental barriers and dy-
namic building changes.
Chapter 4 We propose four different graphical indoor navigational tools designed using
different combinations of spatial knowledge (landmark, route or survey), graphical
presentation (compass, text, icon, top/side view) and reference frames (egocen-
tric or allocentric). We evaluate user preference for these tools and introduce a
novel wayfinding metric based on a relative energy expenditure ratio. Each tool is
evaluated objectively and subjectively.
Chapter 5 We introduce a Mediated Reality Localization Aware (MERLA) system that
offers wayfinding tools for human indoor navigation. We asses the system’s impact
on indoor topographical orientation skills using two of the navigational tools pro-
posed in chapter 4, presented via the MERLA system. Collectively, objective and
subjective data with 6 subjects reveal a strong user preference for navigation with
tools over navigation without tools.
Chapter 6 We present a summary of the scientific contributions of this thesis.
Chapter 2
A review of indoor localization
technologies
Torres-Solis J and Chau T. (Accepted in preliminary form for publication in Ambient
Intelligence, ISBN 978-953-7619-X-X). A review of indoor localization technologies: to-
wards navigational assistance for topographical disorientation. Book chapter. Ambient
Intelligence (A. Lazinica, editor), In-Tech Publishers.
2.1 Abstract
Indoor localization technologies hold promise for many ambient intelligence applica-
tions, including in-situ navigational assistance for individuals with wayfinding difficulties.
Given that the literature on indoor localization is vast and spans many different disci-
plines, we conducted a comprehensive review of the dominant technologies. We propose a
taxonomy of localization technologies on the basis of the measured physical quantity. In
particular, we identified, radio frequency, photonic, sonic and inertial localization tech-
nologies as leading solutions in the field. For each selected technology, the fundamental
scientific mechanisms for localization are explained, key recent literature appraised and
the merits and limitations are discussed. Recommendations are made regarding the
11
Chapter 2. A review of indoor localization technologies 12
creation of context-aware systems that can be used to enhance a user’s topographical
orientation skills.
2.2 Introduction
Topographical Disorientation (TD) refers to a family of deficits in environmental orien-
tation and navigation. Aguirre and D’Esposito [3] provide a well-accepted taxonomy of
TD, arguing that difficulties in wayfinding may arise as a result of the combination of
different cognitive impairments. For example, it is well recognized that TD and spatial
navigation deficits are common sequelae of brain injury [179, 156]. Individuals living with
post-traumatic effects of brain injury are oftentimes faced with symptoms such as weak
visual scanning skills, or deficits in complex attention, prospective memory or sequential
processing [90]. These symptoms cause problems of interaction with and perception of
the surrounding environment even several years post-injury [36, 145]. It has also been
argued that deficits in topographical orientation can lead to spatial anxiety or wandering
behaviours [19, 161, 179].
It has been suggested that wearable navigation technologies such as Global Posi-
tioning System (GPS) can be a useful wayfinding tool for individuals with cognitive
impairments [7]. However, GPS signals have limited coverage indoors (e.g., [69, 79, 63,
128, 198, 74]). Given that patients spend significant periods of time indoors - be it in
acute and tertiary care hospitals or, subsequent to rehabilitation, at home, schools, office
buildings, shopping malls, long-term care facilities - identification of potential technolo-
gies for indoor navigational assistance is imperative. An initial survey of the literature
has suggested that a diverse collection of candidate indoor localization technologies exists
across many different disciplines. This diversity makes it difficult to grasp the potential
of an existing technology for the rehabilitation of individuals with topographical disori-
entation.
Chapter 2. A review of indoor localization technologies 13
Localization technologies are critical to emerging location-aware guidance systems
and support services for individuals who have wayfinding difficulties due for example to
low vision [141], stroke [178] and traumatic brain injury [6]. In particular, regarding
indoor navigation systems for individuals with topographical disorientation, localization
has often been human-mediated rather than automatic. For instance, Liu et al. evaluated
the benefits of navigational tools in real indoor environments [88]. However, the location
tracking and tool display decisions in their experiments were not automatic, but con-
trolled by the experimenters. In similar vein, Sohlberg et al. [159] found that individuals
with wayfinding difficulties secondary to brain injury responded well to speech-based au-
ditory directions from a wrist-worn PDA navigation system. However, like Liu et al., the
PDA’s navigational instructions were transmitted by a human operator at a mobile com-
puter. Undoubtedly, there is immense opportunity to explore the potential of automatic
patient indoor localization technologies in the emerging fields of cognitive prosthetics and
situated assistive technologies. As a consequence, the overarching goal of this review is
to systematically organize the literature on indoor human tracking technologies, and to
ascertain their feasibility for eventual use in the realm of TD rehabilitation.
2.3 Literature selection
We combed the literature for candidate localization technologies that could serve to cre-
ate an assistive device for individuals with TD in indoor environments. In particular,
peer-reviewed journal articles published in English between 2003 and 2009, inclusive,
were sought from three different academic databases, namely: Compendex, Inspec and
Geobase, using the keywords,“indoor location”, “indoor localization”, “indoor tracking”
and “indoor positioning”. After removing duplicate records, we arrived at 214 articles.
To identify potential technologies applicable to the creation of a navigational assistance
device that for individuals with topographical disorientation that offered accurate infor-
Chapter 2. A review of indoor localization technologies 14
mation in real time, the returned articles were subsequently screened according to the
following inclusion criteria:
1. The article must focus on the development and experimental testing of a local-
ization or navigation system: i.e., articles focusing on mathematical processing
of localization data, or localization experiments in simulated environments were
discarded.
2. The reported technology must:
(a) be usable indoors, within a building or a larger space, i.e., technologies used
to track a capsule inside the human body, or a device within a single room
were excluded;
(b) offer a localization accuracy of a mobile target within a 10 meter radius with
a delay of 5 seconds or less;
(c) be applicable to humans, i.e., systems designed for vehicles, large objects, or
objects that relied on a fixed pose or odometry measurements of a robot were
excluded; and
(d) track and identify multiple humans concurrently.
Fifty three articles met such initial criteria. Such articles were subsequently scanned
for alternate localization technologies that were referenced three or more times and that
were not selected in the initial search. Eleven additional articles were included in this
manner, totaling sixty four articles for consideration in the present review.
2.3.1 Taxonomy of localization technologies
The location of an object in space is determined by measuring a physical quantity that
changes proportionally with the position of the object of interest. The present review is
structured in terms of the measured physical quantity. The selected articles were divided
Chapter 2. A review of indoor localization technologies 15
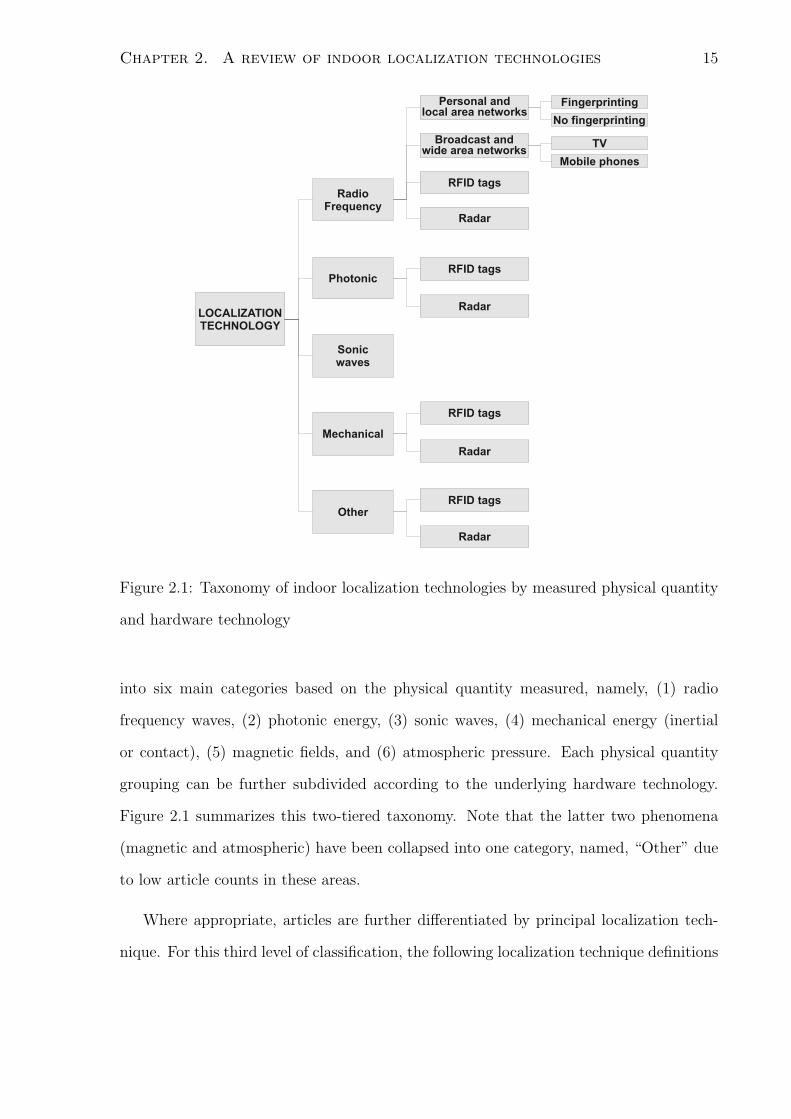
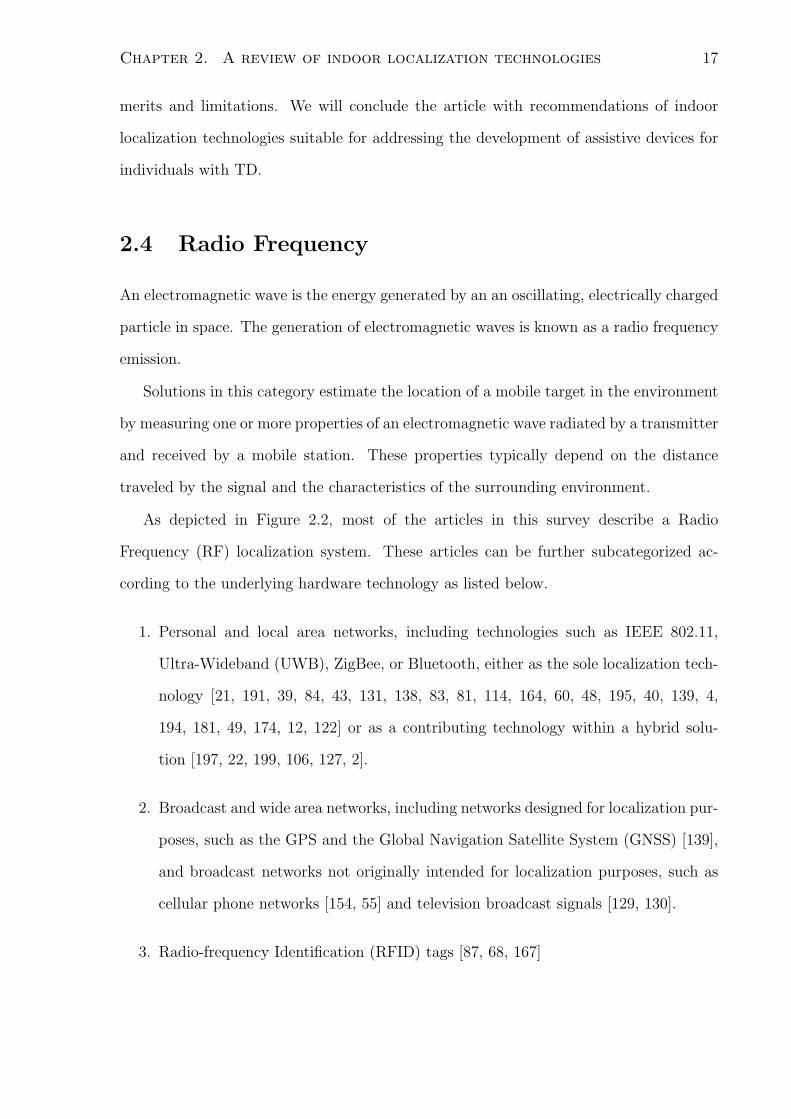
Figure 2.1: Taxonomy of indoor localization technologies by measured physical quantity
and hardware technology
into six main categories based on the physical quantity measured, namely, (1) radio
frequency waves, (2) photonic energy, (3) sonic waves, (4) mechanical energy (inertial
or contact), (5) magnetic fields, and (6) atmospheric pressure. Each physical quantity
grouping can be further subdivided according to the underlying hardware technology.
Figure 2.1 summarizes this two-tiered taxonomy. Note that the latter two phenomena
(magnetic and atmospheric) have been collapsed into one category, named, “Other” due
to low article counts in these areas.
Where appropriate, articles are further differentiated by principal localization tech-
nique. For this third level of classification, the following localization technique definitions
Chapter 2. A review of indoor localization technologies 16
are provided, expanding on those proposed by Hightower and Borriello [62]:
Triangulation is a family of methods that include lateration, angulation and variations
thereof. Lateration refers to the calculation of the position of the human subject
based on his relative distance to several previously-known fixed points in space.
Such distances are commonly obtained indirectly by measuring parameters that
are proportional to distance. Time of flight and power attenuation of a radio signal
are common indirect distance metrics [43]. Angulation refers to the calculation of
the position of the subject using the angles of arrival of signals emitted from fixed
points in space. [181, 166].
Proximity refers to a class of methods which establish the presence of the human sub-
ject in the vicinity of a sensor, which alone has limited sensing range and analysis
capabilities. The proximity of the subject can be detected through physical con-
tact, presentation of a device such as a magnetic band to an appropriate reader
or through the monitoring of a physical quantity in the vicinity of the sensor, for
instance, a magnetic field.
Scene analysis involves the monitoring of a wide area around the subject of interest
from a specific vantage point. The commonly deployed sensors have broad cover-
age area and range. Examples include ceiling-mounted video cameras or passive
infrared (PIR) sensors.
Dead reckoning refers to the usage of sensors that provide location updates, calculated
using information about a previously-estimated location. Position estimation is
commonly based on accelerometry and gyroscopy.
The ensuing review of literature will adhere closely to the taxonomy depicted in
Figure 2.1. For each physical phenomenon, we will briefly present the general principles
of localization, review articles in the relevant subcategories and comment on their relative
Chapter 2. A review of indoor localization technologies 17
merits and limitations. We will conclude the article with recommendations of indoor
localization technologies suitable for addressing the development of assistive devices for
individuals with TD.
2.4 Radio Frequency
An electromagnetic wave is the energy generated by an an oscillating, electrically charged
particle in space. The generation of electromagnetic waves is known as a radio frequency
emission.
Solutions in this category estimate the location of a mobile target in the environment
by measuring one or more properties of an electromagnetic wave radiated by a transmitter
and received by a mobile station. These properties typically depend on the distance
traveled by the signal and the characteristics of the surrounding environment.
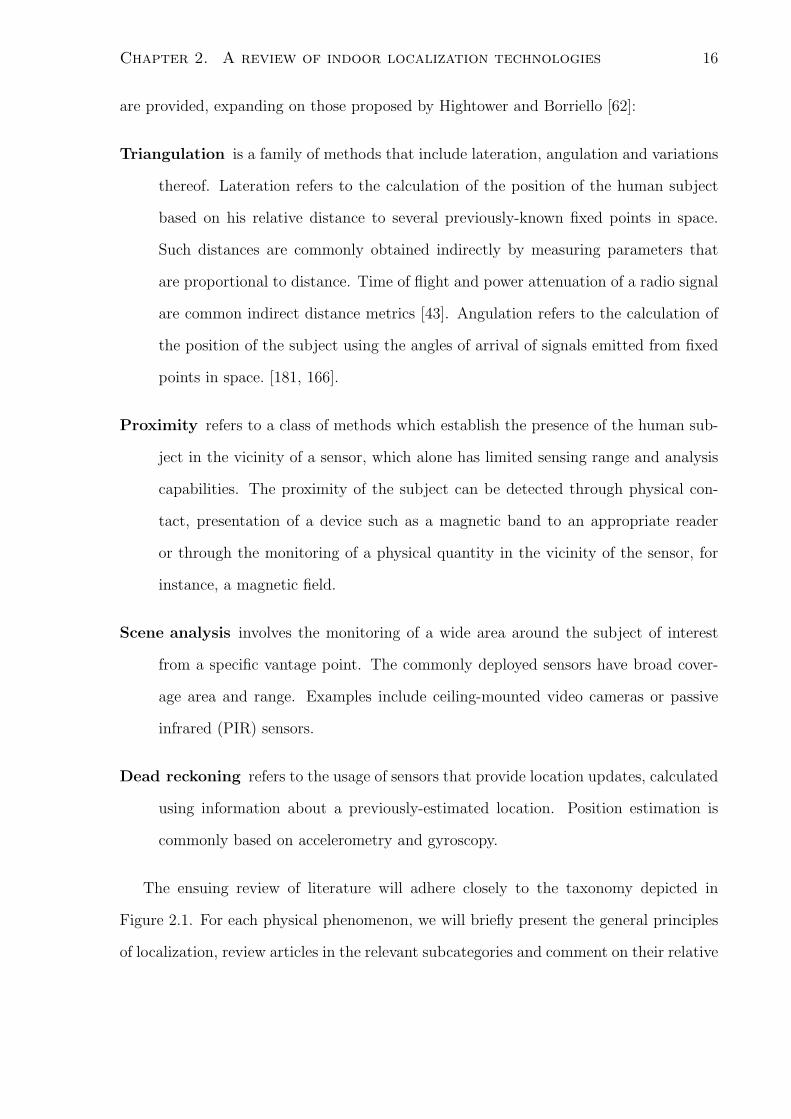
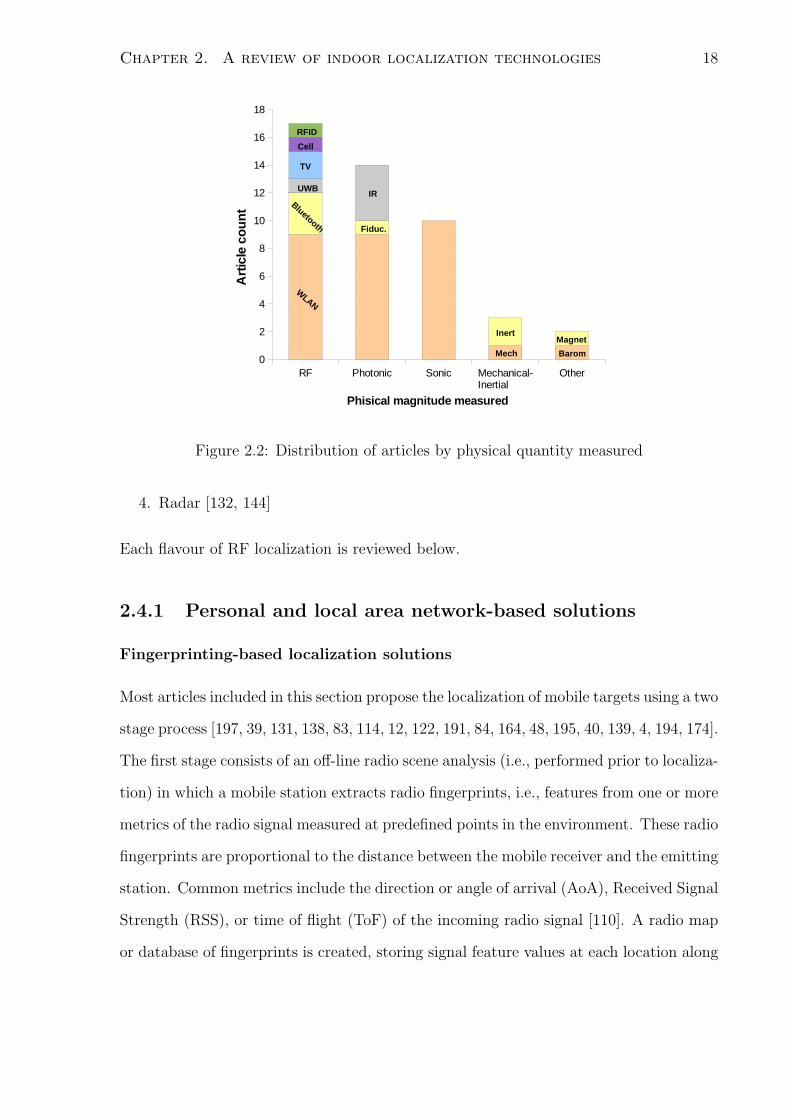
As depicted in Figure 2.2, most of the articles in this survey describe a Radio
Frequency (RF) localization system. These articles can be further subcategorized ac-
cording to the underlying hardware technology as listed below.
1. Personal and local area networks, including technologies such as IEEE 802.11,
Ultra-Wideband (UWB), ZigBee, or Bluetooth, either as the sole localization tech-
nology [21, 191, 39, 84, 43, 131, 138, 83, 81, 114, 164, 60, 48, 195, 40, 139, 4,
194, 181, 49, 174, 12, 122] or as a contributing technology within a hybrid solu-
tion [197, 22, 199, 106, 127, 2].
2. Broadcast and wide area networks, including networks designed for localization pur-
poses, such as the GPS and the Global Navigation Satellite System (GNSS) [139],
and broadcast networks not originally intended for localization purposes, such as
cellular phone networks [154, 55] and television broadcast signals [129, 130].
3. Radio-frequency Identification (RFID) tags [87, 68, 167]
Chapter 2. A review of indoor localization technologies 18
Figure 2.2: Distribution of articles by physical quantity measured
4. Radar [132, 144]
Each flavour of RF localization is reviewed below.
2.4.1 Personal and local area network-based solutions
Fingerprinting-based localization solutions
Most articles included in this section propose the localization of mobile targets using a two
stage process [197, 39, 131, 138, 83, 114, 12, 122, 191, 84, 164, 48, 195, 40, 139, 4, 194, 174].
The first stage consists of an off-line radio scene analysis (i.e., performed prior to localiza-
tion) in which a mobile station extracts radio fingerprints, i.e., features from one or more
metrics of the radio signal measured at predefined points in the environment. These radio
fingerprints are proportional to the distance between the mobile receiver and the emitting
station. Common metrics include the direction or angle of arrival (AoA), Received Signal
Strength (RSS), or time of flight (ToF) of the incoming radio signal [110]. A radio map
or database of fingerprints is created, storing signal feature values at each location along
Chapter 2. A review of indoor localization technologies 19
with the corresponding spatial coordinates. Some authors propose automated or assisted
radio map creation techniques, exploiting the characteristics of the environment, such as
the spatial configuration and the material composition of the environment [164, 67, 197].
The on-line stage comprises the active localization process where the mobile receiver
extracts a fingerprint of the radio signal at an unknown location. Localization is com-
monly achieved by proximity techniques, i.e., finding the closest match between the
features of the received radio signal and those stored in the radio map [197, 39, 131,
138, 83, 48, 40, 139, 4, 122, 191]. More accurate localization can be achieved using a
triangulation-like process, in which several candidate locations (each with a fingerprint
bearing some resemblance to that of the received signal) are geometrically combined to
provide an estimate of the receiver location in space [84, 114, 164, 139, 194, 174, 12].
Algorithms deployed in the selection of the closest match or matches from the radio
map include: 1) nearest neighbours techniques and variations thereof [39, 194, 12]; 2)
Bayesian statistical matching [197, 191, 84, 131, 138, 139, 174, 122]; 3) maximum like-
lihood estimation [164, 48]; 4) correlation discriminant kernel selection [83, 114]; and
neural networks [40, 4].
Some fingerprinting techniques also provide coarse estimates of orientation, for exam-
ple, 4 different orientations [191, 12]. The radio map is created with a user transporting
the mobile device. At a given location, a fingerprint is recorded at each possible orien-
tation. Since the human body affects the propagation of radio signals, the fingerprint
generated for each orientation will be different [191, 12].
Fingerprinting localization accuracy is commonly down to a few meters (i.e. within
3 metres 90% of the time [83] and within 3 metres 91.6% of the time [114]). The lowest
number of base stations used to create the feature space of a fingerprint was one [197].
In other words, fingerprinting seems to provide reasonable localization accuracies with-
out excessive hardware requirements. The most pressing challenge however is the non-
stationarity of the radio map. This is reflected as differences in the measured signals
Chapter 2. A review of indoor localization technologies 20
during the on-line and off-line phases at the same exact location. The time-variant na-
ture of the radio map can be attributed to radio signal propagation effects induced by
dynamic aspects of the environment such as the presence or absence of people, elevators,
moving doors and other environmental changes [87, 83, 12].
As a particular case, in [139], the authors proposed an indoor and outdoor hybrid
localization system, combining GPS and WLAN localization technologies. The authors
proposed handing off the localization responsibility between GPS and WLAN depending
on their availability. Fingerprinting was done through a GPS-on-line stage, collecting
positional information of the access points within a nearby building and geo-referencing
these measurements with the information obtained through GPS. After this fingerprinting
process, indoor WLAN positioning was achieved by estimating a point located among
a set of the most probable locations. These locations were predefined by the user -
i.e. copy room, cafeteria. The histogram of the RSS measurements was used to deter-
mine the location that best matched the histogram received. If the histogram did not
closely match any known locations, a centroid algorithm estimated the location of the
user from the locations of previously geo-referenced access points and probable nearby
locations. The place detection algorithm, which relied on an almost perfect fingerprint
match, yielded room level localization accuracy, while the WLAN localization algorithm,
using the centroid of several probable locations, yielded an accuracy of approximately 30
metres.
Non-fingerprinting-based solutions
RF-based localization can also be achieved without a priori analysis of the radio proper-
ties of the environment (i.e., without development of a radio map). Four of these articles,
all of them based on UWB radio signals, rely on signal triangulation as the sole localiza-
tion technique [60, 181, 49, 81], while in [43] localization is achieved by proximity and
scene analysis.
Chapter 2. A review of indoor localization technologies 21
Indoor localization based on triangulation of radio waves is a non-trivial problem
because the transmitted signal can suffer obstructions and reflections. As a consequence,
Non-Line-of-sight (NLOS) conditions emerge. In the presence of NLOS conditions, the
radio signal can travel to the receiver through a non-direct path, giving rise to erroneous
distance estimates.
To overcome these problems, the use of UWB radio signals has become the most
novel solution in radio frequency-based solutions. The properties of ultra-wide band,
short duration pulses mitigate the propagation problems associated with multi-path radio
propagation. The most representative example is the system proposed by Venkatesh
and Buehrer. They introduced a triangulation localization system based on impulse
UWB radio signals [181]. They suggested that the statistical parameters describing
the distribution of the received root-mean-square delay spread (RDS) serve as the best
discriminant estimator between Line-of-sight (LOS) and NLOS signal propagation. This
means that the statistical parameters defining the RDS of the received signal can be
compared against a predefined rule set to determine if the signal was received via a direct
or indirect path. Subsequently Venkatesh and Buehrer tracked a mobile station though
71 predefined locations within a building, achieving localization accuracies ranging from 1
centimetre to 2 metres. As another example of RF triangulation-based schemes, Krejcar
and Cernohorsky presented a localization system [81] that relied on the triangulation
of RSS metrics. Room-granularity accuracies were reported but further details of the
triangulation or localization schemes were not revealed.
Finally, a system based on a combination of scene analysis and proximity techniques
using a Bluetooth ad-hoc network was presented in [43]. Bluetooth inquiry signals were
used for localization. In inquiry mode, a bluetooth device inquires about neighbouring
bluetooth stations. This inquiry process consists of scanning for devices in the vicinity,
using a sequence of different power levels. Low power levels will detect devices in close
proximity while high power levels will include devices that are located farther away,
Chapter 2. A review of indoor localization technologies 22
providing coarse distance estimates in this fashion. This approach requires a fixed or
“anchor” node which establishes the position of nearby mobile nodes. Subsequently, the
localized nodes can establish the position of other undetected mobiles nodes in their
vicinity, creating an ad-hoc localization network. The reported localization error was
1.88 meters.
2.4.2 Broadcast and wide area network solutions
Solutions based on television signals and cellular networks
The solutions in this section are based on RF infrastructure transmitters that cover a wide
area, and while not originally designed for localization, can be adapted to provide indoor
localization services. In particular, two such technologies were identified: television (TV)
broadcast signals [129, 130] and cellular phone networks [154].
Rabinowitz and Spilker [129, 130] proposed the use of synchronization signals al-
ready present in the Advanced Television Signal Committee (ATSC) standard for com-
pliant digital TV signals. As the signal properties and geometrical arrangement of the
TV broadcast network have been designed to penetrate indoors, they offer significantly
greater indoor coverage than GPS-based solutions. Implementation of a localization so-
lution would require no modification of the existing broadcast signal. To overcome the
inherent lack of synchrony between stations due to clock imperfections, Rabinowitz and
Spilker deployed a fixed reference station that transmitted an offset correction signal.
A mobile station then calculated the ToF of the signal, and subsequently the distance
to each TV broadcast station. As the positions of the broadcast stations were fixed
and known, the position of a mobile receiver could be estimated. At least three visible
transmitting stations were required for triangulation purposes. Rabinowitz and Spilker
presented experiments in indoor environments in which they obtained a mean localization
error ranging from 10 to 23 meters depending on the environment.
Chapter 2. A review of indoor localization technologies 23
Hu et al. developed a method for the localization of mobile phones inside a cell [154]
using fingerprinting techniques. Invoking a method for the automated creation of a radio
fingerprint of the cellular signal, Hu et al. argued that granular localization can be
achieved in indoor environments by statistically matching the fingerprint of the received
signal with a record in the radio map. The authors emphasized that the localization
accuracy in this case is highly dependent on the size of the cell and the characteristics
of the environment. This localization solution can be considered a combination of scene
analysis (the off-line phase) and proximity techniques. Unfortunately, the improvement
achieved in localization accuracy over conventional cell-ID localization was not reported.
2.4.3 Solutions based on RFID tags
An RFID system is commonly composed of one or more reading devices that can wire-
lessly obtain the ID of tags present in the environment. The reader transmits a RF
signal. The tags present in the environment reflect the signal, modulating it by adding a
unique identification code [87, 124]. The tags can be active, i.e., powered by a battery, or
passive, drawing energy from the incoming radio signal. The detection range of passive
tags is therefore more limited.
Lionel et al. [87] proposed a localization system named LANDMARC, using active
tags. Reference tags were located in known, fixed positions in the environment. The
reader was also situated in a fixed position. To locate a mobile tag, the reader scanned
through 8 different power levels for tags in the vicinity. When a mobile tag was detected,
the receiver compared the power returned by the reference tags and the mobile tag,
determining the closest reference tags using a nearest neighbour algorithm. The position
of the mobile tag was determined by triangulating the position of the nearest reference
tags. The authors reported a localization accuracy of 2 meters, 75% of the time. The
maximum localization delay was of 7.5 seconds.
Jia et al. [68] proposed a hybrid radio and vision based system which used RFID tags
Chapter 2. A review of indoor localization technologies 24
and a stereo camera for robot navigation purposes. To estimate the location of the mobile
unit, RFID tags were used to mark walls and obstacles within the environment. The
RFID detector comprised of a directional antenna, which yielded the general direction of
the RFID tags detected. When a tag was in proximity of the robot, it obtained images
from the stereo camera to estimate the distance to the obstacle marked by the RFID tag.
Subsequently, the ID of the tag was compared against entries in a tag location database
to determine if it belonged to a fixed landmark (i.e. RFID tag fixed to the wall) or an
obstacle prone to change its position in the environment (i.e. a chair or a human). If the
tag belonged to a fixed object or location, the information from the camera, combined
with the directional orientation obtained from the RFID tag, were used to estimate the
distance and orientation of the robot with respect to the tag. The localization accuracy
was of 8.5 centimetres. Although this localization system was designed for a robot, the
constraints on the robot’s movement and posture were minimal. Therefore, this system
might be adapted to human localization, at the risk of accuracy reduction.
Finally, in [167], Tesoreiro et al. introduced a localization system based on proximity
to RFID tags. In this system a museum visitor used a personal digital assistant (PDA),
which served as an automated museum guide. To estimate the position of the user, the
PDA obtained the ID of RFID tags in the vicinity. Each tag was associated with an
exhibit in the museum. The ID of the detected tag was subsequently transmitted to
a server, which returned information about the exhibit in proximity to the user. This
information was displayed in the PDA screen. The localization accuracy of this system
was not reported. However, the accuracy was related to the density of tags in the
environment.
l
Chapter 2. A review of indoor localization technologies 25
2.4.4 Solutions based on a radio frequency radar
Roehr et al. [144] presented an extension to the conventional frequency-modulated continuous-
wave radar. The particular characteristic of this system was that it used two-way radio
communication. Both fixed and mobile units were capable of transmitting and receiv-
ing a frequency modulated signal with a 5.8 GHz carrier. The fixed and mobile clocks
were synchronized before distance and velocity estimations could be calculated. Once
the units were synchronized, the fixed unit emitted a signal, which arrived at the mobile
station. Subsequently, the mobile station sent a reply to the fixed station, which was
synchronized using the signal just received from the fixed station. The round trip time of
the signal was used to calculate the distance between the fixed and the mobile stations,
while the frequency deviation was used to estimate the velocity of the mobile unit. The
experimental setup included one experiment within an office building, where distances
ranging from 5 to 25 metres were measured with the radar system. These distance mea-
surements were then compared against the measurements obtained with a laser range
finder. This experiment was designed to test line-of-sight conditions only and yielded
measurements with a deviation of less than 3 centimetres when compared to laser range
finder measurements.
In [132], the authors presented a radar indoor human tracking system, which exploited
the Doppler effect of moving objects and micro-Doppler signal features that are particular
to human movements. Various movements of the human body were classified based on
the Doppler features received by the radar system. Such features were obtained from a
joint time-frequency analysis, using the short-time Fourier transform and the reassigned
joint timefrequency transform. The authors also proposed a scheme for tracking several
human beings concurrently; the Doppler separation effect between moving humans was
exploited, while target differentiation was realized using an antenna array that formed
directed beams. Three antennas and two frequencies were required for multiple target
tracking. Finally, the authors presented experiments to determine the range of the target,
Chapter 2. A review of indoor localization technologies 26
using frequency diversity, and studied the effects and errors introduced by the attenuation
due to walls in the environment. The authors concluded that the properties of human
movements can be exploited for localization purposes and that human localization using
radar technologies is challenging within an indoor environment. They suggested a few
techniques that might improve indoor localization, such as the placement of the radar as
far away from the walls as possible.
2.4.5 Limitations
The propagation of RF signals in indoor environments poses a central challenge. Certain
materials within the indoor environment affect the propagation of radio waves. For
example materials such as wood or concrete attenuate RF signals, while materials such
as metals or water cause reflections, scattering and diffraction of radio waves. These
effects lead to multipath radio wave propagation, which encumbers accurate calculation
of the distance between the transmitter and the receiver [181, 186, 154, 83, 198, 164, 144,
110]. Several authors have proposed techniques to compensate for these inaccuracies by
automatically generating radio maps which consider the structure of the building [164,
154, 67]. However, a comprehensive model of all the materials in a complex environment
such as a health care facility or a patient’s home is a non-trivial problem.
The propagation of radio waves are adversely affected by changes to the physical en-
vironment such as the rearrangement of furniture, structural modifications or movement
of personnel within a building. Clinical setting are under constant change; elevators, per-
sonnel and large metallic structures such as beds and wheelchairs are constantly moving
through the building. In these environments, the radio properties are highly dynamic,
and a radio map captured at a certain point in time cannot be used reliably for localiza-
tion without accounting for these dynamic changes [87, 84, 191, 12].
Interference and noise are often-mentioned challenges [83, 175]. Although some so-
lutions operate within a reserved radio band [129, 154, 130], most of the research is
Chapter 2. A review of indoor localization technologies 27
conducted on open spectrum bands. This means that these solutions must account for
the increased risk of interference due to other systems sharing the same frequency bands
of the radio spectrum [84].
Finally, the usage of radio transmitting devices is often times restricted in critical areas
of most healthcare facilities, according to recommendations made by the Association
for the Advancement of Medical Instrumentation (AAMI) [1] and other standards or
regulatory bodies. These restrictions limit the deployment of localization systems based
on non-broadcast radio waves to specific, non-patient care areas, e.g, waiting rooms.
Localization technologies based on RF technologies can be attractive due to the ubiq-
uity of certain infrastructural technologies, such as wireless data networks, that may
already be present in the facilities. Care must be taken, however, in evaluating the im-
pact of the physical environment on the RF localization technologies, as the solution may
be rendered non-operative in certain clinical settings.
2.5 Photonic energy
Light refers to the phenomena of electromagnetic radiation at wavelengths within the
visible range, which extends approximately between 380 and 750 nanometres. Photonic
energy refers to the energy carried by electromagnetic radiation in this wavelength range,
known as visible light, or in its lower or upper vicinity, known as ultraviolet and infrared
light, respectively. A photon is the minimum possible discrete amount of light energy.
Solutions in this category rely on the photonic energy received from infrared or visible
light emissions or reflections, to estimate the position of an object in space.
The articles selected for this section can be distinguished based on the sensor required
to estimate the location of the tracked object. Some articles proposed the use of cameras
to locate a mobile subject or device via image processing [123, 5, 193, 52, 46, 192, 196,
184, 76, 143, 64, 105, 18]. In contrast, some other articles present localization solutions
Chapter 2. A review of indoor localization technologies 28
based on non-image processing devices [28, 121, 120, 24, 66, 185].
Methods based on image analysis are all of the scene analysis persuasion. The classical
model of computer vision-based location detection consists of 4 main stages [5]
1. Image acquisition, normally through a video camera
2. Segmentation of the image and extraction of relevant features
3. Selection of the closest match or matches of the detected features against the en-
tries of a database of features (e.g. edges or fiducials). This process typically
involves mathematical transformations of the spatial relationships between the fea-
tures detected to account for the variability in scale, rotation or luminance of a
given scene.
4. Computation of the pose of the camera. This consists of estimating the position
and orientation of the camera that could have given rise to the observed image,
assumed to be a distorted and rotated version of a database image. The selection
of the closest match is achieved as in the previous step.
We can subsequently distinguish between localization systems that rely on image
processing that exploits natural environmental features and systems that rely on the
detection of a predefined synthetic pattern (i.e. fiducial) in the environment.
Consequently, the articles included in this section were organized in three main groups:
1) image processing and natural feature extraction, 2)image processing and fiducial recog-
nition, and 3) non-image processing sensors. This organization is presented in the fol-
lowing sections.
2.5.1 Image analysis, natural feature extraction and recognition
Natural feature extraction refers to the mathematical processing of an image to extract
a set of numerical values that uniquely represent that image. Features of an image are
Chapter 2. A review of indoor localization technologies 29
commonly selected from its colour histogram [46] or from structural edges and their
spatial relationships [5]. A reduced subset of these features is subsequently defined to
uniquely identify the image.
Mobile camera systems
Articles grouped in this section consider solutions where the camera was carried along by
the subject or device being located. In most cases the localization process involves two
stages, analogous to the two-stage fingerprinting process described for wireless localiza-
tion solutions. In the off-line stage, images of the environment are captured at predefined
locations. Each image is processed to extract its unique features. Subsequently, the ex-
tracted features are stored in a database along with the associated camera position and
orientation, at which the image was captured.
In the on-line stage, the camera captures an image, and image features are subse-
quently extracted. These features are compared to the entries in the feature database,
either directly (to define a crude location of the camera), or through spatial transforma-
tions that yield the best match between the features in question and those in the database
(to obtain more accurate location estimates). Such transformations reflect the differences
in between on-line and off-line image capture locations. Once the best matching set of
database features is identified, the corresponding database entry for camera position and
orientation is used to estimate the absolute location of the camera.
Articles adopting a mobile camera system include [5, 193, 52, 46, 192, 143, 64]. It
must be noted, however, that these articles propose the indoor localization of robots.
Nevertheless, the algorithms used in such articles are not strictly dependent on properties
of the robots and can be easily adapted to human localization. Three distinctive examples
are presented in this section.
Observing the rectilinearity of human-made indoor environments, Aider, Hoppenot
and Colle [5] proposed a localization system based on a mobile monocular vision system
Chapter 2. A review of indoor localization technologies 30
which exploited straight line environmental features. The maximum localization error
reported during their experiments was 20 centimetres, and the maximum angle estimation
error reported was 2.5 degrees.
Frontoni and Zingaretti [46] used a single colour camera to detect coloured areas of
an image and their spatial relationships, which were, in turn, used as features. Through
a rotation invariant feature transformation, they estimated the most probable location of
the camera from a previously created database of features. The authors reported indoor
localization errors less than 50 centimetres, 94% of the time.
In [64] the authors presented a navigation system for a humanoid robot, which can be
extended to the case of human walking. Location determination was accomplished in two
stages. In the off-line stage, images were captured while following the route between two
points. The on-line stage involved autonomous robot navigation between two arbitrary
points while capturing images. To achieve localization, an algorithm correlated freshly
captured images with images in the route database. In this way, the unprocessed raw
image was considered as a large set of features. Correlation analysis yielded the position
deviation between the learned route and the current position. Temporary occlusions were
detected as sudden drops in the correlation. The maximum position deviation reported
during an experimental 17 metre long route, was 0.9 metres. This represents a deviation
of 5.3% of the walked distance.
Fixed camera systems
When the camera or cameras of the system are mounted in fixed locations in the en-
vironment, the structural features of the building cannot serve as discriminant factors
for localization purposes. Instead, features of the object being tracked must be used.
In this way, if the salient features of the object or objects appear in the field of view
of the camera, the location of the object or person can be calculated with respect to
the camera’s fixed position. The position of the object of interest in the environment is
Chapter 2. A review of indoor localization technologies 31
estimated based on its position within the captured image, and the spatial distribution
of its salient features.
Although several candidate articles discussed solutions for tracking the position of
a person using cameras fixed in the environment, few considered tracking a person in
a building. Instead, most of the articles presented a solution in which the tracking
process was limited to the field of view of a single camera. Therefore, only articles
[123, 196, 184, 105, 18] were considered as an indoor tracking solution based on our
inclusion and exclusion criteria.
In [123], the authors proposed a system that detected elements of the scene which
were not part of the static environment. Through segmentation, the colour histograms
of the region or regions of interest were obtained, along with a vertical colour average to
estimate a general vertical orientation of the object detected. In this way, the algorithm
accounted for the global colour scheme of the clothes of a person while standing up. A
camera, located at the entrance of the test environment, was used to create an initial
colour model of each person. Fifty subjects were tracked within an office environment
using surveillance cameras in this fashion. Visual overlaps between cameras allowed
constant tracking of subjects. The authors reported correct user recall values of 87.21%
with an availability of 73.55%.
A similar approach was presented in [196]. The authors used colour-based features
assuming vertical differentiation of colour regions of a human figure while standing up. To
account for movement between cameras with no visual overlapping coverage, the authors
proposed the creation of a connected graph that represented the areas covered by each
camera. The edges of the graph denoted physical connections of the areas covered by the
field of view of each camera. This connected graph was used in the probabilistic modeling
of the movement pattern and traffic constraints of the user, to improve recognition and
tracking accuracy.
Pursuing a slightly different approach, [184] proposed a distributed sensor network
Chapter 2. A review of indoor localization technologies 32
based on image processing. The robustness of the solution relied on overlapping the
visual field of several cameras, and distributing computational processing for localization
purposes among the elements of the distributed network. Features were extracted using a
principal components analysis of features obtained by differencing consecutive segments
of the image. The field of view overlap of different cameras allowed robustness against
occlusions. The authors demonstrated the feasibility of human tracking in a crowded
setting. The localization accuracy, however, was not reported.
In a similar vein, [105] proposed a system with 4 cameras with partially overlapping
coverage areas. Colour and non-colour features were used to account for areas of interest
in the image that yielded colour and illumination information, respectively. These cam-
eras were calibrated to estimate the 3D position of the user within the 2D image using
a projective algorithm. Using an evidential filter, particles represented the probability
of a user being in a certain location. Experiments were conducted with multiple users
navigating a room concurrently, without deliberately avoiding occlusions. Three hundred
particles were used to represent each user. In some cases the users wore similar clothes.
Some of these users walked out of the field of view of some of the cameras intermittently.
The reported localization accuracy of a single user using the 4 cameras was 0.15 m, while
using a minimum of 30 particles for the evidential filter.
Finally, the Easyliving project [18] proposed the usage of image-based localization
systems to provide context awareness within intelligent environments. The project was
based on ceiling-mounted stereo vision cameras capable of estimating the anatomical
posture of humans or the orientation of objects in the environment. The identification of
the subject being tracked was based on colour and structural features. The localization
accuracy was not reported.
Chapter 2. A review of indoor localization technologies 33
2.5.2 Image analysis, fiducial markers
Fiducial image detection differs from natural feature detection in that the image process-
ing algorithms are designed to detect predefined, synthetically created, patterns in the
environment. These patterns are called fiducial markers [109, 41].
In principle, localization algorithms based on fiducial recognition are very similar
to localization based on natural feature recognition. However, as the properties of the
image to be detected are constrained, there is no need for an a priori stage to extract
the features of the fiducial. A database is still required to determine the location of
the camera relative to a reference frame, fixed with respect to the environment. In
this case, however, the database can be created automatically by storing a numeric ID
associated with the fiducial along with its coordinates in the environment [193]. The ID
of the fiducial can be encoded within the fiducial image, analogous to how the image
of a bar code represents a numeric ID. Some reported advantages of fiducial recognition
over natural feature recognition are reduction of computational requirements, improved
detection accuracy and resilience to noise artifacts [109].
In [193], the authors proposed a position detection system for robot navigation in
indoor environments. They conducted a simple experiment using a fiducial marker as
reference. They presented an image analysis technique based on homography to obtain
the relative position of the camera with respect to the fiducial marker. Although devel-
oped for a robot, the localization technique is not constrained to intrinsic properties of
the robot, and can be applied to human localization.
Kim and Jun [76] introduced a wearable indoor localization system composed of a
portable computer, a head mounted display and a camera. Localization was achieved
through image processing, combining fiducial markers and natural visual feature extrac-
tion. Localization with fiducials was achieved through an open source library called
ARToolkit [72]. The localization algorithm detected a synthetic visual pattern in the
image captured by the camera. Using affine transformations, the authors estimated the
Chapter 2. A review of indoor localization technologies 34
distortion and scaling of the fiducial due to angle of view and capture distance. With
this information, the exact position (i.e. distance and orientation) of the camera with
respect to the marker could be determined. The authors modified ARToolkit, adding an
adaptive illumination thresholding algorithm and an algorithm for natural scene feature
recognition, which determined the location of the person when there were no fiducial
markers in view. Natural feature recognition was achieved by analyzing the color and
hue histograms for a sequence of frames. The authors defined a ”location” as a sequence
64 consecutive frames. Hence, each location was defined by a high dimensional space,
namely a sequence of 64 colour and 64 hue histograms. A Linear Discriminant Analy-
sis (LDA) was applied to reduce the dimensionality of the features which defined each
location. The first five LDA coefficients of each frame were used as descriptive features
of that frame. The sequence of features in consecutive frames defined a location. An
off-line navigation phase facilitated the creation of a database of natural features of the
building. To estimate the location of the user, the vector of features obtained from the
last 64 frames, defining the current location, were compared against the features in each
entry of the database. The difference between a feature vector captured by the camera
in the on-line stage against feature vectors stored in the database were quantified by the
Euclidean distance. If the Euclidean distance was lower than an unspecified threshold,
the location of the person was defined as the matching database coordinates. In this
fashion, the system yielded the general location of the user in a continuous fashion. The
exact location of the user was determined using fiducial markers in the field of view of
the camera. The location information obtained by both visual systems was presented in
a virtual map, along with instructions to complete a predefined path through the head
mounted display. The localization accuracy of the system was not reported.
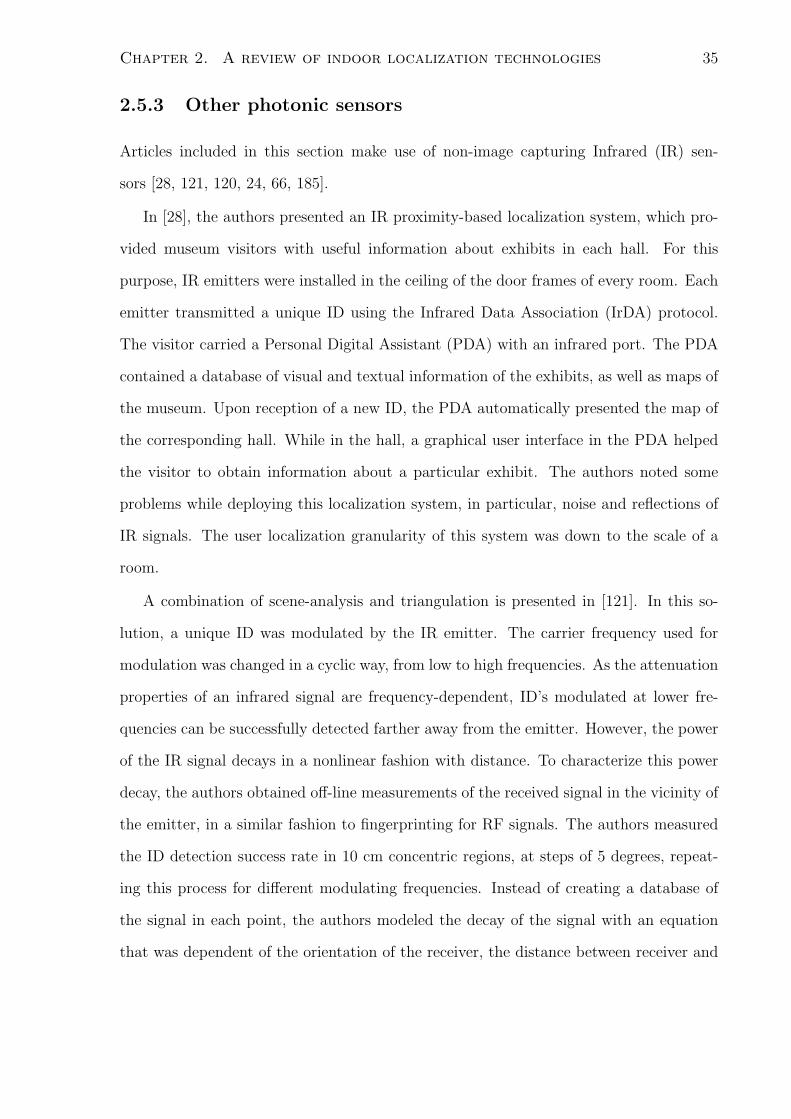
Chapter 2. A review of indoor localization technologies 35
2.5.3 Other photonic sensors
Articles included in this section make use of non-image capturing Infrared (IR) sen-
sors [28, 121, 120, 24, 66, 185].
In [28], the authors presented an IR proximity-based localization system, which pro-
vided museum visitors with useful information about exhibits in each hall. For this
purpose, IR emitters were installed in the ceiling of the door frames of every room. Each
emitter transmitted a unique ID using the Infrared Data Association (IrDA) protocol.
The visitor carried a Personal Digital Assistant (PDA) with an infrared port. The PDA
contained a database of visual and textual information of the exhibits, as well as maps of
the museum. Upon reception of a new ID, the PDA automatically presented the map of
the corresponding hall. While in the hall, a graphical user interface in the PDA helped
the visitor to obtain information about a particular exhibit. The authors noted some
problems while deploying this localization system, in particular, noise and reflections of
IR signals. The user localization granularity of this system was down to the scale of a
room.
A combination of scene-analysis and triangulation is presented in [121]. In this so-
lution, a unique ID was modulated by the IR emitter. The carrier frequency used for
modulation was changed in a cyclic way, from low to high frequencies. As the attenuation
properties of an infrared signal are frequency-dependent, ID’s modulated at lower fre-
quencies can be successfully detected farther away from the emitter. However, the power
of the IR signal decays in a nonlinear fashion with distance. To characterize this power
decay, the authors obtained off-line measurements of the received signal in the vicinity of
the emitter, in a similar fashion to fingerprinting for RF signals. The authors measured
the ID detection success rate in 10 cm concentric regions, at steps of 5 degrees, repeat-
ing this process for different modulating frequencies. Instead of creating a database of
the signal in each point, the authors modeled the decay of the signal with an equation
that was dependent of the orientation of the receiver, the distance between receiver and

Chapter 2. A review of indoor localization technologies 36
emitter, and the modulation frequency. Using this approach the system achieved a max-
imum localization error of 10 centimetres, within an area of 5 square metres. Although
a building-wide experiment was not conducted, the usage of a unique ID per transmitter
would allow the deployment of multiple emitters in a cellular arrangement to cover large
areas.
Petrellis et al. [120] presented a localization system consisting of two IR emitters
fixed in the environment, and two receivers installed on a mobile unit. The transmitters
were mounted facing each other on the walls of a corridor, while the receivers on the
mobile unit faced away from each other. Each emitter transmitted a series of unique
cyclic data patterns, modulated at a carrier frequency of 38 Hz. The opposite-facing
arrangement of the receiving sensors facilitated detection of user orientation and, at the
same time, discrimination between signals received via direct path and reflected signals.
Reflection rejection was enhanced using a predictive model, which took into consideration
the immediate previous location and orientation of the user. Since the system relied on
predictions of future position and orientation of the mobile device, the estimation rules
constrained the maximum linear and angular speeds at which the system was reliable.
Given that the emitters transmitted unique sequences, the authors proposed a cellular-
like spatial emitter arrangement to cover extensive areas. The system was sensitive
to moving personnel and other objects that caused reflections although compensation
algorithms reduced such effects. The localization accuracy was not reported.
Cheok and Li [24] presented a localization system which made use of existing fluo-
rescent lamps in a building. A user carried a wearable computer instrumented with a
photo-detector and a gyroscope. Each fluorescent lamp emitted an ID, associated with
the location of the lamp. The ID was encoded through pulse frequency modulation.
The encoded information did not introduce perceptible illumination effects. The photo-
detector and gyroscope were mounted on a cap, worn by the user. The gyroscope served
to obtain orientation information. The wearable computer was carried on a vest, worn by
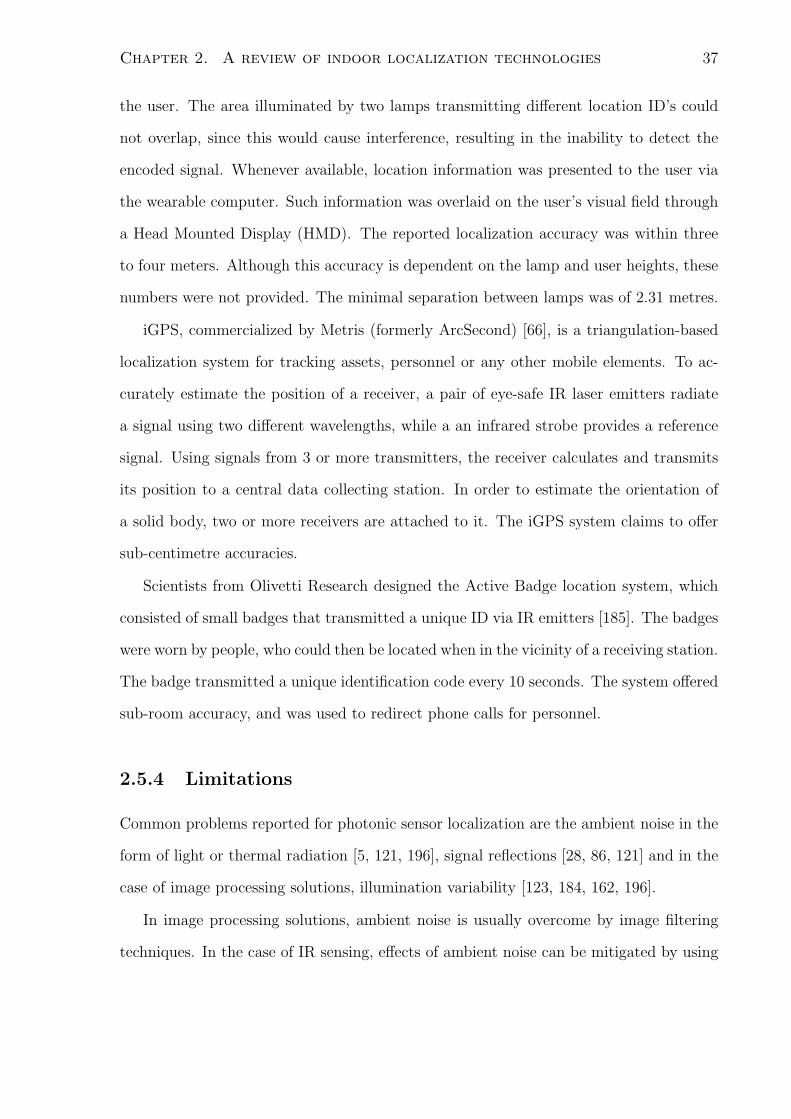
Chapter 2. A review of indoor localization technologies 37
the user. The area illuminated by two lamps transmitting different location ID’s could
not overlap, since this would cause interference, resulting in the inability to detect the
encoded signal. Whenever available, location information was presented to the user via
the wearable computer. Such information was overlaid on the user’s visual field through
a Head Mounted Display (HMD). The reported localization accuracy was within three
to four meters. Although this accuracy is dependent on the lamp and user heights, these
numbers were not provided. The minimal separation between lamps was of 2.31 metres.
iGPS, commercialized by Metris (formerly ArcSecond) [66], is a triangulation-based
localization system for tracking assets, personnel or any other mobile elements. To ac-
curately estimate the position of a receiver, a pair of eye-safe IR laser emitters radiate
a signal using two different wavelengths, while a an infrared strobe provides a reference
signal. Using signals from 3 or more transmitters, the receiver calculates and transmits
its position to a central data collecting station. In order to estimate the orientation of
a solid body, two or more receivers are attached to it. The iGPS system claims to offer
sub-centimetre accuracies.
Scientists from Olivetti Research designed the Active Badge location system, which
consisted of small badges that transmitted a unique ID via IR emitters [185]. The badges
were worn by people, who could then be located when in the vicinity of a receiving station.
The badge transmitted a unique identification code every 10 seconds. The system offered
sub-room accuracy, and was used to redirect phone calls for personnel.
2.5.4 Limitations
Common problems reported for photonic sensor localization are the ambient noise in the
form of light or thermal radiation [5, 121, 196], signal reflections [28, 86, 121] and in the
case of image processing solutions, illumination variability [123, 184, 162, 196].
In image processing solutions, ambient noise is usually overcome by image filtering
techniques. In the case of IR sensing, effects of ambient noise can be mitigated by using
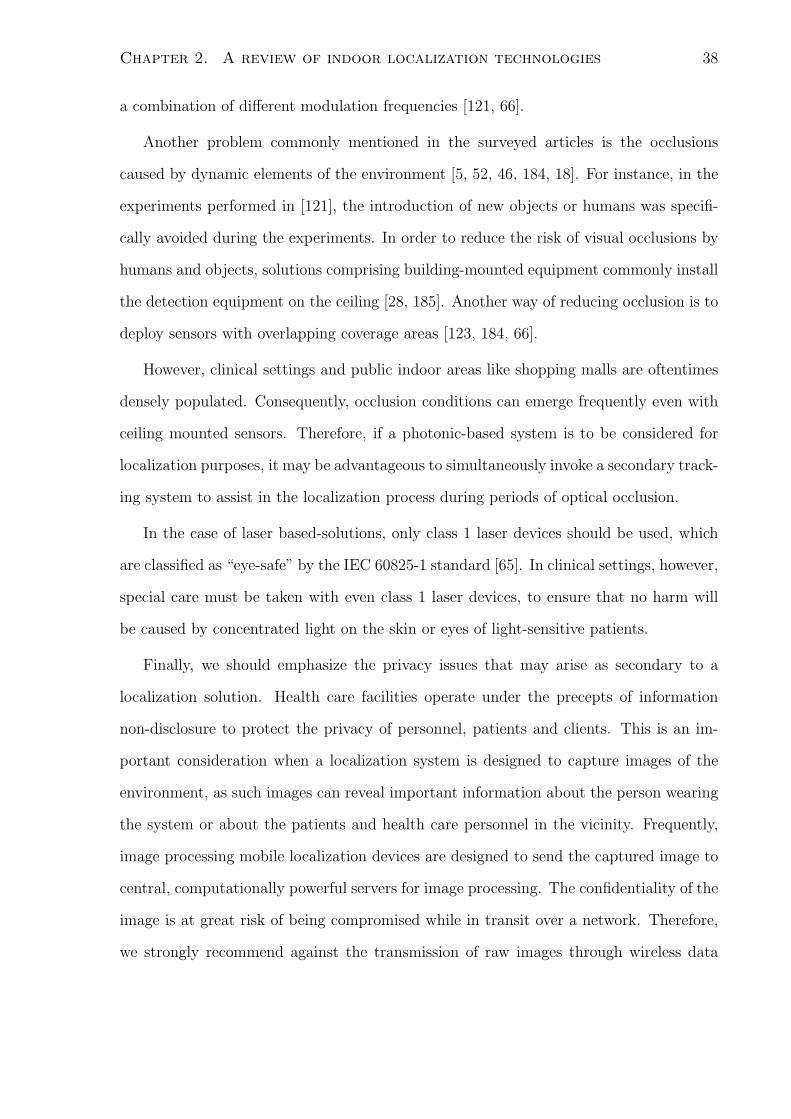
Chapter 2. A review of indoor localization technologies 38
a combination of different modulation frequencies [121, 66].
Another problem commonly mentioned in the surveyed articles is the occlusions
caused by dynamic elements of the environment [5, 52, 46, 184, 18]. For instance, in the
experiments performed in [121], the introduction of new objects or humans was specifi-
cally avoided during the experiments. In order to reduce the risk of visual occlusions by
humans and objects, solutions comprising building-mounted equipment commonly install
the detection equipment on the ceiling [28, 185]. Another way of reducing occlusion is to
deploy sensors with overlapping coverage areas [123, 184, 66].
However, clinical settings and public indoor areas like shopping malls are oftentimes
densely populated. Consequently, occlusion conditions can emerge frequently even with
ceiling mounted sensors. Therefore, if a photonic-based system is to be considered for
localization purposes, it may be advantageous to simultaneously invoke a secondary track-
ing system to assist in the localization process during periods of optical occlusion.
In the case of laser based-solutions, only class 1 laser devices should be used, which
are classified as “eye-safe” by the IEC 60825-1 standard [65]. In clinical settings, however,
special care must be taken with even class 1 laser devices, to ensure that no harm will
be caused by concentrated light on the skin or eyes of light-sensitive patients.
Finally, we should emphasize the privacy issues that may arise as secondary to a
localization solution. Health care facilities operate under the precepts of information
non-disclosure to protect the privacy of personnel, patients and clients. This is an im-
portant consideration when a localization system is designed to capture images of the
environment, as such images can reveal important information about the person wearing
the system or about the patients and health care personnel in the vicinity. Frequently,
image processing mobile localization devices are designed to send the captured image to
central, computationally powerful servers for image processing. The confidentiality of the
image is at great risk of being compromised while in transit over a network. Therefore,
we strongly recommend against the transmission of raw images through wireless data
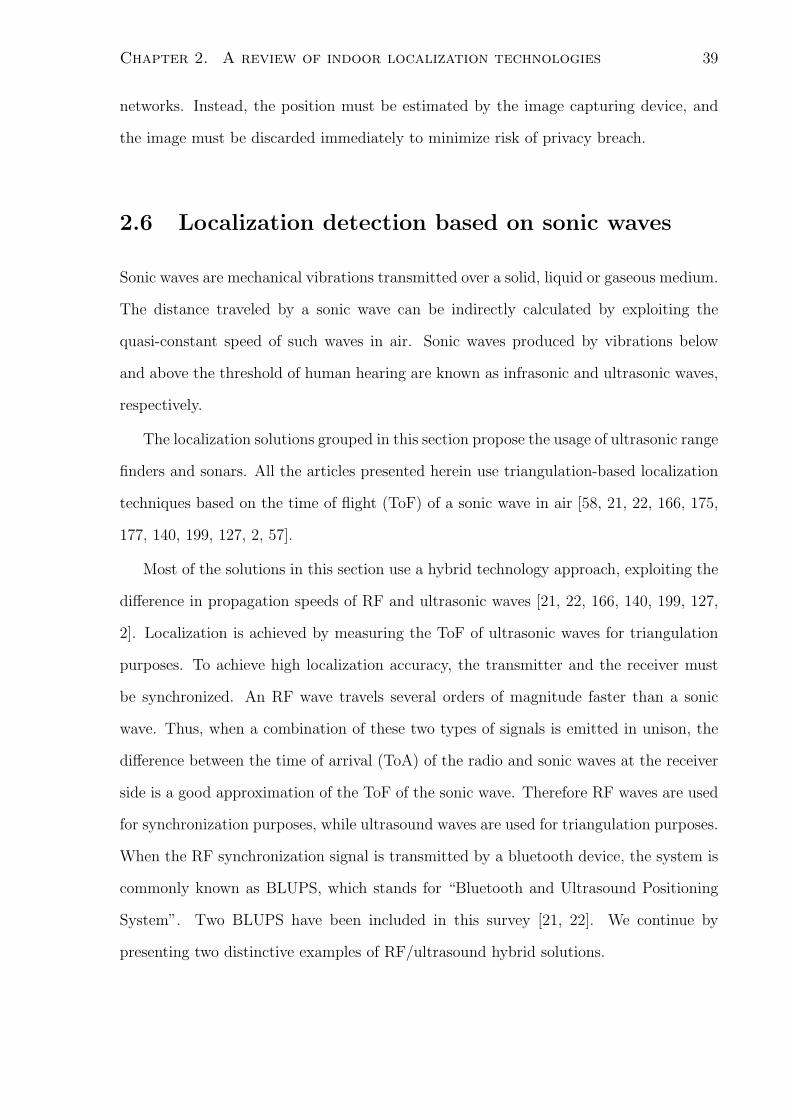
Chapter 2. A review of indoor localization technologies 39
networks. Instead, the position must be estimated by the image capturing device, and
the image must be discarded immediately to minimize risk of privacy breach.
2.6 Localization detection based on sonic waves
Sonic waves are mechanical vibrations transmitted over a solid, liquid or gaseous medium.
The distance traveled by a sonic wave can be indirectly calculated by exploiting the
quasi-constant speed of such waves in air. Sonic waves produced by vibrations below
and above the threshold of human hearing are known as infrasonic and ultrasonic waves,
respectively.
The localization solutions grouped in this section propose the usage of ultrasonic range
finders and sonars. All the articles presented herein use triangulation-based localization
techniques based on the time of flight (ToF) of a sonic wave in air [58, 21, 22, 166, 175,
177, 140, 199, 127, 2, 57].
Most of the solutions in this section use a hybrid technology approach, exploiting the
difference in propagation speeds of RF and ultrasonic waves [21, 22, 166, 140, 199, 127,
2]. Localization is achieved by measuring the ToF of ultrasonic waves for triangulation
purposes. To achieve high localization accuracy, the transmitter and the receiver must
be synchronized. An RF wave travels several orders of magnitude faster than a sonic
wave. Thus, when a combination of these two types of signals is emitted in unison, the
difference between the time of arrival (ToA) of the radio and sonic waves at the receiver
side is a good approximation of the ToF of the sonic wave. Therefore RF waves are used
for synchronization purposes, while ultrasound waves are used for triangulation purposes.
When the RF synchronization signal is transmitted by a bluetooth device, the system is
commonly known as BLUPS, which stands for “Bluetooth and Ultrasound Positioning
System”. Two BLUPS have been included in this survey [21, 22]. We continue by
presenting two distinctive examples of RF/ultrasound hybrid solutions.
Chapter 2. A review of indoor localization technologies 40
Teller, Jiawen and Balakrishnan [166] extend the localization system called ‘Cricket’ [127]
by making it pose-aware. The authors combined several ultrasonic receivers in a single
mobile unit. The separation between each sensor in the mobile unit was fixed. The phase
differences between the signal received at each sensor of the array were used to calculate
the orientation of the device with respect to the transmitter. This emulates the human
process of detecting the direction of an incoming sound. This extended version of Cricket
located the mobile unit with sub-centimetre accuracy, and reported angle accuracies were
down to a few degrees.
The localization system proposed in [140] is based on a technology called ‘the Bat’ [2,
57]. In the Bat, the ultrasound signal is emitted by the mobile device. The ceiling of
the environment is instrumented with several RF transmitter-ultrasound receiver units.
The ceiling mounted units were interconnected and synchronized. After simultaneously
emitting a radio pulse, the ceiling units waited for a reply from the mobile stations. A
mobile unit in turn sent a reply as soon as it detected a radio beacon. The creators of
the Bat reported accuracies under 9 centimetres, 95% of the time.
In a different vein, three of the selected articles presented localization systems based
solely on ultrasound waves [58, 175, 177]. In these solutions, wide band sonic signals were
required. To achieve accurate localization, spread spectrum code division techniques were
used. Spread spectrum code division allows several emitters to transmit signals, sharing
the same frequency band concurrently, causing minimal interference to other signals being
transmitted [119].
Hazas and Hopper [58] presented a localization system called “Dolphin” which em-
ploys broadband ultrasonic waves. The advantage of broadband ultrasound is the ability
to localize a mobile station with ultrasound signals without an external synchronization
system. In particular, Direct Sequence Code Division Multiplexing (DS/CDM) tech-
niques were used to combine multiple signals simultaneously over the same frequency
spectrum. The authors reported maximum localization errors of 10 centimetres 95% of
Chapter 2. A review of indoor localization technologies 41
the time. Along the same lines, in [177] broadband ultrasound signals and DS/CDM
techniques were used for localization purposes. Beacon units were fixed at predefined
positions of the environment. Such beacons transmitted a unique ID using DS/CDM.
The receiver location was calculated via hyperbolic trilateration, using the difference
between the time of arrival difference of time of arrival (DToA) of the signals received
from the beacon. The authors reported localization errors in the millimetre range. Al-
though the localization system was proposed for utilization on the scale of a full building,
experiments were only conducted in a limited area.
2.6.1 Limitations
In this section we list the common challenges associated with sonic wave localization
systems. Some authors reported that high levels of ambient noise commonly encumber
the detection of the sonic signal [58, 22, 173]. This is particularly important when
considering the deployment of a sonic localization solution for healthcare facilities, where
areas of the building can be densely populated and noisy (e.g., emergency rooms or
hospital foyers).
Another common issue is the co-interference caused by the presence of multiple sonic
emitters in the environment. This condition encumbers the isolation of single sources.
Common narrow-band ultrasound emitters may be affected by this condition [58]. The
most common emitter disambiguation technique is to combine ultrasound-based trian-
gulation with RF beacons. These composite solutions communicate the emitter ID via
a different physical channel, assign time slots to multiple emitters, and thereby avoid
interference at the cost of reduced accuracy.
Recent research proposes broadband ultrasonic emitters as means of overcoming the
concurrent interference problem associated with narrow-band sonic sensors. The usage
of a wideband signal allows for multiple access techniques such as DS/CDM, which are
commonly used in telecommunication solutions (i.e., cellular phone networks. These
Chapter 2. A review of indoor localization technologies 42
techniques provide improved noise resilience, while allowing multiple emitting stations
to transmit in synchrony over a single ultrasound channel. This eliminates the need for
additional communication channels [58], reducing the complexity of the system.
All the solutions considered in this survey estimate the position of a mobile device
based on the triangulation of the ToF of a sonic wave. The speed of sound over air is
an important factor in such calculations. Temperature variations are known to affect
the speed of sound in air [58, 21, 22, 173, 57]. Therefore, sonic wave based systems
cannot be used in environments with frequent and drastic temperature or environmental
changes [22].
Finally, the propagation properties of sonic waves in indoor environments pose a
challenge for accurate position estimation. Elements in the environment such as furniture,
walls and their salient edges cause echoes. The appearance of such echoes can lead to
localization inaccuracies [22, 175, 140, 57]. Obstructions between the receiver and the
transmitter can cause NLOS conditions, which contribute to erroneous distance estimates
[21, 22]. The dynamic nature of healthcare facilities represents a challenge. Installation
of ceiling-mounted transmitters or receivers may, to a certain extent, alleviate some of
the problems associated with environmental conditions.
2.7 Localization detection based on inertial or me-
chanical sensors
The articles included in this section measure energy exerted by the mechanical movement
of the element being tracked. Such energy can be measured via direct application of force,
or by exploiting the inertial properties of an element of negligible mass (when compared
to the mass of the object being tracked) that deflects from its fixed position within a
reference frame when it is subject to acceleration or angular rotation.
Three articles were included in this section, one based on mechanical contact [108],
Chapter 2. A review of indoor localization technologies 43
and two based on inertial sensing [39, 138].
2.7.1 Localization detection based on mechanical coupling or
activation
A sensory block consisting of a 60 by 60 centimetre metallic shelf was instrumented with
load cells. Several sensory blocks were used as the support structure for a wooden floor.
The separation between sensory blocks was of 20 centimetres. An experiment for tracking
a single user was conducted, reporting a localization accuracy of 28.3 centimetres 85% of
the time. Experiments were designed to track two users with intersecting paths following
different walking patterns. The introduction of a second user reduced the localization
accuracy during experiments involving non-intersecting paths, to 28.3 centimetres 76%
of the time. The system could only differentiate between users if their weights were
extremely different, i.e. the experiments were conducted with two participants, weighing
50 and 90 kilograms. Accuracy was not reported.
Similarly, in a project called “Smart Floor” [108], metallic plates were instrumented
with load cells. These plates were then laid on the floor. In order to identify the person
walking over a plate, the signal captured via the load cell was processed in order to select
a set of 10 features. Such features emerged as distinctive for each pedestrian. The system
required an off-line stage, in which the users to be identified walked over the plates of
the Smart Floor. The data captured during the off-line stage served to create a database
of stepping features for each user. Later, during the on-line stage, the features extracted
via the load cells are matched with the features stored in the database, using a nearest-
neighbour algorithm. 15 participants were tracked and identified during an experiment.
The system achieved a user recognition rate of 93%. As well, the authors investigated the
effects of different footwear on recognition accuracy, concluding that there as no effect.
Since Smart Floor relies on mechanical contact, it can be classified as a proximity-based
localization system.
Chapter 2. A review of indoor localization technologies 44
2.7.2 Localization detection based on inertial sensors
All the articles included in this section considered a hybrid solution, combining iner-
tial sensors with a different localization technology that provided absolute positioning
information [39, 138, 24]. Since inertial sensors yield relative positioning information
only, an absolute reference is required to specify the displacement reported by an inertial
measurement in absolute coordinates. Inertial sensors proposed in the selected articles
include gyroscopes, accelerometers and inclinometers.
Evennou and Marx [39] proposed a localization system based on an IEEE 802.11
wireless network. The absolute positional information obtained from the wireless network
was combined with the relative displacements and rotations reported by a gyroscope, a
dual-axis accelerometer and a pressure sensor. The information obtained from all the
sensors was combined through Kalman and particle filtering [160, 9]. To calculate the
displacement of the user, the accelerometer was used to count the number of steps taken.
Then, a constant estimate of the stride length of the user was used to calculate the total
displacement of the user within the environment. The authors showed that combining
the information from the bank of sensors yielded improved localization when compared
to the usage of each sensor separately. Evenou and Marx conducted an experiment using
their multi-sensor localization system. The localization accuracies reported during such
experiment ranged from 1.53 to 3.32 metres.
In [138], Retscher presented another multi-sensor localization system, which included
inertial sensors. This system was based on a localization infrastructure named “ipos”.
The system was composed of a combination of a fingerprint-based Wireless Local Area
Network (WLAN) localization technology, a digital compass, a pressure sensor, and three
accelerometers, plus a GPS unit for outdoor localization. Retscher characterized different
brands and makes of each type of sensor. By analyzing the inertial sensors separately,
localization accuracies between 5 to 8 metres were obtained. The distance traveled by
the user was calculated based on stride frequency, detected through accelerometry. A
Chapter 2. A review of indoor localization technologies 45
pre-estimate of the stride length was used to estimate the displacement of the user. The
system was reported as highly dependent on the walking patterns of each user. Finally,
Retscher conducted an experiment in an indoor environment, using the wireless network
localization system combined with the dead reckoning sensors, reporting approximate
localization accuracies of 3 metres. Kalman filtering was invoked to combine the inputs
from multiple sensors.
The solutions based on inertial sensing were classified as dead reckoning localization
techniques, since the location estimates provided by such sensors depend on previous
measurements to estimate the absolute position or orientation of the object being tracked
at a given instant.
2.7.3 Limitations
One of the main issues with inertial sensors is the drift associated with thermal changes
and inherent noise [39].
Drift measurement deviations are mainly caused by thermal changes in the circuitry of
the sensor. The effects of such deviations can significantly affect the location estimation
process. Since double integration is required to estimate the displacement of an object
based on its acceleration, any small measurement error will be accumulated over time,
leading to aberrant position estimation. To avoid this condition, in [39] and [138] the
displacement of a user is estimated considering a constant stride length. In this case,
however, the accuracy of the system is highly dependent on the walking pattern of the
user.
As mentioned earlier, inertial sensors can only yield relative motion estimates. There-
fore, a system that provides an absolute positional reference is required to report absolute
location estimates. While an absolute positioning system could be used as the unique
localization technology, the addition of the information provided by inertial sensors can
lead to improved localization accuracies, as discussed earlier. Recall that solutions based
Chapter 2. A review of indoor localization technologies 46
on photonic and sonic sensors can be rendered unavailable due to occlusions. A dead
reckoning system could be used to account for such periods of unavailability.
2.8 Other localization technologies
This section groups a reduced number of articles that were not included in any of the
previous sections, but which matched the inclusion criteria. The sensing technologies
included in this section were pressure and magnetic sensors.
Evennou and Marx [39] and Retscher (2007) [138] used atmospheric sensors as part
of a multi-sensor localization system to estimate the altitude of a user. In both articles,
vertical storey level accuracy is reported. In [138], Retscher characterized different com-
mercial pressure sensors, recommending the pressure sensor PTB 220 manufactured by
Vaisala. This sensor yielded an accuracy of 33 cm.
In [138], a digital compass was used in a multi-sensor localization system to assist with
bearing estimation. The author reported spurious electromagnetic field disturbances that
affected the readings of the compass when in proximity to metallic structures or radio
wave emitting devices.
2.9 Discussion
A brief summary of localization principle, merits and limitations of the aforementioned
technologies is presented in Table 2.1.
2.9.1 Recommendations
The foregoing review has suggested 1) a need for research towards rehabilitation of to-
pographical disorientation, 2) the existence of devices for ameliorating cognitive im-
pairments, but limited research and development of devices suitable for topographical
Chapter 2. A review of indoor localization technologies 47
disorientation, and 3) the existence of research towards the development of localization
systems that could be incorporated into assistive technologies for topographical disori-
entation. In this section, we will present some recommendations to guide the selection
of a suitable localization technology for assisted navigation.
Based on previous research, each type of localization system has advantages and
shortcomings. By combining some of these technologies, we may exploit the advantages
of the individual technologies while mitigating their respective shortcomings. Some of the
selected articles in the last section have proposed effective combinations of technologies
[39, 138] or mention the advantages of such composite systems [22, 5, 193, 186]. We will
briefly consider the types of technologies that may be especially conducive to combination.
Recall that one of the main shortcomings of technologies based on scene scanning
and triangulation techniques for localization purposes is the dynamic nature of indoor
environments. Changes in the environment will diminish the efficacy of the localization
algorithms used in the system. For instance, furniture or personnel agglomeration in
an office could adversely affect both laser range scanners and RF systems, leading to
temporary or permanent failures in localization detection. On the other hand, the self
contention of dead reckoning systems allows them to provide constant tracking of the
desired target because their measurements do not depend on external elements. This
self contention also means that solutions based on dead reckoning will normally require
calibration and acquisition of initial position and altitude. Finally, the self-contained
nature of dead reckoning systems makes them prone to drifting errors, corrupting the
localization information delivered by the sensors from true values [39].
Therefore the combination of a system based on scene scanning or triangulation local-
ization techniques with a system using dead reckoning sensors would provide the strengths
of both systems, allowing real time tracking of the element to be located provided by
the dead reckoning sensors, even if the other localization system is unavailable due to
environmental factors, while the scene scanning or triangulation-based system would pro-
Chapter 2. A review of indoor localization technologies 48
vide accurate position information for recalibration purposes and a start point for initial
measurements.
In fact, such a combination is present in the articles surveyed in the last section
[39, 138]. The selection of technologies to be used will be dependent on the requirements
imposed by the application. For instance, a solution based on RF signals would not
be desirable in environments with high RF noise, or the solution proposed would con-
flict with elements present in the environment; for instance IEEE 802.11 access points
should not be installed in the same building as medical equipment using the same fre-
quency band reserved for medical equipment (ISM), or localization systems based on
sonic waves should not be used in environments with unstable temperature conditions.
Other constraints should take into account the complexity and cost of installation of a
particular solution.
Certain technical challenges must be taken into account while considering the com-
bination of multiple types of sensors to create a robust localization system. Since the
localization update rates and errors associated to each type of sensor can be different,
optimal schemes to combine localization data from multiple error-prone sources must be
used. We can see that in fact, several algorithms of this sort are mentioned in the arti-
cles reviewed, for instance, Kalman filtering and particle filtering among other techniques.
One more aspect to consider is that, the addition of elements to a system normally in-
crease the complexity of such system, making it more prone to unavailability conditions
due to failure of one or more components.
Other constraints to be taken into account are the complexity and cost of deployment
of a particular solution. For instance, for some solutions the pre-existing deployment
of infrastructure might reduce time and cost of implementation of a localization system.
For instance, some solutions use existing unmodified IEEE 802.11 infrastructure networks
[197, 191, 39, 84, 138, 83, 114, 164, 122, 12], and some others benefit from already existing
video surveyance systems [123, 196].
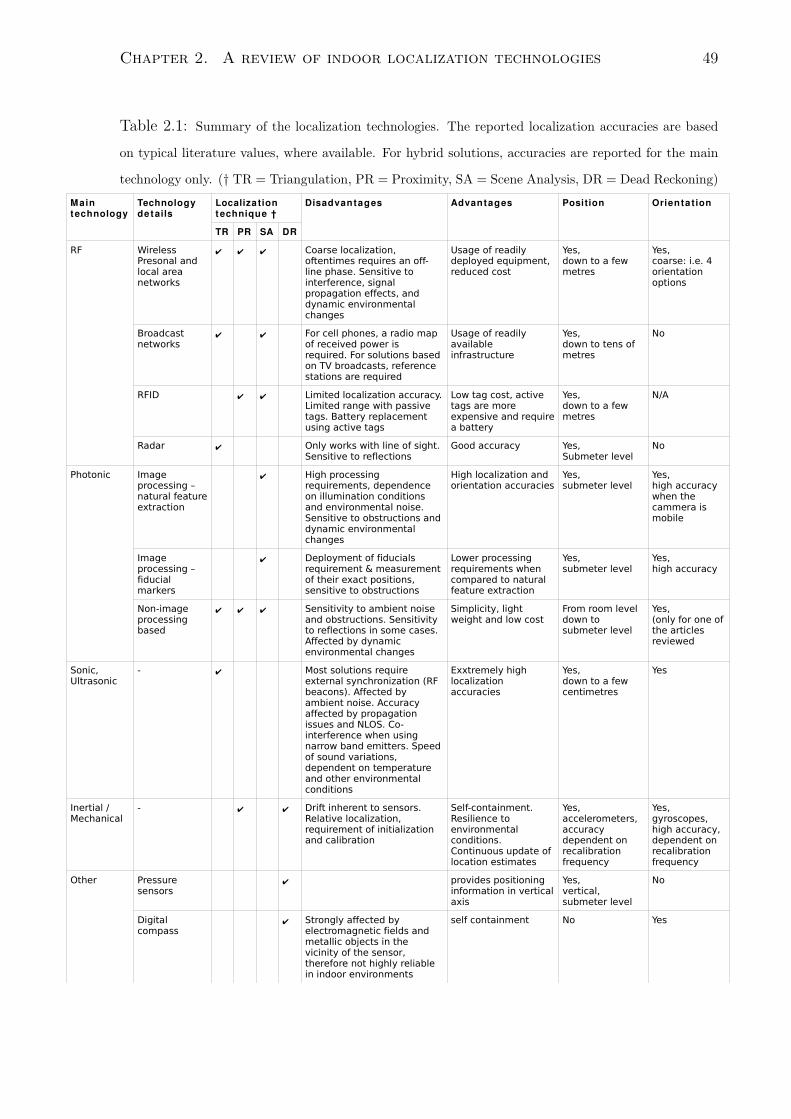
Chapter 2. A review of indoor localization technologies 49
Table 2.1: Summary of the localization technologies. The reported localization accuracies are based
on typical literature values, where available. For hybrid solutions, accuracies are reported for the main
technology only. († TR = Triangulation, PR = Proximity, SA = Scene Analysis, DR = Dead Reckoning)
Maintechnology
Technologydetails
Localiza tiontechnique †
Disadvantages Advantages Position Orienta tion
TR PR SA DR
RF WirelessPresonal andlocal areanetworks
� � � Coarse localization,oftentimes requires an off-line phase. Sensitive tointerference, signalpropagation effects, anddynamic environmentalchanges
Usage of readilydeployed equipment,reduced cost
Yes,down to a fewmetres
Yes,coarse: i.e. 4orientationoptions
Broadcastnetworks
� � For cell phones, a radio mapof received power isrequired. For solutions basedon TV broadcasts, referencestations are required
Usage of readilyavailableinfrastructure
Yes,down to tens ofmetres
No
RFID � � Limited localization accuracy.Limited range with passivetags. Battery replacementusing active tags
Low tag cost, activetags are moreexpensive and requirea battery
Yes,down to a fewmetres
N/A
Radar � Only works with line of sight.Sensitive to reflections
Good accuracy Yes,Submeter level
No
Photonic Imageprocessing �natural featureextraction
� High processingrequirements, dependenceon illumination conditionsand environmental noise.Sensitive to obstructions anddynamic environmentalchanges
High localization andorientation accuracies
Yes,submeter level
Yes,high accuracywhen thecammera ismobile
Imageprocessing �fiducialmarkers
� Deployment of fiducialsrequirement & measurementof their exact positions,sensitive to obstructions
Lower processingrequirements whencompared to naturalfeature extraction
Yes,submeter level
Yes,high accuracy
Non-imageprocessingbased
� � � Sensitivity to ambient noiseand obstructions. Sensitivityto reflections in some cases.Affected by dynamicenvironmental changes
Simplicity, lightweight and low cost
From room leveldown tosubmeter level
Yes,(only for one ofthe articlesreviewed
Sonic,Ultrasonic
- � Most solutions requireexternal synchronization (RFbeacons). Affected byambient noise. Accuracyaffected by propagationissues and NLOS. Co-interference when usingnarrow band emitters. Speedof sound variations,dependent on temperatureand other environmentalconditions
Exxtremely highlocalizationaccuracies
Yes,down to a fewcentimetres
Yes
Inertial /Mechanical
- � � Drift inherent to sensors.Relative localization,requirement of initializationand calibration
Self-containment.Resilience toenvironmentalconditions.Continuous update oflocation estimates
Yes,accelerometers,accuracydependent onrecalibrationfrequency
Yes,gyroscopes,high accuracy,dependent onrecalibrationfrequency
Other Pressuresensors
� provides positioninginformation in verticalaxis
Yes,vertical,submeter level
No
Digitalcompass
� Strongly affected byelectromagnetic fields andmetallic objects in thevicinity of the sensor,therefore not highly reliablein indoor environments
self containment No Yes
Chapter 3
A flexible routing scheme
Torres-Solis J and Chau T (2007). A flexible routing scheme for patients with topograph-
ical disorientation. Journal of Neuroengineering and Rehabilitation, 4:44 (11 pages)
3.1 abstract
Background: Individuals with topographical disorientation have difficulty navigat-
ing through indoor environments. Recent literature has suggested that ambient intel-
ligence technologies may provide patients with navigational assistance through auditory
or graphical instructions delivered via embedded devices.
Method: We describe an automatic routing engine for such an ambient intelligence
system. The method routes patients with topographical disorientation through indoor
environments by repeatedly computing the route of minimal cost from the current loca-
tion of the patient to a specified destination. The cost of a given path not only reflects the
physical distance between end points, but also incorporates individual patient abilities,
the presence of mobility-impeding physical barriers within a building and the dynamic
nature of the indoor environment.
50
Chapter 3. A flexible routing scheme 51
Results: We demonstrate the method by routing simulated patients with either topo-
graphical disorientation or physical disabilities. Additionally, we exemplify the ability to
route a patient from source to destination while taking into account changes to the build-
ing interior. When compared to a random walk, the method offers potential cost-savings
even when the patient follows only a subset of instructions.
Conclusions: The routing method presented reduces the navigational effort for pa-
tients with topographical disorientation in indoor environments, accounting for physi-
cal abilities of the patient, environmental barriers and dynamic building changes. The
routing algorithm and database proposed could be integrated into wearable and mobile
platforms within the context of an ambient intelligence solution.
3.2 Background
Topographical orientation is the ability to orient oneself within the environment and
to navigate through it to specific destinations [13]. Through recent magnetic resonance
imaging studies, specific structures such as the parahippocampal gyrus [163], parietal cor-
tex [100] and temporal cortical areas [10] have been implicated as neural mechanisms for
topographical orientation. It is generally agreed that in normative way-finding, humans
employ a number of different way-finding strategies, including landmark recognition,
route learning and map-like representations [3]. The particular choice of strategy is de-
pendent on the individual’s developmental age, the familiarity with the environment, the
manner by which the environment was introduced, the level of detail in the environment
and the specific navigational task at hand.
Topographical disorientation generally refers to the family of deficits in orientation
and navigation in the real environment. Aguirre and D’Esposito [3] note that difficulties
in way-finding may arise from a variety of different lesions or injuries and provide a
well-accepted taxonomy of this disorder. For example, people living with post-traumatic

Chapter 3. A flexible routing scheme 52
effects of brain injury often have symptoms such as weakness in visual scanning skills,
complex attention, prospective memory and sequential processing [90]. These symptoms
can lead to problems of interaction with and perception of the surrounding environment,
even several years after the injury [145],[36]. It is well recognized that topographical
disorientation [180] and spatial navigation deficits [157] are common sequelae of brain
injury.
Current therapies for topographical disorientation, such as simple mnemonic tech-
niques [34] or compensatory wayfinding strategies [8], often require the presence of an
occupational therapist over extended periods of time. Consequently, conventional ther-
apies are both time and human resource intensive. Recent developments in ambient
intelligence suggest that navigational support to patients with topographical disorienta-
tion among other disabilities, may be provided by smart technologies embedded in the
environment and wearable devices [101, 142, 38]. An ambient intelligence (AmI) system
would be aware of the patient’s location and physical abilities as well as the building’s
structural layout. The AmI system would provide context-specific navigational assistance
in the form of visual or verbal cues through an augmented reality interface. As a first
step towards such a system, Chau et al. [23] reported a desktop augmented reality sys-
tem for patients with acquired brain injury where pictures of navigation decision points
inside a building were superimposed on the real environment to encourage the retraining
of wayfinding skills. In terms of an embedded implementation, Blache et al. [17] re-
cently proposed a full-fledged ambient intelligence navigation solution using a relational
database to maintain information about the building structure and mobile entities within,
a Dijkstra routing engine for navigation, WLAN for user localization and a PDA as the
user interface.
In this paper, we focus specifically on the central processing module of an indoor
ambient intelligence system, namely the routing engine. In particular, we address some
previously unconsidered challenges of routing patients with topographical disorientation.
Chapter 3. A flexible routing scheme 53
The Dijkstra algorithm serves to calculate the shortest path tree, originating at a
single source node, to all the nodes of a connected graph. The weights associated with
the edges of the connected graph must be non-negative for the Dijkstra algorithm to
work. The generation of the whole routing tree from a single source with n nodes and m
edges is a problem of complexity O(n2).
A common application of the Dijkstra algorithm is found in the Open Shortest Path
First (OSPF) routing protocol, an dynamic interior gateway protocol used to route data
packets in computer networks. OSPF is one of the most prevalent interior gateway
protocol on the Internet. OSPF obtains link state information from the routers reachable
in an internal network (known as an autonomous system), creating a map of such network.
OSPF can detect broken links dynamically, reshaping the network map as required. The
shortest path between a source and a destination router can be calculated using the
network map created by the routing protocol. The metric to minimize while calculating
the shortest route can be based on link reliability, available throughput, physical distance,
network transmission delay or some other parameter chosen by the network designer.
When considering human routing tasks, each person has unique abilities and limi-
tations, implying that a given environment may present different challenges to different
users. Furthermore, the indoor environment may be dynamic: certain pathways may
become unavailable due to facility cleaning and maintenance, renovation projects, spe-
cial events or emergency closures. This is especially true in busy hospital environments.
Finally, due to spatial disorientation, patients may make errors along the recommended
route. These challenges imply that a single set of navigational instructions would not
suffice and some form of dynamic and patient-specific routing is required.
3.2.1 Selective routing
In typical routing schemes such as the Routing Information Protocol (RIP) [59],[93], the
Open Shortest Path First (OSPF) protocol [102],[103] or the Border Gateway Protocol
Chapter 3. A flexible routing scheme 54
version 4 (BGP-4)[137], all the routed elements (e.g., packets) are processed in a uniform
manner. In the present case, however, we intend to route patients, each with unique
characteristics. The minimum distance route assuming uniformly processed packets is
therefore not necessarily the optimal solution.
In recent years, some authors have suggested selective routing for packet networks as
a means to implement Quality of Service (QoS) mechanisms for different types of traffic
on the Internet [30],[165]. These routing schemes take into account the type of traffic
that the packet carries based on a tag (packet context) and the topology of the network.
In other words, each packet is given individualized treatment, either on the basis of its
content or to maximize network efficiency. The selective routing idea is an appealing
approach to route patients based on their individual characteristics and attributes of the
environment. To the best of our knowledge, selective routing of human subjects has not
been previously reported in the literature.
3.3 Proposed method
The proposed patient routing scheme consists of a database, weighted connected graph
and a routing algorithm. Each component will be described in turn.
3.3.1 Database
Information pertaining to patient disability, the building layout and environmental bar-
riers along paths of travel are organized into a relational database consisting of three
tables.
An adjacency table captures the building layout which is represented by a connected
graph. The content of this table is the upper triangle of an adjacency matrix for the
graph, coded as triplets of the form (node A, node B, ID), indicating a connection (edge)
between node A and node B. The ID element is a numerical identifier which serves as a
Chapter 3. A flexible routing scheme 55
key into an accompanying context table.
A context table embodies information about environmental barriers. This table holds
the attributes of each edge or link of the graph in the form of numerical weights. Example
attributes include the physical distance of the link, the tread length and rise height of
each step and the number of steps in a staircase, the level of illumination (luminous
intensity) or the multiplicity of nearby permanent landmarks. In practice, the values of
these attributes could be physically measured or derived from architectural drawings.
A patient table captures vital information about the patient, namely, personal data
such as name, age, sex, contact information, and most importantly, individual ability
levels. The latter were captured via a set of weights denoting the individual’s ability
to negotiate stairs, ramps, elevators, poor illumination and other potential barriers to
mobility. A patient is defined in the database by specifying the attribute values for
the fields in the patient table. For example, a patient without disability might have
zero values for stair difficulty, ramp difficulty and low illumination fields while a patient
with impaired mobility might have a large positive value for the stair difficulty field.
In practice, the weights in the patient table might be determined from standardized
assessments for gross motor function (e.g., GMFCS [113]), visual acuity or dynamic
balance (e.g., center-of-mass kinematics [27]).
Figure 3.1 shows a graphical representation of a simple database with some sample
fields. In our implementation, the database was implemented in MySQL.
3.3.2 Generation of a weighted connected graph
As alluded to earlier, a connected graph represented the target building. Deriving the
graph involved strategically placing nodes and estimating weights, each of which is ex-
plained below.
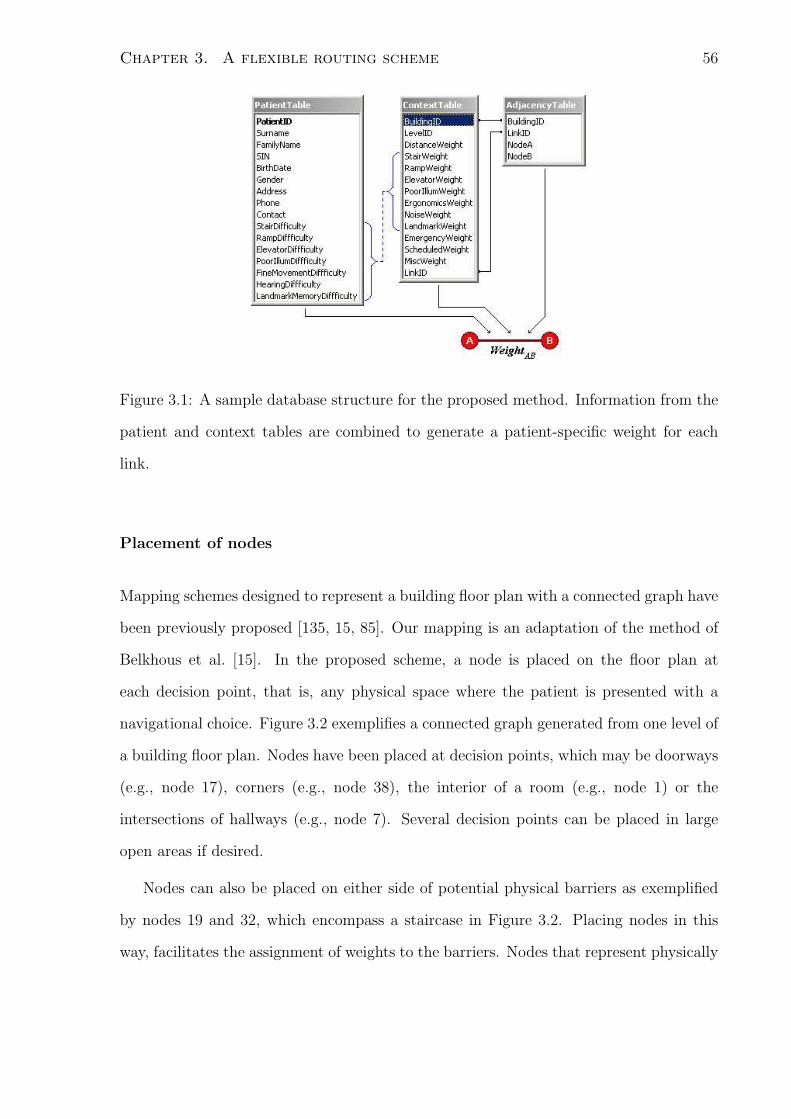
Chapter 3. A flexible routing scheme 56
Figure 3.1: A sample database structure for the proposed method. Information from the
patient and context tables are combined to generate a patient-specific weight for each
link.
Placement of nodes
Mapping schemes designed to represent a building floor plan with a connected graph have
been previously proposed [135, 15, 85]. Our mapping is an adaptation of the method of
Belkhous et al. [15]. In the proposed scheme, a node is placed on the floor plan at
each decision point, that is, any physical space where the patient is presented with a
navigational choice. Figure 3.2 exemplifies a connected graph generated from one level of
a building floor plan. Nodes have been placed at decision points, which may be doorways
(e.g., node 17), corners (e.g., node 38), the interior of a room (e.g., node 1) or the
intersections of hallways (e.g., node 7). Several decision points can be placed in large
open areas if desired.
Nodes can also be placed on either side of potential physical barriers as exemplified
by nodes 19 and 32, which encompass a staircase in Figure 3.2. Placing nodes in this
way, facilitates the assignment of weights to the barriers. Nodes that represent physically
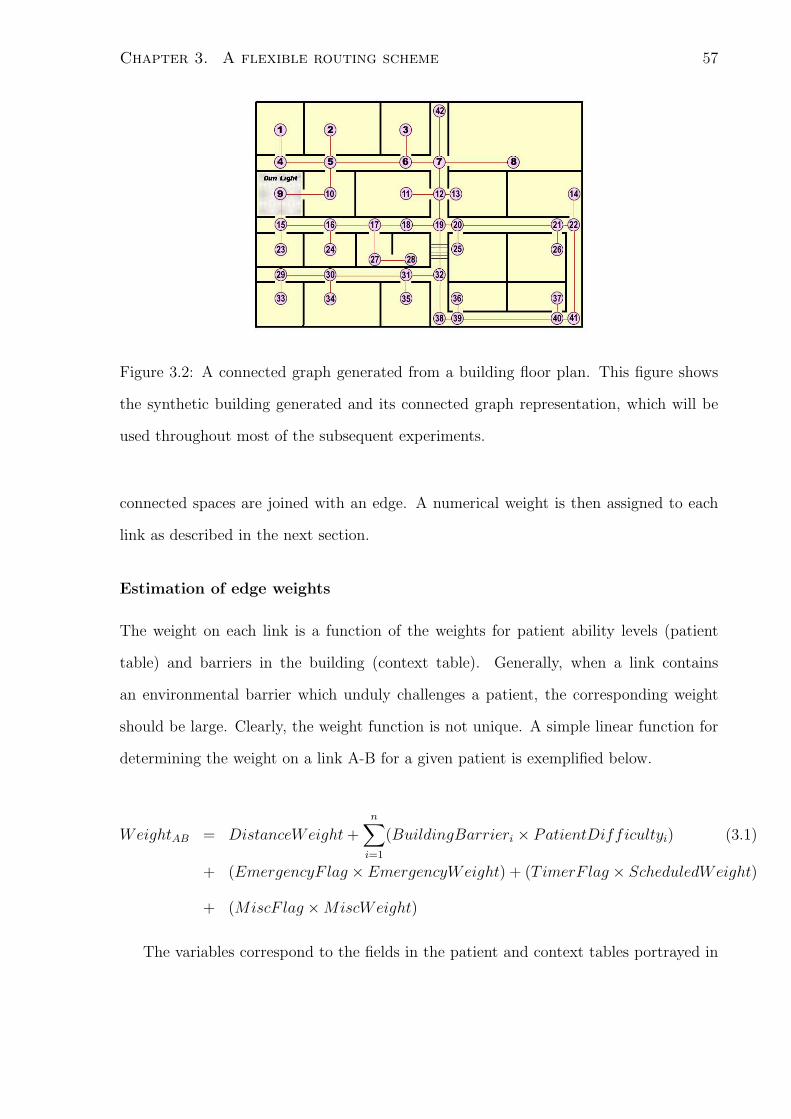
Chapter 3. A flexible routing scheme 57
Figure 3.2: A connected graph generated from a building floor plan. This figure shows
the synthetic building generated and its connected graph representation, which will be
used throughout most of the subsequent experiments.
connected spaces are joined with an edge. A numerical weight is then assigned to each
link as described in the next section.
Estimation of edge weights
The weight on each link is a function of the weights for patient ability levels (patient
table) and barriers in the building (context table). Generally, when a link contains
an environmental barrier which unduly challenges a patient, the corresponding weight
should be large. Clearly, the weight function is not unique. A simple linear function for
determining the weight on a link A-B for a given patient is exemplified below.
WeightAB = DistanceWeight +n∑
i=1
(BuildingBarrieri × PatientDifficultyi) (3.1)
+ (EmergencyF lag × EmergencyWeight) + (TimerF lag × ScheduledWeight)
+ (MiscF lag × MiscWeight)
The variables correspond to the fields in the patient and context tables portrayed in
Chapter 3. A flexible routing scheme 58
Figure 3.1 The DistanceWeight represents the physical distance between nodes A and
B. The BuildingBarrieri variable corresponds to the stair, ramp, elevator or illumina-
tion weights while PatientDifficultyi denotes the corresponding patient ability level.
For example, if the patient has impaired vision (high weight value for poor illumination
difficulty in the patient table) and the link A-B denotes a dimly lit corridor (high weight
value for poor illumination in the context table), then the product of the corresponding
weights will make a large contribution to the overall weight on the link. EmergencyFlag,
TimerFlag and MiscFlag are flags that indicate the occurrence of, respectively, an emer-
gency code (e.g., fire), a time-dependent event (e.g., closure of a certain doorway at a
specific time) and other miscellaneous situations which may affect patient routing. These
flags might be toggled by alarm or monitoring systems within the building.
In this manner, the connected graph has different edge weights for different patients
negotiating the same building. The final weighted graph is used in the determination of
the optimal route. Evidently, links with large weights relative to those on other links are
not favoured during routing.
3.3.3 Routing scheme
Once we have a weighted graph representing the building layout, patient abilities and
environmental barriers, a routing scheme can be deployed. Different optimization algo-
rithms have been proposed for calculating the shortest path between two connected nodes
in a graph. The Dijkstra algorithm, a time-honored graph-theoretic method [35] has been
widely applied for routing packets in communication networks, and is still widely used by
core routers, implemented in the ’Open Shortest Path First’ (OSPF) routing algorithm
[102],[103]. It is also commonly applied for routing human subjects [17], mobile elements
(i.e. robots) and virtual or simulated subjects in labyrinths and maps [135],[153],[15]. We
therefore invoked the Dijkstra algorithm [35], which was programmed in PERL for sim-
plicity of data management. Unlike conventional implementations that rely on a static
Chapter 3. A flexible routing scheme 59
graph, our approach uses a dynamically changing graph. Recall that there is a naviga-
tional choice at each node. Whenever the user reaches a new node, the routing algorithm
references the context table in the database to obtain an up-to-date status of the indoor
environment. With the current and destination nodes and most up-to-date estimation of
edge weights as inputs, the algorithm returns the path of minimal cost. In this way, the
“optimal” route in terms of minimal distance and best fit between environmental con-
text and patient ability is found dynamically. Recalculating the route at every node has
been previously proposed as a strategy to account for human mistakes [135]. However,
previous work did not simultaneously accommodate environmental changes which may
alter the building map and consequently, the graph structure.
3.4 Simulations
3.4.1 Patient simulator
We created a program to simulate a patient navigating through a building by following
the directions given by the Dijkstra engine. To model patient disorientation, we defined
a confusion probability, PC , that is, the probability of randomly selecting the next node
rather than that recommended by the Dijkstra engine. The simulation program accepts
as inputs the origin and destination nodes and the confusion probability. The patient
simulation program with a confusion probability, PC , operated as follows.
1. The patient starts at a given source node.
2. The program generates a random number, X, between 0 and 1 from a uniform
distribution.
(a) If X < PC , a random navigational decision is made. The program consults
the interconnection map (adjacency table) to determine the number of possible
paths emanating from the current node. One of the available adjacent nodes is
Chapter 3. A flexible routing scheme 60
randomly selected as the next position of the patient. Note that it is possible
that either the path suggested by the Dijkstra algorithm or the path back to
the patient’s previous location might be selected.
(b) Otherwise, if X > PC , the navigational decision is per the Dijkstra recom-
mendation. The Dijkstra algorithm finds the optimal route using the current
node as the origin node. The simulation program consults the context table
to account for any recent changes in the environment. The patient will move
to the next node as indicated by the Dijkstra engine.
3. Step 2 is repeated upon arrival at each new node until the patient reaches the
destination node.
3.4.2 Simulation of patients with topographical disorientation
A connected graph with 10 nodes and different weights for the links was constructed
as shown in Figure 3.3. We simulated patients with five different confusion levels, each
traveling from node 1 to node 10. The minimum distance path was 1 − 3 − 7 − 10. The
confusion probabilities were 0.25, 0.5, 0.75, 0.90 and 1.0. The last patient (PC = 1.0)
served as the benchmark subject who did not follow any navigational instructions and
simply wandered randomly around the building until he stumbled upon the destination
node. Wandering behaviour has been previously observed in patients with acquired brain
injury [180]. Each patient was simulated 1000 times to account for route variations arising
from random navigation when PC 6= 0. For the patient who followed every navigational
instruction, i.e., PC = 0, the Dijkstra-suggested optimal path was unique and hence
this patient was simulated only once. The number of nodes traversed between source
and destination, the travel cost and the number of random decisions were recorded for
each trial. After 1000 trials, the above data from patients with decreasing confusion
probability, were compared against the random walk (PC = 1) results using a Wilcoxon
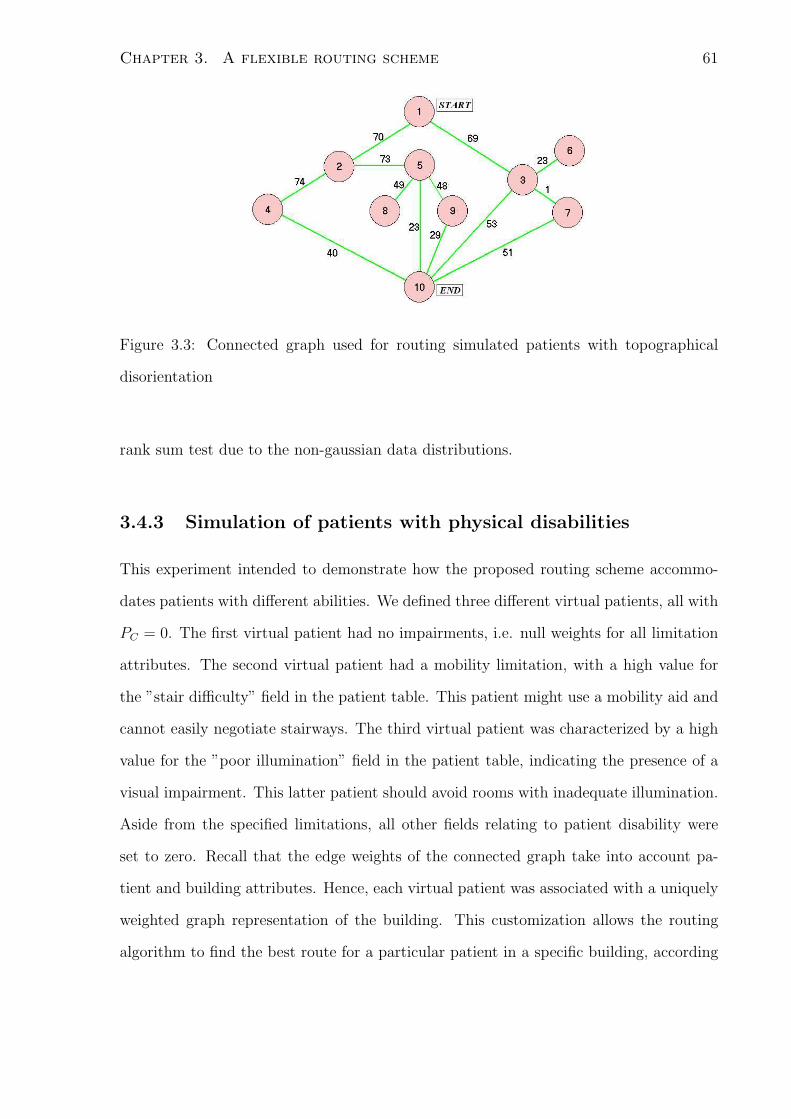
Chapter 3. A flexible routing scheme 61
Figure 3.3: Connected graph used for routing simulated patients with topographical
disorientation
rank sum test due to the non-gaussian data distributions.
3.4.3 Simulation of patients with physical disabilities
This experiment intended to demonstrate how the proposed routing scheme accommo-
dates patients with different abilities. We defined three different virtual patients, all with
PC = 0. The first virtual patient had no impairments, i.e. null weights for all limitation
attributes. The second virtual patient had a mobility limitation, with a high value for
the ”stair difficulty” field in the patient table. This patient might use a mobility aid and
cannot easily negotiate stairways. The third virtual patient was characterized by a high
value for the ”poor illumination” field in the patient table, indicating the presence of a
visual impairment. This latter patient should avoid rooms with inadequate illumination.
Aside from the specified limitations, all other fields relating to patient disability were
set to zero. Recall that the edge weights of the connected graph take into account pa-
tient and building attributes. Hence, each virtual patient was associated with a uniquely
weighted graph representation of the building. This customization allows the routing
algorithm to find the best route for a particular patient in a specific building, according
Chapter 3. A flexible routing scheme 62
to the patient’s abilities and the current internal environmental conditions.
The virtual patients walked through the map depicted in Figure 3.2. In particular,
we selected two paths, each of which traversed a space with a targeted physical barrier,
i.e. a stairwell and a dimly lit room. The first is an environmental barrier for the patient
with a mobility impairment while the second might be an environmental barrier for the
patient with impaired vision.
3.4.4 Simulation of changing building conditions
We developed this experiment to demonstrate the algorithm’s ability to correctly re-
route a patient in the presence of changing building conditions. This capability could
be important in an emergency situation where the number of available paths might be
suddenly reduced, due, for example, to door closures. In this experiment, a simulated
patient with no physical disabilities and no topographical disorientation (PC = 0) walked
from an origin (node 1) to a destination (node 13) in Figure 3.2. While the patient was
walking, the conditions on the shortest distance path were altered, such that the weight
on an upcoming link was substantially increased, i.e. the path became inaccessible.
3.4.5 Simulation of a complex scenario
Combining all the patient and building conditions mentioned above, we simulated a
complex patient routing scenario. The patient had a confusion probability of PC = 0.6
and a mobility impairment that rendered stair climbing extremely difficult (Stair Weight
= 1000). The patient was asked to navigate from node 1 to node 37. In addition, building
conditions were dynamic. The weight on the link between nodes 7 and 12 escalated when
the patient reached node 7, forcing the routing system to find an alternate route for the
patient. In addition to the recommendations from the routing algorithm, the program
would reverse the patient’s direction whenever the patient simulator randomly selected a
link with a very large weight (999 or greater in this simulation), denoting an inaccessible
Chapter 3. A flexible routing scheme 63
or hazardous path for the patient. In a real system, this function would be enabled via
a patient localization system that would detect the approach towards the restricted area
and subsequently instruct the patient to reverse directions.
3.5 Results
The results of routing the patients with topographical disorientation are listed in Ta-
ble 3.1. The histograms for the three measures in Table 3.1 were positively skewed and
hence we report maximum likelihood estimates for location and spread according to a
gamma distribution. We can appreciate that the patient who followed all the instruc-
tions (i.e., zero confusion probability, PC = 0), arrived at the desired destination with
the least effort. It is interesting to note that even patients who only followed a subset
of instructions (PC ≤ 0.75), traversed significantly fewer nodes and experienced a lower
travel cost than the patient who wandered randomly. In fact, the results suggest that as
long as the patient follows at least one in ten instructions (PC < 0.9), he or she will reap
some cost-savings over the random walk scenario. Generally, the more prone a patient is
to random navigation, the greater the effort to reach the desired destination.
We also remark that the variability of the results in Table 3.1 increases with rising
confusion probability, PC . Therefore, it appears that low values of PC lead to greater
consistency in the selected route. Clinically, this suggests that adhering to the Dijkstra
recommendations may provide the patient with a greater chance of internalizing a specific,
consistent route.
Table 3.2 contains the simulation results for patients with disability. In the last two
columns, the paths taken by each patient in each of the two scenarios is summarized
by listing the nodes. It can be seen that each patient successfully avoided the target
environmental barrier.
The simulation results for routing amid building changes is graphically represented
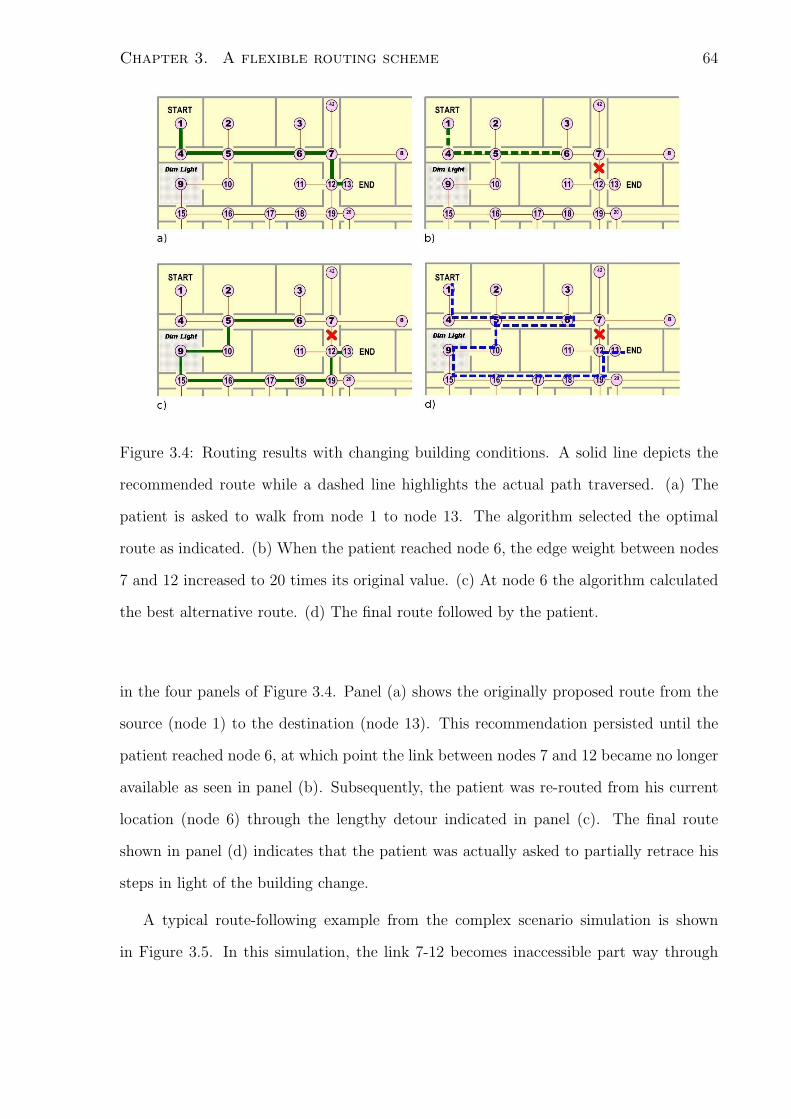
Chapter 3. A flexible routing scheme 64
Figure 3.4: Routing results with changing building conditions. A solid line depicts the
recommended route while a dashed line highlights the actual path traversed. (a) The
patient is asked to walk from node 1 to node 13. The algorithm selected the optimal
route as indicated. (b) When the patient reached node 6, the edge weight between nodes
7 and 12 increased to 20 times its original value. (c) At node 6 the algorithm calculated
the best alternative route. (d) The final route followed by the patient.
in the four panels of Figure 3.4. Panel (a) shows the originally proposed route from the
source (node 1) to the destination (node 13). This recommendation persisted until the
patient reached node 6, at which point the link between nodes 7 and 12 became no longer
available as seen in panel (b). Subsequently, the patient was re-routed from his current
location (node 6) through the lengthy detour indicated in panel (c). The final route
shown in panel (d) indicates that the patient was actually asked to partially retrace his
steps in light of the building change.
A typical route-following example from the complex scenario simulation is shown
in Figure 3.5. In this simulation, the link 7-12 becomes inaccessible part way through
Chapter 3. A flexible routing scheme 65
the patient’s journey. The thick solid lines indicate decisions that the patient made in
accordance with the routing algorithm instructions. The hashed lines indicate random
navigational decisions, some of which coincided with the recommendations of the routing
algorithm. We notice that the patient retraced his path in a few locations due to his
random wandering. At node 7, the patient decided to go towards node 12, a link which
was no longer available. Later on, at node 19, the patient attempted to access the
stairway, which was an identified environmental barrier. In both of these instances, the
patient was provided with the instruction to reverse his direction. Clearly, the patient
did not follow to a tee his recommended shortest path i.e., 1-4-5-6-7-6-5-10-9-15-16-17-18-
19-20-21-22-41-40-37 with a total cost of 1843. Nonetheless, he still reached the desired
destination carving out a route that oscillated about the optimal path, racking up a
final cost of 3157, which is still 38% less than the average cost of a random walk in this
context.
3.6 Discussion
From the disorientation simulation, we see that even a patient who follows a subset of
navigational directions, will benefit in terms of reduced distance and time of travel. The
examples also illustrate that the proposed routing scheme can adapt to different patient
abilities, environmental barriers and dynamic modifications of the indoor pathways.
3.6.1 Potential clinical applications
The proposed algorithm could be deployed in a patient navigation system where weights
of certain links in the connected graph are automatically updated at various times in
the day. Target populations would include patients with topographical disorientation,
patients with different physical abilities and healthcare staff, families or visitors needing
to navigate an unfamiliar indoor environment. Alternatively, the routing algorithm might
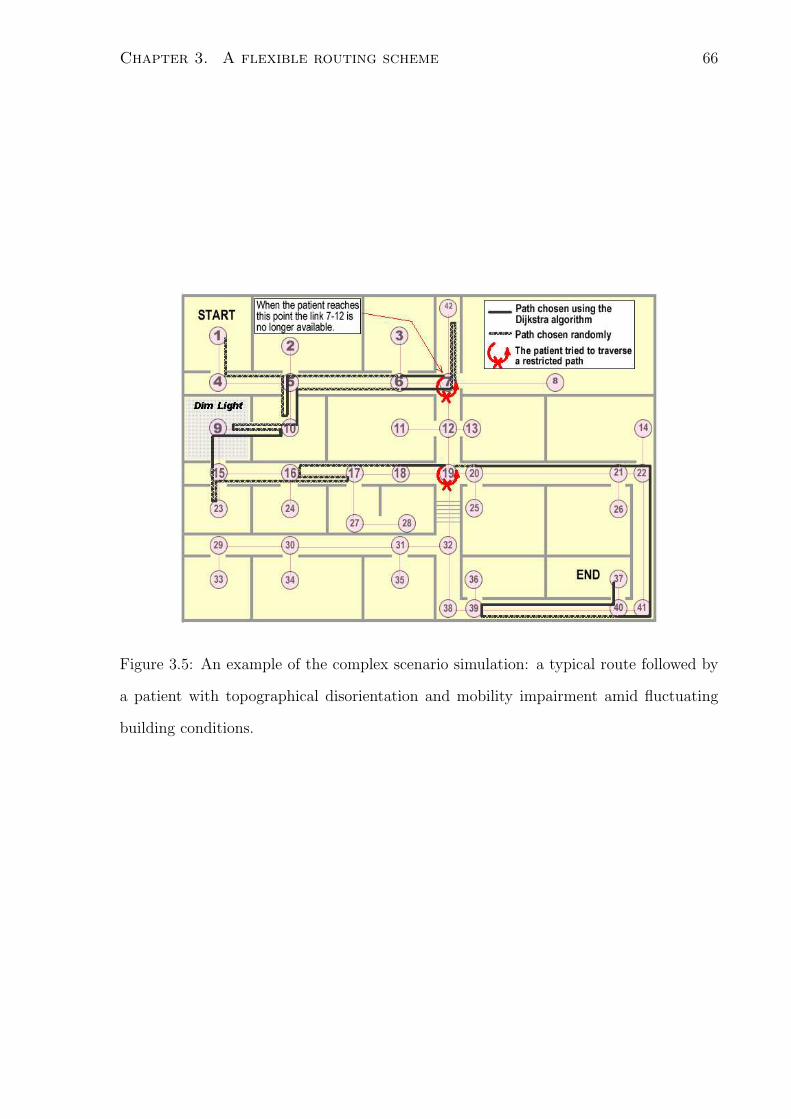
Chapter 3. A flexible routing scheme 66
Figure 3.5: An example of the complex scenario simulation: a typical route followed by
a patient with topographical disorientation and mobility impairment amid fluctuating
building conditions.
Chapter 3. A flexible routing scheme 67
be connected to an alarm system and provide a set of weights according to the nature of
the emergency. For example, a link traversing elevators might have a very high weight
whenever a fire alarm is triggered. A patient would then be routed away from the elevator
unless there were no other navigational options for the particular patient. This might be
the case for a patient who uses a wheelchair, in which case, the physical barriers of stairs
would retain a higher weight than elevators even in the event of a fire.
The algorithm always recalculates the optimal route between the current and des-
tination nodes. Therefore, assuming navigational instructions are followed, it would be
known a priori whether or not the patient would have to traverse a link with a high weight
value. The routing system, if connected to a network, could generate a message to re-
quest assistance at the forthcoming link. In this way, appropriate health care personnel
could be dispatched to provide the required assistance at the specified location.
3.6.2 Limitations and future work
The algorithm has only been demonstrated via computer simulation with simplified pa-
tients and a subset of environmental challenges. Clinical tests with human participants
are necessary to comprehensively characterize patient behaviors and potential barriers,
including, for example, auditory and visual distractions, nonstationary landmarks, and
crowded spaces. Also, unaccounted for at present are patient preferences, which may
serve to break ties between two competing routes of otherwise equal cost. Fortunately,
the proposed system is scalable in the sense that the database could easily embody ad-
ditional details about the patient and the environment.
In the above examples, the graphs were generated by manual placement of nodes.
In sophisticated or large scale floor plans, it may be advantageous to develop automatic
graph generation methods as in the geoinformatics literature (e.g., [85]). Further, we
have only described routing on a one level building. Generalizing the method for mul-
tilayer routing, for example, using 3-dimensional graphs, would be useful in hospital
Chapter 3. A flexible routing scheme 68
environments where patients are permitted limited interlevel travel.
The assignment of weights to characterize physical barriers and the patient’s ability
to overcome these barriers has been arbitrary in our simulations. More realistic weight
determination needs to be established, as suggested through standardized assessments,
building measurements and architectural drawings. Further, future work should explore
a means for physicians or occupational therapists to set patient-specific weight values in
an intuitive way, for example, via a series of sliders w3hose positions indicate the patient’s
ability to negotiate specific barriers.
In the current implementation, the patient can receive new directions only upon
arrival at a new node, leaving ”dead spaces” between nodes where the algorithm offers
no new information. The amount of tolerable dead space would be patient and building
dependent and would likely necessitate therapist assessments. Algorithmically, the spatial
granularity of the information service can be easily refined by adding more intermediate
nodes.
3.7 Conclusions
We have presented a method of routing patients with topographical disorientation through
an indoor environment, accounting for physical abilities of the patient, environmental
barriers and dynamic building changes. The routing algorithm and database could be in-
tegrated into wearable and mobile platforms within the context of an ambient intelligence
solution.
3.8 Acknowledgements
This work was supported by the Natural Sciences and Engineering Research Council of
Canada, the Canada Research Chairs Program, Bloorview Childrens Hospital Foundation
and Conacyt, Mexico.
Chapter 3. A flexible routing scheme 69
3.9 Competing interests
The authors declare that they have no competing interests.
3.10 Authors contributions
JT designed the routing algorithm. He also designed the software tools and data struc-
tures needed for the experiments. JT proposed the initial design of experiments, exe-
cuted them, and analyzed and interpreted the data. JT worked on the initial draft of the
manuscript. TC participated in the design and coordination of the study, experiments
and data analysis, and helped to draft the manuscript. Both authors read and approved
the final version of the manuscript.
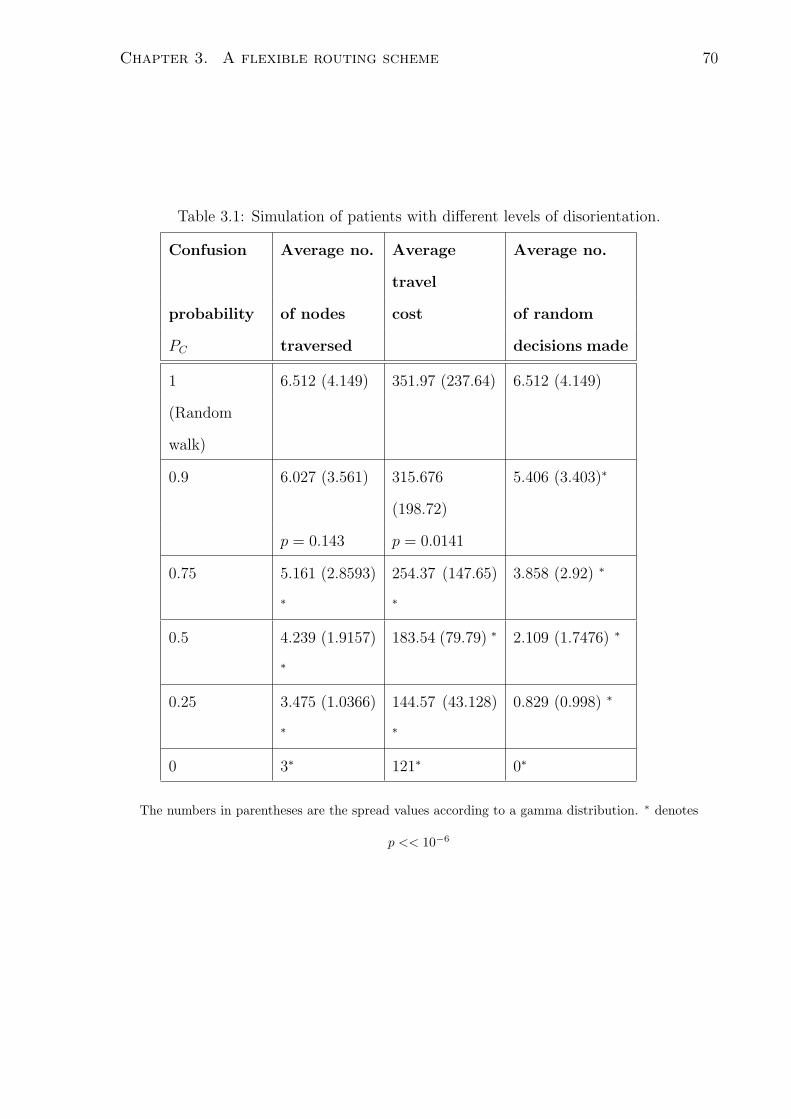
Chapter 3. A flexible routing scheme 70
Table 3.1: Simulation of patients with different levels of disorientation.
Confusion Average no. Average
travel
Average no.
probability of nodes cost of random
PC traversed decisions made
1 6.512 (4.149) 351.97 (237.64) 6.512 (4.149)
(Random
walk)
0.9 6.027 (3.561) 315.676
(198.72)
5.406 (3.403)∗
p = 0.143 p = 0.0141
0.75 5.161 (2.8593)
∗
254.37 (147.65)
∗
3.858 (2.92) ∗
0.5 4.239 (1.9157)
∗
183.54 (79.79) ∗ 2.109 (1.7476) ∗
0.25 3.475 (1.0366)
∗
144.57 (43.128)
∗
0.829 (0.998) ∗
0 3∗ 121∗ 0∗
The numbers in parentheses are the spread values according to a gamma distribution. ∗ denotes
p << 10−6
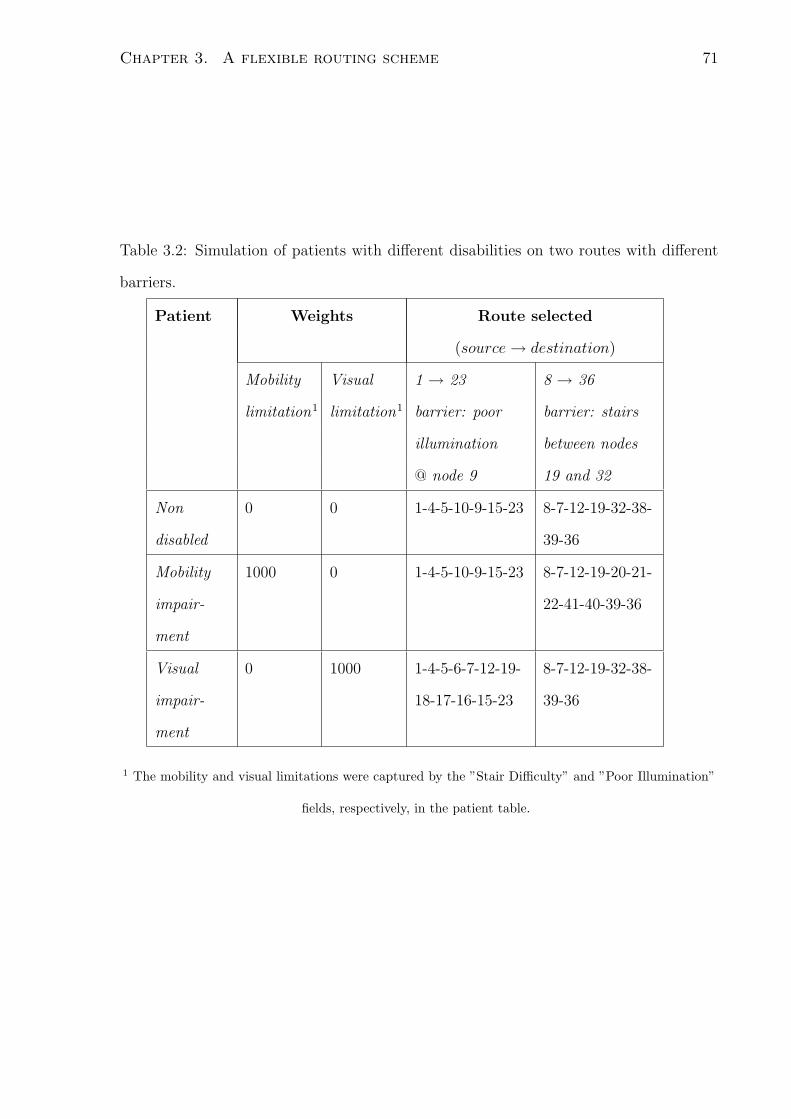
Chapter 3. A flexible routing scheme 71
Table 3.2: Simulation of patients with different disabilities on two routes with different
barriers.
Patient Weights Route selected
(source → destination)
Mobility Visual 1 → 23 8 → 36
limitation1 limitation1 barrier: poor barrier: stairs
illumination between nodes
@ node 9 19 and 32
Non
disabled
0 0 1-4-5-10-9-15-23 8-7-12-19-32-38-
39-36
Mobility
impair-
ment
1000 0 1-4-5-10-9-15-23 8-7-12-19-20-21-
22-41-40-39-36
Visual
impair-
ment
0 1000 1-4-5-6-7-12-19-
18-17-16-15-23
8-7-12-19-32-38-
39-36
1 The mobility and visual limitations were captured by the ”Stair Difficulty” and ”Poor Illumination”
fields, respectively, in the patient table.
Chapter 4
Navigation in smart environments
Torres-Solis J, Guan M, Biddiss E, and Chau T. Mediated reality tools for navigation in
smart environments. Technology and Health Care, Special Issue: Smart environments:
technology to support healthcare (Invited). IOSpress. 2009.
Reprinted from Technology and Health Care. Special Issue: Smart environments:
technology to support healthcare. Torres-Solis J, Guan M, Biddiss E, and Chau T.
Mediated reality tools for navigation in smart environments. Copyright (2009), with
permission from IOSpress.
4.1 abstract
Topographical Disorientation (TD) is the lack or loss of orientation and navigation abil-
ities. People living with TD face functional challenges in everyday situations. Smart
mediated reality environments present potential solutions for cognitive conditions like
TD. In this article, we introduce a novel mediated reality location aware environment. It
was hypothesized that tools which offer different positional information affect the nav-
igation performance of a user. The objective of this study was to investigate preferred
assistive tools for indoor navigation for use in a proposed mediated reality wayfinding
system. These tools may eventually be used to assist patients with TD.
72
Chapter 4. Navigation in smart environments 73
To this purpose, we designed a novel wayfinding metric that can be used in the
assessment of navigation tasks similar to a scavenger hunt. This novel metric is based on
a relative energy expenditure ratio and is independent of navigation route complexity.
We investigated four sets of tools (minimap, locator, coordinate display and routing
compass) that can be used in a smart mediated reality environment to provide relevant
wayfinding information. These tools were designed using different combinations of spa-
tial knowledge (landmark, route or survey), graphical presentation (compass, text, icon,
top/side view) and reference frames (egocentric or allocentric). Each tool was evalu-
ated objectively and subjectively. The locator and minimap tools emerged as preferred
interfaces, providing the most relevant wayfinding information while minimizing energy
expenditure during navigation tasks.
4.2 Introduction
4.2.1 Topographical Disorientation
Topographical orientation refers to the set of cognitive abilities that allow a person to nav-
igate to specific destinations of an environment in an efficient way [13]. Individuals with
Topographical Disorientation (TD) lack one or more orientation or navigation abilities
needed to accomplish navigation tasks[3]. Some etiologies associated with TD are ac-
quired brain injury, stroke, Alzheimer’s disease and brain tumours [180, 157, 10, 111, 29].
People living with TD face functional challenges in everyday situations. Examples
include limited range of mobility and loss of independence. As a result, compensatory
navigation techniques, or the long-term accompaniment of a caregiver may be necessary
[56, 8, 29]
Chapter 4. Navigation in smart environments 74
4.2.2 Spatial knowledge
Existing literature in topographical orientation suggests three main types of spatial
knowledge: landmark, route and survey [155]. Landmark knowledge is developed in
early stages of spatial learning of a new environment, and it refers to the creation of
mental relationships between the position of objects in the environment (landmarks) and
a specific spatial location. Route knowledge refers to learning sequences of instructions
required to navigate between locations that are not visually connected. Such instruc-
tions use landmarks as reference points. Finally, survey knowledge refers to a global
representation of the environment. This global representation is based on knowledge of
the spatial interconnection of navigable areas, and the location of objects and landmarks
in the environment. This knowledge is normally acquired in the later stages of the spatial
learning process. Landmark knowledge is useful for orientation (knowing one’s position),
while route and survey knowledge are associated with the navigation process (knowing
how to reach a specific destination).
Spatial knowledge is also commonly classified as egocentric or allocentric [78]. In
general, egocentric spatial knowledge refers to knowledge of the position of an object
relative to the subject navigating the environment (or to an “ego object” as referred by
Klatzky). Allocentric spatial knowledge refers to knowledge that is based on a coordinate
system that is fixed to the environment. For instance, a north/south/east/west coordi-
nate system is allocentric as these directions do not change for other observers when the
“ego” observer rotates or moves. Knowledge of the position of a building in georeferenced
coordinates is allocentric, as it will not change if the observer changes his or her position
or orientation. Expressing the location of the same building as “10 meters away from
me, to my left” is egocentric, as it will change with any position or orientation of the
observer, and is only relevant to him/herself.
Chapter 4. Navigation in smart environments 75
4.2.3 Navigation tools
For this study we consider a navigation tool to be any real or virtual device that extends
or enhances the spatial knowledge or wayfinding abilities of an individual. A wide variety
of such tools have been suggested in the literature. In general they can be classified into
4 main categories:
• Path-following instruction tool: A sequence of instructions is presented to the user
as a textual list of turn-by-turn directions, a sequence of landmarks in the environ-
ment, or a picture or 3D model of the next location on the target path [88, 77, 32,
80].
• Virtual aids interacting with the environment: These are virtual elements added
to the environment to guide users from their current location to the destination.
Examples include virtual assistants that walk the user through the environment and
virtual lines superimposed on the floor marking the recommended path [26, 158].
These virtual aids can be considered an extension of the path-following instructions
where the point-by-point directions are embedded in the environment itself.
• Location pointing tool: A pointing device or a set of displayed coordinates indicates
the position of the desired destination in 2 or 3 dimensions. Alternatively, the tool
can indicate the position of a fixed point in the environment, for instance, the north
pole [25]. Polar or Cartesian coordinate systems are possible displays presented in
the literature [32].
• Survey maps: A map of the environment is presented, most commonly from a
top-view perspective [80, 116].
Chapter 4. Navigation in smart environments 76
4.2.4 Mediated reality location aware system
To investigate ways of providing technological aids to people with TD, we designed a
MEdiated Reality Location Aware system (MERLA) for personal navigation. Mediated
reality is defined as the modification of the real world by using computer generated
elements to add virtual components (e.g., an arrow pointing towards the destination),
or to occlude selective features of the real world that provide unnecessary or potentially
confusing information to the task at hand (e.g., advertisements). To achieve this, a
camera is used to capture the real world scene onto which these virtual elements can be
overlaid or projected. Such modification of the real world is known to heighten the user’s
sensory experience [95, 96].
The goal of MERLA is to mitigate the need for a long term chaperon to accompany
a patient on every trip. In this way, MERLA may enhance patient independence while
reducing the work load of health care personnel, both of which are benefits cited in
previous clinical studies of environmental interventions [187].
To reduce costs and enable rapid deployment, the system is composed of a unique
fusion of off-the-shelf sensors, namely a web cam (Logitech 4000), a WiFi network USB
dongle (Linksys), a gyromouse (Gyration), a Wii remote controller (Nintendo), a wearable
computer (any small-factor laptop) and a mediated reality semitransparent head mounted
display (Liteye LE-500).
This hardware setup is complemented by custom-developed processing algorithms
that accurately determine the position of the user in the environment in real time, using
visual markers and the information received from accelerometers (Wii controller) and
gyroscopes (gyromouse). A total of 30 distinct visual position markers are positioned
at corridor intersections throughout the building, as exemplified in Figure 4.1. Each
marker consists of 17 x 17 cm, black and white, symbolic image which uniquely identifies
its specific 3D location. The position and orientation of each marker are recorded in a
database. The wearable webcam is used to obtain the 3D position and rotation of the

Chapter 4. Navigation in smart environments 77
camera relative to a visual marker. By combining the computed position of the wearable
camera relative to a marker, and the location of that marker relative to the building
(obtained from the database), we can determine the position and orientation of the user
in the building. For a detailed review of the visual marker system and image processing
algorithms used, the reader is referred to [73].
To reduce the number of visual markers required in the environment, the gyroscope in
the gyromouse and the accelerometer in the Wii controller are used as a dead reckoning
inertial navigation system (INS). This allows the position of the user to be tracked in
real-time when there are no visual markers in the field of view of the camera. Markers are
then used primarily to reset the absolute position of the INS which is prone to error over
long periods of time without recalibration. If the building is equipped with a wireless
network with multiple fixed access points, then the wireless card can also be used to
increase the localization accuracy by measuring the received signal strength from nearby
access points in the environment. A schematic of the wearable system and the smart
environment is provided in Figure 4.1.
By wearing the proposed system, the user sees the real world, with virtual wayfinding
tools superimposed in the environment, seemingly floating in front of the user. An
example of this view is shown in Figure 4.2, where a virtual compass and a map of the
environment are overlaid on top of the real world scene.
The objective of this article is to investigate preferred indoor visual navigational tools
for use with the proposed mediated reality system. These tools may eventually be used
to assist patients with TD. It is hypothesized that tools which offer different positional
information differentially affect the navigation performance of a user.
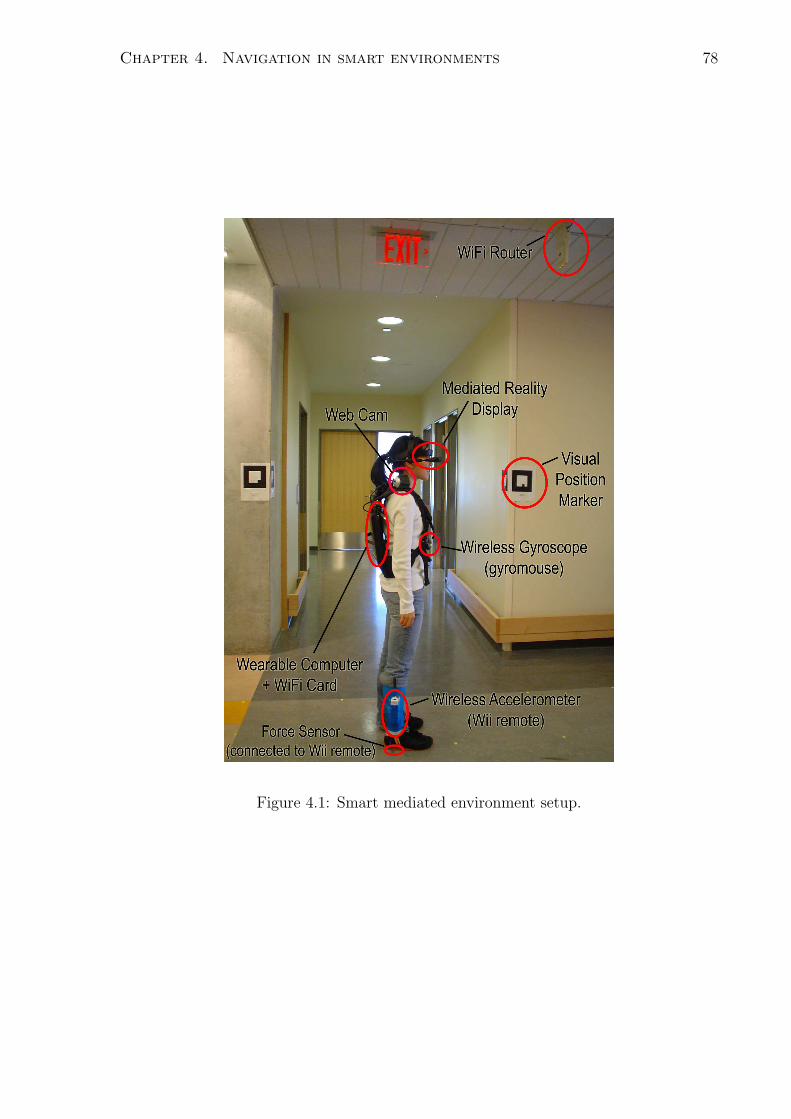
Chapter 4. Navigation in smart environments 78
Figure 4.1: Smart mediated environment setup.
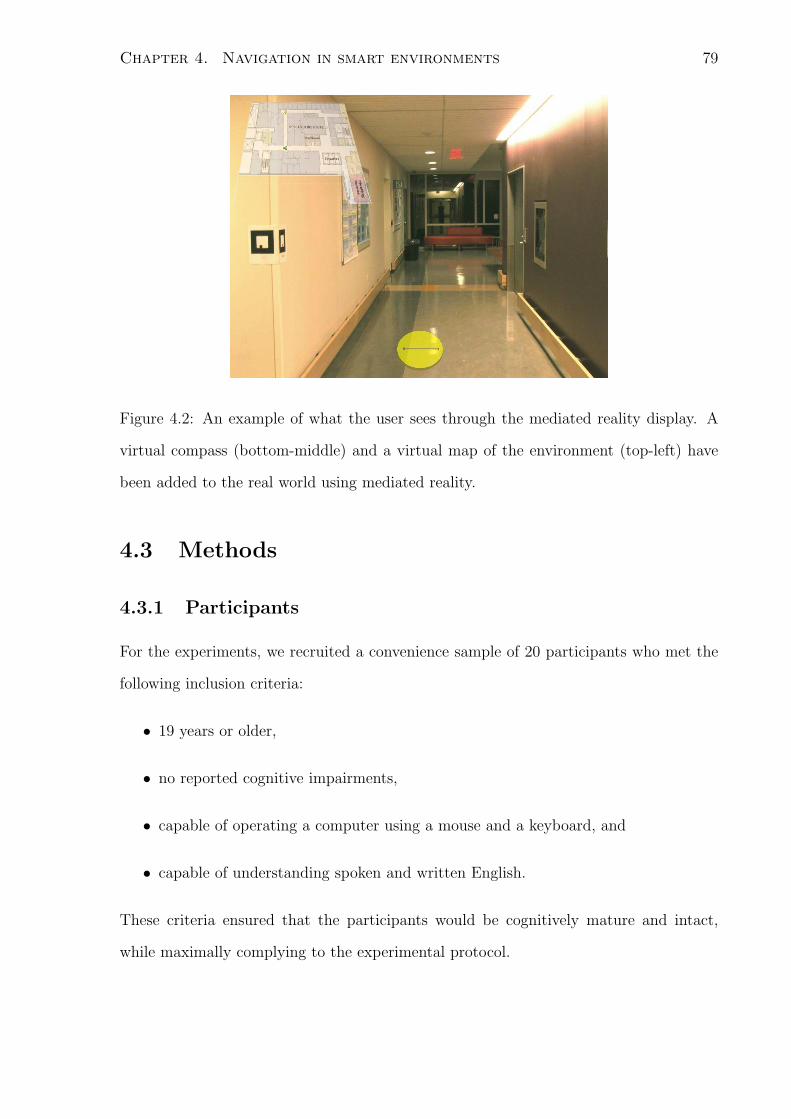
Chapter 4. Navigation in smart environments 79
Figure 4.2: An example of what the user sees through the mediated reality display. A
virtual compass (bottom-middle) and a virtual map of the environment (top-left) have
been added to the real world using mediated reality.
4.3 Methods
4.3.1 Participants
For the experiments, we recruited a convenience sample of 20 participants who met the
following inclusion criteria:
• 19 years or older,
• no reported cognitive impairments,
• capable of operating a computer using a mouse and a keyboard, and
• capable of understanding spoken and written English.
These criteria ensured that the participants would be cognitively mature and intact,
while maximally complying to the experimental protocol.

Chapter 4. Navigation in smart environments 80
4.3.2 Test environment
To test the effectiveness of different mediated reality navigation tools, experiments were
conducted in a controlled virtual environment. Previous studies have shown that spa-
tial knowledge acquired within virtual environments are transferrable to the real world
[183, 42]. Since the goal of this study was to determine the preferred navigational tool
irrespective of route, tools and routes were randomized to eliminate any ordering effects.
One advantage of testing in virtual environments is that confounding factors (i.e.,
distractions) can be well-controlled. Given the random presentation of routes and unpre-
dictability of each user’s chosen path, it would not be possibe to ensure that every user
experienced equivalent distractions. Non-uniformly presented distractions would obfus-
cate the effects of the tools. For this reason, distractions such as path obstacles and
encounters with people were not included in the virtual environment. A second advan-
tage is that the virtual environment offers a safe milieu for human user testing. Finally,
the virtual environment provides a direct linkage to the real-world MERLA system; we
can simulate the vantage point of the head-mounted display used in MERLA.
To create the virtual environment we modified the source code of Quake III. Quake
III is a first-person viewpoint computer game created by id Software, set in a three-
dimensional environment. For our experiments we programed a new single-player game
modality which we called “scavenger hunt”. In the scavenger hunt, the user has to find
a treasure (represented by a blue flag) present in the virtual environment. The game
engine was programmed to record all movements undertaken by the user.
Our virtual environment was built and customized to simulate a hospital with 5 floors
and several offices and rooms per floor. In this simulation, the operation of elevators was
removed from the environment to maintain simplicity. Users moved from floor to floor by
4 flights of stairs, located at 4 opposite corners of the virtual building. We used a map
editing tool called GTKRadiant, provided by id Software, to generate the customized
environment.
Chapter 4. Navigation in smart environments 81
To navigate the virtual environment, Quake III can be used with a combination of
user input intefaces, namely the keyboard, the mouse and a joystick. To ensure equivalent
experimental conditions, the users were requested to use uniquely the four cursor arrows
of the keyboard. These keys are mapped to forwards/backwards walking and left/right
body rotation.
4.3.3 Navigation tool design
The navigation tools were designed to provide only the fundamdental orientation infor-
mation necessary to effectively guide the user to the destination. For instance, a map of
the environment may contain at minimum, markers indicating the location of the user
and the desired destination as minimal information. However, this tool can be extended
by adding an arrow to show the orientation of the user on the map, or by changing the
orientation of the map based on the user orientation. To focus attention on the effect of
fundamental orientation tools, interface embellishments were intentionally avoided.
We designed four navigation tools using different combinations of spatial knowledge
enhanced by the tool, presentation and reference frame. The tool characteristics are
presented in Table 4.1. A picture of each tool within the virtual reality environment is
shown in Figure 4.3. A description of each tool is presented below.
• Routing compass tool: A tool that presents path following instructions displayed
as a compass. A sequence of textual instructions is hard to present in a head-
up display, i.e. a transparent display that presents data without requiring the
user to change the position of his or her gaze. Further presenting a picture of
the environment is not desirable as in typical hospitals, many hallways look alike.
We decided that the most meaningful interface to use for this tool was a compass
that changes its bearing at every intersection to provide the user with turn-by-turn
instructions. This tool selects and presents the best route to follow dynamically,
and autoadjusts the route automatically if the user becomes disoriented or decides
Chapter 4. Navigation in smart environments 82
not to follow all the instructions as described in [170]. This tool supports egocentric
spatial knowledge as it instructs the user to move forwards/backwards/left/right
from the user’s current position and orientation.
• Locator: A location pointing tool displayed as a combination of a compass and an
icon. If the user is located on the wrong floor, an icon will appear on the head-up
display indicating that the user has to go upstairs or downstairs. In this modality,
the compass will point to the closest set of stairs in the building. When the user
reaches the desired floor the icon will disappear and the compass will point directly
to the destination point (location of the treasure). This tool supports egocentric
knowledge as it provides information about the bearing of an object relative to the
orientation of the user.
• Coordinate display: A location pointing tool displayed as a combination of a com-
pass and textual information. The compass will always point to north in the virtual
environment. If the user is on the wrong floor, the textual information displayed
tells the user how many floors he or she has to walk upstairs or downstairs. If
the user is on the same floor as the treasure the textual information displays the
distance that he has to walk north/south and east/west to reach the treasure. This
tool supports egocentric knowledge as it provides coordinates of the destination
relative to the position of the user.
• Minimap: A tool that presents survey map information using a combination of top
and side views of the building structure. Both views present the location of the
user and the treasure in real time using little icons. This tool supports allocentric
knowledge as it provides information about a fixed destination point in a fixed
survey map.
These navigation tools were programmed as an addition to the Quake III game engine.
The custom code creates 2D and 3D visual elements in virtual head-up display of the
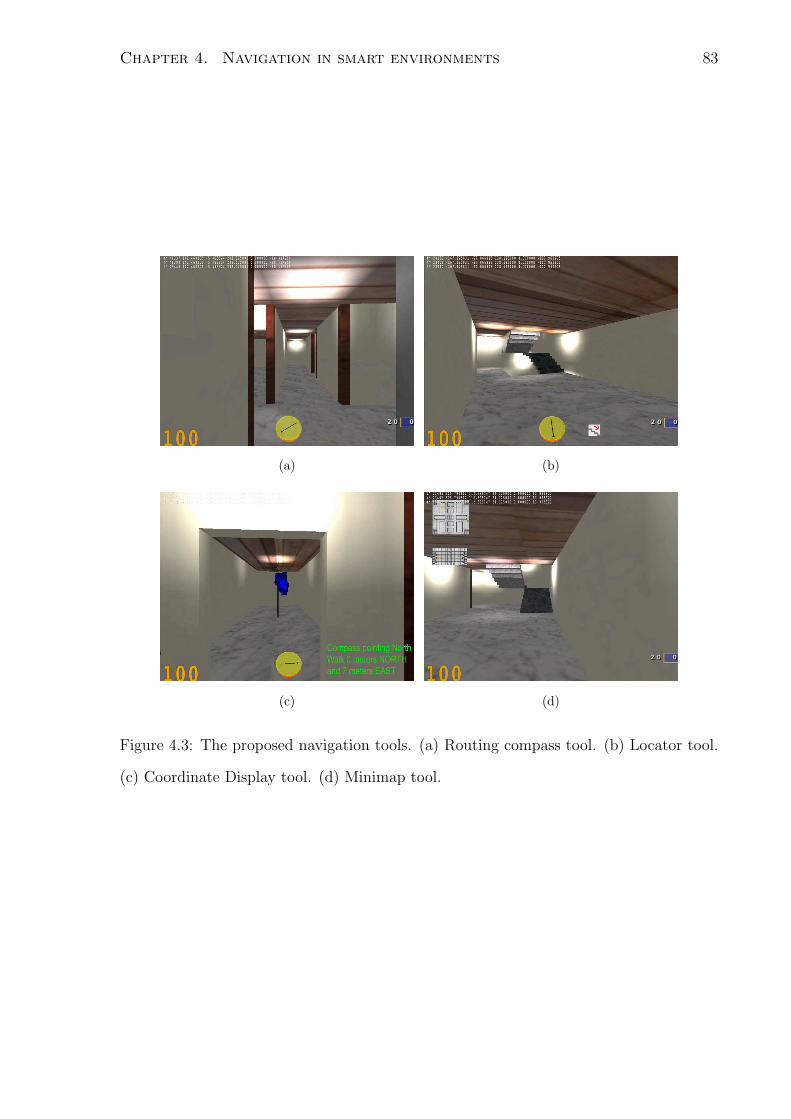
Chapter 4. Navigation in smart environments 83
(a) (b)
(c) (d)
Figure 4.3: The proposed navigation tools. (a) Routing compass tool. (b) Locator tool.
(c) Coordinate Display tool. (d) Minimap tool.
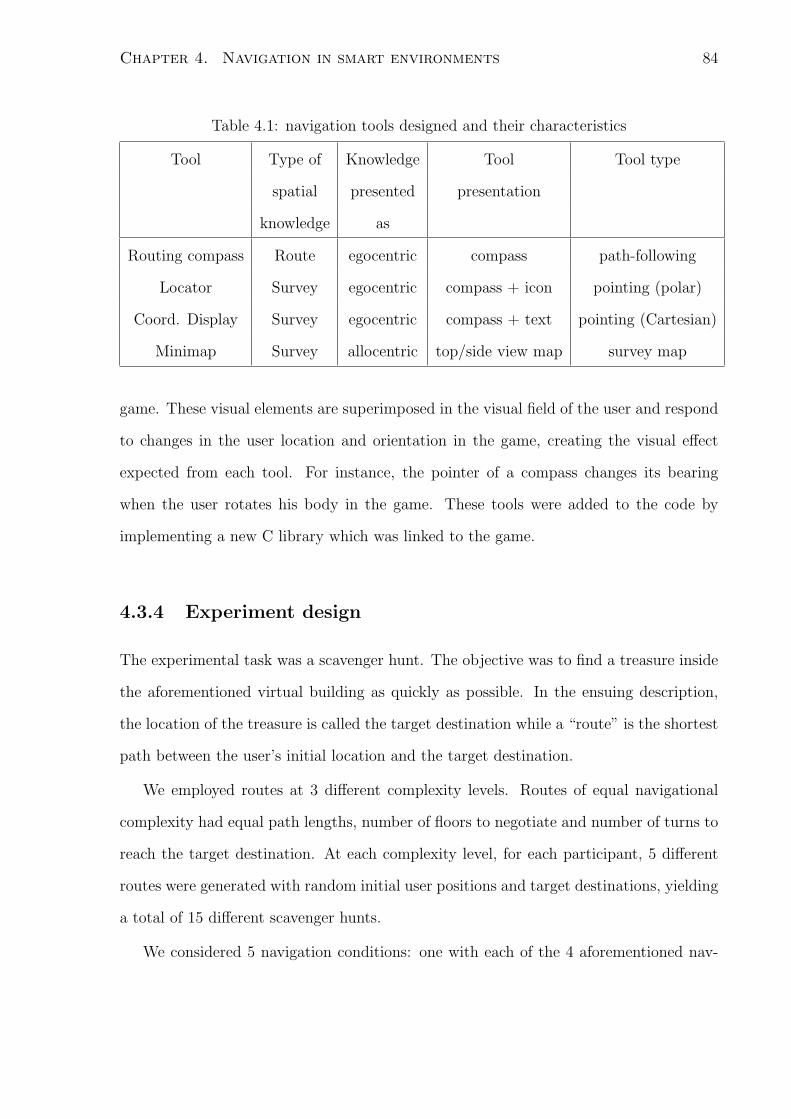
Chapter 4. Navigation in smart environments 84
Table 4.1: navigation tools designed and their characteristics
Tool Type of Knowledge Tool Tool type
spatial presented presentation
knowledge as
Routing compass Route egocentric compass path-following
Locator Survey egocentric compass + icon pointing (polar)
Coord. Display Survey egocentric compass + text pointing (Cartesian)
Minimap Survey allocentric top/side view map survey map
game. These visual elements are superimposed in the visual field of the user and respond
to changes in the user location and orientation in the game, creating the visual effect
expected from each tool. For instance, the pointer of a compass changes its bearing
when the user rotates his body in the game. These tools were added to the code by
implementing a new C library which was linked to the game.
4.3.4 Experiment design
The experimental task was a scavenger hunt. The objective was to find a treasure inside
the aforementioned virtual building as quickly as possible. In the ensuing description,
the location of the treasure is called the target destination while a “route” is the shortest
path between the user’s initial location and the target destination.
We employed routes at 3 different complexity levels. Routes of equal navigational
complexity had equal path lengths, number of floors to negotiate and number of turns to
reach the target destination. At each complexity level, for each participant, 5 different
routes were generated with random initial user positions and target destinations, yielding
a total of 15 different scavenger hunts.
We considered 5 navigation conditions: one with each of the 4 aforementioned nav-
Chapter 4. Navigation in smart environments 85
igational tools and one baseline scavenger hunt without the aid of any tools. In each
navigation condition, participants completed 3 routes, one at each complexity level.
Custom developed software randomized the selection of routes and navigation tools,
start positions and target destinations. A researcher was present during the tests to
provide assistance with the experimental setup, but did not provide any navigational
assistance. The participant was given a practice trial where he or she could navigate
a virtual environment until comfortable with the control interface of the game. The
practice environment had a different structural configuration from the one used in the
actual experiments.
Before each scavenger hunt, the software would provide the user with information
about the tool that was about to be used, and initial orientation information, for ex-
ample, “YOU will start in the NORTH-EAST section of the building, FLOOR 5. The
TREASURE is in the WEST section of the building, FLOOR 3”. The scavenger hunt
ended when the user touched the treasure or after 3 minutes had elapsed since the begin-
ning of the trial. Time-stamped user position and orientation in the virtual environment
were recorded thoughout the experiment.
At the end of the experiment the participant subjectively ranked the 5 tools on a
scale of one (most useful) to five (least useful).
4.3.5 Objective navigation metric
Relative energy expenditure ratio ERATIO
There are several metrics for evaluating wayfinding in virtual environments. These met-
rics can be classified into three main groups [147]: task performance, physical behaviour
and decision making. Ideally, the metric has to be independent of route complexity. As
we used three groups of routes with different complexity, distance or time (task perfor-
mance metrics), these parameters themselves could not directly serve as metrics. Instead,
Chapter 4. Navigation in smart environments 86
we propose a relative energy expenditure ratio (ERATIO), defined as the energy expended
during the actual navigation task divided by the energy expended in following the short-
est path, minimizing body rotations and always facing forwards. According to Ruddle’s
taxonomy, the relative energy expenditure ratio combines a first level metric (task perfor-
mance) by considering distance travelled at a constant speed, with a second level metric
(physical behaviour) by considering a “looking around” behaviour.
This combined metric is calculated using equation 4.1,
ERATIO =
(
EEXPENDED
A%
)
EMIN
(4.1)
where ERATIO is the relative energy expenditure for a particular scavenger hunt, EEXPENDED
is the total energy expended by the participant during the scavenger hunt, A% is the per-
centage of the task completed, and EMIN is the minimum energy required to complete
the scavenger hunt, calculated by following the shortest path to the treasure using the
minimum number of turns. In the following sections we will present the equations needed
to obtain the value of these paremeters.
To include a third level metric (decision making), we analyzed the subjective data
collected in the survey, and compared this to the objective data.
Calculation of relative energy expenditure parameters
Calculation of EEXPENDED
EEXPENDED is the energy expended by the user during the scavenger hunt. As
shown in equation (4.2), EEXPENDED is calculated as a linear combination of the energy
expenditure of straight walking and body rotation.
EEXPENDED = (DTRAV ELLED × EMeter) +
(
RTRAV ELLED(
pi
2
) × ECorner
)
(4.2)
where DTRAV ELLED is the distance travelled in the virtual world by the participant dur-
ing the scavenger hunt, in meters; RTRAV ELLED is the total accumulated body rotation
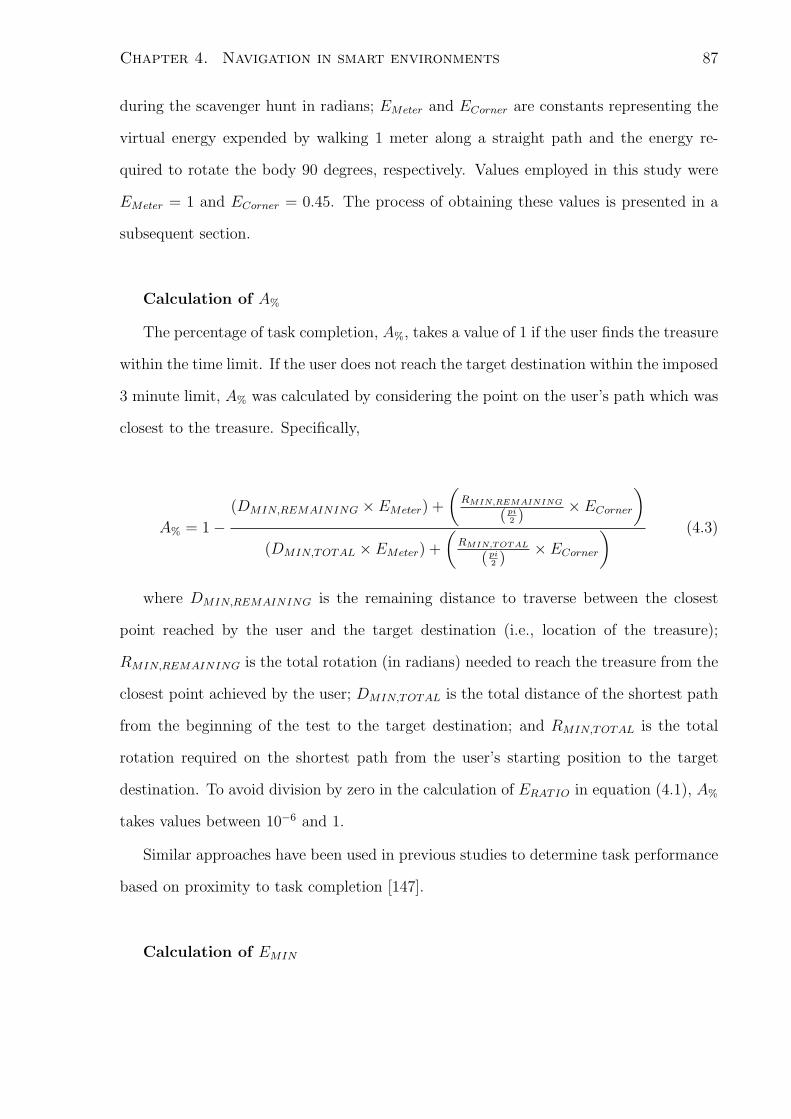
Chapter 4. Navigation in smart environments 87
during the scavenger hunt in radians; EMeter and ECorner are constants representing the
virtual energy expended by walking 1 meter along a straight path and the energy re-
quired to rotate the body 90 degrees, respectively. Values employed in this study were
EMeter = 1 and ECorner = 0.45. The process of obtaining these values is presented in a
subsequent section.
Calculation of A%
The percentage of task completion, A%, takes a value of 1 if the user finds the treasure
within the time limit. If the user does not reach the target destination within the imposed
3 minute limit, A% was calculated by considering the point on the user’s path which was
closest to the treasure. Specifically,
A% = 1 −
(DMIN,REMAINING × EMeter) +
(
RMIN,REMAINING
( pi
2 )× ECorner
)
(DMIN,TOTAL × EMeter) +
(
RMIN,TOTAL
( pi
2 )× ECorner
) (4.3)
where DMIN,REMAINING is the remaining distance to traverse between the closest
point reached by the user and the target destination (i.e., location of the treasure);
RMIN,REMAINING is the total rotation (in radians) needed to reach the treasure from the
closest point achieved by the user; DMIN,TOTAL is the total distance of the shortest path
from the beginning of the test to the target destination; and RMIN,TOTAL is the total
rotation required on the shortest path from the user’s starting position to the target
destination. To avoid division by zero in the calculation of ERATIO in equation (4.1), A%
takes values between 10−6 and 1.
Similar approaches have been used in previous studies to determine task performance
based on proximity to task completion [147].
Calculation of EMIN
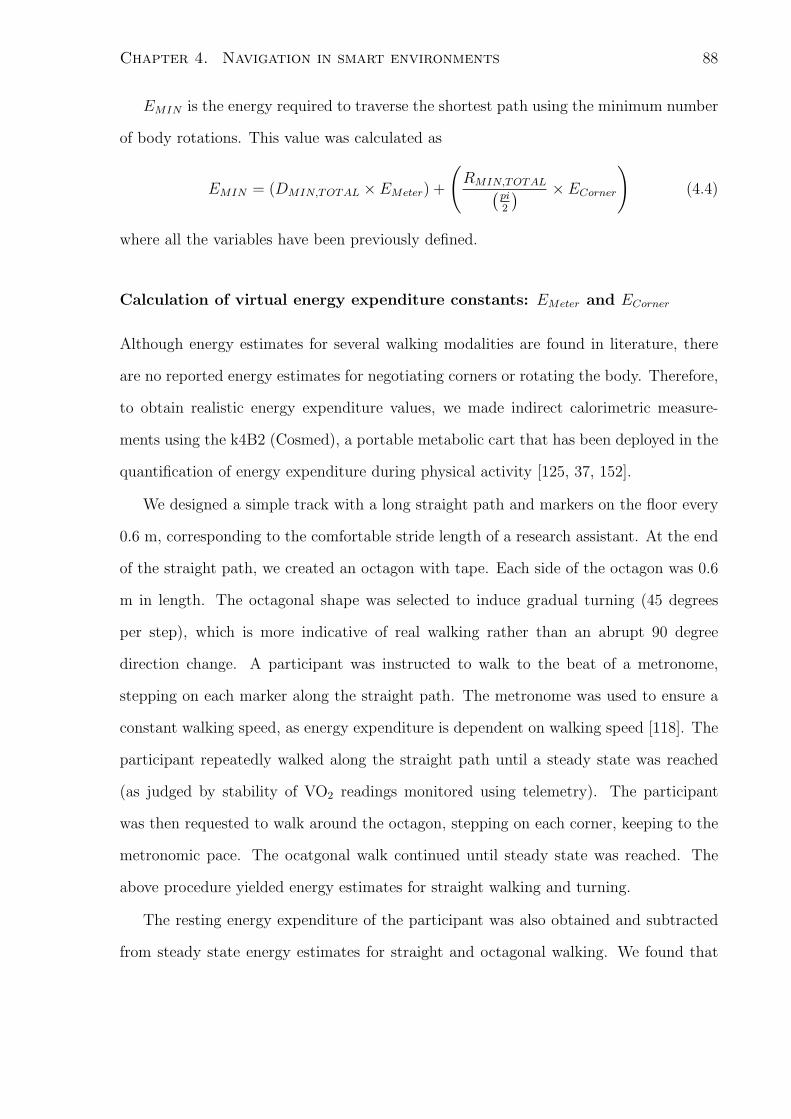
Chapter 4. Navigation in smart environments 88
EMIN is the energy required to traverse the shortest path using the minimum number
of body rotations. This value was calculated as
EMIN = (DMIN,TOTAL × EMeter) +
(
RMIN,TOTAL(
pi
2
) × ECorner
)
(4.4)
where all the variables have been previously defined.
Calculation of virtual energy expenditure constants: EMeter and ECorner
Although energy estimates for several walking modalities are found in literature, there
are no reported energy estimates for negotiating corners or rotating the body. Therefore,
to obtain realistic energy expenditure values, we made indirect calorimetric measure-
ments using the k4B2 (Cosmed), a portable metabolic cart that has been deployed in the
quantification of energy expenditure during physical activity [125, 37, 152].
We designed a simple track with a long straight path and markers on the floor every
0.6 m, corresponding to the comfortable stride length of a research assistant. At the end
of the straight path, we created an octagon with tape. Each side of the octagon was 0.6
m in length. The octagonal shape was selected to induce gradual turning (45 degrees
per step), which is more indicative of real walking rather than an abrupt 90 degree
direction change. A participant was instructed to walk to the beat of a metronome,
stepping on each marker along the straight path. The metronome was used to ensure a
constant walking speed, as energy expenditure is dependent on walking speed [118]. The
participant repeatedly walked along the straight path until a steady state was reached
(as judged by stability of VO2 readings monitored using telemetry). The participant
was then requested to walk around the octagon, stepping on each corner, keeping to the
metronomic pace. The ocatgonal walk continued until steady state was reached. The
above procedure yielded energy estimates for straight walking and turning.
The resting energy expenditure of the participant was also obtained and subtracted
from steady state energy estimates for straight and octagonal walking. We found that
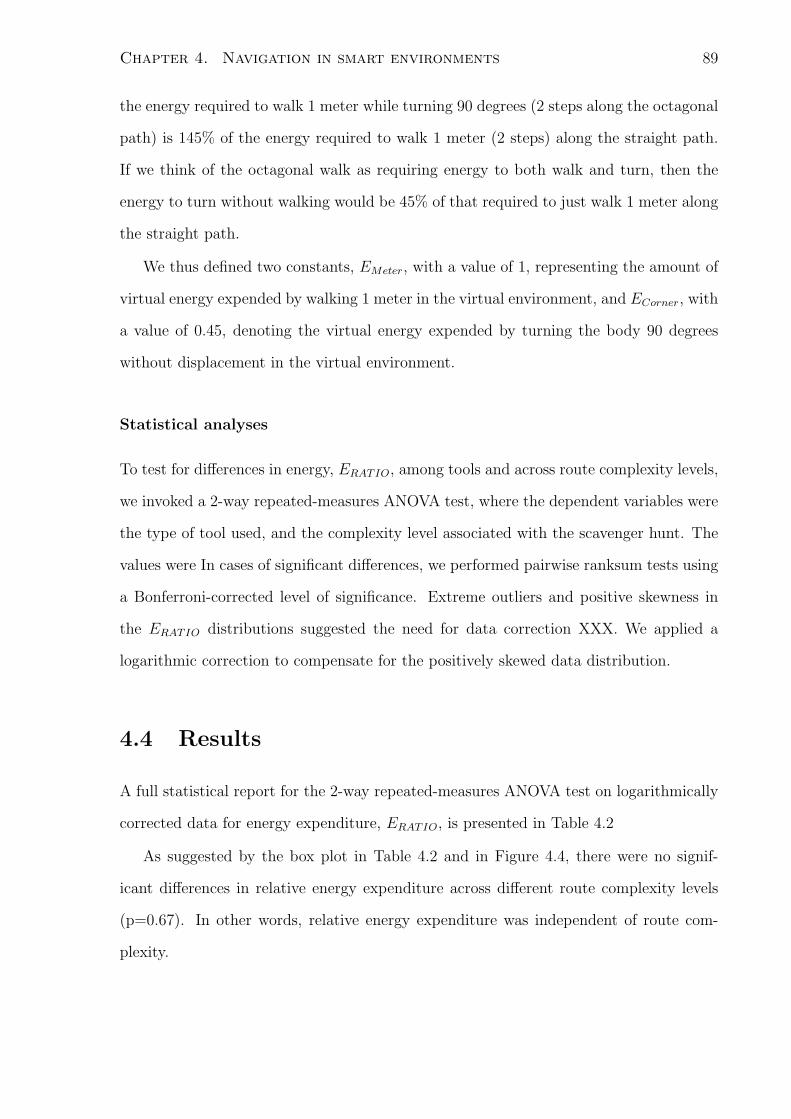
Chapter 4. Navigation in smart environments 89
the energy required to walk 1 meter while turning 90 degrees (2 steps along the octagonal
path) is 145% of the energy required to walk 1 meter (2 steps) along the straight path.
If we think of the octagonal walk as requiring energy to both walk and turn, then the
energy to turn without walking would be 45% of that required to just walk 1 meter along
the straight path.
We thus defined two constants, EMeter, with a value of 1, representing the amount of
virtual energy expended by walking 1 meter in the virtual environment, and ECorner, with
a value of 0.45, denoting the virtual energy expended by turning the body 90 degrees
without displacement in the virtual environment.
Statistical analyses
To test for differences in energy, ERATIO, among tools and across route complexity levels,
we invoked a 2-way repeated-measures ANOVA test, where the dependent variables were
the type of tool used, and the complexity level associated with the scavenger hunt. The
values were In cases of significant differences, we performed pairwise ranksum tests using
a Bonferroni-corrected level of significance. Extreme outliers and positive skewness in
the ERATIO distributions suggested the need for data correction XXX. We applied a
logarithmic correction to compensate for the positively skewed data distribution.
4.4 Results
A full statistical report for the 2-way repeated-measures ANOVA test on logarithmically
corrected data for energy expenditure, ERATIO, is presented in Table 4.2
As suggested by the box plot in Table 4.2 and in Figure 4.4, there were no signif-
icant differences in relative energy expenditure across different route complexity levels
(p=0.67). In other words, relative energy expenditure was independent of route com-
plexity.
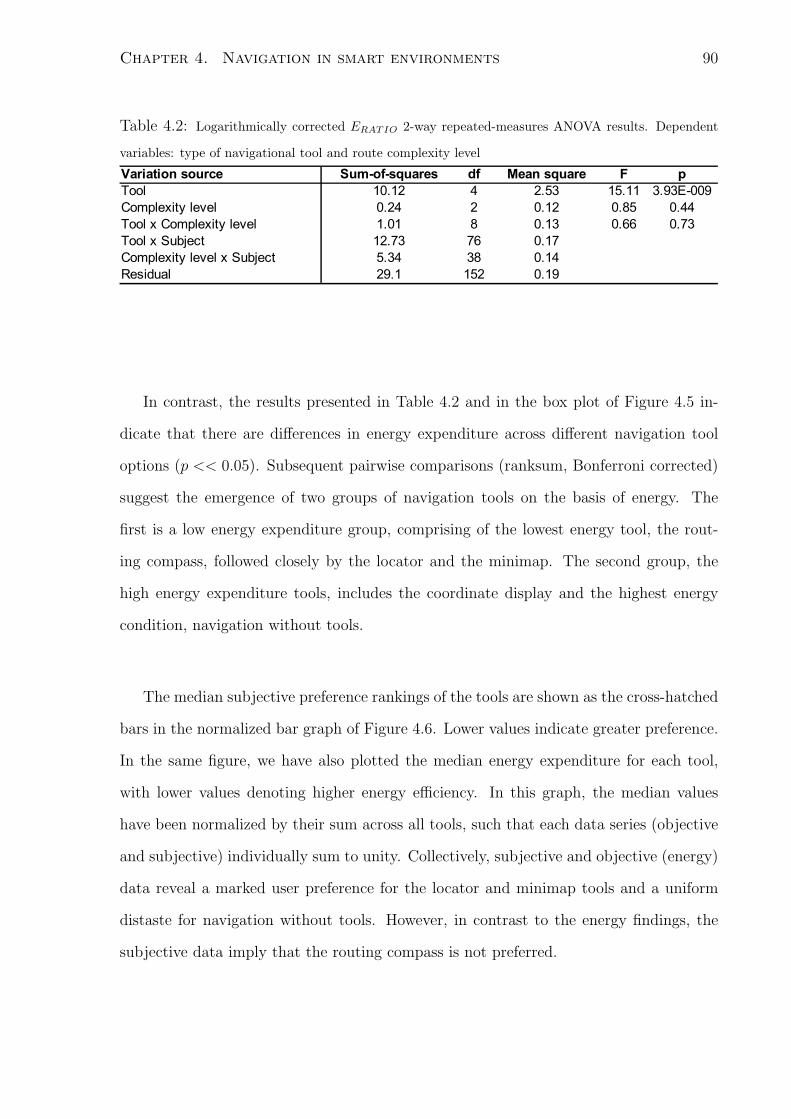
Chapter 4. Navigation in smart environments 90
Table 4.2: Logarithmically corrected ERATIO 2-way repeated-measures ANOVA results. Dependent
variables: type of navigational tool and route complexity level
In contrast, the results presented in Table 4.2 and in the box plot of Figure 4.5 in-
dicate that there are differences in energy expenditure across different navigation tool
options (p << 0.05). Subsequent pairwise comparisons (ranksum, Bonferroni corrected)
suggest the emergence of two groups of navigation tools on the basis of energy. The
first is a low energy expenditure group, comprising of the lowest energy tool, the rout-
ing compass, followed closely by the locator and the minimap. The second group, the
high energy expenditure tools, includes the coordinate display and the highest energy
condition, navigation without tools.
The median subjective preference rankings of the tools are shown as the cross-hatched
bars in the normalized bar graph of Figure 4.6. Lower values indicate greater preference.
In the same figure, we have also plotted the median energy expenditure for each tool,
with lower values denoting higher energy efficiency. In this graph, the median values
have been normalized by their sum across all tools, such that each data series (objective
and subjective) individually sum to unity. Collectively, subjective and objective (energy)
data reveal a marked user preference for the locator and minimap tools and a uniform
distaste for navigation without tools. However, in contrast to the energy findings, the
subjective data imply that the routing compass is not preferred.
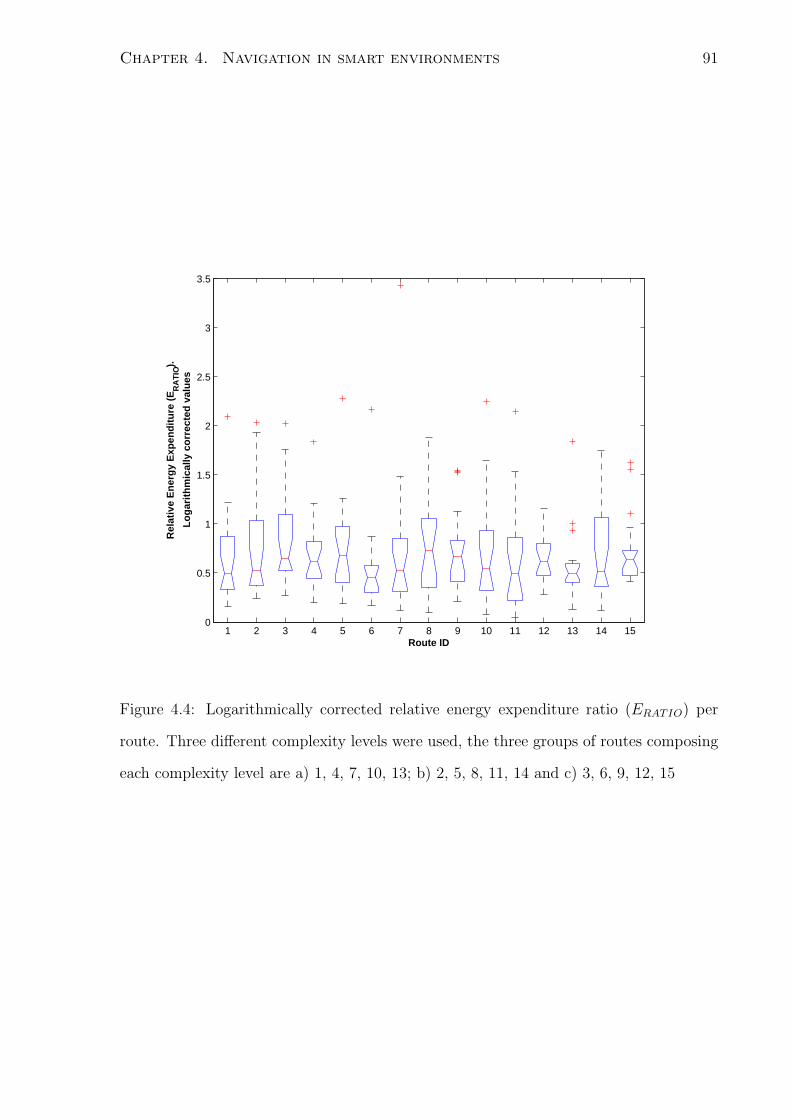
Chapter 4. Navigation in smart environments 91
1 2 3 4 5 6 7 8 9 10 11 12 13 14 150
0.5
1
1.5
2
2.5
3
3.5
Rel
ativ
e E
ner
gy
Exp
end
itu
re (
ER
AT
IO).
Lo
gar
ith
mic
ally
co
rrec
ted
val
ues
Route ID
Figure 4.4: Logarithmically corrected relative energy expenditure ratio (ERATIO) per
route. Three different complexity levels were used, the three groups of routes composing
each complexity level are a) 1, 4, 7, 10, 13; b) 2, 5, 8, 11, 14 and c) 3, 6, 9, 12, 15
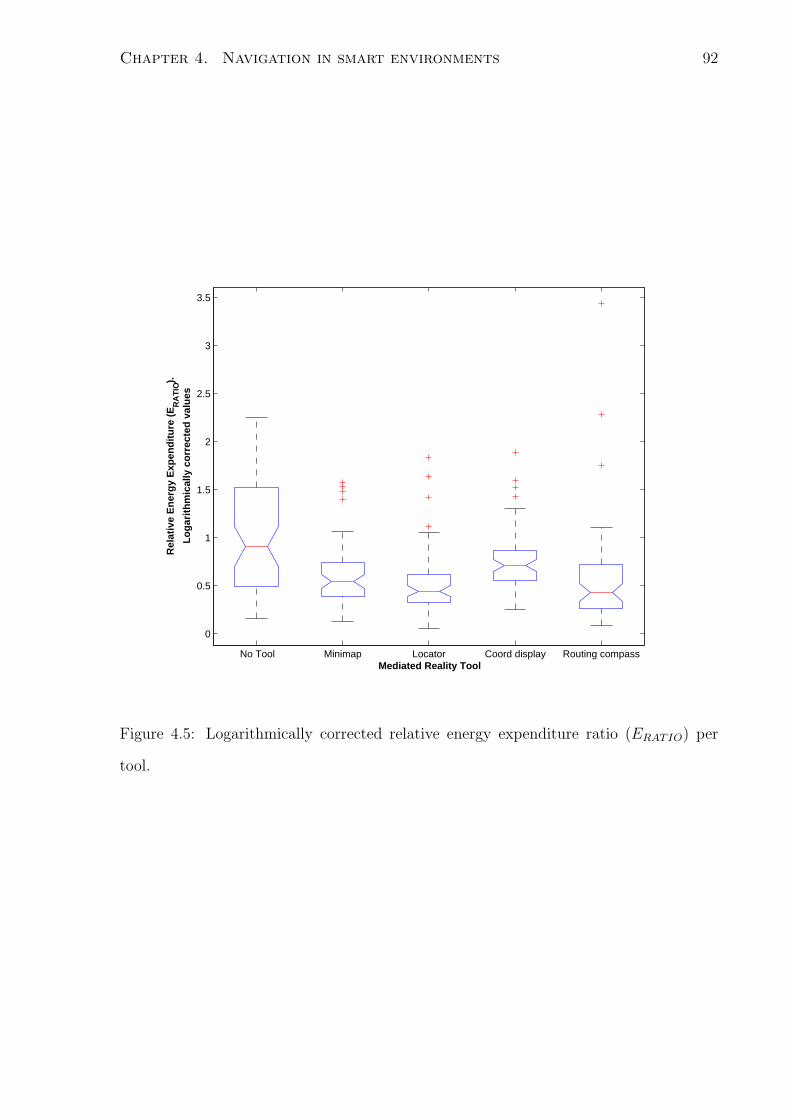
Chapter 4. Navigation in smart environments 92
No Tool Minimap Locator Coord display Routing compass
0
0.5
1
1.5
2
2.5
3
3.5
Rel
ativ
e E
ner
gy
Exp
end
itu
re (
ER
AT
IO).
Lo
gar
ith
mic
ally
co
rrec
ted
val
ues
Mediated Reality Tool
Figure 4.5: Logarithmically corrected relative energy expenditure ratio (ERATIO) per
tool.
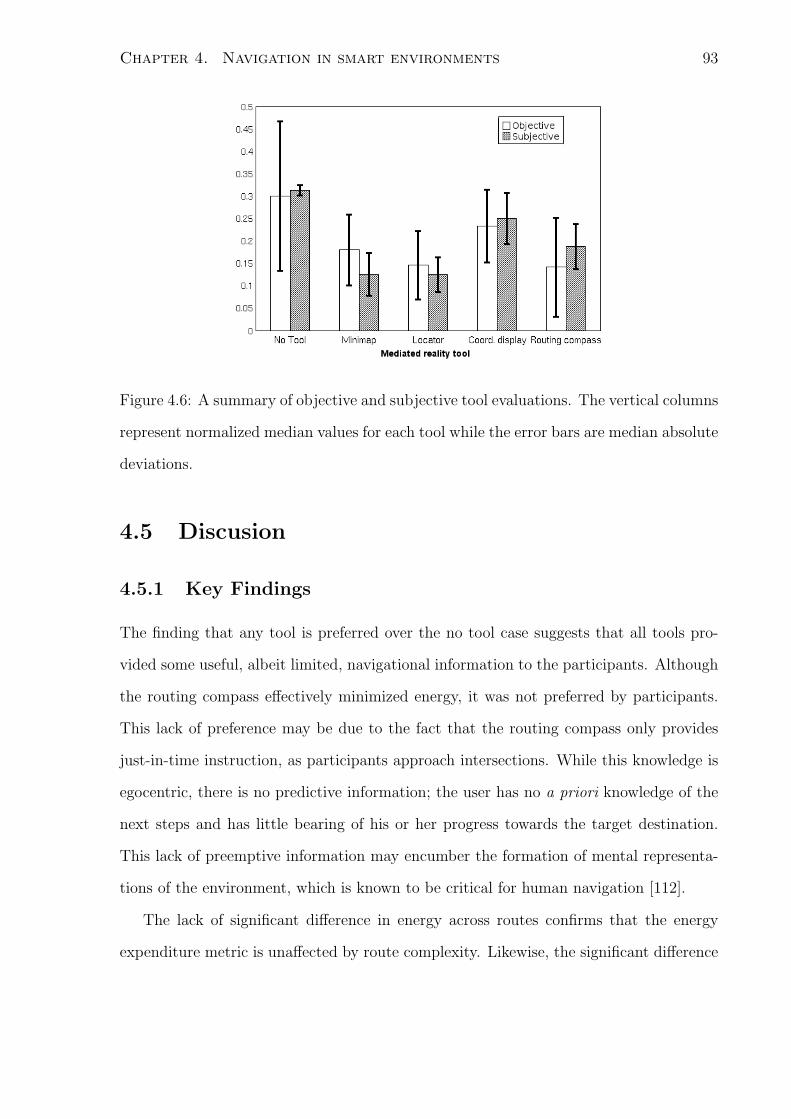
Chapter 4. Navigation in smart environments 93
Figure 4.6: A summary of objective and subjective tool evaluations. The vertical columns
represent normalized median values for each tool while the error bars are median absolute
deviations.
4.5 Discusion
4.5.1 Key Findings
The finding that any tool is preferred over the no tool case suggests that all tools pro-
vided some useful, albeit limited, navigational information to the participants. Although
the routing compass effectively minimized energy, it was not preferred by participants.
This lack of preference may be due to the fact that the routing compass only provides
just-in-time instruction, as participants approach intersections. While this knowledge is
egocentric, there is no predictive information; the user has no a priori knowledge of the
next steps and has little bearing of his or her progress towards the target destination.
This lack of preemptive information may encumber the formation of mental representa-
tions of the environment, which is known to be critical for human navigation [112].
The lack of significant difference in energy across routes confirms that the energy
expenditure metric is unaffected by route complexity. Likewise, the significant difference
Chapter 4. Navigation in smart environments 94
in energy among different navigational tools, confirms the hypothesis that such tools do
in fact have an impact on navigational performance.
Overall the locator tool seems to provide the most relevant navigation information
while minimizing the energy expended during navigation tasks based on both objective
and subjective data. The minimap would be the next most preferred tool based on the
same criteria. A combination of these two tools may offer a very effective navigation tool.
The study provided a novel methodology for navigational tool design and evaluation.
Candidate tools were mocked up in the virtual environment, simulating the head-up
display of a mediated reality navigation system. A realistic energy expenditure metric
quantified differences between wayfinding performance with different tools. The system-
atic methodology also provided a safe environment for patient testing and, a time and
resource efficient means for meaningful evaluation.
4.5.2 Study limitations
The experiments for this study were run in a virtual building. Due to limited ecolog-
ical validity of virtual environments [89], it would be desirable to test the navigation
tools during navigation tasks in a real environment. Nevertheless, the well-controlled
conditions of virtual environments make them attractive for research in navigation.
The relative energy expenditure metric did not take into account the different energy
requirements for walking up or downstairs. We assume equivalent cognitive effort in
finding a destination one floor above or below. In studies concerned with precise energy
requirements, a stair negotiation term can be added to equation (4.1) based on estimates
found in literature [118].
We did not consider tools that require interaction with the virtual environment, such
as virtual assistants or guide lines superimposed on the floor. When used in a mediated re-
ality environment, interactive navigational tools require extremely accurate, low-latency
localization and orientation systems to ensure correct registration of the virtual objects
Chapter 4. Navigation in smart environments 95
in the real environment [11]. Any minor inaccuracy while overlaying virtual elements on
a real environment can lead to user confusion.
4.6 Conclusions
In this study, we evaluated 4 possible navigation tools offering different combinations of
spatial knowledge (landmark, route or survey), presentation (e.g., compass, icon, text or
top/side view) and reference frame (egocentric or allocentric). These tools were tested in
a virtual environment and evaluated objectively using an energy-based metric, and sub-
jectively through a simple tool ranking survey [147]. Based on objective and subjective
criteria, two tools were preferred. The locator tool reinforced egocentric route spatial
knowledge, and was presented as a compass. The minimap tool reinforced allocentric
survey spatial knowledge, and was presented as a survey map of the environment. The
development of smart environment navigation using mediated reality tools is expected
to support the independent wayfinding of patients with topographical disorientation and
thereby reduce the work load of health care personnel.
4.7 Acknowledgements
This work was supported by the Canadian Institutes of Health Research, the Canada
Research Chairs Program, Bloorview Childrens Hospital Foundation and Conacyt, Mex-
ico.
Chapter 5
Pedestrian dead reckoning system
Torres-Solis J and Chau T (submitted). Wearable indoor pedestrian dead reckoning
system. Pervasive and Mobile Computing, (Under review, Manuscript number: PMC-
D-09-00006).
5.1 abstract
We introduce a wearable pedestrian indoor localization system with dynamic position
correction. The system uniquely combines dead reckoning and fiducial marker-based
localization schemes, exclusively using widely available, low end and low power consumer
hardware components.
The proposed system was tested with various walking patterns inside a building,
achieving an indoor positioning accuracy of 3.38% of the total distance walked. This
accuracy is comparable to those obtained with solutions deploying specialized high cost
hardware components. The low cost wearable system proposed herein could serve as the
foundation for a pervasive solution for indoor way finding and patient tracking.
96
Chapter 5. Pedestrian dead reckoning system 97
5.2 Introduction
The estimation of indoor user position is a key challenge in the development of ubiquitous
computing environments because location is a fundamental aspect of a user’s context
[61]. A system must be location-aware in order to seamlessly deliver context-relevant
information to the user [47]. Therefore, to realize a truly pervasive system, an accurate
indoor positioning system is necessary.
In recent years, localization systems based on pedestrian dead reckoning (PDR) have
gained interest among the scientific community. In PDR systems, position estimation
is achieved by double integration of accelerometer measurements, while the orientation
is estimated by integrating the angular velocity obtained from gyroscopes [169] or by
obtaining the direction of the geographical north pole using magnetometers. The latter
are oftentimes combined with gyroscopes, as they are prone to errors due to metallic
structures and electrical appliances in the vicinity [45]. Inertial sensors (accelerometers
and gyroscopes) are prone to drift errors. To mitigate such drift errors during pedestrian
tracking, the properties of human gait can be exploited, resetting the velocity and accel-
eration values when the accelerometers are known to be static. This technique is called
“zero-velocity updates” or ZUPT [45].
As mentioned in [45], most of the experiments in previous literature regarding PDR
do not consider varied and realistic walking patterns. Recent research has presented
PDR’s capable of tracking the movements of a pedestrian without imposing restrictions
on how and where a person walks. For example, Sagawa et al. [150] propose a method to
measure the distance traversed without imposing constraints on speed, or stride length.
This system used a combination of 3 accelerometers, a gyroscope and an atmospheric
pressure sensor. The system was only tested during straight-path walking and stair
climbing tasks, achieving a horizontal distance estimation error of less than 5.3% of the
total distanced travelled. A PDR system capable of tracking unrestricted pedestrian
movements that achieves an indoor positioning accuracy within 0.3% of the distance
Chapter 5. Pedestrian dead reckoning system 98
travelled is presented in [45]. This solution uses a hardware device named InertiaCube3,
which is composed of 3 accelerometers, 3 gyroscopes and 3 magnetometers. Localization
is achieved by combining the location information provided by the sensors using Kalman
filters.
Other authors have considered combining PDR systems with localization systems
based on external location references to recalibrate or enhance the accuracy of the dead
reckoning navigation system. Recent research proposes the recalibration of inertial nav-
igation systems for vehicles using image processing [51, 190, 50]. Of particular interest
for this work are indoor pedestrian tracking solutions which combine inertial sensors
and image processing. In [82] a camera was used to recalibrate an indoor localization
system designed for pedestrians, using pattern classification to determine the movement
performed by the user, and Kalman filtering to combine the location data provided by
the sensors. The inertial tracking system was custom made, and the hardware setup was
not fully described in the article. In [44] a camera was mounted on the head, pointing in
the superior direction with respect to the user. Several markers were positioned on the
ceiling and walls, arranged in a high density pattern of about 1.7 markers per square me-
ters. InertiaCube2 was used as the inertial measurement device, which contains a similar
sensor array to InertiaCube3, described above. The localization accuracy achieved by
this system was not reported.
5.2.1 Motivation
Although indoor pedestrian navigation systems have been previously investigated, prior
solutions require custom made hardware [82] or specialized commercial components which
are expensive and not readily available to the general public. For instance, the Inerti-
aCube family of devices have been used in [45] and [44], producing solutions in the
thousands of dollars. Further, both studies only present data from a single indoor local-
ization experiment.
Chapter 5. Pedestrian dead reckoning system 99
Pedestrian localization applications in the fields of rehabilitation, patient monitor-
ing or personnel tracking require solutions that are economically attractive and readily
available on the market. These requirements are particularly relevant for technological
solutions in developing countries, where specialized hardware is difficult to acquire or
prohibitive in terms of cost [189, 188]. In light of these observations and the review
above, it is clear that further research is needed to develop cost effective localization
systems that allow indoor pedestrian tracking for unrestricted navigation in real-time.
We hypothesized that an indoor pedestrian navigation system can be built using main-
stream hardware components, while achieving position errors comparable to previously
published solutions.
The specific objective of this work was to investigate an indoor pedestrian navigation
system that:
• Can be easily built and deployed by using mainstream hardware components,
• Does not require major infrastructure alterations, such as the installation of wireless
network equipment,
• Requires less than 1 fiducial marker per 10 square meters, and
• Yields real-time location estimates with an accuracy comparable to that of solu-
tions found in recent literature.
The reason for limiting the amount of fiducial markers in the environment is to mini-
mize the size of the database associated with the fiducial markers and the visual clutter,
which would be unacceptable in health care facilities and public buildings. In this paper,
we introduce novel features to the PDR field by proposing the usage of mainstream,
low-cost hardware components in the creation of an indoor PDR system with image
processing-based recalibration.
Chapter 5. Pedestrian dead reckoning system 100
5.3 System Design
5.3.1 Hardware set-up
Our PDR system is composed of a unique combination of sensors, namely:
• A Nintendo Wii remote control to obtain tri-axial accelerometry data,
• A Gyrosense Gyropoint air mouse to obtain angular velocity from its dual-axis
gyroscope,
• A Logitech QuickCam Pro 4000 web cam to detect visual markers fixed in the
environment, and
• A small form factor computer with a bluetooth interface and USB ports.
To record the data acquired by the sensors, the small form factor computer was mounted
on an Ergotron mobile workstand cart. A bluetooth dongle and the Gyrosense wireless re-
ceiver were connected to the computer. The laptop was pushed along by an experimenter
while the subject walked on the predefined circuit.
The Wii remote control was mounted on the lateral side of the right ankle. The
gyromouse was mounted anterior to the abdomen, with one sensitive axis in the superior-
inferior direction and the other in the mediolateral direction. The camera was mounted
on the left shoulder of the participant. Although the camera location differed from
the foot location, they were spatially correlated. The data processing stage (Section
5) specifically compensated for this location difference. The hardware arrangement is
presented in Figure 5.1.
Thirty distinct visual markers were positioned at the corners of a predefined polygonal
indoor circuit. The walls and the ceiling of such circuit had an approximate surface of
580 square metres. This represented a marker density lower than 1 marker per 19 square
metres.
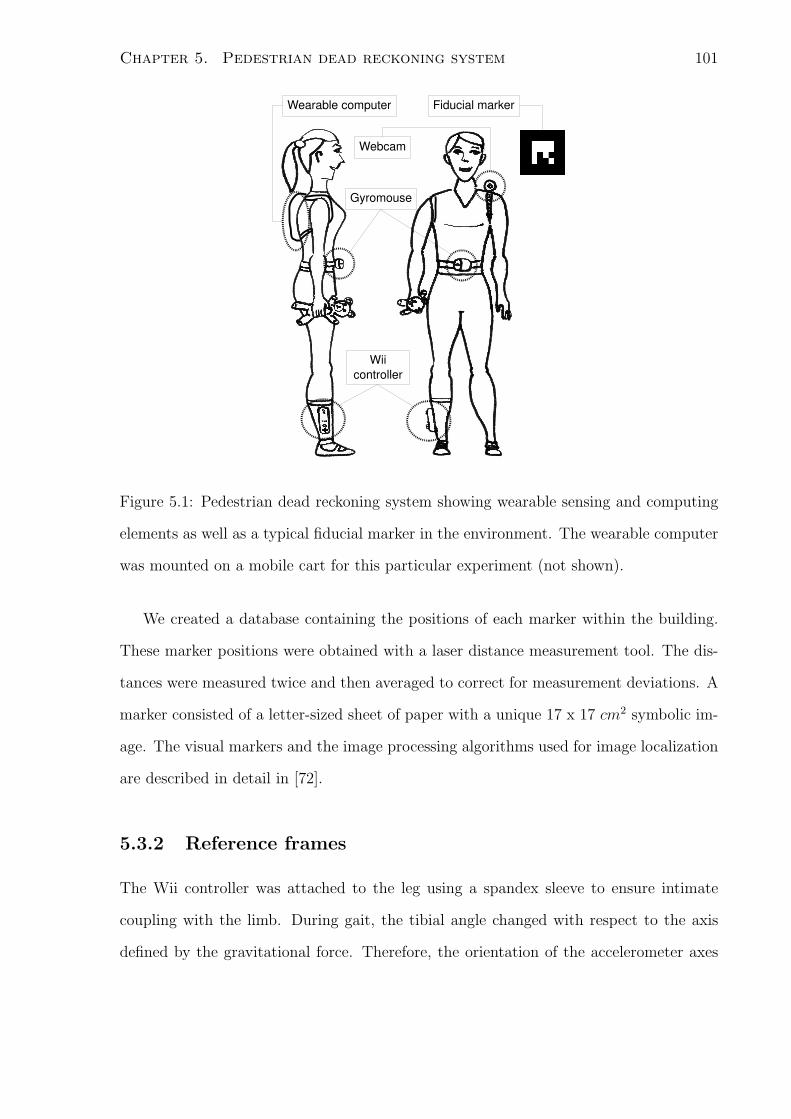
Chapter 5. Pedestrian dead reckoning system 101
Figure 5.1: Pedestrian dead reckoning system showing wearable sensing and computing
elements as well as a typical fiducial marker in the environment. The wearable computer
was mounted on a mobile cart for this particular experiment (not shown).
We created a database containing the positions of each marker within the building.
These marker positions were obtained with a laser distance measurement tool. The dis-
tances were measured twice and then averaged to correct for measurement deviations. A
marker consisted of a letter-sized sheet of paper with a unique 17 x 17 cm2 symbolic im-
age. The visual markers and the image processing algorithms used for image localization
are described in detail in [72].
5.3.2 Reference frames
The Wii controller was attached to the leg using a spandex sleeve to ensure intimate
coupling with the limb. During gait, the tibial angle changed with respect to the axis
defined by the gravitational force. Therefore, the orientation of the accelerometer axes
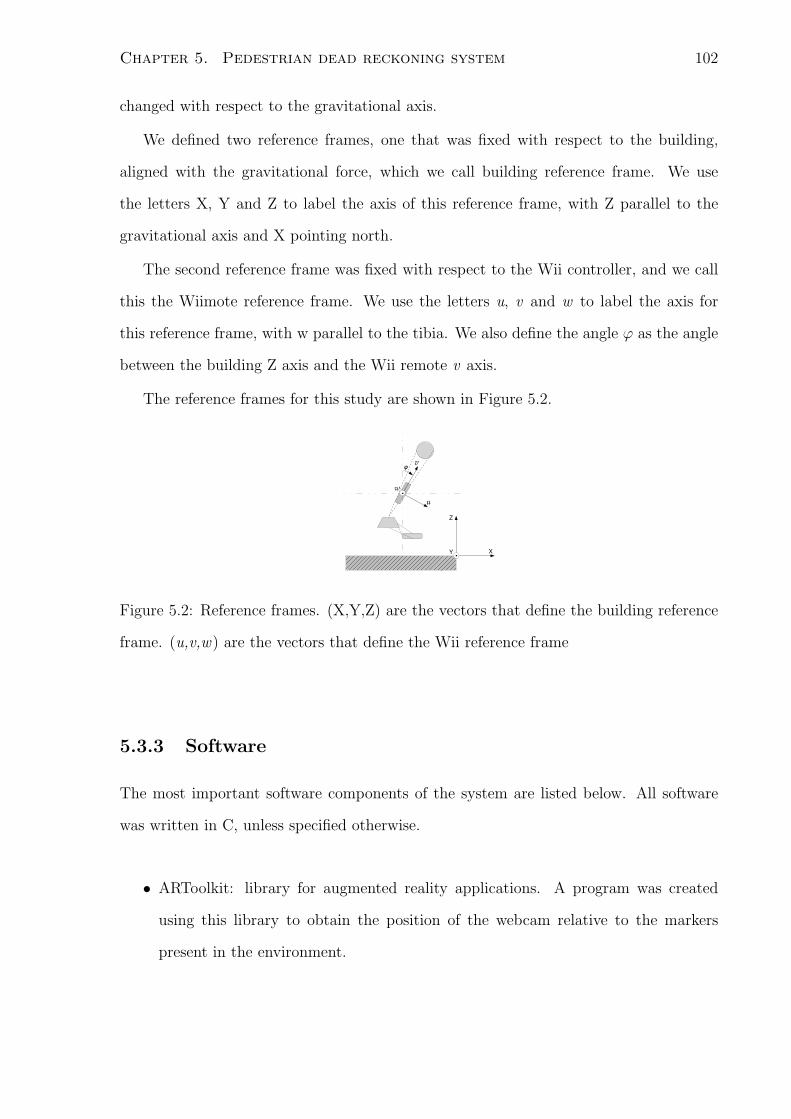
Chapter 5. Pedestrian dead reckoning system 102
changed with respect to the gravitational axis.
We defined two reference frames, one that was fixed with respect to the building,
aligned with the gravitational force, which we call building reference frame. We use
the letters X, Y and Z to label the axis of this reference frame, with Z parallel to the
gravitational axis and X pointing north.
The second reference frame was fixed with respect to the Wii controller, and we call
this the Wiimote reference frame. We use the letters u, v and w to label the axis for
this reference frame, with w parallel to the tibia. We also define the angle ϕ as the angle
between the building Z axis and the Wii remote v axis.
The reference frames for this study are shown in Figure 5.2.
Figure 5.2: Reference frames. (X,Y,Z) are the vectors that define the building reference
frame. (u,v,w) are the vectors that define the Wii reference frame
5.3.3 Software
The most important software components of the system are listed below. All software
was written in C, unless specified otherwise.
• ARToolkit: library for augmented reality applications. A program was created
using this library to obtain the position of the webcam relative to the markers
present in the environment.

Chapter 5. Pedestrian dead reckoning system 103
• Libcwiid: library to communicate with the Wii controller. A program was written
to capture data from the Wii controller (accelerometry signals).
• Program to capture data from the Gyropoint air mouse, using the mouse data
obtained from the operating system, written in C.
• Program to coordinate all the data capturing routines in a synchronized fashion,
and
• Software for data analysis and processing, written in Matlab.
The ARToolkit identified fiducial markers placed in the environment. Each fiducial
marker was composed of a unique arrangement of black and white squares within a 4 by
4 grid, enclosed in a black frame.
Through image processing, ARToolkit thresholds the image captured by the camera,
converting it to an equivalent bynary image of black and white regions. Subsequently,
the edges present in the binary image are obtained. The intersections of such edges
are detected in order to find any 4 corners that compose a black square on top of a
white brackround. Each black square detected in the image is compared against a set
of pre-defined patterns through template matching, using a projective transformation.
Such transformation allows to detect squares that are not aligned with the camera’s focal
axis. The parameters of the projective transformation that return a match are used to
calculate the camera’s distance and angle of view with respect to the detected marker,
given that the marker size is previously known. The details of the operation of ARToolkit
are described in more detail in [71].
We created a database of markers along with their position and orientation. In this
way, we were able to calculate the absolute position of the camera in the building.

Chapter 5. Pedestrian dead reckoning system 104
5.4 Experiments
An 84.4 metre indoor circuit was traversed 4 times in each direction, clockwise (CW) and
counterclockwise (CCW), yielding a total of 8 trials per participant. For each trial, the
participant followed a specific walking pattern (see Tables 1 and 2). Therefore, each trial
or traverse of the circuit will also be referred to as a ‘walking task’. Before each task,
we set initial conditions for the experiment, and obtained calibration constants for the
inertial sensors. The camera was calibrated only once, and recalibration was not required
as long as the same camera was used for all walking tasks.
The system was tested by two participants walking at a comfortable pace. The first
participant was a 30 year old, 1.81 metre tall male, weighting 72 kilograms. The second
participant was a 19 year old, 1.60 metre tall female, weighting 48 kilograms.
5.4.1 Experiment initialization
A start point and an initial body bearing were defined for each walking direction (clock-
wise and counterclockwise). Pieces of tape were used to mark these starting points on
the floor. The user had to position the toes of the right foot on the defined markers. This
allowed us to define values for the top-view start-up position (PosX [0], PosY [0]) and the
initial user bearing (θ[0]) in building coordinates.
Since the user started the experiment in a static position, the acceleration and velocity
of the ankle relative to the building are initially equal to zero.
VAnk [0] = AAnk [0] = 0
5.4.2 Sensor calibration
On start-up, the user is requested to stand in a vertical position for 5 seconds. This
allowed the system to obtain calibration values from the accelerometers. The values
obtained during this calibration are recorded as offset constants for the accelerometers,
Chapter 5. Pedestrian dead reckoning system 105
and are named Au OFFSET , Av OFFSET and Aw OFFSET .
The sensitivity of the accelerometers can be calculated from calibration values which
are stored in the Wii remote EEPROM, in memory locations 0x16 to 0x1A. These values
contain the calibrated readings for each sensitive axis when subjected to 0g and 1g
accelerations, where ‘g ’ is the acceleration due to the gravity. We obtained the numerical
relationship between Wii acceleration units and ‘g ’ for each sensitive axis from these
values: 27 Wii accelerometer units equal 1g, or 9.8m/s2. We defined a conversion constant
called ‘Wii2MSS ’, to convert Wii acceleration units to physical units of m/s2,
Wii2MSS =9.81
27(5.1)
To calibrate the gyroscopes, the user was requested to rotate the body, changing
his yaw by 90 degrees to the right, and then to rotate his body back to the original
orientation. The mouse ticks reported by the Gyrosense mouse upon the rotation to the
right and left were accumulated in the variables TicksR and TicksL, respectively. We
calculated the sensitivity of the Gyrosense mouse in degrees per mouse tick for left and
right rotations in the following fashion
GyroSensR =90
TicksR
; GyroSensL =90
TicksL
(5.2)
The camera localization system was calibrated using the software utilities provided
by ARToolkit, which are explained in detail in [72].
5.4.3 Walking tasks
A walking task consisted of one complete traverse of the predefined circuit. For each task,
the user conformed to one of the following walking patterns (each pattern was performed
in both directions):
1. Walk continuously along the circuit in a natural straight path, turning only at the
Chapter 5. Pedestrian dead reckoning system 106
corners of the circuit, until the circuit is completed (the starting point is reached
again).
2. Walk continuously along the circuit in a zig-zag path until the circuit is completed.
3. Take 6 consecutive steps then stop for 5 seconds. Continue walking in this fashion
until the circuit is completed.
4. Take 6 consecutive steps then stop and rotate your body to look left and right and
then start walking again. Walk in this fashion until the circuit is completed.
These walking patterns were defined in order to emulate common walking behaviours
of a person trying to find a place within a building.
5.5 Position and orientation estimation
The data obtained from the inertial sensors were processed using a localization algorithm
with low memory and processing power requirements. If improved localization accuracy
is required in the future, these data can be processed using advanced techniques such
as Kalman or particle filtering.
To accurately track motion of a rigid body in 3D space with 6 degrees of freedom,
an inertial unit, namely a combination of 3 accelerometers and 3 gyroscopes, is required
[169]. In the case of an articulated body, an inertial unit has to be mounted on each ar-
ticulated section of the body [97, 168]. We simplified the system by making the following
assumptions:
• The ankle is articulated with respect to the pelvis, but in general the distance
between the ankle and the pelvis will remain within certain limits. The movement of
the torso (where the gyroscope is attached) and the legs (where the accelerometers
are attached) is assumed to be spatially correlated.
Chapter 5. Pedestrian dead reckoning system 107
• Three accelerometers can be used to calculate the total acceleration of the ankle
due solely to inertia, eliminating the contribution of gravity. We can then extract
forward and lateral components of the movement of the leg by using the acceleration
components in each axis.
• The user of the system will be walking upright with minimal pelvic tilt. We can
then use one single gyroscope to estimate the user’s bearing. If this condition is
not met, 3 gyroscopes would be required.
• We assume that the user walks over a horizontal plane. This means that the
accumulated acceleration of the foot during a full gait cycle (i.e. heel-off to heel-
off) must be equal to zero, resulting in no net vertical displacement of the foot.
5.5.1 Emulation of uniform data sampling
The gyromouse and the Wii remote controller have non-uniform sampling rates. We
created uniformly sampled versions of the data from these sensors, simulating a sampling
frequency of FS=20Hz. The sampling time is the inverse of the sampling frequency (i.e.
TS = 1/FS).
The Wii controller does not report data updates unless the values have changed since
the last values reported (i.e. it will not send data when it is static or its movement speed
is constant). We generated a uniformly sampled version of the accelerometry signals sent
by the Wii controller for each uniform period i=1,2,3,...,N in the following fashion:
• If there were one or more Wii data reports per uniform period i, the last acceleration
values received during that period are recorded as Au[i], Av[i] and Aw[i] ;
• If the Wii remote did not send any reports during the uniform period i, copy the
values stored from the previous period into the values of the current period
(i.e. Au[i] = Au[i − 1]; Av[i] = Av[i − 1]; Aw[i] = Aw[i − 1])

Chapter 5. Pedestrian dead reckoning system 108
The gyromouse only reports data if the angular velocity of any of its axis is differ-
ent from zero. We generated a uniformly sampled version of the data reported by the
gyroscopes in the following fashion:
• If one or more reports are received during one sampling period i, we assign the
accumulated value of the samples received from the superior-inferior and the medi-
olateral sensitive axes during the period to RSI [i] and RML[i] respectively;
• If we do not receive a report from the gyroscopes during a period i, we assign a
value of zero to RSI [i] and RML[i].
5.5.2 Acceleration, velocity and distance travelled by the ankle
As the orientation of the sensitive axis of the Wii remote changes with respect to the
gravitational field during a gait cycle, we needed to consider the total inertial acceleration
of the Wii remote, in order to determine the distance travelled. The three accelerometers
have identical sensitivity values. This allowed us to calculate the inertial acceleration
magnitude, which is independent of the orientation of the Wii remote.
AAnk[i] = |Au[i] − Au OFFSET | + Av[i] − Av OFFSET + |Aw[i] − Aw OFFSET | (5.3)
Technically, the ankle acceleration should be obtained via the vector sum of the
orthogonal acceleration vectors. For the sake of computational efficiency however, we
summed the absolute values of the magnitudes of individual acceleration components.
Based on the triangle inequality, this sum is an upper bound for the magnitude of the
vector sum of the three acceleration components. The absolute value bars are inten-
tionally omitted from the second term to eliminate the accumulation of small aberrant
vibrations and sensor noise in the v axis.
We calculated the ankle speed relative to the ground by integrating equation (5.3)
VAnk [i] = AAnk [i] · TS + VAnk [i − 1] (5.4)
Chapter 5. Pedestrian dead reckoning system 109
where Ts is again the sampling period. We then calculated the distance travelled by
the ankle by double integration of equation (5.3). We converted the calculated distance
to metres by multiplying the resulting value by the conversion factor ‘Wii2MSS ’, defined
in equation (5.1).
DAnk [i] = (AAnk [i] · T2S/2 + VAnk [i − 1] · Ts) · (Wii2MSS ) (5.5)
5.5.3 Zero-velocity updates for accelerometry signals
To mitigate the measurement drift of the accelerometers, we used a zero-velocity update
(ZUPT) technique, which consists of resetting the speed and acceleration to zero when
the accelerometer is known to be static, i.e., between heel-strike and toe-off of the in-
strumented foot. Originally we modified the Wii controller and connected a force sensor
(Interllink electronics FSR, model 406) to one of the Wii controller buttons. The force
sensor was placed under the heel, and was used as a foot switch. When the sensor was
depressed, the acceleration and velocity values were reset to zero.
The force sensor was discontinued from the system because it is not a mainstream
hardware component, and to reduce complexity since it had to be placed correctly to
avoid damaging the sensor and to obtain correct measurements.
To substitute for the force sensor, we generated a synthetic foot switch signal by
estimating the acceleration of the ankle due to inertia (ASwitch[i]) as the sum of the
acceleration sensed by each of the three accelerometers contained in the Wii controller,
namely,
ASwitch [i] = |Au[i] − Au OFFSET | + |Av[i] − Av OFFSET | + |Aw[i] − Aw OFFSET | (5.6)
The synthetic foot switch signal was then generated using the following rule,
Chapter 5. Pedestrian dead reckoning system 110
FootSwitch[i] =
{
0, if ASwitch [i] > Amin
1, if ASwitch [i] ≤ Amin
(5.7)
If the value of ASwitch[i] was lower than or equal to a minimum acceleration threshold,
Amin, we assumed that the ankle was static on the ground. This minimum threshold
value was selected empirically by visually comparing the synthetic foot switch signal
against the signal obtained using an actual force sensor under the heel. Normally, the
numerical value of the minimum acceleration would be dependent on the resolution of
the analog-to-digital conversion and the sensitivity of the accelerometer. In the present
study, Amin = 8, or approximately 2.9 m/s2.
When the synthetic foot switch signal had a value of 1 (the switch is in a pressed
state), we updated the acceleration and speed values of the ankle using the following
ZUPT conditions:
AAnk [i] = 0
VAnk [i − 1] = 0
}
, if FootSwitch[i] = 1 (5.8)
Applying the ZUPT conditions provided in (5.8) to the estimation of the distance
travelled by the ankle (equation (5.5)), resulted in zero displacement whenever the ankle
was static on the ground. (DAnk[i] = 0, ifFootSwitch = 1)
5.5.4 User bearing
The gyroscope which has its sensitive axis parallel to the superior-inferior direction of the
user reported the rate of change of the bearing of the user’s torso. Therefore, the bearing
of the user can be calculated by integrating the data received from this gyroscope. We
used the calibration data obtained from equation (5.2) to convert the values reported by
the gyromouse into degrees, θ, as follows.
θ[i] =
{
RSI [i] ∗ GyroSensR + θ[i − 1] , if RSI [i] ≤ 0
RSI [i] ∗ GyroSensL + θ[i − 1] , if RSI [i] > 0(5.9)
Chapter 5. Pedestrian dead reckoning system 111
5.5.5 Position update rule
To calculate the absolute position of the user in the building, we combined the location
information obtained independently by the camera and the inertial navigation system.
The algorithm for combining the information of both subsystems worked as follows.
1. If the camera provided reliable localization information through ARToolkit, this
information was preferred over the localization information obtained with the in-
ertial navigation system. When a reliable marker was detected by the camera, the
position and bearing of the user were updated using the location information from
the fiducial marker system. The image obtained from the camera had an inherent
delay. We empirically determined that this delay was approximately 0.5 seconds (or
10 samples at a 20Hz sampling frequency). During off-line data processing, we com-
pensated for this delay by adding a 0.5 second time offset to the location samples
obtained by the camera. If processing in real time, the last 10 position estimates
can be updated upon discovery of a recognized marker in the environment.
PosX [i] = PosCAMX[i + 10]
PosY [i] = PosCAMY[i + 10]
θ[i] = θCAM [i + 10]
A marker was considered recognized if it was not discounted by the following cri-
teria:
(a) ARToolkit provides a recognition quality (RQ) estimate for the detected marker.
This estimate takes a value between 0 and 1. An RQ value close to 0 indicates
that the detected marker location is not recognized. An RQ value close to 1
indicates that the detected marker ID, position and rotation are highly recog-
nizable. We defined an 80% threshold for the RQ estimate. Markers with RQ
values under this minimum threshold were discounted.
Chapter 5. Pedestrian dead reckoning system 112
(b) We discounted detected markers that implied an upside-down orientation of
the user (head towards the floor and feet towards the ceiling).
2. If there were no recognizable markers in the field of view of the camera, the user’s
position was updated each sampling period i, using the distance travelled by the
ankle DAnk and the user’s body bearing θ obtained from the inertial sensors in
equations (5.5) and (5.9). This was done in the following fashion:
(a) Calculate the distance travelled by the ankle in the current sampling period
DAnk[i] using equation (5.5), correcting this calculation using the ZUPT pro-
cedure presented in equation (5.8).
(b) Calculate the user bearing for the current sampling period θ[i] using equation
(5.9).
(c) Update the top-view position of the user in the building using these values.
PosX [i] = DAnk [i] · cos(θ[i]) + PosX [i − 1]
PosY [i] = DAnk [i] · sin(θ[i]) + PosY [i − 1]
5.6 Analysis of empirical data
5.6.1 Performance metrics
We calculated the path traversed by each participant using the proposed system, and we
defined six metrics of interest.
1. The mean out-of-bounds error value.
2. The maximum out-of-bounds error value.
3. The difference, in metres, between the final position detected by the proposed
system and the real final position.
Chapter 5. Pedestrian dead reckoning system 113
4. The difference between the final user bearing measured using the proposed system
and the real final bearing, in degrees.
5. The total distance measured by the accelerometers during each walking task.
6. The positioning accuracy.
The first two metrics are based on how often the estimated user’s position fell within
the boundaries of the predefined circuit during a walking task. An ‘out-of-bounds’ error
value was calculated at each sample point. If the detected user position fell within the
predefined circuit, the out-of-bounds error was zero. On the other hand, if the detected
position was beyond the boundaries of the predefined circuit, the out-of-bounds error
was the distance, in metres, to the closest wall of the circuit.
We calculated two versions of the first four metrics, an uncorrected version using
solely the inertial sensors to calculate the position of the user, and a corrected version
using the camera and the fiducial marker arrangement to adjust the position and bearing
estimates during the walking task.
The indoor positioning accuracy was defined as the final position error (metric #3)
over the gold standard distance, namely,
Accuracy =Finalpositionerror
Goldstandarddistancetravelled× 100 (5.10)
where the gold standard distance in the present experiment was 84.4 m. The gold
standard distance was obtained as follows. We measured the minimum and maximum
distances along the predefined circuit. The minimum distance was measured over the
innermost walls of the circuit, using shortcuts (diagonal walking) to minimize the mea-
sured distance. The maximum distance was measured along the outermost walls of the
predefined circuit. The minimum and maximum distances along the circuit were 74.3
and 94.5 metres, respectively. The gold standard distance was taken to be the aver-
Chapter 5. Pedestrian dead reckoning system 114
age of the maximum and minimum distances measured over the predefined path, i.e.,
(74.3+94.5)/2=84.4.
5.7 Results
The first five performance metrics for the male and female participants are presented in
Tables 1 and 2, respectively.
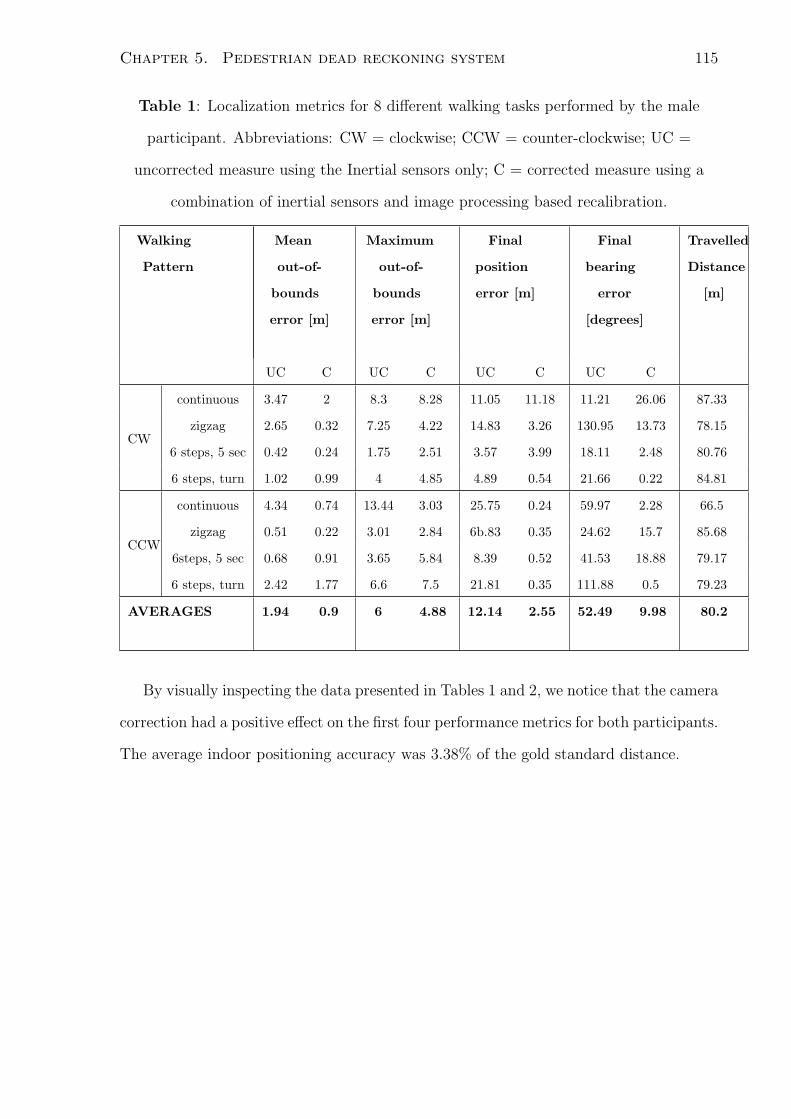
Chapter 5. Pedestrian dead reckoning system 115
Table 1: Localization metrics for 8 different walking tasks performed by the male
participant. Abbreviations: CW = clockwise; CCW = counter-clockwise; UC =
uncorrected measure using the Inertial sensors only; C = corrected measure using a
combination of inertial sensors and image processing based recalibration.
Walking
Pattern
Mean
out-of-
bounds
error [m]
Maximum
out-of-
bounds
error [m]
Final
position
error [m]
Final
bearing
error
[degrees]
Travelled
Distance
[m]
UC C UC C UC C UC C
CW
continuous 3.47 2 8.3 8.28 11.05 11.18 11.21 26.06 87.33
zigzag 2.65 0.32 7.25 4.22 14.83 3.26 130.95 13.73 78.15
6 steps, 5 sec 0.42 0.24 1.75 2.51 3.57 3.99 18.11 2.48 80.76
6 steps, turn 1.02 0.99 4 4.85 4.89 0.54 21.66 0.22 84.81
CCW
continuous 4.34 0.74 13.44 3.03 25.75 0.24 59.97 2.28 66.5
zigzag 0.51 0.22 3.01 2.84 6b.83 0.35 24.62 15.7 85.68
6steps, 5 sec 0.68 0.91 3.65 5.84 8.39 0.52 41.53 18.88 79.17
6 steps, turn 2.42 1.77 6.6 7.5 21.81 0.35 111.88 0.5 79.23
AVERAGES 1.94 0.9 6 4.88 12.14 2.55 52.49 9.98 80.2
By visually inspecting the data presented in Tables 1 and 2, we notice that the camera
correction had a positive effect on the first four performance metrics for both participants.
The average indoor positioning accuracy was 3.38% of the gold standard distance.
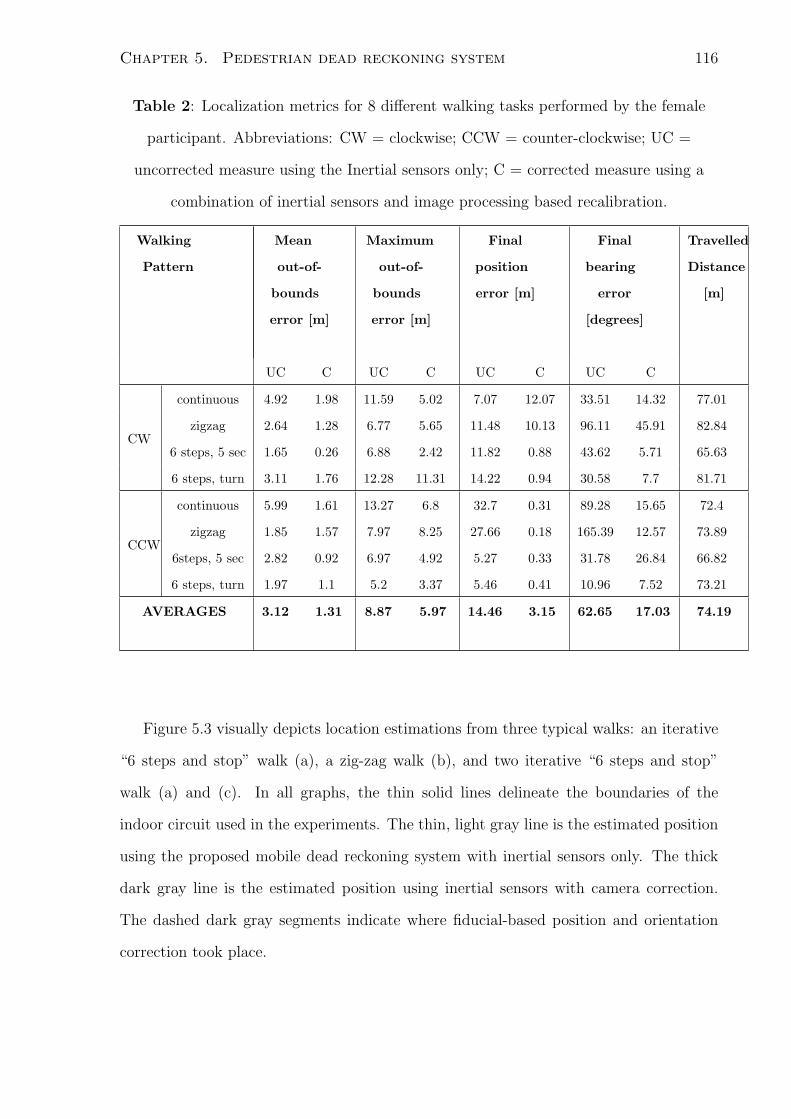
Chapter 5. Pedestrian dead reckoning system 116
Table 2: Localization metrics for 8 different walking tasks performed by the female
participant. Abbreviations: CW = clockwise; CCW = counter-clockwise; UC =
uncorrected measure using the Inertial sensors only; C = corrected measure using a
combination of inertial sensors and image processing based recalibration.
Walking
Pattern
Mean
out-of-
bounds
error [m]
Maximum
out-of-
bounds
error [m]
Final
position
error [m]
Final
bearing
error
[degrees]
Travelled
Distance
[m]
UC C UC C UC C UC C
CW
continuous 4.92 1.98 11.59 5.02 7.07 12.07 33.51 14.32 77.01
zigzag 2.64 1.28 6.77 5.65 11.48 10.13 96.11 45.91 82.84
6 steps, 5 sec 1.65 0.26 6.88 2.42 11.82 0.88 43.62 5.71 65.63
6 steps, turn 3.11 1.76 12.28 11.31 14.22 0.94 30.58 7.7 81.71
CCW
continuous 5.99 1.61 13.27 6.8 32.7 0.31 89.28 15.65 72.4
zigzag 1.85 1.57 7.97 8.25 27.66 0.18 165.39 12.57 73.89
6steps, 5 sec 2.82 0.92 6.97 4.92 5.27 0.33 31.78 26.84 66.82
6 steps, turn 1.97 1.1 5.2 3.37 5.46 0.41 10.96 7.52 73.21
AVERAGES 3.12 1.31 8.87 5.97 14.46 3.15 62.65 17.03 74.19
Figure 5.3 visually depicts location estimations from three typical walks: an iterative
“6 steps and stop” walk (a), a zig-zag walk (b), and two iterative “6 steps and stop”
walk (a) and (c). In all graphs, the thin solid lines delineate the boundaries of the
indoor circuit used in the experiments. The thin, light gray line is the estimated position
using the proposed mobile dead reckoning system with inertial sensors only. The thick
dark gray line is the estimated position using inertial sensors with camera correction.
The dashed dark gray segments indicate where fiducial-based position and orientation
correction took place.
Chapter 5. Pedestrian dead reckoning system 117
5.8 Discussion
5.8.1 Key findings
The proposed system uniquely combines mainstream hardware to achieve real-time pedes-
trian indoor localization using a limited number of markers in the environment. The cost
of the sensors used in this work is under $150. This makes the solution affordable for
clinical applications such as the rehabilitation of indoor topographical orientation or in-
door patient tracking, where GPS is not viable due to limited satellite visibility. The
proposed localization system does not require major infrastructure reconfigurations, such
as the installation of a wireless network. On the other hand, when wireless infrastructure
already exists in the building, the accuracy of the proposed solution could be enhanced
further using localization data from the wireless network.
The camera-corrected localization metrics seem to reduce the error when compared
with the corresponding non-corrected metrics. This indicates that the localization accu-
racy improves by using camera correction while using a limited number of markers
The final positioning accuracy of 3.38% of the total distance is comparable to the
positioning accuracies of 0.3% and 5.3% of the distance travelled reported in [45] and
[150] respectively, both of which used Kalman filtering to estimate the position of the
user. Hence, our results demonstrate that with simple processing and generic, off-the-
shelf consumer hardware, indoor pedestrian localization can be achieved with accuracies
comparable to those published in current literature.
5.8.2 Study limitations
Our experiments were conducted with a limited number of walking trials and participants.
A larger variety of natural walking tasks should be conducted in the future to verify the
finding that the quality of location estimation is indeed consistent across a large sample
of users. In this case, the study can only be considered as exploratory and a proof of
Chapter 5. Pedestrian dead reckoning system 118
concept.
The accuracy of the proposed system is limited due to the simplified processing algo-
rithm used and could be further improved by using more complex tracking algorithms,
such as Kalman filtering as in [45, 82] or algorithms that take into account the structure
of the building, such as particle filtering. This could be the subject of future research.
The localization algorithm assumed that the user walks on a horizontal surface. If
the vertical location of the user needs to be tracked as well, a barometer could be added
to the sensor bank.
The dead reckoning localization algorithm used in this study only takes into account
the total acceleration experienced by the ankle, assuming that the step was taken for-
wards. To determine the direction of the step (i.e., steps taken backwards or laterally),
the signals obtained from the different axes of the accelerometer need to be analyzed
individually. For example, the proposed system may benefit from a step classification
algorithm similar to the one used in [82].
We noticed that the distance calculated by the system was often shorter than the
minimum distance required to fully traverse the predefined circuit. In fact, 6 distance
measurements out of 16 were below this minimum distance. Possible causes include
inaccuracies in the simulated foot switch used for zero-velocity updates and the difference
between the distance travelled by the foot versus the distance travelled by the ankle.
Therefore, location estimation might be improved in future research by developing a
more accurate foot switch signal from the accelerometry data, and compensating for the
difference in the distance travelled by the foot and the ankle.
We also noticed that the orientation provided by a single gyroscope was not enough
to reliably track the orientation of the user in some cases. This could have been due to
the violation of the assumption that the users walked with minimum pelvic tilt. If such
condition is not obeyed, the sensitive axis of the gyroscope considered for data collection
might have capture rotation data of the user’s body that did not correspond to the vertical
Chapter 5. Pedestrian dead reckoning system 119
(gravitational) axis. Although the camera correction algorithm seemed to account for
this type of errors, the accuracy of orientation detection could be drastically improved
by used a tri-axial gyroscope. A better solution would be combining the gyroscopes and
the accelerometers in one single rigid unit (probably worn in the ankle), too create a
unit similar to InertiaCube. This option might be explored in future experiments using
the Wii Motion Plus extension for the Nintendo Wii remote controller, which contains a
two-axial gyroscope.
5.9 Conclusions
The proposed localization system yields indoor positioning accuracies that are compara-
ble to those of previous works on indoor navigation and outdoor GPS-based localization,
while being cost-effective and reliant only on mainstream consumer hardware compo-
nents. Our system uniquely combines dead reckoning sensors for position estimation and
fiducial marker-based image processing localization for dynamic recalibration. The pro-
posed system can estimate user locations for four different level-walking tasks without
constraining walking speed or stride length. Future research may aim to further improve
the localization accuracy of the proposed system and conduct expanded tests with a
larger sample of participants.
5.10 Acknowledgements
This work was supported by the Natural Sciences and Engineering Research Council of
Canada, the Canada Research Chairs Program, Bloorview Childrens Hospital Foundation
and Conacyt, Mexico.
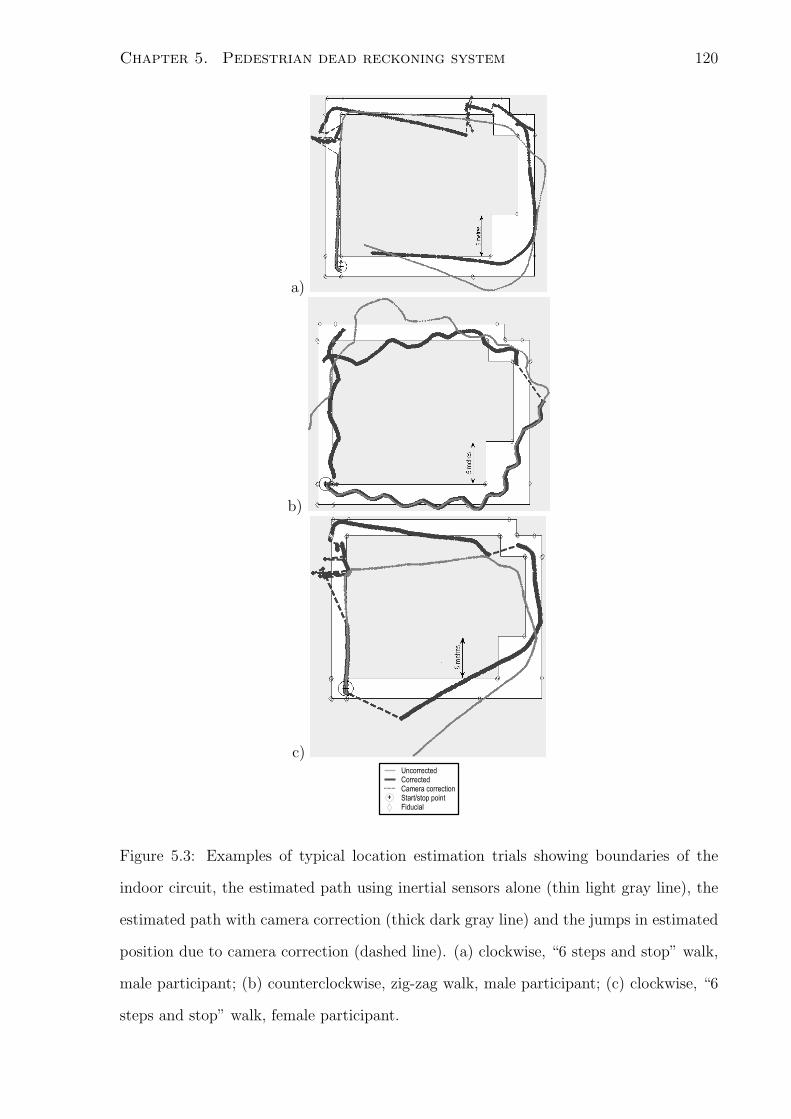
Chapter 5. Pedestrian dead reckoning system 120
a)
b)
c)
Figure 5.3: Examples of typical location estimation trials showing boundaries of the
indoor circuit, the estimated path using inertial sensors alone (thin light gray line), the
estimated path with camera correction (thick dark gray line) and the jumps in estimated
position due to camera correction (dashed line). (a) clockwise, “6 steps and stop” walk,
male participant; (b) counterclockwise, zig-zag walk, male participant; (c) clockwise, “6
steps and stop” walk, female participant.

Chapter 6
Mediated Reality Location Aware
System (MERLA)
Tores-Solis J and Chau T (submitted). A mediated reality location aware (MERLA)
system to facilitate indoor topographical orientation. Journal of Location Based Services.
Manuscript number: TLBS-2009-0016
6.1 abstract
We introduce a Mediated Reality Localization Aware (MERLA) system that offers wayfind-
ing tools for human indoor navigation. We hypothesized that indoor topographical ori-
entation skills can be enhanced by using the MERLA system. To quantitatively test this
hypothesis, six subjects participated in an experiment consisting of 24 scavenger hunts
inside an unfamiliar hospital building. For each scavenger hunt, the user was randomly
offered either no tools or one of two navigational tools: a locator or a minimap. The 8
no-tool trials constituted the baseline condition. To mitigate spatial learning effects over
the course of the experiment, participants were blindfolded and transported to a random
start location before each scavenger hunt. We estimated the relative energy expended
by each participant per hunt and each participant completed a post-experiment survey.
121
Chapter 6. Mediated Reality Location Aware System (MERLA) 122
Results indicated that when aided by mediated reality tools, participants expended sig-
nificantly less energy than in the unaided condition (p=4 × 10⁻⁶). Energy estimates
confirmed that spatial learning when using the tools was negligible over the duration
of the experiment. Collectively, objective and subjective results revealed a strong user
preference for navigation with tools (either the locator or the minimap) over navigation
without tools. The MERLA system, presented in this study, may offer a platform for
the future development of assistive devices that improve the independence of people with
topographical disorientation.
6.2 Introduction
Topographical orientation is the ability of recognizing objects and places in the environ-
ment, forming mental spatial relationships between them, and being able to navigate
to one of these objects or places efficiently [16]. Topographical disorientation refers to
deficits in orientation and navigation in the real environment [3]. An individual with
topographical disorientation can find it difficult to relate the position of an object with
respect to him or herself or to a landmark, has difficulties recognizing landmarks, or has
impaired ability to learn paths between objects and places [146]. All of these challenges
can lead to the inability to navigate through the environment independently.
Outdoor navigation tools that facilitate topographical orientation, such as compasses
or global positioning system devices (GPS), are commonplace and commercially avail-
able. However, indoor navigational tools are still in the research stage. Recent studies
have investigated the effectiveness of navigation tools within indoor virtual environments
[146, 172, 117]. [88] evaluated the benefits of navigational tools in real indoor environ-
ments. However, the location tracking and tool display decisions in their experiments
were not automatic, but manually facilitated by the experimenters. Other authors have
proposed indoor, location-based, augmented reality systems delivered via head-mounted
Chapter 6. Mediated Reality Location Aware System (MERLA) 123
displays [136, 134, 53]. [136] described an innovative localization system that combined
optical tracking of environmental fiducial markers with user-based inertial tracking, but
did not present any empirical data. Deploying an indoor ultrasound location system with
their augmented reality headgear, [134] presented qualitative user comments which sup-
ported improved user-environment interaction experience via in-situ visualization. Their
focus however was not on navigation. Most recently, within a very small indoor maze
and using a limited range tracking system, [53] demonstrated that when wearing a bat-
tlefield augmented reality system, participants more comprehensively covered the maze
than when navigating unassisted.
In the spirit of [88] and building on the optical-inertial hybrid tracking approach [136],
we created a Mediated Reality Location Aware (MERLA) device [171] to study the effects
of indoor navigational tools on actual wayfinding performance. Mediated reality refers
to the augmentation (i.e., augmented reality), reduction (i.e., diminished reality), or
otherwise alteration of the visual perception of reality [94]. Typically, the real world
scene is captured by a camera, processed and subsequently presented to the user. The
user then perceives the modified real world scene, which may contain virtual elements
whose dynamic behavior is location-based. Since mediated reality can enhance user
experience and perception [95, 96], it appears to be a fitting platform for presenting
indoor navigational tools to the user.
It is important to mention that an alternate indoor navigation assistive alternative
proposed in the literature is the usage of robotic guidance assistants [126]. This seems
to be a promising alternative since autonomous robotic navigation has been extensively
explored and tested. Nevertheless, we did not consider the usage of robotic guidance
assistants in this study for the same reasons exposed in chapter 4. Virtual navigation
assistants would introduce several variables that would encumber data analysis and result
interpretation. This option could be explored in future studies.
The objective of this study was to determine if topographical orientation within a
Chapter 6. Mediated Reality Location Aware System (MERLA) 124
large unfamiliar indoor environment can be enhanced by a location-based device which
presents the user with one of two different mediated-reality navigational tools, i.e., a lo-
cator and a minimap. The selected tools had been previously identified as the preferred
navigational devices in a virtual environment study [172]. Unlike previous studies, we fo-
cus specifically on the user’s physical effort when navigating with a fully-automated and
integrated location-based wayfinding service. Furthermore, we consider a much larger
navigation area than in previous indoor investigations. Research in this field may lead
to the creation of assistive devices that improve the independence of people with topo-
graphical disorientation [88].
6.3 Methods
6.3.1 Participants
We recruited a convenience sample of six participants (3 male) from the community, who
met the following inclusion criteria:
• 18 years of age or older
• Normal or corrected to normal vision
• Unfamiliar with the building where the experiments took place
• No reported cognitive impairments
• Capable of providing navigational instructions in English
6.3.2 Reference frames
The MERLA system obtained estimates of the location and orientation of a person within
a contemporary hospital building. For this, we considered three different reference frames.
Chapter 6. Mediated Reality Location Aware System (MERLA) 125
1. The building reference frame (fixed with respect to the building): We use the letters
(X,Y,Z) to label the axes of this reference frame, with ‘X’ pointing east, ‘Y’ pointing
North, and ‘Z’ pointing upwards.
2. The wheelchair reference frame (fixed with respect to the wheelchair): We use the
letters (u,v,w) to label the axes of this reference frame. The origin was defined
to be the centre of the seat upholstery of the wheelchair, with ‘u’ pointing to the
front of the wheelchair, ‘v’ pointing towards the right side of the wheelchair and
‘w’ pointing upwards with respect to the wheelchair. The bearing of the wheelchair
in the building was defined as the angle between the ‘X’ and ‘v’ axes, projected on
the XY plane.
3. The marker reference frame: MERLA used a fiducial marker recognition system,
and the ARToolkit library [72] to estimate the position and orientation of a camera
with respect to the fiducial marker in the camera’s field of view. Each marker had
its own reference frame, as defined in [72].
6.3.3 Localization system
For indoor user localization, we used a dead reckoning system combined with a fiducial
image processing system for intermittent position correction, similar to that proposed
in [171]. The basic idea is that strategically placed fiducial markers are intermittently
captured via a camera to provide the absolute position of the user, while the dead reck-
oning (inertial) system estimates the user’s relative position between fiducial markers.
The system was designed to provide real-time location estimates.
Due to safety requirements imposed by the healthcare facility, participants were re-
quired to use a wheelchair. Since the inertial dead reckoning subsystem proposed in [171]
relied on gait features for sensor recalibration, we developed an alternative solution suit-
able for wheeled mobility. In particular, the spokes of the back wheels of the wheelchair
Chapter 6. Mediated Reality Location Aware System (MERLA) 126
were instrumented with magnets (See Figure 6.2). Two magnetic sensors (Filzer dZ2L)
were set on the wheelchair frame close to each wheel. Two sensors per wheel were re-
quired to determine the direction of motion (forwards or backwards). Knowing the radius
of the wheels, the number of spokes per wheel, and the distance between the wheels, we
calculated the displacement and the change in bearing of the wheelchair each time the
spoke-mounted magnets passed the frame sensors.
Each fiducial marker was composed of a unique arrangement of black and white
squares within a 4 by 4 grid, enclosed in a black frame. The web camera used for the
fiducial-based localization system was mounted on the right handgrip of the wheelchair,
facing towards the front of the wheelchair. The fiducial recognition system was more
prone to misrecognizing a marker as the number of distinct markers grew. Hence, to
mitigate identification errors, we used only 10 distinct markers, but marked each position
in the building with a pair of markers. Each marker pair represented a numeric ID
composed of two digits. For instance, the combination of marker 4 on top and marker
3 on the bottom identified position 43 in the building. This position ID could then
be used to retrieve the building coordinates of the marker set within the building from
a database of the exact position and orientation of each fiducial within the building.
Ninety-two fiducial marker pairs were fixed at the corners of the intersections and on the
walls of large areas of the building. This represents a density of less than 1 fiducial per
15 square meters of wall and ceiling surface of navigable areas.
To further reduce fiducial detection errors, our algorithm verified that
• the separation between two markers in a set was 29.5 cm, which is the length of a
sheet of letter-sized paper;
• both markers in the set had their ‘y’ axis (as defined in the ARToolkit marker
reference frames [72]) aligned with the ‘Z’ axis of the building, and
• the vector traced from the first to the second marker in the set pointed to the
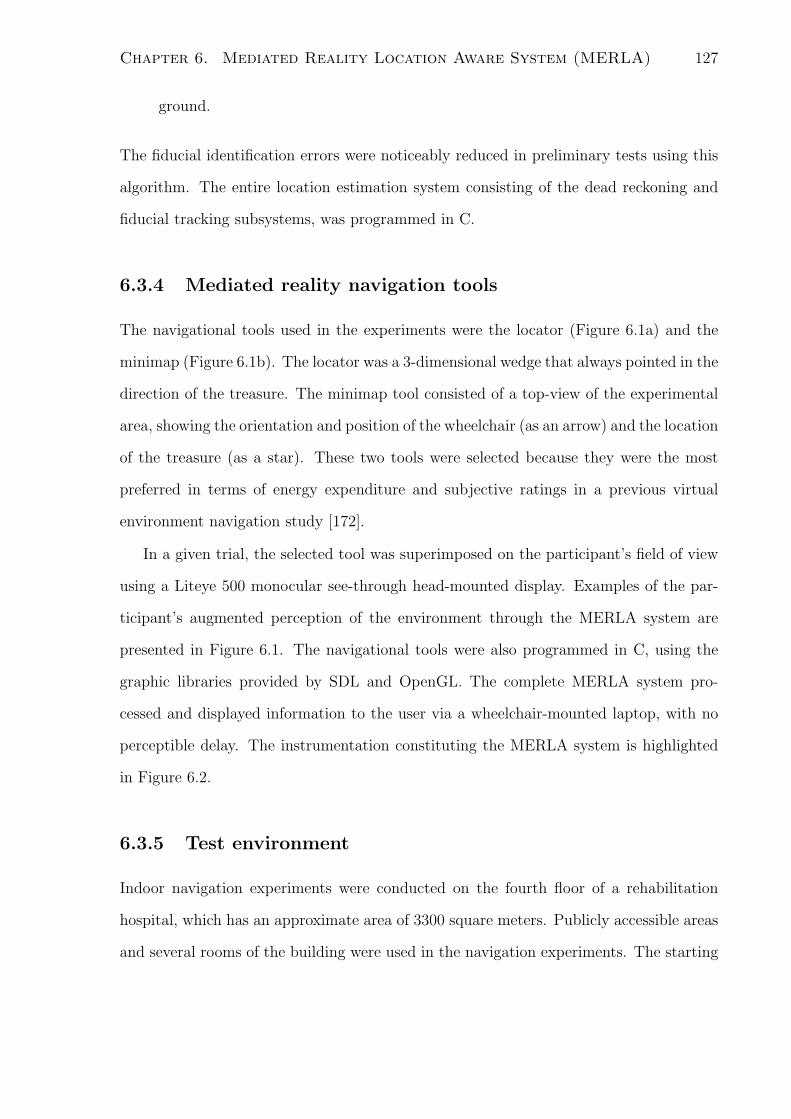
Chapter 6. Mediated Reality Location Aware System (MERLA) 127
ground.
The fiducial identification errors were noticeably reduced in preliminary tests using this
algorithm. The entire location estimation system consisting of the dead reckoning and
fiducial tracking subsystems, was programmed in C.
6.3.4 Mediated reality navigation tools
The navigational tools used in the experiments were the locator (Figure 6.1a) and the
minimap (Figure 6.1b). The locator was a 3-dimensional wedge that always pointed in the
direction of the treasure. The minimap tool consisted of a top-view of the experimental
area, showing the orientation and position of the wheelchair (as an arrow) and the location
of the treasure (as a star). These two tools were selected because they were the most
preferred in terms of energy expenditure and subjective ratings in a previous virtual
environment navigation study [172].
In a given trial, the selected tool was superimposed on the participant’s field of view
using a Liteye 500 monocular see-through head-mounted display. Examples of the par-
ticipant’s augmented perception of the environment through the MERLA system are
presented in Figure 6.1. The navigational tools were also programmed in C, using the
graphic libraries provided by SDL and OpenGL. The complete MERLA system pro-
cessed and displayed information to the user via a wheelchair-mounted laptop, with no
perceptible delay. The instrumentation constituting the MERLA system is highlighted
in Figure 6.2.
6.3.5 Test environment
Indoor navigation experiments were conducted on the fourth floor of a rehabilitation
hospital, which has an approximate area of 3300 square meters. Publicly accessible areas
and several rooms of the building were used in the navigation experiments. The starting
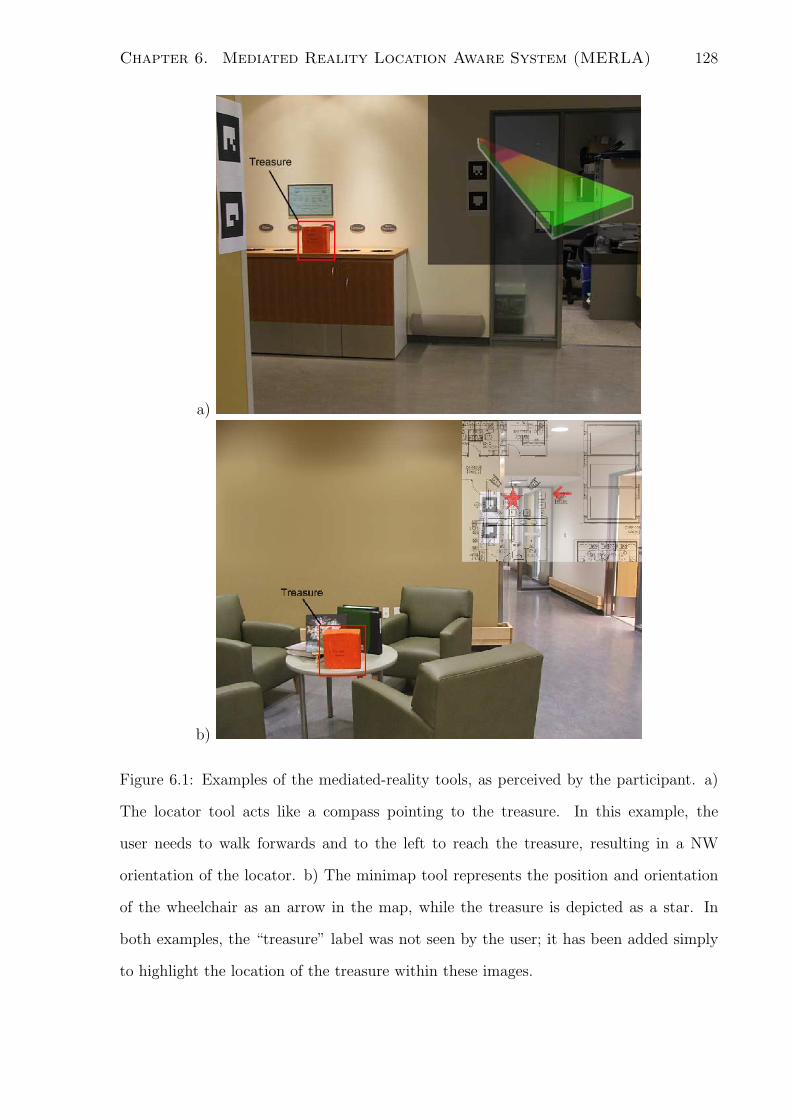
Chapter 6. Mediated Reality Location Aware System (MERLA) 128
a)
b)
Figure 6.1: Examples of the mediated-reality tools, as perceived by the participant. a)
The locator tool acts like a compass pointing to the treasure. In this example, the
user needs to walk forwards and to the left to reach the treasure, resulting in a NW
orientation of the locator. b) The minimap tool represents the position and orientation
of the wheelchair as an arrow in the map, while the treasure is depicted as a star. In
both examples, the “treasure” label was not seen by the user; it has been added simply
to highlight the location of the treasure within these images.
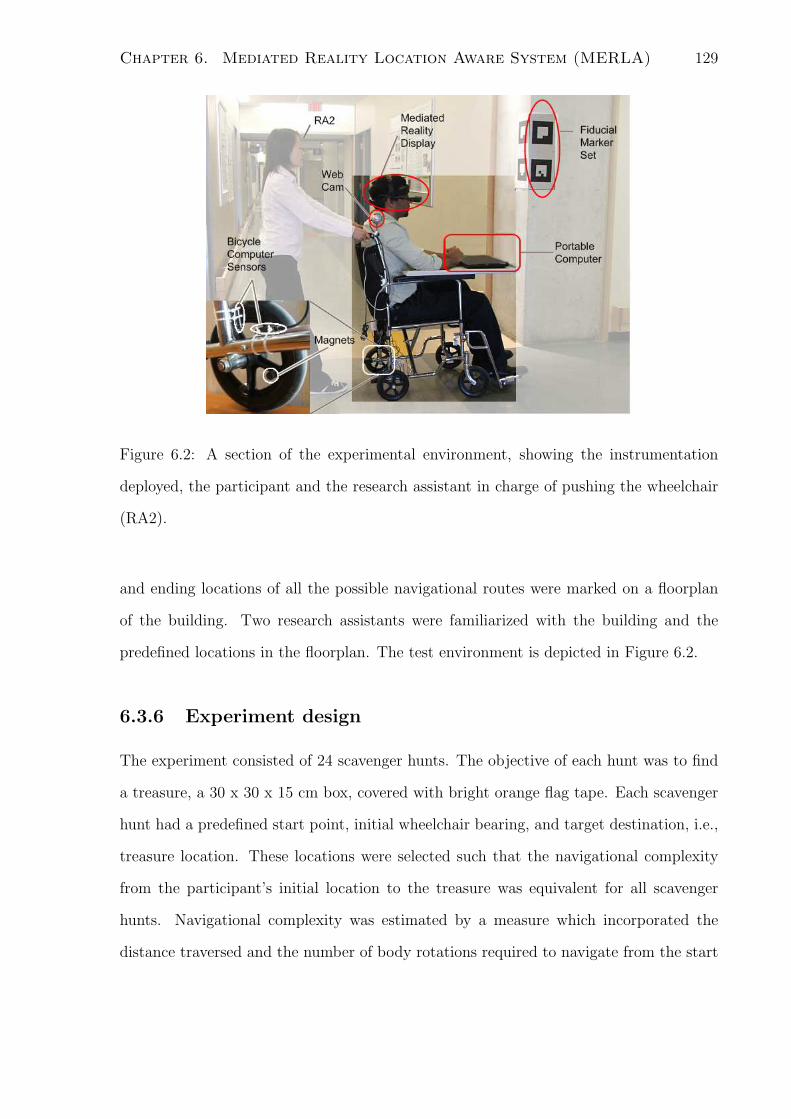
Chapter 6. Mediated Reality Location Aware System (MERLA) 129
Figure 6.2: A section of the experimental environment, showing the instrumentation
deployed, the participant and the research assistant in charge of pushing the wheelchair
(RA2).
and ending locations of all the possible navigational routes were marked on a floorplan
of the building. Two research assistants were familiarized with the building and the
predefined locations in the floorplan. The test environment is depicted in Figure 6.2.
6.3.6 Experiment design
The experiment consisted of 24 scavenger hunts. The objective of each hunt was to find
a treasure, a 30 x 30 x 15 cm box, covered with bright orange flag tape. Each scavenger
hunt had a predefined start point, initial wheelchair bearing, and target destination, i.e.,
treasure location. These locations were selected such that the navigational complexity
from the participant’s initial location to the treasure was equivalent for all scavenger
hunts. Navigational complexity was estimated by a measure which incorporated the
distance traversed and the number of body rotations required to navigate from the start
Chapter 6. Mediated Reality Location Aware System (MERLA) 130
point to the treasure position, as defined in [172].
The order of presentation of the different scavenger hunts was randomized. The indoor
navigational tool in each scavenger hunt was randomized in the following fashion:
• A sample space N, M, L was defined, representing the possible tool choices “No
tools”, “Minimap” or “Locator”, respectively.
• An event pool with 24 tools was defined. These 24 tools were composed of each
possible outcome ‘N’, ‘M’ and ‘L’ repeated 8 times each.
• For each scavenger hunt we randomly sampled the event pool without replacement.
The selected sample defined the tool for that particular scavenger hunt.
Before starting the experiment, the treasure was shown to the participant. The
participant was familiarized with the two navigational tools; pictures of the minimap
and a quick demo of the locator were provided to the participant while he was on the
first floor, which was not part of the test environment.
To mitigate spatial learning effects, the participant was blindfolded before being trans-
ported by wheelchair to the fourth floor via the elevator. The participant was also blind-
folded before starting each scavenger hunt, while being transported to the predefined
start location. The wheelchair was rotated a few times to disorient the participant be-
fore setting it to the predefined start orientation for the scavenger hunt. Before the start
of each scavenger hunt, a research assistant (RA1) placed the treasure in the predefined
target location for the specific hunt and vacated the area as soon as possible to avoid
revealing the treasure location. A second research assistant (RA2), shown in Figure 6.2,
was informed of the starting location and orientation of the wheelchair for the scavenger
hunt but had no knowledge of the treasure location.
At the beginning of each scavenger hunt, the participant was asked to remove the
blindfold. If a navigational tool was offered for that scavenger hunt, the participant
adjusted the augmented reality helmet until he or she could see the tool. RA2 pushed
Chapter 6. Mediated Reality Location Aware System (MERLA) 131
the wheelchair according to the participant’s commands. The permissible commands
were “forward”, “left”, “right”, “turn around”, “stop”, and “recalibrate”. RA2 carried
out the first four commands, continuing to move in the stated direction until finding a
new intersection or an open door, or upon an explicit “stop” command. The participant
was able to request recalibration if he or she thought that the navigational tool displayed
inaccurate or confusing information. To recalibrate, the participant needed to issue the
“recalibrate” command, and point to a set of fiducials. In this case, RA2 positioned the
wheelchair to face the pair of fiducials indicated by the participant and awaited further
instructions.
If the participant spotted the treasure within 10 minutes, the wheelchair was pushed
to the treasure location and the data capture program was terminated. If the treasure was
not found within 10 minutes, the participant was informed that the scavenger hunt was
over and the data capture program was stopped. The participant was then requested to
don the blindfold before being transported to the starting location of the next scavenger
hunt.
A rest period of 40 minutes was introduced after the twelfth scavenger hunt to recharge
the battery of the portable computer. After the twelfth scavenger hunt, the portable
computer was docked in a recharging station, and the participant was blindfolded and
transported by wheelchair to the first floor. At the end of the rest period, the participant
was blindfolded again before being taken back to the fourth floor to continue with the
experiment.
At the end of the scavenger hunts, the participants subjectively ranked the navigation
conditions, from the most (rank=1) to least (rank=3) helpful in finding the treasure. The
participant could also rank two or more conditions equally. Finally, participants were
invited to provide written comments regarding their experience of the navigational tools.

Chapter 6. Mediated Reality Location Aware System (MERLA) 132
6.3.7 Data analysis
Given the restricted access to certain hospital areas and the asymmetrical structure of the
building, the navigational complexity (i.e., distance and number of wheelchair rotations)
could not be strictly equal for the 24 scavenger hunts in the experiment. For this reason,
we decided to use the relative energy expenditure ratio metric proposed in [172] to obtain
a quantitative estimate of the physical effort exerted by the participant in each scavenger
hunt. This metric is independent of navigational complexity and thus facilitated the
comparison among tool conditions.
Using a two-way repeated-measures ANOVA, we tested for tool and presentation order
on the relative energy expenditure ratios. In cases of significant differences, we performed
pairwise one-way ANOVA tests, using a Bonferroni corrected level of significance. To
check for potential spatial learning effects, we conducted regression tests of the energy
versus trial number (i.e., scavenger hunt number) data for the minimap, locator and
no-tool conditions.
The participants’ subjective rankings of the conditions were summarized by the me-
dian statistic. Median values were normalized by their sum across all tools such that the
normalized rankings across tools summed to unity. Likewise, median energy values for
each tool were normalized by the sum of median energies across tools such that normal-
ized energies also summed to unity. This normalization allowed us to present subjective
and objective results side by side.
6.4 Results
A full statistical report for the 2-way repeated-measures ANOVA test for energy expen-
diture is presented in Table 6.1
As suggested by Table 6.1 and the box plot in Figure 6.3, there were significant differ-
ences in energy expenditure across tools (ANOVA, p = 4 × 10⁻⁶). The energy expended
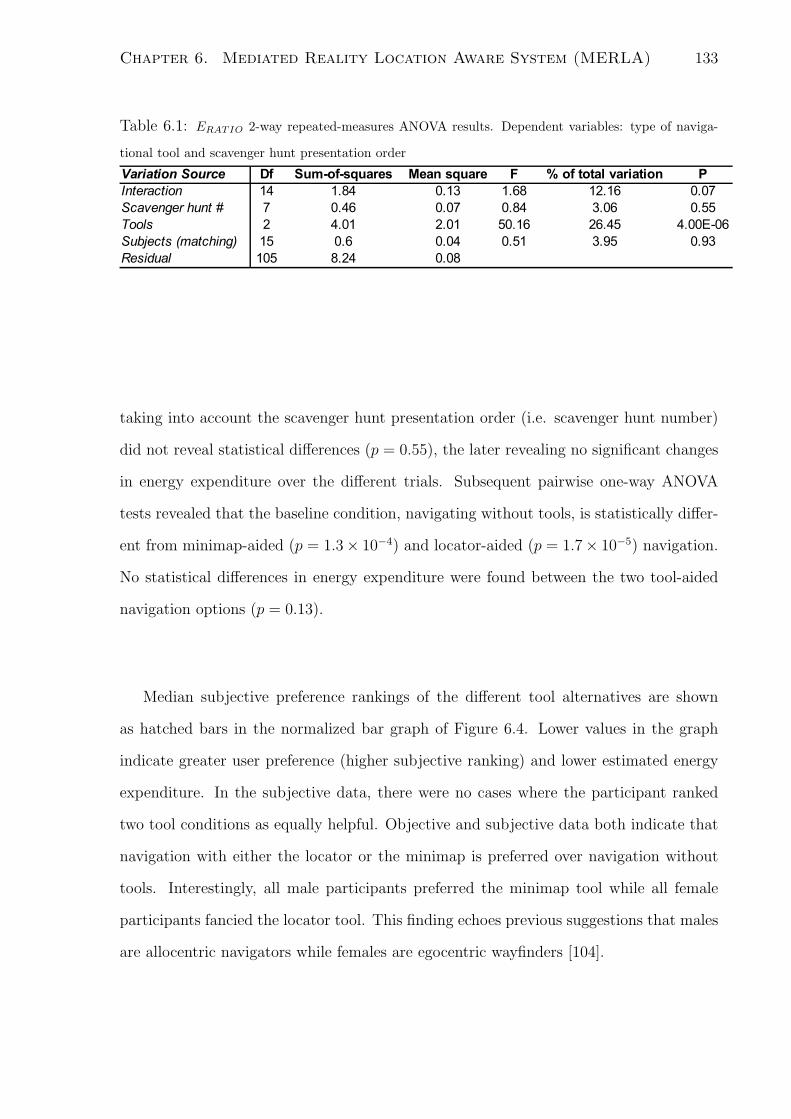
Chapter 6. Mediated Reality Location Aware System (MERLA) 133
Table 6.1: ERATIO 2-way repeated-measures ANOVA results. Dependent variables: type of naviga-
tional tool and scavenger hunt presentation order
taking into account the scavenger hunt presentation order (i.e. scavenger hunt number)
did not reveal statistical differences (p = 0.55), the later revealing no significant changes
in energy expenditure over the different trials. Subsequent pairwise one-way ANOVA
tests revealed that the baseline condition, navigating without tools, is statistically differ-
ent from minimap-aided (p = 1.3× 10⁻⁴) and locator-aided (p = 1.7× 10⁻⁵) navigation.
No statistical differences in energy expenditure were found between the two tool-aided
navigation options (p = 0.13).
Median subjective preference rankings of the different tool alternatives are shown
as hatched bars in the normalized bar graph of Figure 6.4. Lower values in the graph
indicate greater user preference (higher subjective ranking) and lower estimated energy
expenditure. In the subjective data, there were no cases where the participant ranked
two tool conditions as equally helpful. Objective and subjective data both indicate that
navigation with either the locator or the minimap is preferred over navigation without
tools. Interestingly, all male participants preferred the minimap tool while all female
participants fancied the locator tool. This finding echoes previous suggestions that males
are allocentric navigators while females are egocentric wayfinders [104].
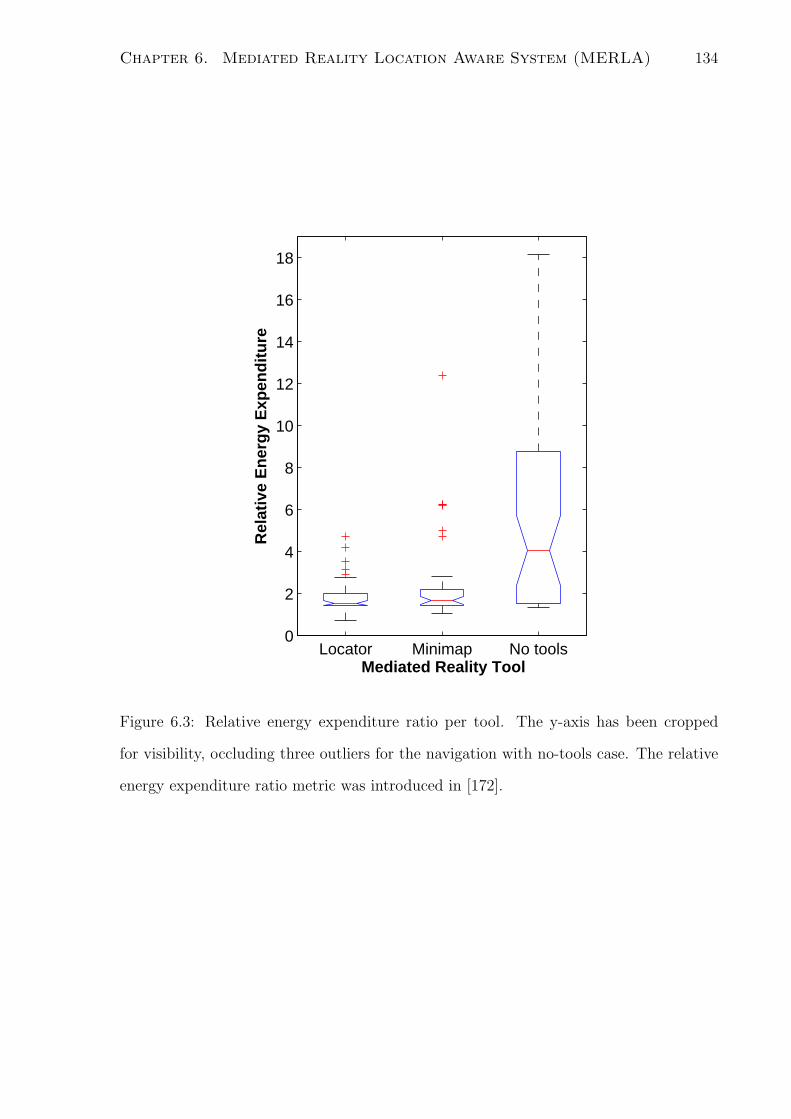
Chapter 6. Mediated Reality Location Aware System (MERLA) 134
Locator Minimap No tools0
2
4
6
8
10
12
14
16
18R
elat
ive
En
erg
y E
xpen
dit
ure
Mediated Reality Tool
Figure 6.3: Relative energy expenditure ratio per tool. The y-axis has been cropped
for visibility, occluding three outliers for the navigation with no-tools case. The relative
energy expenditure ratio metric was introduced in [172].
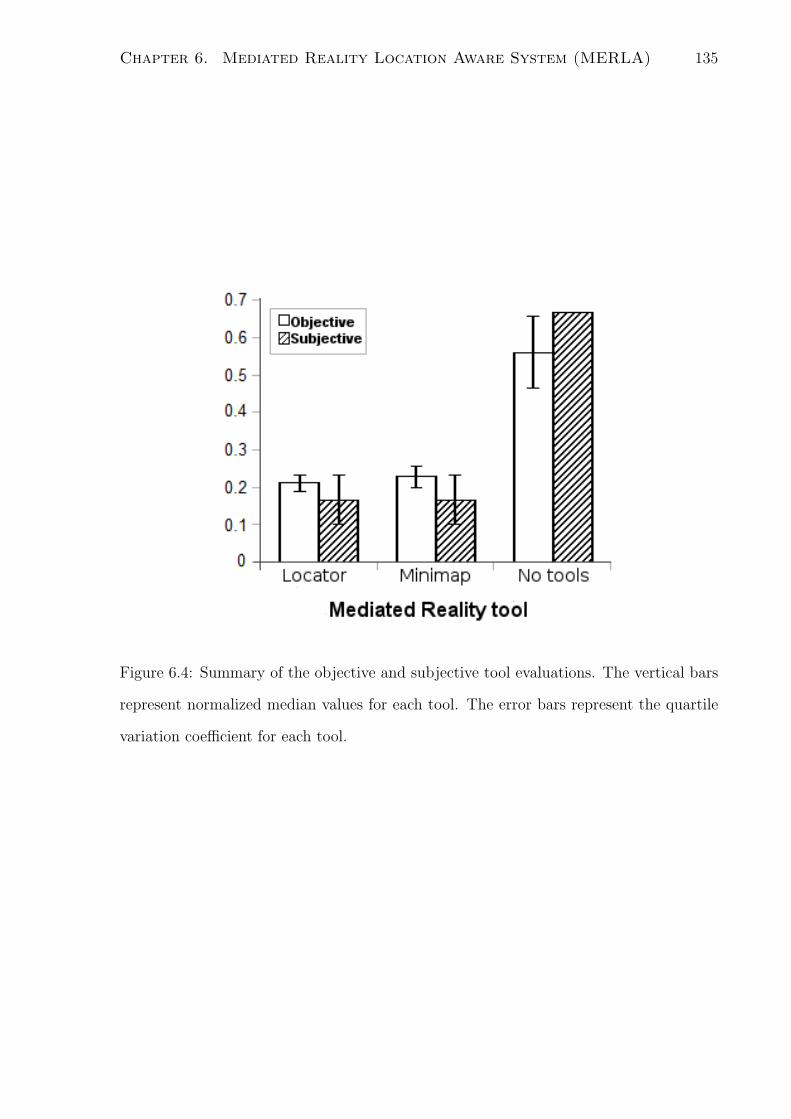
Chapter 6. Mediated Reality Location Aware System (MERLA) 135
Figure 6.4: Summary of the objective and subjective tool evaluations. The vertical bars
represent normalized median values for each tool. The error bars represent the quartile
variation coefficient for each tool.
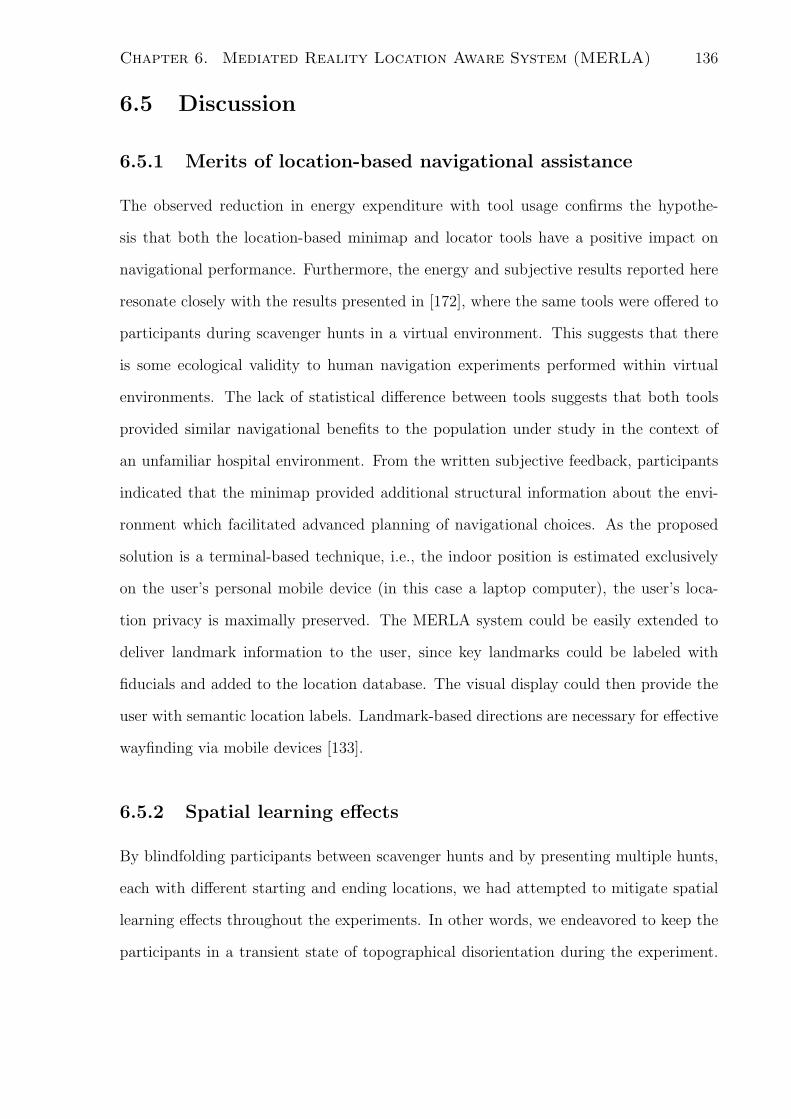
Chapter 6. Mediated Reality Location Aware System (MERLA) 136
6.5 Discussion
6.5.1 Merits of location-based navigational assistance
The observed reduction in energy expenditure with tool usage confirms the hypothe-
sis that both the location-based minimap and locator tools have a positive impact on
navigational performance. Furthermore, the energy and subjective results reported here
resonate closely with the results presented in [172], where the same tools were offered to
participants during scavenger hunts in a virtual environment. This suggests that there
is some ecological validity to human navigation experiments performed within virtual
environments. The lack of statistical difference between tools suggests that both tools
provided similar navigational benefits to the population under study in the context of
an unfamiliar hospital environment. From the written subjective feedback, participants
indicated that the minimap provided additional structural information about the envi-
ronment which facilitated advanced planning of navigational choices. As the proposed
solution is a terminal-based technique, i.e., the indoor position is estimated exclusively
on the user’s personal mobile device (in this case a laptop computer), the user’s loca-
tion privacy is maximally preserved. The MERLA system could be easily extended to
deliver landmark information to the user, since key landmarks could be labeled with
fiducials and added to the location database. The visual display could then provide the
user with semantic location labels. Landmark-based directions are necessary for effective
wayfinding via mobile devices [133].
6.5.2 Spatial learning effects
By blindfolding participants between scavenger hunts and by presenting multiple hunts,
each with different starting and ending locations, we had attempted to mitigate spatial
learning effects throughout the experiments. In other words, we endeavored to keep the
participants in a transient state of topographical disorientation during the experiment.
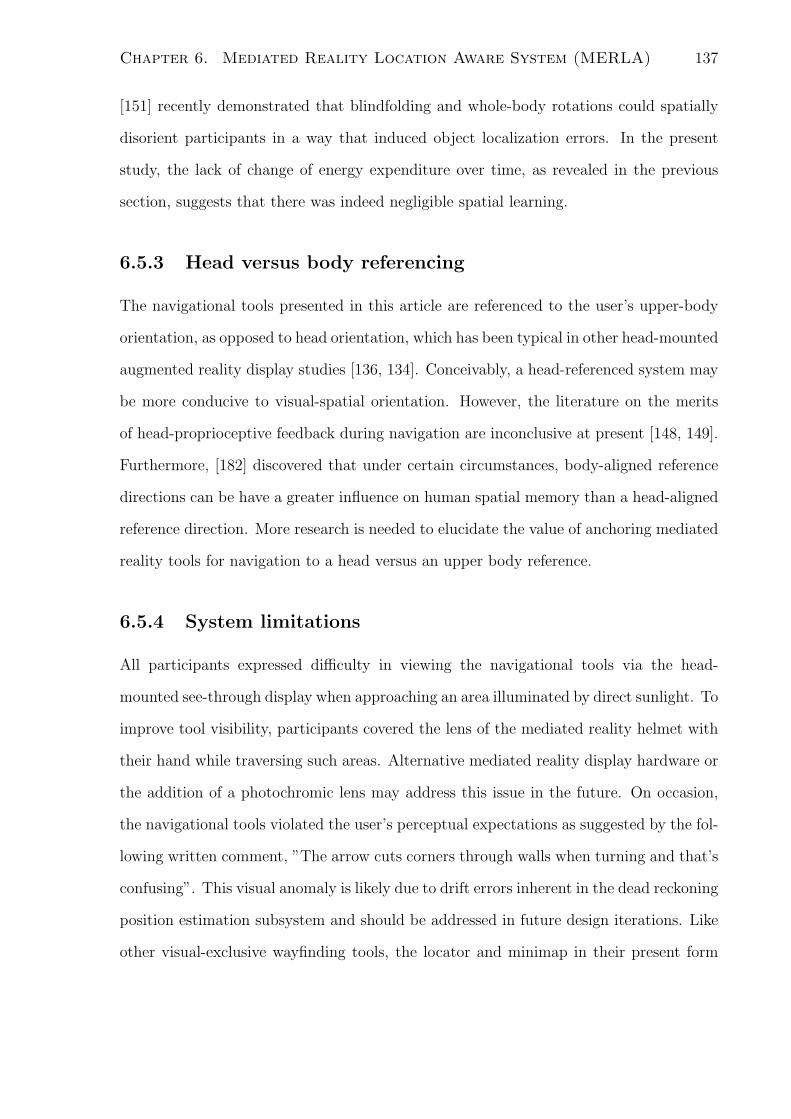
Chapter 6. Mediated Reality Location Aware System (MERLA) 137
[151] recently demonstrated that blindfolding and whole-body rotations could spatially
disorient participants in a way that induced object localization errors. In the present
study, the lack of change of energy expenditure over time, as revealed in the previous
section, suggests that there was indeed negligible spatial learning.
6.5.3 Head versus body referencing
The navigational tools presented in this article are referenced to the user’s upper-body
orientation, as opposed to head orientation, which has been typical in other head-mounted
augmented reality display studies [136, 134]. Conceivably, a head-referenced system may
be more conducive to visual-spatial orientation. However, the literature on the merits
of head-proprioceptive feedback during navigation are inconclusive at present [148, 149].
Furthermore, [182] discovered that under certain circumstances, body-aligned reference
directions can be have a greater influence on human spatial memory than a head-aligned
reference direction. More research is needed to elucidate the value of anchoring mediated
reality tools for navigation to a head versus an upper body reference.
6.5.4 System limitations
All participants expressed difficulty in viewing the navigational tools via the head-
mounted see-through display when approaching an area illuminated by direct sunlight. To
improve tool visibility, participants covered the lens of the mediated reality helmet with
their hand while traversing such areas. Alternative mediated reality display hardware or
the addition of a photochromic lens may address this issue in the future. On occasion,
the navigational tools violated the user’s perceptual expectations as suggested by the fol-
lowing written comment, ”The arrow cuts corners through walls when turning and that’s
confusing”. This visual anomaly is likely due to drift errors inherent in the dead reckoning
position estimation subsystem and should be addressed in future design iterations. Like
other visual-exclusive wayfinding tools, the locator and minimap in their present form
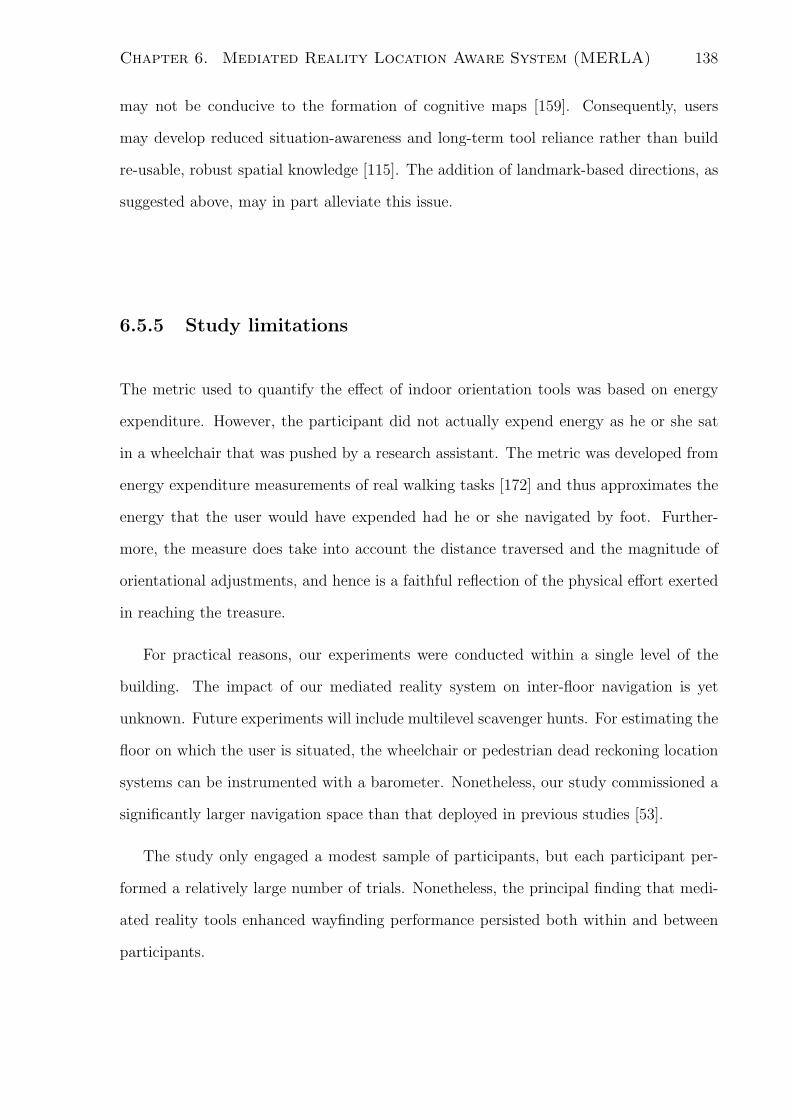
Chapter 6. Mediated Reality Location Aware System (MERLA) 138
may not be conducive to the formation of cognitive maps [159]. Consequently, users
may develop reduced situation-awareness and long-term tool reliance rather than build
re-usable, robust spatial knowledge [115]. The addition of landmark-based directions, as
suggested above, may in part alleviate this issue.
6.5.5 Study limitations
The metric used to quantify the effect of indoor orientation tools was based on energy
expenditure. However, the participant did not actually expend energy as he or she sat
in a wheelchair that was pushed by a research assistant. The metric was developed from
energy expenditure measurements of real walking tasks [172] and thus approximates the
energy that the user would have expended had he or she navigated by foot. Further-
more, the measure does take into account the distance traversed and the magnitude of
orientational adjustments, and hence is a faithful reflection of the physical effort exerted
in reaching the treasure.
For practical reasons, our experiments were conducted within a single level of the
building. The impact of our mediated reality system on inter-floor navigation is yet
unknown. Future experiments will include multilevel scavenger hunts. For estimating the
floor on which the user is situated, the wheelchair or pedestrian dead reckoning location
systems can be instrumented with a barometer. Nonetheless, our study commissioned a
significantly larger navigation space than that deployed in previous studies [53].
The study only engaged a modest sample of participants, but each participant per-
formed a relatively large number of trials. Nonetheless, the principal finding that medi-
ated reality tools enhanced wayfinding performance persisted both within and between
participants.
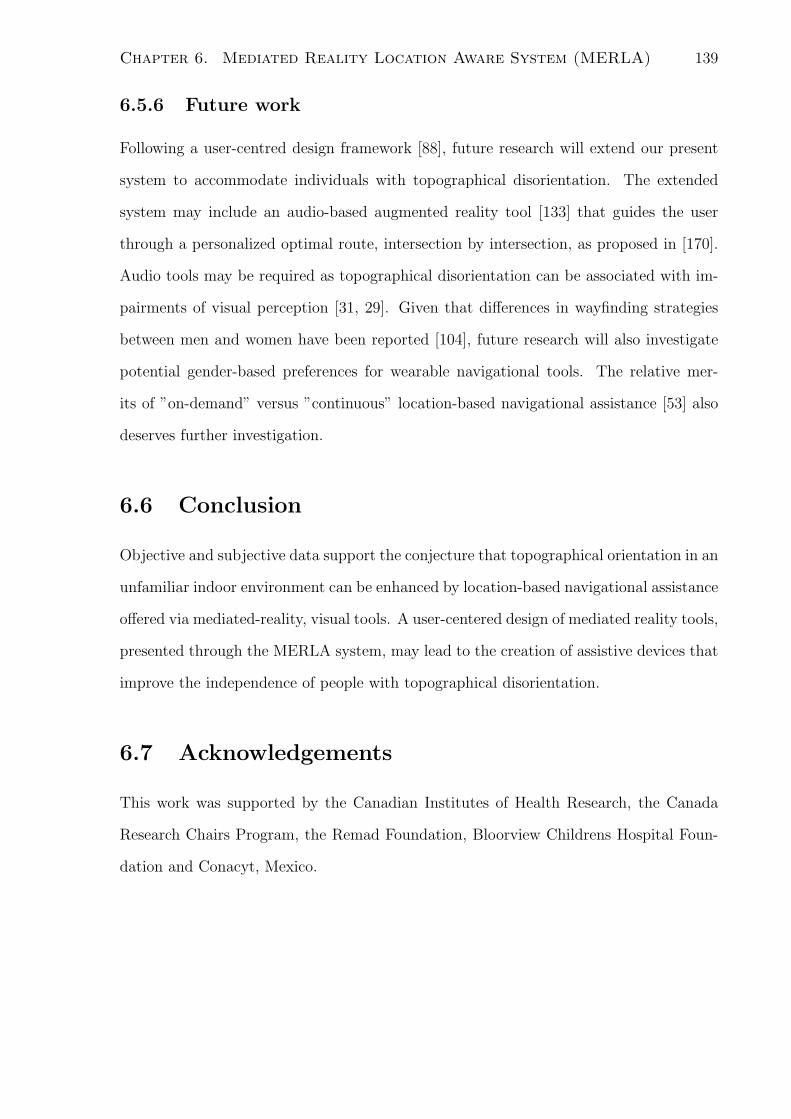
Chapter 6. Mediated Reality Location Aware System (MERLA) 139
6.5.6 Future work
Following a user-centred design framework [88], future research will extend our present
system to accommodate individuals with topographical disorientation. The extended
system may include an audio-based augmented reality tool [133] that guides the user
through a personalized optimal route, intersection by intersection, as proposed in [170].
Audio tools may be required as topographical disorientation can be associated with im-
pairments of visual perception [31, 29]. Given that differences in wayfinding strategies
between men and women have been reported [104], future research will also investigate
potential gender-based preferences for wearable navigational tools. The relative mer-
its of ”on-demand” versus ”continuous” location-based navigational assistance [53] also
deserves further investigation.
6.6 Conclusion
Objective and subjective data support the conjecture that topographical orientation in an
unfamiliar indoor environment can be enhanced by location-based navigational assistance
offered via mediated-reality, visual tools. A user-centered design of mediated reality tools,
presented through the MERLA system, may lead to the creation of assistive devices that
improve the independence of people with topographical disorientation.
6.7 Acknowledgements
This work was supported by the Canadian Institutes of Health Research, the Canada
Research Chairs Program, the Remad Foundation, Bloorview Childrens Hospital Foun-
dation and Conacyt, Mexico.
Chapter 7
Contributions
The main scientific contributions of this thesis are:
1. An extensive and structured literature review of indoor localization technologies.
This literature review could serve as a guideline for future research aimed to create
wayfinding assistive devices.
2. The creation of an automated navigation algorithm, that can effectively reduce the
navigational effort of patients with topographical disorientation. The algorithm ac-
counts for the physical abilities of the patient, environmental barriers and dynamic
building changes.
3. The introduction a novel wayfinding metric that can be used in the assessment of
navigation tasks.
4. The identification of preferrred graphical navigation tools for mediated reality
wayfinding guidance, taking into account different combinations of spatial knowl-
edge, graphical presentations and reference frames.
5. The creation of two unique localization systems for indoor human tracking in real-
time. The first localization system was oriented to pedestrians, while the second
was implemented on a wheelchair.
140
Chapter 7. Contributions 141
6. The realization of a wearable, mediated reality location aware system for indoor
navigation. This system proved to be an effective indoor navigation assistive device
by reducing the physical effort required during wayfinding tasks in an unfamiliar
indoor environment.
7.1 Publications
• Torres-Solis J and Chau T. (Accepted in preliminary form for publication in Am-
bient Intelligence, ISBN 978-953-7619-X-X). A review of indoor localization tech-
nologies: towards navigational assistance for topographical disorientation. Book
chapter. Ambient Intelligence (A. Lazinica, editor), In-Tech Publishers.
• Torres-Solis J and Chau T (2007). A flexible routing scheme for patients with
topographical disorientation. Journal of Neuroengineering and Rehabilitation, 4:44
(11 pages)
• Torres-Solis J, Guan M, Biddiss E, and Chau T. (In press) Mediated reality tools
for navigation in smart environments. Technology and Health Care, Special Issue:
Smart environments: technology to support healthcare (Invited).
• Torres-Solis J and Chau T (submitted). Wearable indoor pedestrian dead reckoning
system. Pervasive and Mobile Computing, (Under review, Manuscript number:
PMC-D-09-00006).
• Tores-Solis J and Chau T (submitted). A mediated reality location aware (MERLA)
system to facilitate indoor topographical orientation. Journal of Location Based
Services. Manuscript number: TLBS-2009-0016
Bibliography
[1] AAMI. Technical information report (tir) 18, guidance on electromagnetic compat-
ibility of medical devices for clinical/biomedical engineers. Technical Information
Report TIR-18, Association for the Advancement of Medical Instrumentation, Ar-
lington, Virginia, 1997.
[2] Mike Addlesee, Rupert Curwen, Steve Hodges, Joe Newman, Pete Steggles, Andy
Ward, and Andy Hopper. Implementing a sentient computing system. Computer,
34(8):50–56, 2001.
[3] GK. Aguirre and M. D’Esposito. Topographical disorientation: a synthesis and
taxonomy. Brain, 122 (Pt 9):1613–28, Sep 1999.
[4] Uzair Ahmad, Andrey V. Gavrilov, Sungyoung Lee, and Young-Koo Lee.
A modular classification model for received signal strength based loca-
tion systems. Neurocomputing, 71(13-15):2657 – 2669, 2008. Attrac-
tive methods;Classification methods;Classification models;Environmental fac-
tors;Feature spaces;Indoor positioning systems;Location accuracies;Location es-
timation;Location estimations;Location systems;Modular classifiers;Multilayer
perceptron;Null values;Radio signals;Received signal strength;Received signal
strengths;Target sites;.
[5] Omar Ait Aider, Philippe Hoppenot, and Etienne Colle. A model-based method
for indoor mobile robot localization using monocular vision and straight-line cor-
142
Bibliography 143
respondences. Robotics and Autonomous Systems, v 52, n 2-3, Aug 31, 2005, p
229-246, 2005.
[6] Murat Alemdar, Pervin Iseri, Irem Yalug, Huumlseyin Kutlu, Husnu Efendi, and
Sezer Sener Komsuoglu. Route learning impairment associated with encephaloma-
lasia secondary to traumatic brain injury: A case report. Applied Neuropsychology,
15(2):150–155, April 2008.
[7] JM Alisky. Integrated electronic monitoring systems could revolutionize care for
patients with cognitive impairments. Medical Hypotheses, 66(6):1161–1164, 2006.
[8] Cathy L. Antonakos. Compensatory wayfinding behavior in topographic disori-
entation from brain injury. Environmental Psychology, 24(4):495–502, December
2004.
[9] S. Arulampalam, S. Maskell, N. Gordon, and T. Clapp. A tutorial on particle
filters for on-line non-linear/non-gaussian bayesian tracking. In IEEE transactions
in Signal Processing, volume 50, pages 174–188, 2002.
[10] M. Van Asselen, R.P.C. Kessels, L.J. Kappelle, S. Neggers, C. Frijns, and
A. Postma. Neural correlates of human wayfinding in stroke patients. Neurobi-
ology of Aging, 1067(1):229–238, 2006.
[11] Ronald Azuma. A survey of augmented reality. Presence, 6(4):355–385, 1997.
[12] Paramvir Bahl and Venkata N. Padmanabhan. Radar: An in-building rf-based user
location and tracking system. In INFOCOM (2), pages 775–784, 2000.
[13] J Barrash. A historical review of topographical disorientation and its neuroanatom-
ical correlates. J Clin Exp Neuropsychol, 20(6):807–27, Dec 1998.
[14] J Barrash, H Damasio, R Adolphs, and D Tranel. The neuroanatomical correlates
of route learning impairment. Neuropsychologia, 38(6):820–36, 2000.
Bibliography 144
[15] S. Belkhous, A. Azzouz, M. Saad, C. Nerguizian, and V. Nerguizian. A novel
approach for mobile robot navigation with dynamic obstacles avoidance. Journal
of Intelligent and Robotic Systems, 44:187–201, 2005.
[16] Laura Bertella, Stefano Marchi, and Giuseppe Riva. Virtual environment for topo-
graphical orientation (veto): Clinical rationale and technical characteristics. Pres-
ence: Teleoper. Virtual Environ., 10(4):440–449, 2001.
[17] F Blache, N Chraiet, O Daroux an dF Evennou, T Flury, G Privat, and JP Viboud.
Position-based interaction for indoor ambient intelligence environments. In Ambient
Intelligence, volume 2875 of Lectures Notes in Computer Science, pages 192–207.
Springer Verlag, 2003.
[18] Barry Brumitt, Brian Meyers, John Krumm, Amanda Kern, and Steven A. Shafer.
Easyliving: Technologies for intelligent environments. In HUC, pages 12–29, 2000.
[19] R. Brunsdon, L. Nickels, M. Coltheart, and P. Joy. Assessment and treatment
of childhood topographical disorientation: A case study. Neuropsychol Rehabil,
17(1):53–94, 2007.
[20] G. A. Carlesimo, R. Perri, P. Turriziani, F. Tomaiuolo, and C. Caltagirone. Remem-
bering what but not where: independence of spatial and visual working memory in
the human brain. Cortex, 37(4):519–34, Sep 2001.
[21] R. Casas, A. Marco, J.J. Guerrero, and J. Falco. Robust estimator for non-line-
of-sight error mitigation in indoor localization. Eurasip Journal on Applied Signal
Processing, v 2006, 2006, p 43429, 2006.
[22] Roberto Casas, David Cuartielles, Alvaro Marco, Hector J. Gracia, and Jorge L.
Falco. Hidden issues in deploying an indoor location system. IEEE Pervasive
Computing, v 6, n 2, April/June, 2007, p 62-69, 2007.
Bibliography 145
[23] T. Chau, H. Schwellnus, C. Tam, A. Lamont, and C. Eaton. Augmented environ-
ments for paediatric rehabilitation. Technology & Disability, 18(3):1–5, 2006.
[24] Adrian David Cheok and Yue Li. Ubiquitous interaction with positioning and nav-
igation using a novel light sensor-based information transmission system. Personal
and Ubiquitous Computing, 12(6):445 – 458, 2008. Electronic ballasts;Fluorescent
light;GPS tracking;Guidance and navigation;Indoor environments;Indoor position-
ing;Information transmission;Light sensors;Modulation techniques;Positioning in-
formation;Transmitter circuits;.
[25] Luca Chittaro and Stefano Burigat. 3d location-pointing as a navigation aid in vir-
tual environments. In AVI ’04: Proceedings of the working conference on Advanced
visual interfaces, pages 267–274, New York, NY, USA, 2004. ACM.
[26] Luca Chittaro, Lucio Ieronutti, and Roberto Ranon. Navigating 3d virtual envi-
ronments by following embodied agents: a proposal and its informal evaluation
on a virtual museum application. PsychNology Journal (Special issue on Human-
Computer Interaction, 2:24–42, 2004.
[27] LS Chou, KR Kaufman, AE Walker-Rabatin, RH Brey, and JR Basford. Dynamic
instability during obstacle crossing following traumatic brain injury. Gait & Pos-
ture, 20(3):245–254, 2004.
[28] C. Ciavarella and F. Paterno. The design of a handheld, location-aware guide for
indoor environments. Personal and Ubiquitous Computing, v 8, n 2, 2004, 82-91,
2004.
[29] S. Clarke, G. Assal, and N. de Tribolet. Left hemisphere strategies in visual recogni-
tion, topographical orientation and time planning. Neuropsychologia, 31(2):99–113,
February 1993.
Bibliography 146
[30] M. Claypool and G. Kannan. Selective flooding for improved quality-of-service
routing. Proceedings of SPIE, Quality of Service over Next-Generation Data Net-
work, 4524:33–44, 2001.
[31] Maurizio Corbetta, J. Michelle Kincade, and Gordon L. Shulman. Neural systems
for visual orienting and their relationships to spatial working memory. J. Cognitive
Neuroscience, 14(3):508–523, 2002.
[32] Rudy P. Darken and John L. Sibert. A toolset for navigation in virtual envi-
ronments. In Proceedings of ACM User Interface Software and Technology, pages
157–165, 1993.
[33] M. Davis, S. J. C.; Coltheart. Rehabilitation of topographical disorientation: An
experimental single case study. Neuropsychological Rehabilitation, 9(1):1–30, 1999.
[34] S. J. C. Davis. Rehabilitation of topographical disorientation: An experimental
single case study. Neuropsychological Rehabilitation, 9(1):1–30, 1999.
[35] E. W. Dijkstra. A note on two problems in connexion with graphs. Numerische
Mathematik, 1(1):269–271, 1959.
[36] S.S. Dikmen, J.E. Machamer, J.M. Powell, and N.R. Temkin. Outcome 3 to 5
years after moderate to severe traumatic brain injury. Arch Phys Med Rehabil,
84(10):1449–1457, 2003.
[37] R Duffield, B Dawson, H.C. Pinnington, and P Wong. Accuracy and reliability of
a cosmed k4b2 portable gas analysis system. Journal of Science and Medicine in
Sport, 7(1):11–22, March 2004.
[38] PL Emiliani and C Stephanidis. Universal access to ambient intelligence environ-
ments: opportunities and challenges for people with disabilities. IBM Systems
Journal, 44(3):605–619, 2005.
Bibliography 147
[39] F. Evennou and F. Marx. Advanced integration of wifi and inertial navigation
systems for indoor mobile positioning. EURASIP Journal on Applied Signal Pro-
cessing, v 2006, n 17, 2006, 11 pp., 2006.
[40] Shih-Hau Fang and Tsung-Nan Lin. Indoor location system based on discriminant-
adaptive neural network in ieee 802.11 environments. IEEE Transactions on
Neural Networks, 19(11):1973 – 1978, 2008. Access points;Adaptive;Adaptive
neural networks;Discriminative components;IEEE 802.11;Indoor location
systems;Localization algorithms;Localization systems;Location fingerprint-
ing;Multilayer perceptron;Nearest neighbors;Network learnings;Nonlinear rela-
tionships;Received signal strengths;Redundant informations;Test beds;Wireless
lans;.
[41] Mark Fiala. Artag, a fiducial marker system using digital techniques. In CVPR ’05:
Proceedings of the 2005 IEEE Computer Society Conference on Computer Vision
and Pattern Recognition (CVPR’05) - Volume 2, pages 590–596, Washington, DC,
USA, 2005. IEEE Computer Society.
[42] Nigel Foreman, Danae Stanton-Fraser, Paul N. Wilson, Hester Duffy, and Richard
Parnell. Transfer of spatial knowledge to a two-level shopping mall in older people,
following virtual exploration. Environment and Behavior, 37(2):275–292, April
2005.
[43] F. Forno, G. Malnati, and G. Portelli. Design and implementation of a bluetooth
ad hoc network for indoor positioning. IEE Proceedings: Software, v 152, n 5,
October, 2005, Microsoft Research Embedded Systems, p 223-228, 2007.
[44] E Foxlin and L Naimark. Vis-tracker: a wearable vision-inertial self-tracker. In
IEEE Virtual Reality Proceedings, 2003, pages 199–206, 2003.
Bibliography 148
[45] Eric Foxlin. Pedestrian tracking with shoe-mounted inertial sensors. IEEE Com-
puter Graphics and Applications, 25(6):38–46, November 2005.
[46] Emanuele Frontoni and Primo Zingaretti. An efficient similarity metric for omni-
directional vision sensors. Robotics and Autonomous Systems, v 54, n 9, Sep 30,
2006, p 750-757, 2006.
[47] Y Fukuju, M Minami, H Morikawa, and et al. Dolphin: An autonomous indoor
positioning system in ubiquitous computing environment. In IEEE Workshop on
Software Technologies for Future Embedded Systems (WSTFES 2003), proceedings,
pages 53–56, Hakodate, Japan, May 2003.
[48] Chunwang Gao, Zhen Yu, Yawen Wei, Steve Russell, and Yong Guan. A
statistical indoor localization method for supporting location-based access
control. Mobile Networks and Applications, 14(2):253 – 263, 2009. Confi-
dence intervals;Estimation errors;Indoor environments;Locally weighted regres-
sions;Location awareness;Location-based access control;Maximum-likelihood
estimations;Measured signals;Off-line trainings;On-line estimations;Scatter
plots;Signal strengths;Statistical indoor localization;Wireless signal strength;.
[49] Camillo Gentile, A. Judson Braga, and Alfred Kik. A comprehensive evaluation of
joint range and angle estimation in indoor ultrawideband location systems. Eurasip
Journal on Wireless Communications and Networking, 2008, 2008. Angle esti-
mations;Angular resolutions;Bearing capabilities;Bearing systems;Center frequen-
cies;Channel sounders;Comprehensive evaluations;First arrivals;Higher frequen-
cies;Line of sights;Location systems;Multi paths;Non line of sights;Physical lim-
its;Range errors;Ranging systems;Spatial temporals;Time resolutions;Transmitter
and receivers;Uwb systems;Vector network analyzers;Virtual antenna arrays;Wall
materials;.
Bibliography 149
[50] Michael George and Salah Sukkarieh. Inertial navigation aided by monocular cam-
era observations of unknown features. In 2007 IEEE International Conference on
Robotics and Automation, pages 3558–3564, Rome, Italy, April 2007.
[51] Michael G Giebner. Tightly-coupled image-aided inertial navigation system via a
kalman filter. Masters Thesis, March 2003.
[52] C. Giovannangeli, P. Gaussier, and J.P. Banquet. Robustness of visual place cells
in dynamic indoor and outdoor environment. International Journal of Advanced
Robotic Systems, v 3, n 2, June, 2006, p 115-124, 2006.
[53] BF Goldiez, AM Ahmad, and PA Hancock. Effects of augmented reality display
settings on human wayfinding performance. IEEE Transactions on Systems, Man
and Cybernetics - Part C: Applications and Reviews, 37(5):839–845, 2007.
[54] Kelly K. Greene, Jacobus Donders, and Timothy Thoits. Topographical heading
disorientation: a case study. Appl Neuropsychol, 13(4):269–74, 2006.
[55] M. Grigoras, O. Feiermann, and U.D. Hanebeck. Data-driven modeling of signal
strength distributions for localization in cellular radio networks. Automatisierung-
stechnik, v 53, n 7, July 2005, 314-21, 2005.
[56] D. Grossi, A. Fasanaro, R. Cecere, S. Salzano, and L. Trojano. Progressive topo-
graphical disorientation: a case of focal alzheimer’s disease. Neurological Sciences,
28(2):107–110, April 2007.
[57] Andy Harter, Andy Hopper, Pete Steggles, Andy Ward, and Paul Webster. The
anatomy of a context-aware application. In Mobile Computing and Networking,
pages 59–68, 1999.
Bibliography 150
[58] Mike Hazas and Andy Hopper. Broadband ultrasonic location systems for im-
proved indoor positioning. IEEE Transactions on Mobile Computing, v 5, n 5,
September/October, 2006, p 536-547, 2006.
[59] C. L. Hedrick. RFC 1058: Routing information protocol. RFC 1058 (Standard),
June 1988.
[60] Mohammad Heidari and Kaveh Pahlavan. Identification of the absence of direct
path in toa-based indoor localization systems. International Journal of Wireless
Information Networks, 15(3-4):117 – 127, 2008. Angle of arrivals;Detected Direct
paths;Direct paths;Do-mains;High precisions;Hypothesis testing;Indoor position-
ing;Indoor positioning systems;Localization errors;Multipath components;NLoS
identification and mitigation;On times;Ranging measurements;Received sig-
nal strengths;Receiver locations;ToA-based indoor localization;Undetected direct
paths;UWB communication;Wide bands;.
[61] J Hightower and G Borriello. Particle filters for location estimation in ubiquitous
computing: A case study. In Lecture notes in computer science; 6th International
Conference on Ubiquitous Computing (UBICOMP), volume 3205, pages 88–106,
Nottingham, England, September 2004.
[62] Jeffrey Hightower and Gaetano Borriello. Location systems for ubiquitous comput-
ing. IEEE Computer, 34(8):57–66, August 2001.
[63] Tao Hu, G. Lachapelle, and R. Klukas. Controlled gps signal simulation for indoors.
Journal of Navigation, v 60, n 2, May 2007, 265-80, 2007.
[64] Junichi Ido, Yoshinao Shimizu, Yoshio Matsumoto, and Tsukasa Ogasawara.
Indoor navigation for a humanoid robot using a view sequence. Interna-
tional Journal of Robotics Research, 28(2):315 – 325, 2009. Human envi-
ronments;Humanoid;Humanoid robots;Image blurs;Indoor navigations;Localization

Bibliography 151
and navigations;Motion capture systems;Navigation functions;Quantitative ef-
fects;View sequence;View-based approaches;.
[65] IEC. Safety of laser products - part 1: Equipment classification and requirements.
Technical Information Report 2nd edition, International Electrotechnical Commis-
sion, 2007.
[66] Arc Second Inc. Constellation-3d indoor gps technology for metrology. In White
paper 071502, page 111, 2002.
[67] Yiming Ji, Saad Biaz, Santosh Pandey, and Prathima Agrawal. Ariadne: a dy-
namic indoor signal map construction and localization system. In MobiSys ’06:
Proceedings of the 4th international conference on Mobile systems, applications
and services, pages 151–164, New York, NY, USA, 2006. ACM.
[68] Songmin Jia, Jinbuo Sheng, Erzhe Shang, and Kunikatsu Takase. Robot local-
ization in indoor environments using radio frequency identification technology and
stereo vision. Advanced Robotics, 22(2-3):279 – 297, 2008. Localization;Obstacle
detection;Stereo camera;.
[69] Wei-Wen Kao and Chin-Lang Tsai. Carrier phase indoor positioning using pseudo-
lites and relative movements. Journal of the Chinese Institute of Engineers, Trans-
actions of the Chinese Institute of Engineers,Series A/Chung-kuo Kung Ch’eng
Hsuch K’an, v 28, n 5, September, 2005, p 899-903, 2005.
[70] E. Karner, C. Jenner, E. Donnemiller, M. Delazer, and T. Benke. Posterior cortical
atrophy the clinical syndrome. Nervenarzt, 77(2):208–214, 2006.
[71] H. Kato and M. Billinghurst. Marker tracking and hmd calibration for a video-
based augmented reality conferencing system. In Proceedings of the 2nd IEEE
and ACM International Workshop on Augmented Reality ’99, pages 85–94, San
Francisco, CA, October 1999.
Bibliography 152
[72] Hirokazu Kato and Mark Billinghurst. Marker tracking and hmd calibration for
a video-based augmented reality conferencing system. In Proceedings of the 2nd
International Workshop on Augmented Reality (IWAR 99), pages 85–94, San Fran-
cisco, CA, USA, October 1999.
[73] Hirokazu Kato and Mark Billinghurst. Marker tracking and hmd calibration for
a video-based augmented reality conferencing system. In IWAR ’99: Proceedings
of the 2nd IEEE and ACM International Workshop on Augmented Reality, pages
85–94, Washington, DC, USA, 1999. IEEE Computer Society.
[74] Changdon Kee, Doohee Yun, and Haeyoung Jun. Precise calibration method of
pseudolite positions in indoor navigation systems. Computers and Mathematics
with Applications, v 46, n 10, November/December, 2003, p 1711-1724, 2003.
[75] M. Kelly-Hayes, J. T. Robertson, J. P. Broderick, P. W. Duncan, L. A. Hershey,
E. J. Roth, W. H. Thies, and C. A. Trombly. The american heart association stroke
outcome classification. Stroke, 29:1274–1280, June 1998.
[76] JongBae Kim and HeeSung Jun. Vision-based location positioning us-
ing augmented reality for indoor navigation. IEEE Transactions on Con-
sumer Electronics, 54(3):954 – 962, 2008. Accurate;Augmented realities;Bus
services;Consumer applications;Display locations;Efficient;Guide systems;Image
databases;Image sequence matching;Image sequences;Indoor environments;Indoor
navigation;Indoor navigations;Location informations;Location model;Location
models;Location positioning;Location recognitions;Plate systems;Prior knowl-
edges;Shopping assistances;Vision-based;.
[77] N. L. Kirsch, M. Shenton, E. Spirl, J. Rowan, R. Simpson, D. Schreckenghost,
and E. F. Lopresti. Web-based assistive technology interventions for cognitive
Bibliography 153
impairments after traumatic brain injury: A selective review and two case studies.
Rehabilitation Psychology, 49(3):200–212, August 2004.
[78] Roberta L. Klatzky. Allocentric and egocentric spatial representations: Defini-
tions, distinctions, and interconnections. In Spatial Cognition, An Interdisciplinary
Approach to Representing and Processing Spatial Knowledge, pages 1–18, London,
UK, 1998. Springer-Verlag.
[79] C. Krause, H. Schmitz, and M. Kuipers. Predicting the availability of (a)gps in
indoor places by simulations. ITG-Fachbericht, n 194, 2006, 109-13, 2006.
[80] Christian Kray and Christian Elting. Presenting route instructions on mobile de-
vices. pages 117–124. ACM Press, 2003.
[81] O. Krejcar and J. Cernohorsky. Wifi user localization for intelligent crisis man-
agement predictive data push technology framework. WSEAS Transactions on
Environment and Development, v 1, n 2, Nov. 2005, 319-25, 2005.
[82] Masakatsu Kurogi and Takeshi Kurata. Personal positioning based on walking
locomotion analysis with self-contained sensors and a wearable camera. In The
Second IEEE and ACM International Symposium on Mixed and Augmented Reality,
2003. Proceedings, pages 103–112, October 2003.
[83] Azadeh Kushki, Konstantinos N. Plataniotis, and Anastasios N. Venetsanopoulos.
Kernel-based positioning in wireless local area networks. IEEE Transactions on
Mobile Computing, v 6, n 6, June, 2007, p 689-705, 2007.
[84] Andrew M. Ladd, Kostas E. Bekris, Algis P. Rudys, Dan S. Wallach, and Lydia E.
Kavraki. On the feasibility of using wireless ethernet for indoor localization. IEEE
Transactions on Robotics and Automation, v 20, n 3, June, 2004, p 555-559, 2004.
Bibliography 154
[85] J Lee. A spatial access oriented implementation of a topological data model for 3D
urban entities. GeoInformatica, 8(3):235–262, 2004.
[86] Suk Lee, Kyoung Nam Ha, and Kyung Chang Lee. A pyroelectric infrared sensor-
based indoor location-aware system for the smart home. IEEE Transactions on
Consumer Electronics, v 52, n 4, November, 2006, p 1311-1317, 2006.
[87] M.Ni Lionel, Yunhao Liu, Yiu Cho Lau, and Abhishek P. Patil. Landmarc: Indoor
location sensing using active rfid. Wireless Networks, v 10, n 6, November, 2004,
p 701-710, 2004.
[88] Alan L. Liu, Harlan Hile, Henry A. Kautz, Gaetano Borriello, Pat A. Brown, Mark
Harniss, and Kurt Johnson. Indoor wayfinding: : developing a functional interface
for individuals with cognitive impairments. In ASSETS, pages 95–102, 2006.
[89] Jack M. Loomis, James J. Blascovich, and Andrew C. Beall. Immersive virtual
environment technology as a basic research tool in psychology. Behavior Research
Methods, ln.strummt.s, & Computers, 31(4):557–564, 1999.
[90] E. F. LoPresti, Alex Mihailidis, and N. Kirsch. Assistive technology for cognitive
rehabilitation: State of the art. Neuropsychological Rehabilitation, 14(1/2):5–39,
2004.
[91] S. Luzzi, E. Pucci, P. Di Bella, and M. Piccirilli. Topographical disorientation
consequent to amnesia of spatial location in a patient with right parahippocampal
damage. Cortex, 36(3):427–434, 2000.
[92] E.A. Maguire, T. Burke, J. Phillips, and H. Staunton. Topographical disorien-
tation following unilateral temporal lobe lesions in humans. Neuropsychologica,
34(10):993–1991, 1996.
Bibliography 155
[93] G. Malkin. RFC 2453: RIP version 2. RFC 2453 (Standard), November 1998. See
also STD0056. Obsoletes RFC1388, RFC1723.
[94] S Mann and W Barfield. Introduction to mediated reality. International Journal
of Human-Computer Interaction, 15:205–208, 2003.
[95] Steve Mann. Mediated reality. Linux J., 59es:5, 1999.
[96] Steve Mann. When both camera and display are headworn: Personal imaging
and mediated reality. In Simon Haykin, editor, Intelligent Image Processing, pages
38–58. Willey Interscience, 2002.
[97] Ruth E Mayagoitia, Anand V Neneb, and Peter H Veltinkc. Accelerometer and
rate gyroscope measurement of kinematics: an inexpensive alternative to optical
motion analysis systems. Journal of Biomechanics, 35:537–542, 2002.
[98] M. Mazzoni, E. Del Torto, M. Vista, and P. Moretti. Transient topographical
amnesia: a case report. Ital J Neurol Sci, 14(9):633–6, Dec 1993.
[99] Scott D. Moffat, Wendy Elkins, and Susan M. Resnick. Age differences in the
neural systems supporting human allocentric spatial navigation. Neurobiol Aging,
June 2005.
[100] S.D. Moffat, W. Elkins, and S.M. Resnick. Age differences in the neural systems
supporting human allocentric spatial navigation. Neurobiology of Aging, 27(7):965–
972, 2006.
[101] F Morganti and G Riva. Ambient intelligence for rehabilitation. In G Riva, F Vata-
laro, F Davide, and M Alcaniz, editors, Ambient Intelligence, pages 283–295. IOS
Press, 2005.
[102] J. Moy. RFC 1131 - OSPF specification. RFC 1131 (Proposed Standard), October
1989.
Bibliography 156
[103] J. Moy. RFC 2328 - OSPF Version 2. RFC 2328 (Standard), May 1998.
[104] SC Mueller, CPT Jackson, and RW Skelton. Sex differences in a virtual water maze:
an eye tracking and pupillometry study. Behavioural Brain Research, 193(2):209–
215, 2008.
[105] Rafael Munoz-Salinas, R. Medina-Carnicer, F.J. Madrid-Cuevas, and A. Carmona-
Poyato. Multi-camera people tracking using evidential filters. International Jour-
nal of Approximate Reasoning, 50(5):732 – 749, 2009. Dempster-Shafer;Multiple-
views;Particle filters;People tracking;Transferable belief model;.
[106] Min-Young Nam, Mhd Zaher Al-Sabbagh, Jung-Eun Kim, Man-Ki Yoon, Chang-
Gun Lee, and Eun Yong Ha. A real-time ubiquitous system for assisted living:
Combined scheduling of sensing and communication for real-time tracking. IEEE
Transactions on Computers, 57(6):795 – 808, 2008. Prototype system;Real-time
tracking;Real-time ubiquitous system;.
[107] T. Nyfefeler, K. Gutbrod, T. Pflugshaupt, R. Von Wartburg, C.W. Hess, and R.M.
Muri. Allocentric and egocentric spatial impairments in a case of topographical
disorientation. 41(2):133–1453, 2005.
[108] Robert J. Orr and Gregory D. Abowd. The smart floor: a mechanism for natural
user identification and tracking. In CHI ’00: CHI ’00 extended abstracts on Human
factors in computing systems, pages 275–276, New York, NY, USA, 2000. ACM.
[109] Charles B. Owen, Fan Xiao, and Paul Middlin. What is the best fiducial? In
The First IEEE International Augmented Reality Toolkit Workshop, pages 98–105,
Darmstadt, Germany, September 2002.
[110] K. Pahlavan, Xinrong Li, and J. P. Makela. Indoor geolocation science and tech-
nology. Communications Magazine, IEEE, 40(2):112–118, 2002.
Bibliography 157
[111] M.C. Pai and W.J. Jacobs. Topographical orientation in community-residing
patients with alzheimers disease. International Journal of Geriatric Psychiatry,
19(3):250–255, 2004.
[112] L Palermo, G Iaria, and C Guariglia. Mental imagery skills and topographical
orientation in humans: a correlation study. Behavioural Brain Research, 192:248–
253, 2008.
[113] R Palisano, P Rosenbaum, S Walter, D Russell, E Wood, and B Galuppi. Devel-
opment and reliability of a system to classify gross motor function in children with
cerebral palsy. Developmental Medicine and Child Neurology, 39(4):214–223, 1997.
[114] Jeffrey Junfeng Pan, James T. Kwok, Qiang Yang, and Yiqiang Chen. Multidimen-
sional vector regression for accurate and low-cost location estimation in pervasive
computing. IEEE Transactions on Knowledge and Data Engineering, v 18, n 9,
September, 2006, p 1181-1193, 2006.
[115] A Parush, S Ahuvia, and I Erev. Degradation of spatial knowledge acquisition
when using automatic navigation systems. In Winter S, Duckham M, Kulik L,
and Kuipers B, editors, Proceedings of the 8th International Conference on Spatial
Information Theory, pages 238–254, 2007.
[116] Avi Parush and Dafna Berman. Navigation and orientation in 3d user inter-
faces: the impact of navigation aids and landmarks. Int. J. Hum.-Comput. Stud.,
61(3):375–395, 2004.
[117] Avi Parush and Dafna Berman. Navigation and orientation in 3d user inter-
faces: the impact of navigation aids and landmarks. Int. J. Hum.-Comput. Stud.,
61(3):375–395, 2004.
[118] R. Passmore and J . V. G. A. Durnin. Human energy expenditure. Physiol. Rev.,
35(4):801–840, 1955.
Bibliography 158
[119] P. Patel and J. Holtzman. Analysis of a simple successive interference cancellation
scheme ina ds/cdma system. In Selected Areas in Communications, volume 12,
pages 796 – 807, June 1994.
[120] Nikos Petrellis, Nikos Konofaos, and George P. Alexiou. Using future position
restriction rules for stabilizing the results of a noise-sensitive indoor localization
system. Optical Engineering, 46(6), 2007. Estimation error reduction;Indoor navi-
gation system;Infrared sensors;Noise-sensitive indoor localization system;.
[121] Nikos Petrellis, Nikos Konofaos, and George Ph. Alexiou. Target localization uti-
lizing the success rate in infrared pattern recognition. IEEE Sensors Journal, v 6,
n 5, October, 2006, p 1355-1364, 2006.
[122] Myllymaki Petri, Tirri Henry, Kontkanen Petri, Lahtinen Jussi, Silander Tomi,
Roos Teemu, Tuominen Antti, Valtonen Kimmo, and Wettig Hannes. Location
estimation in wireless telecommunication networks, 2007.
[123] V.A. Petrushin, Gang Wei, and A.V. Gershman. Multiple-camera people localiza-
tion in an indoor environment. Knowledge and Information Systems, v 10, n 2,
Aug. 2006, 229-41, 2006.
[124] Matthai Philipose, Joshua R. Smith, Bing Jiang, Alexander Mamishev, Sumit Roy,
and Kishore Sundara-Rajan. Battery-free wireless identification and sensing. IEEE
Pervasive Computing, v 4, n 1, January/March, 2005, p 37-45, 2005.
[125] Hugh C. Pinnington, Patricia Wong, Janice Tay, Danny Green, and Brian Dawson.
The level of accuracy and agreement in measures of feo2, feco2 and ve between
the cosmed k4b2 portable, respiratory gas analysis system and a metabolic cart.
Journal of Science and Medicine in Sport, 4(3):324–335, September 2001.
[126] Martha E. Pollack, Laura Brown, Dirk Colbry, Cheryl Orosz, Bart Peintner, Sailesh
Ramakrishan, Sandra Engberg, Judith T. Matthews, Jacqueline Dunbar-Jacob,
Bibliography 159
Colleen E. Mccarthy, Sebastian Thrun, Michael Montemerlo, Joelle Pineau, and
Nicholas Roy. Pearl: A mobile robotic assistant for the elderly. In AAAI Workshop
”Automation as Caregiver”, July 2001.
[127] Nissanka Bodhi Priyantha, Anit Chakraborty, and Hari Balakrishnan. The cricket
location-support system. In 6th ACM MOBICOM, Boston, MA, August 2000.
[128] Ilir F. Progri, William R. Michalson, and David Cyganski. An ofdm/fdma indoor
geolocation system. Navigation, Journal of the Institute of Navigation, v 51, n 2,
Summer, 2004, p 133-142, 2004.
[129] Matthew Rabinowitz and James J. Spilker Jr. Augmenting gps with television
signals for reliable indoor positioning. Navigation, Journal of the Institute of Nav-
igation, v 51, n 4, Winter, 2004, p 269-282, 2004.
[130] Matthew Rabinowitz and James J. Spilker Jr. A new positioning system using
television synchronization signals. IEEE Transactions on Broadcasting, v 51, n 1,
March, 2005, p 51-61, 2005.
[131] Jyri Rajamaki, Petri Viinikainen, Julius Tuomisto, Thomas Sederholm, and Mi-
ika Saamanen. Laureapop personalized indoor navigation service for specific user
groups in a wlan environment. WSEAS Transactions on Communications, v 6, n
4, April, 2007, p 524-531, 2007.
[132] Shobha Sundar Ram, Yang Li, Adrian Lin, and Hao Ling. Doppler-based detection
and tracking of humans in indoor environments. Journal of the Franklin Institute,
345(6):679 – 699, 2008.
[133] J Raper, G Gartner, H Karimi, and C Rizos. A critical evaluation of location based
services and their potential. Journal of Location Based Services, 1(1):5–45, 2007.
Bibliography 160
[134] K Rehman, F Stajano, and G Coulouris. Visually interactive location-aware com-
puting. In UbiComp 2005, 2005.
[135] G. Reitmayr and D. Schmalstieg. Location based applications for mobile augmented
reality. In 4th Australasian User Interface Conference, 2003.
[136] G Reitmayr and D Schmalstieg. Location based applications for mobile augmented
reality. In Proceedings of the 4th Australasian User Interface Conference, 2003.
[137] Y. Rekhter and T. Li. RFC 1771: A Border Gateway Protocol 4 (BGP-4). RFC
1771 (Draft Standard), March 1995. Obsoletes RFC1654.
[138] G. Retscher. Test and integration of location sensors for a multi-sensor personal
navigator. Journal of Navigation, v 60, n 1, Jan. 2007, 107-17, 2007.
[139] Lionel Reyero and Gilles Delisle. A pervasive indoor-outdoor
positioning system. Journal of Networks, 3(8):70 – 83, 2008.
GPS;GSM;Positioning;Ubiquitous;WLAN;.
[140] Andrew Rice and Robert Harle. Evaluating lateration-based positioning algorithms
for fine-grained tracking. Proceedings of the 2005 Joint Workshop on Foundations
of Mobile Computing, DIALM-POMC’05, 2005, p 54-61, 2005.
[141] T. H. Riehle, P. Lichter, and N. A. Giudice. An indoor navigation system to
support the visually impaired. In Engineering in Medicine and Biology Society,
2008. EMBS 2008. 30th Annual International Conference of the IEEE, pages 4435–
4438, Vancouver, BC, August 2008.
[142] G Riva. Ambient intelligence in health care. Cyberpsychology & Behavior, 6(3):295–
300, 2003.
[143] Ranga Rodrigo, Mehrnaz Zouqi, Zhenhe Chen, and Jagath Samarabandu. Robust
and efficient feature tracking for indoor navigation. IEEE Transactions on Systems,
Bibliography 161
Man, and Cybernetics, Part B: Cybernetics, 39(3):658 – 671, 2009. Distinctive fea-
tures;Feature tracking;Motion refinement;Multihomographies;Nondistinctive fea-
tures;.
[144] S. Roehr, P. Gulden, and M. Vossiek. Precise distance and velocity mea-
surement for real time locating in multipath environments using a frequency-
modulated continuous-wave secondary radar approach. IEEE Transactions on Mi-
crowave Theory and Techniques, 56(10):2329 – 2339, 2008. mobile unit distance
measurement;mobile unit velocity measurement;real-time radio location estima-
tion;indoor multipath propagation environment;frequency-modulated continuous-
wave secondary radar approach;wireless unit;measurement system;Doppler fre-
quency shift evaluation;radar signal;radio navigation;.
[145] F.D. Rose, D.A. Johnson, and E.A. Attree. Rehabilitation of the head-injured
child: basic research and new technology. Pediatr Rehabil, 1(1):3–7, 1977.
[146] Roy A. Ruddle. Generating trails automatically, to aid navigation when you revisit
an environment. Presence: Teleoper. Virtual Environ., 17(6):562–574, 2008.
[147] Roy A. Ruddle and Simon Lessels. Three levels of metric for evaluating wayfinding.
Presence: Teleoper. Virtual Environ., 15(6):637–654, 2006.
[148] Roy A. Ruddle, Stephen J. Payne, and Dylan M. Jones. Navigating large-scale
virtual environments: What differences occur between helmet-mounted and desk-
top displays? Presence: Teleoper. Virtual Environ., 8(2):157–168, 1999.
[149] Roy A. Ruddle and Patrick Peruch. Effects of proprioceptive feedback and envi-
ronmental characteristics on spatial learning in virtual environments. International
Journal of Human-Computer Studies, 60(3):299–326, 2004.
Bibliography 162
[150] K Sagawa, H Inooka, and Y Satoh. Non-restricted measurement of walking dis-
tance. In IEEE International Conference on Systems, Man, and Cybernetics, 2000,
volume 3, pages 1847–1852, 2000.
[151] J Sargent, S Dopkins, J Philbeck, and R Modarres. Spatial memory during pro-
gressive disorientation. Journal of Experimental Psychology - Learning, Memory
and Cognition, 34(3):602–615, 2008.
[152] K. H. Schmitz, M. Treuth, P. Hannan, R. McMurray, K. B. Ring, D. Catellier, and
R. Pate. Predicting energy expenditure from accelerometry counts in adolescent
girls. Medicine and Science in Sports & Exercise, 37(1):155–161, January 2005.
[153] M. O. Schneider and J. L. Garcia Rosa. Neural labyrinth robot - finding the
best way in a connectionist fashion. In Anais do XXIII Congresso da Sociedade
Brasileira de Computacao (SBC 2003), pages 1751–1760, 2003.
[154] Hu Sheng, Lei Jian-jun, Xia Ying, Ge Jun-wei, and Bae Hae-young. Hybrid location
determination technology within urban and indoor environment based on cell-id
and path loss. Journal of Chongqing University of Posts and Telecommunication
(Natural Science Edition), v 16, n 5, Oct. 2004, 46-9, 2004.
[155] A. W. Siegel and S. H. White. The development of spatial representations of large-
scale environments. Advances in Child Development and Behavior, 10:9–55, 1975.
[156] R.W. Skelton, S.P. Ross, L. Nerad, and S.A. Livingstone. Human spatial navigation
deficits after traumatic brain injury shown in the arena maze, a virtual morris water
maze. Brain Injury, 20(2):189–203, 2006.
[157] R.W. Skelton, S.P. Ross, L. Nerad, and S.A. Livingstone. Human spatial navigation
deficits after traumatic brain injury shown in the arena maze, a virtual morris water
maze. Brain Injury, 20(2):189–203, 2006.
Bibliography 163
[158] Shamus P. Smith and Jonathan Hart. Evaluating distributed cognitive resources
for wayfinding in a desktop virtual environment. In VR ’06: Proceedings of the
IEEE conference on Virtual Reality, page 115, Washington, DC, USA, 2006. IEEE
Computer Society.
[159] MM Sohlberg, S Fickas, PF Hung, and A Fortier. A comparison of four prompt
modes for route finding for community travellers with severe cognitive impairments.
Brain Injury, 21(5):531–538, 2007.
[160] H. W. Sorenson. Kalman filtering: Theory and applications. IEEE press, New
York, 1985.
[161] A. Stracciari, S. Lorusso, A. Delli Ponti, K. Mattarozzi, and A. Tempestini. Cog-
nitive functions after transient topographical amnesia. Europ J of Neurology,
9(4):401–405, July 2002.
[162] T. Suzuki, S. Iwasaki, Y. Kobayashi, Y. Sato, and A. Sugimoto. Incorporating
environment models for improving vision-based tracking of people. Systems and
Computers in Japan, v 38, n 2, Feb. 2007, 71-80, 2007.
[163] Nobuyoshi Takahashi and Mitsuru Kawamura. Pure topographical disorientation:
The anatomical basis of landmark agnosia. Cortex, 38(5):717–725, 2002.
[164] Masahiro Takashima, Dapeng Zhao, Kentaro Yanagihara, Kiyoshi Fukui, Shigeru
Fukunaga, Shinsuke Hara, and Ken-Ichi Kitayama. Location estimation using re-
ceived signal power and maximum likelihood estimation in wireless sensor networks.
Electronics and Communications in Japan, Part I: Communications (English trans-
lation of Denshi Tsushin Gakkai Ronbunshi), v 90, n 12, December, 2007, p 62-72,
2007.
Bibliography 164
[165] Golam Shagadul Amin Talukder and Al-Mukaddim Khan Pathan. Qosip: A qos
aware ip routing ptotocol for multimedia data. In 8th International Conference of
Advanced Communication Technology (ICACT 2006), 2006.
[166] S. Teller, Jiawen Chen, and H. Balakrishnan. Pervasive pose-aware applications and
infrastructure. IEEE Computer Graphics and Applications, v 23, n 4, July-Aug.
2003, 14-18, 2003.
[167] R. Tesoriero, J.A. Gallud, M. Lozano, and V.M.R. Penichet. Using active and pas-
sive rfid technology to support indoor location-aware systems. IEEE Transactions
on Consumer Electronics, 54(2):578 – 583, 2008. Location-aware;Location-aware
systems;Mobile technologies;Passive RFID;Smart phones;System environment;.
[168] Jan-Phillip Tiesel and Jorn Loviscach. A mobile low-cost motion capture system
based on accelerometers. In International Symposium on Visual Computing 2006,
pages 437–446, 2006.
[169] David H Titterton and John L Weston. Strapdown Inertial Navigation Technol-
ogy. Institution of Electrical Engineers, American Institute of Aeronautics and
Astronautics, 2nd edition, 2004.
[170] Jorge Torres-Solis and Tom Chau. A flexible routing scheme for patients with
topographical disorientation. Journal of NeuroEngineering and Rehabilitation, 4:1–
11, November 2007.
[171] Jorge Torres-Solis and Tom Chau. Wearable indoor pedestrian dead reckoning
system. Pervasive and Mobile Computing, (Under review, Manuscript number:
PMC-D-09-00006), 2009.
[172] Jorge Torres-Solis, Mei Guan, Elaine Biddiss, and Tom Chau. Mediated reality
tools for navigation in smart environments. Technology and Health Care, Special
Bibliography 165
Issue: Smart environments: technology to support healthcare (Invited)(Special
Issue: Smart environments: technology to support healthcare), 2009.
[173] Ching-Chih Tsai, Hung-Hsing Lin, and Szu-Wei Lai. 3d posture determination
of a wheeled mobile robot by fusing dead-reckoning and ultrasonic measurements.
Journal of the Chinese Institute of Engineers, Transactions of the Chinese Institute
of Engineers,Series A/Chung-kuo Kung Ch’eng Hsuch K’an, v 28, n 6, October,
2005, Automation, p 1005-1011, 2007.
[174] Chih-Hsiung Tseng and Sheng-Tzong Cheng. Location management scheme
with wlan positioning algorithm for integrated wireless networks. Computer
Communications, 31(18):4304 – 4311, 2008. Indoor positioning;Integrated
wireless networks;Location databases;Location informations;Location manage-
ment;Location management methods;Location management schemes;Location-
based services (LBS);Mobile clients;Mobile users;Parameter settings;Performance
evaluations;Positioning algorithm;Positioning algorithms;Rapid growths;Received
signal strength indication (RSSI);Received signal strength indications;Wireless
communications;Wlan positioning;.
[175] Shinji Tsuzuki. High-speed power-line communication and its application to a
localization system. IEICE Transactions on Fundamentals of Electronics, Commu-
nications and Computer Sciences, v E89-A, n 11, November, 2006, p 3006-3012,
2006.
[176] P. Turriziani, G. A. Carlesimo, R. Perri, F. Tomaiuolo, and C. Caltagirone. Loss of
spatial learning in a patient with topographical disorientation in new environments.
J Neurol Neurosurg Psychiatry, 74(1):61–9, Jan 2003.
[177] J. Urena, A. Hernandez, A. Jimenez, J.M. Villadangos, M. Mazo, J.C. Garcia, J.J.
Garcia, F.J. Alvarez, C. De Marziani, M.C. Perez, J.A. Jimenez, A.R. Jimenez,
Bibliography 166
and F. Seco. Advanced sensorial system for an acoustic lps. Microprocessors and
Microsystems, v 31, n 6, Sep 1, 2007, Sensor Systems, p 393-401, 2007.
[178] M. Van Asselen, R. P. Kessels, L. J. Kappelle, S. F. Neggers, C. J. Frijns, and
A. Postma. Neural correlates of human wayfinding in stroke patients. Brain Res,
1067(1):229–238, January 2006.
[179] N. Vaughan, D. Agner, and D.M. Clinchot. Perseveration and wandering as a
predictor variable after brain injury. Brain Injury, 11(11):815–819, 1997.
[180] N. Vaughan, D. Agner, and D.M. Clinchot. Perseveration and wandering as a
predictor variable after brain injury. Brain Injury, 11(11):815–819, 1997.
[181] S. Venkatesh and R.M. Buehrer. Non-line-of-sight identification in ultra-
wideband systems based on received signal statistics. IET Microwaves, Anten-
nas and Propagation, 1(6):1120 – 1130, 2007. Non-line-of-sight (NLOS);Statistical
information;Ultra-wideband (UWB);.
[182] D Waller, Y Lippa, and A Richardson. Isolating observer-based reference direc-
tions in human spatial memory: head, body and self-to-arrya axis. Cognition,
106(1):157–183, 2008.
[183] David Waller, Earl Hunt, and David Knapp. The transfer of spatial knowledge in
virtual environment training. Presence, 7(2):129–143, April 1998.
[184] Xue Wang and Sheng Wang. Collaborative signal processing for target tracking in
distributed wireless sensor networks. Journal of Parallel and Distributed Comput-
ing, v 67, n 5, May, 2007, p 501-515, 2007.
[185] Roy Want, Andy Hopper, Veronica Falcao, and Jon Gibbons. The active badge
location system. Technical Report 92.1, ORL, 24a Trumpington Street, Cambridge
CB2 1QA, 1992.

Bibliography 167
[186] R. Watson, G. Lachapelle, R. Klukas, S. Turunen, S. Pietila, and I. Halivaara.
Investigating gps signals indoors with extreme high-sensitivity detection techniques.
Navigation. Journal of the Institute of Navigation, v 52, n 4, Winter 2005-2006,
199-213, 2006.
[187] Mann WC, Ottenbacher KJ, Fraas L, Tomita M, and Granger CV. Effectiveness of
assistive technology and environmental interventions in maintaining independence
and reducing home care costs for the frail elderly. a randomized controlled trial.
Arch Fam Med, 8(3):210–217, May-Jun 1999.
[188] D Wright. Telemedicine and developing countries. a report of study group 2 of the
itu development sector. J Telemed Telecare, 4(2):1–85, 1998.
[189] D Wright and L Androuchko. Telemedicine and developing countries. J Telemed
Telecare, 2(2):63–70, 1996.
[190] Allen D Wu, Eric N Johnson, and Alison A Proctor. Vision-aided inertial navigation
for flight control. Journal of Aerospace Computing, Information, and Communica-
tion, 2(9):348–360, 2005.
[191] Zhe Xiang, Song Song, Jin Chen, Hao Wang, Jian Huang, and Xingxin Gao. A
wireless lan-based indoor positioning technology. IBM Journal of Research and
Development, v 48, n 5-6, September/November, 2004, p 617-626, 2004.
[192] De Xu and Min Tan. Accurate positioning in real time for mobile robot. Zidonghua
Xuebao/Acta Automatica Sinica, v 29, n 5, September, 2003, p 716-725, 2003.
[193] De Xu, Zhi-Guo Tu, and Min Tan. Study on visual positioning based on homog-
raphy for indoor mobile robot. Zidonghua Xuebao/Acta Automatica Sinica, v 31,
n 3, May, 2005, p 464-469, 2005.

Bibliography 168
[194] Qiang Yang, Sinno Jialin Pan, Vincent Wenchen Zheng, Hisashi Kashima, Shoko
Suzuki, Shohei Hido, Yuta Tsuboi, Toshihiro Takahashi, Tsuyoshi Id, Rikiya Taka-
hashi, Akira Tajima, Yuichi Katori, Yang Qu, Chun Li, Xi-Zhao Wang, Feng Guo,
Xianghui Gao, Zhuo Sun, Juan Qi, Junfa Liu, and Yiqiang Chen. Estimating loca-
tion using wi-fi. IEEE Intelligent Systems, 23(1):8 – 9, 2008. Indoor location;Radio
signal strength;Transfer learning;.
[195] Jaegeol Yim, Chansik Park, Jaehun Joo, and Seunghwan Jeong. Extended kalman
filter for wireless lan based indoor positioning. Decision Support Systems, 45(4):960
– 971, 2008. Bayesian method;Decision tree;Extended Kalman Filter;Fingerprinting
method;Indoor positioning;K-NN;Trilateration;Wireless Local Area Network;.
[196] Wojciech Zajdel and Ben J.A. Krose. A sequential bayesian algorithm for surveil-
lance with nonoverlapping cameras. International Journal of Pattern Recognition
and Artificial Intelligence, v 19, n 8, December, 2005, p 977-996, 2005.
[197] G.V. Zaruba, M. Huber, F.A. Kamangar, and I. Chlamtac. Indoor location tracking
using rssi readings from a single wi-fi access point. Wireless Networks, v 13, n 2,
April, 2007, p 221-235, 2007.
[198] Z. Zhang, C.L. Law, and E. Gunawan. Multipath mitigation technique based on
partial autocorrelation function. Wireless Personal Communications, v 41, n 1,
April, 2007, p 145-154, 2007.
[199] YunFei Zu, MunGyu Choi, and JangMyung Lee. An indoor localization sys-
tem in a multiblock workspace. Artificial Life and Robotics, 13(2):493 – 499,
2009. Autonomous navigations;Fault detection and isolations;Indoor localiza-
tion;Localization schemes;Mobile objects;Multiblock;Position estimations;Precision
analysis;Service robots;Ubiquitous technologies;Ultrasonic attenuations;.