medicaid redesign team supportive housing evaluation ... · sponsored by the new york state...
TRANSCRIPT

Medicaid Redesign Team Supportive Housing Evaluation:
UTILIZATION REPORT 1MAY 2017

MEDICAID REDESIGN TEAM SUPPORTIVE HOUSING EVALUATION:
Utilization Report 1
Sandra McGinnis, PhD; Lauren Polvere, PhDCenter for Human Services Research
School of Social Welfare, University at Albany
Devin Smith; Diane Dewar, PhDInstitute for Health System Evaluation
School of Public Health, University at Albany

Executive Summary ......................................................................................................................... 4Background ................................................................................................................................ 5Key Findings ............................................................................................................................... 5
Introduction ..................................................................................................................................... 6
Methodology .................................................................................................................................... 8
The Medicaid Redesign Team Supportive Housing (MRT-SH) population in New York State ...... 10Demographic Characteristics ..................................................................................................... 11Clinical Characteristics ............................................................................................................... 13Health Care Utilization ................................................................................................................ 15
Program Specific Analyses ............................................................................................................ 18AIDS Institute – Services Only .................................................................................................... 19AIDS Institute – Services + Subsidy ........................................................................................... 23East 99th Street ......................................................................................................................... 27Health Homes Supportive Housing Pilot ...................................................................................... 30OASAS Rental Subsidies............................................................................................................. 34Office of Mental Health Rental Subsidies – Brooklyn................................................................... 38Office of Mental Health Rental Subsidies – Statewide ................................................................. 42OPWDD Expansion Program ....................................................................................................... 46Eviction Prevention for Vulnerable Adults .................................................................................... 47Homeless Housing and Assistance Program (HHAP).................................................................... 50OTDA Homeless Senior and Disabled Placement Pilot (New York City) ........................................ 51
Analyses by Diagnostic Groups ..................................................................................................... 52SMI Population ........................................................................................................................... 53SUD Population .......................................................................................................................... 58HIV Population ............................................................................................................................ 63Chronic Conditions Population .................................................................................................... 66
Summary and Conclusions ............................................................................................................ 70
Measurement of Key Constructs .................................................................................................... 72
References ...................................................................................................................................... 74
TABLE OF CONTENTS

MEDICAID REDESIGN TEAM SUPPORTIVE HOUSING EVALUATION:Utilization Report 1
EXECUTIVE SUMMARY
MEDICAID REDESIGN TEAM SUPPORTIVE HOUSING EVALUATION:
Utilization Report 1

Background• The current study examines clinical and Medicaid health service utilization outcomes for enrollees in the Medicaid Redesign Team
Supportive Housing programs. Specifically, this report documents the Medicaid health service utilization incurred by supportive housing participants over the 12 months prior to their enrollment (the pre-period) and the 12 months after enrollment (the post-period). The analysis measures utilization changes pre- and post-supportive housing enrollment in the context of inpatient care and emergency department visits, including those for mental health and substance abuse, as well as changes in outpatient mental health and substance abuse services. Participant demographic and clinical characteristics are also analyzed. Utilization characteristics are analyzed for the MRT-SH programs overall, as well as by program. Further analyses are provided for the key diagnostic groups served by the MRT-SH programs, which include individuals with Serious Mental Illness (SMI), Substance Use Disorders (SUD), HIV, and chronic conditions. An accompanying report covers Medicaid spending, program descriptions, and eligibility requirements.
• The analysis includes clients who were enrolled in supportive housing for at least one year before January 1, 2016, who had consistent Medicaid coverage during the year before and after their supportive housing start date. A few included programs use a six- or nine-month pre/post-period as needed. Nonparametric tests of statistical significance are typically used throughout the report, including the McNemar test for pre/post differences in binary variables and the Wilcoxon test for pre/post differences in continuous variables. Ordinary least-squares regression analysis is also used to model pre-post differences in inpatient admissions, inpatient days, and emergency department visits. These models demonstrate which client characteristics are associated with greater or lesser pre-post changes in utilization of these high-cost services.
Key Findings• The average age of Medicaid Redesign Team Supportive
Housing (MRT-SH) service recipients is 47.1. Across the MRT-SH programs, men slightly outnumber women (55% to 45%), though differences are seen across the programs. The population served by the MRT-SH programs is racially and ethnically diverse (23% Hispanic/Latino, 42% non-Hispanic black, 30% non-Hispanic white, and 5% Asian/Pacific Islanders, American Indian/Alaska Natives, others, or unknown).
• The MRT-SH programs are serving a seriously ill population who experience high rates of comorbidities. Sixty-six percent have an active diagnosis of a Serious Mental Illness (SMI), 46% have a Substance Use Disorder (SUD), 40% are HIV+, and 53% have one or more other chronic conditions, not including HIV. In terms of chronic conditions, hypertension and diabetes are the most commonly experienced illnesses. A significant number of participants have asthma, coronary heart disease, osteoarthritis, or COPD.
• MRT-SH participants had high rates of inpatient and emergency department utilization in the pre-period, prior to enrollment in supportive housing. Across the various programs, 44% percent had at least one inpatient admission and 60% had at least one emergency department visit in the pre-period. The mean number of inpatient days was 10.1, and the mean number of emergency department visits was 3.1. More than 7% of MRT-SH participants had spent time in inpatient substance abuse rehabilitation centers.
• Post-enrollment in supportive housing, participants across the MRT-SH programs used virtually all of the measured services significantly less. The findings show statistically significant decreases in inpatient care, inpatient mental health services, inpatient substance abuse services, average inpatient days, emergency department visits (including those for mental health and substance abuse), psychiatric inpatient stays, and inpatient rehabilitation services.
• The extent of changes in service utilization from the pre-period to the post-period differed across the programs.
OASAS Rental Subsidies, OMH Rental Subsidies Statewide, the AIDS Institute “services only” program, and OTDA Homeless Housing Assistance Program showed particular promise in terms of reducing inpatient days and/or emergency department visits.
• The OASAS Rental Subsidies program and the OMH Rental Subsidies Statewide program showed especially strong findings in the current study, with statistically significant decreases in inpatient stays, emergency department visits, and other high cost services.
• In the context of diagnostic groups (individuals with an SMI, SUD, HIV, or other chronic condition), statistically significant reductions in inpatient days and emergency department visits were found for all groups in the post-period.
• Individuals with an SUD experienced the largest average net reductions in inpatient days and emergency department visits, which suggests that this diagnostic group is especially benefitting from supportive housing.
• Across the MRT-SH programs overall, use of outpatient behavioral health services decreased in the post-period. This result was unexpected, as previous supportive housing research finds that once participants are housed, high cost services (e.g. inpatient and emergency department visits) tend to decrease and less expensive, more community-based outpatient services tend to increase.
• The Medicaid service utilization findings to date are encouraging. MRT-SH program participants appear to be benefitting from supportive housing, as evidenced by decreases in the receipt of high-cost Medicaid services. Additional research is needed to better understand which program participants benefit most from supportive housing. Further research should also address the unexpected finding of decreases in the use of outpatient health services among supportive housing participants.
EXECUTIVE SUMMARY
5

MEDICAID REDESIGN TEAM SUPPORTIVE HOUSING EVALUATION:Utilization Report 1
INTRODUCTION
MEDICAID REDESIGN TEAM SUPPORTIVE HOUSING EVALUATION:
Utilization Report 1

Permanent Supportive Housing has been credited with reducing homelessness, particularly among those with complex needs (HUD, 2010; Culhane et al., 2002; Metraux et al., 2003, Stefanic & Tsemberis, 2007). Studies of supportive housing using a Housing First approach show improvements in housing stability (Palepu et al, 2013; Stergiopoulos et al, 2015), reductions in criminal justice involvement (Larim-er et al., 2009; Srebnik 2013), and reductions in substance use (Padgett et al, 2011). Following place-ment in permanent supportive housing, participants spend fewer days homeless and in justice settings (Henwood, Katz, and Gilmer, 2014).
Research indicates an association between housing instability, high utilization of acute hospital services, poor health outcomes, and high costs of care (Wright, 2016). Homeless individuals use emergency departments and require inpatient hospitalization at rates three to four times higher than other citizens (Chambers et al, 2013; Kushel et al., 2002; Kushel et al., 2001). However, rates of primary care use are low among homeless populations (Chambers et al., 2013; Hwang et al., 2001).
Outcomes and Costs Associated with Supportive Housing
Previous studies of supportive housing outcomes and costs have focused on housing stability, health care utilization, shelter use, and incarceration rates. Health care utilization outcomes have been tracked through Medicaid data in most studies, with specific focus on emergency department visits, hospitaliza-tions, hospital days, outpatient behavioral health, and primary care visits (Sadowski et al., 2009; Wright et al., 2016; Metraux et al., 2003; Culhane et al., 2002). Studies have also focused on overall system spending beyond Medicaid, tracking outcomes such as shelter stays, sobering center use, and jail/pris-on incarceration (Srebnik et al., 2013; Goering et al., 2015; Culhane et al., 2002; Metraux et al., 2003).
Emerging research has shown reductions in costs associated with health care utilization among for-merly homeless individuals residing in supportive housing, guided by a Housing First model1 (Metraux et al., 2003; Srebnik et al., 2013; Goering et al., 2015; Sadowski et al., 2009; Wright et al., 2016). Cost savings related to supportive housing are due to reductions in acute or “crisis-centered” services, such as emergency department use and inpatient hospitalization. These reductions offset increases in “community-based” services, such as primary care visits (Goering et al., 2015). Cost reductions are also reflected through reduced use of psychiatric inpatient services and reductions in incarcerations (Goering et al., 2015).
This report offers a preliminary look at some of the clinical outcomes for enrollees in the programs sponsored by the New York State Medicaid Redesign Team’s Supportive Housing initiative (MRT-SH). For those programs which began enrolling participants prior to January 2015, the report offers a first look at health care utilization for their clients over the 12 months prior to and after program enrollment.
1 Housing First models of housing do not require residents to achieve or maintain sobriety
INTRODUCTION
7

MEDICAID REDESIGN TEAM SUPPORTIVE HOUSING EVALUATION:Utilization Report 1
METHODOLOGY
MEDICAID REDESIGN TEAM SUPPORTIVE HOUSING EVALUATION:
Utilization Report 1
This analysis includes all clients who were enrolled in supportive housing for at least one year prior to January 1, 2016 and had consistent Medicaid coverage during the year before and after their supportive housing start2. The following programs began enrolling or placing clients before January 2015, and thus had enrollees that met the above criteria:
• AIDS Institute Rental Subsidies (AIRS)
• AIDS Institute – Services only
• AIDS Institute – Services and Subsidies
• Metro East 99th Street
• Office of Alcohol and Substance Abuse Services - Rental Subsidies and Supports (OASAS-RS)
• Office of Mental Health Rental Subsidies – Brooklyn (RSB)
• Office of Mental Health Rental Subsidies – Statewide (RSS)
• Office for Persons with Developmental Disabilities - Expansion of Existing Rental/Services (OPWDD)
• Office of Temporary and Disability Assistance - Disability Housing Subsidy Program (aka Eviction Prevention for Vulnerable Adults [EPVA])
Additionally, we will examine enrollees in some of the newer projects using either a 6-month (for the Health Homes Supportive Housing Pilot [HHSP] and the Office of Temporary and Disability Assistance Homeless Senior and Disabled Placement Pilot [OTDA Pilot] or 9-month (for the Homeless Housing and Assistance Program [HHAP]) post-period.
Nonparametric tests of statistical significance are typically used throughout the report because of the non-normal distribution of most of the dependent variables– the McNemar test for pre-post differenc-es in binary variables, and the Wilcoxon test for pre-post differences in continuous variables. Ordinary least-squares regression analysis is also used to model pre-post differences in inpatient admissions, inpatient days, and emergency department visits. These models demonstrate which client characteris-tics are associated with greater or lesser pre-post changes in utilization of these high-cost services.
The following section will provide an overview of pre-enrollment and post-enrollment health care use for all of these programs, followed by separate sections looking at each of the programs listed in greater detail.
2 Because of changes to the procedures for billing managed care encounters, data quality for managed care clients was only assured through December 31, 2015; therefore analy-ses were restricted to those who enrolled in supportive housing prior to January 1, 2015. Consistent Medicaid coverage was defined as having gaps in full Medicaid coverage not exceeding sixty consecutive days in either the pre- or the post-enrollment period.
METHODOLOGY
9

MEDICAID REDESIGN TEAM SUPPORTIVE HOUSING EVALUATION:Utilization Report 1
MEDICAID REDESIGN TEAM SUPPORTIVE HOUSING EVALUATION:
Utilization Report 1
THE MEDICAID REDESIGN TEAM SUPPORTIVE HOUSING (MRT-SH) POPULATION IN NEW YORK STATE
Demographic characteristics ......................................................................... 11Clinical Characteristics .................................................................................. 13Health Care Utilization ................................................................................... 15

Sex. Among supportive housing recipients in all programs, men slightly outnumber women (55% versus 45%). This varies by program as shown below, with the AIDS Institute services-only programs and the Office of Temporary and Disability Assistance Homeless Senior and Disabled Place-ment Pilot (OTDA Pilot) most heavily weighted towards men (66%, 70% and 67%, respectively). The Office of Temporary and Disability Assistance Eviction Prevention for Vulnerable Adults (EPVA) program is the only program in which women substantially outnumber men (at 74%).
Race/ethnicity. The population served was racially and ethnically diverse across all programs, with 23% indicating Hispanic or Latino heritage (of any race); 42% non-Hispan-ic black; 30% non-Hispanic white; and the remaining 5% including Asian/Pacific Islanders, American Indian/Alaska Natives, others, or unknown. This varied by program and by geography. The highest percentages of Hispanic recipi-ents were found in the East 99th Street and EPVA programs (39% and 38%, respectively), while the lowest percentages were found in the HHAP and OPWDD programs (2% and 4%, respectively). The highest percentage of non-Hispanic black recipients was in OTDA Pilot (63%), and the fewest in the OPWDD program (20%). Non-Hispanic whites were by far the highest percentage of the population in the OPWDD program (71%), and the lowest percentages in EPVA, OTDA Homeless Senior and Disabled Placement Pilot, and the AIDS Institute “services only” program (5%, 7%, and 8%, respectively).
Age at SH Enrollment. The average age of recipients was 47.1 (median = 49), but this also varied by program. The lowest average age in any program was 36.6 for OPWDD Expan-sion, while the highest average age was 57.4 in East 99th.
Demographic characteristics
THE MEDICAID REDESIGN TEAM SUPPORTIVE HOUSING (MRT-SH) POPULATION IN NEW YORK STATE
Figure 1. Distribution of MRT-SH Enrollees by Sex and Program
Figure 2. Distribution of MRT-SH Enrollees by Race/Ethnicity and Program
100%
75%
50%
25%
0%
100%
75%
50%
25%
0%
Male Female
White Black Hispanic
AIRS
- S
ervi
ces
only
AIRS
- S
ubsi
dies
East
99t
h St
reet
Heal
th H
ome
Pilo
t
OAS
AS RSB
RSS
OPW
DD
EPVA
HHAP
OTDA
Pilo
t
AIRS
- S
ervi
ces
only
AIRS
- S
ubsi
dies
East
99t
h St
reet
Heal
th H
ome
Pilo
t
OAS
AS RSB
RSS
OPW
DD
EPVA
HHAP
OTDA
Pilo
t
Figure 3. Average Age at Enrollment among MRT-SH Enrollees by Program
60
50
40
30
20
10
0
AIRS
- S
ervi
ces
only
AIRS
- S
ubsi
dies
East
99t
h St
reet
Heal
th H
ome
Pilo
t
OAS
AS RSB
RSS
OPW
DD
EPVA
HHAP
OTDA
Pilo
t
Mean Median
179
345
42
32
105
192
19
32
42
67
178
157
21
22
10
20
61
76
126
153
142
50
11

MEDICAID REDESIGN TEAM SUPPORTIVE HOUSING EVALUATION:Utilization Report 1
Relatively few MRT-SH participants were under the age of 30 (10%) or 35 (19%) at the time of their enrollment in MRT-SH. The primary exception is in the OPWDD program, where 59% of participants were under age 35 when they enrolled, and 33% were under age 30.
There was a relatively high percentage of people age 55 and older at enrollment (28%), but relatively few were 65 and older were a much smaller group (5%). The programs with the highest percentages of older adults were the OTDA Pilot (with 77% age 55 and over), and East 99th Street (with 61% ages 55 and older).
3 As noted in the Methodology section, most programs used a 12-month follow-up, but HHAP used a 9-month follow-up and the HHSP and OTDA Homeless Senior and Disabled Placement Pilot programs used a 6-month follow-up.
Geography. While projects are found throughout New York State, certain programs are concentrated primarily in New York City and Long Island. The AIDS Institute services-only programs are exclusively downstate, as well as the East 99th, RSB, EPVA, and OTDA Homeless Senior and Disabled Placement Pilot programs. Overall, 65% of participants are recorded as living in New York City, and another 3% on Long Island.
Deaths. Everyone included in this analysis survived for at least 6-123 months after their supportive housing enrollment (as only those who remained on the Medicaid rolls for that period were selected). It is instructive, however, to look at the number of deaths that occurred after that period among participants in the various programs.
Overall, 6% of the participants have died. The highest mortal-ity rates to date have been among those in the OTDA Home-less Senior and Disabled Placement Pilot at 13%, followed by the AIDS Institute “services only” program and Health Home Supportive Housing Pilot, both at 8%. Relatively few deaths occurred among the OMH and OPWDD populations.
Figure 4. Percent Age <30 and <35 at MRT-SH Enrollment, by Program
Figure 6. Percent of MRT-SH Enrollees Residing in New York City and Long Island, by Program
Figure 5. Percent Age 55+ and Age 65+
60%
50%
40%
30%
20%
10%
0%
100%
90%
80%
70%
60%
50%
40%
30%
20%
10%
0%
80%
60%
40%
20%
0%
AIRS
- S
ervi
ces
only
AIRS
- S
ubsi
dies
East
99t
h St
reet
Heal
th H
ome
Pilo
t
OAS
AS RSB
RSS
OPW
DD
EPVA
HHAP
OTDA
Pilo
t
AIRS
- S
ervi
ces
only
AIRS
- S
ubsi
dies
East
99t
h St
reet
Heal
th H
ome
Pilo
t
OAS
AS RSB
RSS
OPW
DD
EPVA
HHAP
OTDA
Pilo
t
AIRS
- S
ervi
ces
only
AIRS
- S
ubsi
dies
East
99t
h St
reet
Heal
th H
ome
Pilo
t
OAS
AS RSB
RSS
OPW
DD
EPVA
HHAP
OTDA
Pilo
t
Under 30 Under 35
New York City Long Island
55+ 65+
12

Clinical CharacteristicsThe population served by the MRT-SH programs is a seriously ill population, with high rates of comorbidities4. Sixty-six percent had an active diagnosis of a severe mental illness (SMI)5 at the time of enrollment, 46% had an ac-tive substance abuse disorder (SUD)6, and 40% had HIV7. Fifty-three percent had one or more other chronic medical conditions (see Table 2).
Clearly, the prevalence of specific types of conditions varies by the population served by each program. All recipients in the AIDS Institute program should have a diagnosis of HIV, in the OMH programs have a mental health diagnosis, and in the OASAS-RS program have a substance abuse disorder8.
4 It should be noted that the interim report defined diagnostic conditions based on the diagnosis in any position on a claim, at any point during the observed period. The current report uses a more stringent definition of only the primary diagnosis.
5 ICD9 codes 290, 293-302, 306-319
6 ICD9 codes 291-292, 303-305
7 ICD9 code 042
8 There are a handful of enrollees in these diagnostic-specific programs that do not have any Medicaid claims for the appropriate primary diagnosis during the period. This does not mean that they have never been diagnosed with the condition; only that no Medicaid claims were submitted for the condition as the primary diagnosis during this specific time period. For the purposes of this report, they are included in the appropriate diagnostic category for their program, even if no claims were observed.
At the same time, there is a great deal of overlap between populations. Eight percent have a SMI and a SUD and HIV and at least one other chronic medical condition, and 26% have three of these (most commonly SMI, SUD, and a chronic medical condition other than HIV [12%]). Fewer than6% of participants did not have claims associated with any of these diagnoses.
THE MEDICAID REDESIGN TEAM SUPPORTIVE HOUSING (MRT-SH) POPULATION IN NEW YORK STATE
Figure 7. Percent of MRT-SH Enrollees Deceased to Date, by Program
Figure 8. Overlap Between Types of Chronic Conditions among MRT-SH Enrollees
14%
12%
10%
8%
6%
4%
2%
0%
AIRS
- S
ervi
ces
only
AIRS
- S
ubsi
dies
East
99t
h St
reet
Heal
th H
ome
Pilo
t
OASA
S
RSB
RSS
OPW
DD
EPVA
HHAP
OTDA
Pilo
t
8%
5%4%
8%
5%4%
3%2%
4%
7%
13%
Note: These data are not appropriate for cross-program comparisons, as programs have different start dates, and therefore different lengths of time that participants have been at risk of mortality.
Note: Not shown are substance use + chronic medical condition (3%) and severe mental illness + HIV (4%).
Note: To obtain total percentage of participants with a given diagnosis, sum all percentages that fall into the relevant circle (but may not exactly match text due to rounding). Circles are not sized proportionately.
HIV6%
8%5% 5%
4%
12%10%
5%
9%
3%
Severe Mental Illness11%
ChronicConditions
6%
SubstanceAbuse3%
13

MEDICAID REDESIGN TEAM SUPPORTIVE HOUSING EVALUATION:Utilization Report 1
Table 2. Specific Types of Chronic Medical Conditions (Other than HIV) Present in MRT-SH Population
AllAIDS Institute
East 99th
HHSP OASASOMH OTDA
Services only
Services & Subsidy
RSB RSS OPWDD EPVA HHAP Pilot
Hypertension 20% 13% 8% 23% 15% 26% 27% 20% 16% 22% 14% 37%
Diabetes 18% 12% 12% 28% 12% 13% 24% 21% 27% 17% 12% 37%
Asthma 14% 14% 8% 10% 6% 15% 20% 16% 6% 14% 12% 20%
Coronary Heart Disease 11% 8% 14% 10% 13% 14% 15% 8% 0% 12% 5% 27%
Osteoarthritis 10% 11% 9% 10% 6% 10% 9% 12% 2% 8% 12% 17%
Chronic obstructive pulmonary disease 8% 7% 12% 6% 10% 11% 5% 10% 4% 5% 7% 27%
Cerebrovascular Disease 6% 5% 5% 5% 6% 7% 8% 7% 2% 5% 2% 13%
Chronic kidney disease 7% 9% 9% 9% 6% 7% 3% 3% 2% 6% 7% 27%
Congestive heart failure 3% 3% 3% 7% 3% 3% 2% 1% 2% 4% 7% 13%
Cancer 3% 3% 5% 7% 2% 3% 3% 1% 0% 3% 0% 0%
Angina 2% 3% 0% 1% 3% 3% 2% 1% 0% 3% 0% 0%
Acute Myocardial infarction 1% 1% 1% 1% 1% 2% 1% 1% 0% 2% 0% 0%
Table 1. Types and Combinations of Chronic Conditions Present in MRT-SH Population
AllAIDS Institute
East 99th
HHSP OASASOMH OTDA
Services only
Services & Subsidy
RSB RSS OPWDD EPVA HHAP Pilot
All four conditionsMental health + Substance abuse + HIV + Other chronic condition
8% 16% 14% 2% 4% 6% 10% 3% 0% 2% 0% 7%
Three conditionsMental health + Substance abuse + chronic condition (other than HIV)
12% -- -- 2% 12% 36% 15% 20% 4% 5% 0% 7%
HIV + Mental health + Other chronic condition 5% 10% 10% 3% 1% 1% 11% 2% 0% 3% 0% 7%
Mental health + Substance abuse + HIV 5% 12% 19% 0% 5% 4% 3% 1% 0% 1% 2% 0%
HIV + Substance abuse + Other chronic condition 4% 11% 11% 0% 5% 2% -- -- 0% 0% 0% 0%
Two conditionsMental health + Chronic condition 10% -- -- 18% 7% 2% 21% 25% 29% 12% 9% 13%
Mental health + Substance abuse 9% -- -- 2% 19% 24% 9% 16% 2% 3% 16% 0%
Substance abuse + Chronic condition 3% -- -- 1% 2% 11% -- -- 2% 4% 2% 13%
Mental health + HIV 4% 11% 7% 4% 2% -- 7% 2% 0% 1% 0% 3%
HIV + Chronic condition 5% 12% 18% 4% 2% -- -- -- 0% 3% 0% 17%
Substance abuse + HIV 3% 11% 4% 0% 2% 0% -- -- 0% 1% 0% 3%
One conditionOnly Mental health 11% -- -- 14% 17% 2% 25% 24% 26% 17% 12% 0%
Only Chronic condition 6% -- -- 31% 11% 1% --
-- -- 6% 22% 14% 10%
Only HIV 6% 18% 15% 3% 1% -- -- -- 0% 2% 0% 7%
Only Substance abuse 3% -- -- 0% 5% 11% -- -- 2% 3% 7% 0%
None identified in study period* 6% -- -- 18% 7% -- -- -- 29% 22% 16% 13%
*This item does not mean that these recipients have never been diagnosed with any of these; only that none of these appeared as a diagnosis on any claims for services received during the pre-enrollment period
Note: “0%” is used when no clients fell into a particular category, while “–“ is used when a diagnosis-based program would not enroll anyone in that category
The specific other chronic medical conditions measured are shown in the table below. Hypertension and diabetes are the most common of these diagnoses, affecting 20% and 18% of the MRT-SH participants, respectively. Significant num-
bers also had asthma, coronary heart disease, osteoarthritis, or COPD. One in a hundred suffered an acute myocardial infarction (heart attack) during the pre-enrollment period.
14

The MRT-SH participants have high rates of inpatient and emergency department utilization, especially for care related to mental health conditions or substance abuse. In the 12 months prior to MRT-SH enrollment9, 44% had at least one inpatient admission, and more than half (60%) had at least one emergency department visit. These patients averaged, in the year prior to their MRT-SH enrollment, 10.1 inpatient days and 3.1 emergency department visits. More than 7% had spent time in an inpatient substance abuse rehabilita-tion center.
Virtually all of these services, however, were used signifi-cantly less following MRT-SH enrollment, regardless of whether they were measured by any use of the services or by volume of use.
There was, however, some variation by program in the extent of the reduction in service use. Specifically, the AIDS Institute program serving the New York City area (ser-vices only), the OASAS-RS and RSS programs, and HHAP
9 Six months for those in the Health Homes Supportive Housing Pilot or the OTDA Homeless Senior and Disabled Placement Pilot, and 9 months for those in the Homeless Housing and Assistance Program capital projects.
showed particular promise in terms of reducing inpatient days and/or emergency department visits.
Statistically significant reductions in both inpatient days and emergency department visits were obtained for all four major diagnostic groups studied, with persons with substance use disorders experiencing the largest average net reductions (7 inpatient days and 1.5 emergency department visits).
The use of inpatient and emergency department services prior to MRT-SH enrollment varied according to the com-binations of diagnoses these clients had. Generally, com-binations that include a SUD were associated with higher utilization than combinations that did not include a SUD.
Health Care Utilization
THE MEDICAID REDESIGN TEAM SUPPORTIVE HOUSING (MRT-SH) POPULATION IN NEW YORK STATE
Table 3. Inpatient and Emergency Department Utilization, Pre- and Post-Enrollment Pre Post Significance
Inpatient utilization
Any inpatient care 44% 36% ***
Any inpatient mental health (defined by Dx) 12.0% 8.8% ***
Any inpatient substance abuse 18% 12% ***
Average number inpatient days 10.1 6.1 ***
Emergency department utilization
Any ED visits 60% 53% ***
Any ED visits - mental health 11.2% 7.8% ***
Any ED visits - substance abuse 10.2% 7.7% ***
Average number of ED visits 3.1 2.3 ***
Average number of ED visits - mental health 0.22 0.17 ***
Average number of ED visits - substance abuse 0.28 0.16 ***
Specific behavioral health services
Any Comprehensive Psychiatric Emergency Program (CPEP)
3.2% 3.3% n.s.
Any psychiatric inpatient 10.0% 7.3% ***
Inpatient rehab 7.2% 4.0% ***
Inpatient detox 3.5% 2.6% *
Note: Significance testing is done with nonparametric techniques, specifically the Wilcoxon test for count variables and the McNemar test for dichotomous variables.*** p =<0.001, *p>0.01 & =<0.05, n.s. = not significant
Table 4. Inpatient Days and Emergency Visits by Program, Pre- and Post-Enrollment Inpatient Days Emergency Visits
Pre Post Sig. Pre Post Sig.
AIDS Institute
Services only 8.8 6.0 ** 2.5 1.9 **
Services + Subsidy 4.5 6.9 n.s. 4.1 3.8 n.s.
East 99th 3.5 3.3 n.s. 1.0 1.1 n.s.
Health Home Pilot 11.0 6.0 * 2.6 1.7 †
OASAS Rental Subsidies 23.4 12.0 *** 6.1 3.6 ***
OMH Rental - Brooklyn 8.6 5.1 * 2.1 2.0 n.s.
OMH Rental - Statewide 11.8 6.5 *** 4.5 3.1 **
OPWDD 0.5 0.8 n.s. 0.6 0.7 n.s.
OTDA Eviction Prevention 3.4 2.1 n.s. 2.0 1.7 n.s.
Homeless Housing Program 4.1 1.3 * 2.3 1.5 **
OTDA Pilot 2.6 4.0 n.s. 1.3 0.7 †
*** p =<0.001, ** p >0.001 & =< 0.01, *p>0.01 & =<0.05, †p>0.05 & <0.10, n.s. = not significant
Table 5. Inpatient Days and Emergency Visits by Diagnostic Group, Pre- and Post-Enrollment Inpatient Days Emergency Visits
Pre Post Sig. Pre Post Sig.
Severe mental illness 12.0 6.8 *** 3.7 2.6 ***
Substance use disorder 15.8 8.8 *** 4.4 2.9 ***
HIV 8.2 5.9 *** 3.0 2.3 ***
Chronic medical condition 11.7 7.4 *** 4.3 3.1 ***
Note: There is significant overlap between these diagnostic groups; the categories are not mutually exclusive.*** p =<0.001
15

MEDICAID REDESIGN TEAM SUPPORTIVE HOUSING EVALUATION:Utilization Report 1
Among those MRT-SH clients with a known referral source, the highest prevalence of inpatient care during the pre-en-rollment period is among those referred from Article 28/31 hospitals, state psychiatric centers, and behavioral health treatment. This finding is not surprising, as those referred by hospitals or psychiatric centers were likely to have been re-ceiving inpatient services from those institutions. Only those referred by behavioral health treatment had a statistically significant reduction in the likelihood of using inpatient care
10 Behavioral health services in an outpatient setting were defined as those for which the primary diagnosis was a severe mental illness or substance abuse disorder and where the category of service was one of the following: hospital-based outpatient; diagnostic and treatment center; physician services; case management; nurse practitioner; clinical social worker; or clinical psychology.
post-enrollment, but this may have been because of the small numbers for Article 28/31 hospitals and psychiatric centers, as the absolute size of the reductions was substan-tial. Clients referred by Article 28/31 hospitals did, however, experience a significant reduction in inpatient days. Those referred by a homeless shelter or by Health Home care coordination also experienced significant reductions in both the likelihood of at least one inpatient stay and the average number of inpatient days.
Clients referred by homeless shelters and behavioral health treatment are the most likely to have had at least one ED visit during the pre-enrollment period. Both groups experi-enced significant drops in the percentage with an ED visit post-enrollment, as did those referred by self/family.
It was anticipated that the decrease in behavioral health ser-vices received in an inpatient or emergency department set-ting would be partially explained by greater use of behavior-al health services in outpatient settings10, preventing clients
Table 7. Percent with Any Inpatient or Emergency Utilization and Average Inpatient Days, Pre- and Post-, by Referral Source
Any Inpatient Admissions
Any ED VisitsAvg. Inpatient
Days
Pre Post Pre Post Pre Post
Self/Family/Other (n=224) 41% 37% 64% 55%* 7.3 6.1†
Homeless shelter (n=208) 49% 36%** 76% 58%*** 11.0 5.9***
Health home care coordination (n=203)
46% 35%* 63% 59% 7.9 4.5***
Behavioral health treatment (n=93)
72% 57%* 71% 55%* 27.2 13.8***
Prevention/Intervention service (n=24)
58% 42% 67% 67% 11.6 5.9
Article 28/31 hospitals (n=22)
82% 64% 55% 73% 64.1 21.1*
Employer/Educational/ Special service (n=22)
5% 9% 23% 36% 0.2 0.2
State psychiatric centers (n=15)
73% 47% 60% 67% 58.9 31.5
Other (n=81) 48% 37% 58% 49% 12.4 5.6**
Unknown (n=726) 36% 33% 52% 46%** 5.7 4.5*
Missing † (n=429) 44% 37%** 61% 54%* 11.2 6.5***
† Referral source data not updated for corrected sample*** p =<0.001, ** p >0.001 & p=< 0.01, *p>0.01 & =<0.05, †p>0.05 & <0.10
Table 6. Average Pre-Enrollment Inpatient Admissions, Inpatient Days, and ED Visits for Combinations of Comorbidities
Inpatient Admissions
Inpatient DaysED
Visits
All four conditions
SMI + SUD + HIV + Other chronic condition
3.0 14.8 4.9
Three conditions
SMI + SUD + chronic condition (other than HIV)
2.7 20.3 6.8
HIV + SMI + Other chronic condition
1.2 6.2 3.6
SMI + SUD + HIV 1.6 11.1 2.9
HIV + SUD + Other chronic condition
2.5 11.5 3.8
Two conditions
SMI + Chronic condition (other than HIV)
1.1 8.9 3.6
SMI + SUD 3.0 18.2 3.3
SUD + Chronic condition (other than HIV)
4.1 15.0 3.6
SMI + HIV 0.4 3.5 1.6
HIV + Chronic condition 1.0 5.4 3.8
SUD + HIV 1.4 10.1 1.8
One condition
Only SMI 0.4 5.6 1.3
Only Chronic condition 0.6 3.3 1.4
Only HIV 0.2 0.8 0.7
Only SUD 6.0 12.4 3.4
None identified in study period* 0.1 3.2 0.6
*This does not mean that these recipients have never been diagnosed with any of these, only that none of these appeared as a diagnosis on any claims for services received during the study period.
16

from reaching a level of acuity that would require inpatient or emergency care. In fact, overall outpatient behavioral health services also decreased. The decreases were statistically significant for all outpatient mental health and substance abuse services, for therapy and counseling, and for outpa-tient behavioral health not elsewhere classified. This finding, in combination with the lower rates of inpatient and emer-gency utilization, may instead represent stabilization in the condition of behavioral health clients, thus causing them to require fewer services overall.
11 Medication management was defined by the combination of evaluation and management (E&M) codes with a behavioral health diagnosis.
THE MEDICAID REDESIGN TEAM SUPPORTIVE HOUSING (MRT-SH) POPULATION IN NEW YORK STATE
Table 8. Utilization of Outpatient Mental Health and Substance Abuse Services, Overall and Selected Services, Pre- and Post-Enrollment
Pre Post Sig.
Outpatient behavioral health
All outpatient mental health services 12.5 11.3 ***
All outpatient substance abuse services 17.8 13.0 ***
Methadone maintenance 3.6 3.5 n.s.
Therapy and counseling 9.9 8.7 ***
Medication management11 2.3 2.3 n.s.
Other outpatient behavioral health 15.2 10.1 ***
*** p =<0.001, n.s. = not significant
17

MEDICAID REDESIGN TEAM SUPPORTIVE HOUSING EVALUATION:Utilization Report 1
PROGRAM SPECIFIC ANALYSESAIDS Institute – Services Only ........................................................................ 19AIDS Institute – Services + Subsidy ............................................................... 22East 99th Street .............................................................................................. 25Health Homes Supportive Housing pilot ......................................................... 28OASAS Rental Subsidies ................................................................................. 31Office of Mental Health Rental Subsidies – Brooklyn ..................................... 35Office of Mental Health Rental Subsidies – Statewide ................................... 38OPWDD Expansion program ........................................................................... 42Eviction Prevention for Vulnerable Adults ....................................................... 43Homeless Housing and Assistance Program (HHAP) ...................................... 46OTDA Homeless Senior and Disabled Placement Pilot (New York City) .......... 47
MEDICAID REDESIGN TEAM SUPPORTIVE HOUSING EVALUATION:
Utilization Report 1

Persons enrolled in the AIDS Institute services-only pro-grams (n=524) are all HIV positive. Forty-eight percent have a diagnosed severe mental illness (SMI), 50% have an active substance abuse disorder diagnosis, and 48% have anoth-er chronic condition. Sixteen percent have all four types of conditions, while 18% have HIV alone.
Inpatient hospitalizations were high among this group in both the pre- and post-period, with 46% experiencing at least one inpatient hospitalization during the year prior to MRT-SH enrollment and 42% experiencing at least one in-patient hospitalization during the year following enrollment. This difference was not statistically significant. There was, however, a statistically significant decrease in the average number of inpatient days between the pre- and post-periods – from 8.8 to 6.0 (p=0.003).
Enrollees were less likely to have any emergency depart-ment visits (from 56% to 52%, p=0.078), and also had significantly fewer emergency department visits (from 2.5 to 1.9, p=0.002). The percentage of enrollees with any emer-gency department visits for mental health or substance abuse also dropped.
Enrollees in the AIDS Institute “services only” program had more outpatient mental health visits in the 12 months follow-ing their enrollment, as well as more outpatient substance abuse services (although neither difference was statistically significant). In particular, they had more medication manage-ment visits (1.7 versus 1.3, p=0.036).
AIDS Institute – Services Only
PROGRAM SPECIFIC ANALYSES
12%
11%
16%
10%
Substanceabuse11%
Figure 9. Overlap Between Types of Chronic Conditions Among AIDS Institute Services-Only Enrollees
Chronic condition12%HIV+
18%
Mental health11%
Note: To obtain total percentage of participants with a given diagnosis, sum all percentages that fall into the relevant circle (sum may not exactly match text due to rounding). The “18%” that falls below the “HIV+” label refers to the proportion of the participants who have no other diagnosis. Circles are not sized proportionately.
** p >0.001 & =< 0.01, *p>0.01 & =<0.05, †p>0.05 & <0.10, n.s. = not significant
Table 9. Inpatient and Emergency Department Utilization, Pre- and Post-Enrollment Pre Post Sig.
Inpatient utilization
Any inpatient care 46% 42% n.s.
Any inpatient mental health 5.2% 4.4% n.s.
Any inpatient substance abuse 20% 19% n.s.
Average number inpatient days 8.8 6.0 **
Emergency department utilization
Any ED visits 56% 52% †
Any ED visits - mental health 4.2% 2.9% n.s.
Any ED visits - substance abuse 8.8% 6.5% n.s.
Average number of ED visits 2.5 1.9 **
Average number of ED visits - mental health 0.07 0.04 †
Average number of ED visits - substance abuse
0.19 0.12 n.s.
Specific behavioral health services
Any CPEP 2.3% 2.3% n.s.
Any psychiatric inpatient 3.8% 2.3% *
Inpatient rehab 5.0% 4.2% n.s.
Inpatient detox 3.6% 3.1% n.s.
*p>0.01 & =<0.05, †p>0.05 & <0.10, n.s. = not significant
Table 10. Utilization of Outpatient Mental Health and Substance Abuse Services, Overall and Selected Services, Pre- and Post-Enrollment
Pre Post Sig.
Outpatient behavioral health visits
All outpatient mental health services 4.9 5.5 †
All outpatient substance abuse services 13.2 15.6 n.s.
Specific outpatient behavioral health services
Methadone maintenance 6.9 6.8 n.s.
Therapy and counseling 5.5 7.0 n.s.
Medication management 1.3 1.7 *
Other outpatient behavioral health 5.5 5.9 n.s.
19

MEDICAID REDESIGN TEAM SUPPORTIVE HOUSING EVALUATION:Utilization Report 1
Use of inpatient and emergency department visits during the pre-enrollment period for AIDS Institute “services only” clients tended to be predicted primarily by comorbidities (although there was a negative effect of age on inpatient admissions that was not quite statistically significant). Cli-ents with a comorbid substance use disorder had signifi-
cantly more inpatient admissions (about 1.7) and inpatient days (about 9.7) than those without. Similarly, those with a comorbid chronic medical condition had significantly more inpatient admissions and ED visits, as well as more inpatient days (the latter not quite statistically significant).
*** p =<0.001, †p>0.05 & <0.10
Inpatient Admissions Inpatient Days ED Visits
Unstandardized Coefficients
Unstandardized Coefficients
Unstandardized Coefficients
Model B Std. Error Sig. B Std. Error Sig. B Std. Error Sig.
(Constant) -0.263 0.500 2.264 3.289 0.276 1.082
Age at Enrollment (in years, mean-centered for HIV population)
-0.025 0.013 † 0.016 0.089 -0.042 0.029
Race/EthnicityNon-Hispanic white (Ref. category) -- -- -- -- -- --
Non-Hispanic Black (1=yes) -0.029 0.495 -1.103 3.257 0.780 1.071
Hispanic (1=yes) 0.063 0.514 -1.941 3.381 0.380 1.112
Multiracial/Other (1=yes) 0.665 0.835 3.652 5.492 0.500 1.806
SexMale (Ref. category) -- -- -- -- -- --
Female (1=yes) 0.271 0.283 -0.257 1.860 -0.120 0.612
ComorbiditiesSevere mental illness (1=yes) 0.370 0.271 2.292 1.781 -0.126 0.586
Substance use disorder (1=yes) 1.736 0.271 *** 9.741 1.781 *** 0.747 0.586
Other chronic condition (1=yes) 1.451 0.279 *** 3.553 1.832 † 2.799 0.603 ***
Table 11. Predictors of Pre-Enrollment Inpatient Admissions, Inpatient Days, and Emergency Department Visits among AIDS Institute “Services only” Clients
20

PROGRAM SPECIFIC ANALYSES
Male clients had a greater pre-post reduction in inpatient days than female clients (3.3 versus 1.6), while female clients had a greater reduction in the likelihood of any ED visits (11 percentage points versus 2 for men). Generally, only Hispanic clients had statistically significant reductions in inpatient or emergency care, although non-Hispanic black clients had a smaller but significant reduction in ED visits. Multiracial clients or those of other or unknown race experienced in-creases in their inpatient and emergency utilization, but their
number in the program was relatively small (n=19), and none of these increases were statistically significant (although the increase in any inpatient admissions was close to significant).
The largest decreases in inpatient and emergency care were observed among those with a comorbid substance use disorder, although those with comorbid severe mental illness or chronic medical conditions also experienced significant decreases in at least some of these metrics.
*** p =<0.001, ** p >0.001 & p=< 0.01, *p>0.01 & =<0.05, †p>0.05 & <0.10
Table 12. Pre- and Post-Enrollment Utilization of Inpatient and Emergency Care by Client Characteristics
AIDS Institute “services only” Inpt Days ED Visits Any Inpt Any ED
Pre Post Pre Post Pre Post Pre Post
Sex
Male (n=345) 8.8 5.5* 2.5 1.8* 43% 41% 51% 49%
Female (n=179) 8.7 7.1† 2.6 2.1* 50% 45% 67% 56%*
Race/ethnicity
Non-Hispanic white (n=44) 9.3 3.5 1.8 1.9 32% 41% 52% 57%
Non-Hispanic black (n=285) 8.5 6.8 2.8 2.2* 46% 44% 58% 55%
Hispanic (any race) (n=176) 8.7 4.7*** 2.4 1.4** 51% 38%** 54% 43%*
Multiracial/Other (n=19) 12 13.1 1.8 1.9 26% 53%† 63% 68%
Comorbidities
Severe mental illness (n=252) 10.9 8.1** 2.7 2.0* 53% 47% 64% 54%**
Substance use disorder (n=261) 13.9 7.8*** 3 2.0*** 63% 52%** 62% 57%*
Chronic condition (n=254) 11.1 8.6† 3.9 2.8** 58% 52% 68% 61%†
21

MEDICAID REDESIGN TEAM SUPPORTIVE HOUSING EVALUATION:Utilization Report 1
Summary. The AIDS Institute services-only program serves a very at-risk population with high rates
of medical and behavioral health comorbidities. Following MRT-SH enrollment, these patients
experienced fewer inpatient days and fewer emergency department visits. While clients with a SUD
or other chronic condition particularly saw reductions, this decrease in service utilization was not
especially linked to any demographic factors. Clients also receive more outpatient mental health
services following enrollment, particularly medication management.
Very few factors significantly predicted the magnitude of pre-post change in the AIDS Institute “services only” pro-gram. The decreases in inpatient admission and inpatient days were larger for clients with a substance use disorder than for those with no comorbid conditions. The decrease in
ED visits was also significantly greater for clients with anoth-er chronic medical condition beyond HIV. Client demograph-ics, however, were not predictive of changes in utilization between the pre- and post-enrollment period.
*** p =<0.001, ** p >0.001 & p=< 0.01, *p>0.01 & =<0.05
Table 13. Predictors of Pre-Post Changes in Inpatient and ED Utilization among AIDS Institute “Services Only” Clients
Δ Inpatient Admissions Δ Inpatient Days Δ ED Visits
Unstandardized Coefficients
Unstandardized Coefficients
Unstandardized Coefficients
Model B Std. Error Sig. B Std. Error Sig. B Std. Error Sig.
(Constant) 0.388 0.430 -4.238 3.250 0.703 0.719
Age at Enrollment (in years, mean-cen-tered for HIV population)
0.006 0.012 -0.113 0.088 0.011 0.019
Race/Ethnicity
Non-Hispanic white (Ref. category) -- -- -- -- -- --
Non-Hispanic Black (1=yes) 0.003 0.426 4.007 3.218 -0.686 0.712
Hispanic (1=yes) -0.448 0.442 2.392 3.341 -1.100 0.740
Multiracial/Other (1=yes) 0.245 0.718 6.732 5.427 -0.274 1.201
Sex
Male (Ref. category) -- -- -- -- -- --
Female (1=yes) 0.107 0.243 1.143 1.838 0.258 0.407
Comorbidities
Severe mental illness (1=yes) -0.113 0.233 0.876 1.760 0.081 0.390
Substance use disorder (1=yes) -0.712 0.233 ** -6.824 1.759 *** -0.539 0.390
Other chronic condition (1=yes) -0.328 0.240 1.534 1.811 -0.911 0.401 *
22
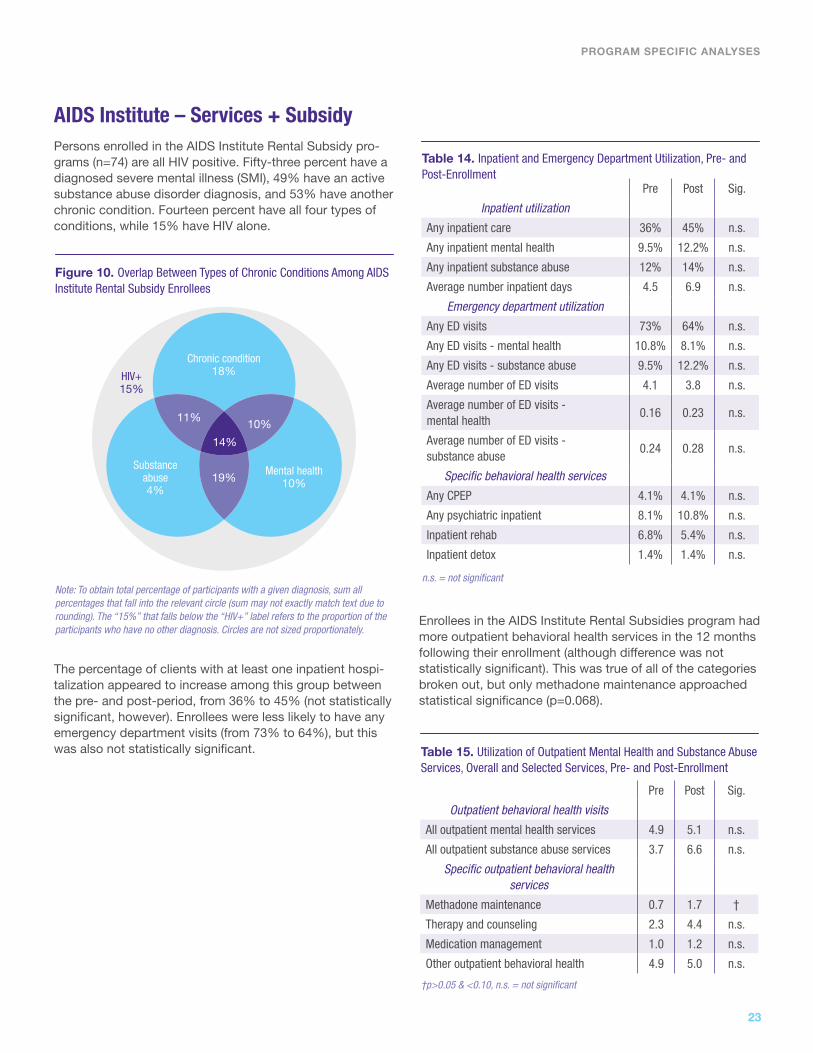
Persons enrolled in the AIDS Institute Rental Subsidy pro-grams (n=74) are all HIV positive. Fifty-three percent have a diagnosed severe mental illness (SMI), 49% have an active substance abuse disorder diagnosis, and 53% have another chronic condition. Fourteen percent have all four types of conditions, while 15% have HIV alone.
AIDS Institute – Services + Subsidy
The percentage of clients with at least one inpatient hospi-talization appeared to increase among this group between the pre- and post-period, from 36% to 45% (not statistically significant, however). Enrollees were less likely to have any emergency department visits (from 73% to 64%), but this was also not statistically significant.
Enrollees in the AIDS Institute Rental Subsidies program had more outpatient behavioral health services in the 12 months following their enrollment (although difference was not statistically significant). This was true of all of the categories broken out, but only methadone maintenance approached statistical significance (p=0.068).
PROGRAM SPECIFIC ANALYSES
19%
11%
14%
10%
Substanceabuse4%
Figure 10. Overlap Between Types of Chronic Conditions Among AIDS Institute Rental Subsidy Enrollees
Chronic condition18%HIV+
15%
Mental health10%
Note: To obtain total percentage of participants with a given diagnosis, sum all percentages that fall into the relevant circle (sum may not exactly match text due to rounding). The “15%” that falls below the “HIV+” label refers to the proportion of the participants who have no other diagnosis. Circles are not sized proportionately.
n.s. = not significant
Table 14. Inpatient and Emergency Department Utilization, Pre- and Post-Enrollment Pre Post Sig.
Inpatient utilization
Any inpatient care 36% 45% n.s.
Any inpatient mental health 9.5% 12.2% n.s.
Any inpatient substance abuse 12% 14% n.s.
Average number inpatient days 4.5 6.9 n.s.
Emergency department utilization
Any ED visits 73% 64% n.s.
Any ED visits - mental health 10.8% 8.1% n.s.
Any ED visits - substance abuse 9.5% 12.2% n.s.
Average number of ED visits 4.1 3.8 n.s.
Average number of ED visits - mental health
0.16 0.23 n.s.
Average number of ED visits - substance abuse
0.24 0.28 n.s.
Specific behavioral health services
Any CPEP 4.1% 4.1% n.s.
Any psychiatric inpatient 8.1% 10.8% n.s.
Inpatient rehab 6.8% 5.4% n.s.
Inpatient detox 1.4% 1.4% n.s.
†p>0.05 & <0.10, n.s. = not significant
Table 15. Utilization of Outpatient Mental Health and Substance Abuse Services, Overall and Selected Services, Pre- and Post-Enrollment
Pre Post Sig.
Outpatient behavioral health visits
All outpatient mental health services 4.9 5.1 n.s.
All outpatient substance abuse services 3.7 6.6 n.s.
Specific outpatient behavioral health services
Methadone maintenance 0.7 1.7 †
Therapy and counseling 2.3 4.4 n.s.
Medication management 1.0 1.2 n.s.
Other outpatient behavioral health 4.9 5.0 n.s.
23
MEDICAID REDESIGN TEAM SUPPORTIVE HOUSING EVALUATION:Utilization Report 1
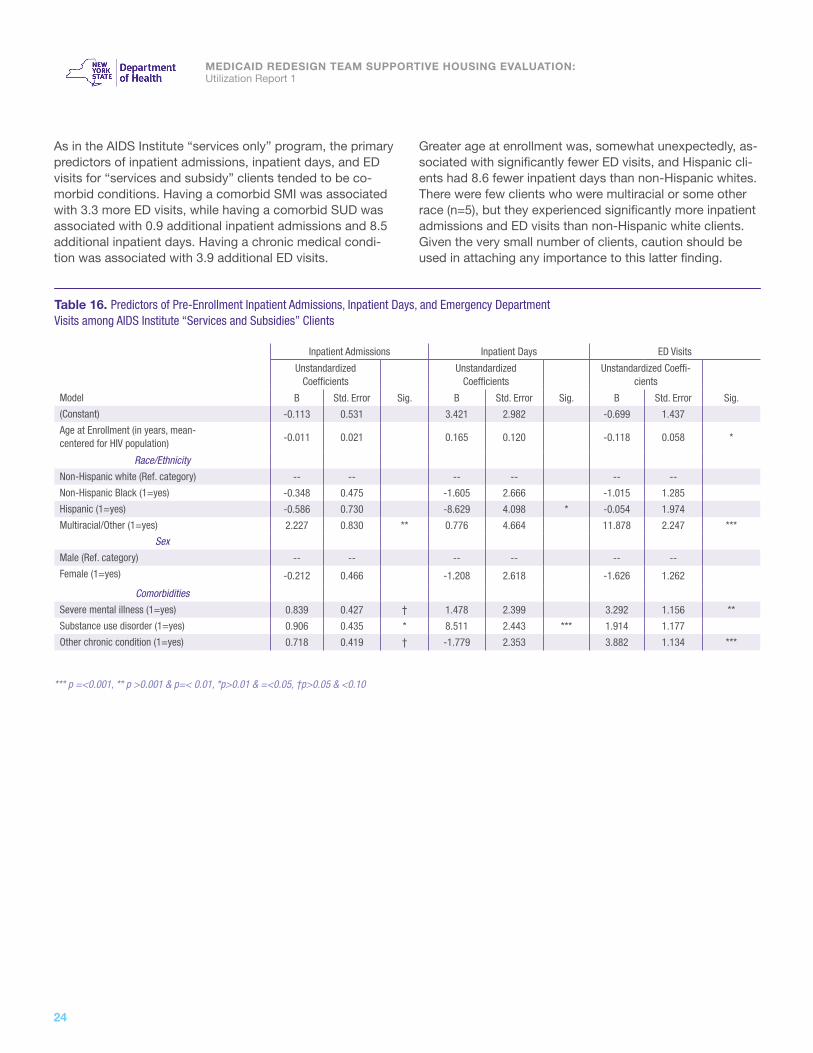
As in the AIDS Institute “services only” program, the primary predictors of inpatient admissions, inpatient days, and ED visits for “services and subsidy” clients tended to be co-morbid conditions. Having a comorbid SMI was associated with 3.3 more ED visits, while having a comorbid SUD was associated with 0.9 additional inpatient admissions and 8.5 additional inpatient days. Having a chronic medical condi-tion was associated with 3.9 additional ED visits.
Greater age at enrollment was, somewhat unexpectedly, as-sociated with significantly fewer ED visits, and Hispanic cli-ents had 8.6 fewer inpatient days than non-Hispanic whites. There were few clients who were multiracial or some other race (n=5), but they experienced significantly more inpatient admissions and ED visits than non-Hispanic white clients. Given the very small number of clients, caution should be used in attaching any importance to this latter finding.
*** p =<0.001, ** p >0.001 & p=< 0.01, *p>0.01 & =<0.05, †p>0.05 & <0.10
Table 16. Predictors of Pre-Enrollment Inpatient Admissions, Inpatient Days, and Emergency Department Visits among AIDS Institute “Services and Subsidies” Clients
Inpatient Admissions Inpatient Days ED Visits
Unstandardized Coefficients
Unstandardized Coefficients
Unstandardized Coeffi-cients
Model B Std. Error Sig. B Std. Error Sig. B Std. Error Sig.
(Constant) -0.113 0.531 3.421 2.982 -0.699 1.437
Age at Enrollment (in years, mean- centered for HIV population) -0.011 0.021 0.165 0.120 -0.118 0.058 *
Race/Ethnicity
Non-Hispanic white (Ref. category) -- -- -- -- -- --
Non-Hispanic Black (1=yes) -0.348 0.475 -1.605 2.666 -1.015 1.285
Hispanic (1=yes) -0.586 0.730 -8.629 4.098 * -0.054 1.974
Multiracial/Other (1=yes) 2.227 0.830 ** 0.776 4.664 11.878 2.247 ***
Sex
Male (Ref. category) -- -- -- -- -- --
Female (1=yes) -0.212 0.466 -1.208 2.618 -1.626 1.262
Comorbidities
Severe mental illness (1=yes) 0.839 0.427 † 1.478 2.399 3.292 1.156 **
Substance use disorder (1=yes) 0.906 0.435 * 8.511 2.443 *** 1.914 1.177
Other chronic condition (1=yes) 0.718 0.419 † -1.779 2.353 3.882 1.134 ***
24

PROGRAM SPECIFIC ANALYSES
†p>0.05 & <0.10
Table 17. Pre- and Post-Enrollment Utilization of Inpatient and Emergency Care by Client Characteristics
Inpatient Days ED Visits Any Inptatient Admissions Any ED Visits
Pre Post Pre Post Pre Post Pre Post
Sex
Male (n=32) 4.8 7.5 4.2 2.7 31% 34% 66% 50%
Female (n=42) 4.2 6.5 4.0 4.7 40% 52% 79% 76%
Race/ethnicityNon-Hispanic white (n=33) 6.1 7.6 3.6 3.5 42% 45% 79% 64%
Non-Hispanic black (n=29) 3.2 8.3 2.8 2.7 28% 41% 66% 59%
Hispanic (any race) (n=7) 1.3 1.0 3.3 3.3 29% 57% 71% 86%
Multiracial/Other (n=5) 6.0 2.8 15.47 13.4 60% 40% 80% 80%
Comorbidities
Severe mental illness (n=39) 6.6 6.8 5.5 5.2 54% 54% 85% 67%†
Substance use disorder (n=36) 8.6 7.2 5.4 4.4 61% 58% 92% 69%
Chronic condition (n=39) 3.9 8.5 5.5 4.9 44% 59% 82% 79%
No demographic or clinical subgroup experienced a signifi-cant pre-post change in inpatient or emergency department
use, although clients with a SMI had a close-to-significant drop in the likelihood of having at least one ED visit.
25

MEDICAID REDESIGN TEAM SUPPORTIVE HOUSING EVALUATION:Utilization Report 1
Summary. For unknown reasons, the use of inpatient services appeared to increase following MRT-
SH enrollment for clients in the AIDS Institute Rental Subsidy program. These findings, however,
were not statistically significant and therefore may be due to random variation. The lower likelihood
of using the emergency department is in the expected direction, although also not statistically
significant. There may be an increase in the use of outpatient behavioral health services,
particularly methadone maintenance. While these trends are interesting and raise many questions,
the lack of statistical significance for any of these findings makes it difficult to determine if these
patterns are genuine.
Few factors predicted pre-post differences among AIDS Institute “services and subsidies” clients. Clients with a SUD experienced a significantly greater decrease in inpatient
admissions than those without a SUD, while women in the program experienced a significant increase in ED visits net of other factors.
Table 18. Predictors of Pre-Post Changes in Inpatient and ED Utilization among AIDS Institute “Services and Subsidies” Clients
Δ Inpatient Admissions Δ Inpatient Days Δ ED Visits
Unstandardized Coefficients
Unstandardized Coefficients
Unstandardized Coefficients
Model B Std. Error Sig. B Std. Error Sig. B Std. Error Sig.
(Constant) 0.126 0.679 3.335 8.787 -0.880 1.655
Age at Enrollment (in years, mean-cen-tered for HIV population)
-0.021 0.027 -0.063 0.353 0.021 0.067
Race/Ethnicity
Non-Hispanic white (Ref. category) -- -- -- -- -- --
Non-Hispanic Black (1=yes) 0.686 0.607 1.799 7.856 0.976 1.480
Hispanic (1=yes) 0.522 0.933 0.937 12.074 0.714 2.274
Multiracial/Other (1=yes) -0.931 1.061 -6.237 13.742 -0.961 2.588
Sex
Male (Ref. category) -- -- -- -- -- --
Female (1=yes) 0.212 0.596 0.753 7.715 3.033 1.453 *
Comorbidities
Severe mental illness (1=yes) 0.449 0.546 -1.830 7.070 0.219 1.331
Substance use disorder (1=yes) -1.300 0.556 * -6.960 7.199 -1.992 1.356
Other chronic condition (1=yes) 0.716 0.536 4.452 6.934 -0.969 1.306
*p>0.01 & =<0.05
26

The East 99th Street population (n=137) has a high rate of chronic medical conditions other than behavioral health or HIV. Sixty percent had at least one chronic condition, while 43% had an active SMI diagnosis, 6% had a substance abuse disorder, and 15% had HIV. Two percent had all four types of chronic conditions; 31% had a chronic medical condition (other than behavioral health and HIV) alone.
East 99th Street
The percentage of enrollees experiencing at least one inpatient hospitalization was slightly higher in the year after MRT-SH enrollment than before (31% versus 27%), but this was not statistically significant. The average number of inpatient days declined slightly (from 3.5 to 3.3), but this was not statistically significant either. Very small numbers of this population had inpatient stays for mental health or substance abuse either before or after MRT-SH enrollment. Similarly, the likelihood of experiencing at least one ED visit increased slightly (from 35% to 37%), but this was not a statistically significant difference.
These participants received more outpatient substance abuse services following their MRT-SH enrollment, with methadone maintenance being statistically significant. They also had significantly more visits for medication manage-ment for behavioral health conditions, despite receiving fewer outpatient mental health services overall and fewer visits for therapy and counseling.
PROGRAM SPECIFIC ANALYSES
Figure 11. Overlap Between Types of Chronic Conditions amongEast 99th Street Enrollees
Not shown are HIV+SMI (3.6%), SUD + chronic conditions (0.7%), and none (18%).
To obtain total percentage of participants with a given diagnosis, sum all percentages that fall into the relevant circle (sum may not exactly match text due to rounding). Circles are not sized proportionately.
HIV3%
2%3% 0%
0%
2%18%
4%
2%
0%
Mental health14%
Chronicconditions
31%
Substanceabuse0%
n.s. = not significant
Table 19. Inpatient and Emergency Department Utilization, Pre- and Post-Enrollment Pre Post Sig.
Inpatient utilization
Any inpatient care 27% 31% n.s.
Any inpatient mental health 2.2% 2.9% n.s.
Any inpatient substance abuse 1.5% 2.2% n.s.
Average number inpatient days 3.5 3.3 n.s.
Emergency department utilization
Any ED visits 35% 37% n.s.
Any ED visits - mental health 1.5% 2.9% n.s.
Any ED visits - substance abuse 1.5% 1.5% n.s.
Average number of ED visits 1.0 1.1 n.s.
*p>0.01 & =<0.05, †p>0.05 & <0.10, n.s. = not significant
Table 20. Utilization of Outpatient Mental Health and Substance Abuse Services, Overall and Selected Services, Pre- and Post-Enrollment
Pre Post Sig.
Outpatient behavioral health visits
All outpatient mental health services 12.1 9.9 n.s.
All outpatient substance abuse services 0.9 3.2 †
Specific outpatient behavioral health services
Methadone maintenance 0.4 1.6 *
Therapy and counseling 4.5 3.1 †
Medication management 1.1 1.4 *
Other outpatient behavioral health 7.1 7.0 n.s.
27

MEDICAID REDESIGN TEAM SUPPORTIVE HOUSING EVALUATION:Utilization Report 1
There were few significant predictors of inpatient or ED use during the pre-enrollment period for clients in East 99th Street. Age at enrollment was associated with significantly fewer ED visits, although the effect was small (a decrease of about 0.4 visits per 10-year increase in age). Those with
a SUD experienced significantly more inpatient days (11.7 on average) and ED visits (3.6). Having a chronic medical condition was also associated with greater utilization – in all 3 categories – but none of these relationships were quite statistically significant.
Statistically significant pre-post changes were not found for any of the demographic and clinical subgroups examined except for those with a SUD, who experienced an average
decrease of 3.9 ED visits. Some of the changes were large, but the modest sizes of the subgroups kept most from ap-proaching statistical significance.
*** p =<0.001, ** p >0.001 & p=< 0.01, †p>0.05 & <0.10
Table 21. Predictors of Pre-Enrollment Inpatient Admissions, Inpatient Days, and Emergency Department Visits among East 99th Street Residents
Inpatient Admissions Inpatient Days ED Visits
Unstandardized Coefficients
Unstandardized Coefficients
Unstandardized Coefficients
B Std. Error Sig. B Std. Error Sig. B Std. Error Sig.
(Constant) -0.040 0.429 -0.411 2.960 -0.444 0.594
Age at Enrollment (in years, mean-centered for chronic conditions population)
-0.007 0.010 -0.083 0.071 -0.038 0.014 **
Race/EthnicityNon-Hispanic white (Ref. category) -- -- -- -- -- --
Non-Hispanic Black (1=yes) 0.498 0.463 2.830 3.194 0.992 0.641
Hispanic (1=yes) 0.214 0.482 1.724 3.330 0.254 0.668
Multiracial/Other (1=yes) -0.188 0.629 4.364 4.342 1.119 0.871
SexMale (Ref. category) -- -- -- -- -- --
Female (1=yes) -0.210 0.262 -0.036 1.811 0.440 0.363
ComorbiditiesSevere mental illness (1=yes) 0.293 0.303 -0.107 2.095 0.652 0.420
Substance use disorder (1=yes) 0.829 0.564 11.710 3.893 ** 3.648 0.781 ***
HIV+ (1=yes) -0.257 0.352 -2.377 2.426 -0.186 0.487
Other chronic condition (1=yes) 0.532 0.270 † 3.398 1.862 † 0.733 0.374 †
*p>0.01 & =<0.05
Table 22. Pre- and Post-Enrollment Utilization of Inpatient and Emergency Care by Client Characteristics
Inpatient Days ED Visits Any Inptatient Admissions Any ED Visits
Pre Post Pre Post Pre Post Pre Post
Sex
Male (n=76) 3.9 2.9 0.9 1.0 26% 33% 36% 34%
Female (n=61) 3.1 3.9 1.1 1.3 28% 28% 34% 39%
Race/ethnicityNon-Hispanic white (n=13) 1.8 7.1 0.6 0.6 23% 31% 23% 15%
Non-Hispanic black (n=60) 4.0 3.3 1.2 1.3 28% 30% 45% 42%
Hispanic (any race) (n=54) 2.9 1.5 0.6 1.7 30% 33% 30% 41%
Multiracial/Other (n=10) 6.2 8.8 2.0 0.7 10% 20% 20% 10%
Comorbidities
Severe mental illness (n=59) 4.5 3.0 1.8 1.4 31% 24% 49% 39%
Substance use disorder (n=8) 14.8 11.0 4.9 1.0* 63% 38% 75% 25%
HIV+ (n=21) 2.6 2.5 1.3 1.2 19% 33% 33% 43%
Chronic condition (n=82) 5.0 4.3 1.3 1.4 34% 35% 39% 44%
28

Summary. There were no statistically significant differences in the use of inpatient or emergency
department care or primary care among East 99th residents overall following their MRT-SH
enrollment, although a decrease in ED visits was significantly associated with having a SUD
diagnosis. East 99th residents used significantly more outpatient substance abuse services
(specifically more methadone maintenance) and had more visits for medication management for
behavioral health.
PROGRAM SPECIFIC ANALYSES
The only factor that significantly predicted the magnitude of pre-post changes among East 99th Street residents was having a SUD. Clients with a SUD experienced a greater decrease in ED visits than clients without a SUD. Black and
Hispanic clients also experienced a greater decrease in inpatient days than non-Hispanic white clients, but these relationships were not quite statistically significant.
*** p =<0.001, ** p >0.001 & p=< 0.01, *p>0.01 & =<0.05, †p>0.05 & <0.10
Table 23. Predictors of Pre-Post Changes in Inpatient and ED Utilization among East 99th Street Residents
Δ Inpatient Admissions Δ Inpatient Days Δ ED Visits
Unstandardized Coefficients
Unstandardized Coefficients
Unstandardized Coefficients
Model B Std. Error Sig. B Std. Error Sig. B Std. Error Sig.
(Constant) 1.072 0.586 † 6.162 3.192 † 0.678 0.661
Age at Enrollment (in years, mean-cen-tered for chronic conditions population)
-0.010 0.014 -0.023 0.076 0.020 0.016
Race/Ethnicity
Non-Hispanic white (Ref. category) -- -- -- -- -- --
Non-Hispanic Black (1=yes) -0.963 0.632 -6.756 3.444 † -0.571 0.714
Hispanic (1=yes) -0.765 0.659 -6.984 3.591 † -0.106 0.744
Multiracial/Other (1=yes) 0.566 0.859 -1.988 4.682 -1.505 0.970
Sex
Male (Ref. category) -- -- -- -- -- --
Female (1=yes) 0.476 0.358 2.433 1.953 -0.151 0.405
Comorbidities
Severe mental illness (1=yes) -0.625 0.415 -2.937 2.259 -0.107 0.468
Substance use disorder (1=yes) 0.507 0.770 -3.701 4.198 -4.111 0.870 ***
HIV+ (1=yes) -0.056 0.480 1.361 2.616 0.169 0.542
Other chronic condition (1=yes) -0.176 0.369 -0.255 2.008 0.027 0.416
29

MEDICAID REDESIGN TEAM SUPPORTIVE HOUSING EVALUATION:Utilization Report 1
The Health Homes Supportive Housing population (n=109) are Health Home enrolled and have two or more chronic conditions or one single qualifying condition (HIV/AIDS or SMI). Sixty-five percent of the persons enrolled in the pro-gram have a high rate of SMI (65%), SUD (52%), HIV (20%) and other chronic medical conditions (42%).
Health Homes Supportive Housing Pilot
While the percent with at least one inpatient admission did not significantly decline, the average number of inpatient days was significantly lower in the year after enrollment (6 versus 11). Emergency department visits also declined, especially for mental health, substance abuse, but these relationships did not quite meet the threshold for statistical significance.
For the most part, the volume of outpatient behavior-al health services did not significantly change following MRT-SH enrollment. Use of overall outpatient mental health services increased slightly, while use of overall outpatient substance abuse services decreased (neither change was statistically significant). Clients did, however, receive significantly more methadone maintenance. There was also a significant decrease in outpatient behavioral health other than methadone, therapy, and medication management.
Figure 12. Overlap Between Types of Chronic Conditions amongHHSP Project Enrollees
Not shown are SUD + chronic medical condition (2%), SMI + HIV (2%), and none (7%).
To obtain total percentage of participants with a given diagnosis, sum all percentages that fall into the relevant circle (sum may not exactly match text due to rounding). Circles are not sized proportionately.
HIV1%
4%1% 5%
5%
12%7%
2%
19%
2%
Mental health17%
Chronicconditions
11%
Substanceabuse5%
*p>0.01 & =<0.05, †p>0.05 & <0.10, n.s. = not significant
Table 24. Inpatient and Emergency Department Utilization, Pre- and Post-Enrollment
Pre Post Sig.
Inpatient utilization
Any inpatient care 39% 29% n.s.
Any inpatient mental health 16% 11% n.s.
Any inpatient substance abuse 14% 6% †
Average number inpatient days 11.0 6.0 *
Emergency department utilization
Any ED visits 62% 55% n.s.
Any ED visits - mental health 14% 6% †
Any ED visits - substance abuse 13% 6% †
Average number of ED visits 2.6 1.7 †
** p >0.001 & =< 0.01, *p>0.01 & =<0.05, n.s. = not significant
Table 25. Utilization of Outpatient Mental Health and Substance Abuse Services, Overall and Selected Services, Pre- and Post-Enrollment
Pre Post Sig.
Outpatient behavioral health visits
All outpatient mental health services 6.8 7.2 n.s.
All outpatient substance abuse services 11.0 7.9 n.s.
Specific outpatient behavioral health services
Methadone maintenance 0.7 1.4 **
Therapy and counseling 7.4 6.9 n.s.
Medication management 1.5 1.5 n.s.
Other outpatient behavioral health 8.3 5.5 *
30

PROGRAM SPECIFIC ANALYSES
There were very few statistically significant predictors of inpatient admissions, inpatient days, or ED visits during the pre-enrollment period for the HHSP clients. Those with a
chronic medical condition experienced 1.0 more inpatient admission than those with none, while those with a SUD experienced 2.0 more ED visits than those without.
*p>0.01 & =<0.05,
Table 26. Predictors of Pre-Enrollment Inpatient Admissions, Inpatient Days, and Emergency Department Visits among HHSP Clients
Inpatient Admissions Inpatient Days ED Visits
Unstandardized Coefficients
Unstandardized Coefficients
Unstandardized Coefficients
B Std. Error Sig. B Std. Error Sig. B Std. Error Sig.
(Constant) 0.271 0.616 8.875 10.149 1.386 1.089
Age at Enrollment (in years, mean-centered for MRT population)
-0.034 0.021 0.028 0.339 -0.023 0.036
Race/EthnicityNon-Hispanic white (Ref. category) -- -- -- -- -- --
Non-Hispanic Black (1=yes) 0.065 0.615 4.377 10.138 -0.025 1.087
Hispanic (1=yes) -0.170 0.745 -7.805 12.281 2.153 1.317
Multiracial/Other (1=yes) -0.643 0.775 -9.473 12.768 -2.114 1.369
SexMale (Ref. category) -- -- -- -- -- --
Female (1=yes) -0.150 0.472 9.545 7.780 0.103 0.834
GeographyNew York City (1=yes) 0.227 0.545 11.156 8.975 -1.459 0.963
Other NYS (Ref. category) -- -- -- -- -- --
ComorbiditiesSevere mental illness (1=yes) 0.140 0.500 -6.659 8.235 0.146 0.883
Substance use disorder (1=yes) 0.694 0.480 1.773 7.906 2.033 0.848 *
HIV+ (1=yes) -0.272 0.607 -4.136 9.994 -0.011 1.072
Other chronic condition (1=yes) 1.032 0.455 * -2.813 7.490 1.287 0.803
31
MEDICAID REDESIGN TEAM SUPPORTIVE HOUSING EVALUATION:Utilization Report 1
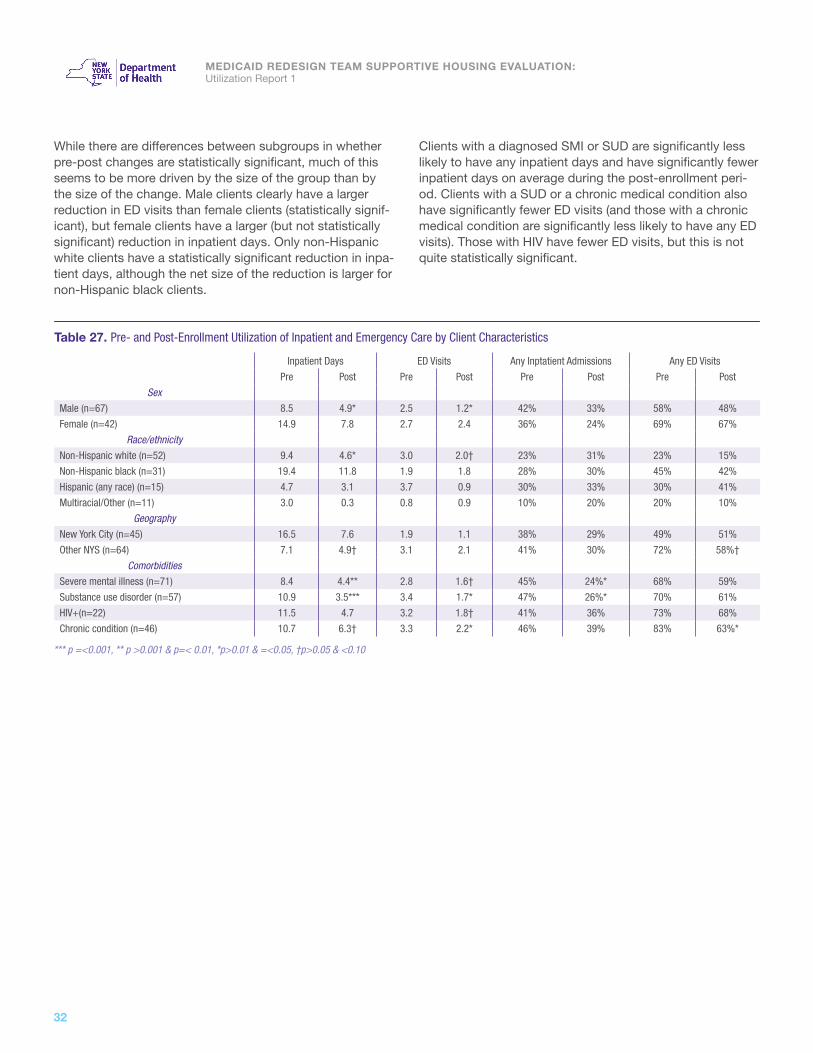
While there are differences between subgroups in whether pre-post changes are statistically significant, much of this seems to be more driven by the size of the group than by the size of the change. Male clients clearly have a larger reduction in ED visits than female clients (statistically signif-icant), but female clients have a larger (but not statistically significant) reduction in inpatient days. Only non-Hispanic white clients have a statistically significant reduction in inpa-tient days, although the net size of the reduction is larger for non-Hispanic black clients.
Clients with a diagnosed SMI or SUD are significantly less likely to have any inpatient days and have significantly fewer inpatient days on average during the post-enrollment peri-od. Clients with a SUD or a chronic medical condition also have significantly fewer ED visits (and those with a chronic medical condition are significantly less likely to have any ED visits). Those with HIV have fewer ED visits, but this is not quite statistically significant.
*** p =<0.001, ** p >0.001 & p=< 0.01, *p>0.01 & =<0.05, †p>0.05 & <0.10
Table 27. Pre- and Post-Enrollment Utilization of Inpatient and Emergency Care by Client Characteristics
Inpatient Days ED Visits Any Inptatient Admissions Any ED Visits
Pre Post Pre Post Pre Post Pre Post
Sex
Male (n=67) 8.5 4.9* 2.5 1.2* 42% 33% 58% 48%
Female (n=42) 14.9 7.8 2.7 2.4 36% 24% 69% 67%
Race/ethnicityNon-Hispanic white (n=52) 9.4 4.6* 3.0 2.0† 23% 31% 23% 15%
Non-Hispanic black (n=31) 19.4 11.8 1.9 1.8 28% 30% 45% 42%
Hispanic (any race) (n=15) 4.7 3.1 3.7 0.9 30% 33% 30% 41%
Multiracial/Other (n=11) 3.0 0.3 0.8 0.9 10% 20% 20% 10%
GeographyNew York City (n=45) 16.5 7.6 1.9 1.1 38% 29% 49% 51%
Other NYS (n=64) 7.1 4.9† 3.1 2.1 41% 30% 72% 58%†
Comorbidities
Severe mental illness (n=71) 8.4 4.4** 2.8 1.6† 45% 24%* 68% 59%
Substance use disorder (n=57) 10.9 3.5*** 3.4 1.7* 47% 26%* 70% 61%
HIV+(n=22) 11.5 4.7 3.2 1.8† 41% 36% 73% 68%
Chronic condition (n=46) 10.7 6.3† 3.3 2.2* 46% 39% 83% 63%*
32

Few factors were significantly associated with the magni-tude of pre-post changes among HHSP clients. Older age was associated with a lesser decrease in inpatient admis-sions, while Hispanic clients experienced a significantly
Summary. While still in its early stages, the Health Home Supportive Housing Pilot shows a trend
towards reducing inpatient and emergency care among a high-risk client population, although
only a reduction in inpatient days is statistically significant. In particular, the lesser use of inpatient
and emergency services for mental health and substance abuse problems suggests an improved
quality of life in which these clients are less likely to experience behavioral health crises. This
decrease may also be associated with a SUD diagnosis, race, and age.
*p>0.01 & =<0.05
Table 28. Predictors of Pre-Post Changes in Inpatient and ED Utilization among HHSP Clients
Δ Inpatient Admissions Δ Inpatient Days Δ ED Visits
Unstandardized Coefficients
Unstandardized Coefficients
Unstandardized Coefficients
Model B Std. Error Sig. B Std. Error Sig. B Std. Error Sig.
(Constant) 0.518 0.614 -1.208 11.693 0.001 1.034
Age at Enrollment (in years, mean- centered for overall MRT-SH population)
0.043 0.020 * -0.077 0.390 -0.011 0.034
Race/Ethnicity
Non-Hispanic white (Ref. category) -- -- -- -- -- --
Non-Hispanic Black (1=yes) 0.744 0.614 1.573 11.680 0.355 1.032
Hispanic (1=yes) -0.093 0.744 5.561 14.149 -2.494 1.251 *
Multiracial/Other (1=yes) 0.009 0.773 3.927 14.710 0.963 1.300
Sex
Male (Ref. category) -- -- -- -- -- --
Female (1=yes) 0.414 0.471 -5.933 8.963 0.839 0.792
Geography
New York City (1=yes) -0.850 0.543 -8.797 10.340 0.706 0.914
Other NYS (Ref. category) -- -- -- -- -- --
Comorbidities
Severe mental illness (1=yes) -0.383 0.499 3.665 9.487 -0.275 0.839
Substance use disorder (1=yes) -0.424 0.479 -5.609 9.108 -1.991 0.805 *
HIV+ (1=yes) 0.103 0.605 0.856 11.514 0.164 1.018
Other chronic condition (1=yes) -0.620 0.453 2.308 8.629 -0.441 0.763
larger decrease in ED visits (by about 2.5) than non-Hispanic white clients. Clients with a SUD experienced a larger de-crease in ED visits (by about 2) than those without a SUD.
PROGRAM SPECIFIC ANALYSES
33

MEDICAID REDESIGN TEAM SUPPORTIVE HOUSING EVALUATION:Utilization Report 1
Persons enrolled in the OASAS Rental Subsidies program (n=297) should all have a history of substance abuse. Sev-enty-five percent also have a mental health diagnosis, 59% have another chronic medical condition (other than HIV), and 13% have HIV. Six percent of the enrollees have all four types of conditions, while only 11% have a substance use disorder only.
OASAS Rental Subsidies
The percentage of enrollees who experienced at least one inpatient hospitalization was dramatically lower in the 12 months after MRT-SH enrollment compared to the 12 months before (52% post-enrollment versus 77%, pre-en-rollment, p < 0.001). The average number of inpatient days also declined from 23.4 to 12.0 (p<0.001). In particular, the percentages with at least one inpatient hospitalization for a primary diagnosis of mental health or of substance abuse also declined markedly (from 21% to 14% [p=0.005] and from 55% to 31% [p<0.001], respectively).
The percentage with at least one emergency department visit also declined, from 85% to 70% (p<0.001); this was particularly true of emergency department visits for mental health or substance abuse (22% versus 14% [p=0.007] and 30% versus 19% [p<0.001], respectively). Similar find-ings were obtained for the average number of emergency
department visits, which declined from 6.1 to 3.6 overall (p<0.001); from 0.4 to 0.3 for mental health (p=0.014); and from 1.0 to 0.5 for substance abuse (p<0.001).
Enrollees in this program also had significantly fewer inpatient rehabilitation stays and inpatient detox stays, as well as fewer psychiatric inpatient stays as defined by rate codes (although the latter was not quite statistically significant).
4%
1%
7%
38%
HIV0%
Figure 13. Overlap Between Types of Chronic Conditions amongOASAS Rental Subsidy Enrollees
Chronic condition12%Substance
abuse11%
Mental health26%
Note: To obtain total percentage of participants with a given diagnosis, sum all percentages that fall into the relevant circle (sum may not exactly match text due to rounding). The “11%” that falls below the “Substance abuse” label refers to the proportion of the participants who have no other diagnosis. Circles are not sized proportionately.
*** p =<0.001, ** p >0.001 & =< 0.01, *p>0.01 & =<0.05, †p>0.05 & <0.10, n.s. = not significant
Table 29. Inpatient and Emergency Department Utilization, Pre- and Post-Enrollment Pre Post Sig.
Inpatient utilization
Any inpatient care 77% 52% ***
Any inpatient mental health (by Dx) 21% 14% **
Any inpatient substance abuse 55% 31% ***
Average number inpatient days 23.4 12.0 ***
Emergency department utilization
Any ED visits 85% 70% ** *
Any ED visits - mental health 22% 14% **
Any ED visits - substance abuse 30% 19% ***
Average number of ED visits 6.1 3.6 ***
Average number of ED visits - mental health
0.4 0.3 *
Average number of ED visits - substance abuse
1.0 0.5 ***
Specific behavioral health services
Any CPEP 3.7% 2.7% n.s.
Any psychiatric inpatient (by rate code) 15% 11% †
Inpatient rehab 25% 13% ***
Inpatient detox 13% 8% *
34

The OASAS Rental Subsidy enrollees received significantly fewer outpatient substance abuse services in the 12 months following MRT-SH enrollment than in the 12 months previ-ous to enrollment. If their substance abuse disorders were improving, however, they may have required fewer services. Outpatient visits for medication management for behavioral
PROGRAM SPECIFIC ANALYSES
health conditions increased, although this was not quite statistically significant (p=0.063). These enrollees also had significantly fewer outpatient visits for behavioral health oth-er than methadone, therapy, and medication management, which could possibly be indicative of stabilization in their condition.
Within the OASAS-RS program, Hispanic clients have significantly more inpatient admissions and inpatient days during the pre-period than non-Hispanic white clients, while woman have significantly fewer inpatient admissions than men. Age at enrollment is negatively associated with inpa-tient days, and clients living on Long Island have significantly more inpatient days than those living in upstate New York.
*** p =<0.001, †p>0.05 & <0.10, n.s. = not significant
Table 30. Utilization of Outpatient Mental Health and Substance Abuse Services, Overall and Selected Services, Pre- and Post-Enrollment
Pre Post Sig.
Outpatient behavioral health visits
All outpatient mental health services 10.4 11.2 n.s.
All outpatient substance abuse services 60.0 37.1 ***
Specific outpatient behavioral health services
Methadone maintenance 5.9 5.0 n.s.
Therapy and counseling 18.4 16.7 n.s.
Medication management 2.1 2.5 †
Other outpatient behavioral health 40.2 20.4 ***
*** p =<0.001, ** p >0.001 & p=< 0.01, *p>0.01 & =<0.05, †p>0.05 & <0.10
Table 31. Predictors of Pre-Enrollment Inpatient Admissions, Inpatient Days, and Emergency Department Visits among OASAS-RS Clients
Inpatient Admissions Inpatient Days ED Visits
Unstandardized Coefficients
Unstandardized Coefficients
Unstandardized Coefficients
B Std. Error Sig. B Std. Error Sig. B Std. Error Sig.
(Constant) 9.523 1.701 *** 14.448 5.795 * 3.972 1.337 **
Age at Enrollment (in years, mean-centered for SUD population)
0.005 0.067 -0.625 0.228 ** 0.070 0.053
Race/EthnicityNon-Hispanic white (Ref. category) -- -- -- -- -- --
Non-Hispanic Black (1=yes) 1.241 1.753 10.962 5.974 † 0.340 1.379
Hispanic (1=yes) 6.781 2.284 ** 15.953 7.783 * 0.910 1.796
Multiracial/Other (1=yes) -0.404 2.648 -2.972 9.023 -1.497 2.082
SexMale (Ref. category) -- -- -- -- -- --
Female (1=yes) -3.050 1.436 * -9.349 4.895 † -0.019 1.129
GeographyNew York City (1=yes) -3.143 1.817 † -2.065 6.192 -1.397 1.429
Long Island (1=yes) -1.896 2.651 40.802 9.033 *** 0.660 2.085
Other NYS (Ref. category) -- -- -- -- -- --
ComorbiditiesSevere mental illness (1=yes) -3.023 1.582 † 7.127 5.391 1.717 1.244
HIV+ (1=yes) -1.224 2.062 -7.051 7.027 1.654 1.622
Other chronic condition (1=yes) -2.445 1.423 † -0.911 4.849 1.693 1.119
35

MEDICAID REDESIGN TEAM SUPPORTIVE HOUSING EVALUATION:Utilization Report 1
Nearly every subgroup in the OASAS-RS program has statistically significant pre-post reductions in inpatient and/or ED use. The size of the effect varies between group and
between measures, but a broad diversity of clients appear to benefit from participation in this program.
*** p =<0.001, ** p >0.001 & p=< 0.01, *p>0.01 & =<0.05, †p>0.05 & <0.10
Table 32. Pre- and Post-Enrollment Utilization of Inpatient and Emergency Care by Client Characteristics
Inpatient Days ED Visits Any Inptatient Admissions Any ED Visits
Pre Post Pre Post Pre Post Pre Post
Sex
Male (n=192) 24.7 13.1*** 6.1 3.3*** 82% 51%*** 83% 65%***
Female (n=105) 21.1 10.1** 6.1 4.3** 70% 53%* 89% 79%†
Race/ethnicity
Non-Hispanic white (n=151) 22.0 9.6*** 6.0 3.9*** 74% 47%*** 86% 72%**
Non-Hispanic black (n=90) 23.7 13.8** 6.2 3.3*** 82% 52%*** 80% 68%†
Hispanic (any race) (n=35) 33.7 19.3† 6.9 4.2* 83% 69% 91% 71%†
Multiracial/Other (n=21) 15.4 10.0 6.1 2.4** 71% 52% 90% 67%†
Geography
New York City (n=85) 20.9 16.8* 5.9 3.2*** 83% 56%*** 80% 66%*
Other NYS (n=212) 24.4 10.1*** 6.2 3.8*** 75% 50%*** 87% 72%***
Comorbidities
Severe mental illness (n=224) 24.7 11.6*** 6.6 3.9*** 77% 52%*** 88% 71%***
HIV+ (n=39) 15.9 9.7 7.5 3.2*** 77% 59% 90% 87%
Chronic condition (n=175) 22.5 11.9*** 7.0 4.4*** 78% 57%*** 85% 74%*
36

PROGRAM SPECIFIC ANALYSES
Hispanic clients experienced a significantly greater decrease in inpatient admissions than non-Hispanic white clients. Cli-ents in New York City or who had HIV or a SMI experienced a lesser decrease, although these relationships were not quite statistically significant. The decrease in inpatient days
became significantly smaller as client age increased, while clients on Long Island experienced a much greater decrease in inpatient days than those in the rest of New York State outside of New York City. The pre-post change in ED visits did not vary by any demographic or clinical characteristics.
Summary. Overall, the findings for the OASAS-RS program are overwhelmingly positive, with enrollees clearly needing less inpatient or emergency care overall, and particularly for their behavioral health conditions. Given the level of comorbidities in the population served, these results are striking. These decreases appeared relatively constant throughout the population, without being moderated by any particular client characteristic, although client age, race and geography did show some significant effects. It is difficult to effectively interpret findings for a population with a primary condition of substance use disorders, because unlike other chronic conditions found in the MRT-SH population, full recovery from the effects of substance abuse is possible. Some of the services that this population is receiving less of, such as primary care services and outpatient substance abuse services, may be less needed if substance use decreases.
Table 33. Predictors of Pre-Post Changes in Inpatient and ED Utilization among OASAS-RS Clients
Δ Inpatient Admissions Δ Inpatient Days Δ ED Visits
Unstandardized Coefficients
Unstandardized Coefficients
Unstandardized Coefficients
Model B Std. Error Sig. B Std. Error Sig. B Std. Error Sig.
(Constant) -6.818 1.863 *** -3.682 5.410 -1.608 1.056
Age at Enrollment (in years, mean- centered for SUD population)
0.038 0.073 0.561 0.213 ** -0.007 0.042
Race/Ethnicity
Non-Hispanic white (Ref. category) -- -- -- -- -- --
Non-Hispanic Black (1=yes) -1.770 1.920 -8.412 5.577 -0.987 1.089
Hispanic (1=yes) -6.482 2.502 ** -8.649 7.265 -0.653 1.418
Multiracial/Other (1=yes) -1.048 2.900 3.342 8.423 0.209 1.644
Sex
Male (Ref. category) -- -- -- -- -- --
Female (1=yes) 2.931 1.573† 6.268 4.569 1.171 0.892
Geography
New York City (1=yes) 3.463 1.990 † 8.425 5.781 0.494 1.128
Long Island (1=yes) 1.620 2.904 -36.175 8.433 *** -1.252 1.646
Other NYS (Ref. category) -- -- -- -- -- --
Comorbidities
Severe mental illness (1=yes) 2.967 1.733 † -7.299 5.032 -0.965 0.982
HIV+ (1=yes) 3.899 2.259 † 1.550 6.560 -1.923 1.281
Other chronic condition (1=yes) 1.538 1.558 -0.290 4.526 0.021 0.884
37

MEDICAID REDESIGN TEAM SUPPORTIVE HOUSING EVALUATION:Utilization Report 1
Office of Mental Health Rental Subsidies – Brooklyn Persons enrolled in Office of Mental Health Rental Subsi-dies programs (n=279) should all have a history of mental health conditions12. Fifty-seven percent have some other chronic medical condition (other than substance abuse or HIV); 37% have a substance use disorder; and 30% have HIV. Ten percent of enrollees have all four types of condi-tions, while twenty-five percent had a mental health condi-tion alone without any of the other types of conditions.
The percentage of enrollees who experienced at least one inpatient hospitalization was 28% following MRT-SH enroll-ment compared to 33% before, but this difference was not statistically significant. Enrollees did, however, spend signifi-cantly fewer days in an inpatient setting after their MRT-SH enrollment (5.1 versus 8.6).
12 For the purposes of this section, it is assumed that participants in the program by definition have had a SMI diagnosis even if such a primary diagnosis was not identified in the year prior to enrollment.
There were no significant differences in ED visits, either overall or for behavioral health conditions.
*p>0.01 & =<0.05, †p>0.05 & <0.10, n.s. = not significant
Table 34. Inpatient and Emergency Department Utilization, Pre- and Post-Enrollment Pre Post Sig.
Inpatient utilization
Any inpatient care 33% 28% n.s.
Any inpatient mental health 13% 10% n.s.
Any inpatient substance abuse 8.6% 7.5% n.s.
Average number inpatient days 8.6 5.1 *
Emergency department utilization
Any ED visits 51% 48% n.s.
Any ED visits - mental health 13% 9% n.s.
Any ED visits - substance abuse 5.4% 4.7% n.s.
Average number of ED visits 2.1 2.0 n.s.
Average number of ED visits - mental health
0.23 0.25 n.s.
Average number of ED visits - substance abuse
0.12 0.09 n.s.
Specific behavioral health services
Any CPEP 5.0% 6.1% n.s.
Any psychiatric inpatient 10.4% 9.3% n.s.
Inpatient rehab 3.6% 3.2% n.s.
Inpatient detox 2.9% 2.5% n.s.
3%
11%
10%
16%
HIV7%
Figure 14. Overlap Between Types of Chronic Conditions amongOffice of Mental Health - Brooklyn Rental Subsidy Enrollees
Chronic Condition21%Mental
Health25%
Substance Abuse9%
Note: To obtain total percentage of participants with a given diagnosis, sum all percentages that fall into the relevant circle (sum may not exactly match text due to rounding). The “25%” that appears below the “Mental Health” label refers to the proportion of the participants who have no other diagnosis. Circles are not sized proportionately.
38

PROGRAM SPECIFIC ANALYSES
These enrollees consumed significantly fewer outpatient mental health and substance abuse visits in the year follow-ing MRT-SH enrollment, particularly significantly fewer visits for therapy and counseling and for other outpatient behav-ioral health services other than methadone maintenance and medication management.
The only statistically significant predictors of pre-enroll-ment inpatient and emergency department use among RSB clients are comorbidities, especially SUDs. Those with a co-morbid SUD had significantly more inpatient admissions and inpatient days, and also more ED visits (although the latter was not quite statistically significant). Those with HIV had significantly more ED visits, and those with another chronic condition had significantly more inpatient admissions and ED visits.
*** p =<0.001, †p>0.05 & <0.10, n.s. = not significant
Table 35. Utilization of Outpatient Mental Health and Substance Abuse Services, Overall and Selected Services, Pre- and Post-Enrollment
Pre Post Sig.
Outpatient behavioral health visits
All outpatient mental health services 26.8 21.4 ***
All outpatient substance abuse services 16.1 5.3 ***
Specific outpatient behavioral health services
Methadone maintenance 1.6 1.6 n.s.
Therapy and counseling 16.0 11.2 ***
Medication management 5.1 4.6 †
Other outpatient behavioral health 21.0 10.5 ***
*** p =<0.001, ** p >0.001 & p=< 0.01, *p>0.01 & =<0.05, †p>0.05 & <0.10
Table 36. Predictors of Pre-Enrollment Inpatient Admissions, Inpatient Days, and Emergency Department Visits among RSB Clients
Inpatient Admissions Inpatient Days ED Visits
Unstandardized Coefficients
Unstandardized Coefficients
Unstandardized Coefficients
B Std. Error Sig. B Std. Error Sig. B Std. Error Sig.
(Constant) 0.214 0.263 4.494 4.053 0.425 0.552
Age at Enrollment (in years, mean-centered for SMI population)
-0.011 0.010 -0.171 0.161 -0.031 0.022
Race/Ethnicity
Non-Hispanic white (Ref. category) -- -- -- -- -- --
Non-Hispanic Black (1=yes) -0.174 0.280 -4.972 4.309 -0.159 0.587
Hispanic (1=yes) -0.102 0.334 -4.918 5.146 -0.602 0.701
Multiracial/Other (1=yes) -0.713 0.548 -8.154 8.434 -1.849 1.149
Sex
Male (Ref. category) -- -- -- -- -- --
Female (1=yes) 0.149 0.229 4.921 3.521 0.655 0.480
Comorbidities
Substance use disorder (1=yes) 0.877 0.238 *** 9.030 3.658 * 0.923 0.498 †
HIV+ (1=yes) 0.183 0.249 -1.727 3.838 1.611 0.523 **
Other chronic condition (1=yes) 0.613 0.243 * 5.724 3.747 1.678 0.511 ***
39

MEDICAID REDESIGN TEAM SUPPORTIVE HOUSING EVALUATION:Utilization Report 1
Women in the RSB program appeared to have a greater reduction than men in inpatient days and ED visits following enrollment. Non-Hispanic whites appeared to have a larger reduction in inpatient days and ED visits than their black and Hispanic peers. The decreases for most demographic
subgroups were not statistically significant, however, with the exception of the reduction of inpatient days for women. The only clinical subgroup with a significant pre-post differ-ence was clients with chronic conditions, who experienced significantly fewer inpatient days post-enrollment.
** p >0.001 & p=< 0.01, , †p>0.05 & <0.10
Table 37. Pre- and Post-Enrollment Utilization of Inpatient and Emergency Care by Client Characteristics
Inpatient Days ED Visits Any Inptatient Admissions Any ED Visits
Pre Post Pre Post Pre Post Pre Post
Sex
Male (n=153) 6.5 5.7 1.8 1.7 28% 23% 46% 43%
Female (n=126) 11.0 4.2** 2.6 2.3† 39% 35% 58% 53%
Race/ethnicity
Non-Hispanic white (n=70) 10.6 4.6† 1.9 1.5 27% 27% 37% 31%
Non-Hispanic black (n=136) 8.1 5.8 2.4 2.1 39% 32% 55% 57%
Hispanic (any race) (n=59) 8.0 5.0 2.1 2.4 31% 24% 61% 49%
Multiracial/Other (n=14) 4.7 0.2 0.8 1.0 14% 21% 43% 36%
Comorbidities
Substance use disorder (n=103) 14.2 9.2 2.9 2.9 48% 41% 63% 61%
HIV+ (n=84) 8.4 5.7† 3.5 3.3 39% 29% 46% 43%
Chronic condition (n=158) 11.1 6.6* 2.9 2.7 43% 35% 63% 55%
40

PROGRAM SPECIFIC ANALYSES
There were no client characteristics that significantly predicted the magnitude of pre-post changes among RSB clients.
†p>0.05 & <0.10
Table 38. Predictors of Pre-Post Changes in Inpatient and ED Utilization among RSB Clients
Δ Inpatient Admissions Δ Inpatient Days Δ ED Visits
Unstandardized Coefficients
Unstandardized Coefficients
Unstandardized Coefficients
Model B Std. Error Sig. B Std. Error Sig. B Std. Error Sig.
(Constant) -0.274 0.353 -2.326 3.959 -0.209 0.585
Age at Enrollment (in years, mean- centered for SMI population)
0.012 0.014 0.243 0.157 0.001 0.023
Race/Ethnicity
Non-Hispanic white (Ref. category) -- -- -- -- -- --
Non-Hispanic Black (1=yes) 0.520 0.375 5.134 4.208 0.030 0.622
Hispanic (1=yes) -0.210 0.448 4.184 5.026 0.801 0.743
Multiracial/Other (1=yes) -0.024 0.734 2.219 8.237 0.598 1.217
Sex
Male (Ref. category) -- -- -- -- -- --
Female (1=yes) -0.125 0.306 -5.991 3.439 † -0.187 0.508
Comorbidities
Substance use disorder (1=yes) 0.292 0.318 -3.002 3.572 0.321 0.528
HIV+ (1=yes) 0.220 0.334 2.134 3.749 -0.144 0.554
Other chronic condition (1=yes) -0.063 0.326 -3.500 3.660 -0.286 0.541
Summary. The findings for the RSB program are trending in the right direction, with reductions in
the use of inpatient and emergency department services. These reductions were not significantly
moderated by any demographic or clinical factors. Unexpectedly, however, receipt of outpatient
behavioral health care tended to decrease, although this is clearly not causing greater use of
hospital inpatient and emergency department care. More detailed studies are needed to better
understand the relationship between program enrollment and outcomes.
41

MEDICAID REDESIGN TEAM SUPPORTIVE HOUSING EVALUATION:Utilization Report 1
13 For the purposes of this section, it is assumed that participants in the program by definition have had a SMI diagnosis even if such a primary diagnosis was not identified in the year prior to enrollment.
Office of Mental Health Rental Subsidies – Statewide Persons enrolled in Office of Mental Health Rental Subsi-dies Statewide program (n=335) should all have a history of mental health conditions13. Forty-three percent also had a substance use disorder, and 53% had some other chronic medical condition other than HIV. Eight percent had HIV. Three percent had all four types of conditions, while only 25% had a mental health condition alone, without any of the other types of conditions.
The percentage of enrollees who experienced at least one inpatient hospitalization was 37% following MRT-SH enroll-ment, compared to 48% before (p<0.001). They were also significantly less likely to experience an inpatient hospital-ization for a mental health diagnosis or a substance abuse diagnosis, and spent significantly fewer days in an inpatient setting after their MRT-SH enrollment (11.8 versus 6.5).
This group was also significantly less likely to have at least one ED visit in the months following enrollment (61% versus 69% before enrollment), and had significantly fewer ED visits (3.1 on average, compared to 4.5 prior to enrollment). Spe-cifically, they were less likely to experience an ED visit for a primary SMI diagnosis, and averaged fewer ED visits for SMI.
Enrollees were also significantly less likely to have an in-patient psychiatric stay as defined by rate codes, and less likely to have an inpatient rehabilitation stay for substance abuse.
2%
2%
3%
21%
HIV2%
Figure 15. Overlap Between Types of Chronic Conditions amongOffice of Mental Health - Statewide Rental Subsidy Enrollees
Chronic condition28%
Substance abuse18%
Mental health25%
Note: To obtain total percentage of participants with a given diagnosis, sum all percentages that fall into the relevant circle (but may not exactly match text due to rounding). The “25%” that falls below the “Mental Health” label refers to the proportion of the participants who have no other diagnosis. Circles are not sized proportionately. *** p =<0.001, ** p >0.001 & =< 0.01, *p>0.01 & =<0.05, n.s. = not significant
Table 39. Inpatient and Emergency Department Utilization, Pre- and Post-Enrollment Pre Post Sig.
Inpatient utilization
Any inpatient care 48% 37% ***
Any inpatient mental health 27% 17% ***
Any inpatient substance abuse 12% 6% **
Average number inpatient days 11.8 6.5 ***
Emergency department utilization
Any ED visits 69% 61% **
Any ED visits - mental health 22% 17% *
Any ED visits - substance abuse 9.6% 10% n.s.
Average number of ED visits 4.5 3.1 **
Average number of ED visits - mental health
0.5 0.4 *
Average number of ED visits - substance abuse
0.14 0.16 n.s.
Specific behavioral health services
Any CPEP 5.4% 3.3% n.s.
Any psychiatric inpatient 23% 14% ***
Inpatient rehab 6.3% 1.2% ***
Inpatient detox 0.6% 0.9% n.s.
42
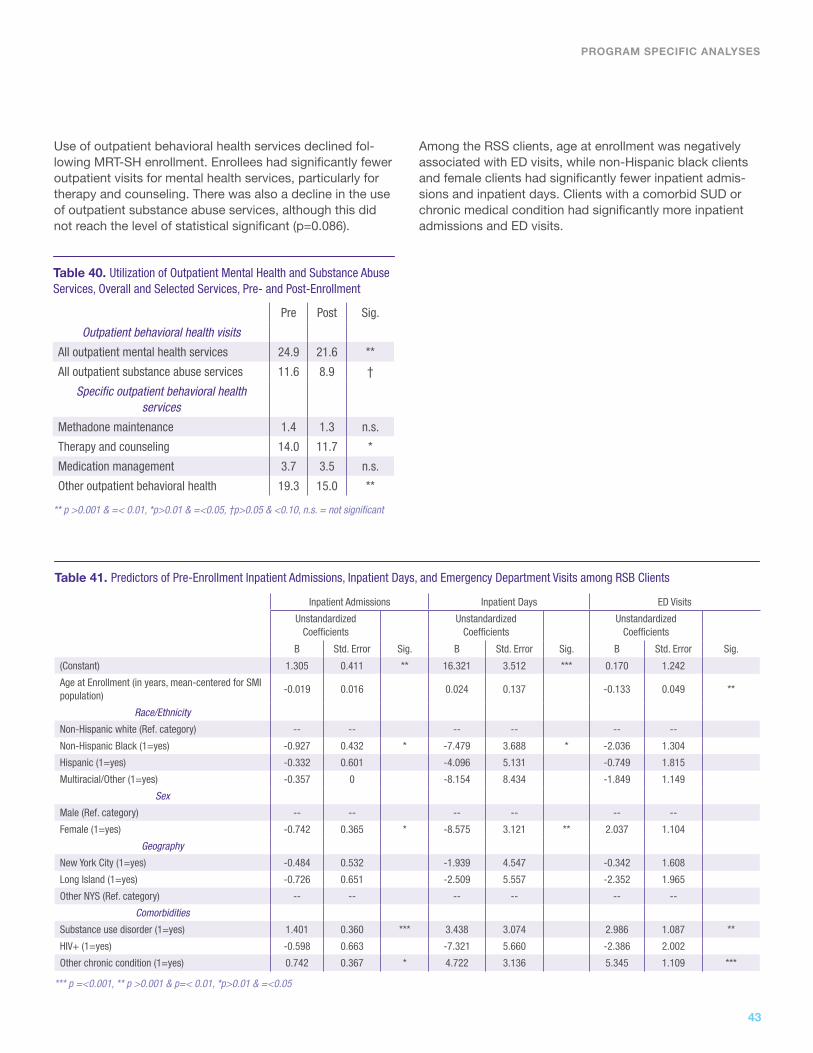
Use of outpatient behavioral health services declined fol-lowing MRT-SH enrollment. Enrollees had significantly fewer outpatient visits for mental health services, particularly for therapy and counseling. There was also a decline in the use of outpatient substance abuse services, although this did not reach the level of statistical significant (p=0.086).
PROGRAM SPECIFIC ANALYSES
Among the RSS clients, age at enrollment was negatively associated with ED visits, while non-Hispanic black clients and female clients had significantly fewer inpatient admis-sions and inpatient days. Clients with a comorbid SUD or chronic medical condition had significantly more inpatient admissions and ED visits.
** p >0.001 & =< 0.01, *p>0.01 & =<0.05, †p>0.05 & <0.10, n.s. = not significant
Table 40. Utilization of Outpatient Mental Health and Substance Abuse Services, Overall and Selected Services, Pre- and Post-Enrollment
Pre Post Sig.
Outpatient behavioral health visits
All outpatient mental health services 24.9 21.6 **
All outpatient substance abuse services 11.6 8.9 †
Specific outpatient behavioral health services
Methadone maintenance 1.4 1.3 n.s.
Therapy and counseling 14.0 11.7 *
Medication management 3.7 3.5 n.s.
Other outpatient behavioral health 19.3 15.0 **
*** p =<0.001, ** p >0.001 & p=< 0.01, *p>0.01 & =<0.05
Table 41. Predictors of Pre-Enrollment Inpatient Admissions, Inpatient Days, and Emergency Department Visits among RSB Clients
Inpatient Admissions Inpatient Days ED Visits
Unstandardized Coefficients
Unstandardized Coefficients
Unstandardized Coefficients
B Std. Error Sig. B Std. Error Sig. B Std. Error Sig.
(Constant) 1.305 0.411 ** 16.321 3.512 *** 0.170 1.242
Age at Enrollment (in years, mean-centered for SMI population)
-0.019 0.016 0.024 0.137 -0.133 0.049 **
Race/Ethnicity
Non-Hispanic white (Ref. category) -- -- -- -- -- --
Non-Hispanic Black (1=yes) -0.927 0.432 * -7.479 3.688 * -2.036 1.304
Hispanic (1=yes) -0.332 0.601 -4.096 5.131 -0.749 1.815
Multiracial/Other (1=yes) -0.357 0 -8.154 8.434 -1.849 1.149
Sex
Male (Ref. category) -- -- -- -- -- --
Female (1=yes) -0.742 0.365 * -8.575 3.121 ** 2.037 1.104
Geography
New York City (1=yes) -0.484 0.532 -1.939 4.547 -0.342 1.608
Long Island (1=yes) -0.726 0.651 -2.509 5.557 -2.352 1.965
Other NYS (Ref. category) -- -- -- -- -- --
Comorbidities
Substance use disorder (1=yes) 1.401 0.360 *** 3.438 3.074 2.986 1.087 **
HIV+ (1=yes) -0.598 0.663 -7.321 5.660 -2.386 2.002
Other chronic condition (1=yes) 0.742 0.367 * 4.722 3.136 5.345 1.109 ***
43

MEDICAID REDESIGN TEAM SUPPORTIVE HOUSING EVALUATION:Utilization Report 1
Both men and women experienced statistically significant reductions in almost all the metrics of inpatient and ED use, but men appeared to generally have the larger decrease (with the exception of ED visits, where a larger, but not sta-tistically significant, decrease was observed for women).
Except for the very small number of multiracial clients, all ra-cial/ethnic groups experienced a statistically significant de-crease in inpatient days, with the largest absolute decrease observed among non-Hispanic white and the smallest observed among non-Hispanic blacks. Black and Hispanic clients experienced a statistically significant decrease in ED visits, while non-Hispanic white clients did not. (Nor did multiracial clients, but this was likely due to the very small number of clients.) Non-Hispanic black clients were the only
racial/ethnic subgroup to show a statistically significant decrease in the percentage with any inpatient stays or any ED visits.
Clients who lived outside of New York City and Long Island had significant decreases in all the metrics, while clients in New York City only had a statistically significant decrease in ED visits, but this may be more of a reflection of the much larger number of clients in RSS who lived upstate, rather than a larger effect for these clients.
Statistically significant decreases in all metrics were ob-served for clients with a comorbid SUD or chronic medical condition, but not for clients with HIV.
*** p =<0.001, ** p >0.001 & p=< 0.01, *p>0.01 & =<0.05, †p>0.05 & <0.10
Table 42. Pre- and Post-Enrollment Utilization of Inpatient and Emergency Care by Client Characteristics
Inpatient Days ED Visits Any Inptatient Admissions Any ED Visits
Pre Post Pre Post Pre Post Pre Post
Sex
Male (n=157) 16.0 6.4** 3.2 2.4** 49% 36%** 65% 52%
Female (n=178) 8.1 6.5* 5.6 3.8† 48% 39%* 72% 68%**
Race/ethnicity
Non-Hispanic white (n=197) 14.0 8.1*** 5.2 3.6 49% 43% 70% 64%
Non-Hispanic black (n=88) 8.3 4.2** 3.1 2.6* 49% 32%** 70% 56%*
Hispanic (any race) (n=38) 10.3 4.9* 4.6 2.4** 45% 29% 66% 58%
Multiracial/Other (n=12) 7.2 2.0 1.8 1.1 42% 17% 50% 50%
Geography
New York City (n=53) 10.5 5.7 3.4 2.4* 36% 28% 66% 49%†
Long Island (n=29) 9.8 7.0 1.9 1.4 31% 21% 24% 34%
Other NYS (n=253) 12.3 6.6*** 5.1 3.6* 53% 41%** 74% 66%*
Comorbidities
Substance use disorder (n=144) 14.1 8.8*** 6.3 4.3** 59% 46%** 82% 67%***
HIV+ (n=26) 4.8 3.5 3.2 2.8 50% 31%† 73% 65%
Chronic condition (n=177) 13.7 7.0** 6.4 4.3* 55% 45%* 76% 67%*
44
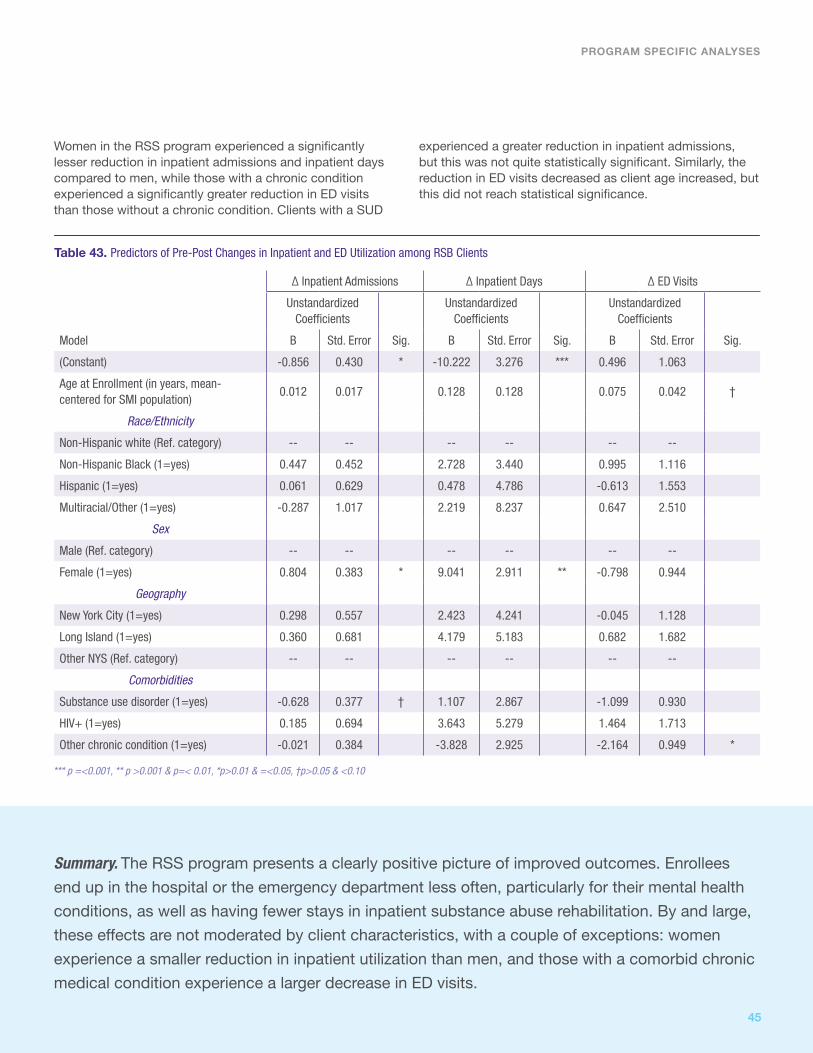
PROGRAM SPECIFIC ANALYSES
Women in the RSS program experienced a significantly lesser reduction in inpatient admissions and inpatient days compared to men, while those with a chronic condition experienced a significantly greater reduction in ED visits than those without a chronic condition. Clients with a SUD
experienced a greater reduction in inpatient admissions, but this was not quite statistically significant. Similarly, the reduction in ED visits decreased as client age increased, but this did not reach statistical significance.
Table 43. Predictors of Pre-Post Changes in Inpatient and ED Utilization among RSB Clients
Δ Inpatient Admissions Δ Inpatient Days Δ ED Visits
Unstandardized Coefficients
Unstandardized Coefficients
Unstandardized Coefficients
Model B Std. Error Sig. B Std. Error Sig. B Std. Error Sig.
(Constant) -0.856 0.430 * -10.222 3.276 *** 0.496 1.063
Age at Enrollment (in years, mean- centered for SMI population)
0.012 0.017 0.128 0.128 0.075 0.042 †
Race/Ethnicity
Non-Hispanic white (Ref. category) -- -- -- -- -- --
Non-Hispanic Black (1=yes) 0.447 0.452 2.728 3.440 0.995 1.116
Hispanic (1=yes) 0.061 0.629 0.478 4.786 -0.613 1.553
Multiracial/Other (1=yes) -0.287 1.017 2.219 8.237 0.647 2.510
Sex
Male (Ref. category) -- -- -- -- -- --
Female (1=yes) 0.804 0.383 * 9.041 2.911 ** -0.798 0.944
Geography
New York City (1=yes) 0.298 0.557 2.423 4.241 -0.045 1.128
Long Island (1=yes) 0.360 0.681 4.179 5.183 0.682 1.682
Other NYS (Ref. category) -- -- -- -- -- --
Comorbidities
Substance use disorder (1=yes) -0.628 0.377 † 1.107 2.867 -1.099 0.930
HIV+ (1=yes) 0.185 0.694 3.643 5.279 1.464 1.713
Other chronic condition (1=yes) -0.021 0.384 -3.828 2.925 -2.164 0.949 *
*** p =<0.001, ** p >0.001 & p=< 0.01, *p>0.01 & =<0.05, †p>0.05 & <0.10
Summary. The RSS program presents a clearly positive picture of improved outcomes. Enrollees
end up in the hospital or the emergency department less often, particularly for their mental health
conditions, as well as having fewer stays in inpatient substance abuse rehabilitation. By and large,
these effects are not moderated by client characteristics, with a couple of exceptions: women
experience a smaller reduction in inpatient utilization than men, and those with a comorbid chronic
medical condition experience a larger decrease in ED visits.
45

MEDICAID REDESIGN TEAM SUPPORTIVE HOUSING EVALUATION:Utilization Report 1
OPWDD Expansion Program This program serves persons with developmental disabili-ties (n=51), most of which fall under the ICD-9 category of mental disorders. However, 61% additionally have an active SMI diagnosis. Forty-one percent of this population has a chronic medical condition, and 10% have a substance use disorder. None have HIV. Four percent have a mental health diagnosis, a substance use disorder, and a chronic medical condition in addition to their developmental disability. Only 29% do not have any of these conditions.
Differences in the utilization of inpatient and emergen-cy department services from the pre-enrollment to the post-enrollment periods were minimal for the enrollees in this program. Enrollees were more likely to have at least one inpatient stay or at least one emergency department visit during the post-enrollment period, but this was not sta-tistically significant.
Enrollees in the OPWDD program received fewer outpatient mental health services overall after enrollment, but this was not statistically significant. In particular, they had fewer visits for medication management.2%
29%
4%
2%
Mental Health26%
Figure 16. Overlap Between Types of Chronic Conditions among Office for Persons with Developmental Disabilities Expansion Program Enrollees
Chronic condition6%
Substance abuse2%
Note: 29% of enrollees had none of these primary diagnoses during the observed period
Note: To obtain total percentage of participants with a given diagnosis, sum all percentages that fall into the relevant circle (but may not exactly match text due to rounding). Circles are not sized proportionately.
n.s. = not significant
Table 44. Inpatient and Emergency Department Utilization, Pre- and Post-Enrollment Pre Post Sig.
Inpatient utilization
Any inpatient care 6% 16% n.s.
Any inpatient mental health 2% 6% n.s.
Any inpatient substance abuse 0% 0% --
Average number inpatient days 0.5 0.8 n.s.
Emergency department utilization
Any ED visits 24% 26% n.s.
Any ED visits - mental health 2% 6% n.s.
Average number of ED visits 0.6 0.7 n.s.
Average number of ED visits - mental health
0.02 0.00 n.s.
Average number of ED visits - mental health
0.23 0.25 n.s.
†p>0.05 & <0.10, n.s. = not significant
Table 45. Utilization of Outpatient Mental Health and Substance Abuse Services, Overall and Selected Services, Pre- and Post-Enrollment
Pre Post Sig.
Outpatient behavioral health visits
All outpatient mental health services 8.5 7.0 n.s.
All outpatient substance abuse services 0.14 0.10 n.s.
Specific outpatient behavioral health services
Methadone maintenance 0 0 --
Therapy and counseling 6.3 4.5 n.s.
Medication management 1.5 1.1 †
Other outpatient behavioral health 0.9 1.5 †
Summary. There are no significant findings for the OPWDD Expansion population. The current findings do not present a clear and consistent picture. The percentage of clients with at least one inpatient stay increased following enrollment, but this result was not statistically significant and there was little difference in the average number of inpatient days. The use of overall outpatient mental health and substance abuse services decreases very slightly. Visits for medication management for behavioral health conditions show a decrease that approaches statistical significance (p=0.081), while the use of outpatient behavioral health care other than therapy and counseling and medication management increased slightly (also only trending towards significance, [p=0.097]). The small number of clients enrolled in this program to date may be contributing to the lack of statistical significance.
46

Eviction Prevention for Vulnerable AdultsMore than half (51%) of the enrollees in this program (n=192) have a chronic medical condition other than behav-ioral health or HIV, while 44% have a mental health diagno-sis, 19% have a substance abuse disorder, and 12% have HIV. Twenty-two percent did not have a Medicaid claim for a diagnosis in one of these categories in the 12 months prior to MRT-SH enrollment.
The percentage of enrollees who experienced at least one inpatient hospitalization decreased slightly from 24% to 22%, but this difference was not statistically significant. The average number of inpatient days also declined, from 3.4 to 2.1, but also was not statistically significant. There were very small numbers of inpatient hospitalizations for mental health or substance abuse.
The percentage with at least one emergency department visit also decreased, from 51% to 40%, which was statisti-cally significant (p=0.006). Numbers of emergency depart-ment visits for mental health or substance abuse were very small for this population.
Enrollees in the Eviction Prevention for Vulnerable Adults program received significantly fewer outpatient substance abuse services after enrollment, in particular, fewer visits for methadone maintenance (although the latter was not statistically significant).
PROGRAM SPECIFIC ANALYSES
** p >0.001 & =< 0.01, n.s. = not significant
Table 46. Inpatient and Emergency Department Utilization, Pre- and Post-Enrollment Pre Post Sig.
Inpatient utilization
Any inpatient care 24% 22% n.s.
Any inpatient mental health 2.1% 1.0% n.s.
Any inpatient substance abuse 0.5% 1.0% n.s.
Average number inpatient days 3.4 2.1 n.s.
Emergency department utilization
Any ED visits 51% 40% **
Any ED visits - mental health 2.6% 1.6% n.s.
Any ED visits - substance abuse 1.6% 2.1% n.s.
Average number of ED visits 2.0 1.7 n.s.
*p>0.01 & =<0.05, †p>0.05 & <0.10, n.s. = not significant
Table 47. Utilization of Outpatient Mental Health and Substance Abuse Services, Overall and Selected Services, Pre- and Post-Enrollment
Pre Post Sig.
Outpatient behavioral health visits
All outpatient mental health services 4.9 4.7 n.s.
All outpatient substance abuse services 7.0 4.5 *
Specific outpatient behavioral health services
Methadone maintenance 4.8 3.5 †
Therapy and counseling 3.2 2.5 n.s.
Medication management 1.4 1.1 n.s.
Other outpatient behavioral health 2.0 1.7 †
Figure 17. Overlap Between Types of Chronic Conditions amongEviction Prevention for Vulnerable Adults Enrollees
Note: Not shown are SUD + chronic condition (4.2%), SMI + HIV (1.0%) and none (22%).
Note: To obtain total percentage of participants with a given diagnosis, sum all percent-ages that fall into the relevant circle (but may not exactly match text due to rounding). Circles are not sized proportionately.
HIV2%
2%3% 1%
4%
5%12%
3%
3%
1%
Mental health17%
Substance abuse3%
Chronicconditions
22%
47

MEDICAID REDESIGN TEAM SUPPORTIVE HOUSING EVALUATION:Utilization Report 1
Among EPVA clients, older age was associated with fewer inpatient admissions and ED visits in the pre-enrollment period (although only the latter was statistically significant). Having a chronic medical condition was associated with sig-nificantly fewer inpatient admissions, and also with fewer ED visits (not statistically significant).
Few subgroups of EPVA clients experienced any statistically significant decrease in inpatient or emergency care. Women and Hispanic clients were significantly less likely to have any ED visits post-enrollment.
*** p =<0.001, ** p >0.001 & p=< 0.01, *p>0.01 & =<0.05, †p>0.05 & <0.10
Table 48. Predictors of Pre-Enrollment Inpatient Admissions, Inpatient Days, and Emergency Department Visits among EPVA Clients
Inpatient Admissions Inpatient Days ED Visits
Unstandardized Coefficients
Unstandardized Coefficients
Unstandardized Coefficients
B Std. Error Sig. B Std. Error Sig. B Std. Error Sig.
(Constant) -0.018 1.415 0.729 8.821 0.994 3.410
Age at Enrollment (in years, mean- centered for SMI population)
-0.041 0.022 † -0.212 0.137 -0.129 0.053 *
Race/EthnicityNon-Hispanic white (Ref. category) -- -- -- -- -- --
Non-Hispanic Black (1=yes) -0.298 1.250 -3.724 7.793 -0.601 3.012
Hispanic (1=yes) 0.336 1.260 1.119 7.857 0.963 3.037
Multiracial/Other (1=yes) -0.862 1.593 -4.434 9.935 -1.684 3.840
SexMale (Ref. category) -- -- -- -- -- --
Female (1=yes) 0.056 0.652 1.483 4.069 -0.535 1.573
ComorbiditiesSevere mental illness (1=yes) 0.556 0.561 2.380 3.501 1.486 1.353
Substance use disorder (1=yes) -0.316 0.706 -0.270 4.402 -1.027 1.701
HIV+ (1=yes) -0.389 0.835 -3.058 5.208 -0.573 2.013
Other chronic condition (1=yes) 1.200 0.546 * 5.566 3.408 2.366 1.317 †
*p>0.01 & =<0.05, †p>0.05 & <0.10
Table 49. Pre- and Post-Enrollment Utilization of Inpatient and Emergency Care by Client Characteristics
Inpatient Days ED Visits Any Inptatient Admissions Any ED Visits
Pre Post Pre Post Pre Post Pre Post
Sex
Male (n=50) 0.8 0.9 1.5 1.2 24% 14% 50% 38%
Female (n=142) 4.2 2.5 2.2 1.9 24% 25% 51% 40%*
Race/ethnicityNon-Hispanic white (n=10) 4.0 3.3 0.9 1.1 20% 30% 60% 40%
Non-Hispanic black (n=97) 1.2 1.2 1.4 1.4 26% 19% 48% 39%
Hispanic (any race) (n=73) 6.3 3.2 3.1 2.3† 23% 26% 55% 40%*
Multiracial/Other (n=12) 2.1 1.0 0.9 1.4 17% 25% 42% 42%
ComorbiditiesSevere mental illness (n=84) 5.5 1.8 3.3 2.5 29% 25% 54% 43%
Substance use disorder (n=36) 2.2 2.2 1.0 1.4 22% 17% 53% 44%
HIV+ (n=23) 1.3 2.5 2.0 1.6† 30% 39% 52% 52%
Chronic condition (n=97) 5.3 3.6 2.8 2.2† 34% 29% 49% 40%
48
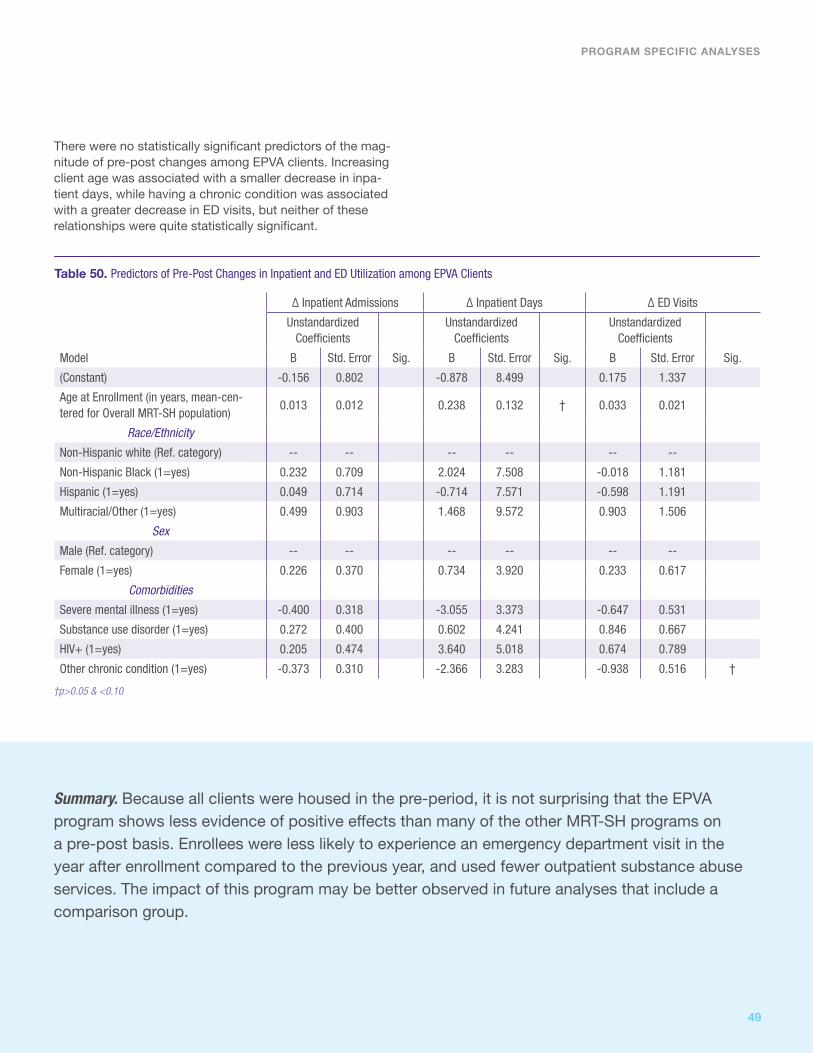
There were no statistically significant predictors of the mag-nitude of pre-post changes among EPVA clients. Increasing client age was associated with a smaller decrease in inpa-tient days, while having a chronic condition was associated with a greater decrease in ED visits, but neither of these relationships were quite statistically significant.
PROGRAM SPECIFIC ANALYSES
†p>0.05 & <0.10
Table 50. Predictors of Pre-Post Changes in Inpatient and ED Utilization among EPVA Clients
Δ Inpatient Admissions Δ Inpatient Days Δ ED Visits
Unstandardized Coefficients
Unstandardized Coefficients
Unstandardized Coefficients
Model B Std. Error Sig. B Std. Error Sig. B Std. Error Sig.
(Constant) -0.156 0.802 -0.878 8.499 0.175 1.337
Age at Enrollment (in years, mean-cen-tered for Overall MRT-SH population)
0.013 0.012 0.238 0.132 † 0.033 0.021
Race/Ethnicity
Non-Hispanic white (Ref. category) -- -- -- -- -- --
Non-Hispanic Black (1=yes) 0.232 0.709 2.024 7.508 -0.018 1.181
Hispanic (1=yes) 0.049 0.714 -0.714 7.571 -0.598 1.191
Multiracial/Other (1=yes) 0.499 0.903 1.468 9.572 0.903 1.506
Sex
Male (Ref. category) -- -- -- -- -- --
Female (1=yes) 0.226 0.370 0.734 3.920 0.233 0.617
Comorbidities
Severe mental illness (1=yes) -0.400 0.318 -3.055 3.373 -0.647 0.531
Substance use disorder (1=yes) 0.272 0.400 0.602 4.241 0.846 0.667
HIV+ (1=yes) 0.205 0.474 3.640 5.018 0.674 0.789
Other chronic condition (1=yes) -0.373 0.310 -2.366 3.283 -0.938 0.516 †
Summary. Because all clients were housed in the pre-period, it is not surprising that the EPVA program shows less evidence of positive effects than many of the other MRT-SH programs on a pre-post basis. Enrollees were less likely to experience an emergency department visit in the year after enrollment compared to the previous year, and used fewer outpatient substance abuse services. The impact of this program may be better observed in future analyses that include a comparison group.
49
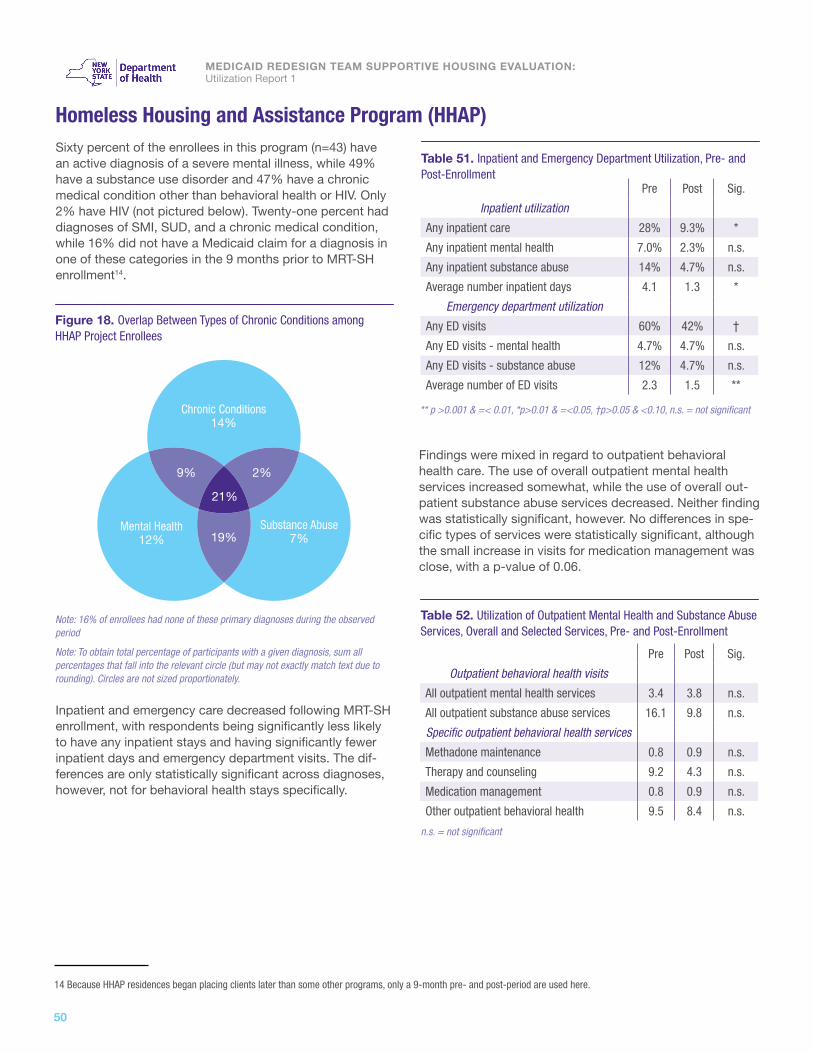
MEDICAID REDESIGN TEAM SUPPORTIVE HOUSING EVALUATION:Utilization Report 1
14 Because HHAP residences began placing clients later than some other programs, only a 9-month pre- and post-period are used here.
Homeless Housing and Assistance Program (HHAP) Sixty percent of the enrollees in this program (n=43) have an active diagnosis of a severe mental illness, while 49% have a substance use disorder and 47% have a chronic medical condition other than behavioral health or HIV. Only 2% have HIV (not pictured below). Twenty-one percent had diagnoses of SMI, SUD, and a chronic medical condition, while 16% did not have a Medicaid claim for a diagnosis in one of these categories in the 9 months prior to MRT-SH enrollment14.
Inpatient and emergency care decreased following MRT-SH enrollment, with respondents being significantly less likely to have any inpatient stays and having significantly fewer inpatient days and emergency department visits. The dif-ferences are only statistically significant across diagnoses, however, not for behavioral health stays specifically.
Findings were mixed in regard to outpatient behavioral health care. The use of overall outpatient mental health services increased somewhat, while the use of overall out-patient substance abuse services decreased. Neither finding was statistically significant, however. No differences in spe-cific types of services were statistically significant, although the small increase in visits for medication management was close, with a p-value of 0.06.
19%
9%
21%
2%
Mental Health12%
Figure 18. Overlap Between Types of Chronic Conditions amongHHAP Project Enrollees
Chronic Conditions14%
Substance Abuse7%
Note: 16% of enrollees had none of these primary diagnoses during the observed period
Note: To obtain total percentage of participants with a given diagnosis, sum all percentages that fall into the relevant circle (but may not exactly match text due to rounding). Circles are not sized proportionately.
** p >0.001 & =< 0.01, *p>0.01 & =<0.05, †p>0.05 & <0.10, n.s. = not significant
Table 51. Inpatient and Emergency Department Utilization, Pre- and Post-Enrollment Pre Post Sig.
Inpatient utilization
Any inpatient care 28% 9.3% *
Any inpatient mental health 7.0% 2.3% n.s.
Any inpatient substance abuse 14% 4.7% n.s.
Average number inpatient days 4.1 1.3 *
Emergency department utilization
Any ED visits 60% 42% †
Any ED visits - mental health 4.7% 4.7% n.s.
Any ED visits - substance abuse 12% 4.7% n.s.
Average number of ED visits 2.3 1.5 **
n.s. = not significant
Table 52. Utilization of Outpatient Mental Health and Substance Abuse Services, Overall and Selected Services, Pre- and Post-Enrollment
Pre Post Sig.
Outpatient behavioral health visits
All outpatient mental health services 3.4 3.8 n.s.
All outpatient substance abuse services 16.1 9.8 n.s.
Specific outpatient behavioral health services
Methadone maintenance 0.8 0.9 n.s.
Therapy and counseling 9.2 4.3 n.s.
Medication management 0.8 0.9 n.s.
Other outpatient behavioral health 9.5 8.4 n.s.
50

15 Because OTDA Homeless Senior and Disabled Placement Pilot began enrolling clients later than some other programs, only a 6-month pre- and post-period are used here.
OTDA Homeless Senior and Disabled Placement Pilot (New York City)More than two-thirds (73%) of the enrollees in this program (n=30) have a chronic medical condition (other than be-havioral health or HIV), while 43% have HIV. Thirty-seven percent have an active diagnosis of a severe mental illness, and 30% have a substance use disorder. Seven percent had all four types of diagnoses, while 13% did not have a Medicaid claim for a diagnosis in one of these categories in the 6 months prior to MRT-SH enrollment15.
While inpatient utilization appeared to rise for these clients following the MRT-SH enrollment, the differences were not statistically significant. Emergency department use de-clined sharply, and while these differences were not quite statistically significant, they were close to being so.
Similarly, the use of outpatient behavioral health services declined after MRT-SH enrollment, but none of these changes were statistically significant.
PROGRAM SPECIFIC ANALYSES
†p>0.05 & <0.10, n.s. = not significant
Table 59. Inpatient and Emergency Department Utilization, Pre- and Post-Enrollment Pre Post Sig.
Inpatient utilization
Any inpatient care 37% 40% n.s.
Any inpatient mental health 7% 10% n.s.
Any inpatient substance abuse 0% 0% --
Average number inpatient days 2.6 4.0 n.s.
Emergency department utilization
Any ED visits 57% 33% †
Any ED visits - mental health 3% 7% n.s.
Any ED visits - substance abuse 0% 0% --
Average number of ED visits 1.3 0.7 †
†p>0.05 & <0.10, n.s. = not significant
Table 60. Utilization of Outpatient Mental Health and Substance Abuse Services, Overall and Selected Services, Pre- and Post-Enrollment
Pre Post Sig.
Outpatient behavioral health visits
All outpatient mental health services 5.1 2.6 n.s.
All outpatient substance abuse services 3.4 3.3 n.s.
Specific outpatient behavioral health services
Methadone maintenance 2.0 2.4 n.s.
Therapy and counseling 1.2 0.7 †
Medication management 0.4 0.6 n.s.
Other outpatient behavioral health 5.0 2.3 n.s.
Figure 19. Overlap Between Types of Chronic Conditions amongOTDA Homeless Senior and Disabled Placement Pilot Enrollees
Note: Not shown are SMI+HIV (3%), chronic conditions + SUD (13%), and none (13%)
Note: To obtain total percentage of participants with a given diagnosis, sum all percent-ages that fall into the relevant circle (sum may not exactly match text due to rounding). Circles are not sized proportionately.
HIV7%
7%7% 0%
0%
7%13%
17%
0%
3%
Mental health0%
Substance abuse0%
Chronicconditions
10%
Summary. The early view of the OTDA Homeless Senior and Disabled Pilot Program shows possible increases in inpatient utilization along with decreases in emergency department utilization, primary care, and outpatient behavioral health services. These findings are particularly limited, however, by the fact that the pre- and post-periods were only 6 months in duration and that only 30 cases were available for the analyses. A much clearer picture of this program is likely to emerge going forward.
51

MEDICAID REDESIGN TEAM SUPPORTIVE HOUSING EVALUATION:Utilization Report 1
ANALYSES BY DIAGNOSTIC GROUPS
MEDICAID REDESIGN TEAM SUPPORTIVE HOUSING EVALUATION:
Utilization Report 1
Outcomes for the SMI Population ................................................................... 49Outcomes for the SUD Population .................................................................. 54HIV Population ................................................................................................ 59Chronic Conditions Population ........................................................................ 62
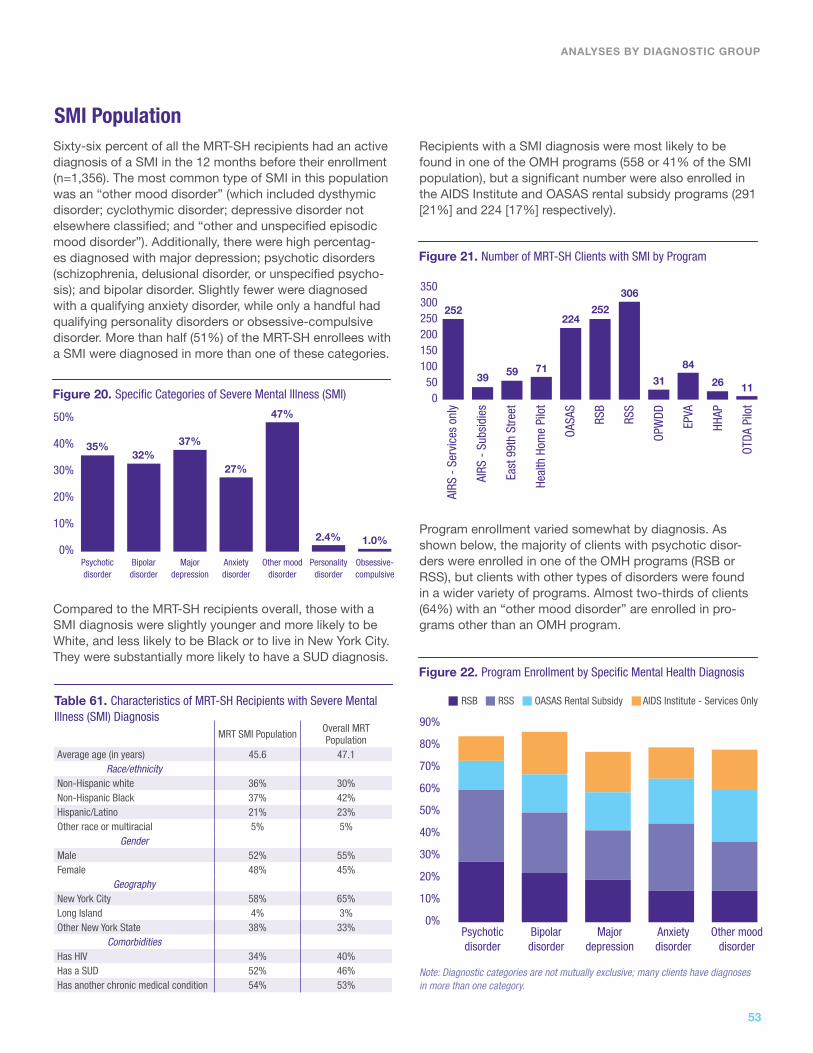
Sixty-six percent of all the MRT-SH recipients had an active diagnosis of a SMI in the 12 months before their enrollment (n=1,356). The most common type of SMI in this population was an “other mood disorder” (which included dysthymic disorder; cyclothymic disorder; depressive disorder not elsewhere classified; and “other and unspecified episodic mood disorder”). Additionally, there were high percentag-es diagnosed with major depression; psychotic disorders (schizophrenia, delusional disorder, or unspecified psycho-sis); and bipolar disorder. Slightly fewer were diagnosed with a qualifying anxiety disorder, while only a handful had qualifying personality disorders or obsessive-compulsive disorder. More than half (51%) of the MRT-SH enrollees with a SMI were diagnosed in more than one of these categories.
Compared to the MRT-SH recipients overall, those with a SMI diagnosis were slightly younger and more likely to be White, and less likely to be Black or to live in New York City. They were substantially more likely to have a SUD diagnosis.
SMI PopulationRecipients with a SMI diagnosis were most likely to be found in one of the OMH programs (558 or 41% of the SMI population), but a significant number were also enrolled in the AIDS Institute and OASAS rental subsidy programs (291 [21%] and 224 [17%] respectively).
Program enrollment varied somewhat by diagnosis. As shown below, the majority of clients with psychotic disor-ders were enrolled in one of the OMH programs (RSB or RSS), but clients with other types of disorders were found in a wider variety of programs. Almost two-thirds of clients (64%) with an “other mood disorder” are enrolled in pro-grams other than an OMH program.
ANALYSES BY DIAGNOSTIC GROUP
Figure 20. Specific Categories of Severe Mental Illness (SMI)
50%
40%
30%
20%
10%
0%Psychoticdisorder
Bipolar disorder
Major depression
Psychotic disorder
Anxietydisorder
Bipolardisorder
Other mood disorder
Major depression
Personalitydisorder
Anxiety disorder
Obsessive-compulsive
Other mooddisorder
35%32%
37%
27%
47%
2.4% 1.0%
Table 61. Characteristics of MRT-SH Recipients with Severe Mental Illness (SMI) Diagnosis
MRT SMI Population Overall MRT Population
Average age (in years) 45.6 47.1Race/ethnicity
Non-Hispanic white 36% 30%Non-Hispanic Black 37% 42%Hispanic/Latino 21% 23%Other race or multiracial 5% 5%
GenderMale 52% 55%Female 48% 45%
GeographyNew York City 58% 65%Long Island 4% 3%Other New York State 38% 33%
ComorbiditiesHas HIV 34% 40%Has a SUD 52% 46%Has another chronic medical condition 54% 53%
Figure 21. Number of MRT-SH Clients with SMI by Program
Figure 22. Program Enrollment by Specific Mental Health Diagnosis
350300250200150100
500
90%
80%
70%
60%
50%
40%
30%
20%
10%
0%
AIRS
- S
ervi
ces
only
AIRS
- S
ubsi
dies
East
99t
h St
reet
Heal
th H
ome
Pilo
t
OASA
S
RSB
RSS
OPW
DD
EPVA
HHAP
OTDA
Pilo
t
252
39 59 71
224252
306
31
84
26 11
Note: Diagnostic categories are not mutually exclusive; many clients have diagnoses in more than one category.
RSB RSS OASAS Rental Subsidy AIDS Institute - Services Only
53

MEDICAID REDESIGN TEAM SUPPORTIVE HOUSING EVALUATION:Utilization Report 1
The table above shows the percentage of all clients (not just those with SMI) enrolled in each program that has each cat-egory of diagnosis. This gives a very different picture of the impact of these disorders on each program. For example, while only 3% of MRT-SH clients with a psychotic disorder are found in the HHAP program (not shown), 28% of HHAP clients have a diagnosed psychotic disorder (Table 62). For most programs other than the OMH programs, other mood disorders are the most heavily represented SMI diagnosis in their client population. (East 99th, HHAP, and OTDA Home-less Senior and Disabled Pilot Program are exceptions, with major depression most common in East 99th Street, anxiety disorders most common in OTDA Homeless Senior and Disabled Pilot and psychotic disorders most common in HHAP.)
While most programs showed a reduction in overall inpa-tient days (not just inpatient stays related to behavioral health) among their clients with SMI (except for AIDS Insti-tute “subsidies and services,” OPWDD and OTDA Home-less Senior and Disabled Placement Pilot), the relationship was clearly more robust in some programs than in others (Table 63). The AIDS Institute “services only”, OASAS-RS, RSB, RSS, and Health Home Pilot programs in particular seemed to reduce inpatient days among clients with SMI.
When looking at the percent of clients with SMI who had at least one emergency room visit for a primary diagnosis of SMI, there were similar levels of variation. The clients most likely to have one or more ED visits in the year prior to en-rollment were those in the OASAS-RS and OMH Statewide rental subsidy programs. While most programs did experi-ence a reduction in the percentage of their clients who had an ED visit for SMI, this was only statistically significant for the AIDS Institute “services only” program, OASAS-RS, and
RSS (although the p-values for HHSP, RSB, and EPVA were close to statistical significance). It should also be noted that the HHSP, HHAP, and OTDA Homeless Senior and Disabled Placement Pilot programs had a shorter pre- and post-pe-riod than the other programs, which may account for their lower numbers overall.
Table 62. Specific Mental Health Diagnoses by Program Enrollment (All Clients)
Table 63. Average Overall Inpatient Days and Percent with >=1 Emergency Visits for SMI among the SMI Population by Program, Pre- and Post-Enrollment
Program % Any SMI Psychotic Disorder Bipolar Disorder Major Depression Other Mood Disorder Anxiety Disorder
AIDS Institute “Services Only” 48% 10% 16% 17% 22% 11%
AIDS Institute “Subsidies and Services” 53% 12% 9% 22% 28% 22%
East 99th Street 43% 13% 7% 27% 18% 9%
Health Home Pilot 65% 14% 17% 24% 35% 15%
OASAS Rental Subsidies and Supports 75% 20% 26% 29% 49% 26%
OMH Rental Subsidies: Brooklyn 100% 47% 34% 33% 31% 19%
OMH Rental Subsidies: Statewide 100% 45% 36% 32% 42% 36%
OPWDD Expansion of Existing Rental/Services 61% 18% 8% 2% 37% 16%
Eviction Prevention for Vulnerable Adults 44% 8% 12% 19% 20% 11%
HHAP Capital Programs 60% 28% 7% 5% 21% 19%
OTDA NYC Disability Housing Subsidy Pilot 37% 7% 4% 11% 7% 14%
All MRT-SH Programs 66% 23% 21% 24% 31% 19%
# Inpatient Days – for any reason
% with Emergency Visits – for SMI
Pre Post Sig. Pre Post Sig.
AIDS Institute –
Services only10.9 8.1 ** 8.7% 4.8% *
AIDS Institute –
Services + Subsidy6.6 6.8 n.s. 21% 13% n.s.
East 99th 4.5 3.0 n.s. 3% 3% n.s.
Health Home Pilot 8.4 4.4 ** 10% 4.1% †
OASAS Rental
Subsidies24.7 11.6 *** 29% 18% **
OMH Rental - Brooklyn 9.1 5.1 * 14% 9.1% †
OMH Rental -
Statewide12.8 7.1 *** 25% 18% *
OPWDD 0.7 1.0 n.s. 3.0% 0% n.s.
OTDA Eviction
Prevention5.5 1.8 n.s. 6.0% 0% †
Homeless Housing
Program6.5 1.8 † 7.7% 7.7% n.s.
OTDA Pilot 3.8 4.6 n.s. 9.1% 18% n.s.
Note: Diagnostic categories are not mutually exclusive; many clients have diagnoses in more than one category.
*** p =<0.001, ** p >0.001 & =< 0.01, *p>0.01 & =<0.05, †p>0.05 & <0.10, n.s. = not significant
54

The results were less striking when looking at mental-health specific metrics, like the percentage of clients who used CPEP services or had at least one psychiatric hospitaliza-tion. The pattern for CPEP was not clear across programs, with some experiencing increases and others decreases in the percentage of their SMI clients who used CPEP ser-vices. None of these changes were statistically significant. The percent of clients with a SMI who had at least one psychiatric hospitalization decreased among almost all programs (except for AIDS Institute “services only”, OP-WDD and OTDA NYC Senior Disabled Housing), but these decrease were only statistically significant for the AIDS Insti-tute “services only” program, OASAS-RS, and RSS.
Overall, inpatient services were used most intensively by clients with psychotic disorders, bipolar disorders, or other mood disorders, and these diagnostic groups also had the highest rate of any psychiatric hospitalization during the pre-period. All diagnostic groups showed statistically signif-icant decreases in the average number of inpatient admis-sions and inpatient days, and in the percentage with at least one psychiatric hospital stay.
In contrast, clients with an anxiety disorder used emergen-cy department services most intensively, although those with a psychotic disorder were most likely to receive CPEP services. Once again, all diagnostic groups had statistically significant decreases in both ED visits overall and ED visits for a primary SMI diagnosis. None of the groups had statis-tically significant changes in the use of CPEP services.
There are a few interesting observations when examining the types of procedures billed for clients with a SMI before and after MRT-SH enrollment (especially when compared to the other diagnostic groups [see Tables 76, 81, and 87]). Most types of services went down post-enrollment. How-ever, genitourinary system procedures went up 44% and gastrointestinal system procedures went up 22% (these procedures increased across all the diagnostic groups, not just SMI). Also, otolaryngologic system procedures decreased slightly for clients with SMI, but increased for the other diagnostic groups. Finally, neurologic procedures decreased slightly for clients with SMI as well as clients with chronic medical conditions, while increasing for clients with a SUD [Table 76] or with HIV [Table 81].
ANALYSES BY DIAGNOSTIC GROUP
Table 64. CPEP and Psychiatric Inpatient Stays among the SMI Population by Program, Pre- and Post-Enrollment
Table 65. Pre- and Post-Enrollment Utilization of Inpatient Care by Specific Diagnosis
Table 66. Pre- and Post-Enrollment Utilization of Emergency Care by Specific Diagnosis
Any CPEP Any Psychiatric Inpatient
Pre Post Sig. Pre Post Sig.
AIDS Institute –
Services only3.6% 2.4% n.s. 7.9% 4.4% *
AIDS Institute –
Services + Subsidy7.7% 2.4% n.s. 15% 18% n.s.
East 99th 1.7% 1.7% n.s. 8.5% 5.1% n.s.
Health Home Pilot 4.2% 8.5% n.s. 15% 13% n.s.
OASAS Rental
Subsidies4.5% 3.6% n.s. 19% 12% **
OMH Rental - Brooklyn 5.5% 6.7% n.s. 12% 9.5% n.s.
OMH Rental -
Statewide5.9% 3.6% n.s. 25% 16% ***
OPWDD 3.2% 3.2% n.s. 3.2% 6.5% n.s.
OTDA Eviction
Prevention0% 3.6% † 6.0% 2.4% n.s.
Homeless Housing
Program12% 3.9% n.s. 15% 3.9% †
OTDA Pilot 0% 2.7% † 18% 27% n.s.
Inpt Adm Inpt Days Psych Adm
Pre Post Pre Post Pre Post
Psychotic disorder 2.2 1.7*** 18.3 9.5*** 28% 18%***
Bipolar disorder 2.3 1.5*** 16.1 8.8*** 22% 16%**
Major depression 1.8 1.4*** 12.8 7.3*** 17% 11%***
Anxiety disorder 1.9 1.3*** 11.6 6.5*** 16% 11%**
Other mood disorder 2.3 1.6*** 16.5 8.2*** 21% 12%***
ED Visits ED Visits for SMI Any CPEP
Pre Post Pre Post Pre Post
Psychotic disorder 4.8 3.3*** 0.6 0.4*** 8.9% 7.8%
Bipolar disorder 4.2 3.2*** 0.5 0.4* 5.9% 7.1%
Major depression 3.8 2.8*** 0.4 0.2*** 4.7% 3.8%
Anxiety disorder 5.2 3.6*** 0.7 0.4*** 4.8% 4.4%
Other mood disorder 4.9 3.3*** 0.6 0.4*** 6.4% 5.5%
*** p =<0.001, ** p >0.001 & =< 0.01, *p>0.01 & =<0.05, †p>0.05 & <0.10, n.s. = not significant
*** p =<0.001, ** p >0.001 & =< 0.01
*** p =<0.001, *p>0.01 & =<0.05
55

MEDICAID REDESIGN TEAM SUPPORTIVE HOUSING EVALUATION:Utilization Report 1
A look at specific APG types (more detailed than service lines) is also interesting. Therapeutic drug monitoring greatly increased (389%). Furthermore, while group psy-chotherapy decreased substantially (-31%), individual comprehensive psychotherapy increased (6%). Full-day day rehabilitation decreased markedly (-80%), and mental hy-giene assessments also decreased (-25%). It would appear that mental health care for these clients post-enrollment is more likely to consist of medication management and in-dividual comprehensive therapy rather than day rehab and group therapy.
The average decrease in inpatient admissions for MRT-SH clients with a SMI was 0.5 admissions. This reduction was greater for Hispanic clients than non-Hispanic white clients, but less for women than for men. Clients with a comorbid SUD had a greater reduction, while clients with HIV had a lesser reduction.
The average decrease in inpatient days for MRT-SH clients with a SMI was 5.3 days. There is less of a reduction as cli-ent age increases. Clients with a psychotic disorder, bipolar disorder, or other mood disorder experience a greater re-duction in inpatient days than those with major depression only. While clients in the OMH rental subsidy programs did not experience a significantly greater reduction in inpa-
Table 67. Top 20 APG Service Lines from Claims for Clients with SMI, Number of Procedures Pre- and Post-Enrollment
Table 68. Top 25 APG Types from Claims for Clients with SMI, Number of Procedures Pre- and Post-Enrollment
Pre Post Total % Change
Mental illness and substance abuse therapies
52,299 45,122 97,421 -14%
Laboratory 34,002 34,539 68,541 2%
Incidental procedures and services 35,507 32,366 67,873 -9%
Other ancillary tests and procedures 10,740 9,661 20,401 -10%
Radiology 5,484 4,602 10,086 -16%
Dental procedures 5,162 4,009 9,171 -22%
Radiologic procedures 3,891 3,653 7,544 -6%
Rehabilitation 2,799 2,610 5,409 -7%
Chemotherapy and other drugs 2,478 2,685 5,163 8%
Pathology 1,006 980 1,986 -3%
Skin and integumentary system procedures
868 768 1,636 -12%
Cardiovascular procedures 700 655 1,355 -6%
Neurologic system procedures 671 655 1,326 -2%
Hematologic, lymphatic, and endocrine procedures
683 585 1,268 -14%
Genitourinary system procedures 485 697 1,182 44%
Musculoskeletal system procedures 605 488 1,093 -19%
Anesthesia 374 366 740 -2%
Gastrointestinal system procedures 304 372 676 22%
Respiratory procedures 342 292 634 -15%
Otolaryngologic system procedures 278 263 541 -5%
Pre Post Total % Change
Medical visit indicator 30,509 27,562 58,071 -10%
Medication administration & observation 18596 19,195 37,791 3%
Group psychotherapy 12,375 8524 20899 -31%
Individual comprehensive psychotherapy 8,075 8,590 16,665 6%
Level I chemistry tests 6,914 6,610 13,524 -4%
Counseling or individual brief psychotherapy
5,933 5,746 11,679 -3%
Organ or disease oriented panels 4,969 4,498 9,467 -9%
Incidental to medical visit or significant procedure
4,688 4,473 9,161 -5%
Plain film 4,862 3,962 8,824 -19%
Level I hematology tests 3,281 2,869 6,150 -13%
Level I immunology tests 3,026 2,753 5,779 -9%
Venipuncture 2,679 2,451 5,130 -9%
Physical therapy 2,685 2,424 5,109 -10%
Cardiogram 2,747 2,275 5,022 -17%
Basic chemistry tests 2,658 2,356 5,014 -11%
Level II microbiology tests 1,899 2,042 3,941 8%
Level II immunology tests 1,775 1,831 3,606 3%
Level I endocrinology tests 1,824 1,728 3,552 -5%
Mental hygiene assessment 1,976 1,484 3,460 -25%
Minor pharmacotherapy 1,748 1,633 3,381 -7%
Day rehabilitation, full day 2,758 544 3,302 -80%
Level II chemistry tests 1,669 1,620 3,289 -3%
Therapeutic drug monitoring 469 2,293 2,762 389%
Urinalysis 1,304 1,271 2,575 -3%
Diagnostic ultrasound except obstetrical and vascular of lower extremities
1,233 1,301 2,534 6%
Blood and urine dipstick tests 1,268 1,206 2,474 -5%
Level I clotting tests 1,052 921 1,973 -12%
Note: A single claim may include multiple procedures, including multiple procedures within the same category
Note: A single claim may include multiple procedures, including multiple proce-dures within the same category
The Enhanced Ambulatory Patient Group classification system (version 13.2.17.1), a product of the 3M Health Information Systems, Inc., categorizes the amount and type of resources used in various ambulatory visits so that patients within each APG have similar resource use and cost. APGs group together procedures and medical visits that share similar characteristics and resource utilization patterns. APGs are designed to predict the average pattern of resource use of a group of patients in a given APG.
56

tient days than those in programs that were not behavior-al-health focused, clients in OASAS-RS did experience a significantly greater reduction.
The average decrease in emergency department visits for MRT-SH clients with a SMI was 1.1. This was significantly larger for clients with a comorbid chronic condition or with
a psychotic disorder or other mood disorder (versus major depression only). The decrease was also greater for clients who were enrolled in managed care for at least part of the pre-enrollment period. Finally, clients in the OASAS-RS program had a significantly larger reduction in inpatient days than those in a program that was not behavioral-health focused.
ANALYSES BY DIAGNOSTIC GROUP
Table 69. Predictors of Pre-Post Changes in Inpatient and ED Utilization among Clients with SMI
Δ Inpatient Admissions Δ Inpatient Days Δ ED Visits
Unstandardized Coefficients Unstandardized Coefficients Unstandardized Coefficients
Model B Std. Error Sig. B Std. Error Sig. B Std. Error Sig.
(Constant) 0.028 0.449 1.587 2.645 1.267 0.571 *
Age at Enrollment (in years, mean-centered for SMI population)
0.014 0.012 0.161 0.069 * 0.027 0.015 †
Race/Ethnicity
Non-Hispanic white (Ref. category) -- -- -- -- -- --
Non-Hispanic Black (1=yes) -0.214 0.318 1.884 1.870 0.048 0.404
Hispanic (1=yes) -1.104 0.366 ** -2.434 2.153 -0.385 0.465
Multiracial/Other (1=yes) -0.557 0.591 2.626 3.478 0.678 0.751
Sex
Male (Ref. category) -- -- -- -- -- --
Female (1=yes) 0.593 0.256 * 1.492 1.510 -0.018 0.326
Comorbidities
Substance use disorder (1=yes) -0.548 0.281 * -2.563 1.653 -0.452 0.357
HIV+ (1=yes) 0.844 0.305 ** 2.639 1.798 0.024 0.388
Other chronic condition (1=yes) -0.021 0.264 -1.363 1.554 -0.798 0.335 *
Specific Diagnoses
Major Depression (Ref. category) -- -- -- -- -- --
Psychotic disorder (1=yes) -0.063 0.277 -6.134 1.634 *** -0.967 0.353 **
Bipolar disorder (1=yes) -0.427 0.275 -2.989 1.620 † 0.060 0.350
Anxiety disorder (1=yes) -0.178 0.293 0.557 1.728 -0.573 0.373
Other mood disorder (1=yes) -0.137 0.258 -4.777 1.517 ** -0.760 0.328 *
Program Enrollment
Other program - not behavioral health-focused (Ref. category)
-- -- -- -- -- --
OMH Rental Subsidies – Brooklyn (1=yes) 0.391 0.370 0.318 2.180 0.549 0.471
OMH Rental Subsidies – Statewide (1=yes) -0.053 0.379 0.308 2.231 -0.463 0.482
OASAS Rental Subsidies (1=yes) -0.674 0.419 -6.464 2.470 ** -1.430 0.533 **
Managed Care in Pre-Period
No months managed care enrollment (Ref. category)
-- -- -- -- -- --
1+ months managed care enrollment (1=yes) -0.190 0.291 -0.784 1.716 -0.779 0.371 *
*** p =<0.001, ** p >0.001 & =< 0.01, *p>0.01 & =<0.05, †p>0.05 & <0.10, n.s. = not significant
57

MEDICAID REDESIGN TEAM SUPPORTIVE HOUSING EVALUATION:Utilization Report 1
SUD PopulationForty-six percent of all the MRT-SH recipients had an active diagnosis of a substance abuse disorder (SUD) in the 12 months before their enrollment (n=959).
Compared to the MRT-SH clients overall, those with a SUD diagnosis were more likely to be men and somewhat more likely to be white. They were less likely to live in New York City, and more likely to have a co-occurring severe mental illness.
Interestingly, the greatest raw number of clients with a SUD diagnosis are enrolled in one of the AIDS Institute programs (297, or 31% of all clients with SUD), although nearly as many are enrolled in the OASAS rental subsidy program. Large numbers of people with SUDs are also found in the two OMH rental subsidy programs.
Program enrollment varied somewhat by diagnosis. In-terestingly, those diagnosed with an alcohol use disorder were more likely than those with other kinds of SUDs to be enrolled in the OASAS-RS program. While it might be ex-pected that a high percentage of those with an opioid use disorder would be enrolled in the AIDS Institute “services only” program (due to the prevalence of intravenous abuse of opioids and the potential for HIV transmission), almost as high a percentage of those with a cocaine use disorder were enrolled in that program (33% and 32%, respective-ly). Those with a cannabis use disorder were more likely than any other diagnostic group to be enrolled in an OMH program.
Table 70. Characteristics of MRT-SH Recipients with Substance Use Disorder (SUD) Diagnosis
MRT SUD Population
Overall MRT Population
Average age (in years) 46.2 47.1Race/ethnicity
Non-Hispanic Black 40% 42%Hispanic/Latino 20% 23%Other race or multiracial 6% 5%Non-Hispanic white 35% 30%
GenderMale 61% 55%Female 39% 45%
GeographyNew York City 56% 65%Long Island 3% 3%Other New York State 41% 33%
ComorbiditiesHas HIV 43% 40%Has a SMI 73% 66%Has another chronic medical condition 57% 53%
Figure 23. Number of MRT-SH Clients with SUD, by Program
300250200150100500
AIRS
- S
ervi
ces
only
AIRS
- S
ervi
ces
+
Subs
idie
s
East
99t
h St
reet
HHSP
OASA
S
OMH
- Br
ookl
yn
OMH
- St
atew
ide
OPW
DD
OTDA
- E
PVA
OTDA
- H
HAP
OTDA
- P
ilot
261
368
57
278
103144
536 21 9
Alcohol Opioid Cocaine Cannabis Non-Opioid Combo
Figure 24. Program Enrollment by Specific Substance Use Disorder Diagnosis
100%
90%
80%
70%
60%
50%
40%
30%
20%
10%
0%
Note: Diagnostic categories are not mutually exclusive; many clients have diagnoses in more than one category.
OASAS AIDS Institute - Svcs only RSS RSB
58

ANALYSES BY DIAGNOSTIC GROUP
The table below shows the percentage of all clients (not just those with a SUD) enrolled in each program that has each category of diagnosis. This gives a very different picture of the impact of these disorders on each program. For ex-
ample, while only a small fraction of MRT-SH clients with an alcohol or cocaine use disorder are enrolled in HHAP, a significant proportion of the HHAP clients have an alcohol or cocaine use disorder (33% and 21%, respectively).
Overall, inpatient days decreased for clients with SUD in all programs except for OTDA Homeless Senior and Dis-abled Placement Pilot, which had very small numbers. The decreases were statistically significant for clients enrolled in the AIDS Institute “services only” program, the Health Home Pilot, the OASAS-RS, and the OMH Statewide Rental Subsidy program.
The percent of clients with at least one ED visit for a primary diagnosis of a SUD similarly tended to decline following en-rollment, but most of these decreases were not significant. Only the AIDS Institute “services only”, OASAS-RS, and HHSP had statistically significant reductions in ED visits for SUD among their clients with a diagnosed SUD.
Table 71. Specific Substance Use Disorder Diagnosis by Program Enrollment
Program % Any SUD Alcohol Use Disorder
Opioid Use Disorder
Cocaine Use Disorder
Cannabis Use Disorder
Non-Opioid Combi-nation Disorder Other SUD
AIDS Institute “Services Only” 50% 21% 23% 15% 5% 8% 20%
AIDS Institute “Subsidies and Services” 49% 15% 16% 20% 9% 3% 19%
East 99th Street 6% 2% 1% 0% 0% 1% 2%
Health Home Pilot 52% 24% 16% 6% 4% 6% 18%
OASAS Rental Subsidies and Supports 100% 62% 41% 28% 13% 16% 46%
OMH Rental Subsidies: Brooklyn 37% 19% 12% 5% 5% 8% 15%
OMH Rental Subsidies: Statewide 43% 20% 14% 7% 7% 4% 16%
OPWDD Expansion of Existing Rental/Services 10% 2% 0% 0% 0% 0% 0%
Eviction Prevention for Vulnerable Adults 19% 2% 7% 1% 2% 2% 5%
HHAP Capital Programs 49% 33% 12% 21% 14% 2% 19%
OTDA Pilot 30% 4% 14% 0% 0% 0% 4%
All MRT-SH Programs 46% 23% 18% 11% 6% 7% 19%
Note: Diagnostic categories are not mutually exclusive; many clients have diagnoses in more than one category.
Table 72. Overall Inpatient Days and Emergency Visits for SUD among the SUD Population by Program, Pre- and Post-Enrollment
# Inpatient Days – for any reason
% with >=1 Emergency Visits – for SUD
Pre Post Sig. Pre Post Sig.
AIDS Institute – Services only
13.9 7.8 *** 18% 11% *
AIDS Institute – Services + Subsidy
8.6 7.2 n.s. 19% 19% n.s.
East 99th 14.8 11.0 n.s. 25% 0% n.s.
Health Home Pilot 10.9 3.5 *** 25% 7% *
OASAS Rental Subsidies 24.2 12.5 *** 32% 19% ***
OMH Rental - Brooklyn 14.2 9.2 n.s. 15% 13% n.s.
OMH Rental - Statewide 14.1 8.8 *** 22% 19% n.s.
OPWDD 0 0 -- 0% 0% --
OTDA Eviction Prevention
2.2 2.2 n.s. 8.3% 5.6% n.s.
Homeless Housing Program
6.0 1.2 † 24% 9.5% n.s.
OTDA Pilot 2.2 5.1 n.s. 0% 0% --
Note: As shown in Figure 22, above, the East 99th, OPWDD, and OTDA Homeless Se-nior and Disabled Placement Pilot programs have very small numbers of clients with diagnosed SUDs and their results must be interpreted with considerable caution.
*** p =<0.001, ** p >0.001 & =< 0.01, *p>0.01 & =<0.05, †p>0.05 & <0.10, n.s. = not significant
59
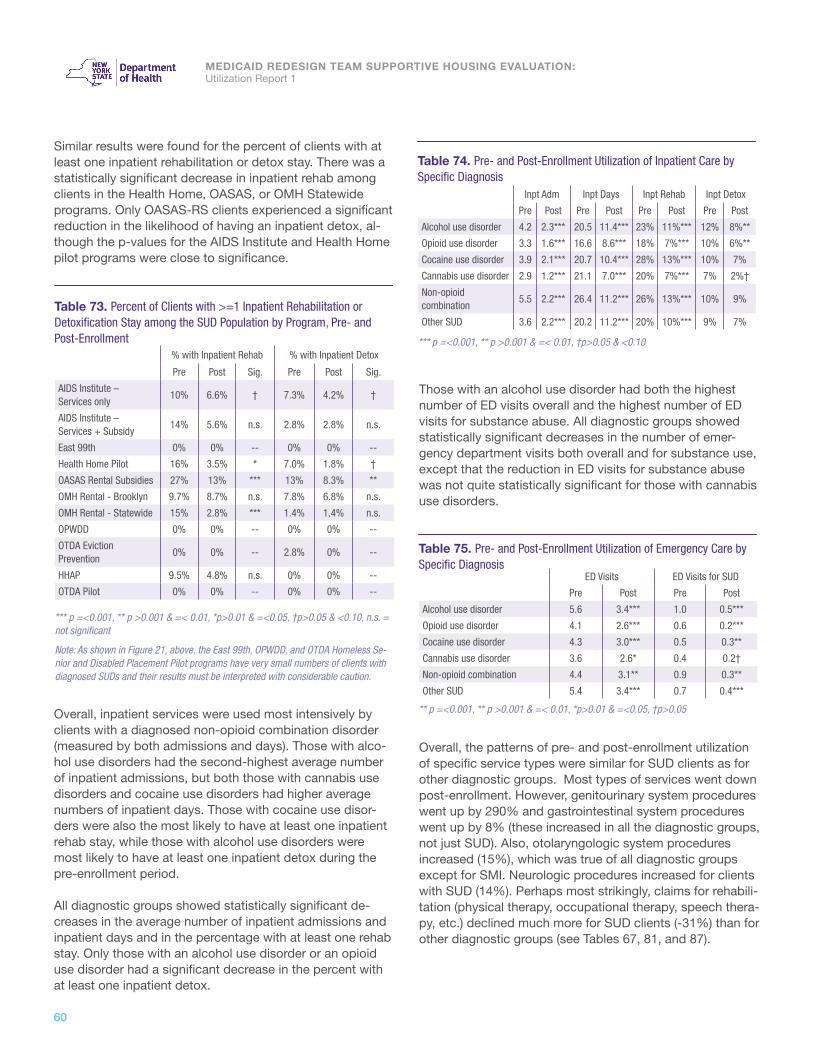
MEDICAID REDESIGN TEAM SUPPORTIVE HOUSING EVALUATION:Utilization Report 1
Similar results were found for the percent of clients with at least one inpatient rehabilitation or detox stay. There was a statistically significant decrease in inpatient rehab among clients in the Health Home, OASAS, or OMH Statewide programs. Only OASAS-RS clients experienced a significant reduction in the likelihood of having an inpatient detox, al-though the p-values for the AIDS Institute and Health Home pilot programs were close to significance.
Overall, inpatient services were used most intensively by clients with a diagnosed non-opioid combination disorder (measured by both admissions and days). Those with alco-hol use disorders had the second-highest average number of inpatient admissions, but both those with cannabis use disorders and cocaine use disorders had higher average numbers of inpatient days. Those with cocaine use disor-ders were also the most likely to have at least one inpatient rehab stay, while those with alcohol use disorders were most likely to have at least one inpatient detox during the pre-enrollment period.
All diagnostic groups showed statistically significant de-creases in the average number of inpatient admissions and inpatient days and in the percentage with at least one rehab stay. Only those with an alcohol use disorder or an opioid use disorder had a significant decrease in the percent with at least one inpatient detox.
Those with an alcohol use disorder had both the highest number of ED visits overall and the highest number of ED visits for substance abuse. All diagnostic groups showed statistically significant decreases in the number of emer-gency department visits both overall and for substance use, except that the reduction in ED visits for substance abuse was not quite statistically significant for those with cannabis use disorders.
Overall, the patterns of pre- and post-enrollment utilization of specific service types were similar for SUD clients as for other diagnostic groups. Most types of services went down post-enrollment. However, genitourinary system procedures went up by 290% and gastrointestinal system procedures went up by 8% (these increased in all the diagnostic groups, not just SUD). Also, otolaryngologic system procedures increased (15%), which was true of all diagnostic groups except for SMI. Neurologic procedures increased for clients with SUD (14%). Perhaps most strikingly, claims for rehabili-tation (physical therapy, occupational therapy, speech thera-py, etc.) declined much more for SUD clients (-31%) than for other diagnostic groups (see Tables 67, 81, and 87).
ED Visits ED Visits for SUD
Pre Post Pre Post
Alcohol use disorder 5.6 3.4*** 1.0 0.5***
Opioid use disorder 4.1 2.6*** 0.6 0.2***
Cocaine use disorder 4.3 3.0*** 0.5 0.3**
Cannabis use disorder 3.6 2.6* 0.4 0.2†
Non-opioid combination 4.4 3.1** 0.9 0.3**
Other SUD 5.4 3.4*** 0.7 0.4***
Table 74. Pre- and Post-Enrollment Utilization of Inpatient Care by Specific Diagnosis
Table 75. Pre- and Post-Enrollment Utilization of Emergency Care by Specific Diagnosis
Inpt Adm Inpt Days Inpt Rehab Inpt Detox
Pre Post Pre Post Pre Post Pre Post
Alcohol use disorder 4.2 2.3*** 20.5 11.4*** 23% 11%*** 12% 8%**
Opioid use disorder 3.3 1.6*** 16.6 8.6*** 18% 7%*** 10% 6%**
Cocaine use disorder 3.9 2.1*** 20.7 10.4*** 28% 13%*** 10% 7%
Cannabis use disorder 2.9 1.2*** 21.1 7.0*** 20% 7%*** 7% 2%†
Non-opioid combination
5.5 2.2*** 26.4 11.2*** 26% 13%*** 10% 9%
Other SUD 3.6 2.2*** 20.2 11.2*** 20% 10%*** 9% 7%
*** p =<0.001, ** p >0.001 & =< 0.01, †p>0.05 & <0.10
** p =<0.001, ** p >0.001 & =< 0.01, *p>0.01 & =<0.05, †p>0.05
Table 73. Percent of Clients with >=1 Inpatient Rehabilitation or Detoxification Stay among the SUD Population by Program, Pre- and Post-Enrollment
% with Inpatient Rehab % with Inpatient Detox
Pre Post Sig. Pre Post Sig.
AIDS Institute – Services only
10% 6.6% † 7.3% 4.2% †
AIDS Institute – Services + Subsidy
14% 5.6% n.s. 2.8% 2.8% n.s.
East 99th 0% 0% -- 0% 0% --
Health Home Pilot 16% 3.5% * 7.0% 1.8% †
OASAS Rental Subsidies 27% 13% *** 13% 8.3% **
OMH Rental - Brooklyn 9.7% 8.7% n.s. 7.8% 6.8% n.s.
OMH Rental - Statewide 15% 2.8% *** 1.4% 1.4% n.s.
OPWDD 0% 0% -- 0% 0% --
OTDA Eviction Prevention
0% 0% -- 2.8% 0% --
HHAP 9.5% 4.8% n.s. 0% 0% --
OTDA Pilot 0% 0% -- 0% 0% --
*** p =<0.001, ** p >0.001 & =< 0.01, *p>0.01 & =<0.05, †p>0.05 & <0.10, n.s. = not significant
Note: As shown in Figure 21, above, the East 99th, OPWDD, and OTDA Homeless Se-nior and Disabled Placement Pilot programs have very small numbers of clients with diagnosed SUDs and their results must be interpreted with considerable caution.
60

ANALYSES BY DIAGNOSTIC GROUP
Overall, the patterns seen in top 25 types of procedures among clients with SUDs closely mirror those for clients with SMI. There is the same transition from group therapy (-30%) to individual therapy (+8%) and from full day rehab (-78%) to therapeutic drug monitoring (+547%). The mag-nitude of the latter change is perhaps the most striking finding.
The average decrease in inpatient admissions among SUD clients is 1.1. There is significantly less of a decrease for women, however, compared to men. There is also less of a decrease for clients who are HIV+ than for those who are not. Compared to those with alcohol use disorder only, clients with a non-opioid combination disorder experience a significantly greater decrease.
The average decrease in inpatient days among SUD clients is 7 days. There is significantly less of a decrease for black
Table 76. Top 20 APG Service Lines from Claims for Clients with SUDNumber of Procedures Pre- and Post-Enrollment
Pre Post Total % Change
Mental illness and substance abuse therapies
61,309 53,550 114,859 -13%
Laboratory 29,390 31,093 60,483 6%
Incidental procedures and services 25,766 23,130 48,896 -10%
Other ancillary tests and procedures 8,258 7,294 15,552 -12%
Radiology 4,327 3,646 7,973 -16%
Dental procedures 3,841 2,838 6,679 -26%
Radiologic procedures 3,145 2,827 5,972 -10%
Chemotherapy and other drugs 1,866 1,990 3,856 7%
Rehabilitation 2,125 1,456 3,581 -31%
Pathology 737 658 1,395 -11%
Cardiovascular procedures 568 551 1,119 -3%
Hematologic, lymphatic, and endocrine procedures
560 511 1,071 -9%
Skin and integumentary system procedures
587 467 1,054 -20%
Neurologic system procedures 468 532 1,000 14%
Musculoskeletal system procedures 491 383 874 -22%
Genitourinary system procedures 118 460 578 290%
Anesthesia 257 238 495 -7%
Respiratory procedures 267 223 490 -16%
Otolaryngologic system procedures 204 235 439 15%
Gastrointestinal system procedures 196 211 407 8%
Note: A single claim may include multiple procedures, including multiple procedures within the same category
Table 77. Top 25 APG Types from Claims for Clients with SUDNumber of Procedures Pre- and Post-Enrollment
Pre Post Total % Change
Medical visit indicator 28,464 30,004 58,468 5%
Medication administration & observation
21,808 19,542 41,350 -10%
Group psychotherapy 14,514 10,231 24,745 -30%
Level I chemistry tests 6,447 6,360 12,807 -1%
Individual comprehensive psychotherapy
5,324 5,739 11,063 8%
Counseling or individual brief psychotherapy
4,415 4,239 8,654 -4%
Organ or disease oriented panels 4,131 3,697 7,828 -11%
Plain film 3,988 3,123 7,111 -22%
Incidental to medical visit or significant procedure
3,704 3,366 7,070 -9%
Level I immunology tests 2,608 2,387 4,995 -8%
Level I hematology tests 2,580 2,235 4,815 -13%
Day rehabilitation, full day 3,824 853 4,677 -78%
Cardiogram 2,309 1,818 4,127 -21%
Basic chemistry tests 2,120 1,866 3,986 -12%
Level II microbiology tests 1,857 2,040 3,897 10%
Venipuncture 2,064 1,819 3,883 -12%
Level II immunology tests 1,792 1,916 3,708 7%
Physical therapy 2,073 1,409 3,482 -32%
Therapeutic drug monitoring 413 2,671 3,084 547%
Mental hygiene assessment 1,772 1,300 3,072 -27%
Level II chemistry tests 1,564 1,452 3,016 -7%
Level I endocrinology tests 1,363 1,312 2,675 -4%
Minor pharmacotherapy 1,257 1,258 2,515 0%
Blood and urine dipstick tests 1,170 1,083 2,253 -7%
Diagnostic ultrasound except obstetrical and vascular of lower extremities
964 1,038 2,002 8%
Note: A single claim may include multiple procedures, including multiple procedures within the same category
61

MEDICAID REDESIGN TEAM SUPPORTIVE HOUSING EVALUATION:Utilization Report 1
clients, however, compared to non-Hispanic white clients. Compared to clients with alcohol use disorder only, clients with cocaine use disorders, cannabis use disorders, and non-opioid combination disorders experience significantly greater decreases in inpatient days.
The average decrease in emergency department visits among SUD clients is 1.5. This decrease was significantly larger for clients with a comorbid chronic condition and those who were enrolled in managed care for at least part of the pre-period.
Table 78. Predictors of Pre-Post Changes in Inpatient and ED Utilization among Clients with SUD
Δ Inpatient Admissions Δ Inpatient Days Δ ED Visits
Unstandardized Coefficients Unstandardized Coefficients Unstandardized Coefficients
Model B Std. Error Sig. B Std. Error Sig. B Std. Error Sig.
(Constant) -1.361 1.017 -6.129 3.914 0.690 0.905
Age at Enrollment (in years, mean-centered for SUD population)
0.027 0.026 0.134 0.099 0.023 0.023
Race/Ethnicity
Non-Hispanic white (Ref. category) -- -- -- -- -- --
Non-Hispanic Black (1=yes) 0.199 0.636 5.549 2.449 * -0.016 0.566
Hispanic (1=yes) -1.019 0.737 3.073 2.837 -0.232 0.656
Multiracial/Other (1=yes) 0.643 1.128 7.467 4.343 † 0.011 1.004
Sex
Male (Ref. category) -- -- -- -- -- --
Female (1=yes) 1.142 0.511 * 2.468 1.968 0.503 0.455
Comorbidities
Severe mental illness (1=yes) 0.767 0.582 -2.905 2.241 -0.543 0.518
HIV+ (1=yes) 1.344 0.633 * 1.647 2.436 0.004 0.563
Other chronic condition (1=yes) 0.448 0.517 -0.143 1.991 -.905 0.460 *
Specific Diagnoses
Alcohol use disorder (Ref. category) -- -- -- -- -- --
Opioid use disorder (1=yes) -0.778 0.520 -1.564 2.001 0.320 0.463
Cocaine use disorder (1=yes) -1.043 0.585 † -4.538 2.251 * 0.295 0.520
Cannabis use disorder (1=yes) -0.347 0.762 -7.230 2.933 * 0.699 0.678
Non-opioid combination disorder (1=yes) -2.372 0.704 *** -9.151 2.710 ** 0.406 0.627
Other SUD (1=yes) 0.219 0.508 -1.174 1.954 -0.762 0.452 †
Program Enrollment
Other program - not behavioral health-focused (Ref. category)
-- -- -- -- -- --
OMH Rental Subsidies – Brooklyn (1=yes) 0.977 0.883 1.961 3.396 1.390 0.785 †
OMH Rental Subsidies – Statewide (1=yes) -0.152 0.855 3.581 3.292 -0.832 0.761
OASAS Rental Subsidies (1=yes) -1.264 0.722 † -2.173 2.779 -1.208 0.642 †
Managed Care in Pre-Period
No months managed care enrollment (Ref. category)
-- -- -- -- -- --
1+ Months Managed Care Enrollment (1=yes) -0.440 0.624 0.891 2.403 -1.357 0.555 *
*** p =<0.001, ** p >0.001 & =< 0.01, *p>0.01 & =<0.05, †p>0.05 & <0.10, n.s. = not significant
62

HIV PopulationForty percent of all the MRT-SH clients had an active diagnosis of HIV (n=821). Compared to the overall MRT-SH population, those with HIV were somewhat older, and more likely to be black, Hispanic, or male. They were also much more likely to live in New York City and less likely to live on Long Island. They were more likely to have a substance abuse diagnosis than the MRT-SH population at large. Be-cause many of the AIDS Institute programs are concentrat-ed in New York City, much of the demographic differences observed may be related to the geographical availability of the programs.
The majority of clients with HIV were enrolled in one of the AIDS Institute programs (521, or 72% of all clients with HIV), but more than one-quarter were enrolled in programs run by other agencies, particularly the OMH rental subsidy pro-grams (110, or 13%). The OPWDD program had no clients with HIV, and the HHAP program had extremely few.
Although most programs are associated with a decrease in inpatient days and the percent of clients with at least one emergency department visit among their HIV-positive population, the change is not statistically significant in any program except for inpatient days in the AIDS Institute services-only program.
ANALYSES BY DIAGNOSTIC GROUP
Table 79. Characteristics of MRT-SH Recipients with HIV Diagnosis
MRT HIV Population
Overall MRT Population
Average age (in years) 49.7 47.1Race/ethnicity
Non-Hispanic Black 52% 42%Hispanic/Latino 28% 23%Other race or multiracial 5% 5%Non-Hispanic white 15% 30%
GenderMale 60% 55%Female 40% 45%
GeographyNew York City 86% 65%Long Island 1% 3%Other New York State 13% 33%
ComorbiditiesHas SMI 57% 66%Has a SUD 50% 46%Has another chronic medical condition 54% 53%
Figure 25. Number of MRT-SH Clients with HIV by Program
600
500
400
300
200
100
0
AIRS
- S
ervi
ces
only
AIRS
- S
ervi
ces
+
Subs
idie
s
East
99t
h St
reet
HHSP
OASA
S
OMH
- Br
ookl
yn
OMH
- St
atew
ide
OTDA
- E
PVA
OTDA
- P
ilot
521
7121 22 39
84
26 23 13
Table 80. Overall Inpatient Days and Emergency Visits among the HIV Population by Program, Pre- and Post-Enrollment
# Inpatient Days – for any reason
% with >=1 Emergency Visits – for any reason
Pre Post Sig. Pre Post Sig.
AIDS Institute “Services only”
8.8 6.0 ** 56% 52% †
AIDS Institute “Services + Subsidy”
4.5 6.9 n.s. 73% 65% n.s.
East 99th 2.6 2.5 n.s. 33% 43% n.s.
Health Home Pilot 11.4 4.7 n.s. 73% 68% n.s.
OASAS Rental Subsidies 15.9 9.7 n.s. 90% 87% n.s.
OMH Rental - Brooklyn 8.4 5.7 † 63% 60% n.s.
OMH Rental - Statewide 4.8 3.5 n.s. 73% 65% n.s.
OTDA Eviction Prevention
1.3 2.5 n.s. 52% 52% n.s.
OTDA Pilot 3.5 4.2 n.s. 69% 38% n.s.
*** p =<0.001, ** p >0.001 & =< 0.01, *p>0.01 & =<0.05, †p>0.05 & <0.10, n.s. = not significant
63

MEDICAID REDESIGN TEAM SUPPORTIVE HOUSING EVALUATION:Utilization Report 1
Looking at the categories of procedures used by clients with HIV, one of the most striking findings is that mental illness and substance abuse therapies increased (11%), in direct contrast to the other diagnostic groups (see Tables 67, 76, and 87). As with the other groups, gastrointestinal and gen-itourinary procedures increased (24% and 55%, respective-ly). Otolargyngologic procedures and neurologic procedures increased as well. The other diagnostic groups all experi-enced a decrease in respiratory procedures, while clients with HIV actually experienced a slight increase. Chemother-apy and other drugs also increased for these clients (14%)
Table 81. Top 20 APG Service Lines from Claims for Clients with HIVNumber of Procedures Pre- and Post-Enrollment
Pre Post Total % Change
Laboratory 27,931 29,657 57,588 6%
Mental illness and substance abuse therapies
25,967 28,856 54,823 11%
Incidental procedures and services 21,225 20,430 41,655 -4%
Other ancillary tests and procedures 6,438 6,365 12,803 -1%
Radiology 3,219 2,669 5,888 -17%
Dental procedures 2,962 2,409 5,371 -19%
Radiologic procedures 2,258 2,091 4,349 -7%
Chemotherapy and other drugs 1,822 2,075 3,897 14%
Rehabilitation 1,674 1,563 3,237 -7%
Pathology 1,027 873 1,900 -15%
Genitourinary system procedures 663 1,025 1,688 55%
Cardiovascular procedures 447 433 880 -3%
Hematologic, lymphatic, and endocrine procedures
408 360 768 -12%
Skin and integumentary system procedures
377 324 701 -14%
Neurologic system procedures 300 367 667 22%
Musculoskeletal system procedures 281 219 500 -22%
Anesthesia 220 205 425 -7%
Respiratory procedures 210 214 424 2%
Gastrointestinal system procedures 157 194 351 24%
Otolaryngologic system procedures 127 174 301 37%
Note: A single claim may include multiple procedures, including multiple procedures within the same category
An examination of more detailed procedure types provides more findings of interest. First of all, while medication administration and observation increased for all diagnostic groups (Tables 68, 77, and 88), it increased quite a bit more for clients with HIV (14%). Group psychotherapy increased slightly for this population (2%), but decreased markedly for the other groups. Individual psychotherapy increased for all diagnostic groups, but the increase was much larger for clients with HIV (44%). Therapeutic drug monitoring showed
dramatic increases in all groups, but the increase was most dramatic for clients with HIV, for whom it increased more than eightfold (836%). Minor pharmacotherapy also increased (17%), while staying the same or decreasing for other groups. Clients with HIV were the only group for whom full-day day rehab was not in the top 25.
Table 82. Top 25 APG Types from Claims for Clients with HIVNumber of Procedures Pre- and Post-Enrollment
Pre Post Total % Change
Medical visit indicator 18,025 17,133 35,158 -5%
Medication administration & observation 16,243 18,512 34,755 14%
Level I chemistry tests 4,919 4,918 9,837 0%
Group psychotherapy 3,814 3,898 7,712 2%
Organ or disease oriented panels 3,913 3,684 7,597 -6%
Incidental to medical visit or significant procedure
3,096 3,125 6,221 1%
Level II immunology tests 2,956 3,057 6,013 3%
Level II microbiology tests 2,692 2,768 5,460 3%
Plain film 2,817 2,377 5,194 -16%
Level I immunology tests 2,588 2,299 4,887 -11%
Counseling or individual brief psychotherapy
2,383 2,465 4,848 3%
Basic chemistry tests 2,469 2,351 4,820 -5%
Individual comprehensive psychotherapy 1,875 2,704 4,579 44%
Level I hematology tests 2,305 2,094 4,399 -9%
Venipuncture 1,695 1,717 3,412 1%
Physical therapy 1,645 1,531 3,176 -7%
Cardiogram 1,471 1,345 2,816 -9%
Level II chemistry tests 1,156 1,276 2,432 10%
Therapeutic drug monitoring 233 2,182 2,415 836%
Minor pharmacotherapy 1,048 1,231 2,279 17%
Blood and urine dipstick tests 1,001 948 1,949 -5%
Level I endocrinology tests 980 919 1,899 -6%
Urinalysis 807 801 1,608 -1%
Diagnostic ultrasound except obstetrical and vascular of lower extremities
723 720 1,443 0%
Mental hygiene assessment 737 644 1,381 -13%
Note: A single claim may include multiple procedures, including multiple procedures within the same category
There was very little pre-post decrease in inpatient ad-missions, on average, for MRT-SH clients with HIV (0.05 admissions).There was a significantly greater decrease for Hispanic clients, however, relative to non-Hispanic white clients. Clients in the AIDS Institute “services only” program also had a significantly greater decrease compared to those in programs that were not HIV-focused. Those with comor-bid chronic conditions also had a larger decrease, while those in managed care previous to enrollment had a smaller
64

ANALYSES BY DIAGNOSTIC GROUP
decrease, but these latter two findings were not quite statis-tically significant.
The average decrease in inpatient days for MRT-SH clients with HIV was 2.2. Black clients, however, experienced a smaller decrease than non-Hispanic white clients. Clients with a comorbid SUD experienced a significantly greater decrease. Surprisingly, enrollment in the AIDS Institute “ser-vices and subsidies” program was associated with a signifi-
Table 83. Predictors of Pre-Post Changes in Inpatient and ED Utilization among Clients with HIV
Δ Inpatient Admissions Δ Inpatient Days Δ ED Visits
Unstandardized Coefficients
Unstandardized Coefficients
Unstandardized Coefficients
Model B Std. Error Sig. B Std. Error Sig. B Std. Error Sig.
(Constant) 0.958 0.561 † -5.782 2.947 * 0.341 0.702
Age at Enrollment (in years, mean-centered for HIV population)
0.013 0.013 0.008 0.069 0.007 0.016
Race/Ethnicity
Non-Hispanic white (Ref. category) -- -- -- -- -- --
Non-Hispanic Black (1=yes) -0.380 0.415 4.357 2.178 * -0.373 0.519
Hispanic (1=yes) -0.945 0.454 * 3.409 2.387 -0.650 0.569
Multiracial/Other (1=yes) -0.822 0.717 2.980 3.765 -0.662 0.897
Sex
Male (Ref. category) -- -- -- -- -- --
Female (1=yes) -0.022 0.279 0.887 1.466 0.553 0.350
Comorbidities
Severe mental illness (1=yes) -0.023 0.288 0.266 1.513 -0.076 0.361
Substance use disorder (1=yes) -0.434 0.274 -5.155 1.441 *** -0.670 0.343 †
Other chronic condition (1=yes) -0.523 0.281 † 0.120 1.479 -0.571 0.353
Program Enrollment
Other program - not HIV-focused (Ref. category) -- -- -- -- -- --
AIDS Institute – services only (1=yes) -0.693 0.324 * -0.182 1.702 0.364 0.406
AIDS Institute – services and subsidies (1=yes) -0.286 0.540 5.816 2.835 * 0.515 0.676
Managed Care in Pre-Period
No months managed care enrollment (Ref. category) -- -- -- -- -- --
1+ Months Managed Care Enrollment (1=yes) 0.630 0.338 † 2.234 1.774 -0.568 0.423
*** p =<0.001, *p>0.01 & =<0.05, †p>0.05 & <0.10, n.s. = not significant
cantly lesser decrease relative to enrollment in a program that was not HIV-focused.
The average decrease in ED visits for clients with HIV was 0.7, and this did not vary significantly based on client characteristics. Those with a comorbid SUD had a large decrease in ED visits than those without a SUD, but this was not quite statistically significant.
65

MEDICAID REDESIGN TEAM SUPPORTIVE HOUSING EVALUATION:Utilization Report 1
Fifty-three percent of the MRT-SH clients had a chronic medical condition other than HIV or a behavioral health diagnosis (n=1,091). The conditions included were osteoar-thritis; asthma; cancer; coronary heart disease; cerebrovas-cular disease; hypertension; congestive heart failure (CHF); acute myocardial infarction or MI (while this is an acute event rather than a chronic condition, a cardiac infarction leaves the heart muscle permanently damaged); angina; chronic kidney disease (CKD); chronic obstructive pulmo-nary disorder (COPD); and diabetes.
Compared to the MRT-SH population overall, those with at least one chronic medical condition were somewhat older on average. Aside from age, their characteristics were much the same as their MRT-SH peers overall.
Chronic Conditions Population
There was a wide distribution of clients with chronic condi-tions across MRT-SH programs, with the greatest numbers in the AIDS Institute programs (293, or 27% of clients with chronic conditions), but large numbers also in the OA-SAS-RS and OMH RSB and RSS programs. (These are the largest MRT-SH programs overall.) For information about the specific chronic medical diagnoses by program, see Table 2 in the first section of the report.
Several programs showed statistically significant or close to significant decreases in the average number of inpatient days among their chronic conditions clients. OASAS-RS and RSS programs had statistically significant effects, while AIDS Institute “services only”, HHSP, and HHAP were close. The OASAS-RS and RSS programs showed statistically sig-nificant reductions in the percentage of chronic conditions clients who had at least one ED visit, while AIDS Institute “services only”, HHSP, and OTDA Homeless Senior and Dis-abled Placement Pilot had p-values between 0.05 and 0.10.
Table 84. Characteristics of MRT-SH Recipients with Chronic Medical Condition Diagnosis
MRT Chronic Conditions Population
Overall MRT Population
Average age (in years) 49.8 47.1Race/ethnicity
Non-Hispanic Black 45% 42%Hispanic/Latino 24% 23%Other race or multiracial 5% 5%Non-Hispanic white 26% 30%
GenderMale 55% 55%Female 45% 45%
GeographyNew York City 66% 65%Long Island 3% 3%Other New York State 31% 33%
ComorbiditiesHas SMI 67% 66%Has a SUD 50% 46%Has HIV 40% 40%
Figure 26. Number of MRT-SH Clients with Chronic Medical Conditions by Program
300
250
200
150
100
50
0
AIRS
- S
ervi
ces
only
AIRS
- S
ervi
ces
+
Subs
idie
s
East
99t
h St
reet
HHSP
OASA
S
OMH
- Br
ookl
yn
OMH
- St
atew
ide
OPW
DD
OTDA
- E
PVA
ODTA
- H
HAP
OTDA
- N
YCDH
254
39
8246
175158
177
2146
20
97
Table 85. Overall Inpatient Days and Emergency Visits among the Chronic Conditions Population by Program, Pre- and Post-Enrollment
# Inpatient Days – for any reason
% with >=1 Emergency Visits – for any reason
Pre Post Sig. Pre Post Sig.
AIDS Institute – Services only
11.1 8.6 † 68% 61% †
AIDS Institute – Services + Subsidy
3.9 8.5 n.s. 82% 79% n.s.
East 99th 5.0 4.3 n.s. 39% 44% n.s.
Health Home Pilot 10.7 6.3 † 83% 63% †
OASAS Rental Subsidies 22.5 11.9 *** 85% 74% *
OMH Rental - Brooklyn 11.1 6.6 * 63% 55% n.s.
OMH Rental - Statewide 13.7 7.0 ** 76% 67% *
OPWDD 1.1 1.5 n.s. 38% 33% n.s.
OTDA Eviction Prevention
5.3 3.6 n.s. 49% 40% n.s.
HHAP 6.2 1.6 † 80% 60% n.s.
OTDA Pilot 3.1 4.7 n.s. 73% 41% †
*** p =<0.001, ** p >0.001 & =< 0.01, *p>0.01 & =<0.05, †p>0.05 & <0.10, n.s. = not significant
66

ANALYSES BY DIAGNOSTIC GROUP
The highest number of inpatient admissions was among clients with angina, followed by those treated for myocardial infarction (heart attack) during the pre-period. (Although one would expect their utilization to thus be quite high during the pre-period, they also had the second-highest average number of inpatient admissions during the post-period.) All diagnostic groups experienced a statistically significant decrease in inpatient admissions, except for those with asthma, osteoarthritis and cancer (and the latter two ap-proached statistical significance).
The highest average number of inpatient days in the pre-pe-riod was among those with congestive heart failure, myocar-dial infarction, and angina. During the post-period this was angina, followed by chronic kidney disease (those who had suffered a heart attack presumably being on their way to recovery). Inpatient days were significantly lower during the post-period for clients with hypertension, diabetes, coro-nary heart disease, COPD, cerebrovascular disease, chronic kidney disease, congestive heart failure, and myocardial infarction.
The highest number of ED visits was among clients who experienced myocardial infarction or angina. All groups experienced a significant reduction in ED visits except for those with chronic kidney disease, cancer, and myocardial infarction.
At the service line level, the procedures used by MRT-SH clients with chronic medical conditions were fairly similar to those for other MRT-SH clients (see Tables 67, 76, and 81). There was a larger drop in cardiovascular procedures (-14%) among this group than others. The only broad categories of procedures that increased were genitourinary system procedures (35%), chemotherapy and other drugs (7%) and laboratory procedures (1%).
When examining the more specific procedure types, it is notable that clients with chronic conditions were the only group with a reduction (albeit an extremely modest one) in individual comprehensive psychotherapy. As with the other groups, the most striking change was the dramatic increase in therapeutic drug monitoring.
Table 86. Pre- and Post-Enrollment Utilization of Inpatient and Emergency Care by Specific Diagnosis (sorted by prevalence in the population)
Inpatient Admissions
Inpatient Days ED Visits
Pre Post Pre Post Pre Post
Hypertension 2.2 1.7** 14.1 8.8*** 4.2 3.0***
Diabetes 1.6 1.2* 10.5 6.5** 3.4 2.7*
Asthma 2.2 1.7 10.9 8.4 5.7 4.1***
Coronary heart disease 3.4 2.2*** 19.6 9.9*** 7.4 4.7***
Osteoarthritis 1.7 1.4† 10.1 7.1† 4.7 2.9***
COPD 3.0 2.1*** 18.4 9.7*** 6.1 3.9***
Cerebrovascular disease
2.3 1.7* 14.2 7.0*** 6.8 4.0***
Chronic kidney disease 2.8 2.3* 18.2 12.0* 5.0 4.1
Congestive heart failure
3.5 2.3** 26.7 11.5** 5.6 3.0**
Cancer 1.4 1.0† 8.0 4.6† 4.1 3.3
Angina 5.2 3.5* 21.1 15.4† 11.8 6.2**
Acute myocardial infarction
4.8 3.2* 22.8 9.3** 10.0 10.0
*** p =<0.001, ** p >0.001 & =< 0.01, *p>0.01 & =<0.05, †p>0.05 & <0.10, n.s. = not significant
Table 87. Top 20 APG Service Lines for Claims for Clients with Chronic Conditions, Number of Procedures Pre- and Post-Enrollment
Pre Post Total % Change
Mental illness and substance abuse therapies
40107 33662 73769 -16%
Laboratory 31279 31724 63003 1%
Incidental procedures and services 31838 28731 60569 -10%
Other ancillary tests and procedures 10743 9820 20563 -9%
Radiology 5782 4537 10319 -22%
Radiologic procedures 3945 3597 7542 -9%
Chemotherapy and other drugs 3339 3558 6897 7%
Dental procedures 3885 2954 6839 -24%
Rehabilitation 3050 2749 5799 -10%
Genitourinary system procedures 1074 1446 2520 35%
Pathology 990 790 1780 -20%
Cardiovascular procedures 907 780 1687 -14%
Skin and integumentary system procedures
854 800 1654 -6%
Hematologic, lymphatic, and endocrine procedures
712 616 1328 -13%
Neurologic system procedures 673 639 1312 -5%
Musculoskeletal system procedures 595 431 1026 -28%
Anesthesia 392 355 747 -9%
Respiratory procedures 374 328 702 -12%
Note: A single claim may include multiple procedures, including multiple procedures within the same category
67
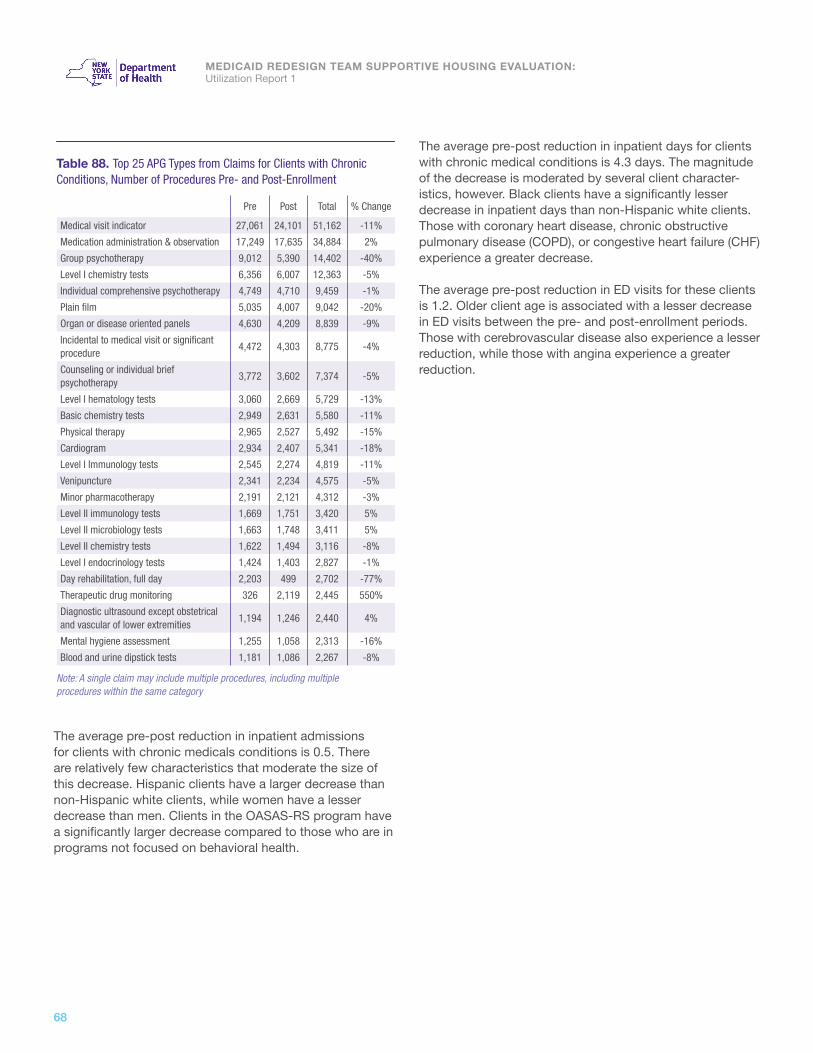
MEDICAID REDESIGN TEAM SUPPORTIVE HOUSING EVALUATION:Utilization Report 1
The average pre-post reduction in inpatient admissions for clients with chronic medicals conditions is 0.5. There are relatively few characteristics that moderate the size of this decrease. Hispanic clients have a larger decrease than non-Hispanic white clients, while women have a lesser decrease than men. Clients in the OASAS-RS program have a significantly larger decrease compared to those who are in programs not focused on behavioral health.
The average pre-post reduction in inpatient days for clients with chronic medical conditions is 4.3 days. The magnitude of the decrease is moderated by several client character-istics, however. Black clients have a significantly lesser decrease in inpatient days than non-Hispanic white clients. Those with coronary heart disease, chronic obstructive pulmonary disease (COPD), or congestive heart failure (CHF) experience a greater decrease.
The average pre-post reduction in ED visits for these clients is 1.2. Older client age is associated with a lesser decrease in ED visits between the pre- and post-enrollment periods. Those with cerebrovascular disease also experience a lesser reduction, while those with angina experience a greater reduction.
Table 88. Top 25 APG Types from Claims for Clients with Chronic Conditions, Number of Procedures Pre- and Post-Enrollment
Pre Post Total % Change
Medical visit indicator 27,061 24,101 51,162 -11%
Medication administration & observation 17,249 17,635 34,884 2%
Group psychotherapy 9,012 5,390 14,402 -40%
Level I chemistry tests 6,356 6,007 12,363 -5%
Individual comprehensive psychotherapy 4,749 4,710 9,459 -1%
Plain film 5,035 4,007 9,042 -20%
Organ or disease oriented panels 4,630 4,209 8,839 -9%
Incidental to medical visit or significant procedure
4,472 4,303 8,775 -4%
Counseling or individual brief psychotherapy
3,772 3,602 7,374 -5%
Level I hematology tests 3,060 2,669 5,729 -13%
Basic chemistry tests 2,949 2,631 5,580 -11%
Physical therapy 2,965 2,527 5,492 -15%
Cardiogram 2,934 2,407 5,341 -18%
Level I Immunology tests 2,545 2,274 4,819 -11%
Venipuncture 2,341 2,234 4,575 -5%
Minor pharmacotherapy 2,191 2,121 4,312 -3%
Level II immunology tests 1,669 1,751 3,420 5%
Level II microbiology tests 1,663 1,748 3,411 5%
Level II chemistry tests 1,622 1,494 3,116 -8%
Level I endocrinology tests 1,424 1,403 2,827 -1%
Day rehabilitation, full day 2,203 499 2,702 -77%
Therapeutic drug monitoring 326 2,119 2,445 550%
Diagnostic ultrasound except obstetrical and vascular of lower extremities
1,194 1,246 2,440 4%
Mental hygiene assessment 1,255 1,058 2,313 -16%
Blood and urine dipstick tests 1,181 1,086 2,267 -8%
Note: A single claim may include multiple procedures, including multiple procedures within the same category
68

ANALYSES BY DIAGNOSTIC GROUP
Table 89. Predictors of Pre-Post Changes in Inpatient and ED Utilization among Clients with Chronic Medical Conditions
Δ Inpatient Admissions Δ Inpatient Days Δ ED Visits
Unstandardized Coefficients
Unstandardized Coefficients
Unstandardized Coefficients
Model B Std. Error Sig. B Std. Error Sig. B Std. Error Sig.
(Constant) -0.131 0.464 -3.577 2.928 0.415 0.740
Age at Enrollment (in years, mean-centered for chronic conditions population)
0.015 0.013 0.132 0.079 † 0.055 0.020 **
Race/Ethnicity
Non-Hispanic white (Ref. category) -- -- -- -- -- --
Non-Hispanic Black (1=yes) 0.070 0.332 4.969 2.093 * 0.430 0.529
Hispanic (1=yes) -0.913 0.381 * 2.020 2.402 -0.224 0.607
Multiracial/Other (1=yes) 0.245 0.611 3.345 3.859 0.434 0.975
Sex
Male (Ref. category) -- -- -- -- -- --
Female (1=yes) 0.571 0.262 * 1.523 1.652 -0.051 0.417
Comorbidities
Severe mental illness (1=yes) 0.069 0.299 -2.174 1.889 0.017 0.477
Substance use disorder (1=yes) -0.377 0.283 -2.705 1.785 -0.515 0.451
HIV+ (1=yes) 0.231 0.291 0.747 1.838 0.042 0.464
Specific Diagnoses
Hypertension (Ref. category) -- -- -- -- -- --
Diabetes (1=yes) 0.115 0.275 -0.153 1.734 0.382 0.438
Asthma (1=yes) -0.140 0.300 2.725 1.895 -0.162 0.479
Coronary heart disease (1=yes) -0.469 0.371 -4.981 2.342 * -1.124 0.592 †
Osteoarthritis (1=yes) 0.133 0.321 0.588 2.027 -0.690 0.512
Chronic obstructive pulmonary dis. (1=yes) -0.385 0.360 -4.490 2.272 * -1.003 0.574 †
Cerebrovascular disease (1=yes) 0.030 0.396 -1.063 2.497 -1.449 0.631 *
Chronic kidney disease (1=yes) 0.045 0.389 -1.662 2.458 0.118 0.621
Congestive heart failure (1=yes) -0.483 0.557 -9.592 3.519 ** -1.150 0.889
Cancer (1=yes) -0.104 0.561 -0.774 3.538 -0.124 0.894
Angina (1=yes) -0.747 0.687 3.964 4.336 -3.646 1.095 ***
Acute myocardial infarction (1=yes) -0.573 0.868 -1.641 5.477 2.524 1.384 †
Program Enrollment †
Other program - not behavioral health-focused (Ref. category)
-- -- -- -- -- --
OMH Rental Subsidies – Brooklyn (1=yes) 0.299 0.399 -2.229 2.521 0.542 0.637
OMH Rental Subsidies – Statewide (1=yes) -0.317 0.416 -2.342 2.623 -1.116 0.663 †
OASAS Rental Subsidies (1=yes) -1.176 0.422 ** -4.961 2.665 † -1.205 0.673 †
Managed Care in Pre-Period
No months managed care (Ref. category) -- -- -- -- -- --
1+ Months Managed Care Enrollment (1=yes) 0.020 0.290 2.607 1.919 -0.652 0.462
*** p =<0.001, ** p >0.001 & =< 0.01, *p>0.01 & =<0.05, †p>0.05 & <0.10, n.s. = not significant† Note: The OASAS-RS and OMH programs were featured in the regression versus other programs because these three programs were the ones that showed the most promise in bivariate analysis (Table 85). When this was reversed and the AIDS Institute programs, East 99th, EPVA, OTDA Homeless Senior and Disabled Placement Pilot, and HHSP were the featured categories (compared to the three behavioral health-focused programs as a reference category, with OPWDD and HHAP excluded) none of the program coefficients were statistically significant (not shown).
69

MEDICAID REDESIGN TEAM SUPPORTIVE HOUSING EVALUATION:Utilization Report 1
SUMMARY AND CONCLUSIONS
MEDICAID REDESIGN TEAM SUPPORTIVE HOUSING EVALUATION:
Utilization Report 1

SUMMARY AND CONCLUSIONS
The MRT-SH programs are serving a diverse population, with serious health needs and high rates of comorbidities. Consistent with the design and intention of the MRT-SH initiative, the programs are serving a seriously ill population with high rates of comorbidities. The program participants are racially and ethnically diverse, with a mean age of 47.1 years. Across the programs, there is a significant overlap in the populations served, given this high rate of comorbidities.
Most programs are serving participants who utilized a significant amount of high cost Medicaid services prior to enrollment in supportive housing. Prior to enrollment in supportive housing, in general, participants experienced high rates of inpatient and emergency department utilization, especially for care related to mental health conditions and substance abuse. This finding suggests that most programs are enrolling high cost Medicaid utilizers.
When considering the MRT-SH programs overall, inpatient and emergency department services are being used less. Following enrollment in supportive housing, virtually all inpatient and emergency department services were used significantly less when considering the MRT-SH program participants overall. This finding is consistent with previous supportive housing research, which noted reductions in acute, high cost services, such as inpatient and emergency department visits (Goering et al., 2015; Metraux et al., 2003; Srebnik et al., 2013; Sadowski et al, 2009; Wright et al., 2016). Unquestionably, this reduction in utilization is a positive finding within the current study. Not only is care in these settings more costly, but an inpatient admission or emergency department visit may be suggestive of a chronic condition or health crisis that negatively impacts a patient’s quality of life overall (particularly for mental health and substance abuse conditions). Patients may also use emergency departments inappropriately to seek care for conditions that could be more effectively managed in a doctor’s office or clinic. The current study suggests that housing and supportive services provided by the MRT-SH programs may be effectively reducing these types of visits as well.
The findings of the pre-post analyses varied substantially across programs. A number of programs showed particular promise in terms of reducing inpatient and emergency department utilization in the current study, including the AIDS Institute “services only” program, OASAS Rental Subsidies, OMH Rental Subsidies Statewide, and the OTDA Homeless Housing and Assistance Program (HHAP) programs. Of these programs, OASAS Rental Subsidies and OMH Rental Subsidies Statewide showed especially strong findings, with significant reductions across all (for OASAS Rental Subsidies) or almost all (for OMH Rental Subsidies Statewide) major inpatient and emergency department service categories measured. Some programs showed less promising findings to date, though it is important to note that at this early stage, findings may change as the evaluation continues. There were no statistically significant differences in use of inpatient or emergency department care for the East 99th Street program and the OPWDD Expansion program. For the OPWDD program in particular, it is important to note that participants typically did not have high rates of acute service utilization in the pre-period. Since these participants are transitioning from more intensive supervised settings into supportive housing, a trajectory leading to Medicaid cost savings is likely to differ from the other programs (e.g., potential costs savings are more likely to result from reductions in cost of the program setting, rather than savings from participants’ utilization of high cost Medicaid services).
MRT-SH enrollees are receiving fewer outpatient behavioral health services. An unexpected finding emerged in the current study, which suggests that MRT-SH participants are receiving less primary care and preventative services in a number of the programs. This finding is difficult to interpret, and contrasts with previous supportive housing research, which generally finds increases in more “community-based” outpatient services, alongside decreases in high cost, acute care services (Goering et al., 2015). In the current study, increases to primary care services are not observed, but neither are increases in inpatient and emergency services. This finding suggests that the MRT-SH enrollees are suffering no ill effects of a primary care decrease; if they were not receiving needed care, they would be more likely to require acute hospital services (e.g. inpatient/emergency department services). It may be the case that the overall health of these enrollees has improved, reducing a need in the overall volume of health services. Additional hypotheses are that supportive services provided by some of the MRT-SH programs (e.g. home visits, interactions with peer counselors) may be taking the place of some outpatient behavioral health services, and that stable housing is reducing the need for hospital use among populations who had previously been homeless.
All four diagnostic groups (SMI, SUD, HIV+, and chronic conditions) experienced statistically significant reductions in inpatient days and emergency department visits, with individuals with an SUD showing the largest reductions in utilization. While all diagnostic groups experienced reductions in utilization, individuals with a SUD experienced the largest average net reductions in inpatient days and emergency department visits. This finding held whether or not the clients were enrolled in the OASAS-RS program or another program, although the reductions tended to be greater for SUD clients in the OASAS-RS program. This finding suggests that individuals with an SUD may especially benefit from supportive housing. Indeed, previous research has found that supportive housing, informed by a Housing First approach, leads to reductions in substance abuse, which may positively impact the health of participants (Padgett et al., 2011). This relationship is one potential trajectory that may be influencing the positive findings among individuals with an SUD in supportive housing. Individuals with an SUD may be a key population for all programs to target, but with the caveat that utilization among individuals with an SUD tends to be highly unstable from one year to the next. Comparison group analysis will be important for determining whether these reductions are significantly greater than those observed for individuals with an SUD not enrolled in the in MRT-SH programs.
More research is needed to understand how the MRT-SH programs are impacting the trajectories of program participants. While these findings are promising, there is still much to learn about how MRT-SH programs may improve the lives of enrollees. One critical element is to learn more about the content of the supportive services that are being provided by different MRT-SH programs, which will be highlighted in the upcoming implementation study. Another approach is to conduct more sophisticated statistical modeling that holds constant for demographic characteristics and other variables known to affect health care outcomes. In sum, this is only a first look at a promising new approach to housing as health care. As more data become available, there is much more to learn about the potential of the MRT-SH initiative.
SUMMARY AND CONCLUSIONS
71

MEDICAID REDESIGN TEAM SUPPORTIVE HOUSING EVALUATION:Utilization Report 1
MEASUREMENT OF KEY CONSTRUCTS
MEDICAID REDESIGN TEAM SUPPORTIVE HOUSING EVALUATION:
Utilization Report 1
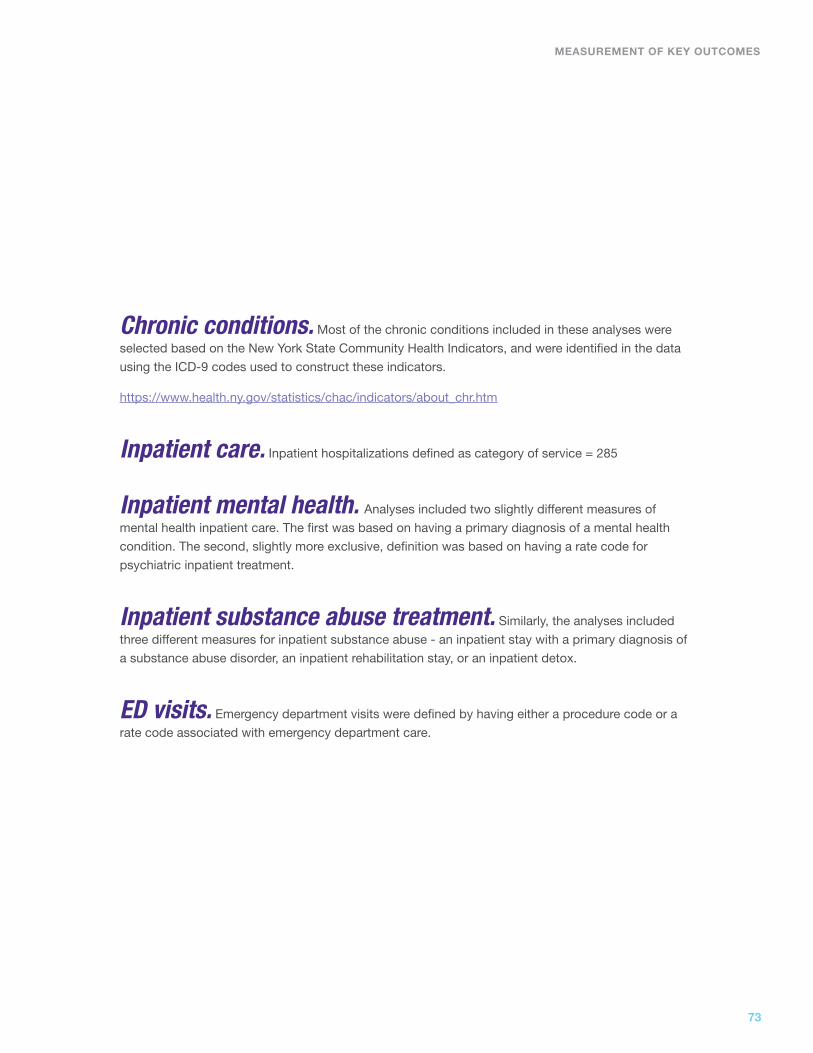
Chronic conditions. Most of the chronic conditions included in these analyses were
selected based on the New York State Community Health Indicators, and were identified in the data
using the ICD-9 codes used to construct these indicators.
https://www.health.ny.gov/statistics/chac/indicators/about_chr.htm
Inpatient care. Inpatient hospitalizations defined as category of service = 285
Inpatient mental health. Analyses included two slightly different measures of
mental health inpatient care. The first was based on having a primary diagnosis of a mental health
condition. The second, slightly more exclusive, definition was based on having a rate code for
psychiatric inpatient treatment.
Inpatient substance abuse treatment. Similarly, the analyses included
three different measures for inpatient substance abuse - an inpatient stay with a primary diagnosis of
a substance abuse disorder, an inpatient rehabilitation stay, or an inpatient detox.
ED visits. Emergency department visits were defined by having either a procedure code or a
rate code associated with emergency department care.
MEASUREMENT OF KEY OUTCOMES
73

MEDICAID REDESIGN TEAM SUPPORTIVE HOUSING EVALUATION:Utilization Report 1
REFERENCES
MEDICAID REDESIGN TEAM SUPPORTIVE HOUSING EVALUATION:
Utilization Report 1

Chambers, C., Chiu, S., Katic, M., Kiss, A., Redelmeier, D.A., Levinson, W. et al. High utilizers of emergency health services in a population-based cohort of homeless adults. American Journal of Public Health, 103, S302-S310.
Culhane, D.P., Metraux, S., & Hadley, T. (2002). Public service reductions associated with placement of homeless persons with severe mental illness in supportive housing. Housing Policy Debate, 13, 228-244.
Culhane, D.P., Metraux, S., & Hadley, T. (2002). The impact of supportive housing for homeless people with severe mental illness on the utilization of the public health, corrections, and emergency shelter systems: The New York New York Initiative. Housing Policy Debate, 13(1), 107-163.
Goering, P., Velhuizen, S., Watson, A., Adair, C., Kopp, B., Latimer, E., et al. (2014). National final report: Cross-site At Home/Chez Soi project. Calgary, AB: Mental Health Commission of Canada.
Henwood, B.F., Cabassa, J., Craig, C.M., & Padgett, D.K. (2013). Permanent supportive housing: Addressing homelessness and health disparities? American Journal of Public Health, 103, S188-S192.
Henwood, B.F., Katz, M.L., & Gilmer, T.P. (2014). Aging in place within permanent supportive housing. Geriatric Psychiatry, 30, 80-87.
HUD 2010 Report. The 2010 Annual Homeless Assessment Report to Congress. (2010). U.S. Department of Housing and Urban Development and Office of Community Planning and Development.
Hwang, S.W. (2001). Homelessness and health. CMAJ, 164(2), 229-233.
Kushel, M.B., Perry, S., Bangsberg, D., Clark, R., Moss, A.R. (2002). Emergency department use among the homeless and marginally housed: Results from a community-based study. American Journal of Public Health, 92(5), 778-784.
Kushel, M.B., Vittinghoff, E., Haas, J.S. (2001). Factors associated with health care utilization of homeless persons JAMA, 285(2), 200-206.
Metraux, S., Marcus, S.C., Culhane, D.P. (2003). The New York-New York housing initiative and use of public shelters by persons with severe mental illness. Psychiatric Services, 54, 67-61.
Larimer, M.E., Malone, D.K., Garner, M.D., Atkins, D.C., Burlingham, B., Lonczak, H.S. et al. (2009). Health care and public service use and costs before and after provision of housing for chronically homeless persons with severe alcohol problems. JAMA, 301(13), 1349-1357.
Padgett, D.K., Stanhope, V., Henwood, B.F., & Stefancic, A. (2011). Substance use outcomes among homeless clients with serious mental illness: Comparing Housing First with Treatment First programs. Community Mental Health Journal, 47(2), 227-232.
Palepu, A., Patterson, M.L., Moniruzzaman, A., Frankish, C.J., & Somers, J. (2013). Housing First improves residential stability in homeless adults with concurrent substance dependence and mental disorders. American Journal of Public Health, 103 (S2), 30-36.
Sadowski, L.S., Kee, R.A., VanderWeele, T.J., & Buchanan, D. (2009). Effect of a housing and case management program on emergency department visits and hospitalizations among chronically ill homeless adults: A randomized trial. JAMA, 301(17), 1171-1178.
Srebnik, D., Connor, T., & Sylla, L. (2013). A pilot study of the impact of housing first- supported housing for intensive users of medical hospitalization and sobering services. American Journal of Public Health, 103(2), 316-321.
Stefancic, A. & Tsemberis, S. (2007). Housing First for long-term shelter dwellers with psychiatric disabilities in a suburban county: A four-year study of housing access and retention. Journal of Primary Prevention, 28(3-4), 265-279.
Stergiopoulos, V., Hwang, S.W., Gozdzik, A., Nisenbaum, R., Latimer, E., Rabouin, D., et al. (2015). Effect of scattered-site housing using rental supplements and intensive case management on housing stability among homeless adults with mental illness: A randomized trial. JAMA, 313(9), 905-915.
Wright, B.J., Vartanian, K.B., Li, H.F., Royal, J., Matson, J.K. (2016). Formerly homeless people had lower overall health care expenditures after moving into supportive housing. Health Affairs, 35(1), 20-27.
REFERENCES
75
Medicaid Redesign Team Supportive Housing Evaluation:
UTILIZATION REPORT 1