medicaid’s long-term care users: spending patterns across
TRANSCRIPT
medicaid
kaiser commiss ion o nI
S
S
U
E
P
A
P
E
R
a n d t h e uninsured
1 3 3 0 G S T R E E T N W , W A S H I N G T O N , D C 2 0 0 0 5P H O N E : 2 0 2 - 3 4 7 - 5 2 7 0 , F A X : 2 0 2 - 3 4 7 - 5 2 7 4W E B S I T E : W W W . K F F . O R G
Medicaid’s Long-Term Care Users:
Spending Patterns Across Institutional and Community-based Settings
Executive Summary
Medicaid has evolved to become our nation’s primary payer for long-term services and supports, financing nearly half (43 percent) of all spending on long-term care services. Medicaid plays a particularly important role in our health care system by covering a range of services and supports including those needed by people to live independently in the community as well as services provided in institutions. Medicaid beneficiaries who rely on long-term services and supports (referred to as “long-term care users” in this paper) are a diverse population with a range of chronic conditions, disabilities and diseases whose spending and enrollment patterns vary widely across different types of service settings. This report provides an overview of long-term care users and their acute and long-term care service spending. Analysis is based on data from the FFY 2007 Medicaid Statistical Information System (MSIS) Summary File.
Key Findings
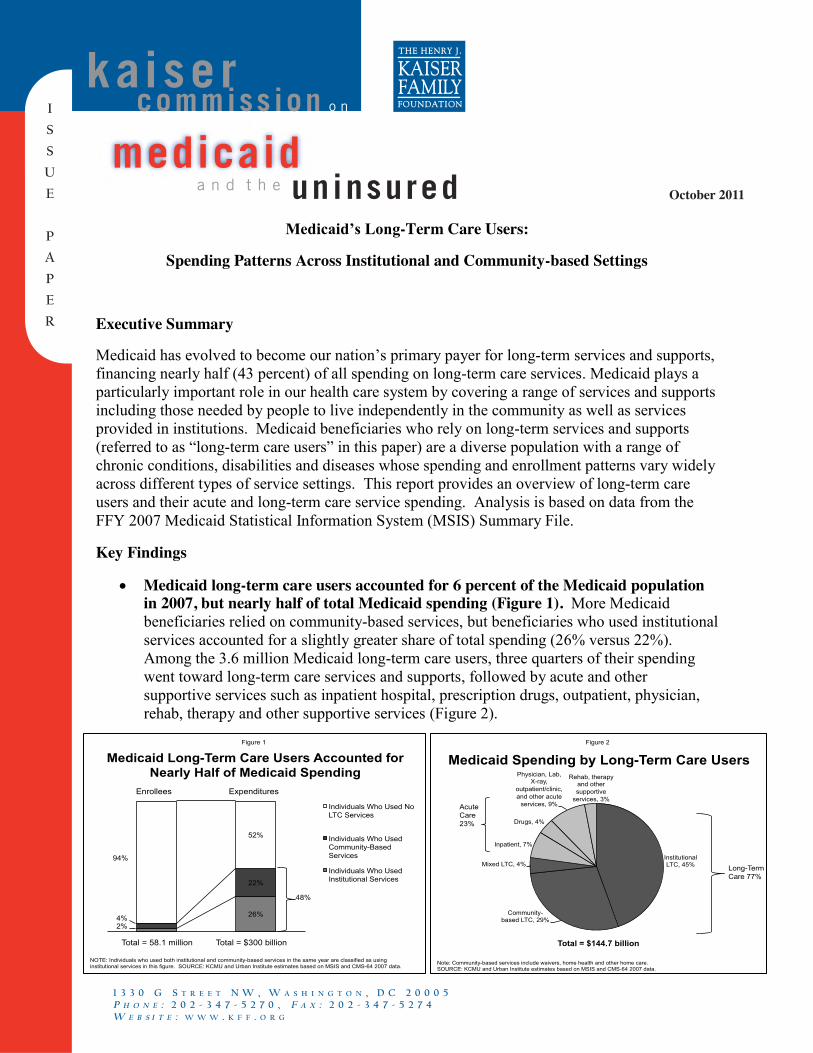
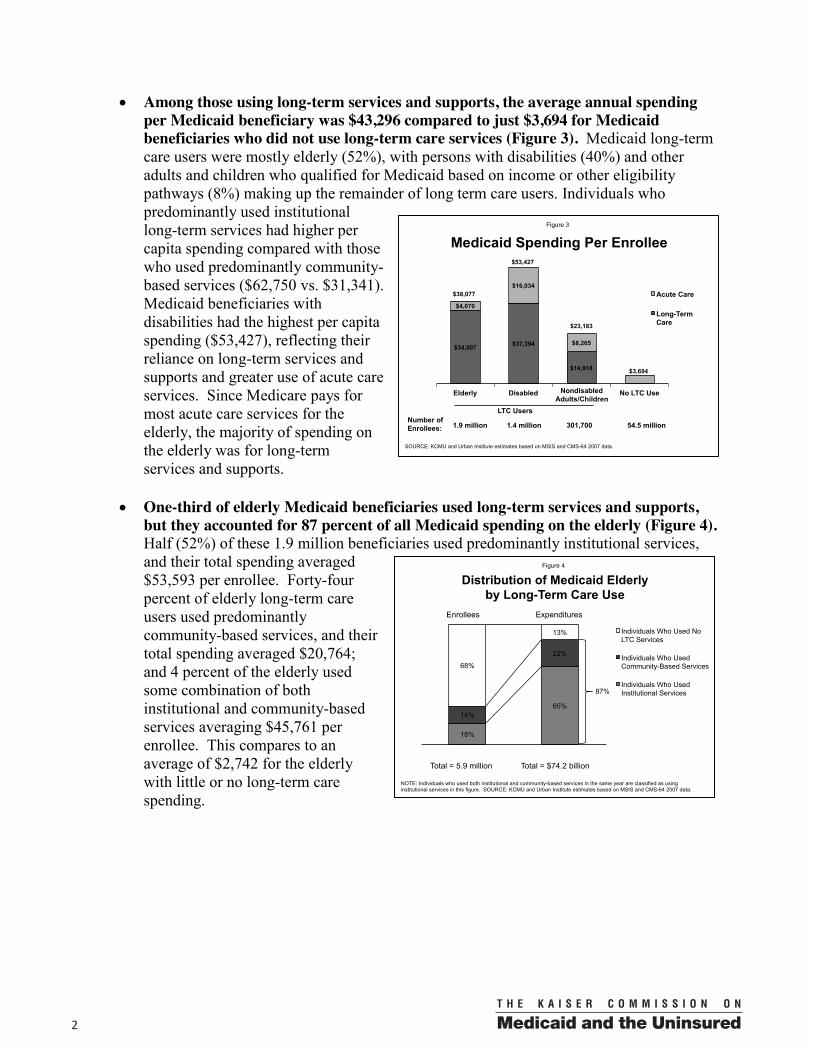
Medicaid long-term care users accounted for 6 percent of the Medicaid population in 2007, but nearly half of total Medicaid spending (Figure 1). More Medicaid beneficiaries relied on community-based services, but beneficiaries who used institutional services accounted for a slightly greater share of total spending (26% versus 22%). Among the 3.6 million Medicaid long-term care users, three quarters of their spending went toward long-term care services and supports, followed by acute and other supportive services such as inpatient hospital, prescription drugs, outpatient, physician, rehab, therapy and other supportive services (Figure 2).
Medicaid Long-Term Care Users Accounted for Nearly Half of Medicaid Spending
2%
26% 4%
22%
94%
52%
Individuals Who Used No LTC Services
Individuals Who Used Community-Based Services
Individuals Who Used Institutional Services
NOTE: Individuals who used both institutional and community-based services in the same year are classified as using institutional services in this figure. SOURCE: KCMU and Urban Institute estimates based on MSIS and CMS-64 2007 data.
Total = 58.1 million Total = $300 billion
Enrollees Expenditures
48%
Figure 1
Medicaid Spending by Long-Term Care Users
Institutional LTC, 45%
Community-based LTC, 29%
Mixed LTC, 4%
Inpatient, 7%
Drugs, 4%
Physician, Lab, X-ray,
outpatient/clinic, and other acute
services, 9%
Rehab, therapy and other supportive
services, 3%
Figure 2
Note: Community-based services include waivers, home health and other home care. SOURCE: KCMU and Urban Institute estimates based on MSIS and CMS-64 2007 data.
Total = $144.7 billion
Long-Term Care 77%
Acute Care 23%
October 2011
002
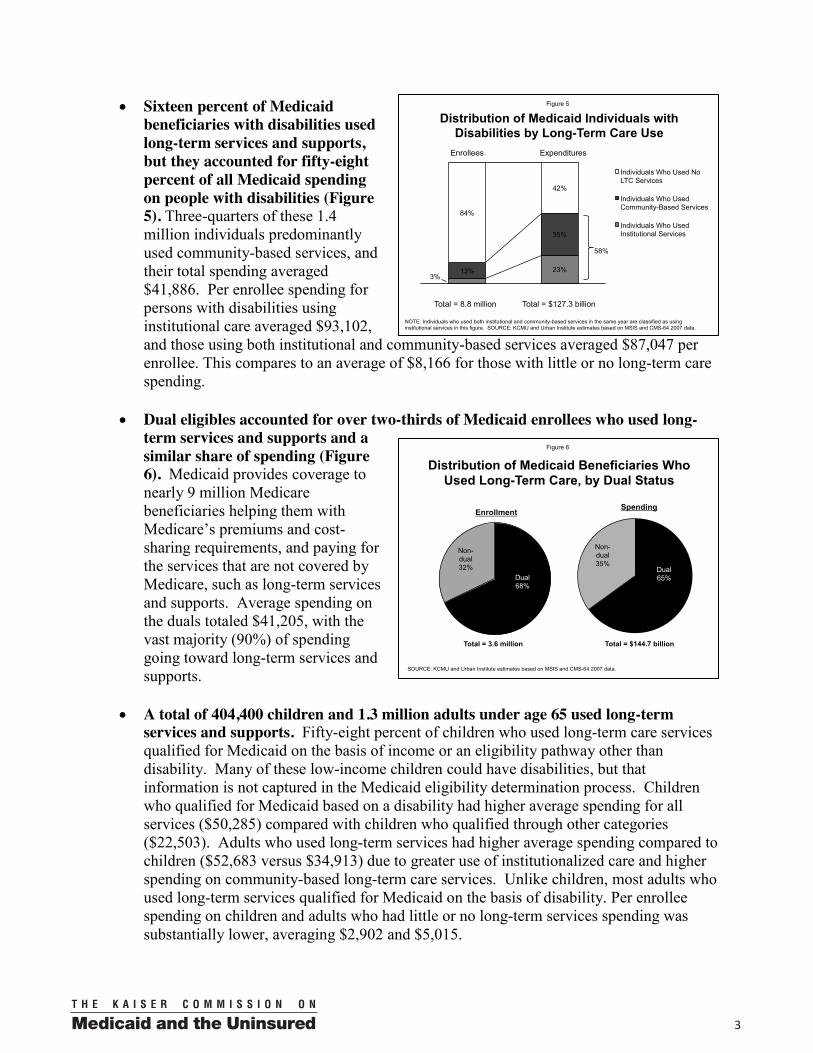
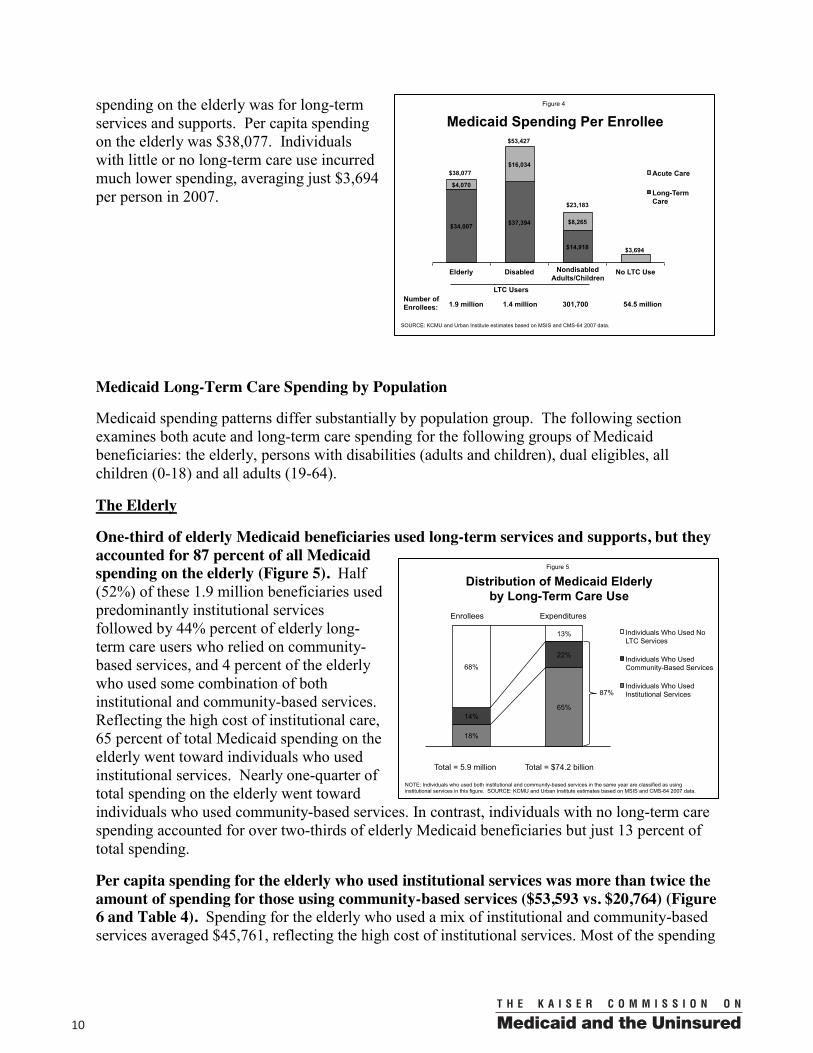
Among those using long-term services and supports, the average annual spending per Medicaid beneficiary was $43,296 compared to just $3,694 for Medicaid beneficiaries who did not use long-term care services (Figure 3). Medicaid long-termcare users were mostly elderly (52%), with persons with disabilities (40%) and other adults and children who qualified for Medicaid based on income or other eligibility pathways (8%) making up the remainder of long term care users. Individuals who predominantly used institutional long-term services had higher per capita spending compared with those who used predominantly community-based services ($62,750 vs. $31,341). Medicaid beneficiaries with disabilities had the highest per capita spending ($53,427), reflecting their reliance on long-term services and supports and greater use of acute care services. Since Medicare pays for most acute care services for the elderly, the majority of spending on the elderly was for long-term services and supports.
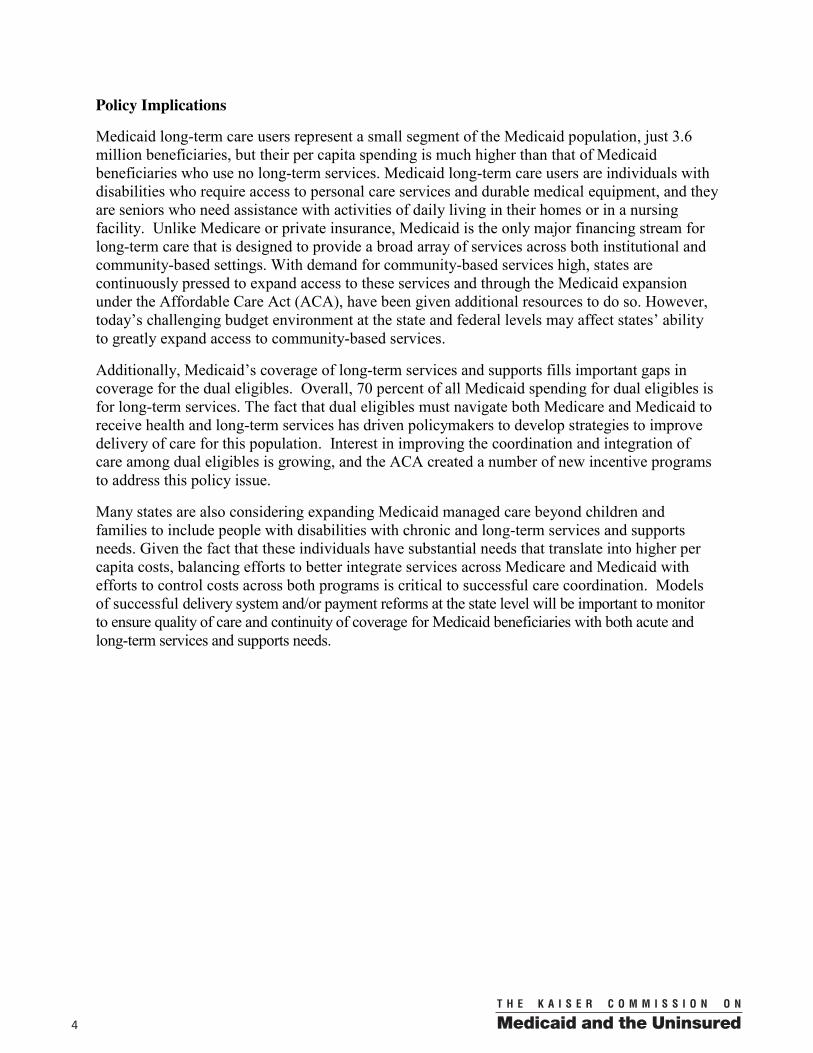
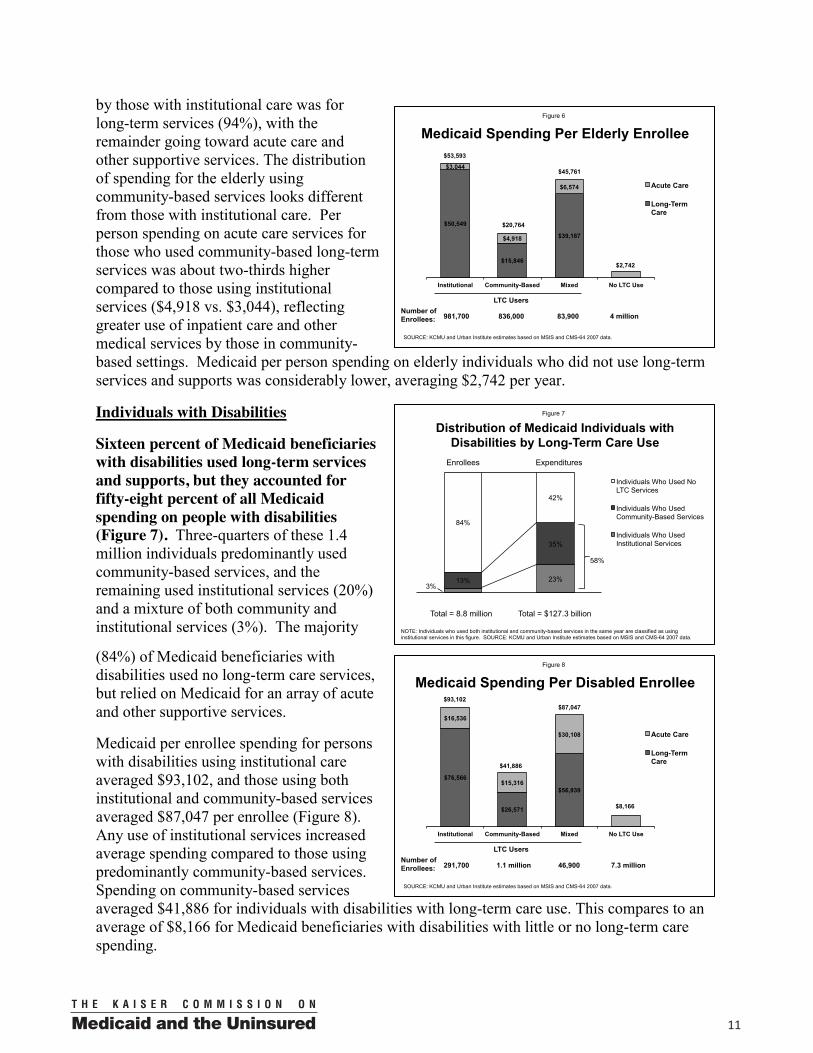
One-third of elderly Medicaid beneficiaries used long-term services and supports, but they accounted for 87 percent of all Medicaid spending on the elderly (Figure 4). Half (52%) of these 1.9 million beneficiaries used predominantly institutional services,and their total spending averaged $53,593 per enrollee. Forty-four percent of elderly long-term care users used predominantly community-based services, and their total spending averaged $20,764;and 4 percent of the elderly used some combination of both institutional and community-based services averaging $45,761 per enrollee. This compares to an average of $2,742 for the elderly with little or no long-term care spending.
Distribution of Medicaid Elderly by Long-Term Care Use
18%
65% 14%
22%
68%
13%
1 2
Individuals Who Used No LTC Services
Individuals Who Used Community-Based Services
Individuals Who Used Institutional Services
Total = 5.9 million Total = $74.2 billion
Enrollees Expenditures
87%
Figure 4
NOTE: Individuals who used both institutional and community-based services in the same year are classified as using institutional services in this figure. SOURCE: KCMU and Urban Institute estimates based on MSIS and CMS-64 2007 data.
Medicaid Spending Per Enrollee
$34,007 $37,394
$14,918
$4,070
$16,034
$8,265
$3,694
Elderly Disabled No LTC Use
Acute Care
Long-Term Care
SOURCE: KCMU and Urban Institute estimates based on MSIS and CMS-64 2007 data.
Number of Enrollees: 1.9 million 1.4 million 301,700 54.5 million
LTC Users
Figure 3
$38,077
$53,427
$23,183
Nondisabled Adults/Children
00 3
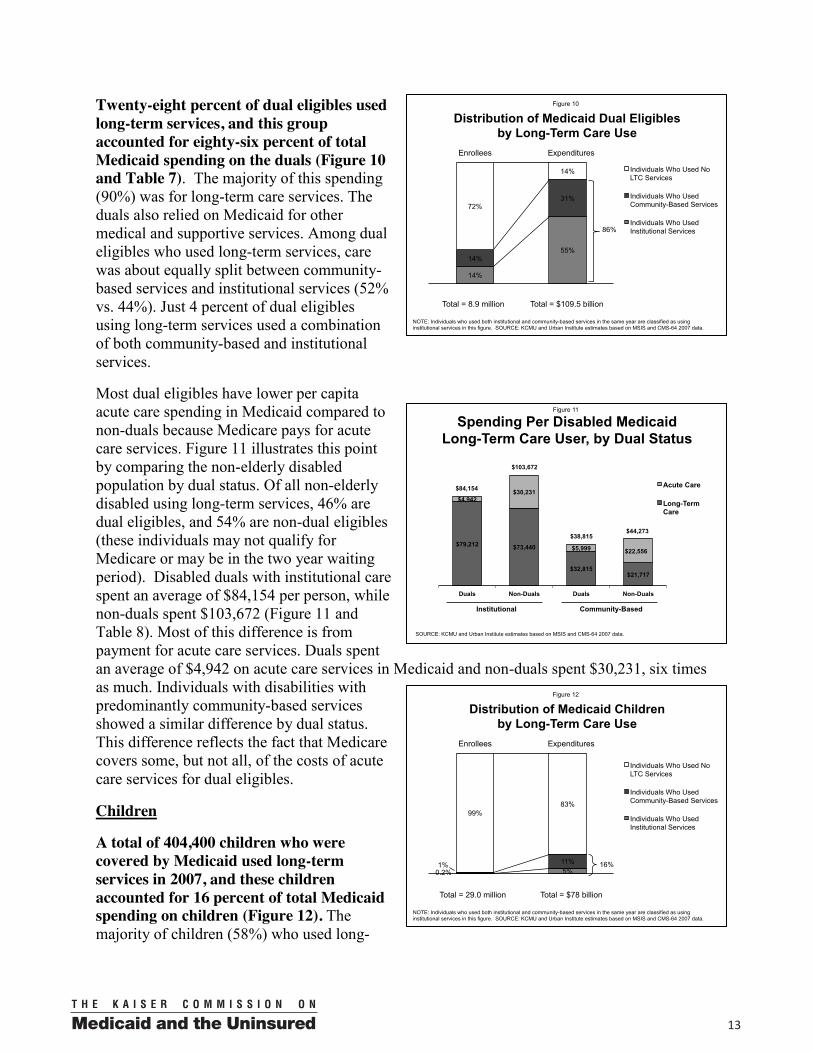
Sixteen percent of Medicaid beneficiaries with disabilities used long-term services and supports, but they accounted for fifty-eight percent of all Medicaid spending on people with disabilities (Figure 5). Three-quarters of these 1.4 million individuals predominantly used community-based services, and their total spending averaged $41,886. Per enrollee spending for persons with disabilities using institutional care averaged $93,102,and those using both institutional and community-based services averaged $87,047 per enrollee. This compares to an average of $8,166 for those with little or no long-term care spending.
Dual eligibles accounted for over two-thirds of Medicaid enrollees who used long-term services and supports and a similar share of spending (Figure 6). Medicaid provides coverage to nearly 9 million Medicare beneficiaries helping them withMedicare’s premiums and cost-sharing requirements, and paying for the services that are not covered by Medicare, such as long-term services and supports. Average spending on the duals totaled $41,205, with the vast majority (90%) of spending going toward long-term services and supports.
A total of 404,400 children and 1.3 million adults under age 65 used long-term services and supports. Fifty-eight percent of children who used long-term care services qualified for Medicaid on the basis of income or an eligibility pathway other than disability. Many of these low-income children could have disabilities, but that information is not captured in the Medicaid eligibility determination process. Children who qualified for Medicaid based on a disability had higher average spending for all services ($50,285) compared with children who qualified through other categories ($22,503). Adults who used long-term services had higher average spending compared to children ($52,683 versus $34,913) due to greater use of institutionalized care and higher spending on community-based long-term care services. Unlike children, most adults who used long-term services qualified for Medicaid on the basis of disability. Per enrollee spending on children and adults who had little or no long-term services spending was substantially lower, averaging $2,902 and $5,015.
Distribution of Medicaid Beneficiaries Who Used Long-Term Care, by Dual Status
Dual 68%
Non-dual 32%
Enrollment
Dual 65%
Non-dual 35%
Spending
Figure 6
SOURCE: KCMU and Urban Institute estimates based on MSIS and CMS-64 2007 data.
Total = 3.6 million Total = $144.7 billion
Distribution of Medicaid Individuals with Disabilities by Long-Term Care Use
3% 23% 13%
35%
84%
42%
1 2
Individuals Who Used No LTC Services
Individuals Who Used Community-Based Services
Individuals Who Used Institutional Services
Total = 8.8 million Total = $127.3 billion
Enrollees Expenditures
58%
Figure 5
NOTE: Individuals who used both institutional and community-based services in the same year are classified as using institutional services in this figure. SOURCE: KCMU and Urban Institute estimates based on MSIS and CMS-64 2007 data.
004
Policy Implications
Medicaid long-term care users represent a small segment of the Medicaid population, just 3.6 million beneficiaries, but their per capita spending is much higher than that of Medicaid beneficiaries who use no long-term services. Medicaid long-term care users are individuals with disabilities who require access to personal care services and durable medical equipment, and they are seniors who need assistance with activities of daily living in their homes or in a nursing facility. Unlike Medicare or private insurance, Medicaid is the only major financing stream for long-term care that is designed to provide a broad array of services across both institutional and community-based settings. With demand for community-based services high, states are continuously pressed to expand access to these services and through the Medicaid expansion under the Affordable Care Act (ACA), have been given additional resources to do so. However, today’s challenging budget environment at the state and federal levels may affect states’ ability to greatly expand access to community-based services.
Additionally, Medicaid’s coverage of long-term services and supports fills important gaps in coverage for the dual eligibles. Overall, 70 percent of all Medicaid spending for dual eligibles is for long-term services. The fact that dual eligibles must navigate both Medicare and Medicaid to receive health and long-term services has driven policymakers to develop strategies to improve delivery of care for this population. Interest in improving the coordination and integration of care among dual eligibles is growing, and the ACA created a number of new incentive programs to address this policy issue.
Many states are also considering expanding Medicaid managed care beyond children and families to include people with disabilities with chronic and long-term services and supports needs. Given the fact that these individuals have substantial needs that translate into higher per capita costs, balancing efforts to better integrate services across Medicare and Medicaid with efforts to control costs across both programs is critical to successful care coordination. Models of successful delivery system and/or payment reforms at the state level will be important to monitor to ensure quality of care and continuity of coverage for Medicaid beneficiaries with both acute and long-term services and supports needs.
00 5
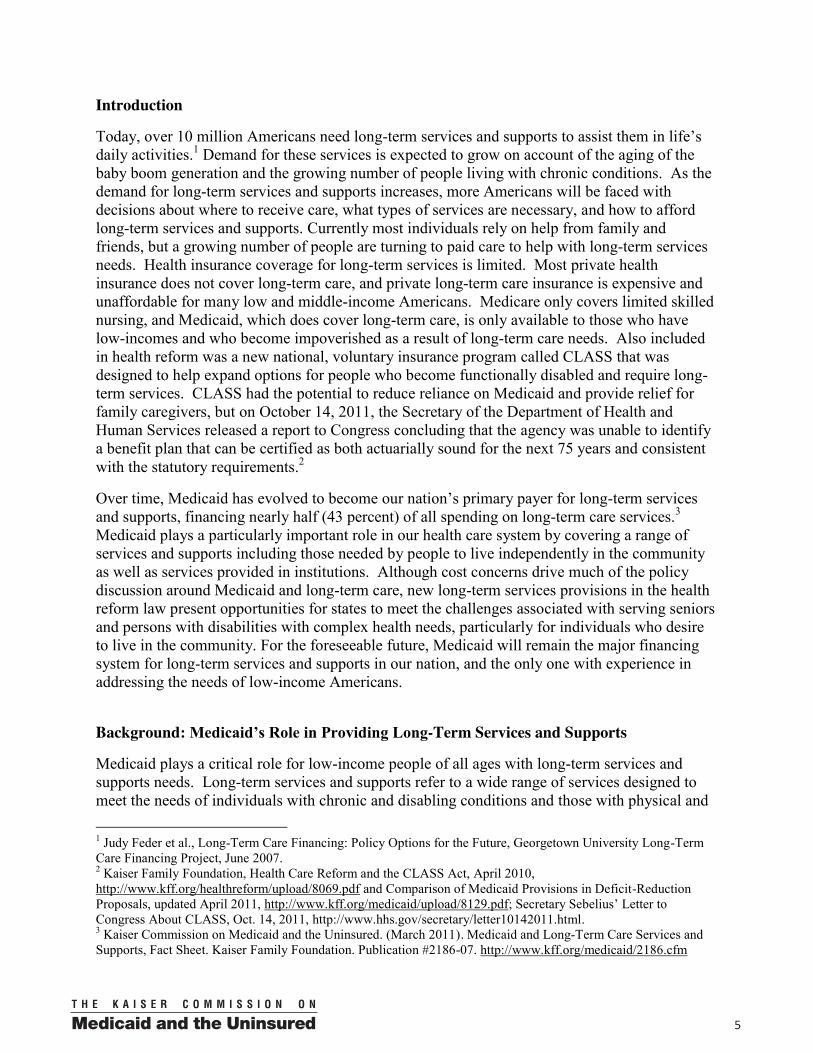
Introduction
Today, over 10 million Americans need long-term services and supports to assist them in life’s daily activities.1 Demand for these services is expected to grow on account of the aging of the baby boom generation and the growing number of people living with chronic conditions. As the demand for long-term services and supports increases, more Americans will be faced with decisions about where to receive care, what types of services are necessary, and how to afford long-term services and supports. Currently most individuals rely on help from family and friends, but a growing number of people are turning to paid care to help with long-term services needs. Health insurance coverage for long-term services is limited. Most private health insurance does not cover long-term care, and private long-term care insurance is expensive and unaffordable for many low and middle-income Americans. Medicare only covers limited skilled nursing, and Medicaid, which does cover long-term care, is only available to those who have low-incomes and who become impoverished as a result of long-term care needs. Also included in health reform was a new national, voluntary insurance program called CLASS that wasdesigned to help expand options for people who become functionally disabled and require long-term services. CLASS had the potential to reduce reliance on Medicaid and provide relief for family caregivers, but on October 14, 2011, the Secretary of the Department of Health and Human Services released a report to Congress concluding that the agency was unable to identify a benefit plan that can be certified as both actuarially sound for the next 75 years and consistent with the statutory requirements.2
Over time, Medicaid has evolved to become our nation’s primary payer for long-term services and supports, financing nearly half (43 percent) of all spending on long-term care services.3Medicaid plays a particularly important role in our health care system by covering a range of services and supports including those needed by people to live independently in the community as well as services provided in institutions. Although cost concerns drive much of the policy discussion around Medicaid and long-term care, new long-term services provisions in the health reform law present opportunities for states to meet the challenges associated with serving seniors and persons with disabilities with complex health needs, particularly for individuals who desire to live in the community. For the foreseeable future, Medicaid will remain the major financing system for long-term services and supports in our nation, and the only one with experience in addressing the needs of low-income Americans.
Background: Medicaid’s Role in Providing Long-Term Services and Supports
Medicaid plays a critical role for low-income people of all ages with long-term services and supports needs. Long-term services and supports refer to a wide range of services designed to meet the needs of individuals with chronic and disabling conditions and those with physical and
1 Judy Feder et al., Long-Term Care Financing: Policy Options for the Future, Georgetown University Long-Term Care Financing Project, June 2007. 2 Kaiser Family Foundation, Health Care Reform and the CLASS Act, April 2010, http://www.kff.org/healthreform/upload/8069.pdf and Comparison of Medicaid Provisions in Deficit-Reduction Proposals, updated April 2011, http://www.kff.org/medicaid/upload/8129.pdf; Secretary Sebelius’ Letter to Congress About CLASS, Oct. 14, 2011, http://www.hhs.gov/secretary/letter10142011.html. 3 Kaiser Commission on Medicaid and the Uninsured. (March 2011). Medicaid and Long-Term Care Services and Supports, Fact Sheet. Kaiser Family Foundation. Publication #2186-07. http://www.kff.org/medicaid/2186.cfm
006
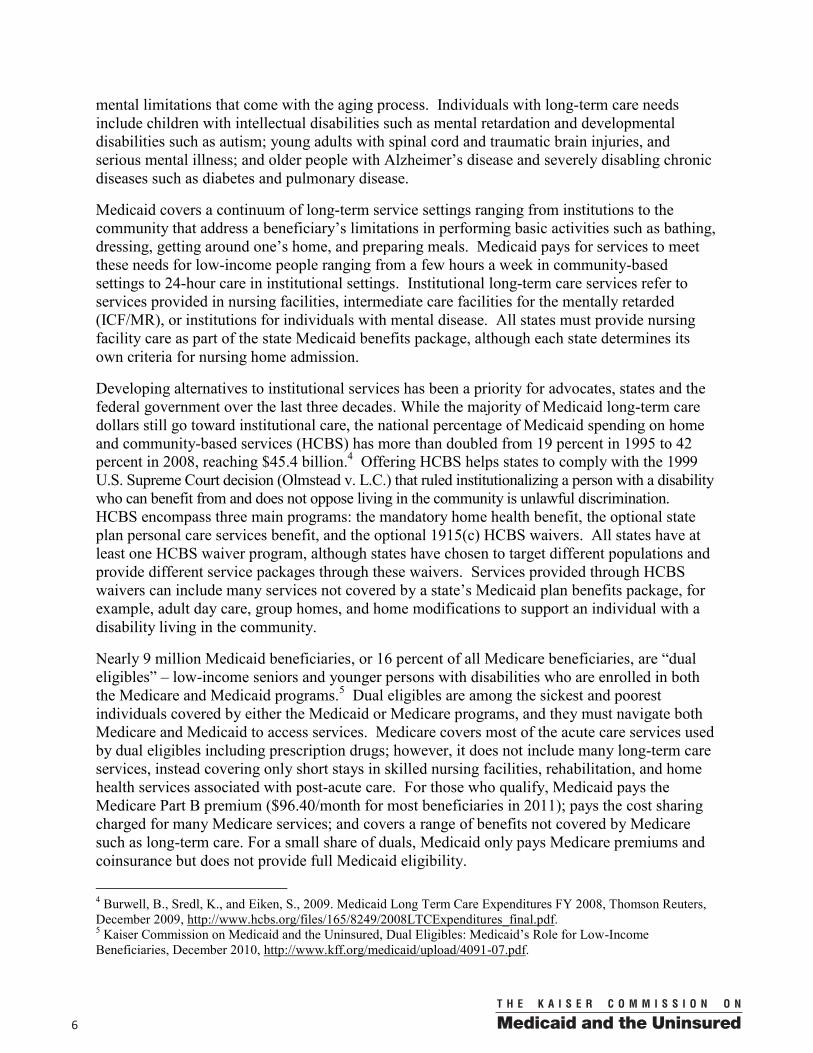
mental limitations that come with the aging process. Individuals with long-term care needs include children with intellectual disabilities such as mental retardation and developmental disabilities such as autism; young adults with spinal cord and traumatic brain injuries, and serious mental illness; and older people with Alzheimer’s disease and severely disabling chronic diseases such as diabetes and pulmonary disease.
Medicaid covers a continuum of long-term service settings ranging from institutions to the community that address a beneficiary’s limitations in performing basic activities such as bathing, dressing, getting around one’s home, and preparing meals. Medicaid pays for services to meet these needs for low-income people ranging from a few hours a week in community-based settings to 24-hour care in institutional settings. Institutional long-term care services refer to services provided in nursing facilities, intermediate care facilities for the mentally retarded (ICF/MR), or institutions for individuals with mental disease. All states must provide nursing facility care as part of the state Medicaid benefits package, although each state determines its own criteria for nursing home admission.
Developing alternatives to institutional services has been a priority for advocates, states and the federal government over the last three decades. While the majority of Medicaid long-term care dollars still go toward institutional care, the national percentage of Medicaid spending on home and community-based services (HCBS) has more than doubled from 19 percent in 1995 to 42 percent in 2008, reaching $45.4 billion.4 Offering HCBS helps states to comply with the 1999U.S. Supreme Court decision (Olmstead v. L.C.) that ruled institutionalizing a person with a disability who can benefit from and does not oppose living in the community is unlawful discrimination.HCBS encompass three main programs: the mandatory home health benefit, the optional state plan personal care services benefit, and the optional 1915(c) HCBS waivers. All states have at least one HCBS waiver program, although states have chosen to target different populations and provide different service packages through these waivers. Services provided through HCBS waivers can include many services not covered by a state’s Medicaid plan benefits package, for example, adult day care, group homes, and home modifications to support an individual with a disability living in the community.
Nearly 9 million Medicaid beneficiaries, or 16 percent of all Medicare beneficiaries, are “dual eligibles” – low-income seniors and younger persons with disabilities who are enrolled in both the Medicare and Medicaid programs.5 Dual eligibles are among the sickest and poorest individuals covered by either the Medicaid or Medicare programs, and they must navigate both Medicare and Medicaid to access services. Medicare covers most of the acute care services used by dual eligibles including prescription drugs; however, it does not include many long-term care services, instead covering only short stays in skilled nursing facilities, rehabilitation, and home health services associated with post-acute care. For those who qualify, Medicaid pays the Medicare Part B premium ($96.40/month for most beneficiaries in 2011); pays the cost sharing charged for many Medicare services; and covers a range of benefits not covered by Medicare such as long-term care. For a small share of duals, Medicaid only pays Medicare premiums and coinsurance but does not provide full Medicaid eligibility.
4 Burwell, B., Sredl, K., and Eiken, S., 2009. Medicaid Long Term Care Expenditures FY 2008, Thomson Reuters, December 2009, http://www.hcbs.org/files/165/8249/2008LTCExpenditures_final.pdf.5 Kaiser Commission on Medicaid and the Uninsured, Dual Eligibles: Medicaid’s Role for Low-Income Beneficiaries, December 2010, http://www.kff.org/medicaid/upload/4091-07.pdf.

00 7
Data Sources and Methods
The data used in this analysis come from the FFY 2007 Medicaid Statistical Information System (MSIS) Summary File maintained by the Centers for Medicare and Medicaid Services (CMS). This report is an update of a previous Urban Institute and Kaiser Commission on Medicaid and the Uninsured analysis conducted with FFY 2002 data.6 The MSIS contains demographic, eligibility, and expenditure information for all Medicaid enrollees, with spending aggregated into over 30 types of services. Expenditures reported in MSIS do not include disproportionate share payments to providers, payments to Medicare, or administrative payments.
We designate all enrollees using the Basis of Eligibility in MSIS as elderly (age 65 and older), disabled under age 65, or other adults or other children not classified as disabled. The disabled under age 65 are adults and children who have been classified as disabled for the purposes of Medicaid eligibility. Some children and adults classified in this paper as “other” may have disabilities but qualified for Medicaid through other eligibility routes. We further differentiate enrollees based on dual status. Individuals in MSIS with unknown eligibility were excluded.7Finally, enrollees classified as disabled were combined with enrollees eligible through all other pathways to describe the long-term care use of the full child and adult populations.
This analysis focuses on individuals who used long-term care services. Some individuals may use nursing home or home health care during short-term recovery or rehabilitation from an acute care episode. We sought to identify beneficiaries who used long-term care services on a long-term basis rather than as post-acute or respite care. Therefore, we did not count individuals as long-term care users if their spending on long-term care services fell into the lowest decile of spending. We divide long-term care beneficiaries into those receiving institutional long-term care and those receiving community-based long-term care. In addition, enrollees with substantial mixed institutional and community-based care are shown separately.
To designate individuals as long-term care users in institutional settings, we identified enrollees who had spending greater than the 10th percentile for nursing facilities, ICF/MR, institutions for individuals with mental disease for those over 65, or inpatient psychiatric services for those 21 and under.8 Because the populations residing in these institutions are virtually mutually exclusive of each other, and because average payments to each type of institution vary widely, this percentile threshold was determined separately for each institutional type. In addition, each percentile threshold was determined at the state-level in order to account for state differences in Medicaid packages, reliance on institutional care, and cost-of-living.
6 Anna Sommers, Mindy Cohen and Molly O’Malley, Medicaid’s Long-Term Care Beneficiaries: An Analysis of Spending Patterns, Kaiser Commission on Medicaid and the Uninsured, November 2006, http://www.kff.org/medicaid/7576.cfm. 7 Missing age beneficiaries with the non-disabled adult pathway were classified as adults for the adult (19-64) tables because the eligibility pathway indicates that they are 19-64. However, missing age beneficiaries with a non-disabled child pathway were not included in the separate adult or child tables because they could be 0-21 depending on the state, since 19-21 year olds are not consistently classified as children or adults across states. This amounted to 298 enrollees (FYE enrollment of 190) with $6,741,651 total spending and $164,038 total long-term care spending not included in the separate adult or child tables. Dual eligibles with missing age have been excluded (this led to three dual eligibles who were elderly, substantial long-term care users being excluded from Table 7).
8 For individuals ages 21-65, Medicaid does not cover services provided in institutions for mental disease (IMDs).
008
The same methodology was applied to designate individuals using community-based long-term care, and included enrollees who had spending greater than the 10th percentile for any of the services of home health, personal care, or HCBS waivers, referred to here in combination as community-based services. Because individuals in the community typically draw on a variety of services, we determined this percentile based on total spending across these three service areas. The remainder of the population we designated as not receiving any long-term care services, and included those who fell in the bottom 10th percentile for all types of long-term care services. As a result, this remainder does include some individuals who had some spending on long-term care services; however, this spending was negligible.9
In the text and tables, institutional services refers to care provided in nursing homes, intermediate care facilities for the mentally retarded (ICF/MR), mental disease institutions for individuals age 65 and older, and inpatient psychiatric facilities for individuals age 21 and under. Community-based long-term care includes spending in the service categories of home health, personal attendant or personal care services, and HCBS waivers. Other services not designated here could be considered to be community-based long-term care, but are not counted as such for the purposes of this analysis because these services are not identifiable in the MSIS. For example, adult day care can be used to support independent living, but payments to these providers cannot be identified in the MSIS. This particular service falls under the umbrella of HCBS waivers and is captured as such. Other services that cannot be identified, such as durable medical equipment, are likely to be used in conjunction with one of the three services used to identify long-term care users. Also, this analysis includes an individual’s total Medicaid spending, including acute services.
Total expenditures reported in MSIS for known beneficiaries fall short of the total aggregate Medicaid expenditures reported by states on the CMS-64 forms, in part because some Medicaid payments to providers cannot be attributed to known beneficiaries. We inflate expenditures in the MSIS up to CMS-64 reported totals by service category to better reflect total expenditures in Medicaid.
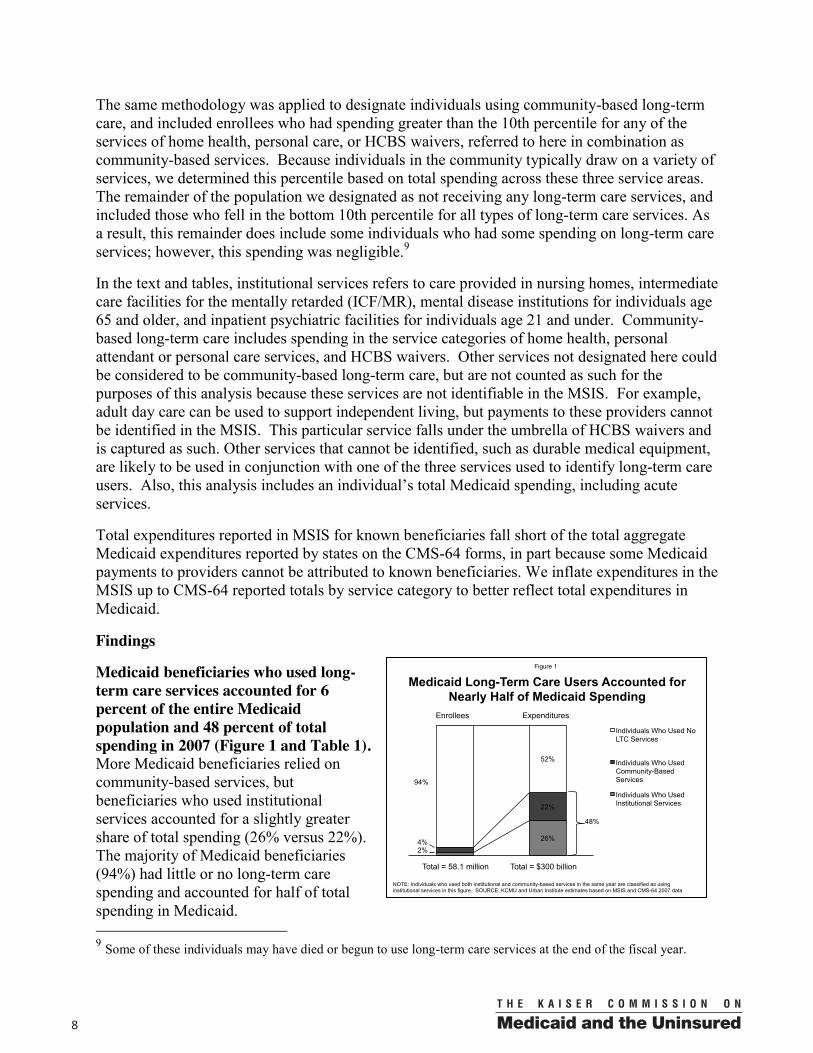
Findings
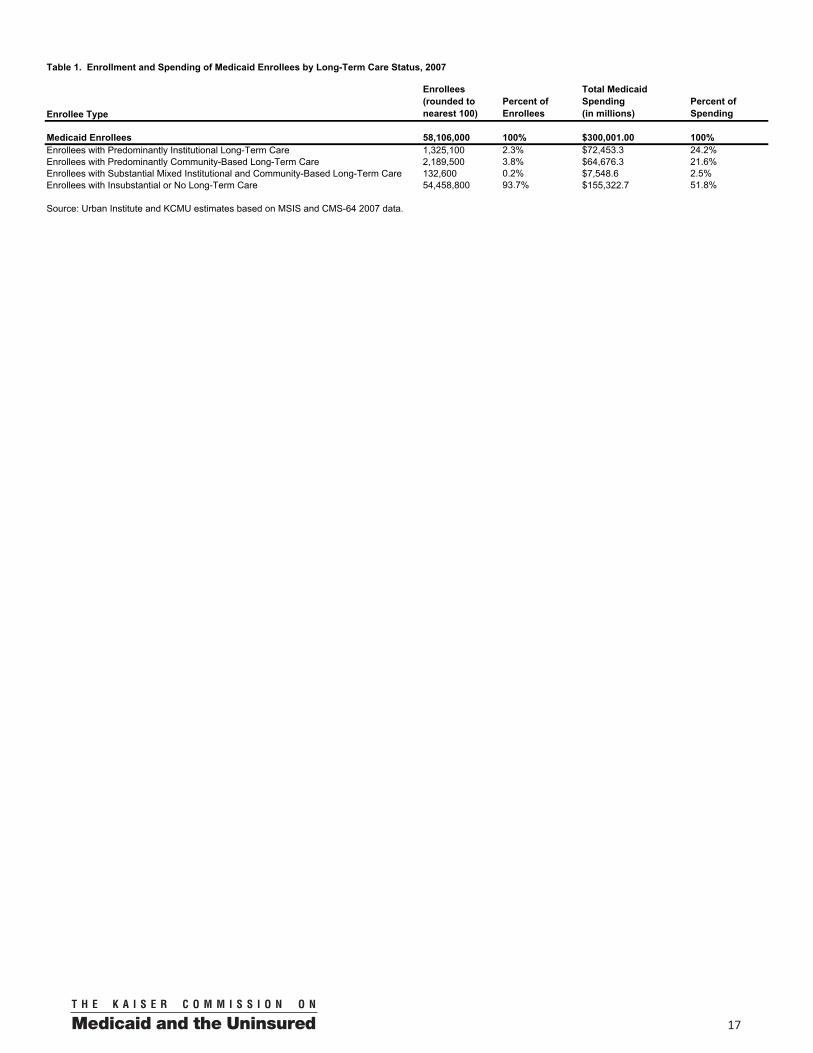
Medicaid beneficiaries who used long-term care services accounted for 6 percent of the entire Medicaid population and 48 percent of total spending in 2007 (Figure 1 and Table 1). More Medicaid beneficiaries relied on community-based services, but beneficiaries who used institutional services accounted for a slightly greater share of total spending (26% versus 22%). The majority of Medicaid beneficiaries (94%) had little or no long-term care spending and accounted for half of total spending in Medicaid.
9 Some of these individuals may have died or begun to use long-term care services at the end of the fiscal year.
Medicaid Long-Term Care Users Accounted for Nearly Half of Medicaid Spending
2%
26% 4%
22%
94%
52%
Individuals Who Used No LTC Services
Individuals Who Used Community-Based Services
Individuals Who Used Institutional Services
NOTE: Individuals who used both institutional and community-based services in the same year are classified as using institutional services in this figure. SOURCE: KCMU and Urban Institute estimates based on MSIS and CMS-64 2007 data.
Total = 58.1 million Total = $300 billion
Enrollees Expenditures
48%
Figure 1

00 9
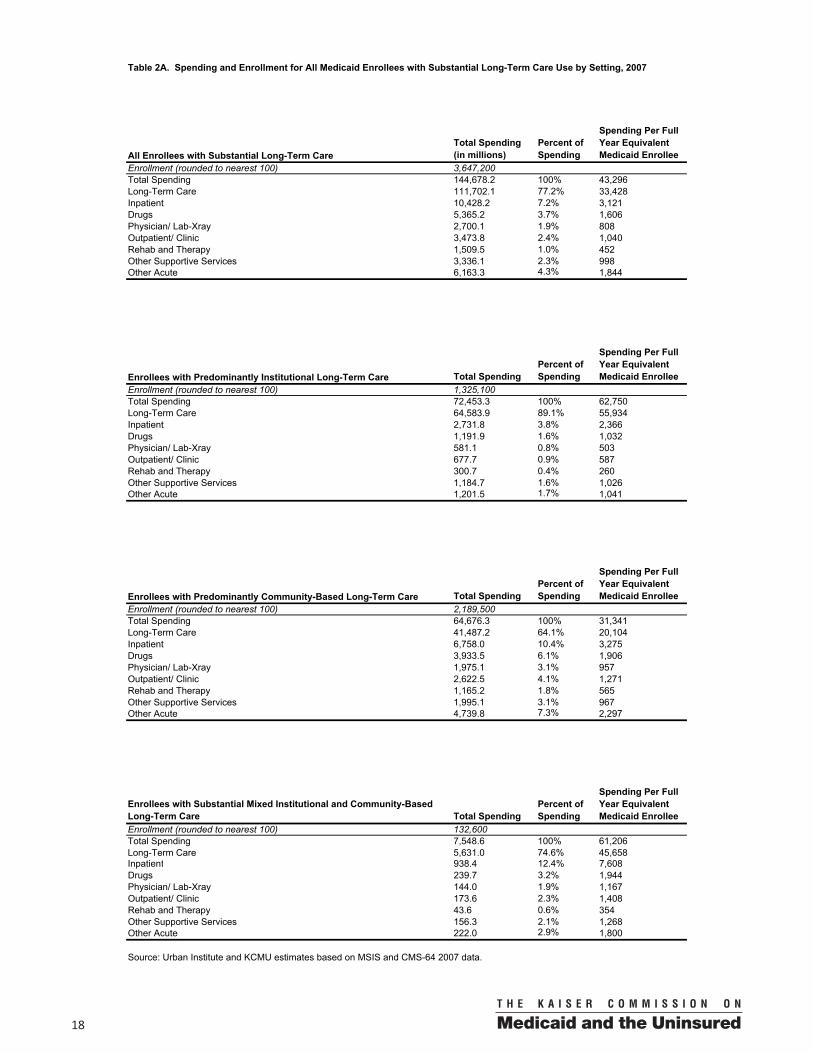
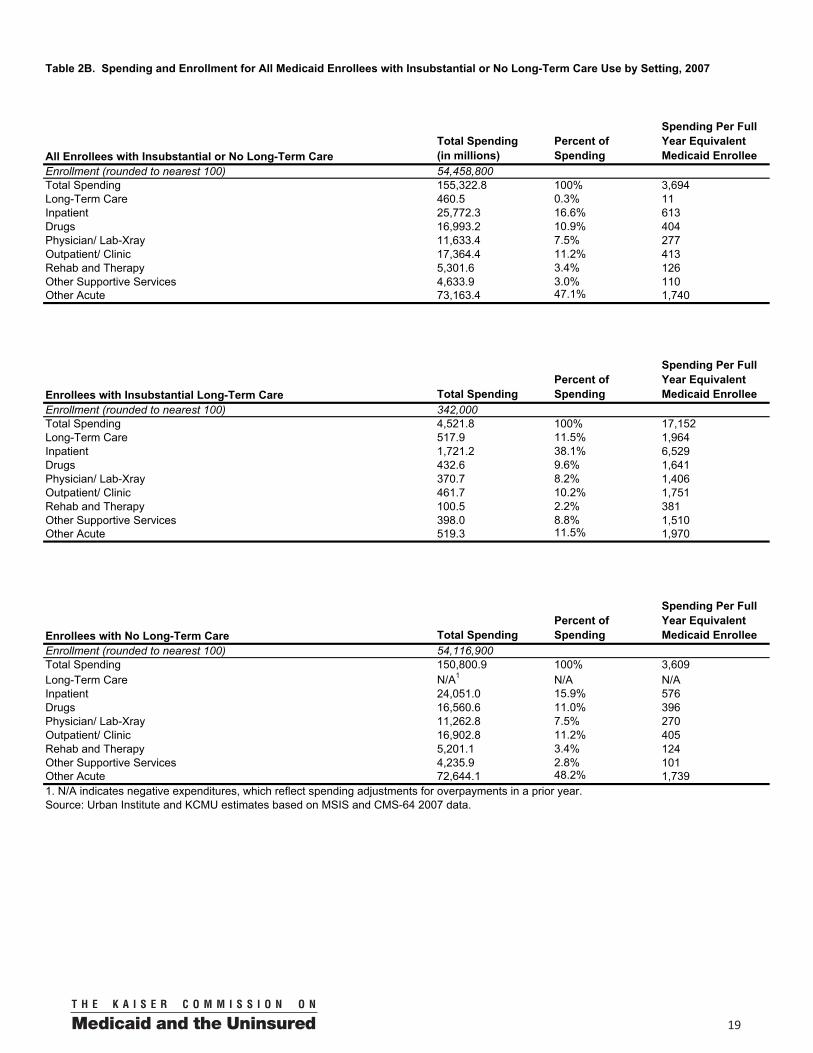
Medicaid beneficiaries who used long-term care services relied on a range of acute care and other support services. Medicaid long-term care users accounted for 3.6 million individuals,and most of their spending was for long-term care services (77%) (Figure 2 and Table 2A). The remaining quarter of Medicaid spending was devoted to acute care and other supportive services such as inpatient hospital, prescription drugs, physician, rehabilitative and therapy services. The share of Medicaid spending devoted to acute and other supportive services was greatest for individuals using community-based services compared with those in institutions and those with mixed institutional and community-based spending (36% vs. 11% vs. 25%). In contrast, Medicaid beneficiaries with insubstantial or no long-term care use devoted most of their spending to other acute services (47%), followed by inpatient (17%), outpatient (11%), and prescription drugs (11%) (Table 2B).
Medicaid beneficiaries who used long-term services and supports were mainly the elderly and persons with disabilities, but 8 percent qualified for Medicaid on the basis of income or another eligibility pathway. The elderly made up just over half (52%) of Medicaid beneficiaries who use long-term services and 45% of Medicaid spending (Figure 3 and Table 3). Individuals with disabilities under the age of 65 accounted for 40 percent of Medicaid beneficiaries who used long-term services and supports and 51 percent of Medicaid spending. Adults and children who qualified for Medicaid on the basis of income or an eligibility pathway other than disability made up 8 percent of Medicaid beneficiaries using long-term services and 4 percent of spending.
Medicaid per capita spending was greatest among individuals with institutional long-term care spending. Among those using long-term services and supports, the average annual spending per Medicaid beneficiary was $43,296. Individuals who predominantly used institutional long-term services had higher per capita spending compared with those who used predominantly community-based services ($62,750 vs. $31,341). Individuals with mixed institutional and community-based services use averaged $61,206 per year. Looking at spending by population group, persons with disabilities had the highest per capita spending ($53,427), reflecting their reliance on long-term services and supports and higher use of acute care services (Figure 4). Since Medicare pays for most acute care services for the elderly, the majority of
Medicaid Enrollees Who Used Long-Term Care Services
Elderly 52%
40%
8%
Enrollment
Elderly 45%
51%
4%
Spending
Figure 3
SOURCE: KCMU and Urban Institute estimates based on MSIS and CMS-64 2007 data.
Total = 3.6 million Total = $144.7 billion
Nondisabled adults/children
Nondisabled adults/children
Disabled Disabled
Medicaid Spending by Long-Term Care Users
Institutional LTC, 45%
Community-based LTC, 29%
Mixed LTC, 4%
Inpatient, 7%
Drugs, 4%
Physician, Lab, X-ray,
outpatient/clinic, and other acute
services, 9%
Rehab, therapy and other supportive
services, 3%
Figure 2
Note: Community-based services include waivers, home health and other home care. SOURCE: KCMU and Urban Institute estimates based on MSIS and CMS-64 2007 data.
Total = $144.7 billion
Long-Term Care 77%
Acute Care 23%
0010
spending on the elderly was for long-term services and supports. Per capita spending on the elderly was $38,077. Individuals with little or no long-term care use incurred much lower spending, averaging just $3,694 per person in 2007.
Medicaid Long-Term Care Spending by Population
Medicaid spending patterns differ substantially by population group. The following section examines both acute and long-term care spending for the following groups of Medicaid beneficiaries: the elderly, persons with disabilities (adults and children), dual eligibles, all children (0-18) and all adults (19-64).
The Elderly
One-third of elderly Medicaid beneficiaries used long-term services and supports, but they accounted for 87 percent of all Medicaid spending on the elderly (Figure 5). Half (52%) of these 1.9 million beneficiaries used predominantly institutional services followed by 44% percent of elderly long-term care users who relied on community-based services, and 4 percent of the elderly who used some combination of both institutional and community-based services. Reflecting the high cost of institutional care, 65 percent of total Medicaid spending on the elderly went toward individuals who used institutional services. Nearly one-quarter of total spending on the elderly went toward individuals who used community-based services. In contrast, individuals with no long-term care spending accounted for over two-thirds of elderly Medicaid beneficiaries but just 13 percent of total spending.
Per capita spending for the elderly who used institutional services was more than twice the amount of spending for those using community-based services ($53,593 vs. $20,764) (Figure 6 and Table 4). Spending for the elderly who used a mix of institutional and community-based services averaged $45,761, reflecting the high cost of institutional services. Most of the spending
Distribution of Medicaid Elderly by Long-Term Care Use
18%
65% 14%
22%
68%
13%
1 2
Individuals Who Used No LTC Services
Individuals Who Used Community-Based Services
Individuals Who Used Institutional Services
Total = 5.9 million Total = $74.2 billion
Enrollees Expenditures
87%
Figure 5
NOTE: Individuals who used both institutional and community-based services in the same year are classified as using institutional services in this figure. SOURCE: KCMU and Urban Institute estimates based on MSIS and CMS-64 2007 data.
Medicaid Spending Per Enrollee
$34,007 $37,394
$14,918
$4,070
$16,034
$8,265
$3,694
Elderly Disabled No LTC Use
Acute Care
Long-Term Care
SOURCE: KCMU and Urban Institute estimates based on MSIS and CMS-64 2007 data.
Number of Enrollees: 1.9 million 1.4 million 301,700 54.5 million
LTC Users
Figure 4
$38,077
$53,427
$23,183
Nondisabled Adults/Children
00 11
by those with institutional care was for long-term services (94%), with the remainder going toward acute care and other supportive services. The distribution of spending for the elderly using community-based services looks different from those with institutional care. Per person spending on acute care services for those who used community-based long-term services was about two-thirds higher compared to those using institutional services ($4,918 vs. $3,044), reflecting greater use of inpatient care and other medical services by those in community-based settings. Medicaid per person spending on elderly individuals who did not use long-term services and supports was considerably lower, averaging $2,742 per year.
Individuals with Disabilities
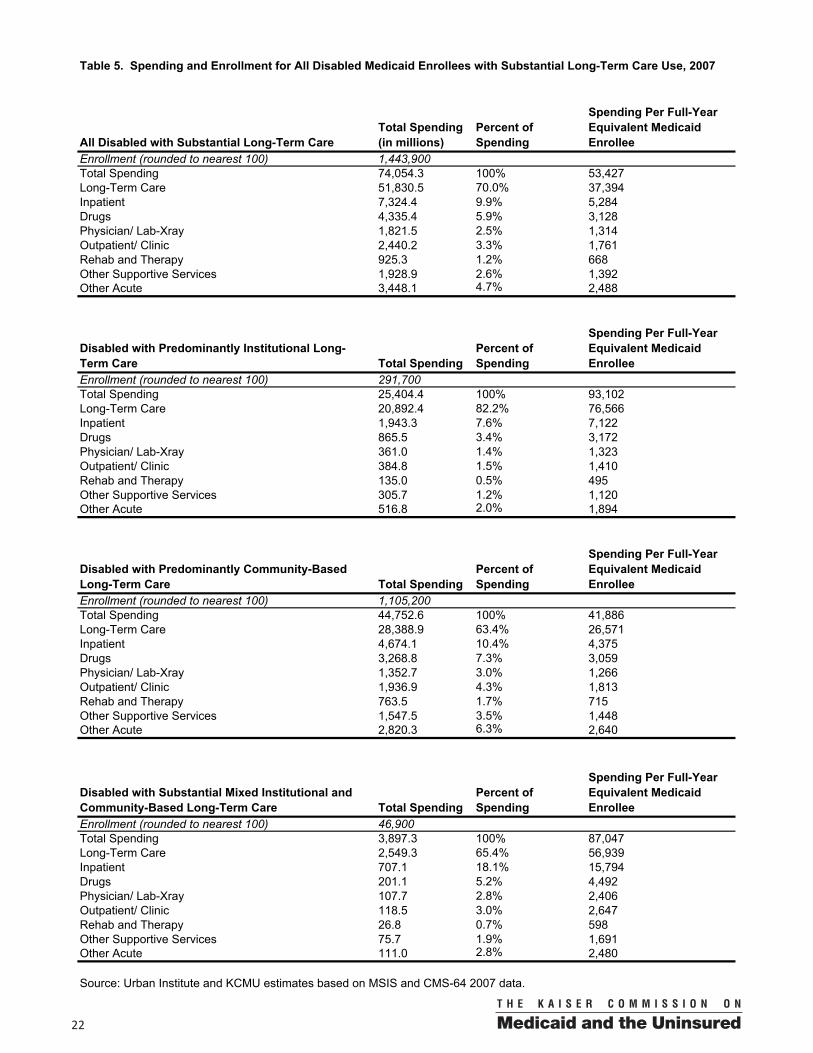
Sixteen percent of Medicaid beneficiaries with disabilities used long-term services and supports, but they accounted for fifty-eight percent of all Medicaid spending on people with disabilities (Figure 7). Three-quarters of these 1.4 million individuals predominantly used community-based services, and the remaining used institutional services (20%) and a mixture of both community and institutional services (3%). The majority
(84%) of Medicaid beneficiaries with disabilities used no long-term care services, but relied on Medicaid for an array of acute and other supportive services.
Medicaid per enrollee spending for persons with disabilities using institutional care averaged $93,102, and those using both institutional and community-based services averaged $87,047 per enrollee (Figure 8). Any use of institutional services increased average spending compared to those using predominantly community-based services. Spending on community-based services averaged $41,886 for individuals with disabilities with long-term care use. This compares to an average of $8,166 for Medicaid beneficiaries with disabilities with little or no long-term care spending.
Distribution of Medicaid Individuals with Disabilities by Long-Term Care Use
3% 23% 13%
35%
84%
42%
1 2
Individuals Who Used No LTC Services
Individuals Who Used Community-Based Services
Individuals Who Used Institutional Services
Total = 8.8 million Total = $127.3 billion
Enrollees Expenditures
58%
Figure 7
NOTE: Individuals who used both institutional and community-based services in the same year are classified as using institutional services in this figure. SOURCE: KCMU and Urban Institute estimates based on MSIS and CMS-64 2007 data.
Medicaid Spending Per Elderly Enrollee
$50,549
$15,846
$39,187
$3,044
$4,918
$6,574
$2,742
Institutional Community-Based Mixed No LTC Use
Acute Care
Long-Term Care
SOURCE: KCMU and Urban Institute estimates based on MSIS and CMS-64 2007 data.
Number of Enrollees: 981,700 836,000 83,900 4 million
LTC Users
Figure 6
$53,593
$20,764
$45,761
Medicaid Spending Per Disabled Enrollee
$76,566
$26,571
$56,939
$16,536
$15,316
$30,108
$8,166
Institutional Community-Based Mixed No LTC Use
Acute Care
Long-Term Care
SOURCE: KCMU and Urban Institute estimates based on MSIS and CMS-64 2007 data.
Number of Enrollees: 291,700 1.1 million 46,900 7.3 million
LTC Users
Figure 8
$93,102
$41,886
$87,047

0012
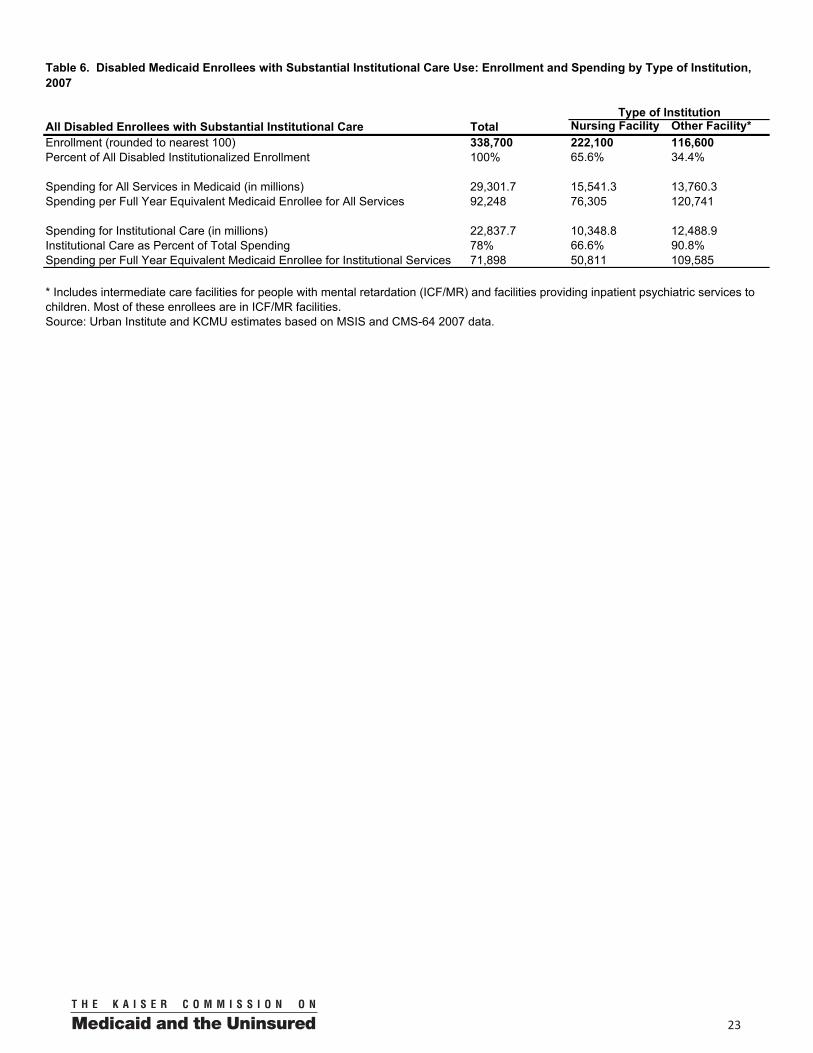
Spending on acute and other supportive services averaged about $16,000 per disabled beneficiary regardless of setting, but spending on long-term care services in the community was considerably lower than in institutions. Although relatively few individuals with disabilities (338,700) used institutional services, per capita spending was substantial, reflecting their high level of need and the relatively higher cost of institutional services compared to HCBS. Aboutone-third (34%) of these individuals resided in intermediate care facilities for the mentally retarded (ICF/MR) or in facilities providing inpatient psychiatric services (Table 6). Average spending per person was almost twice as much for these residents ($120,741) compared to nursing facility residents ($76,305). Also, average spending for institutional services was much higher for these residents ($109,585) compared to nursing facility residents ($50,811). The goal of ICF/MR facilities is to promote independence along a continuum of functional capacity by providing the residents with basic personal care needs but also with services that allow them to engage in and contribute to the community. Job coaching, self-help, and transportation are some of the services offered to residents of ICF/MR facilities to help them with “special care services to achieve their potential.”10
Compared to the elderly, individuals with disabilities who used long-term services are much more likely to rely on services in the community. Average per enrollee spending for the disabled who predominantly use community-based services is about two times higher compared to the elderly who used community-based services ($41,886 vs. $20,764). Medicaid spending is higher for both long-term care spending and acute care spending due to the fact that people with disabilities often have different service needs and longer life expectancies. Another factor is that a majority of elderly Medicaid beneficiaries are dually eligible for both Medicare and Medicaid coverage, while most Medicaid individuals with disabilities are not covered by Medicare.
Dual Eligibles
Dual eligibles accounted for over two-thirds of Medicaid beneficiaries who used long-term services and supports and a similar share of spending (Figure 9). Dual eligibles are defined as low-income seniors and persons with disabilities who are enrolled in both the Medicaid and Medicare programs. They are among the sickest and poorest individuals covered by either program. The duals rely on Medicaid to pay for Medicare premiums and cost-sharing and certain benefits that Medicare does not cover such as long-term care. Medicare covers primarilyhospital and physician services and prescription drugs for the duals.
10 Congressional Research Service, Medicaid Source Book: Background Data and Analysis, January 1993.
Distribution of Medicaid Beneficiaries Who Use Long-Term Care, by Dual Status
Dual 68%
Non-dual 32%
Enrollment
Dual 65%
Non-dual 35%
Spending
Figure 9
SOURCE: KCMU and Urban Institute estimates based on MSIS and CMS-64 2007 data.
Total = 3.6 million Total = $144.7 billion
00 13
Twenty-eight percent of dual eligibles used long-term services, and this group accounted for eighty-six percent of total Medicaid spending on the duals (Figure 10 and Table 7). The majority of this spending (90%) was for long-term care services. The duals also relied on Medicaid for other medical and supportive services. Among dual eligibles who used long-term services, care was about equally split between community-based services and institutional services (52% vs. 44%). Just 4 percent of dual eligibles using long-term services used a combination of both community-based and institutional services.
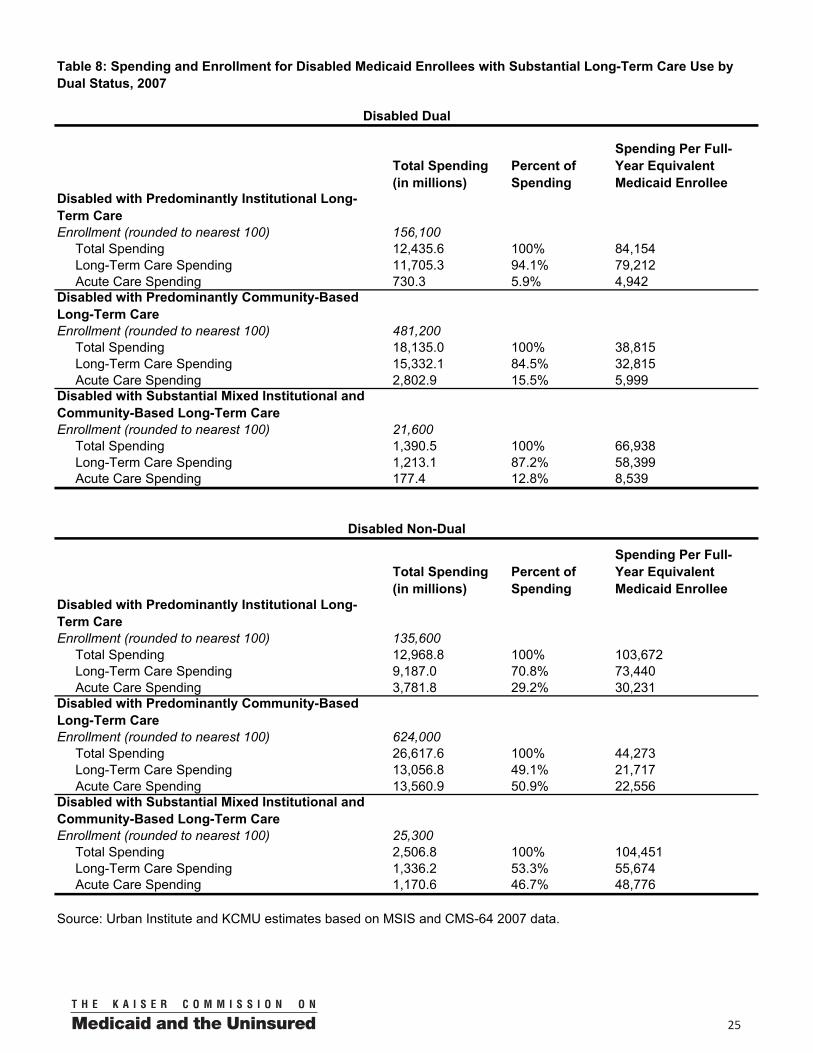
Most dual eligibles have lower per capita acute care spending in Medicaid compared to non-duals because Medicare pays for acute care services. Figure 11 illustrates this point by comparing the non-elderly disabled population by dual status. Of all non-elderly disabled using long-term services, 46% are dual eligibles, and 54% are non-dual eligibles (these individuals may not qualify for Medicare or may be in the two year waiting period). Disabled duals with institutional care spent an average of $84,154 per person, while non-duals spent $103,672 (Figure 11 and Table 8). Most of this difference is from payment for acute care services. Duals spent an average of $4,942 on acute care services in Medicaid and non-duals spent $30,231, six times as much. Individuals with disabilities with predominantly community-based services showed a similar difference by dual status. This difference reflects the fact that Medicare covers some, but not all, of the costs of acute care services for dual eligibles.
Children
A total of 404,400 children who were covered by Medicaid used long-term services in 2007, and these children accounted for 16 percent of total Medicaid spending on children (Figure 12). The majority of children (58%) who used long-
Spending Per Disabled Medicaid Long-Term Care User, by Dual Status
$79,212 $73,440
$32,815 $21,717
$4,942 $30,231
$5,999 $22,556
Duals Non-Duals Duals Non-Duals
Acute Care
Long-Term Care
$44,273
SOURCE: KCMU and Urban Institute estimates based on MSIS and CMS-64 2007 data.
Institutional
Figure 11
$84,154
$103,672
$38,815
Community-Based
Distribution of Medicaid Dual Eligibles by Long-Term Care Use
14%
55% 14%
31% 72%
14%
1 2
Individuals Who Used No LTC Services
Individuals Who Used Community-Based Services
Individuals Who Used Institutional Services
Total = 8.9 million Total = $109.5 billion
Enrollees Expenditures
86%
Figure 10
NOTE: Individuals who used both institutional and community-based services in the same year are classified as using institutional services in this figure. SOURCE: KCMU and Urban Institute estimates based on MSIS and CMS-64 2007 data.
Distribution of Medicaid Children by Long-Term Care Use
0.2% 5% 1% 11%
99% 83%
1 2
Individuals Who Used No LTC Services
Individuals Who Used Community-Based Services
Individuals Who Used Institutional Services
Total = 29.0 million Total = $78 billion
Enrollees Expenditures
16%
Figure 12
NOTE: Individuals who used both institutional and community-based services in the same year are classified as using institutional services in this figure. SOURCE: KCMU and Urban Institute estimates based on MSIS and CMS-64 2007 data.

0014
term services qualified through poverty-related income routes or other categories such as foster care assistance, rather than through a disability category (Figure 13). Some of these children might meet disability standards if assessed, but since income eligibility thresholds for children are typically higher compared to other eligibility groups, it is possible that they qualify based on financial eligibility first.
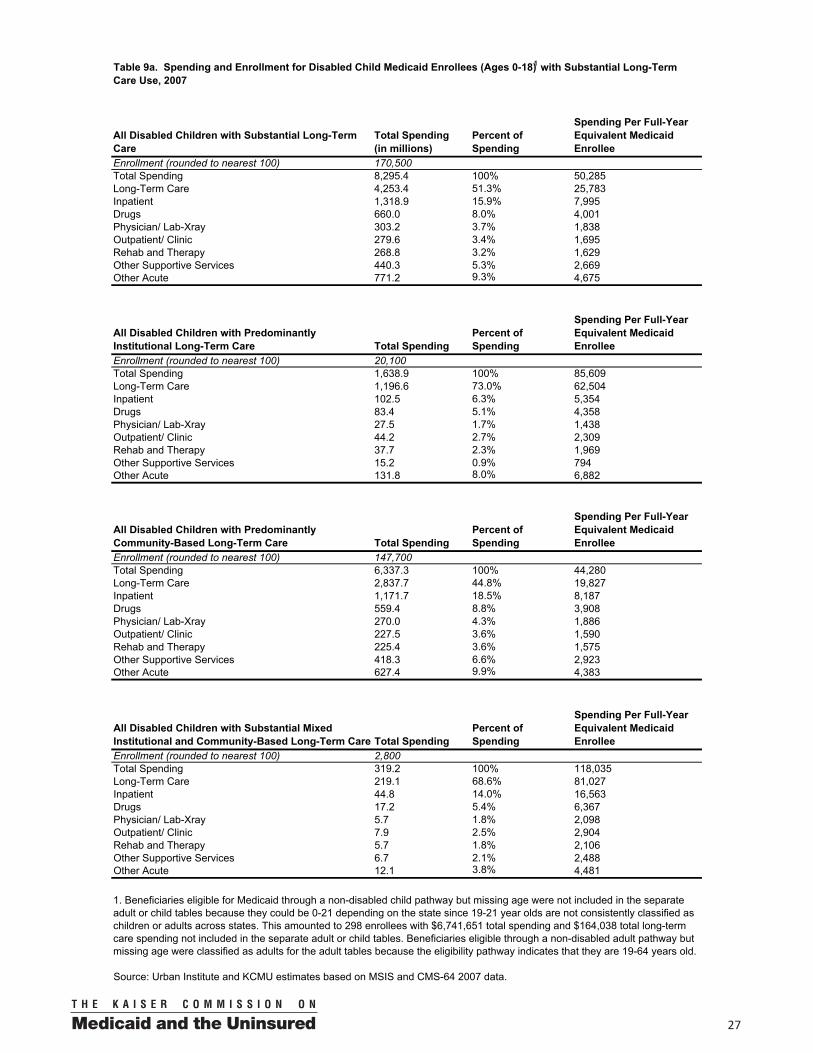
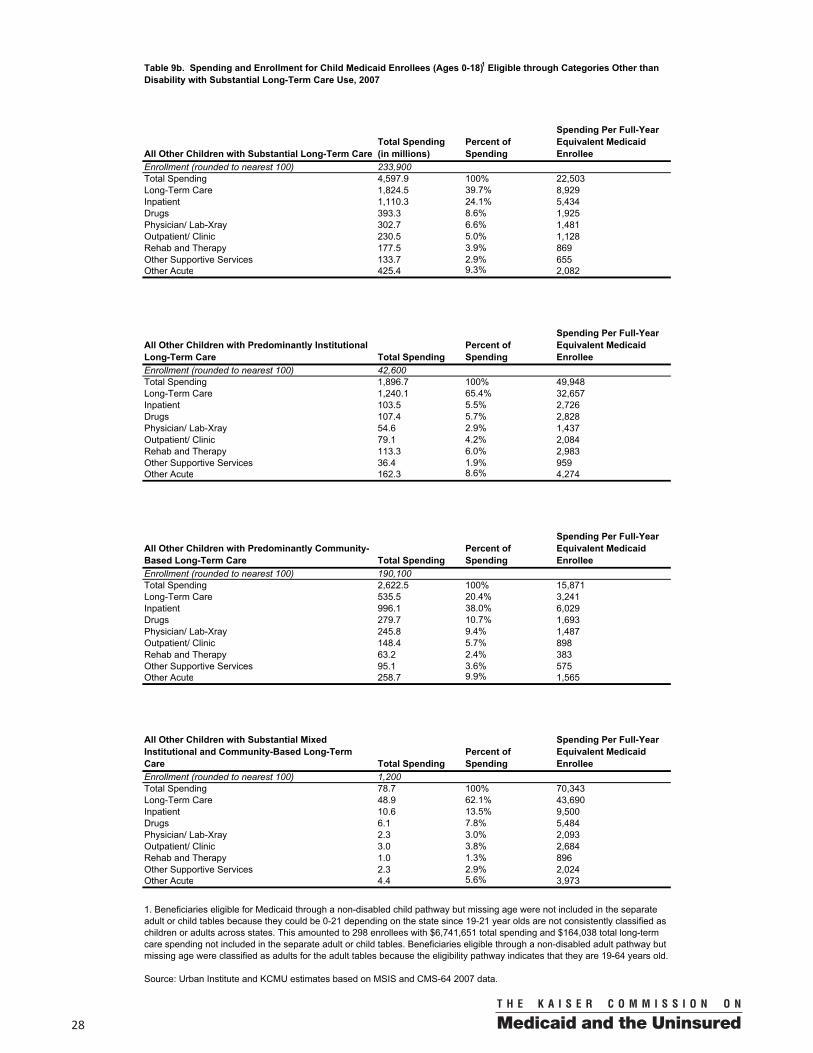
Per person spending among children using Medicaid long-term services and supports was higher for disabled children compared to children who qualified through other categories ($50,285 vs. $22,503) (Figure 14 and Tables 9, 9a & 9b). Roughly the same proportion of disabled and other children using long-term services relied on institutional care (12% vs. 18%),but average spending for those with institutional care was much higher for disabled children ($85,609 vs. $49,948). Similarly, average spending for children using community-based care was also much higher for disabled children ($44,280 vs. $15,871), as was spending for those who used a mix of institutional and community-based services. Spending for both groups was considerably higher than for children who did not use any long-term services and relied on Medicaid primarily for preventive and acute care services.
Adults
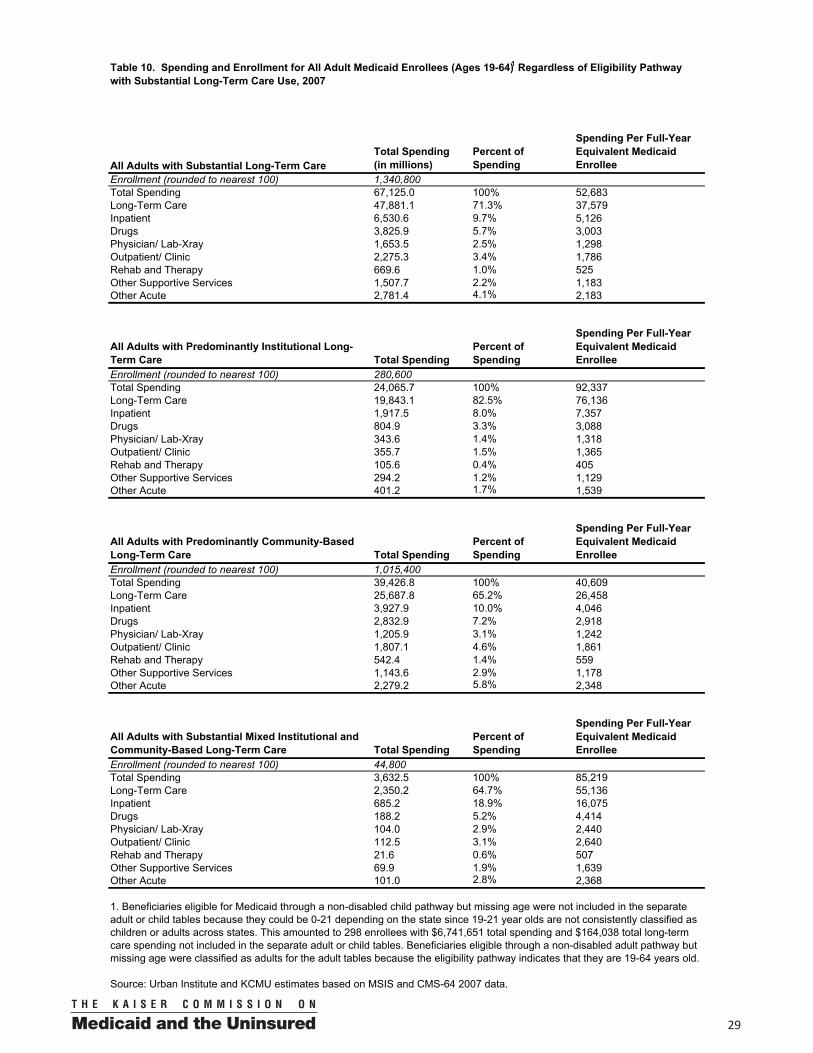
Over 1.3 million adults age 19-64 used long-term services and supports in 2007, accounting for 46% of total Medicaid spending on adults (Figure 15). In contrast to children, most adults (95%) using long-term services qualified on the basis of disability, reflecting Medicaid’s general exclusion of childless adults, prior to health reform changes scheduled to take affect in 2014, who are not disabled and low-income eligibility levels for parents. Average spending for adults who qualified for Medicaid on the basis of disability was higher than for adults who used long-term services but qualified through other pathways ($53,852 vs. $25,760) (Figure 16 and Tables 10, 10a & 10b). A greater percentage of adults with disabilities with long-term care needs used institutional services (21%) compared to other adults (13%). Spending for adults who did not use long-term services was much lower, averaging $5,015. Compared to children, adults who used long-term services had higher average spending ($52,683 vs. $34,913) due to greater use of institutional care and higher spending on community-based long-term services and supports.
Medicaid Spending Per Child Enrollee
$25,783
$8,929
$24,502
$13,574
$2,902
Disabled Children Other Children No LTC Use
Acute Care
Long-Term Care
SOURCE: KCMU and Urban Institute estimates based on MSIS and CMS-64 2007 data.
Number of Enrollees: 170,500 233,900 28.5 million
LTC Users
Figure 14
$50,285
$22,503
Children on Medicaid Who Used Long-Term Care Services
Other Children
52% Disabled Children
58%
Enrollment
Disabled Children
64%
Other Children
36%
Spending
Figure 13
SOURCE: KCMU and Urban Institute estimates based on MSIS and CMS-64 2007 data.
Total = 404,435 million Total = $12.9 billion

00 15
Policy Implications
Analysis of long-term care spending patterns in Medicaid finds that only 3.6 million Medicaid beneficiaries (or 6 percent) use long-term services, but these beneficiaries account for nearly half (48 percent) of all Medicaid spending. Medicaid beneficiaries who rely on long-term care services are a diverse population with a range of chronic conditions, disabilities and diseases who require a mix of acute medical services and long-term care supports to meet their needs. Medicaid long-term care users receive services in a variety of settings including their own homes, adult day centers, assisted living facilities, and nursing homes. Unlike Medicare or private insurance, Medicaid is the only major financing stream for long-term care that is designed to provide a broad array of services across both institutional and community-based settings.
Medicaid plays a critical role for people of all ages with long-term services and supports needs. Persons 65 and older constitute over half (52%) of those who use Medicaid long-term care services, but roughly 40% are individuals under age 65 with a disability. Another 8 percent are adults and children who rely on Medicaid’s long-term services and supports, but became eligible for Medicaid through pathways other than disability. The inclusion of home and community-based services in a state’s Medicaid benefits packages is especially important for individuals with disabilities under 65 because HCBS cover a range of supports necessary to live independently in the community. Offering these services helps states to comply with the 1999Supreme Court decision (Olmstead v. L.C.) that ruled, under the Americans with Disabilities Act, institutionalizing a person with a disability who can benefit from and does not oppose living in the community constitutes unlawful discrimination.
Spending patterns vary widely across different types of long-term care population groups and settings. While more Medicaid long-term care users rely on community-based services (2.2 million versus 1.3 million), more Medicaid dollars go toward the cost of covering institutional services, reflecting the high costs of serving people with high needs in 24-hour care facilities. Medicaid beneficiaries with disabilities have the highest per capita costs ($53,427) reflecting their use of costly institutional settings such as ICF/MRs, followed by the elderly ($38,007) who rely more heavily on institutional care in nursing homes. Medicaid enrollees who receive
Distribution of Medicaid Adults by Long-Term Care Use
1% 19% 4%
27%
94%
55%
1 2
Individuals Who Used No LTC Services
Individuals Who Used Community-Based Services
Individuals Who Used Institutional Services
Total = 23.1 million Total = $147.7 billion
Enrollees Expenditures
46%
Figure 15
NOTE: Individuals who used both institutional and community-based services in the same year are classified as using institutional services in this figure. SOURCE: KCMU and Urban Institute estimates based on MSIS and CMS-64 2007 data.
Medicaid Spending Per Adult Enrollee
$38,962
$5,731
$14,890
$20,029
$5,015
Disabled Other Adult No LTC Use
Acute Care
Long-Term Care
SOURCE: KCMU and Urban Institute estimates based on MSIS and CMS-64 2007 data.
Number of Enrollees: 1.3 million 67,500 21.8 million
LTC Users
Figure 16
$53,852
$25,760

0016
services in the community have lower overall per enrollee spending compared with their counterparts in institutional setting. With demand for community-based services high, states have been continuously pressed to expand access to these services and through the ACA, have been given additional resources to do so. The ACA makes available enhanced federal matching funds through the Money Follows the Person Demonstration, the new State Balancing Incentive Payments Program, and the Community First Choice Option to support state efforts to increasethe provision of HCBS. However, today’s challenging budget environment at the state and federal levels may affect states’ ability to greatly expand access to community-based services in the future.
Medicaid’s coverage of long-term services and supports fills important gaps in coverage for the dual eligibles. Medicare covers primarily hospital and physician services, but few long-term care services. Overall, 70 percent of all Medicaid spending for dual eligibles is for long-term services.11 And while Medicare has taken over the payment of prescription drugs for this population, states are still required to make monthly “clawback” payments related to prescription drugs for the duals. The fact that dual eligibles must navigate both Medicare and Medicaid to receive health and long-term services has driven policymakers to develop strategies to improve delivery of care for the duals. Interest in improving the coordination and integration of care among dual eligibles is growing, and the ACA created a number of new incentive programs to address this policy issue. The ACA establishes the Medicare-Medicaid Coordination Office to align Medicare and Medicaid financing, benefits administration, oversight rules and policies for dual eligibles. In April 2011, the Medicare-Medicaid Coordination Office awarded $1 million contracts to 15 states to design models to improve care for duals. In addition, the new Center for Medicare and Medicaid Innovation created under the ACA has explicit authority to allow states to test and evaluate integrated care models for duals.
Many states are also considering expanding Medicaid managed care beyond children and families to include people with disabilities with chronic and long-term services and supports needs. Given the fact that these individuals have substantial needs that translate into higher per capita costs, balancing efforts to better integrate services across Medicare and Medicaid with efforts to control costs across both programs is critical to successful care coordination. Models of successful delivery system and/or payment reforms at the state level will be important to monitor to ensure quality of care and continuity of coverage for Medicaid beneficiaries with both acute and long-term services and supports needs.
11 Kaiser Commission on Medicaid and the Uninsured, Dual Eligibles: Medicaid and Spending for Medicare Beneficiaries in 2007, http://www.kff.org/medicaid/7846.cfm
This issue paper was prepared for the Kaiser Family Foundation’s Commission on Medicaid and the Uninsured by Molly O’Malley Watts, consultant, Emily Lawton of the Urban Institute, and Katherine Young of the Kaiser Commission on Medicaid and the Uninsured.
00 17
Table 1. Enrollment and Spending of Medicaid Enrollees by Long-Term Care Status, 2007
Enrollee Type
Enrollees(rounded to nearest 100)
Percent of Enrollees
Total Medicaid Spending(in millions)
Percent of Spending
Medicaid Enrollees 58,106,000 100% $300,001.00 100%Enrollees with Predominantly Institutional Long-Term Care 1,325,100 2.3% $72,453.3 24.2%Enrollees with Predominantly Community-Based Long-Term Care 2,189,500 3.8% $64,676.3 21.6%Enrollees with Substantial Mixed Institutional and Community-Based Long-Term Care 132,600 0.2% $7,548.6 2.5%Enrollees with Insubstantial or No Long-Term Care 54,458,800 93.7% $155,322.7 51.8%
Source: Urban Institute and KCMU estimates based on MSIS and CMS-64 2007 data.
0018
Table 2A. Spending and Enrollment for All Medicaid Enrollees with Substantial Long-Term Care Use by Setting, 2007
All Enrollees with Substantial Long-Term CareTotal Spending(in millions)
Percent of Spending
Spending Per Full Year Equivalent Medicaid Enrollee
Enrollment (rounded to nearest 100) 3,647,200Total Spending 144,678.2 100% 43,296Long-Term Care 111,702.1 77.2% 33,428Inpatient 10,428.2 7.2% 3,121Drugs 5,365.2 3.7% 1,606Physician/ Lab-Xray 2,700.1 1.9% 808Outpatient/ Clinic 3,473.8 2.4% 1,040Rehab and Therapy 1,509.5 1.0% 452Other Supportive Services 3,336.1 2.3% 998Other Acute 6,163.3 4.3% 1,844
Enrollees with Predominantly Institutional Long-Term Care Total SpendingPercent of Spending
Spending Per Full Year Equivalent Medicaid Enrollee
Enrollment (rounded to nearest 100) 1,325,100Total Spending 72,453.3 100% 62,750Long-Term Care 64,583.9 89.1% 55,934Inpatient 2,731.8 3.8% 2,366Drugs 1,191.9 1.6% 1,032Physician/ Lab-Xray 581.1 0.8% 503Outpatient/ Clinic 677.7 0.9% 587Rehab and Therapy 300.7 0.4% 260Other Supportive Services 1,184.7 1.6% 1,026Other Acute 1,201.5 1.7% 1,041
Enrollees with Predominantly Community-Based Long-Term Care Total SpendingPercent of Spending
Spending Per Full Year Equivalent Medicaid Enrollee
Enrollment (rounded to nearest 100) 2,189,500Total Spending 64,676.3 100% 31,341Long-Term Care 41,487.2 64.1% 20,104Inpatient 6,758.0 10.4% 3,275Drugs 3,933.5 6.1% 1,906Physician/ Lab-Xray 1,975.1 3.1% 957Outpatient/ Clinic 2,622.5 4.1% 1,271Rehab and Therapy 1,165.2 1.8% 565Other Supportive Services 1,995.1 3.1% 967Other Acute 4,739.8 7.3% 2,297
Enrollees with Substantial Mixed Institutional and Community-Based Long-Term Care Total Spending
Percent of Spending
Spending Per Full Year Equivalent Medicaid Enrollee
Enrollment (rounded to nearest 100) 132,600Total Spending 7,548.6 100% 61,206Long-Term Care 5,631.0 74.6% 45,658Inpatient 938.4 12.4% 7,608Drugs 239.7 3.2% 1,944Physician/ Lab-Xray 144.0 1.9% 1,167Outpatient/ Clinic 173.6 2.3% 1,408Rehab and Therapy 43.6 0.6% 354Other Supportive Services 156.3 2.1% 1,268Other Acute 222.0 2.9% 1,800
Source: Urban Institute and KCMU estimates based on MSIS and CMS-64 2007 data.
00 19
Table 2B. Spending and Enrollment for All Medicaid Enrollees with Insubstantial or No Long-Term Care Use by Setting, 2007
All Enrollees with Insubstantial or No Long-Term CareTotal Spending(in millions)
Percent of Spending
Spending Per Full Year Equivalent Medicaid Enrollee
Enrollment (rounded to nearest 100) 54,458,800Total Spending 155,322.8 100% 3,694Long-Term Care 460.5 0.3% 11Inpatient 25,772.3 16.6% 613Drugs 16,993.2 10.9% 404Physician/ Lab-Xray 11,633.4 7.5% 277Outpatient/ Clinic 17,364.4 11.2% 413Rehab and Therapy 5,301.6 3.4% 126Other Supportive Services 4,633.9 3.0% 110Other Acute 73,163.4 47.1% 1,740
Enrollees with Insubstantial Long-Term Care Total SpendingPercent of Spending
Spending Per Full Year Equivalent Medicaid Enrollee
Enrollment (rounded to nearest 100) 342,000Total Spending 4,521.8 100% 17,152Long-Term Care 517.9 11.5% 1,964Inpatient 1,721.2 38.1% 6,529Drugs 432.6 9.6% 1,641Physician/ Lab-Xray 370.7 8.2% 1,406Outpatient/ Clinic 461.7 10.2% 1,751Rehab and Therapy 100.5 2.2% 381Other Supportive Services 398.0 8.8% 1,510Other Acute 519.3 11.5% 1,970
Enrollees with No Long-Term Care Total SpendingPercent of Spending
Spending Per Full Year Equivalent Medicaid Enrollee
Enrollment (rounded to nearest 100) 54,116,900Total Spending 150,800.9 100% 3,609Long-Term Care N/A1 N/A N/AInpatient 24,051.0 15.9% 576Drugs 16,560.6 11.0% 396Physician/ Lab-Xray 11,262.8 7.5% 270Outpatient/ Clinic 16,902.8 11.2% 405Rehab and Therapy 5,201.1 3.4% 124Other Supportive Services 4,235.9 2.8% 101Other Acute 72,644.1 48.2% 1,7391. N/A indicates negative expenditures, which reflect spending adjustments for overpayments in a prior year.Source: Urban Institute and KCMU estimates based on MSIS and CMS-64 2007 data.

0020
Table 3. Enrollment and Spending for Medicaid Enrollees with Substantial Long-Term Care Service Use, 2007
All Substantial Long-Term Care Users in Medicaid
Enrollees(rounded to nearest 100)
Percent of Enrollees
Total Medicaid Spending(in millions)
Spending Per Full-Year Equivalent Medicaid Enrollee
Elderly 1,901,600 52.1% $64,653.1 38,077Persons with Disabilities 1,443,900 39.6% $74,054.3 53,427Other Adults and Children* 301,700 8.3% $5,970.8 23,183Total 3,647,200 100% $144,678.2 43,296
* "Other" includes individuals who qualified for Medicaid through a pathway not related to disability.Source: Urban Institute and KCMU estimates based on MSIS and CMS-64 2007 data.

00 21
Table 4. Spending and Enrollment for All Elderly Medicaid Enrollees with Substantial Long-Term Care Use, 2007
All Elderly with Substantial Long-Term CareTotal Spending (in millions)
Percent of Spending
Spending Per Full-Year Equivalent Medicaid Enrollee
Enrollment (rounded to nearest 100) 1,901,600Total Spending 64,653.1 100% 38,077Long-Term Care 57,742.9 89.3% 34,007Inpatient 1,462.4 2.3% 861Drugs 485.7 0.8% 286Physician/ Lab-Xray 440.6 0.7% 259Outpatient/ Clinic 688.2 1.1% 405Rehab and Therapy 393.6 0.6% 232Other Supportive Services 1,254.4 1.9% 739Other Acute 2,185.3 3.4% 1,287
Elderly with Predominantly Institutional Long-Term Care Total Spending
Percent of Spending
Spending Per Full-YearEquivalent Medicaid Enrollee
Enrollment (rounded to nearest 100) 981,700Total Spending 44,851.8 100% 53,593Long-Term Care 42,304.0 94.3% 50,549Inpatient 608.2 1.4% 727Drugs 196.2 0.4% 234Physician/ Lab-Xray 155.4 0.3% 186Outpatient/ Clinic 198.7 0.4% 237Rehab and Therapy 44.1 0.1% 53Other Supportive Services 838.9 1.9% 1,002Other Acute 506.2 1.1% 605
Elderly with Predominantly Community-Based Long-Term Care Total Spending
Percent of Spending
Spending Per Full-YearEquivalent Medicaid Enrollee
Enrollment (rounded to nearest 100) 836,000Total Spending 16,283.2 100% 20,764Long-Term Care 12,426.2 76.3% 15,846Inpatient 656.5 4.0% 837Drugs 261.2 1.6% 333Physician/ Lab-Xray 253.2 1.6% 323Outpatient/ Clinic 439.3 2.7% 560Rehab and Therapy 334.2 2.1% 426Other Supportive Services 338.0 2.1% 431Other Acute 1,574.6 9.7% 2,008
Elderly with Substantial Mixed Institutional and Community-Based Long-Term Care Total Spending
Percent of Spending
Spending Per Full-YearEquivalent Medicaid Enrollee
Enrollment (rounded to nearest 100) 83,900Total Spending 3,518.1 100% 45,761Long-Term Care 3,012.7 85.6% 39,187Inpatient 197.7 5.6% 2,572Drugs 28.2 0.8% 367Physician/ Lab-Xray 32.0 0.9% 416Outpatient/ Clinic 50.2 1.4% 653Rehab and Therapy 15.3 0.4% 199Other Supportive Services 77.5 2.2% 1,008Other Acute 104.5 3.0% 1,359
Source: Urban Institute and KCMU estimates based on MSIS and CMS-64 2007 data.
0022
All Disabled with Substantial Long-Term CareTotal Spending (in millions)
Percent of Spending
Spending Per Full-Year Equivalent Medicaid Enrollee
Enrollment (rounded to nearest 100) 1,443,900Total Spending 74,054.3 100% 53,427Long-Term Care 51,830.5 70.0% 37,394Inpatient 7,324.4 9.9% 5,284Drugs 4,335.4 5.9% 3,128Physician/ Lab-Xray 1,821.5 2.5% 1,314Outpatient/ Clinic 2,440.2 3.3% 1,761Rehab and Therapy 925.3 1.2% 668Other Supportive Services 1,928.9 2.6% 1,392Other Acute 3,448.1 4.7% 2,488
Disabled with Predominantly Institutional Long-Term Care Total Spending
Percent of Spending
Spending Per Full-Year Equivalent Medicaid Enrollee
Enrollment (rounded to nearest 100) 291,700Total Spending 25,404.4 100% 93,102Long-Term Care 20,892.4 82.2% 76,566Inpatient 1,943.3 7.6% 7,122Drugs 865.5 3.4% 3,172Physician/ Lab-Xray 361.0 1.4% 1,323Outpatient/ Clinic 384.8 1.5% 1,410Rehab and Therapy 135.0 0.5% 495Other Supportive Services 305.7 1.2% 1,120Other Acute 516.8 2.0% 1,894
Disabled with Predominantly Community-Based Long-Term Care Total Spending
Percent of Spending
Spending Per Full-Year Equivalent Medicaid Enrollee
Enrollment (rounded to nearest 100) 1,105,200Total Spending 44,752.6 100% 41,886Long-Term Care 28,388.9 63.4% 26,571Inpatient 4,674.1 10.4% 4,375Drugs 3,268.8 7.3% 3,059Physician/ Lab-Xray 1,352.7 3.0% 1,266Outpatient/ Clinic 1,936.9 4.3% 1,813Rehab and Therapy 763.5 1.7% 715Other Supportive Services 1,547.5 3.5% 1,448Other Acute 2,820.3 6.3% 2,640
Disabled with Substantial Mixed Institutional and Community-Based Long-Term Care Total Spending
Percent of Spending
Spending Per Full-Year Equivalent Medicaid Enrollee
Enrollment (rounded to nearest 100) 46,900Total Spending 3,897.3 100% 87,047Long-Term Care 2,549.3 65.4% 56,939Inpatient 707.1 18.1% 15,794Drugs 201.1 5.2% 4,492Physician/ Lab-Xray 107.7 2.8% 2,406Outpatient/ Clinic 118.5 3.0% 2,647Rehab and Therapy 26.8 0.7% 598Other Supportive Services 75.7 1.9% 1,691Other Acute 111.0 2.8% 2,480
Source: Urban Institute and KCMU estimates based on MSIS and CMS-64 2007 data.
Table 5. Spending and Enrollment for All Disabled Medicaid Enrollees with Substantial Long-Term Care Use, 2007
00 23
All Disabled Enrollees with Substantial Institutional Care Total Nursing Facility Other Facility*Enrollment (rounded to nearest 100) 338,700 222,100 116,600Percent of All Disabled Institutionalized Enrollment 100% 65.6% 34.4%
Spending for All Services in Medicaid (in millions) 29,301.7 15,541.3 13,760.3Spending per Full Year Equivalent Medicaid Enrollee for All Services 92,248 76,305 120,741
Spending for Institutional Care (in millions) 22,837.7 10,348.8 12,488.9Institutional Care as Percent of Total Spending 78% 66.6% 90.8%Spending per Full Year Equivalent Medicaid Enrollee for Institutional Services 71,898 50,811 109,585
Source: Urban Institute and KCMU estimates based on MSIS and CMS-64 2007 data.
Table 6. Disabled Medicaid Enrollees with Substantial Institutional Care Use: Enrollment and Spending by Type of Institution, 2007
Type of Institution
* Includes intermediate care facilities for people with mental retardation (ICF/MR) and facilities providing inpatient psychiatric services to children. Most of these enrollees are in ICF/MR facilities.

0024
Table 7. Spending and Enrollment for All Dually-Eligible1 Medicaid Enrollees with Substantial Long-Term Care Use, 2007
All Duals with Substantial Long-Term CareTotal Spending(in millions) Percent of Spending
Spending Per Full-Year Equivalent Medicaid Enrollee
Enrollment (rounded to nearest 100) 2,490,000Total Spending 93,790.7 100% 41,205Long-Term Care 84,164.5 89.7% 36,976Inpatient 1,580.2 1.7% 694Drugs 516.0 0.6% 227Physician/ Lab-Xray 587.2 0.6% 258Outpatient/ Clinic 1,307.5 1.4% 574Rehab and Therapy 740.9 0.8% 326Other Supportive Services 1,875.7 2.0% 824Other Acute 3,018.7 3.2% 1,326
Duals with Predominantly Institutional Long-Term Care Total Spending Percent of Spending
Spending Per Full-YearEquivalent Medicaid Enrollee
Enrollment (rounded to nearest 100) 1,103,900Total Spending 55,573.3 100% 57,896Long-Term Care 52,682.0 94.8% 54,883Inpatient 598.5 1.1% 623Drugs 169.3 0.3% 176Physician/ Lab-Xray 177.5 0.3% 185Outpatient/ Clinic 286.2 0.5% 298Rehab and Therapy 83.0 0.1% 87Other Supportive Services 911.6 1.6% 950Other Acute 665.1 1.2% 693
Duals with Predominantly Community-Based Long-Term Care Total Spending Percent of Spending
Spending Per Full-YearEquivalent Medicaid Enrollee
Enrollment (rounded to nearest 100) 1,283,300Total Spending 33,486.2 100% 27,427Long-Term Care 27,346.6 81.7% 22,398Inpatient 782.8 2.3% 641Drugs 316.2 0.9% 259Physician/ Lab-Xray 371.0 1.1% 304Outpatient/ Clinic 947.1 2.8% 776Rehab and Therapy 635.2 1.9% 520Other Supportive Services 861.7 2.6% 706Other Acute 2,225.6 6.6% 1,823
Duals with Substantial Mixed Institutional and Community-Based Long-Term Care Total Spending Percent of Spending
Spending Per Full-YearEquivalent Medicaid Enrollee
Enrollment (rounded to nearest 100) 102,900Total Spending 4,731.2 100% 49,600Long-Term Care 4,135.9 87.4% 43,359Inpatient 198.9 4.2% 2,086Drugs 30.5 0.6% 319Physician/ Lab-Xray 38.7 0.8% 406Outpatient/ Clinic 74.2 1.6% 778Rehab and Therapy 22.7 0.5% 238Other Supportive Services 102.4 2.2% 1,074Other Acute 127.9 2.7% 1,341
Source: Urban Institute and KCMU estimates based on MSIS and CMS-64 2007 data.
1. When dual eligible and non-dual eligible substantial long-term care users were analyzed separately, dual eligibles with missing age were excluded. This led to three elderly dual eligibles with $130,995 total spending and $126,069 total long-term care spending being excluded.
00 25
Total Spending(in millions)
Percent of Spending
Spending Per Full-Year Equivalent Medicaid Enrollee
Disabled with Predominantly Institutional Long-Term CareEnrollment (rounded to nearest 100) 156,100 Total Spending 12,435.6 100% 84,154 Long-Term Care Spending 11,705.3 94.1% 79,212 Acute Care Spending 730.3 5.9% 4,942Disabled with Predominantly Community-Based Long-Term CareEnrollment (rounded to nearest 100) 481,200 Total Spending 18,135.0 100% 38,815 Long-Term Care Spending 15,332.1 84.5% 32,815 Acute Care Spending 2,802.9 15.5% 5,999Disabled with Substantial Mixed Institutional and Community-Based Long-Term CareEnrollment (rounded to nearest 100) 21,600 Total Spending 1,390.5 100% 66,938 Long-Term Care Spending 1,213.1 87.2% 58,399 Acute Care Spending 177.4 12.8% 8,539
Total Spending(in millions)
Percent of Spending
Spending Per Full-Year Equivalent Medicaid Enrollee
Disabled with Predominantly Institutional Long-Term CareEnrollment (rounded to nearest 100) 135,600 Total Spending 12,968.8 100% 103,672 Long-Term Care Spending 9,187.0 70.8% 73,440 Acute Care Spending 3,781.8 29.2% 30,231Disabled with Predominantly Community-Based Long-Term CareEnrollment (rounded to nearest 100) 624,000 Total Spending 26,617.6 100% 44,273 Long-Term Care Spending 13,056.8 49.1% 21,717 Acute Care Spending 13,560.9 50.9% 22,556Disabled with Substantial Mixed Institutional and Community-Based Long-Term CareEnrollment (rounded to nearest 100) 25,300 Total Spending 2,506.8 100% 104,451 Long-Term Care Spending 1,336.2 53.3% 55,674 Acute Care Spending 1,170.6 46.7% 48,776
Source: Urban Institute and KCMU estimates based on MSIS and CMS-64 2007 data.
Table 8: Spending and Enrollment for Disabled Medicaid Enrollees with Substantial Long-Term Care Use by Dual Status, 2007
Disabled Dual
Disabled Non-Dual

0026
All Children with Substantial Long-Term Care Total Spending(in millions)
Percent of Spending
Spending Per Full-Year Equivalent Medicaid Enrollee
Enrollment (rounded to nearest 100) 404,400Total Spending 12,893.4 100% 34,913Long-Term Care 6,077.9 47.1% 16,458Inpatient 2,429.2 18.8% 6,578Drugs 1,053.3 8.2% 2,852Physician/ Lab-Xray 605.9 4.7% 1,641Outpatient/ Clinic 510.1 4.0% 1,381Rehab and Therapy 446.3 3.5% 1,208Other Supportive Services 574.0 4.5% 1,554Other Acute 1,196.6 9.3% 3,240
All Children with Predominantly Institutional Long-Term Care Total Spending
Percent of Spending
Spending Per Full-Year Equivalent Medicaid Enrollee
Enrollment (rounded to nearest 100) 62,700Total Spending 3,535.6 100% 61,900Long-Term Care 2,436.7 68.9% 42,661Inpatient 206.0 5.8% 3,607Drugs 190.8 5.4% 3,341Physician/ Lab-Xray 82.1 2.3% 1,438Outpatient/ Clinic 123.3 3.5% 2,159Rehab and Therapy 151.0 4.3% 2,643Other Supportive Services 51.6 1.5% 904Other Acute 294.0 8.3% 5,148
All Children with Predominantly Community-Based Long-Term Care Total Spending
Percent of Spending
Spending Per Full-Year Equivalent Medicaid Enrollee
Enrollment (rounded to nearest 100) 337,800Total Spending 8,959.8 100% 29,057Long-Term Care 3,373.1 37.6% 10,939Inpatient 2,167.8 24.2% 7,030Drugs 839.1 9.4% 2,721Physician/ Lab-Xray 515.8 5.8% 1,673Outpatient/ Clinic 375.9 4.2% 1,219Rehab and Therapy 288.6 3.2% 936Other Supportive Services 513.4 5.7% 1,665Other Acute 886.0 9.9% 2,873
All Children with Substantial Mixed Institutional and Community-Based Long-Term Care Total Spending
Percent of Spending
Spending Per Full-Year Equivalent Medicaid Enrollee
Enrollment (rounded to nearest 100) 4,000Total Spending 398.0 100% 104,075Long-Term Care 268.0 67.4% 70,098Inpatient 55.4 13.9% 14,496Drugs 23.4 5.9% 6,109Physician/ Lab-Xray 8.0 2.0% 2,097Outpatient/ Clinic 10.9 2.7% 2,840Rehab and Therapy 6.7 1.7% 1,752Other Supportive Services 9.0 2.3% 2,352Other Acute 16.6 4.2% 4,332
Source: Urban Institute and KCMU estimates based on MSIS and CMS-64 2007 data.
Table 9. Spending and Enrollment for All Child Medicaid Enrollees (Ages 0-18)1 Regardless of Eligibility Pathway with Substantial Long-Term Care Use, 2007
1. Beneficiaries eligible for Medicaid through a non-disabled child pathway but missing age were not included in the separate adult or child tables because they could be 0-21 depending on the state since 19-21 year olds are not consistently classified aschildren or adults across states. This amounted to 298 enrollees with $6,741,651 total spending and $164,038 total long-term care spending not included in the separate adult or child tables. Beneficiaries eligible through a non-disabled adult pathway butmissing age were classified as adults for the adult tables because the eligibility pathway indicates that they are 19-64 years old.
00 27
All Disabled Children with Substantial Long-Term Care
Total Spending(in millions)
Percent of Spending
Spending Per Full-Year Equivalent Medicaid Enrollee
Enrollment (rounded to nearest 100) 170,500Total Spending 8,295.4 100% 50,285Long-Term Care 4,253.4 51.3% 25,783Inpatient 1,318.9 15.9% 7,995Drugs 660.0 8.0% 4,001Physician/ Lab-Xray 303.2 3.7% 1,838Outpatient/ Clinic 279.6 3.4% 1,695Rehab and Therapy 268.8 3.2% 1,629Other Supportive Services 440.3 5.3% 2,669Other Acute 771.2 9.3% 4,675
All Disabled Children with Predominantly Institutional Long-Term Care Total Spending
Percent of Spending
Spending Per Full-Year Equivalent Medicaid Enrollee
Enrollment (rounded to nearest 100) 20,100Total Spending 1,638.9 100% 85,609Long-Term Care 1,196.6 73.0% 62,504Inpatient 102.5 6.3% 5,354Drugs 83.4 5.1% 4,358Physician/ Lab-Xray 27.5 1.7% 1,438Outpatient/ Clinic 44.2 2.7% 2,309Rehab and Therapy 37.7 2.3% 1,969Other Supportive Services 15.2 0.9% 794Other Acute 131.8 8.0% 6,882
All Disabled Children with Predominantly Community-Based Long-Term Care Total Spending
Percent of Spending
Spending Per Full-Year Equivalent Medicaid Enrollee
Enrollment (rounded to nearest 100) 147,700Total Spending 6,337.3 100% 44,280Long-Term Care 2,837.7 44.8% 19,827Inpatient 1,171.7 18.5% 8,187Drugs 559.4 8.8% 3,908Physician/ Lab-Xray 270.0 4.3% 1,886Outpatient/ Clinic 227.5 3.6% 1,590Rehab and Therapy 225.4 3.6% 1,575Other Supportive Services 418.3 6.6% 2,923Other Acute 627.4 9.9% 4,383
All Disabled Children with Substantial Mixed Institutional and Community-Based Long-Term Care Total Spending
Percent of Spending
Spending Per Full-Year Equivalent Medicaid Enrollee
Enrollment (rounded to nearest 100) 2,800Total Spending 319.2 100% 118,035Long-Term Care 219.1 68.6% 81,027Inpatient 44.8 14.0% 16,563Drugs 17.2 5.4% 6,367Physician/ Lab-Xray 5.7 1.8% 2,098Outpatient/ Clinic 7.9 2.5% 2,904Rehab and Therapy 5.7 1.8% 2,106Other Supportive Services 6.7 2.1% 2,488Other Acute 12.1 3.8% 4,481
Source: Urban Institute and KCMU estimates based on MSIS and CMS-64 2007 data.
Table 9a. Spending and Enrollment for Disabled Child Medicaid Enrollees (Ages 0-18)1 with Substantial Long-Term Care Use, 2007
1. Beneficiaries eligible for Medicaid through a non-disabled child pathway but missing age were not included in the separate adult or child tables because they could be 0-21 depending on the state since 19-21 year olds are not consistently classified aschildren or adults across states. This amounted to 298 enrollees with $6,741,651 total spending and $164,038 total long-term care spending not included in the separate adult or child tables. Beneficiaries eligible through a non-disabled adult pathway butmissing age were classified as adults for the adult tables because the eligibility pathway indicates that they are 19-64 years old.
0028
All Other Children with Substantial Long-Term Care Total Spending(in millions)
Percent of Spending
Spending Per Full-Year Equivalent Medicaid Enrollee
Enrollment (rounded to nearest 100) 233,900Total Spending 4,597.9 100% 22,503Long-Term Care 1,824.5 39.7% 8,929Inpatient 1,110.3 24.1% 5,434Drugs 393.3 8.6% 1,925Physician/ Lab-Xray 302.7 6.6% 1,481Outpatient/ Clinic 230.5 5.0% 1,128Rehab and Therapy 177.5 3.9% 869Other Supportive Services 133.7 2.9% 655Other Acute 425.4 9.3% 2,082
All Other Children with Predominantly Institutional Long-Term Care Total Spending
Percent of Spending
Spending Per Full-Year Equivalent Medicaid Enrollee
Enrollment (rounded to nearest 100) 42,600Total Spending 1,896.7 100% 49,948Long-Term Care 1,240.1 65.4% 32,657Inpatient 103.5 5.5% 2,726Drugs 107.4 5.7% 2,828Physician/ Lab-Xray 54.6 2.9% 1,437Outpatient/ Clinic 79.1 4.2% 2,084Rehab and Therapy 113.3 6.0% 2,983Other Supportive Services 36.4 1.9% 959Other Acute 162.3 8.6% 4,274
All Other Children with Predominantly Community-Based Long-Term Care Total Spending
Percent of Spending
Spending Per Full-Year Equivalent Medicaid Enrollee
Enrollment (rounded to nearest 100) 190,100Total Spending 2,622.5 100% 15,871Long-Term Care 535.5 20.4% 3,241Inpatient 996.1 38.0% 6,029Drugs 279.7 10.7% 1,693Physician/ Lab-Xray 245.8 9.4% 1,487Outpatient/ Clinic 148.4 5.7% 898Rehab and Therapy 63.2 2.4% 383Other Supportive Services 95.1 3.6% 575Other Acute 258.7 9.9% 1,565
All Other Children with Substantial Mixed Institutional and Community-Based Long-Term Care Total Spending
Percent of Spending
Spending Per Full-Year Equivalent Medicaid Enrollee
Enrollment (rounded to nearest 100) 1,200Total Spending 78.7 100% 70,343Long-Term Care 48.9 62.1% 43,690Inpatient 10.6 13.5% 9,500Drugs 6.1 7.8% 5,484Physician/ Lab-Xray 2.3 3.0% 2,093Outpatient/ Clinic 3.0 3.8% 2,684Rehab and Therapy 1.0 1.3% 896Other Supportive Services 2.3 2.9% 2,024Other Acute 4.4 5.6% 3,973
Source: Urban Institute and KCMU estimates based on MSIS and CMS-64 2007 data.
Table 9b. Spending and Enrollment for Child Medicaid Enrollees (Ages 0-18)1 Eligible through Categories Other than Disability with Substantial Long-Term Care Use, 2007
1. Beneficiaries eligible for Medicaid through a non-disabled child pathway but missing age were not included in the separate adult or child tables because they could be 0-21 depending on the state since 19-21 year olds are not consistently classified aschildren or adults across states. This amounted to 298 enrollees with $6,741,651 total spending and $164,038 total long-term care spending not included in the separate adult or child tables. Beneficiaries eligible through a non-disabled adult pathway butmissing age were classified as adults for the adult tables because the eligibility pathway indicates that they are 19-64 years old.
00 29
All Adults with Substantial Long-Term Care Total Spending(in millions)
Percent of Spending
Spending Per Full-Year Equivalent Medicaid Enrollee
Enrollment (rounded to nearest 100) 1,340,800Total Spending 67,125.0 100% 52,683Long-Term Care 47,881.1 71.3% 37,579Inpatient 6,530.6 9.7% 5,126Drugs 3,825.9 5.7% 3,003Physician/ Lab-Xray 1,653.5 2.5% 1,298Outpatient/ Clinic 2,275.3 3.4% 1,786Rehab and Therapy 669.6 1.0% 525Other Supportive Services 1,507.7 2.2% 1,183Other Acute 2,781.4 4.1% 2,183
All Adults with Predominantly Institutional Long-Term Care Total Spending
Percent of Spending
Spending Per Full-Year Equivalent Medicaid Enrollee
Enrollment (rounded to nearest 100) 280,600Total Spending 24,065.7 100% 92,337Long-Term Care 19,843.1 82.5% 76,136Inpatient 1,917.5 8.0% 7,357Drugs 804.9 3.3% 3,088Physician/ Lab-Xray 343.6 1.4% 1,318Outpatient/ Clinic 355.7 1.5% 1,365Rehab and Therapy 105.6 0.4% 405Other Supportive Services 294.2 1.2% 1,129Other Acute 401.2 1.7% 1,539
All Adults with Predominantly Community-Based Long-Term Care Total Spending
Percent of Spending
Spending Per Full-Year Equivalent Medicaid Enrollee
Enrollment (rounded to nearest 100) 1,015,400Total Spending 39,426.8 100% 40,609Long-Term Care 25,687.8 65.2% 26,458Inpatient 3,927.9 10.0% 4,046Drugs 2,832.9 7.2% 2,918Physician/ Lab-Xray 1,205.9 3.1% 1,242Outpatient/ Clinic 1,807.1 4.6% 1,861Rehab and Therapy 542.4 1.4% 559Other Supportive Services 1,143.6 2.9% 1,178Other Acute 2,279.2 5.8% 2,348
All Adults with Substantial Mixed Institutional and Community-Based Long-Term Care Total Spending
Percent of Spending
Spending Per Full-Year Equivalent Medicaid Enrollee
Enrollment (rounded to nearest 100) 44,800Total Spending 3,632.5 100% 85,219Long-Term Care 2,350.2 64.7% 55,136Inpatient 685.2 18.9% 16,075Drugs 188.2 5.2% 4,414Physician/ Lab-Xray 104.0 2.9% 2,440Outpatient/ Clinic 112.5 3.1% 2,640Rehab and Therapy 21.6 0.6% 507Other Supportive Services 69.9 1.9% 1,639Other Acute 101.0 2.8% 2,368
Source: Urban Institute and KCMU estimates based on MSIS and CMS-64 2007 data.
Table 10. Spending and Enrollment for All Adult Medicaid Enrollees (Ages 19-64)1 Regardless of Eligibility Pathway with Substantial Long-Term Care Use, 2007
1. Beneficiaries eligible for Medicaid through a non-disabled child pathway but missing age were not included in the separate adult or child tables because they could be 0-21 depending on the state since 19-21 year olds are not consistently classified aschildren or adults across states. This amounted to 298 enrollees with $6,741,651 total spending and $164,038 total long-term care spending not included in the separate adult or child tables. Beneficiaries eligible through a non-disabled adult pathway butmissing age were classified as adults for the adult tables because the eligibility pathway indicates that they are 19-64 years old.
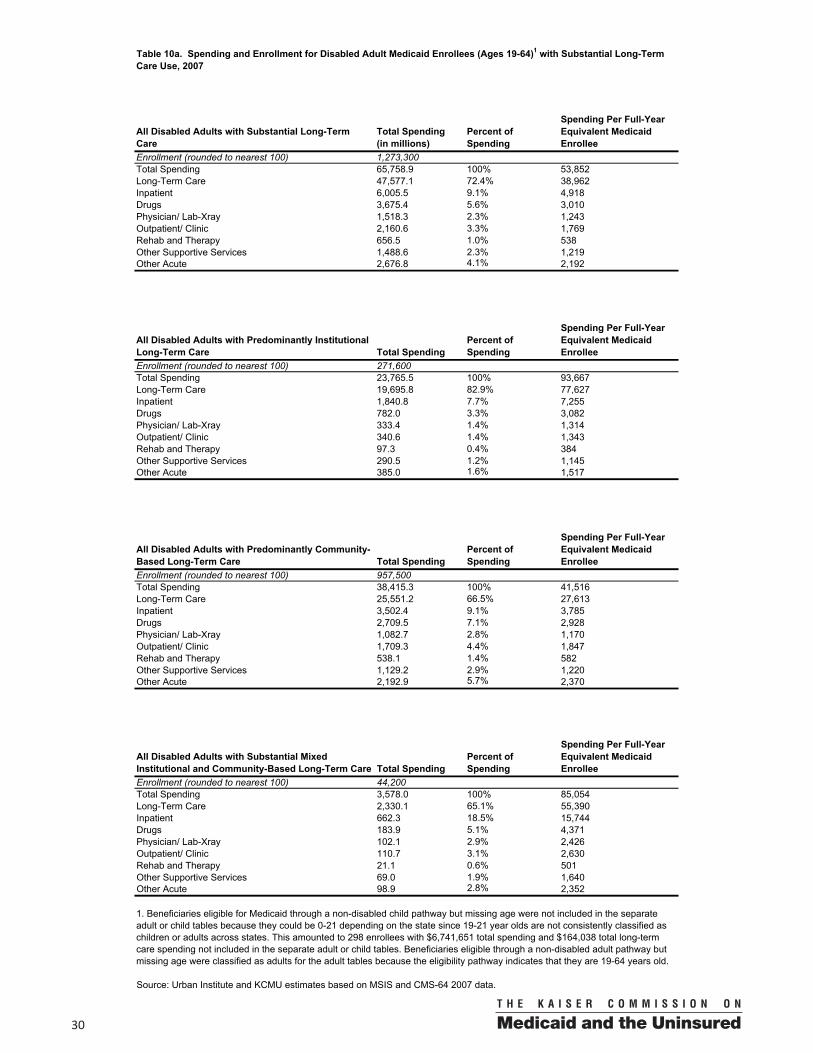
0030
All Disabled Adults with Substantial Long-Term Care
Total Spending(in millions)
Percent of Spending
Spending Per Full-Year Equivalent Medicaid Enrollee
Enrollment (rounded to nearest 100) 1,273,300Total Spending 65,758.9 100% 53,852Long-Term Care 47,577.1 72.4% 38,962Inpatient 6,005.5 9.1% 4,918Drugs 3,675.4 5.6% 3,010Physician/ Lab-Xray 1,518.3 2.3% 1,243Outpatient/ Clinic 2,160.6 3.3% 1,769Rehab and Therapy 656.5 1.0% 538Other Supportive Services 1,488.6 2.3% 1,219Other Acute 2,676.8 4.1% 2,192
All Disabled Adults with Predominantly Institutional Long-Term Care Total Spending
Percent of Spending
Spending Per Full-Year Equivalent Medicaid Enrollee
Enrollment (rounded to nearest 100) 271,600Total Spending 23,765.5 100% 93,667Long-Term Care 19,695.8 82.9% 77,627Inpatient 1,840.8 7.7% 7,255Drugs 782.0 3.3% 3,082Physician/ Lab-Xray 333.4 1.4% 1,314Outpatient/ Clinic 340.6 1.4% 1,343Rehab and Therapy 97.3 0.4% 384Other Supportive Services 290.5 1.2% 1,145Other Acute 385.0 1.6% 1,517
All Disabled Adults with Predominantly Community-Based Long-Term Care Total Spending
Percent of Spending
Spending Per Full-Year Equivalent Medicaid Enrollee
Enrollment (rounded to nearest 100) 957,500Total Spending 38,415.3 100% 41,516Long-Term Care 25,551.2 66.5% 27,613Inpatient 3,502.4 9.1% 3,785Drugs 2,709.5 7.1% 2,928Physician/ Lab-Xray 1,082.7 2.8% 1,170Outpatient/ Clinic 1,709.3 4.4% 1,847Rehab and Therapy 538.1 1.4% 582Other Supportive Services 1,129.2 2.9% 1,220Other Acute 2,192.9 5.7% 2,370
All Disabled Adults with Substantial Mixed Institutional and Community-Based Long-Term Care Total Spending
Percent of Spending
Spending Per Full-Year Equivalent Medicaid Enrollee
Enrollment (rounded to nearest 100) 44,200Total Spending 3,578.0 100% 85,054Long-Term Care 2,330.1 65.1% 55,390Inpatient 662.3 18.5% 15,744Drugs 183.9 5.1% 4,371Physician/ Lab-Xray 102.1 2.9% 2,426Outpatient/ Clinic 110.7 3.1% 2,630Rehab and Therapy 21.1 0.6% 501Other Supportive Services 69.0 1.9% 1,640Other Acute 98.9 2.8% 2,352
Source: Urban Institute and KCMU estimates based on MSIS and CMS-64 2007 data.
Table 10a. Spending and Enrollment for Disabled Adult Medicaid Enrollees (Ages 19-64)1 with Substantial Long-Term Care Use, 2007
1. Beneficiaries eligible for Medicaid through a non-disabled child pathway but missing age were not included in the separate adult or child tables because they could be 0-21 depending on the state since 19-21 year olds are not consistently classified aschildren or adults across states. This amounted to 298 enrollees with $6,741,651 total spending and $164,038 total long-term care spending not included in the separate adult or child tables. Beneficiaries eligible through a non-disabled adult pathway butmissing age were classified as adults for the adult tables because the eligibility pathway indicates that they are 19-64 years old.
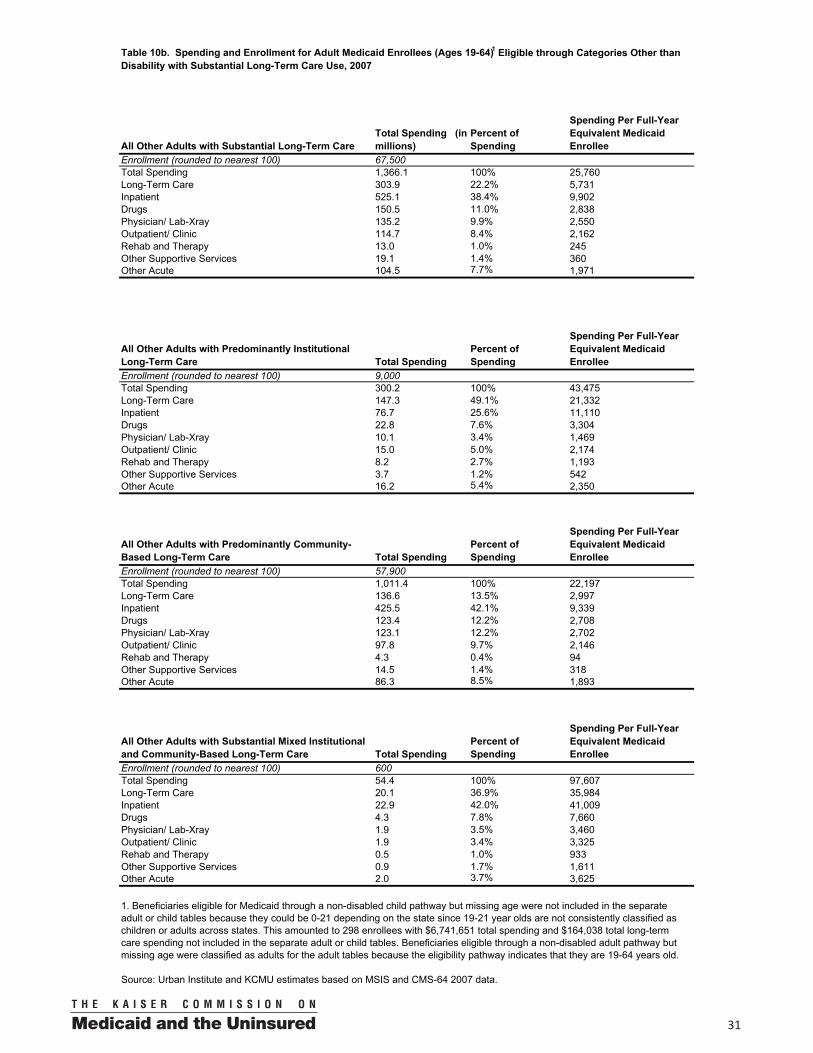
00 31
All Other Adults with Substantial Long-Term Care Total Spending (in millions)
Percent of Spending
Spending Per Full-Year Equivalent Medicaid Enrollee
Enrollment (rounded to nearest 100) 67,500Total Spending 1,366.1 100% 25,760Long-Term Care 303.9 22.2% 5,731Inpatient 525.1 38.4% 9,902Drugs 150.5 11.0% 2,838Physician/ Lab-Xray 135.2 9.9% 2,550Outpatient/ Clinic 114.7 8.4% 2,162Rehab and Therapy 13.0 1.0% 245Other Supportive Services 19.1 1.4% 360Other Acute 104.5 7.7% 1,971
All Other Adults with Predominantly Institutional Long-Term Care Total Spending
Percent of Spending
Spending Per Full-Year Equivalent Medicaid Enrollee
Enrollment (rounded to nearest 100) 9,000Total Spending 300.2 100% 43,475Long-Term Care 147.3 49.1% 21,332Inpatient 76.7 25.6% 11,110Drugs 22.8 7.6% 3,304Physician/ Lab-Xray 10.1 3.4% 1,469Outpatient/ Clinic 15.0 5.0% 2,174Rehab and Therapy 8.2 2.7% 1,193Other Supportive Services 3.7 1.2% 542Other Acute 16.2 5.4% 2,350
All Other Adults with Predominantly Community-Based Long-Term Care Total Spending
Percent of Spending
Spending Per Full-Year Equivalent Medicaid Enrollee
Enrollment (rounded to nearest 100) 57,900Total Spending 1,011.4 100% 22,197Long-Term Care 136.6 13.5% 2,997Inpatient 425.5 42.1% 9,339Drugs 123.4 12.2% 2,708Physician/ Lab-Xray 123.1 12.2% 2,702Outpatient/ Clinic 97.8 9.7% 2,146Rehab and Therapy 4.3 0.4% 94Other Supportive Services 14.5 1.4% 318Other Acute 86.3 8.5% 1,893
All Other Adults with Substantial Mixed Institutional and Community-Based Long-Term Care Total Spending
Percent of Spending
Spending Per Full-Year Equivalent Medicaid Enrollee
Enrollment (rounded to nearest 100) 600Total Spending 54.4 100% 97,607Long-Term Care 20.1 36.9% 35,984Inpatient 22.9 42.0% 41,009Drugs 4.3 7.8% 7,660Physician/ Lab-Xray 1.9 3.5% 3,460Outpatient/ Clinic 1.9 3.4% 3,325Rehab and Therapy 0.5 1.0% 933Other Supportive Services 0.9 1.7% 1,611Other Acute 2.0 3.7% 3,625
Source: Urban Institute and KCMU estimates based on MSIS and CMS-64 2007 data.
Table 10b. Spending and Enrollment for Adult Medicaid Enrollees (Ages 19-64)1 Eligible through Categories Other than Disability with Substantial Long-Term Care Use, 2007
1. Beneficiaries eligible for Medicaid through a non-disabled child pathway but missing age were not included in the separate adult or child tables because they could be 0-21 depending on the state since 19-21 year olds are not consistently classified aschildren or adults across states. This amounted to 298 enrollees with $6,741,651 total spending and $164,038 total long-term care spending not included in the separate adult or child tables. Beneficiaries eligible through a non-disabled adult pathway butmissing age were classified as adults for the adult tables because the eligibility pathway indicates that they are 19-64 years old.
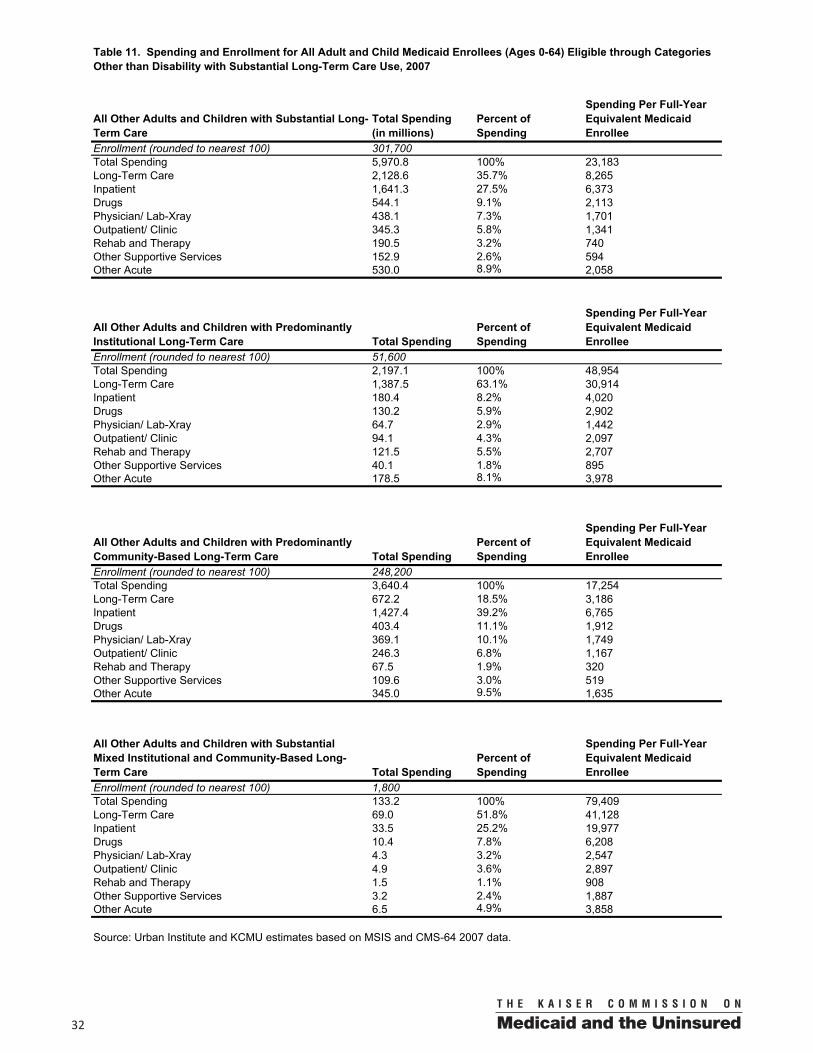
0032
All Other Adults and Children with Substantial Long-Term Care
Total Spending(in millions)
Percent of Spending
Spending Per Full-Year Equivalent Medicaid Enrollee
Enrollment (rounded to nearest 100) 301,700Total Spending 5,970.8 100% 23,183Long-Term Care 2,128.6 35.7% 8,265Inpatient 1,641.3 27.5% 6,373Drugs 544.1 9.1% 2,113Physician/ Lab-Xray 438.1 7.3% 1,701Outpatient/ Clinic 345.3 5.8% 1,341Rehab and Therapy 190.5 3.2% 740Other Supportive Services 152.9 2.6% 594Other Acute 530.0 8.9% 2,058
All Other Adults and Children with Predominantly Institutional Long-Term Care Total Spending
Percent of Spending
Spending Per Full-Year Equivalent Medicaid Enrollee
Enrollment (rounded to nearest 100) 51,600Total Spending 2,197.1 100% 48,954Long-Term Care 1,387.5 63.1% 30,914Inpatient 180.4 8.2% 4,020Drugs 130.2 5.9% 2,902Physician/ Lab-Xray 64.7 2.9% 1,442Outpatient/ Clinic 94.1 4.3% 2,097Rehab and Therapy 121.5 5.5% 2,707Other Supportive Services 40.1 1.8% 895Other Acute 178.5 8.1% 3,978
All Other Adults and Children with Predominantly Community-Based Long-Term Care Total Spending
Percent of Spending
Spending Per Full-Year Equivalent Medicaid Enrollee
Enrollment (rounded to nearest 100) 248,200Total Spending 3,640.4 100% 17,254Long-Term Care 672.2 18.5% 3,186Inpatient 1,427.4 39.2% 6,765Drugs 403.4 11.1% 1,912Physician/ Lab-Xray 369.1 10.1% 1,749Outpatient/ Clinic 246.3 6.8% 1,167Rehab and Therapy 67.5 1.9% 320Other Supportive Services 109.6 3.0% 519Other Acute 345.0 9.5% 1,635
All Other Adults and Children with Substantial Mixed Institutional and Community-Based Long-Term Care Total Spending
Percent of Spending
Spending Per Full-Year Equivalent Medicaid Enrollee
Enrollment (rounded to nearest 100) 1,800Total Spending 133.2 100% 79,409Long-Term Care 69.0 51.8% 41,128Inpatient 33.5 25.2% 19,977Drugs 10.4 7.8% 6,208Physician/ Lab-Xray 4.3 3.2% 2,547Outpatient/ Clinic 4.9 3.6% 2,897Rehab and Therapy 1.5 1.1% 908Other Supportive Services 3.2 2.4% 1,887Other Acute 6.5 4.9% 3,858
Source: Urban Institute and KCMU estimates based on MSIS and CMS-64 2007 data.
Table 11. Spending and Enrollment for All Adult and Child Medicaid Enrollees (Ages 0-64) Eligible through Categories Other than Disability with Substantial Long-Term Care Use, 2007
1 3 3 0 G S T R E E T N W , W A S H I N G T O N , D C 2 0 0 0 5
P H O N E : ( 2 0 2 ) 3 4 7 - 5 2 7 0 , F A X : ( 2 0 2 ) 3 4 7 - 5 2 7 4
W E B S I T E : W W W . K F F . O R G / K C M U
A d d i t i o n a l c o p i e s o f t h i s r e p o r t ( # 0 0 0 0 ) a r e a v a i l a b l e o n t h e K a i s e r F a m i l y F o u n d a t i o n ’ s w e b s i t e a t w w w . k f f . o r g .
The Kaiser Commission on Medicaid and the Uninsured provides information and analysis on health care coverage and access for the low-
income population, with a special focus on Medicaid’s role and coverage of the uninsured. Begun in 1991 and based in the Kaiser Family
Foundation's Washington, DC office, the Commission is the largest operating program of the Foundation. The Commission's work is
conducted by Foundation staff under the guidance of a bi-partisan group of national leaders and experts in health care and public policy.
This publication (#7576-02) is available on the Kaiser Family Foundation’s website at www.kff.org.