medical devices april 19, 2018 · medical devices april 19, ... devices ranging from magnetic...
TRANSCRIPT

Important disclosures appear on the last page of this report.
The Henry Fund
Henry B. Tippie School of Management
Kyle Davies [[email protected]]
Medical Devices April 19, 2018
Healthcare Sector Industry Rating Overweight
Investment Thesis Key Industry Statistics Shifting demographic numbers and a prolonged exemption from an industry wide excise tax are driving enthusiasm in the medical device industry. Further supported by the recent corporate tax cut from 35% down to 21%, companies in the Medical Device industry have renewed vision regarding R&D, M&A, and demand driving factors. The growth of international revenue streams has amplified emphasis on innovation in emerging markets. Drivers of Thesis
• Advantageous Demographic Positioning – With the life expectancy increasing due to technological advances in the medical device industry, more older individuals will be reliant on medical devices to maintain quality of life.
• Increasing Elderly Population Pool – Currently 47.3 million people are over 65 with an estimated CAGR of 3.3% by 2022 and will drive the demand for medical devices focused on maintaining health.
• Extension of Excise Tax – Originally postponed during the rollout of Patient Protection and Affordable Care Act (PPACA), the suspended 2.3% excise tax on all medical device sales has been extended through 2020.
• Rising Healthcare Spending – As GDP continues to rise, so does individual spending on healthcare. Coupled with US Congress’ inability to revoke PPACA, more covered individuals are spending money on their health.
• Continued Focus on Innovation – With emerging markets becoming more mature, the demand for high-tech medical devices is growing. As more worldwide economies can afford the high price tag that accompanies medical devices, the industry is focused on creating new devices that cater to the international marketplace.
Risks to Thesis
• Revoked PPACA –Should Congress fulfill its promise of repealing and replacing PPACA, it will decrease the number of covered individuals whom would spend money in the medical device industry as uncertainty remains about what would replace the legislation.
• Strengthening Dollar – A strong dollar would hurt companies whom operate overseas thus lowering profits and decreasing reinvestment.
Market Cap (Top 6) (in Billions $) Johnson & Johnson Medtronic General Electric Abbott Laboratories Thermo Fisher Scientific Danaher Stryker
$127.4 $114.3 $135.6 $107.4
$87.3 $71.2 $60.7
Beckton and Dickinson $63.1
Key Industry Ratios P/E Net Margin ROA ROE ROIC FCF Margin EV/Sales
34.14 12.22
5.21 10.94
6.71 12.18
4.61 FCF Margin 12.18 EV/Sales 4.61
12 Month Performance Industry Description
The Medical Device industry in the Healthcare sector includes companies that develop, manufacture, and sell products and services catering to the cardiovascular, irradiation, neuromodular, and diabetic medical fields with devices ranging from magnetic resonance imaging (MRI) and ultrasound equipment, to pacemakers and continuous glucose monitors (CGM). Driven by sales in North America, the Medical Device industry is growing globally servicing millions of individuals in a steadily increasing pool.
34.1
6.7
19.722.7
7.6
13.3
0
5
10
15
20
25
30
35
40
P/E ROIC EV/EBITDA
IHI S&P 500
Source: FactSet
-10%
0%
10%
20%
30%
A M J J A S O N D J F M
IHI S&P 500
Source: FactSet

Page 2
EXECUTIVE SUMMARY
The Medical Device Industry is poised to have an explosive year due to several significant demographic, financial, and political changes that cumulatively drive the overweight recommendation.
Demographically, the United States is positioned to have significant growth in the number of elderly adults whom are the most prominent end users of medical devices. According to the US Census Bureau, the number of adults aged 65 and older will increase at a CAGR of 3.3% to reach 55.6 million by 20221. In addition to increasing the size of the pool, the average life expectancy has continually risen over the past decade. The Center for Disease Control (CDC) renewed their projection of the average life expectancy to 78.7 years old, continuing a slight two-year slide in the average life expectancy2. This places the US behind other developed countries, such as Canada, Germany, France, Mexico, Japan and the UK which report an average life expectancy of 80.3 years31. Furthermore, the rising GDP of international countries gives way to increased demand for high-tech medical devices that were otherwise unavailable in the marketplace due to cost restrictions.
Politically, the recent delay of the 2.3% excise tax on all medical device sales has a direct impact on the capabilities of small and large medical device companies. President Trump renewed the delay on the 2.3% medical device excise tax until 20203. Being able to focus efforts on innovation by spending more money on R&D and expanding product pipelines has accelerated company outlooks. This move has been applauded by many top medical device manufacturers citing their ability to spend more money on company projects and employee retirement3. Furthermore, the reduced corporate tax rate from 35% to 21% also contributes to growth in the Medical Device Industry. This allows more room to maneuver within the industry and keep a robust R&D pipeline to drive revenue. With respect to future implementation, the lobbying groups representing the medical device industry will continue to postpone the tax and fight for repeal. The financial impact it will have on the industry would threaten innovation – a staple for growth.
During the 2016 US Presidential election, then candidate Trump promised to repeal and replace PPACA. While there have been a few unsuccessful attempts thus far by Congress and the current administration to repeal PPACA,
it stands to reason that more attempts will be made in the future. Currently the PPACA not only increases the number of covered individuals, but promotes more hospital visits due to decreased out-of-pocket expenses for those insured. Should PPACA be repealed, it is likely that the number of individuals going to the doctor to request and receive treatment using various medical devices will decline.
Furthermore, every top Medical Device company within the industry collects a significant portion of their revenue from international markets. International exposure in conjunction with a strengthening dollar will adversely affect respective revenue streams. This reduces the amount of spending power available to companies and limits the avenues in which to allocate resources.
INDUSTRY DESCRIPTION
The Medical Device Industry in the Healthcare sector specifically applies to companies that develop, manufacture, and sell high-tech products catering to four main fields: cardiovascular, irradiation, spinal, and diabetes. Not included in this industry are consumable sub-industries such as single use surgical equipment. Cardiovascular devices demand the largest portion of device sales at 27.7% followed by irradiation devices and neuromodulation/spinal devices at 20.96% and 14.2% market share, respectively.
Cardiovascular
Consisting of devices such as stents, pacemakers, and electrocardiographs, the global cardiovascular device sub-segment is poised to grow at a CAGR of 6.6% until 20248. Within the United States, a CAGR of 2.0% through 2020 is expected. This segment is the driving force behind the medical device sector. As individuals age, the muscles
27.7%
21.5%20.9%
14.2%
8.7%
7.0%
Medical Device Industry Segmentation
Cardiovascular OtherIrradiation Neuro/SpinalPatient Recovery Diabetes
Source: IBISWorld7

Page 3
within the heart begin to wear and become less efficient. Thus, all individuals are susceptible to experiencing heart difficulties not just the percentage of the population above age 65.
Maintaining healthy behaviors such as nutritious meals and an active lifestyle can help deter needing cardiovascular devices to assist in maintaining health. Furthermore, surgeries in this field are being assisted by robotics. When replacing heart valves or inserting an electrocardiograph, robotics allow surgeons to execute at a new level of precision thereby increasing the number of successful surgeries and decreasing patient risk.
Source: Factset
Irradiation
This sub-segment represents computed tomography (CT) scanners, MRI machines, and the equipment used within those devices. These devices are cost intensive and represent major capital investments from purchasers. Thus, the relationship between number of uses and repayment cannot be understated. As the population ages and requires more frequent doctor visits, hospitals and specialty labs are dependent on consistent usage to earn reimbursement from insurance companies to pay for the machine.
Source: Factset
Supporting cardiovascular, neurological, and spinal diagnoses, irradiation devices provide imaging in multiple fields to assist in the diagnoses process. Significant technological improvements have taken place over the past decade that have directly impacted the accuracy and efficacy of this sub-sector. The number of new case
diagnoses using CT scanners are expected to grow to 22.6 million incidences by 20309.
Spine
Similar to the cardiovascular segment, spinal medical devices target all segments of the population. As individuals get older and less active, joints throughout the body experience wear. However, the spine is the most common location where pain and discomfort are felt. Nearly 2/3 of Americans live with some type of back pain and over half of them do not pursue corrective action10. Currently, the spinal surgery device market is estimated to be $13 billion and grow to $16.6 billion by 2021 due to a CAGR of 5%11.
Herniated and degenerative discs are common issues in this sub-segment and are the main sources of discomfort experienced by patients. Yet increasing innovation and technological advances that limit the invasiveness of the procedures are stymied by growing prices and lack of patient awareness11.
Source: Factset
Diabetes
The global incidence of diabetes has grown significantly from 1980 to 2014. Worldwide over 422 million people were diagnosed with either Type 1 or Type 2 diabetes in 2014 as compared to only 108 million in 198012. The obesity epidemic and rise of unhealthy food options
Company Sales (M) % of Total Revenue Market Cap (M)
Medtronic 8,763$ 29.5% 109,243$
Abbott Labs 5,211$ 19.0% 103,505$
Boston Scientific 4,590$ 50.7% 39,771$
Edwards Lifesciences 3,435$ 100.0% 29,077$
Top Cardiovascular Med Device Companies
Company Sales (M) % of Total Revenue Market Cap (M)
GE Healthcare 16,722$ 15.7% 93,601$
Siemens 13,703$ 16.5% 88,570$
Becton Dickinson and Co 5,248$ 47.9% 49,425$
Top Irradiation Med Device Companies
13.3
18.222.6
0
5
10
15
20
25
2010 2020 2030
New Cancer Diagnoses
Incidences Source: Strategyr9
Company Sales (M) % of Total Revenue Market Cap (M)
Medtronic 2,641$ 8.9% 109,243$
Stryker 5,464$ 43.9% 60,457$
Zimmer Biomet 7,388$ 94.9% 21,785$
Johnson & Johnson 9,262$ 12.1% 353,465$
Top Spine Med Device Companies

Page 4
particularly within low income countries has spearheaded the number of diabetic cases throughout the world many of which go undiagnosed.
Source: Who.org12
WHO predicts that diabetes will be the seventh leading cause of death by 202013. On average globally, nearly 46% of individuals suffering from diabetes are not diagnosed due to the subtle nature of the disease14.
The medical device industry has responded to this epidemic by creating continuous glucose monitors (CGM) that monitor blood sugar levels in real time. For many adults who are diagnosed later in life, CGMs represent an opportunity to live an improved life with a disease that can have devastating effects on quality of life. Being able to manage the peaks and valleys of blood sugar levels and maintain a consistent glucose level allows those suffering from diabetes to avoid consequences of having blood sugar that is too high or too low. Greater awareness within this sub-segment is the greatest opportunity for growth as the medical devices used to facilitate healthier behaviors do not carry an exorbitant cost.
Source: Factset
Industry Growth
Relative to the S&P 500, the Medical Device sector within Healthcare has kept pace with the S&P 500 on a relative basis15.
With revenue growth expected to increase at an average of 4.5% over the next few years, the industry is currently positioned to grow faster than the average annual growth rate of 2%16. Driven primarily by demographic changes, the Medical Device Industry within Healthcare is expected to experience stable domestic growth with increased potential in emerging markets such as Europe, Asia, and Africa.
FDA Approval Process
The approval process for new medical devices in the United States is a complicated and time-intensive task that every company with a new device must endure. Overseen by the Federal Drug Administration (FDA), the review process is strict and time-consuming requiring documentation and clinical studies providing evidence in support of the new device. New devices are classified under three separate categories based on the risk of use: Class I, II, or III with Class I being the lowest risk and Class III posing the highest risk to a patient. Most of the medical devices as described in this specific industry are produced all under Class II or III. Due to the inherently risky nature of these devices, strict tests are required to prove efficacy. In addition to clinical testing, a Pre-Market Notification 501(k) form must be completed for any device that is equivalent to one legally distributed within the United States17.
While many companies are mimicking current devices on the market, any novel and truly innovative
Company Sales (M) % of Total Revenue Market Cap (M)
Sanofi 7,348$ 20.5% 82,828$
Eli Lilly 7,391$ 36.5% 70,794$
Novo Nordisk 12,128$ 80.3% 99,609$
Top Diabetes Med Device Companies
95
105
115
125
135
A M J J A S O N D J F M A
Healthcare Devices v. S&P 500
S&P Healthcare Devices S&P 500 (TR)
Source: Spindices15
Page 5
procedures/devices are not eligible for the Pre-Market Notification 501(k) classification and must prove efficacy solely through clinical studies. However, the design and purpose of these studies are extremely important. A poor clinical hypothesis can prove to be detrimental in the approval of a device if the study is not set up in an advantageous manner. The strict approval process results in many devices rejected by the FDA. Thus, many companies choose to pursue a European Conformity (CE) Mark. Less bureaucratic and more efficient in process, obtaining the CE mark allows novel medical devices to demonstrate efficacy abroad before attempting to get FDA approval for use in the United States.
RECENT DEVELOPMENTS
Change in Regulation
The current Trump administration and Republican-led Congress have been unable to fulfill the 2016 campaign promise of repealing and replacing PPACA. A cornerstone of the Obama Administration, it increased the applicant pool of those insured by penalizing individuals who decided to not get health insurance. While increasing the demand and ease of obtaining healthcare, accompanied with the passage of PPACA was a 2.3% excise tax on all domestic medical device sales. This created immense pressure on both small and large companies as it cut into the bottom line and left many companies unable to reinvest in product pipelines which has impacted innovation. It was consequently suspended until January 1st, 2018 where the tax would be reinstated. However, another vote was recently held that extended the suspension until 2020. Medical device companies celebrated the decision as it affords millions of dollars to be reinvested in R&D and help build a more robust pipeline. Most significantly affected by the decision are smaller companies that may not boast profits. The excise tax would overwhelm their ability to be cash-flow positive and maintain the ability to operate and invest in capital intensive R&D.
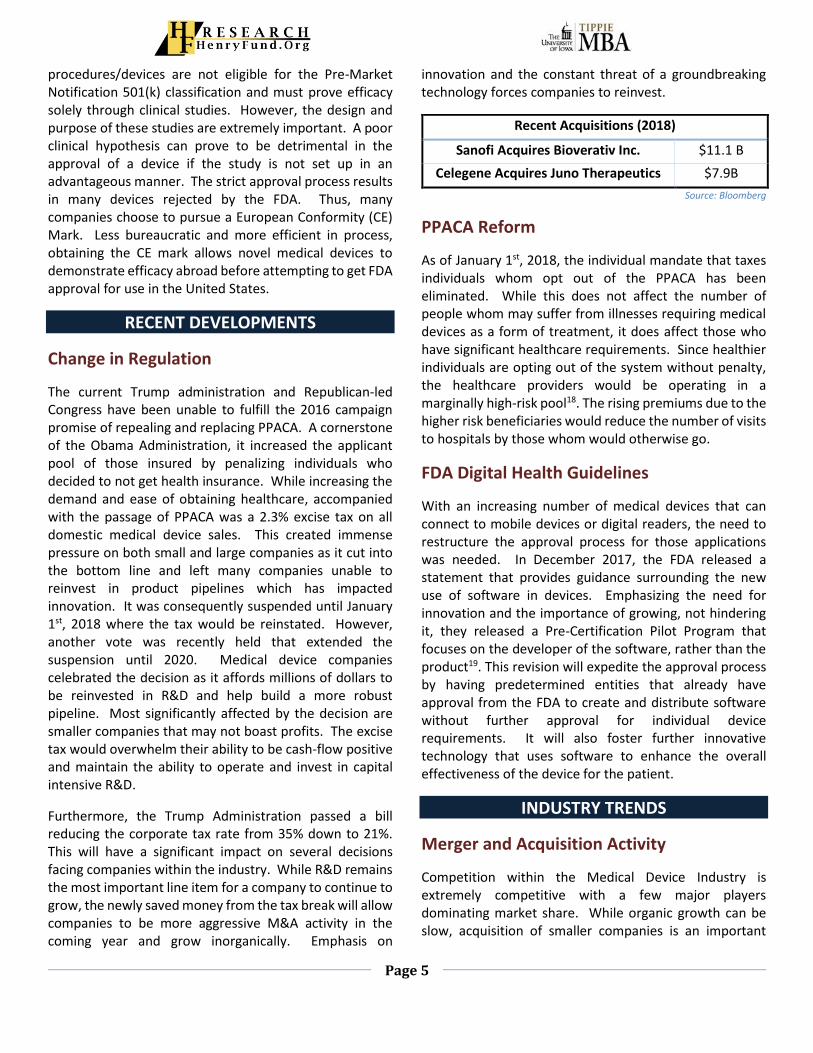
Furthermore, the Trump Administration passed a bill reducing the corporate tax rate from 35% down to 21%. This will have a significant impact on several decisions facing companies within the industry. While R&D remains the most important line item for a company to continue to grow, the newly saved money from the tax break will allow companies to be more aggressive M&A activity in the coming year and grow inorganically. Emphasis on
innovation and the constant threat of a groundbreaking technology forces companies to reinvest.
Recent Acquisitions (2018)
Sanofi Acquires Bioverativ Inc. $11.1 B
Celegene Acquires Juno Therapeutics $7.9B
Source: Bloomberg
PPACA Reform
As of January 1st, 2018, the individual mandate that taxes individuals whom opt out of the PPACA has been eliminated. While this does not affect the number of people whom may suffer from illnesses requiring medical devices as a form of treatment, it does affect those who have significant healthcare requirements. Since healthier individuals are opting out of the system without penalty, the healthcare providers would be operating in a marginally high-risk pool18. The rising premiums due to the higher risk beneficiaries would reduce the number of visits to hospitals by those whom would otherwise go.
FDA Digital Health Guidelines
With an increasing number of medical devices that can connect to mobile devices or digital readers, the need to restructure the approval process for those applications was needed. In December 2017, the FDA released a statement that provides guidance surrounding the new use of software in devices. Emphasizing the need for innovation and the importance of growing, not hindering it, they released a Pre-Certification Pilot Program that focuses on the developer of the software, rather than the product19. This revision will expedite the approval process by having predetermined entities that already have approval from the FDA to create and distribute software without further approval for individual device requirements. It will also foster further innovative technology that uses software to enhance the overall effectiveness of the device for the patient.
INDUSTRY TRENDS
Merger and Acquisition Activity
Competition within the Medical Device Industry is extremely competitive with a few major players dominating market share. While organic growth can be slow, acquisition of smaller companies is an important

Page 6
driver of supplementing current product offerings and expanding into new segments. In some cases, allocating spending towards an acquisition can be more cost-effective than creating the product from scratch due to high R&D cost. This results in small acquisitions that create synergies with existing products, provide a stepping stone into a new market, or shore up patent portfolios.
Over the past two decades, the number of mergers and acquisitions with respect to the deal value has gradually increased with a slight plateau over the past three years20.
Source: IMMA Institute20
As segments within the Medical Device Industry become increasingly populated, the importance of product portfolio development via acquisition is a strategy that companies increasingly rely upon. Recently, companies such as Johnson & Johnson and Abbott Laboratories have purchased either pieces of product portfolios or entire businesses in blockbuster deals. Johnson & Johnson purchased Abbott’s Medical Optics business in January of 2017 and in the same month, Abbott purchased St. Jude Medical. Both actions are part of a greater strategy to position those companies better in the marketplace and give insight to aspects of the industry those companies think will grow over the coming years.
Blockbuster Acquisitions of the Past Two Years
Acquirer Acquiree Deal Amount Date
Shire Baxalta 35.6B 1/16
Abbott Labs St. Jude Medical
30.1B 4/16
JnJ Actelion 29.8B 1/17
Becton, Dickinson and
Co.
CR Bard 24.1B 4/17
Source: Bloomberg
Research and Development Emphasis
Often one of the largest line item deductions on the income statement, R&D plays a pivotal and influential role in the Medical Device Industry. As new emergent technology creates pressure in any sub-sector, it is the responsibility of the major competitors to be at the forefront of innovation. This requires major capital expenditure each year typically following a percentage of sales.
Over the prior 4-years, R&D has represented over 5% total sales expense for these industry leaders. In smaller companies with few devices in their product portfolio, R&D expenses can represent well over 50% of total expenses. Future R&D expenditure, especially given the recent tax cut, will vary as companies decide between investing in current pipeline projects or potential acquisition targets.
Innovation Born from Product Lifecycles
Innovation also plays a significant factor due to the limited product life cycles. With the average lifespan of three to five years6, new innovative technology is in constant demand. Organic growth within companies participating in the Medical Device Industry can only come from a pipeline of new equipment with the expectation of replacement needed within the next decade. Additionally, the emerging international markets have matured to be able to support new medical device technology. However, with capital expenditure playing a significant role in the purchase of equipment, companies are pressured to find alternative ways to reduce costs while maintaining product quality.
8.47%6.83%
3.83%6.22%
12.12%
6.36%
0%2%4%6%8%
10%12%14%
Med
tro
nic
Ab
bo
ttLa
bo
rato
ries
Ther
mo
Fis
he
r
Stry
ker
J&J
Bec
ton
an
dD
icki
nso
n
4-Year Average R&D/Sales Ratio
Source: Factset

Page 7
Healthcare Spending
Healthcare spending within the United States is projected to rise from $3.2 trillion in 2018 to over $3.7 trillion by 2023 over the five-year period by a CAGR of 3.0%4. This trend is also seen worldwide as healthcare spending per GDP has been steadily rising since 20005. Also, increased awareness and education regarding healthy lifestyle choices have increased demand for better technology and availability of medical equipment.
MARKETS AND COMPETITION
The Medical Device industry is mainly dominated by four players based on market share.
However, market share does not adequately indicate competition levels. Smaller companies who focus on more specialized technology are constant threats to deteriorating market share within individual segments of the industry.
Threat of Entry
Immense capital requirements, heavy regulation, and intense competition all stifle potential entrants into the space. While niche opportunities exist, often the target market is too small to justify pursuit. However, firms that can succeed in a niche market are often acquired by larger companies who can leverage their sales structure to boost revenue. Furthermore, the proliferation of patent and intellectual property protection keeps major devices safe from identical products within the space. FDA regulations currently play a significant role as well. The timeline for a novel device from idea creation to market-ready can be years, often too long of a timeline as an investment opportunity due to the high rate of technological advances within the space.
Threat of Substitutes
Mirroring the same challenges presented in the threats of entry, substitutes have similar hurdles to navigate. While under patent protection, devices within the space are safe from direct imitation and topline revenue of the parent company. However, once the patent expires, competitors can manufacture a similar device that may offer benefits not available in the original device. The FDA states that the current term for a new patent is 20 years starting at the filing application date in the United States32.
Furthermore, innovation is constantly looming over the top industry competitors. New devices that offer services/technology that is not already present within the industry can give hospitals and clinical laboratories alternatives to the industry standard equipment. Due to the large amount of M&A activity, many newly patented devices are purchased by industry leaders to bolster their product portfolio.
Power of Supplier
Although there are only a few number of suppliers with industry competitors unable to backward integrate, the power of suppliers is low. The inability to forward integrate (directly due to R&D costs) and the high buyer’s price sensitivity limit the price suppliers can charge. Furthermore, the medical device industry can exert immense pressure upstream to get appropriate prices. Many high-tech medical devices have high margins. Yet, suppliers cannot charge more for materials because the high-margin is required to obtain a return on R&D expenses.
Power of Buyers
Hospitals represents the largest segment of buyers at 40.1% followed by distributors and exports at 27.3% and 25.3%, respectively.
5.3% 10.0% 19.0% 38.9% 26.8%
Medical Device Industry Leaders by Market Cap
Johnson & Johnson Abbott Laboratories
General Electric Medtronic
Other
Source: IbisWorld21
40.1%
27.3%
25.3%
7.3%Buyer Supply Chain Segmentation
Hospitals Distributors Exports Specialists
Source: IbisWorld22

Page 8
Medical devices are significant capital expenditures for hospitals and are often bought in small amounts. Due to the thin margins inherent to the hospital industry, price is a significant factor when determining whether to purchase new equipment. Necessary return on investment over a limited period influences hospitals decision to either replace or repair existing equipment. Influencing this segment is federal regulations regarding reimbursement. If hospitals/clinics are not guaranteed reimbursement for services provided through use of medical equipment (such as an MRI), they are less likely to purchase new equipment.
Distributors often buy in bulk and use discounts of purchasing in scale to then sell to hospitals. However, this market has been shrinking as more hospitals choose to directly purchase directly from the manufacturer. This further decreases the power of buyers and keeps medical device manufacturers squarely in control of pricing.
Intra-Industry Rivalry
Since the domestic market is not growing at a rapid pace, the competition between companies is intense. The slow organic growth of the industry forces companies to compete for the same customers. Fighting for every percentage of the market, industry rivalry is high. Protection of patented technology and extending legal rights are significant factors for each company as it can be the main driver for revenue in a target market segment. As patient satisfaction is an increasing demand driver in the clinical environment, the need for innovative and patient friendly devices spur competition. Since most medical device purchases are not brand driven, the emphasis on end-user satisfaction drives purchasing power. M&A activity is directly impacted by this reality. If a smaller company enters a space that is already dominated by an industry leader, the smaller company will usually be purchased by that leader to maintain market share and increase product and IP protection portfolios.
Life-Cycle Stage
Currently, the Medical Device industry is in a growth stage. As more individuals enter the later stage of life and require more frequent doctor visits, medical devices will be utilized more often. At an estimated 4-5% growth over the coming years16, domestic revenue opportunities are available. This growth is new for an industry that was sluggish ten years ago. A high correlation exists between high-technology and the prominence of using the newest
practices and information available to innovate new changes to existing equipment. Furthermore, the global growth of international economies makes them more suitable to afford the high cost of medical equipment. While most sales occur within the United States, more companies are expanding sales to international markets such as Europe and Asia.
Cost Structure
While profit margins are significant on high-tech medical equipment, the overall industry margin is much lower. The reliance on new, cutting-edge electronic components to power the collection of immense amounts of data and converting those inputs into a visual output (such as an MRI) represents a significant expenditure.
On average, R&D is 12% among all industry competitors (represented within the “Other” portion on the graph) but misrepresents true expenditures. Larger companies have higher revenue streams that dilute the amount of spending on R&D. Realistically, 12% under represents R&D costs since smaller companies will take multiple years of losses due to R&D costs that can represent 50%+ of revenue. Coupled with high materials costs, the benefit of having economies of scale is amplified between market leaders and smaller, niche companies.
Headquarter Location
Since the industry is largely dependent on innovation, it comes as no surprise that the headquarters of many companies that are in the United States are centered in environments where technological innovation is a prominent industry.
6.6%
18.6% 37.9%
12.0% 21.8%
Med Device Average Industry Costs
Profit Wages Purchases
Depreciation Marketing Rent & Utilities
R&D OtherSource: IBISWorld23

Page 9
Source: IbisWorld
Areas such as Silicon Valley in California and Chicago in Illinois offer ideal locations. Geographically moving closer to the origin of innovative and working in an environment that cultivates and supports research in every industry offers an edge to companies whom operate in the same region.
Peer Comparisons
The medical device industry is extremely diverse in the number of companies and scope in which they operate. With many different veins within each subsector, the opportunity for niche innovation is immense. However, the capital requirement to keep companies and ideas afloat for long enough to turn a profit makes it difficult to seize the opportunity. As such, many companies don’t survive long enough to become profitable and the ones that do have a promising pipeline are either acquired by the larger players in the industry or participate in an initial public offering. By market share the top three companies are: Medtronic, General Electric, and Abbott Laboratories.
Medtronic
Headquartered in Minneapolis, Medtronic represents 38.9% of the Medical Device industry. Supporting an extremely robust product pipeline, Medtronic has products in neurology, cardiology, orthopedic, and vascular disciplines24. Diversified into multiple areas of expertise allows Medtronic to maintain a steady revenue stream without being overly exposed in any one segment.
Furthermore, 44% of revenue generated is international24. Expanding into international markets in Europe and Asia, Medtronic can not only be a major influencer in the region, but also benefit their current suite of holdings by exposure to smaller foreign companies with unique IP that may stay off the international radar. With patent protection and IP critical to the revenue and profitability within the industry, Medtronic will continue to look for value investments that drive inorganic growth and synergize with their many product segments.
General Electric
An international conglomerate, General Electric is extremely diversified. However, their presence in the Medical Device industry is a single track – imaging systems. Capitalizing on economies of scale, General Electric manufactures and distributes high-tech instruments focusing on CT scanners, radiography, and contrast media25. With no significant acquisitions in the last five years, General Electric focuses on manufacturing equipment for the lowest cost while competing on price for similar machines.
Abbott Laboratories
A fusion between the biopharmaceutical and medical device industries, Abbott Laboratories is an international company that creates medical device products to complement its pharmaceutical product line. Recently acquiring St. Jude, Abbott Laboratories has increased their impact in the cardiovascular and neurological fields. With only 31% of their total revenue originating in the United States26, Abbott is susceptible to trade deals that hinder exports/imports and currency exchange rates. Perhaps one of the best firms positioned within the industry due to its synergies created by the St. Jude acquisition, Abbott can compete in each sub-segment of the industry.
Industry Competitive Ratios
Source: Factset27
Forward P/E Gross Margin ROA EV/Sales
Medtronic 16 62.3% 3.4% 4.2
Boston Scientific 19 63.7% 1.9% 4.6
Johnson & Johnson 16 69.9% 12.1% 4.8
Abbott Laboratories 20.3 53.9% 2.1% 4.2
Danaher 21.9 55.6% 4.6% 4.20
Stryker 21.5 63.9% 9.0% 5.00
Thermo Fisher 19 47.0% 4.7% 5.0
Becton, Dickinson and Co. 19.4 48.0% 3.7% 5.3

Page 10
P/E ratios within the industry can vary widely depending on the size of the company and the future prospect of young technology. For the larger industry leaders, the multiple is less inflated due to the robust nature of the product pipeline and clear segments that they choose to compete. Smaller firms, both domestically and internationally, drive the industry average P/E up due to overvaluation of technology.
Margins can remain healthy due to the high cost associated with the medical devices each company sells. However, lack of sales in each year that are unable to offset R&D costs can quickly cut into the margins that affects potential acquisitions and mergers that are reliant on the cash to purchase companies up front.
Johnson & Johnson is the only company featured that has a double digit return on assets due to supplementation from its biopharmaceutical line. The high cost of manufacturing and reliance on sales result in a small return on asset percentage for most of companies operating in the sector.
International Revenue
Source: Factset27
International revenue as a percentage of total revenue continues to be a significant economic driver for top companies in the industry. The growth of global GDP and emergent markets have incentivized industry leaders to look internationally for new untapped segments. Keeping track of currency fluctuations and trade agreements/tariffs will impact many of the companies in which over half of the revenue generated come from overseas.
ECONOMIC OUTLOOK
Global Population Growth
Population growth worldwide thereby increasing the number of elderly individuals will continue to drive the incidence of medical device usage. Growing at an average of 1.1% over the past few decades, the global population is expected to reach 8.5 billion by 203028.
Source: OurWorldinData28
Elderly Population
As the Baby Boomer generation reach 65, the growth of that demographic segment reaching retirement will drive medical device sales. Combined with longer average life span, the need for devices to maintain quality of life and healthiness will increase. Furthermore, the percentage of the population represented by baby boomers will be 20% by 203029 is a direct result of a longer lifespan.
% of International Revenue
Medtronic 43.8%
Boston Scientific 43.3%
Johnson & Johnson 47.4%
Abbott Laboratories 68.9%
Danaher 62.2%
Stryker 27.6%
Thermo Fisher 50.3%
Becton, Dickinson and Co. 46.4%

Page 11
Source: US Census29
Growth of Global GDP
Growing global GDP continues to provide wealth for international economies who prefer better medicinal practices to sustain a healthy life. The growth of GPD in developed and emerging countries allow resources to be spent on infrastructure and give their citizens access to previously unavailable medicinal practices that deliver value in every segment of the industry.
Source: The Economist30
Rising Interest Rates
Currently, the federal funds interest rate is 1.75% with plans of increasing the rate to 2% by end of year 2018 and 3% by 2020 indicating positive economic growth forecast. This may have a profound effect on potential mergers and acquisitions within the industry as companies may be encouraged to raise capital through equity as opposed to debt. Additionally, it will put further strain on the balance sheet for companies whom historically have carried large amount of debt with renewals every couple of years. Furthermore, it could influence capital structure organization and financing outlook for inorganic growth opportunities.
Source: FedFunds FRED33
Unemployment
Unemployment currently sits at a ten-year low signifying
strong job creation and boosted consumer income. This
indicates that more people within the working population
have discretionary income to spend. This includes
potential expenditures on healthcare that would have
otherwise been neglected. Currently the unemployment
rate is 4.1%. Coupled with the expectation of rising
interest rates in the coming two years, the unemployment
rate will likely remain near its current level. This puts more
money in the hands of consumers that allow them to take
care of themselves and others with respect to healthcare
needs.

Page 12
Source: US Bureau of Labor Statistics34
Regarding wage pressure, as the job pool fills it puts
greater pressure on companies to provide competitive
wages. Human capital will remain an integral component
of company’s competitive edge and as the number of
unemployed workers drop, the competitive salary
comparisons between companies will heighten.
CATALYSTS FOR GROWTH
The significant non-demographic factor that will determine growth for the industry will be innovation and commitment to R&D. A health product pipeline is mandatory for companies to continue to innovate and improve devices currently on the market. A shift away from innovation would hinder revenues and directly affect margins.
Demographically, the aging population, longevity of life, and growth of international GPD will continue to sustain companies who are reliant on organic growth.
INVESTMENT POSITIVES
• Significant demographic changes are occurring that directly benefit the number of potential individuals in need of medical devices.
• Beneficial tax breaks both directly impacting the medical device industry as well as the economy at large will allow companies to focus their efforts on expanding current product lines and look for investment opportunities
• Growth of emerging markets and the demands for more modern medicinal practices are driving international growth in either untapped or young markets
INVESTMENT NEGATIVES
• Largely dependent on innovation, a downturn of technological advances and lack of reinvestment in research will slow down the industry, deterring growth and dissuading potential entrants.
• A strengthening dollar will decrease revenues earned abroad. Could possibly deter companies from expanding internationally if the conversion rate is unfavorable while cost of expansion represents a significant expense.
KEYS TO MONITOR
As the demographic factors are unlikely the change, the key will be maintaining vision on the industry leaders. Keeping track of spending and revenue streams both in the U.S. and abroad will give the market an idea the direction flagship companies are headed.
Furthermore, the activity in the merger and acquisition sector will continue to act as a barometer of the industry. If M&A activity continues to grow, it will signal a healthy disposition within industry to expand revenue streams and capitalize on synergies between the acquirer and acquiree.
Lastly, watching the federal position on PPACA and other regulations that directly affect the industry will need to be monitored. Increasing operational costs via taxes and export tariffs or tightening restrictions and regulations by the FDA are all small changes that can have a large impact.
REFERENCES
1. IBIS World Report
http://clients1.ibisworld.com.proxy.lib.uiowa.edu
/reports/us/bed/default.aspx?bedid=22
2. CDC Report
https://www.cdc.gov/nchs/data/hus/hus16.pdf#
015 page 15
3. Medical Device Tax
https://www.statnews.com/2018/01/22/congres
s-medical-device-tax/
4. IBIS Healthcare Report
http://clients1.ibisworld.com.proxy.lib.uiowa.edu
/reports/us/bed/default.aspx?bedid=4074

Page 13
5. WorldBank Global Healthcare Spending Per GDP
https://data.worldbank.org/indicator/SH.XPD.TO
TL.ZS?end=2014&start=2000&view=chart
6. IBIS World Operating Conditions
http://clients1.ibisworld.com.proxy.lib.uiowa.edu
/reports/us/industry/operatingconditions.aspx?e
ntid=764
7. IBIS Product Segmentation
http://clients1.ibisworld.com.proxy.lib.uiowa.edu
/reports/us/industry/productsandmarkets.aspx?e
ntid=764
8. Cardiovascular Growth Rate
https://www.grandviewresearch.com/industry-
analysis/cardiovascular-devices-market
9. Cancer Incidences
http://www.strategyr.com/MarketResearch/Com
puted_Tomography_Scanners_CT_Scan_Market_
Trends.asp
10. Back Pain
http://www.apta.org/Media/Releases/Consumer
/2012/4/4/
11. Spine Market Growth
https://www.mordorintelligence.com/industry-
reports/global-spinal-surgery-devices-market-
industry
12. Diabetes Market
http://www.who.int/mediacentre/factsheets/fs3
12/en/
13. Diabetes Death Toll
http://journals.plos.org/plosmedicine/article?id=
10.1371/journal.pmed.0030442
14. Diabetes Reach https://www.idf.org/about-
diabetes/what-is-diabetes.html
15. Healthcare Equipment Sector v S&P 500
http://us.spindices.com/indices/equity/sp-
healthcare-equipment-select-industry-index
16. Medical Device Growth
https://www.mckinsey.com/industries/pharmace
uticals-and-medical-products/our-insights/the-
growth-imperative-for-medical-device-companies
17. FDA Medical Device Approval
https://www.fda.gov/downloads/MedicalDevices
/DigitalHealth/UCM568735.pdf
18. PPACA Reform
https://healthpayerintelligence.com/news/afford
able-care-act-changes-may-bring-a-rocky-2018-
for-payers
19. FDA Digital Health
https://www.fda.gov/downloads/MedicalDevices
/DigitalHealth/UCM568735.pdf
20. M&A Activity https://imaa-institute.org/m-and-a-
by-industries/
21. Industry Leaders
http://clients1.ibisworld.com.proxy.lib.uiowa.edu
/reports/us/industry/majorcompanies.aspx?entid
=764
22. Buyer Segmentation
http://clients1.ibisworld.com.proxy.lib.uiowa.edu
/reports/us/industry/productsandmarkets.aspx?e
ntid=764
23. Life Cycle Stage
http://clients1.ibisworld.com.proxy.lib.uiowa.edu
/reports/us/industry/productsandmarkets.aspx?e
ntid=764
24. Medtronic Factset 10-K
25. General Electric Factset RBICS
26. Abbott Laboratories Factset 10-K
27. Company Ratio Comparison Factset
28. Global Population Growth
https://ourworldindata.org/world-population-
growth
29. US Census Elderly Population Demographic
https://www.census.gov/prod/2014pubs/p25-
1140.pdf
30. Global GDP Growth
https://www.economist.com/news/economic-
and-financial-indicators/21654018-world-gdp
31. British Medical Journal – Life Expectancy
https://www.bmj.com/content/bmj/360/bmj.k49
6/F1.large.jpg
32. FDA Patent Length
https://www.fda.gov/Drugs/DevelopmentApprov
alProcess/ucm079031.htm

Page 14
33. Fed Funds Interest Rate History
https://fred.stlouisfed.org/series/FEDFUNDS
34. Unemployment Rate – Past 10 years
https://tradingeconomics.com/united-
states/unemployment-rate
IMPORTANT DISCLAIMER
Henry Fund reports are created by students enrolled in the Applied Securities Management program at the University of Iowa’s Tippie College of Business. These reports provide potential employers and other interested parties an example of the analytical skills, investment knowledge, and communication abilities of our students. Henry Fund analysts are not registered investment advisors, brokers or officially licensed financial professionals. The investment opinion contained in this report does not represent an offer or solicitation to buy or sell any of the aforementioned securities. Unless otherwise noted, facts and figures included in this report are from publicly available sources. This report is not a complete compilation of data, and its accuracy is not guaranteed. From time to time, the University of Iowa, its faculty, staff, students, or the Henry Fund may hold an investment position in the companies mentioned in this report.