medical visualization: visualizing the invisible · introduction - the visgroup at the uib...
TRANSCRIPT

Medical Visualization:
Visualizing the Invisible
Noeska SmitUiB Dept. of Informatics19-08-2018

Introduction
• Licensed Radiographer
• Studied Computer Science
in Delft, the Netherlands
• Specialized in Computer
Graphics & Visualization
• PhD in Medical
Visualization
• Associate Professor in the
Visualization group

The VisGroup at the University of Bergen

Introduction - The VisGroup at the UiB
Researching and teaching new solutions for the
efficient and effective visualization
of large and complex datasets
from
– measurements (e.g., from medical imaging modalities or
from seismic/sonar sensors),
– computational simulation (e.g., based on computational
fluid dynamics), or from
– analytic modeling (e.g., in the form of difference or
differential equations)
for the purpose of
– data exploration, analysis, and presentation. 4

Introduction - What is Visualization?
“Computer-based visualization systems provide visual
representations of datasets designed to help people carry
out tasks more effectively”
The purpose of computing is insight, not numbers
[R. Hamming, 1962]
The purpose of visualization is insight, not pictures
[B. Shneiderman, 1999]

Why represent all the data?
Summaries lose information, details matter
– Confirm expected and find unexpected patterns
Anscombe’s quartet, 4 datasets:
6
https://en.wikipedia.org/wiki/Anscombe%27s_quartet
Identical statistics
x mean 9
x variance 10
y mean 8
y variance 4
x/y correlation 1

Same Stats, Different Graphs
7
The Datasaurus Dozen:
https://www.autodeskresearch.com/publications/samestats
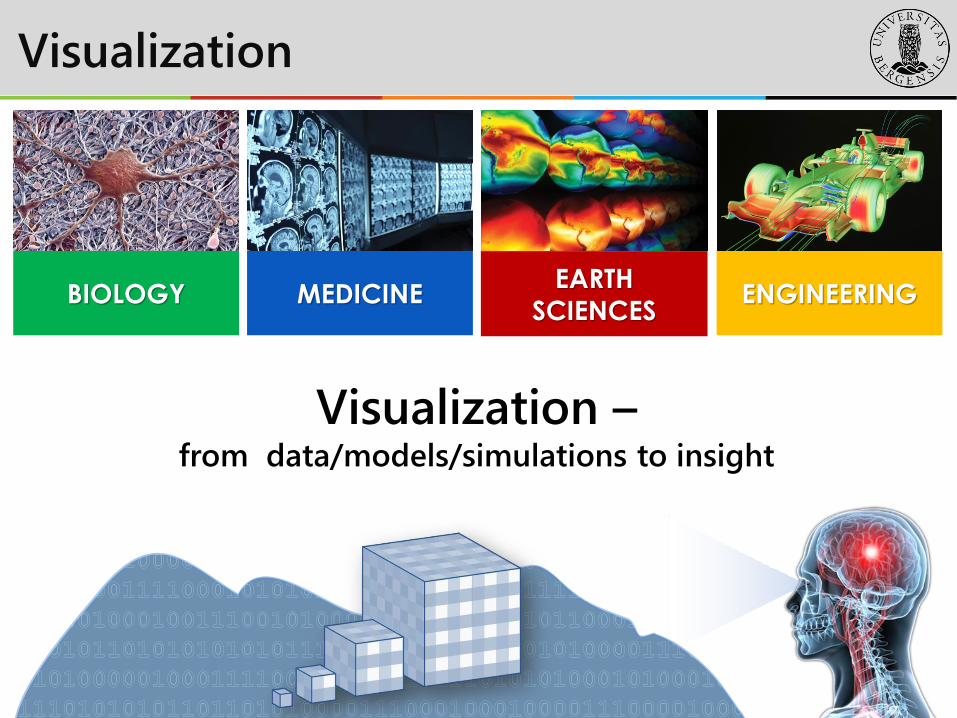
Visualization –from data/models/simulations to insight
Visualization
EARTH SCIENCES
MEDICINEBIOLOGY ENGINEERING

Visualization –from data/models/simulations to insight
Medical Visualization
EARTH SCIENCES
MEDICINEBIOLOGY ENGINEERING

P4 medicine
• Medical paradigm:
• Predictive
• Preventive
• Personalized
• Participatory
• Shift from reactive to proactive
• To make this possible: richer data acquisition
http://p4mi.org/

Medical Visualization - Goals
• Education
• Diagnosis
• Treatment planning
• Treatment guidance
• Doctor-patient communication

Biomedical data explosion
• Exponentially growing data generation
• Increased complexity of analysis
• Higher demands on visualization for decision making
https://www.nlm.nih.gov/about/2015CJ.html

P4 medicine and medical visualization
• ‘Traditional medical visualization’:
• Direct visualization of medical imaging data
• For diagnostic/treatment planning purposes
• P4: Prediction and prevention:
• More advanced techniques needed
• Beyond what is available directly from medical imaging

Model-based visualization
• When measurements are not enough, models or
simulations can add knowledge
https://en.wikipedia.org/wiki/Weather_forecasting


Collaboration
– Dept. Anatomy &
Embryology
• Prof. Dr. M.C. de Ruiter
• Drs. D. Jansma
• Dr. Annelot Kraima
– Dept. Surgery, LUMC
• Prof. Dr. C.J.H. van de Velde
– Dept. Surgery, Eindhoven
• Prof. Dr. H. Rutten
• Computer Graphics &
Visualization
• Prof. Dr. Elmar Eisemann
• Dr. Anna Vilanova
• (Dr. C.P. Botha)
• Dr. Noeska Smit

Rectal cancer
• 4.000 patients every year
• 5 years survival ~ 50%
• Golden standard: Total Mesorectal Excision (TME)
(Heald et al., Br J Surg, 1982)

Background: TME Surgery Complications
• Urinary incontinence in 34%
• Fecal incontinence in 39%
• Sexual dysfunction in 56 – 79%
(Wallner et al., J Clin Oncol, 2008; Lange et al., Eur J Ca, 2009)
Autonomic nerve damage

Invisible Nerves
(Maas et al., Lancet, 1999)

Goal: Modeling Anatomical Knowledge
• Modeling knowledge of where ‘invisible’ nerves occur
to enrich medical imaging data for surgical planning

Virtual model of human anatomy
Kraima, Anne C., Smit, Noeska N. et al. "Toward a highly‐detailed 3D pelvic model:
approaching an ultra‐specific level for surgical simulation and anatomical
education." Clinical Anatomy 26.3 (2013): 333-338.

Cryosection (Visible Korean Human female)
Resolution: 5616 x 2300 x 911
0.2 mm between every slice

Segmentation
Resolution: 5616 x 2300 x 911
0.2 mm between every slice

3D Virtual Atlas of the Pelvis
Smit, N. N. "The Virtual Surgical Pelvis: Anatomy Visualization for Education and
Surgical Planning." (2016)

Medical Education
Smit, Noeska, et al. "The online anatomical human: web-based anatomy
education." Proceedings of the 37th Annual Conference of the European Association for
Computer Graphics: Education Papers. Eurographics Association, 2016.

MOOC deployment
• Massive Open Online Course (MOOC) on human
anatomy via Coursera:
• Over 18.000 participants worldwide
• https://www.coursera.org/learn/anatomy

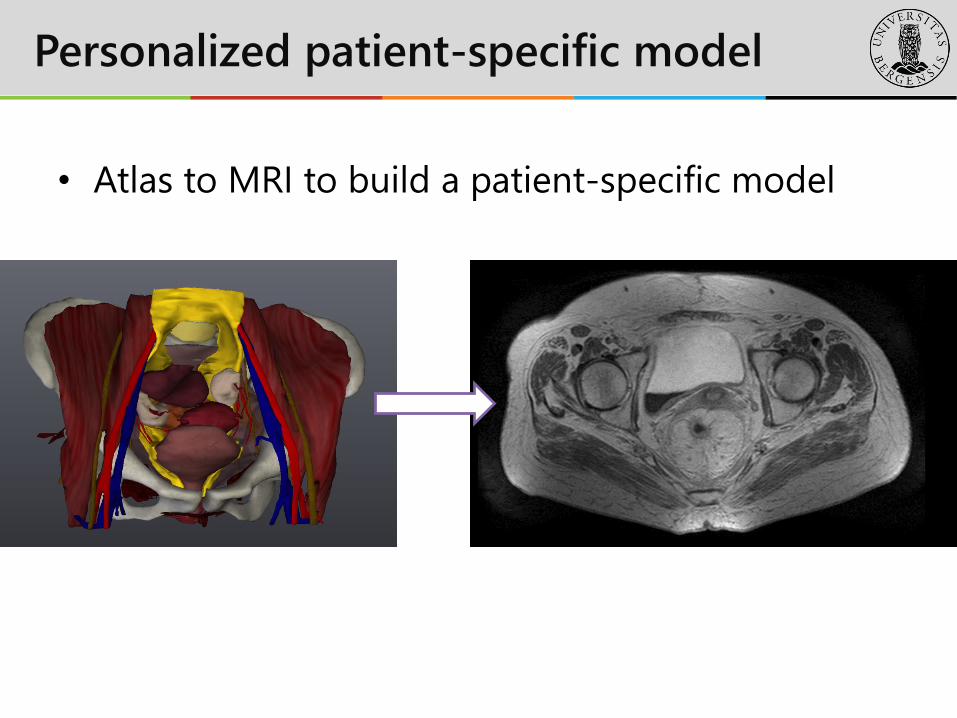
Personalized patient-specific model
• Atlas to MRI to build a patient-specific model

• Typically only 2D visualizations of the registration result
or missing required transformation tools
• Not always suitable for non-image processing experts
Registration software comparison

RegistrationShop
Open source registration framework
RegistrationShop: An Interactive 3D Medical Volume Registration System. N.N. Smit, B. Klein
Haneveld, M. Staring, E. Eisemann, C.P. Botha, A. Vilanova. Proceedings of EG VCBM 2014

Our idea
• simple interaction techniques
• + real-time 3D visual feedback
• = simplified registration process for novice users?

Interactive transformations
• Box widget for translation, scaling, rotation of volume

Landmark placement
• Corresponding landmark pairs:
– Method 1: surface picker

Landmark placement
• Corresponding landmark pairs:
– Method 1: surface picker
– Method 2: two-step picker

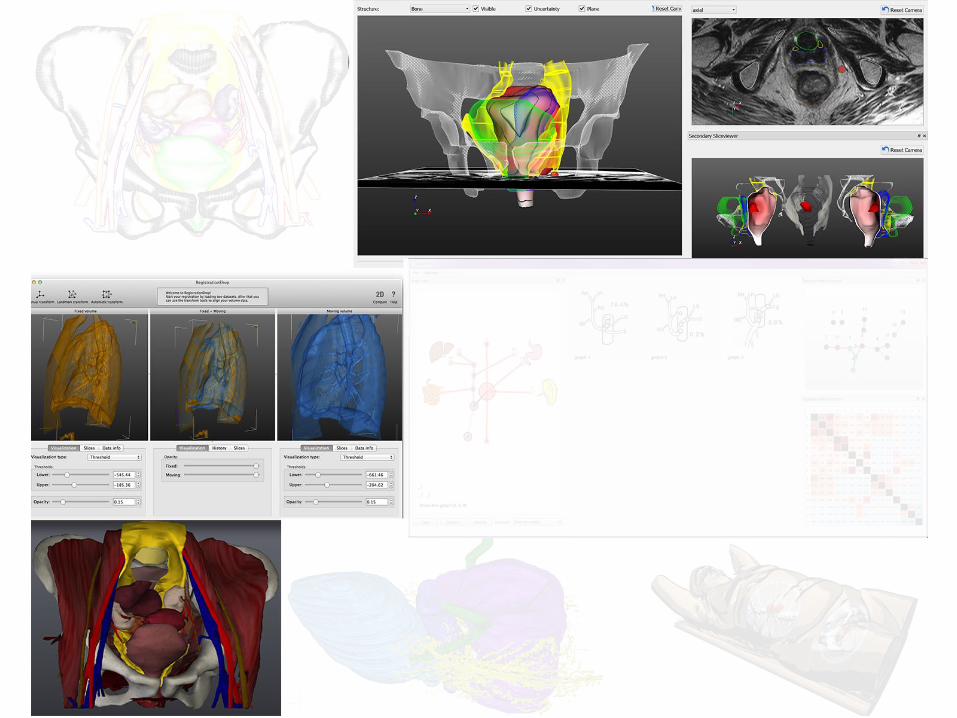
Simple visualization techniques
Direct volume rendering:
Double thresholds Maximum Intensity Projection (MIP)

Integrated comparative visualization
Real-time visual feedback on the current registration
result:
THR/THR MIP/THR MIP/MIP
Personalized patient-specific model
• Atlas to MRI to build a patient-specific model

Registering atlas to MRI
Smit, Noeska N., et al. "RegistrationShop: An Interactive 3D Medical Volume Registration
System." In Proceedings of the EuroGraphics Workshop on Visual Computing for Biology
and Medicine (VCBM). 2014.

How to register the atlas to MRI?
• Assumption: While shape of organs varies, distance
risk zones to organs is same between patients
• Approach : Segment organs in MRI and register atlas
organs to these
MRI
Atlas
Register
LabelsSegmentOrgans
LabelsSelectOrgans
LabelsSelect Riskzones
Distance field
DistanceField
Distance field
DistanceField
Deformation field
Transform

5 patients

Patient-specific 3D models

Surgically relevant information
• Tumor
• Organs:
• Mesorectum
• Vagina and uterus/prostate
• Bladder
• Pelvic bones
• Autonomic nerves
• Distances: nerves to mesorectum / tumor to mesorectum/tumor to anus
• Confidence in registration outcome?
Target
Context
Risk

How to visualize all this?
• Not like this:
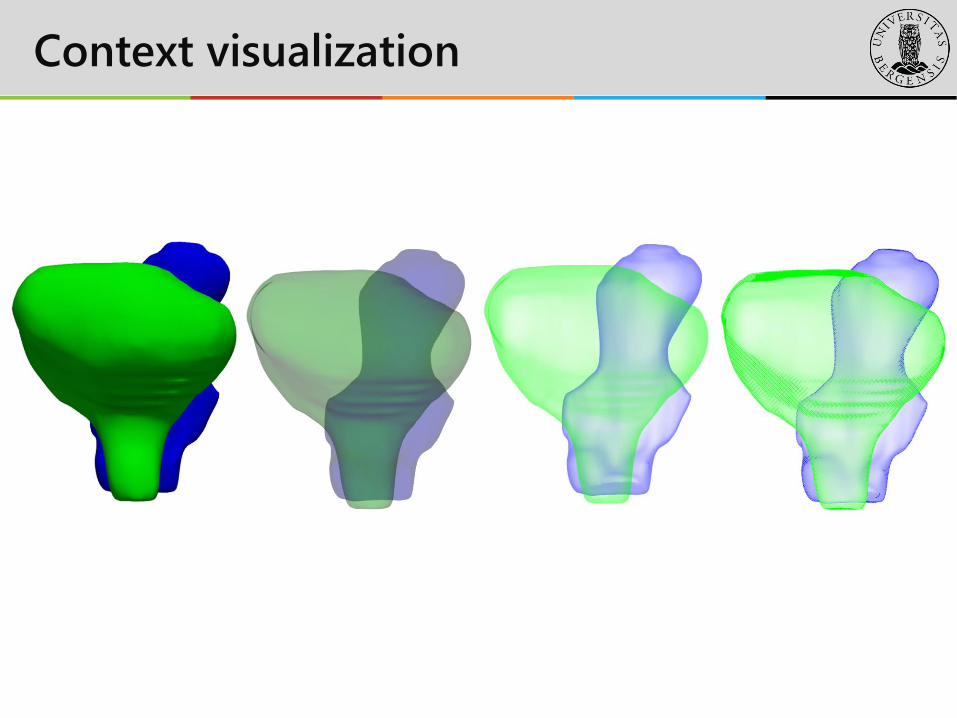
Context visualization
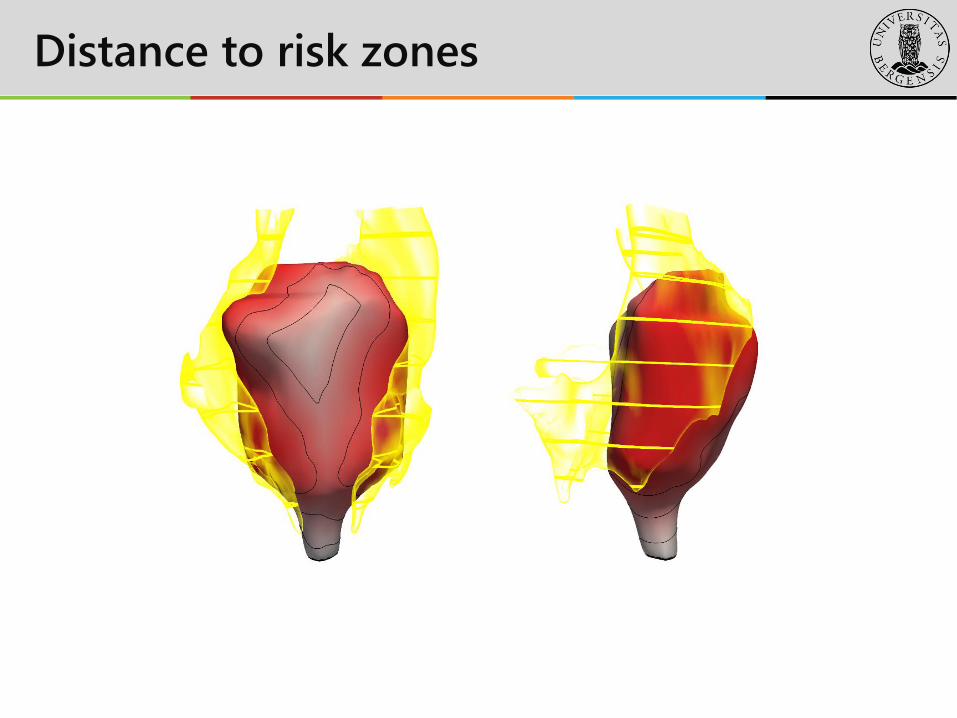
Distance to risk zones

Distance and confidence visualization

Combined context + target visualization

Distance to tumor?

What tumor?


Surgical Planning Application
Smit, Noeska, et al. "PelVis: Atlas-based surgical planning for oncological pelvic
surgery." IEEE transactions on visualization and computer graphics 23.1 (2017): 741-750.

Medical visualization
• ‘Traditional medical visualization research’:
• Direct visualization of medical imaging data
• For diagnostic/treatment planning purposes
• Prediction and prevention
• More advanced techniques needed
• Beyond what is available directly from medical imaging

Advances in data acquisitionHigh-resolution, high-throughput imaging
From static to dynamic4D real-time streamed data
From anatomy to physiologyMulti-modal, multi-scale (bio)medical data
From individuals to populationselectronic health records, cohort studies
Computational medicinePersonalized simulation models
INUMAC MRI scanner,
11.75 Tesla, spatial
resolution: 0.1mm
HDLive 4D
ultrasound [GE
HealthCare]
Personalized anatomical liver
model [Fraunhofer MEVIS]
Variation of hippocampus
shape between Alzheimer
patients and healthy
subjects [Csernansky et al.]
Current Trends and Challenges
IEEE VIS 2015 Tutorial: "Rejuvenated Medical Visualization”
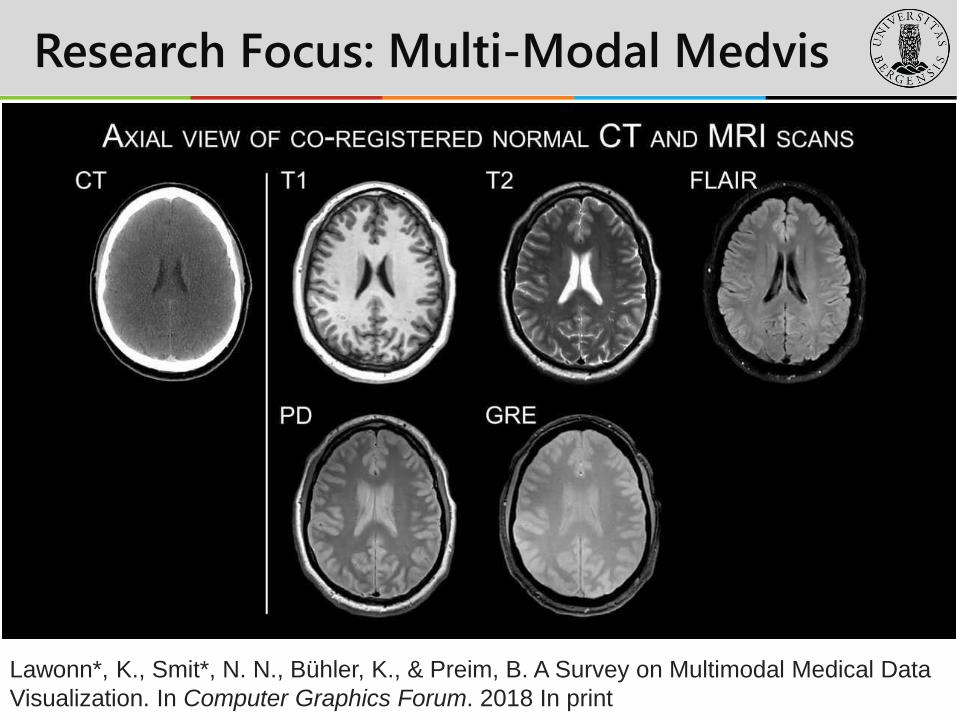
Research Focus: Multi-Modal Medvis
Lawonn*, K., Smit*, N. N., Bühler, K., & Preim, B. A Survey on Multimodal Medical Data
Visualization. In Computer Graphics Forum. 2018 In print

MMIV Centre
• Established in 2017
• Interdisciplinary
collaboration between the
University of Bergen and
the Haukeland University
Hospital

MMIV Core Projects
• Computational Medical
Imaging and Machine
Learning
• Precision Imaging in
Gynecologic Cancer
• Visual Data Science for
Imaging Biomarker Discovery
• Advanced Neuroimaging

Ongoing Research:
Interactive Time-warping

Take-aways
• Interactive visualization can provide a way to explore,
analyze, and communicate data, complementing
automatic methods
• Visualization can reveal information and patterns that
are not immediately apparent from the original data
• Medical visualization can provide assistance with
education, diagnosis, treatment planning and
guidance, and doctor-patient communication
