medicare 2000 - cms
TRANSCRIPT


Medicare 2000: 35 Years of Improving Americans’
Health and Security
Health Care Financing Administration July 2000
P A G E 1 P R O F I L E S O F M E D I C A R E B E N E F I C I A R I E S
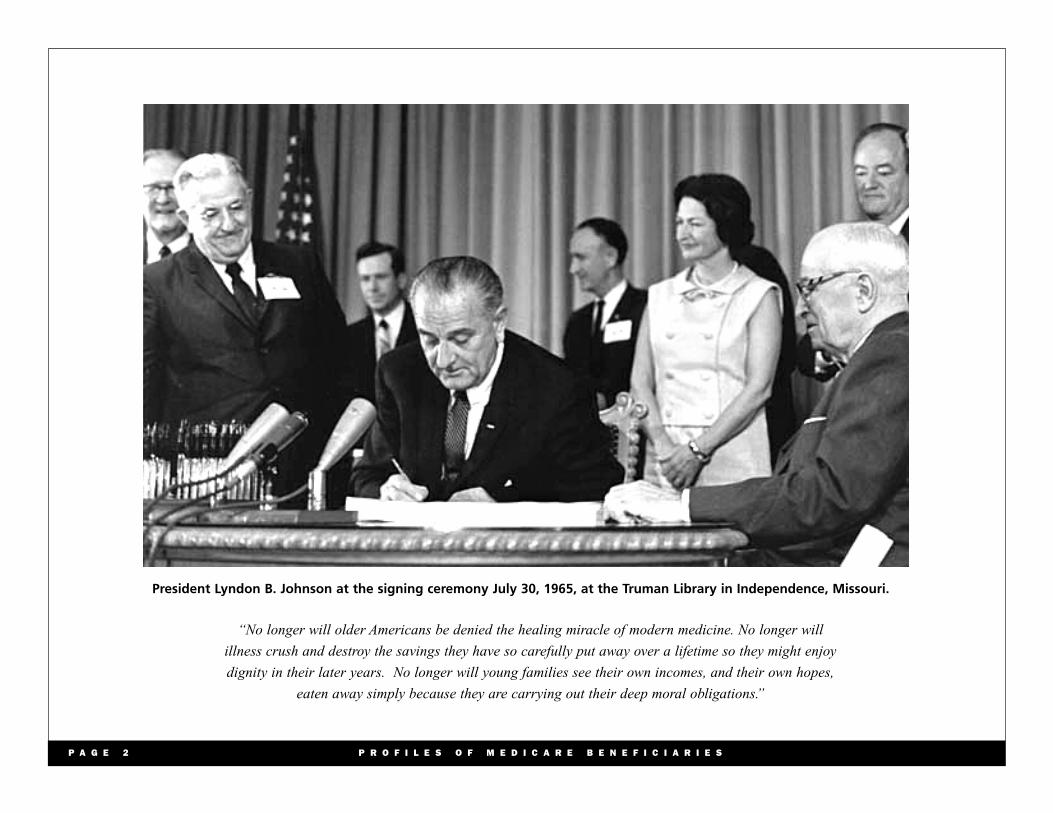
President Lyndon B. Johnson at the signing ceremony July 30, 1965, at the Truman Library in Independence, Missouri.
“No longer will older Americans be denied the healing miracle of modern medicine. No longer will
illness crush and destroy the savings they have so carefully put away over a lifetime so they might enjoy
dignity in their later years. No longer will young families see their own incomes, and their own hopes,
eaten away simply because they are carrying out their deep moral obligations.”
P A G E 2 P R O F I L E S O F M E D I C A R E B E N E F I C I A R I E S

Table of Contents
Preface
List of Figures
Executive Summary
I. A Profile of Medicare and its Beneficiaries
Demographic trends
Economic status
Health and functional status
Medicare spending
II. Improving the Lives of Seniors and the Disabled
Medicare has dramatically increased insurance coverage
Medicare has helped to increase life expectancy
Medicare has improved access to care
Medicare has improved quality of life
Medicare has saved millions from poverty
Medicare has improved access to care for minorities
Medicare has helped disabled Americans
III. Improving and Modernizing the Medicare Program
Changes in Medicare eligibility
Changes in Medicare benefits
Changes in Medicare payment policy
Changes to protect Medicare patients
Chronology of legislative activity
IV. Improving the U.S. Health Care System
Protecting the health care safety net
Training a new generation of providers
Ensuring safety and quality
Combating fraud and abuse
Running an efficient program
Serving as a prudent purchaser of services
V. Improving Medicare for the Future
Financing challenges
Coverage for prescription drugs
Improving access to preventive services
Eliminating cost-sharing on preventive services
Providing additional revenue
Creating insurance options for early retirees
Appendix: Overview of Medicare benefits, cost-sharing,
and program structure
Glossary
Sources
P A G E 3 P R O F I L E S O F M E D I C A R E B E N E F I C I A R I E S
Preface
Medicare,s enactment on July 30, 1965, followed several
decades of debate over ways to meet the health care needs of
vulnerable Americans. In 1952, President Harry S. Truman
became the first President to ask Congress to enact a program to
insure elderly Americans against the cost of medical care. The
Medicare banner was taken up again by President John F.
Kennedy in 1963 but did not pass the Congress until 1965, two
years after Kennedy s death, under the leadership of President
Lyndon B. Johnson. Recognizing the enormous role that
President Truman had played in placing the Medicare idea on the
national agenda, President Johnson traveled to Independence,
Missouri, to sign the Medicare bill into law and present the first
two Medicare cards to former President and Mrs. Truman.
“Medical care will free millions from their miseries. It will signal a deep and lasting change in the American way of life. It will take its place beside Social Security, and together they will form the twin pillars of protection upon which all our people can safely build their lives and their hopes.”
— President Lyndon Baines Johnson in June 1966, just before implementation of the Medicare program, speaking to the National Council of Senior Citizens
Without question, Medicare has altered the lives of seniors and
Americans living with disabilities. In the words of a Medicare
beneficiary:
Well, I think it’s one of the greatest things we have. You know, used to be we didn’t have things like that to help pay bills years ago.
During the past 35 years, Medicare has provided health care
coverage to more than 93 million elderly and persons with
disabilities, assuring them access to high-quality medical care and
protecting their often-meager income and savings from the
frequently devastating cost of illness. Today, more than 39 million
men and women are enrolled in Medicare and that number is
projected to nearly double to 77 million by 2030. In its 35-year
history, Medicare has made important improvements in the health
status of elderly and disabled beneficiaries whose health needs are
greater than those of the general population. And, because of its
significant role in the U.S. health care system, Medicare has made
major contributions to the improvement of that system.
In commemorating Medicare,s 35th anniversary, this report
examines the role that Medicare has played in improving the
health and well-being of America,s senior citizens and those living
with disabilities. It looks at the impact Medicare has had on the
U.S. health care system and the changes that have been made to
the program to improve benefits, eligibility, and finances. Finally,
the report examines the challenges Medicare faces in meeting the
needs of future beneficiaries. It is my hope that, as we debate the
future of the Medicare program, we pause to reflect upon the 35
years that Medicare has provided health security to our nation s
seniors and disabled.
Nancy-Ann Min DeParle
P A G E 4 P R O F I L E S O F M E D I C A R E B E N E F I C I A R I E S

List of Figures
Figure 1. Number of Medicare beneficiaries, calendar years 1970-2030
Figure 2. The aging of the U.S. population, 1970-2030Figure 3. Race/ethnicity distribution of Medicare
beneficiaries, 1998Figure 4. Poverty rates by age, 1965-1998Figure 5. Medicare spending for fee-for-service beneficiaries by
income, 1997Figure 6. Living arrangements of Medicare beneficiaries, 1998 Figure 7. Distribution of Medicare enrollees by functional
status, 1998Figure 8. Medicare spending, fiscal years 1967-1999Figure 9. Where the Medicare dollar went, 1980 and 1998Figure 10. Sources of payment for Medicare beneficaries’ use of
medical services, 1997 Figure 11. Type of supplemental health insurance held by
Medicare beneficiaries, 1998Figure 12. Distribution of beneficiary out-of-pocket
expenses, 1997Figure 13. Elderly health spending as a percentage of
income, 1998Figure 14. Percent of Medicare population with access to at
least one Medicare Risk/M + C plan, 1993-2000Figure 15. HMO enrollment growth, Medicare and non-Medicare,
1990-1999
Figure 16. Beneficiary attitudes towards HMOs and fee-for-service, 1998
Figure 17. Rate of growth in per enrollee Medicare and private health insurance benefits spending, 1970-1998
Figure 18. Average growth in per enrollee Medicare and private health insurance spending, selected periods
Figure 19. Life expectancy at birth and average remaining years of life at age 65, 1950-2030
Figure 20. National personal health expenditures by type of service and percent Medicare paid, 1998
Figure 21. National personal health expenditures by type of service and percent Medicare paid, 1970
Figure 22. Medicare administrative expenses as a percent of benefit payments, fiscal years 1970-1999
Figure 23. Medicare Part A cost per claim and number of claims,fiscal years 1988-1999
Figure 24. Electronic claims, calendar years 1990-1999Figure 25. Female Medicare beneficiaries who report receiving
mammograms and pap smears, 1992-1998 Figure 26. Medicare beneficiaries who report receiving a
preventive service: flu and pneumonia vaccinations,1991-1998
Figure 27. Female Medicare beneficiaries by race who report receiving mammograms, by race, 1992-1998
Figure 28. Medicare beneficiaries who report receiving flu shots, by race, 1991-1998
P A G E 5 P R O F I L E S O F M E D I C A R E B E N E F I C I A R I E S

Executive Summary
One of the crowning accomplishments of the Great Society
programs of President Lyndon Baines Johnson was the 1965
enactment of the Medicare program, providing health insurance
to Americans over the age of 65 and, eventually, to Americans
living with disabilities. As he signed the Medicare program into
law, President Johnson said:
“No longer will older Americans be denied the healing
miracle of modern medicine. No longer will illness crush
and destroy the savings they have so carefully put away
over a lifetime so they might enjoy dignity in their later
years. No longer will young families see their own
incomes, and their own hopes, eaten away simply because
they are carrying out their deep moral obligations to their
parents, and to their uncles, and to their aunts . . . No
longer will this nation refuse the hand of justice to those
who have given a lifetime of service and wisdom and
labor to the progress of this progressive country.”
In the 35 years since President Johnson spoke, Medicare has
provided access to affordable high-quality health care to more
than 93 million elderly and disabled Americans. Today, Medicare
serves more than 39 million beneficiaries, or 1 in 7 Americans. In
30 years, the number of Americans covered by Medicare will
nearly double to 77 million, or 22 percent of the U.S. population.
Beneficiaries born in 1900, who enrolled in Medicare in its first
year, 1966, are celebrating their 100th birthday this year. There are
families with two generations, parent and child, both of whom are
enrolled in Medicare today; some families have three generations
enrolled in Medicare.
Medicare,s importance to Americans will grow. Today, the Census
Bureau estimates that there are about 70,000 Americans age 100 or
older, virtually all of whom are enrolled in Medicare. Over the next
30 years, improved access to health care and continuing scientific
breakthroughs are expected to result in more than 300,000
Americans living until the age of 100 or longer (Census Bureau,
1999).
P A G E 6 P R O F I L E S O F M E D I C A R E B E N E F I C I A R I E S

I. A Profile of Medicare and its Beneficiaries II. Improving the Lives of Seniors and the Disabled
In 2000, Medicare serves 39 million elderly and disabled
Americans. Because of longer life expectancy and other factors,
57 percent of elderly Medicare beneficiaries are women. Among the
disabled, however, men are 59 percent of the beneficiaries. The
majority of elderly Medicare beneficiaries are white (84 percent),
7 percent are African-American, 6 percent are Hispanic, and
3 percent are members of other racial or ethnic minority groups.
Minorities are a larger share of the disabled beneficiary population.
• Economic Status. Most Medicare beneficiaries have relatively
modest incomes, and Social Security benefits often constitute a
significant portion of that income. The reliance on Social Security
is considerably greater for single seniors living alone.
• Health and Functional Status. Nearly 30 percent of
beneficiaries report that they are in fair or poor health compared
with 17 percent of Americans age 45 to 64. Health status is poorer
among those over age 85 and members of minority groups. Nearly
one in three seniors reports limitations in one or more activities of
daily living (e.g., eating, bathing, and going to the bathroom).
• Health Spending. In fiscal year 1999, Medicare spent an average
of $5,410 per beneficiary, significantly more than is spent by those
under 65. Medicare spending is concentrated on a small group of
beneficiaries: more than 75 percent of Medicare spending is spent on
the 15 percent of beneficiaries who incur costs of more than $10,000.
President Johnson,s predictions about the impact of Medicare on
America s seniors and society as a whole have proven to be
remarkably accurate. Medicare provides a crucial role in:
• Guaranteeing insurance coverage. Medicare has made a
dramatic difference in the number of seniors who are insured
against health care costs. In 1964, nearly half of all seniors were
uninsured, making the elderly among the least likely Americans
to have health insurance. Today, with 97 percent of seniors
covered by Medicare, the elderly are the most likely to have
insurance.
• Lengthening life expectancy. The average life expectancy of
elderly Americans has increased, in part, because of Medicare. A
65-year-old woman on Medicare today will live 20 percent
longer than her counterpart in 1960.
• Providing access to care. Medicare had an immediate and
substantial impact on seniors access to high-quality medical
care. In 1964, hospital discharges averaged 194 per 1,000 elderly
Americans. By 1973, that number had jumped to 350 per 1,000.
• Improving quality of life. More important than simply adding
more years to a senior citizen s life, Medicare has helped to
improve the quality of those years. By providing access to medical
procedures such as cataract surgery, hip replacement, cardiac
bypass, and organ transplants, Medicare has enabled millions of
seniors to remain healthier longer, and to participate more fully in
the lives of their families and their communities. For example, the
number of beneficiaries undergoing knee replacement surgery
P A G E 7 P R O F I L E S O F M E D I C A R E B E N E F I C I A R I E S
more than doubled, from 2.0 per 1,000 beneficiaries to 5.2 per
1,000, from 1986 to 1998. The number of beneficiaries undergoing
angioplasty to clear blockage in their arteries and prevent a heart
attack rose more than 600 percent, from 1.3 per 1,000 to 8.4 per
1,000, in the same period. Access to these and other services helped
to reduce mortality rates and improve seniors ability to function.
• Protecting seniors’ financial health. Medicare keeps millions of
seniors from becoming impoverished as a result of illness or
disability. Before Medicare, senior citizens were disproportionately
poor compared with the rest of the population. In 1959, for
example, 35.2 percent of Americans over 65 were living below the
poverty line, compared with 17 percent of those under 65. Today,
about 10 percent of seniors are living in poverty. Before Medicare
was enacted, the elderly paid 53 percent of the cost of their health
care. That share dropped to 29 percent in 1975 and to 18 percent in
1997. The elderly s health costs consumed 24 percent of the average
Social Security check shortly before Medicare; by 1975, that share
dropped to 17 percent (Gornick, 1976).
• Helping minority seniors. One in seven Medicare beneficiaries is a
member of a racial or ethnic minority. Prior to Medicare s enactment,
many U.S. hospitals discriminated against African Americans and
other racial and ethnic minorities. Most minority Americans were
denied access to these facilities and had to rely on separate and often
inferior hospitals and clinics to receive care. By requiring hospitals
accepting Medicare funding to be integrated for all patients, Medicare
played a powerful, but often overlooked, role in expanding access to
high-quality care for minority seniors, and for all Americans who are
members of minority groups. In 1963, minorities 75 years and older
averaged 4.8 visits to the doctor; by 1971 their visits grew to 7.3,
comparable to Caucasian utilization rates (NCHS, 1964 and 1971).
• Improving access to health care for the disabled. In 1972,
Medicare expanded to include Americans living with disabilities
and those with end-stage renal disease (ESRD). Today, more than
five million people with disabilities are enrolled in Medicare. Since
1973, more than one million Americans have received life-saving
renal replacement therapy, either dialysis or transplantation.
Currently 350,000 Americans are alive on renal replacement therapy,
and 90,000 of these persons have a better quality of life due to a
successful kidney transplant (including some 20,000 whose medical
condition improved so much that they left the Medicare program).
III. Improving and Modernizing the Medicare Program
When Congress created Medicare in 1965, it deliberately modeled
the new program after the existing private health insurance market,
allowing for a remarkably quick and efficient implementation of
the program just 11 months later. Medicare s benefit package,
administration, and payment methods were modeled on the Blue
Cross and Blue Shield plans then prevalent in the private market.
Private insurance companies were hired to administer much of the
program as contractors.
A health insurance program designed to meet the needs of seniors
in 1965 needs regular updating to keep pace with and set the pace
for change in the private market. Since 1965, Congress and the
President have made numerous changes to Medicare to continue to
modernize the program. For example:
• Eligibility. The original Medicare program only covered those
Americans age 65 and older. Recognizing the significant health
P A G E 8 P R O F I L E S O F M E D I C A R E B E N E F I C I A R I E S
care needs, and the lack of access to private insurance of other
groups of Americans, Congress expanded eligibility (in 1972) to
include Americans with disabilities and those with end-stage
renal disease.
• Benefits. Medicare s original benefit package was consistent
with medical practices in 1965 with a strong emphasis on
inpatient hospital care. Since then, Congress has expanded
Medicare several times to include coverage of hospice care and
preventive benefits. For example, in 1997, Congress expanded
Medicare to include coverage of certain preventive benefits
including prostate cancer screening, bone mass density
measurement, diabetes self-management, and other services.
• Payment reforms. Medicare,s original payment mechanisms
based on actual costs proved to be highly inflationary because
providers were paid for their costs, regardless of their efficiency.
Medicare has initiated a series of payment reforms for hospitals,
physicians, home health agencies, nursing homes, and HMOs.
Many of these innovations have been replicated by the private
insurance market to help rein in health costs, making Medicare a
widely recognized leader in developing payment systems.
• Patient protections. Medicare is a leader in protecting the
health, safety and financial security of its beneficiaries. Medicare
established strong federal standards for the quality of all hospital,
nursing home, and home health care. It has set standards for the
sale of private supplemental medical insurance also known as
Medigap insurance. Medicare has some of the strongest patient
protections for beneficiaries enrolled in HMOs and other
managed care plans.
IV. Improving the Health Care System
In addition to the improvements Medicare has produced for
America s senior citizens and people with disabilities, the program
has made a significant contribution to the quality and stability of
the American health care system. By providing a stable source of
payment for a large segment of the population that has substantial
health care needs, Medicare has made a major contribution to the
recognized quality of the American health care system, including:
• Ensuring a revenue base. Medicare finances a growing share
of the nation s health system up from 11 percent in 1970 to
21 percent today. Medicare provides 32 percent of all hospital
revenue in the United States and 22 percent of all spending on
physicians services. The program pays a substantial portion of
the revenues of home health agencies, hospices, renal dialysis
facilities, and other services.
• Protecting the “safety net.” Medicare provides special financial
support to urban and rural health care providers (such as $4.6
billion on disproportionate share payments in fiscal year 2000),
enabling them to provide free or discounted care to millions of
uninsured and underinsured Americans while also serving the
needs of Medicare beneficiaries.
• Training for the future. Medicare plays an important societal
role in financing graduate medical education by paying nearly $8
billion a year for the costs of training physicians and other health
professionals at our nation s academic medical centers.
• Combating fraud and abuse. Medicare is a leader in developing
systems to detect and prevent fraud and abuse, including Operation
P A G E 9 P R O F I L E S O F M E D I C A R E B E N E F I C I A R I E S

Restore Trust. Last year, the federal government recovered nearly
$500 million as a result of health care prosecutions. Since 1996,
aggressive enforcement has recovered nearly $1.9 billion.
• Innovative payment systems. By adopting innovative payment
mechanisms such as diagnosis-related groups (DRGs) for hospital
payments and resource-based relative value scale (RBRVS)
payments to physicians, Medicare has paved the way for
significant cost savings and efficiencies in Medicare and in the
health care system as a whole. In recent years, Medicare
developed new and innovative payment systems for home health
services, skilled nursing care, and other outpatient services.
Medicare is also a leader in risk-adjustor research for managed
care plans.
• Reducing administrative costs. Medicare is the single largest
health insurer in the United States, yet it operates at the lowest
administrative costs of any insurer. Medicare s overhead costs
are less than 2 percent, far below the private insurance industry
average of 12 percent. In other words, Medicare spends more
than 98 cents out of every dollar it receives in tax and premium
revenue on health care services for patients. Over the last
decade, Medicare Part A claims have doubled and the cost for
processing each claim has been cut in half. These administrative
savings have been achieved in part by Medicare s leadership in
working with health care providers and others to computerize
claims payment, which has paved the way for other payers to
also computerize their claims payment.
V. Improving Medicare for the Future
In its first 35 years, Medicare has accomplished a tremendous
amount for America s seniors and those with disabilities. In
concert with Social Security, Medicare has made a huge difference
in the lives of the people of this country. As President Johnson
predicted, Medicare has positively affected the lives of not only
those it directly serves but millions of other Americans who are
the sons and daughters, grandsons and granddaughters, and even
the great-grandsons and great-granddaughters of Medicare,s
beneficiaries.
But Medicare and the people it serves cannot continue to
thrive if today s program remains stagnant. Medicare must be
continually modernized to meet the needs of our seniors and
those with disabilities. Medicare s benefit package is now out of
sync with what is covered by today s private insurance market.
In particular, the failure to pay for prescription drugs is a
departure from the norms of medicine and private insurance. And
while Medicare has provided peace of mind to those who are
over age 65 or living with disabilities, millions of Americans with
significant health care needs especially early retirees remain
unable to buy affordable insurance.
Though Medicare coverage of preventive services has improved,
it lags behind private insurance. In addition, the utilization of
preventive services by Medicare beneficiaries remains low,
especially among low-income and minority populations. This
indicates a need to examine and eliminate any impediments to the
use of these important services, including cost-sharing
requirements, lack of public awareness, and the need for greater
provider education and outreach.
P A G E 1 0 P R O F I L E S O F M E D I C A R E B E N E F I C I A R I E S
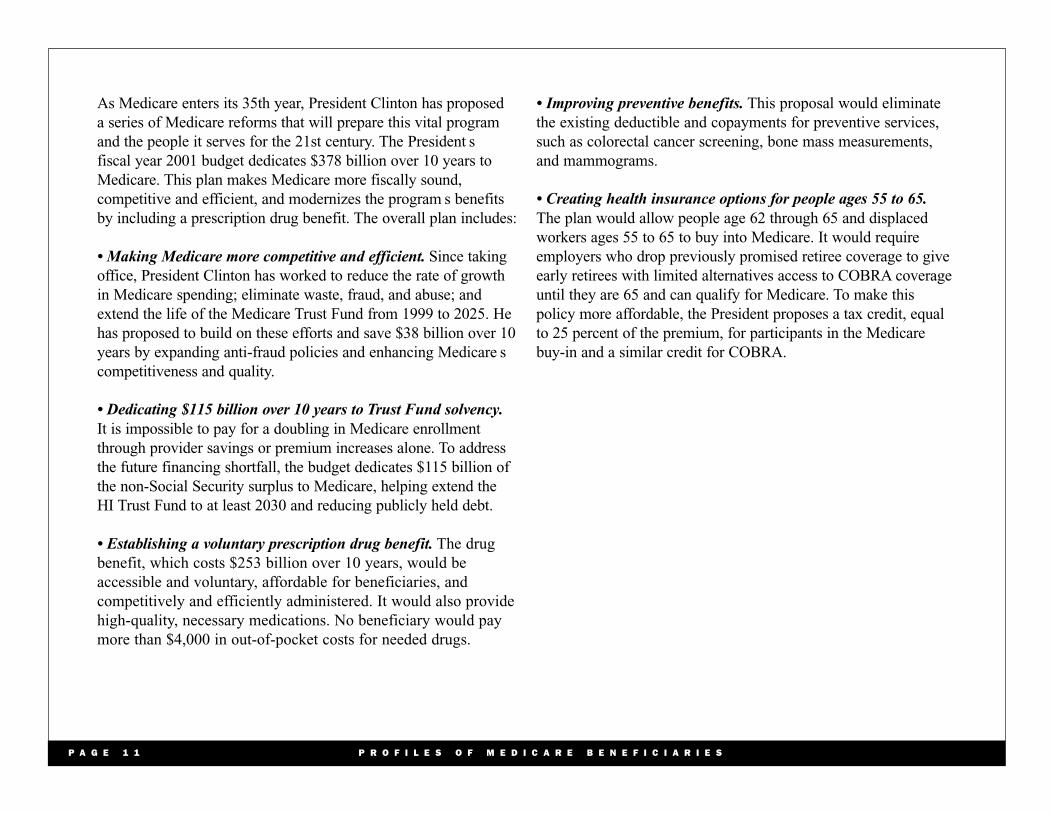
As Medicare enters its 35th year, President Clinton has proposed
a series of Medicare reforms that will prepare this vital program
and the people it serves for the 21st century. The President s
fiscal year 2001 budget dedicates $378 billion over 10 years to
Medicare. This plan makes Medicare more fiscally sound,
competitive and efficient, and modernizes the program s benefits
by including a prescription drug benefit. The overall plan includes:
• Making Medicare more competitive and efficient. Since taking
office, President Clinton has worked to reduce the rate of growth
in Medicare spending; eliminate waste, fraud, and abuse; and
extend the life of the Medicare Trust Fund from 1999 to 2025. He
has proposed to build on these efforts and save $38 billion over 10
years by expanding anti-fraud policies and enhancing Medicare s
competitiveness and quality.
• Dedicating $115 billion over 10 years to Trust Fund solvency. It is impossible to pay for a doubling in Medicare enrollment
through provider savings or premium increases alone. To address
the future financing shortfall, the budget dedicates $115 billion of
the non-Social Security surplus to Medicare, helping extend the
HI Trust Fund to at least 2030 and reducing publicly held debt.
• Establishing a voluntary prescription drug benefit. The drug
benefit, which costs $253 billion over 10 years, would be
accessible and voluntary, affordable for beneficiaries, and
competitively and efficiently administered. It would also provide
high-quality, necessary medications. No beneficiary would pay
more than $4,000 in out-of-pocket costs for needed drugs.
• Improving preventive benefits. This proposal would eliminate
the existing deductible and copayments for preventive services,
such as colorectal cancer screening, bone mass measurements,
and mammograms.
• Creating health insurance options for people ages 55 to 65. The plan would allow people age 62 through 65 and displaced
workers ages 55 to 65 to buy into Medicare. It would require
employers who drop previously promised retiree coverage to give
early retirees with limited alternatives access to COBRA coverage
until they are 65 and can qualify for Medicare. To make this
policy more affordable, the President proposes a tax credit, equal
to 25 percent of the premium, for participants in the Medicare
buy-in and a similar credit for COBRA.
P A G E 1 1 P R O F I L E S O F M E D I C A R E B E N E F I C I A R I E S

I. A Profile of Medicare and Its Beneficiaries
Today, the Medicare program provides health insurance coverage
to a diverse and growing segment of the United States
population [Figure 1]. Over its history, the people who are
covered under the program have not only expanded in numbers,
but have grown more complex in composition and health care
needs. More than 19 million elderly entered Medicare in 1966;
today, Medicare provides insurance coverage for 34 million
elderly, or 97 percent of older Americans. The number of elderly
and disabled enrollees has more than doubled to 39.9 million.
The Medicare population is expected to grow from 39.9 million
enrollees (14 percent of the population) today to more than 77
million in 2030 (22 percent of the population). [Figures 1 and 2].
Demographic Trends
Because of their longer life expectancy, elderly women
outnumber men in the Medicare program by 7 percent. The
proportion of female Medicare beneficiaries increases with age:
women constitute more than 70 percent of the Medicare
population age 85 and older (Medicare Current Beneficiary
Survey). Among disabled beneficiaries, however, men outnumber
women by 9 percent.
Older women are much more likely to be widowed and live
alone than older men due to a number of factors, including
women s longer life expectancy, the tendency for women to
marry men who are slightly older, and higher remarriage rates
for widowed men. Among people age 85 and older, about half
of the men were still married, compared with only 13 percent
of the women (Forum, 2000).
Among the elderly, 84 percent are Caucasian, 7 percent are African-
Americans, 6 percent are Hispanic, and 3 percent make up all other
racial and ethnic minority enrollees. Among disabled enrollees,
African-Americans make up nearly 17 percent and Hispanics about
11 percent [Figure 3].
The living arrangements of the elderly vary by racial and ethnic
group. Older Caucasian women are much less likely to live with
other relatives than older minority women (15 percent compared to
30-40 percent) (Forum, 2000). Living alone is a risk factor for
nursing home placement as the elderly grow older.
More than 13 percent, or 4.5 million Medicare beneficiaries, are over
the age of 85, and more than 70,000 are over the age of 100.
Economic Status
Although the economic status of the elderly as a group has
improved over the past 35 years [Figure 4], most elderly
individuals have modest incomes. Correspondingly, most
Medicare spending is for beneficiaries with modest incomes:
33 percent of program spending is on behalf of those with
incomes of less than $10,000; 74 percent of program spending
is on behalf of those with incomes of $25,000 or less; but only
10 percent of program spending is on behalf of those with
incomes over $40,000 [Figure 5].
Many elderly Medicare beneficiaries depend on their Social Security
benefits for much of their income. The reliance on Social Security
income is greater among single seniors and increases dramatically as
individuals get older. For example, Social Security benefits
represent half of the average 85-year-old s income. In 1998, Social
P A G E 1 2 P R O F I L E S O F M E D I C A R E B E N E F I C I A R I E S

Security benefits provided about two-fifths of the income of older
persons (Forum, 2000).
Nearly 30 percent of Medicare beneficiaries live alone, and
beneficiaries who live alone are disproportionately female and
poor: 72 percent are women, and 60 percent have incomes under
$15,000. About 15 percent of those who live alone are over the
age of 85 [Figure 6].
Because of their low incomes and high medical costs,
approximately 6.5 million beneficiaries or about 16.5 percent
of the Medicare population are enrolled in both Medicare and
Medicaid. Dual-eligible beneficiaries are Medicare beneficiaries
who also qualify for Medicaid benefits on the basis of financial
need, including those that become eligible as they spend down
their income because of high medical costs.
Health and Functional Status
In 1999, nearly 30 percent of the elderly reported that they were in
fair or poor health, compared to 17 percent of those ages 45 to 64.
The percentage reporting fair or poor health was higher for
minority groups and increased with age: about 35 percent of those
85 and older considered themselves in relatively poor health
(Health, US, 1999).
Differences in self-reported health status are reflected in Medicare ,,per capita spending. Beneficiaries who reported their health status
as poor spent five times as much as the beneficiaries reporting
excellent health. Medicare per capita spending also increases as
functional status declines. Twice as much is spent on those with
one or two limitations in activities of daily living (ADL),
including bathing, dressing, going to the bathroom, or eating,
compared to those with no ADL limitations. Beneficiaries with
three or more ADL limitations had per capita costs more than three
times as high as those with no difficulties with ADLs.
Among the elderly, the incidence of chronic conditions, defined
as prolonged illnesses that are rarely cured completely, varies
significantly by age and racial group. For instance, about one in
every 10 elderly Americans has diabetes. Both the incidence of
diabetes and the mortality rates from it are higher for minority
groups (Health, US, 1999).
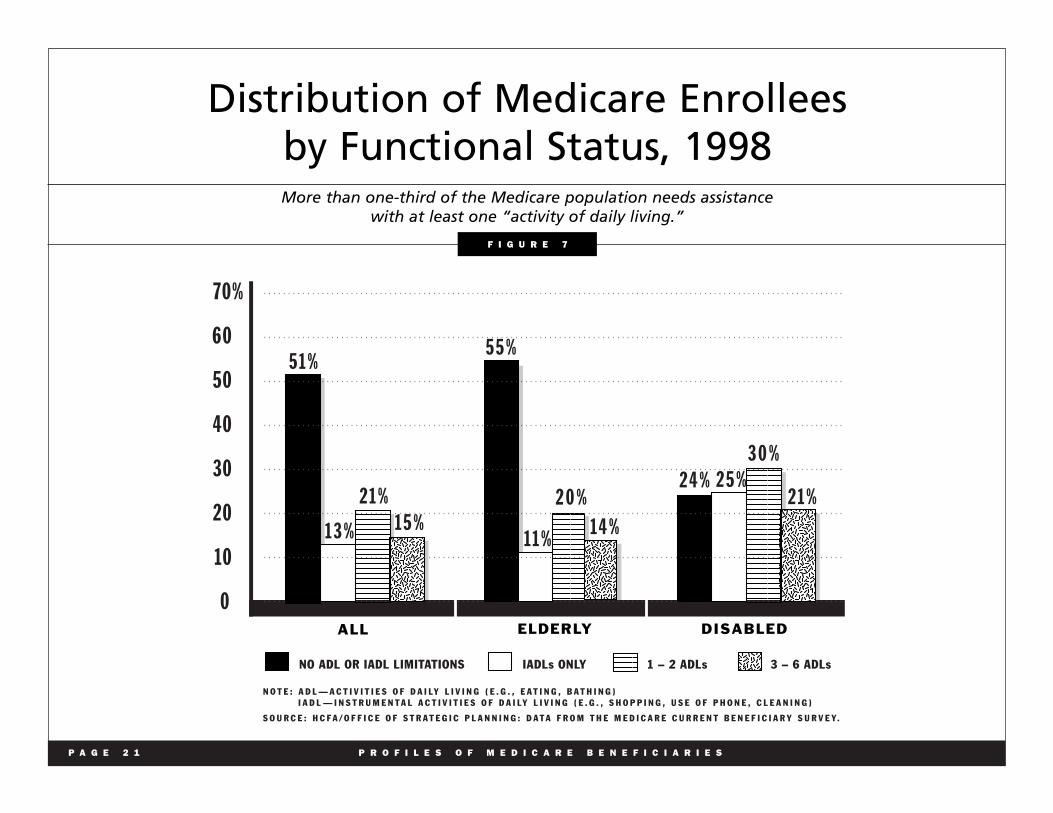
Nearly one in three of the elderly reported limitations with one or
more activities of daily living (ADLs). About 11 percent of the
elderly reported limitations in instrumental activities of daily living
(IADLs). About 30 percent of the disabled Medicare beneficiaries
had difficulties with one or more ADLs. The contrast in functional
status was more marked in the realm of IADL limitations, with
25 percent of disabled beneficiaries reporting trouble with IADLs, a
rate more than twice as high as that of elderly beneficiaries
[Figure 7].
Medicare Spending
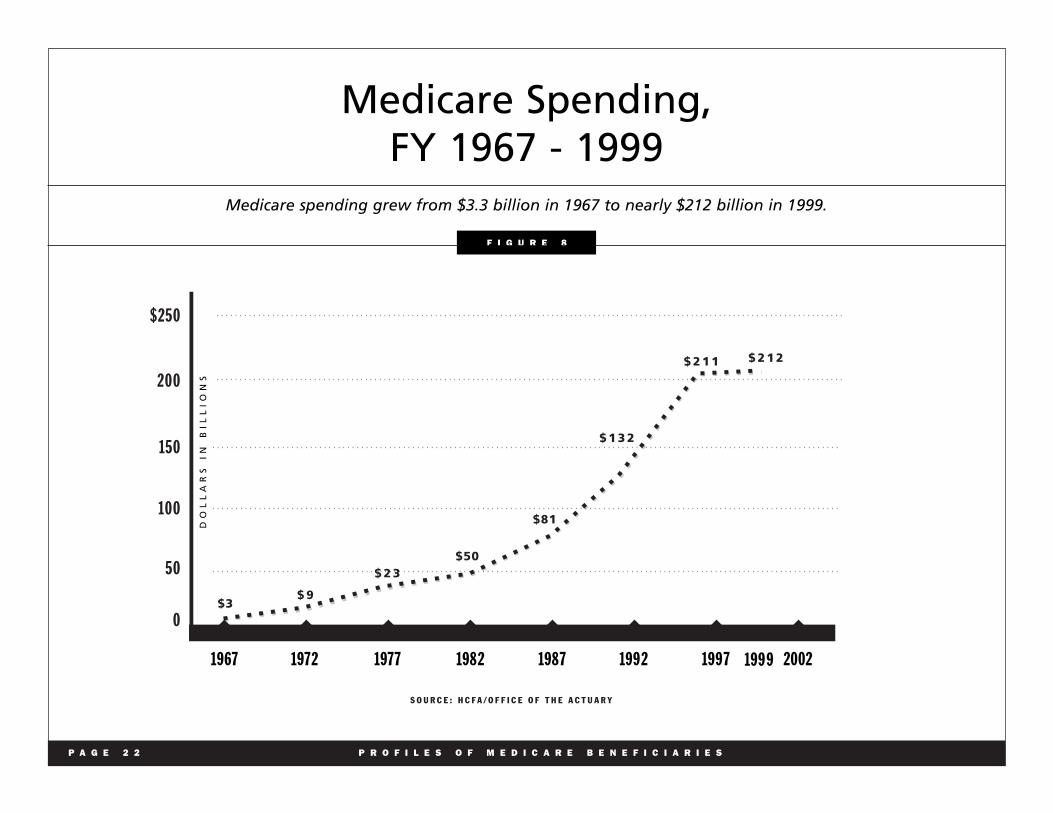
Medicare benefit spending for fiscal year 1999 is estimated at
nearly $212 billion [Fig. 8]. The largest shares of spending are for
inpatient hospital services (48 percent) and physician services
(27 percent) [Fig. 9].
In fiscal year 1999, Medicare spent an average of $5,410 per
beneficiary. The amount varied on the basis of eligibility and
masked considerable variation across individuals.
P A G E 1 3 P R O F I L E S O F M E D I C A R E B E N E F I C I A R I E S
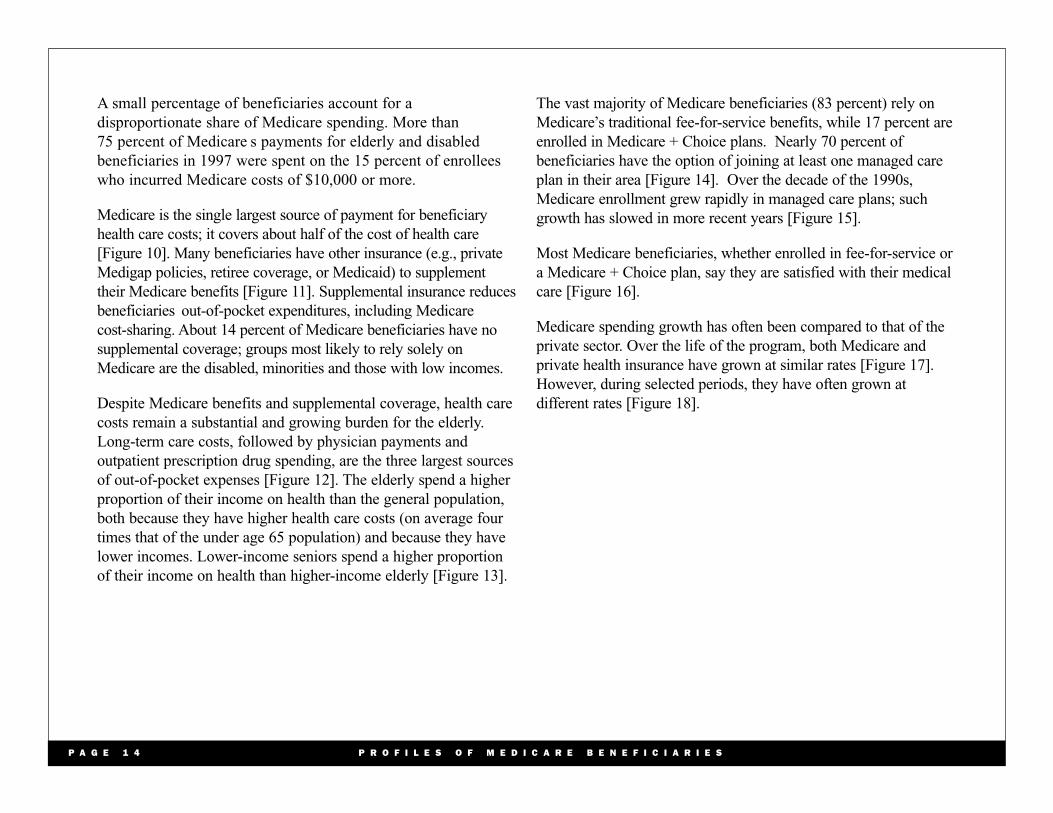
A small percentage of beneficiaries account for a
disproportionate share of Medicare spending. More than
75 percent of Medicare s payments for elderly and disabled
beneficiaries in 1997 were spent on the 15 percent of enrollees
who incurred Medicare costs of $10,000 or more.
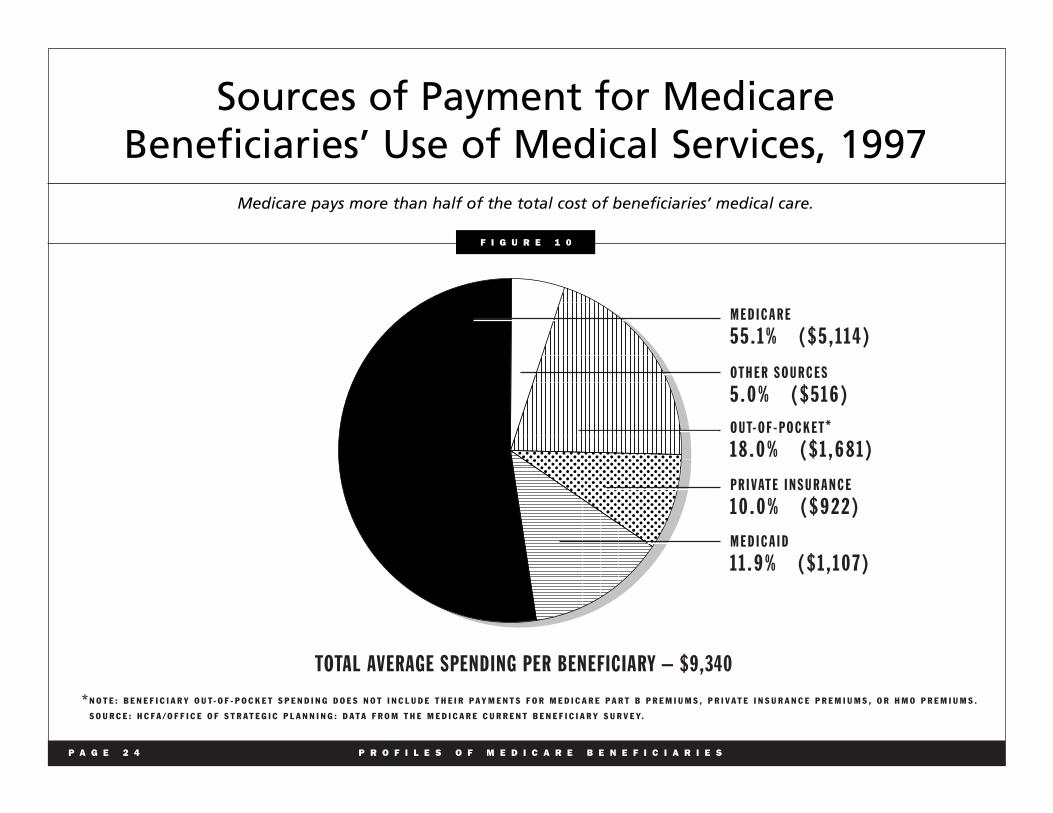
Medicare is the single largest source of payment for beneficiary
health care costs; it covers about half of the cost of health care
[Figure 10]. Many beneficiaries have other insurance (e.g., private
Medigap policies, retiree coverage, or Medicaid) to supplement
their Medicare benefits [Figure 11]. Supplemental insurance reduces
beneficiaries out-of-pocket expenditures, including Medicare
cost-sharing. About 14 percent of Medicare beneficiaries have no
supplemental coverage; groups most likely to rely solely on
Medicare are the disabled, minorities and those with low incomes.
Despite Medicare benefits and supplemental coverage, health care
costs remain a substantial and growing burden for the elderly.
Long-term care costs, followed by physician payments and
outpatient prescription drug spending, are the three largest sources
of out-of-pocket expenses [Figure 12]. The elderly spend a higher
proportion of their income on health than the general population,
both because they have higher health care costs (on average four
times that of the under age 65 population) and because they have
lower incomes. Lower-income seniors spend a higher proportion
of their income on health than higher-income elderly [Figure 13].
The vast majority of Medicare beneficiaries (83 percent) rely on
Medicare,s traditional fee-for-service benefits, while 17 percent are
enrolled in Medicare + Choice plans. Nearly 70 percent of
beneficiaries have the option of joining at least one managed care
plan in their area [Figure 14]. Over the decade of the 1990s,
Medicare enrollment grew rapidly in managed care plans; such
growth has slowed in more recent years [Figure 15].
Most Medicare beneficiaries, whether enrolled in fee-for-service or
a Medicare + Choice plan, say they are satisfied with their medical
care [Figure 16].
Medicare spending growth has often been compared to that of the
private sector. Over the life of the program, both Medicare and
private health insurance have grown at similar rates [Figure 17].
However, during selected periods, they have often grown at
different rates [Figure 18].
P A G E 1 4 P R O F I L E S O F M E D I C A R E B E N E F I C I A R I E S
P A G E 1 5 P R O F I L E S O F M E D I C A R E B E N E F I C I A R I E S
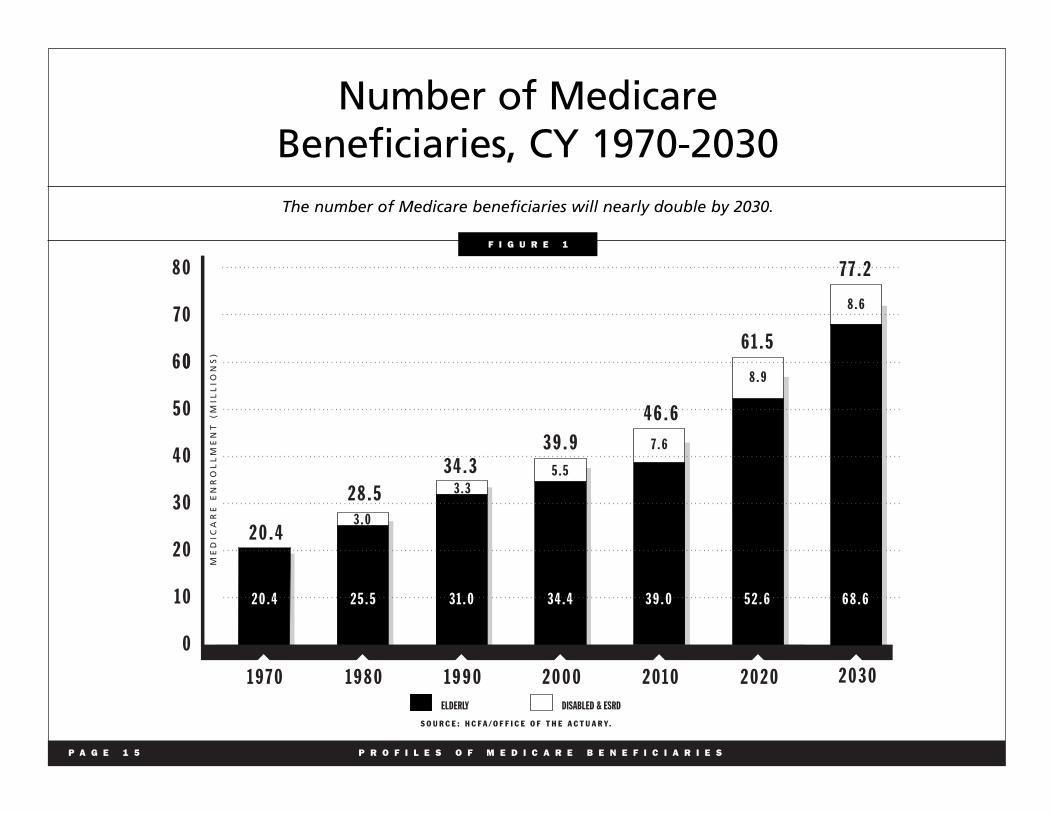
Number of Medicare Beneficiaries, CY 1970-2030 The number of Medicare beneficiaries will nearly double by 2030.
6 0
5 0
4 0
3 0
2 0
1 0
0
1 9 7 0 1 9 8 0 1 9 9 0 2 0 0 0 2 0 1 0 2 0 2 0
2 0 . 4
2 8 . 5 3 4 . 3
3 9 . 9
4 6 . 6
6 1 . 5
3 . 0
3 . 3 5 . 5
7 . 6
8 . 9
2 0 . 4 2 5 . 5 3 1 . 0 3 4 . 4 3 9 . 0 5 2 . 6
ELDERLY DISABLED & ESRD
S O U R C E : H C F A / O F F I C E O F T H E A C T U A R Y.
2 0 3 0
7 7 . 2
8 . 6
6 8 . 6
8 0
7 0
0
ME
DIC
AR
E E
NR
OL
LM
EN
T (
MIL
LIO
NS
)
F I G U R E 1
P A G E 1 6 P R O F I L E S O F M E D I C A R E B E N E F I C I A R I E S
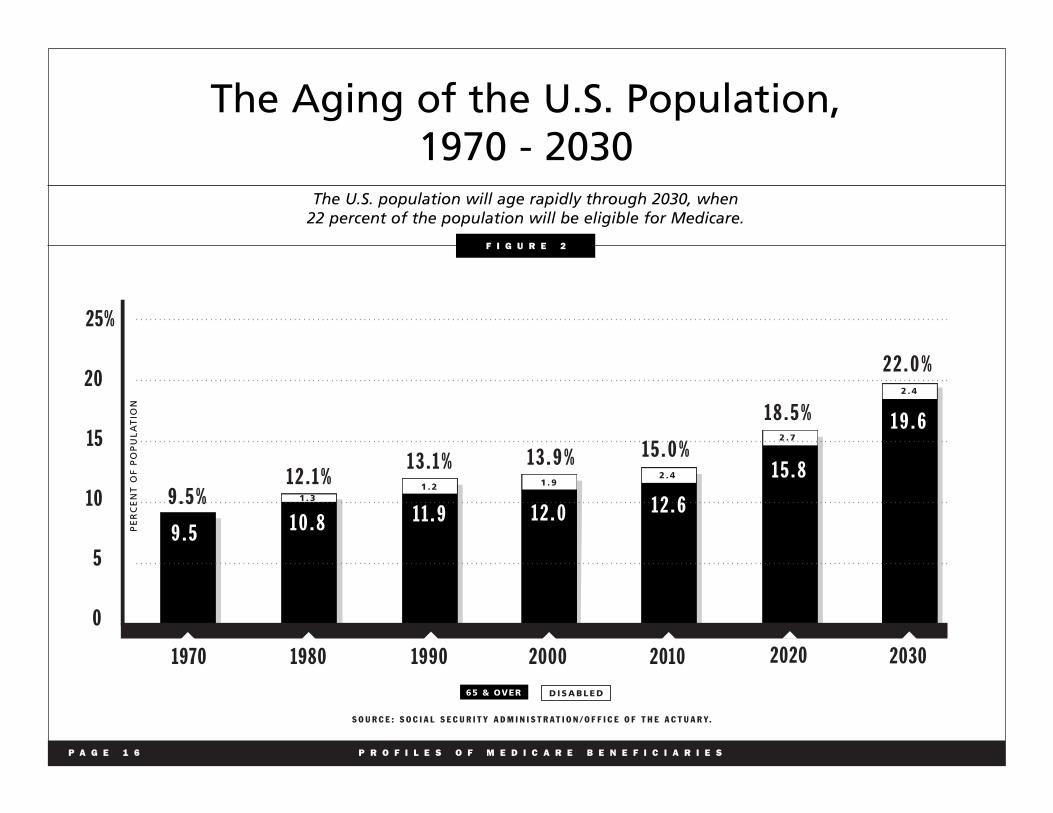
The Aging of the U.S. Population, 1970 - 2030
The U.S. population will age rapidly through 2030, when 22 percent of the population will be eligible for Medicare.
25%
20
15
10
5
0
S O U R C E : S O C I A L S E C U R I T Y A D M I N I S T R A T I O N / O F F I C E O F T H E A C T U A R Y.
9 . 5 % 1 2 . 1 %
1 3 . 1 % 1 3 . 9 % 1 5 . 0 %
1 8 . 5 %
2 2 . 0 %
1970 1980 1990 2000 2010 2020 2030
1 . 3 1 . 2
D I S A B L E D
1 . 9 2 . 4
2 . 7
2 . 4
9 . 5 1 0 . 8 1 1 . 9 1 2 . 0 1 2 . 6
1 5 . 8
1 9 . 6
65 & OVER
PE
RC
EN
T O
F P
OP
UL
AT
ION
F I G U R E 2

P A G E 1 7 P R O F I L E S O F M E D I C A R E B E N E F I C I A R I E S
Race/Ethnicity Distribution of Medicare Beneficiaries, 1998
African-American and Hispanic beneficiaries are disproportionately represented among the disabled.
S O U R C E : H C F A / O F F I C E O F S T R A T E G I C P L A N N I N G : D A T A F R O M T H E M E D I C A R E C U R R E N T B E N E F I C I A R Y S U R V E Y.
W H I T E
8 3 . 6 %
O T H E R
2 . 9 %
H I S PA N I C
5 . 9 %
A F R I C A N - A M E R I C A N
7 . 6 %
O T H E R
3 . 9 %
H I S PA N I C
1 0 . 7 %
A F R I C A N - A M E R I C A N
1 6 . 9 %
W H I T E
6 8 . 5 %
T O TA L = 3 4 . 7 M I L L I O N T O TA L = 5 . 1 M I L L I O N
E L D E R LY D I S A B L E D
F I G U R E 3
P A G E 1 8 P R O F I L E S O F M E D I C A R E B E N E F I C I A R I E S
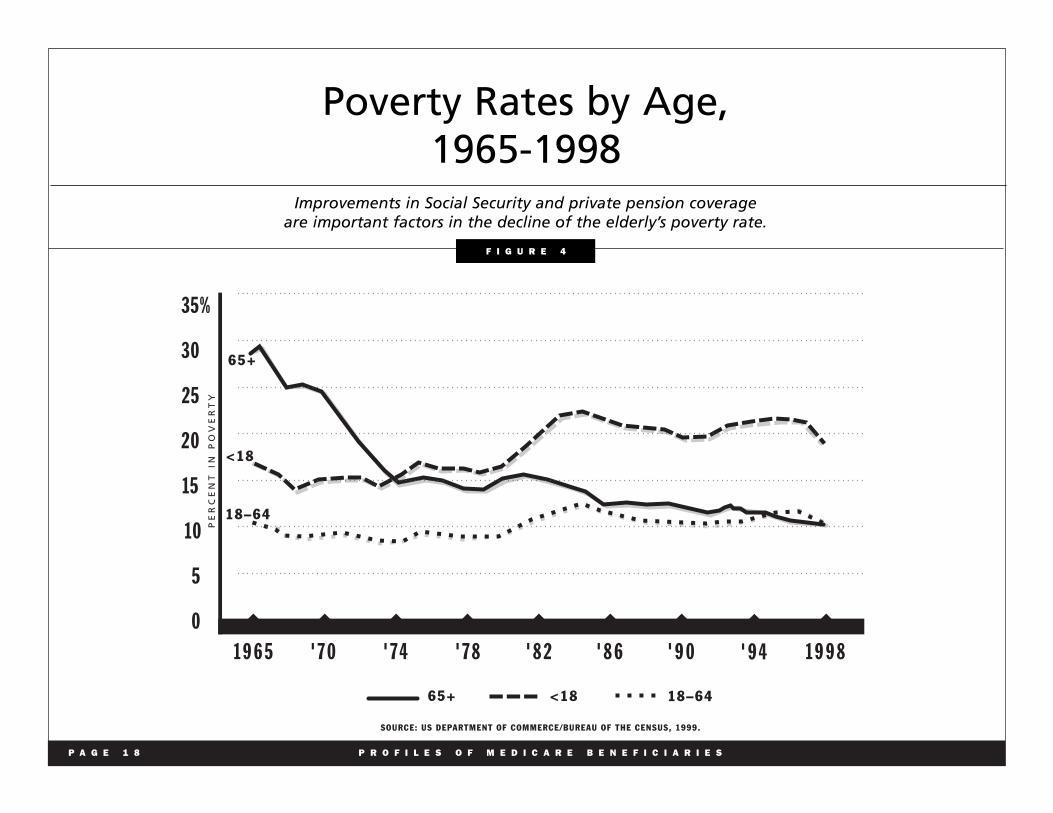
Poverty Rates by Age, 1965-1998
Improvements in Social Security and private pension coverage are important factors in the decline of the elderly’s poverty rate.
SOURCE: US DEPARTMENT OF COMMERCE/BUREAU OF THE CENSUS, 1999.
18–64
<18
65+
35%
30
25
20
15
10
5
0
1 9 6 5 ' 7 4' 7 0 ' 7 8 ' 8 2 ' 8 6 ' 9 0 1 9 9 8
PE
RC
EN
T I
N P
OV
ER
TY
' 9 4
18–64<1865+
F I G U R E 4

P A G E 1 9 P R O F I L E S O F M E D I C A R E B E N E F I C I A R I E S
Medicare Spending for Fee-for-ServiceBeneficiaries by Income, 1997
Seventy-four percent of Medicare expenditures are on behalf of individuals with annual incomes of $25,000 or less.
S O U R C E : H C F A / O F F I C E O F S T R A T E G I C P L A N N I N G : D A T A F R O M T H E M E D I C A R E C U R R E N T B E N E F I C I A R Y S U R V E Y.
$ 5 , 0 0 0 O R L E S S
7 %
$ 4 0 , 0 0 1 O R M O R E
1 0 %
$ 2 5 , 0 0 1 – $ 4 0 , 0 0 0
1 6 %
$ 1 5 , 0 0 1 – $ 2 5 , 0 0 0
2 3 %
$ 5 , 0 0 1 – $ 1 0 , 0 0 0
2 6 %
$ 1 0 , 0 0 1 – $ 1 5 , 0 0 0
1 8 %
F I G U R E 5

P A G E 2 0 P R O F I L E S O F M E D I C A R E B E N E F I C I A R I E S
Living Arrangements of Medicare Beneficiaries, 1998
Nearly 30 percent of Medicare beneficiaries live alone.
S O U R C E : H C F A / O F F I C E O F S T R A T E G I C P L A N N I N G : D A T A F R O M T H E M E D I C A R E C U R R E N T B E N E F I C I A R Y S U R V E Y.
L I V E A L O N E
2 9 %
L I V E W I T H C H I L D R E N / O T H E R S
1 6 %
60% VE INCOME < $15,000
72%
15% ARE OVER THE AGE OF 85
L I V E W I T H S P O U S E
4 9 %
L I V E I N LT C FA C I L I T Y
6 %
F I G U R E 6
HA
ARE WOMEN
P A G E 2 1 P R O F I L E S O F M E D I C A R E B E N E F I C I A R I E S
Distribution of Medicare Enrollees by Functional Status, 1998 More than one-third of the Medicare population needs assistance
with at least one “activity of daily living.”
NO ADL OR IADL LIMITATIONS IADLs ONLY 1 – 2 ADLs 3 – 6 ADLs
70%
60
50
40
30
20
10
0 ALL ELDERLY DISABLED
N O T E : A D L — A C T I V I T I E S O F D A I LY L I V I N G ( E . G . , E A T I N G , B A T H I N G ) I A D L — I N S T R U M E N T A L A C T I V I T I E S O F D A I LY L I V I N G ( E . G . , S H O P P I N G , U S E O F P H O N E , C L E A N I N G )
S O U R C E : H C F A / O F F I C E O F S T R A T E G I C P L A N N I N G : D A T A F R O M T H E M E D I C A R E C U R R E N T B E N E F I C I A R Y S U R V E Y.
5 1 %
1 3 %
2 1 % 1 5 %
5 5 %
1 1 %
2 0 % 1 4 %
2 4 % 2 5 % 3 0 %
2 1 %
F I G U R E 7
P A G E 2 2 P R O F I L E S O F M E D I C A R E B E N E F I C I A R I E S
Medicare Spending, FY 1967 - 1999
Medicare spending grew from $3.3 billion in 1967 to nearly $212 billion in 1999.
S O U R C E : H C F A / O F F I C E O F T H E A C T U A R Y
$250
200
150
100
50
0
1967 19771972 1982 1987 1992 1997 2002
DO
LL
AR
S
IN
B
IL
LI
ON
S
$3 $ 9
$ 2 3 $50
$81
$ 1 3 2
$ 2 1 1 $ 2 1 2
1999
F I G U R E 8

P A G E 2 3 P R O F I L E S O F M E D I C A R E B E N E F I C I A R I E S
Where the Medicare Dollar Went,1980 and 1998
Medicare spending is shifting away from inpatient hospital services toward outpatient services and other providers.
S O U R C E : H C F A / O F F I C E O F T H E A C T U A R Y. M A N A G E D C A R E S P E N D I N G I S I N C O R P O R A T E D W I T H I N T H E C A T E G O R I E S .
1 9 8 0 1 9 9 8
I N PAT I E N T H O S P I TA L
6 7 . 4 %
I N PAT I E N T H O S P I TA L
4 8 . 2 %
O U T PAT I E N T H O S P I TA L A N D O T H E R O U T PAT I E N T FA C I L I T Y
5 . 3 %
O U T PAT I E N T H O S P I TA L A N DO T H E R O U T PAT I E N T FA C I L I T Y
9 . 8 %
S N F
1 . 1 %
S N F
7 . 3 %
H H A
6 . 2 %
H O S P I C E
1 . 2 %
P H Y S I C I A N A N D O T H E R S M I N O N - FA C I L I T Y *2 7 . 2 %
* T H E D E F I N I T I O N O F T H E S E C A T E G O R I E S H A S C H A N G E D O V E R T I M E , S O T H E Y A R E N O T D I R E C T LY C O M P A R A B L E O V E R T H E P E R I O D .
* *
P H Y S I C I A N*2 4 . 1 %
H H A
2 . 2 %
F I G U R E 9
P A G E 2 4 P R O F I L E S O F M E D I C A R E B E N E F I C I A R I E S
Sources of Payment for Medicare Beneficiaries’ Use of Medical Services, 1997
Medicare pays more than half of the total cost of beneficiaries’ medical care.
N O T E : B E N E F I C I A R Y O U T - O F - P O C K E T S P E N D I N G D O E S N O T I N C L U D E T H E I R P A Y M E N T S F O R M E D I C A R E P A R T B P R E M I U M S , P R I V A T E I N S U R A N C E P R E M I U M S , O R H M O P R E M I U M S .
M E D I C A R E
5 5 . 1 %
O T H E R S O U R C E S
5 . 0 %
O U T- O F - P O C K E T*1 8 . 0 %
P R I VAT E I N S U R A N C E
1 0 . 0 %
M E D I C A I D
1 1 . 9 %
TOTAL AVERAGE SPENDING PER BENEFICIARY – $9,340
*S O U R C E : H C F A / O F F I C E O F S T R A T E G I C P L A N N I N G : D A T A F R O M T H E M E D I C A R E C U R R E N T B E N E F I C I A R Y S U R V E Y.
F I G U R E 1 0
( $ 5 , 1 1 4 )
( $ 5 1 6 )
( $ 1 , 6 8 1 )
( $ 9 2 2 )
( $ 1 , 1 0 7 )

P A G E 2 5 P R O F I L E S O F M E D I C A R E B E N E F I C I A R I E S
Type of Supplemental Health Insurance Held by Medicare Beneficiaries, 1998
Most beneficiaries using fee-for-service Medicare have private, supplemental health plans; however,most elderly beneficiaries enrolled in managed care plans have no other supplemental coverage.
S O U R C E : H C F A / O F F I C E O F S T R A T E G I C P L A N N I N G : D A T A F R O M T H E M E D I C A R E C U R R E N T B E N E F I C I A R Y S U R V E Y.
T O TA L B E N E F I C I A R I E S = 3 3 . 3 M I L L I O N
T O TA L B E N E F I C I A R I E S= 6 . 2 M I L L I O N
F E E - F O R - S E R V I C E R I S K H M O
M E D I C A R E O N LY
1 4 %
O T H E R
2 %
I N D I V I D U A L M E D I G A P
2 9 %
I N D I V I D U A L M E D I G A P
8 %
M E D I C A R E O N LY
7 5 %
M E D I C A I D
1 8 %
B O T H P R I VAT E T Y P E S
5 %
E M P L O Y E R - S P O N S O R E D
3 3 %
O T H E R
3 %M E D I C A I D
7 %B O T H P R I VAT E T Y P E S
1 %E M P L O Y E R - S P O N S O R E D
7 %
F I G U R E 1 1

P A G E 2 6 P R O F I L E S O F M E D I C A R E B E N E F I C I A R I E S
Distribution of Beneficiary Out-of-Pocket* Expenses, 1997
Institutional long-term care (LTC) services account for the highest share of beneficiary out-of-pocket payments, followed by outpatient prescription drugs and physician services.
N O T E : B E N E F I C I A R Y O U T - O F - P O C K E T S P E N D I N G D O E S N O T I N C L U D E T H E I R P A Y M E N T S F O R M E D I C A R E P A R T B P R E M I U M S , P R I V A T E I N S U R A N C E P R E M I U M S , O R H M O P R E M I U M S .S O U R C E : H C F A / O F F I C E O F S T R A T E G I C P L A N N I N G : D A T A F R O M T H E M E D I C A R E C U R R E N T B E N E F I C I A R Y S U R V E Y.
P R E S C R I P T I O N D R U G S
1 8 . 7 %
H O M E H E A LT H
1 . 2 %
D E N TA L
9 . 1 %
P H Y S I C I A N / S U P P L I E R
1 8 . 5 %
H O S P I TA L O U T PAT I E N T
4 . 4 %
H O S P I TA L I N PAT I E N T
4 . 1 %
LT C FA C I L I T I E S
4 4 . 0 %
TOTAL OUT-OF-POCKET EXPENDITURES = $66.8 BILLION*
F I G U R E 1 2

P A G E 2 7 P R O F I L E S O F M E D I C A R E B E N E F I C I A R I E S
Elderly Health Spending as a Percentage of Income, 1998
23.2%
36.3%
26.7%
9.8%
4.0%
2 6 . 8 %
2 0 . 3 %
1 3 . 1 %
8 . 2 %
4 . 6 %
40
35
30
25
20
15
10
5
0
<$10 $10-$19 $20-$39 $40-$69 $70+
PE
RC
EN
T O
F E
LDE
RLY
HO
USE
HO
LDS
INCOME IN THOUSANDS
PERCENT OF ELDERLY HOUSEHOLDS BY INCOME, 1998
30
25
20
15
10
5
0
<$10 $10-$19 $20-$39 $40-$69 $70+P
ER
CE
NT
OF
INC
OM
E S
PE
NT
ON
HE
ALT
H
ELDERLY HOUSEHOLDS’ HEALTH SPENDING AS A PERCENTAGE OF INCOME, 1998
MOST ELDERLY HOUSEHOLDS HAVE INCOMES BELOW $40,000
THE ELDERLY POOR SPEND A GREATER PROPORTION OF THEIR INCOME ON HEALTH
S O U R C E : H C F A / O F F I C E O F T H E A C T U A R Y : D A T A F R O M T H E B U R E A U O F L A B O R S T A T I S T I C S , C O N S U M E R E X P E N D I T U R E S U R V E Y, 1 9 9 7 - 9 8 .
INCOME IN THOUSANDS
% %
F I G U R E 1 3
Most elderly households have incomes below $40,000 and spend a greater percentage of their income on health than more affluent elderly households.
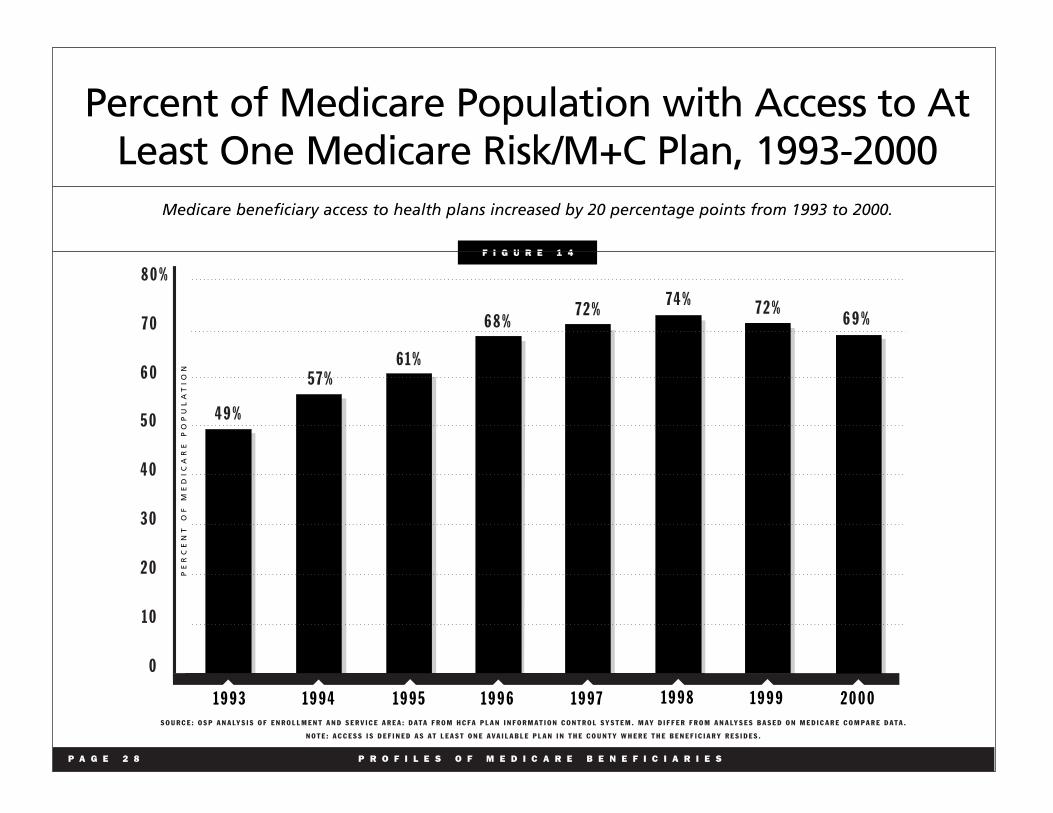
Percent of Medicare Population with Access to At Least One Medicare Risk/M+C Plan, 1993-2000
Medicare beneficiary access to health plans increased by 20 percentage points from 1993 to 2000.
5 0
4 0
3 0
2 0
1 0
0
PE
RC
EN
T
OF
M
ED
IC
AR
E
PO
PU
LA
TI
ON
S O U R C E : O S P A N A LY S I S O F E N R O L L M E N T A N D S E R V I C E A R E A : D A T A F R O M H C F A P L A N I N F O R M A T I O N C O N T R O L S Y S T E M . M A Y D I F F E R F R O M A N A LY S E S B A S E D O N M E D I C A R E C O M P A R E D A T A .
N O T E : A C C E S S I S D E F I N E D A S A T L E A S T O N E A V A I L A B L E P L A N I N T H E C O U N T Y W H E R E T H E B E N E F I C I A R Y R E S I D E S .
4 9 %
5 7 % 6 1 %
6 8 % 7 2 %
7 4 % 7 2 %
1 9 9 3 1 9 9 4 1 9 9 5 1 9 9 6 1 9 9 7 1 9 9 8 1 9 9 9
8 0 %
7 0
6 0
6 9 %
2 0 0 0
P A G E 2 8 P R O F I L E S O F M E D I C A R E B E N E F I C I A R I E S
F I G U R E 1 4

HMO Enrollment Growth, Medicare and Non-Medicare, 1990-1999
Enrollment in each sector grew in this decade. Medicare enrollment increased rapidly through 1998 and in most of the 1990s, but has declined slightly since then.
S O U R C E : I N T E R S T U D Y ; H C F A E N R O L L M E N T D A T A . M E D I C A R E E N R O L L M E N T N U M B E R S A R E F O R D E C E M B E R O F T H E P R E C E D I N G Y E A R , E X C E P T I N 1 9 9 9 , W H E N J A N U A R Y 1 9 9 9 D A T A A R E U S E D . N O N - M E D I C A R E N U M B E R S A R E I N T E R S T U D Y J A N U A R Y N U M B E R S , L E S S M E D I C A R E N U M B E R S .
3 1 . 4 8 3 3 . 1 3 5 . 7 5 3 8 . 8 6 4 2 . 7 9
8 0
6 0
4 0
2 0
0
J A N 9 0 J A N 9 1 J A N 9 2 J A N 9 3 J A N 9 4
EN
RO
LL
ME
NT
IN
MIL
LIO
NS
4 7 . 5 7 5 4 . 9 1
6 2 . 2 6 7 0 . 5 9 7 5 . 0 4
J A N 9 5 J A N 9 6 J A N 9 7 J A N 9 8 J A N 9 9
1 . 8 2 2 . 0 0 2 . 1 5 2 . 3 4 2 . 6 1
8
6
4
2
0
J A N 9 0 J A N 9 1 J A N 9 2 J A N 9 3 J A N 9 4
3 . 0 3 3 . 7 9
4 . 7 4 5 . 8 1
6 . 2 6
J A N 9 5 J A N 9 6 J A N 9 7 J A N 9 8 J A N 9 9
N O N - M E D I C A R E E N R O L L M E N T I N H M O s
M E D I C A R E E N R O L L M E N T I N H M O s
6 . 1 9
J A N 2 0 0 0
EN
RO
LL
ME
NT
IN
MIL
LIO
NS
P A G E 2 9 P R O F I L E S O F M E D I C A R E B E N E F I C I A R I E S
F I G U R E 1 5

Beneficiary Attitudes Toward HMOs and Fee-for-Service, 1998
Medicare beneficiaries in managed care and fee-for-service have high levels of satisfaction with their health care.
3 4 . 6 3
6 0 . 7 3
3 . 8 2
. 8 2
3 0 . 2
6 5 . 9
. 5 3
2 4 . 4 8
6 9 . 7 7
4 . 6 6
1 . 0 9
2 0 . 5 4
7 4 . 7 1
. 6 6
2 4 . 1 9
7 0 . 6 3
3 . 6 5 1 . 5 4
2 0 . 3 5
7 6 . 3 9
. 4 9
VERY SATISFIED SATISFIED UNSATISFIED VERY UNSATISFIED
100
80
60
40
20
0
HMO
2 7 . 2 6
FFS HMO FFS HMO FFS HMO FFS HMO FFS HMO FFS OUT-OF-POCKET COSTS QUALITY SPECIALIST CARE GETTING ANSWERS
ON THE PHONE DR. CONCERN WITH HEALTH
EASE OF GETTING TO DOCTOR
AVAILABILITY OF CARE
HMO FFS
6 6 . 7 2
4 . 8 5
1 . 1 7
1 6 . 3 1
7 0 . 4 4
3 . 0 0
1 8 . 4 3
7 3 . 8 2
6 . 1 8
1 . 5 8
1 5 . 1 9
7 9 . 1 2
1 . 2 6
2 4 . 4 6
7 0 . 9 0
3 . 7 5 . 8 9
1 8 . 7 9
7 5 . 7 3
. 7 7
2 1 . 9 6
7 2 . 5 6
4 . 4 9 . 9 9
1 8 . 3 9
7 6 . 3 9
1 . 1 9
S O U R C E : H C F A / O F F I C E O F S T R A T E G I C P L A N N I N G : D A T A F R O M T H E M E D I C A R E C U R R E N T B E N E F I C I A R Y S U R V E Y .
% 4 . 0 2
1 0 . 2 5 3 . 3 6 4 . 1 2 . 7 7 4 . 4 3 4 . 7 1
P A G E 3 0 P R O F I L E S O F M E D I C A R E B E N E F I C I A R I E S
F I G U R E 1 6

P A G E 3 1 P R O F I L E S O F M E D I C A R E B E N E F I C I A R I E S
Rate of Growth in Per Enrollee Medicare and Private Health Insurance Benefits Spending, 1970-1998
Medicare and private health insurance are the two largest payers of health care. In 1998, benefits per enrollee under Medicare increased 1.2 percent, while those under PHI increased 7.2 percent. This represents a reversal of trends experienced from 1992-1997.
S O U R C E : H C F A / O F F I C E O F T H E A C T U A R Y.
P R I V A T E H E A L T H I N S U R A N C E M E D I C A R E
2 0
1 8
1 6
1 4
1 2
1 0
8
6
4
2
0
1 9 7 0 ' 8 0' 7 5 ' 8 5 ' 9 0 ' 9 5 2 0 0 0
7 . 2
1 . 2
%
F I G U R E 1 7

P A G E 3 2 P R O F I L E S O F M E D I C A R E B E N E F I C I A R I E S
Average Growth in Per Enrollee Medicare and Private Health Insurance Spending, Selected Periods Over the 1969-98 period, Medicare and PHI benefits have grown at similar rates, 10 percent and 11.2 percent respectively.
During selected periods, however, the growth rates have differed dramatically.
PRIVATE HEALTH INSURANCEMEDICARE
1 0 1 1 . 2
6 . 9
1 1 . 4
8 . 6 7 . 8
7 . 5
3 . 5
1 . 2
7 . 2
16
14
12
10
8
6
4
2
0
1969-98 1985-91 1991-93 1993-97 1997-98 E N T I R E P E R I O D S E L E C T E D P E R I O D S
S O U R C E : H C F A / O F F I C E O F T H E A C T U A R Y.
SELECTED PERIODSENTIRE PERIOD
%
F I G U R E 1 8

II. Improving the Lives of Seniors and the Disabled
“If it was not for Medicare, I could not go to the doctor.” Medicare beneficiary, Medicare Current
Beneficiary Survey, 1999
Medicare Has Dramatically Increased Insurance Coverage
Prior to Medicare,s enactment, about half of America s seniors did
not have hospital insurance. By contrast, 75 percent of adults under
65 had such coverage, primarily through their employer. For the
uninsured, needing hospital services could mean going without
health care or turning to family, friends and charity to cover
medical bills. More than one in four elderly were estimated to have
gone without medical care due to cost concerns (Harris, 1966).
Today, Medicare covers nearly all of the elderly (approximately
97 percent), making them the population group most likely to have
health insurance coverage.
Medicare Has Helped to Increase Life Expectancy
In 1960, a 65-year-old American woman could expect to live an
additional 15.9 years to reach the age of 80.9 years. In that same
year, a 65-year-old man could expect to live an additional 12.9
years to the age of 77.9. Today, the average life expectancy of an
American woman over the age of 65 has grown nearly 20 percent
to 84.2 years and the average 65-year-old man can live to the age
of 80.9 [Figure 19].
Medicare Has Improved Access to Care
Medicare quickly expanded access to care for the elderly. Hospital
discharges averaged 190 per 1,000 elderly in 1964 and 350 per
1,000 by 1973; the proportion of elderly using physician services
jumped from 68 to 76 percent between 1963 and 1970. Currently,
more than 94 percent of elderly beneficiaries receive a health care
service paid for by Medicare.
Medicare Has Improved Quality of Life
Medicare coverage has allowed the elderly to have access to many
of the improvements made in medicine over the past 35 years. For
example, cataract surgery means that vision can be restored,
artificial hips and other joints mean that mobility can be retained,
cardiac bypass and transplant surgery mean that life itself can be
extended. Medicare,s coverage of expensive procedures means
that they are widely available. Rates for certain procedures have
grown rapidly: angioplasty rose from 1.3 per 1,000 in 1986 to 8.4
per 1,000 in 1998; heart bypass surgery grew from 2.7 per 1,000
in 1986 to 4.8 per 1,000 in 1998. Mortality following a hospital
admission for a heart attack has dropped from 24 percent in 1986
to 16 percent in 1998.
Medicare Has Saved Millions from Poverty
In 1965, the elderly were the group most likely to be living in
poverty nearly one in three seniors were poor [Figure 4]. Today,
the poverty rate for the elderly is similar to that of the 18-64 year
old group about one in 10 is poor. Before Medicare was enacted,
the elderly paid 53 percent of the cost of their health care. That
share dropped to 29 percent in 1975, and 18 percent in 1997. The
P A G E 3 3 P R O F I L E S O F M E D I C A R E B E N E F I C I A R I E S
elderly,s health costs consumed 24 percent of the average Social
Security check shortly before Medicare was enacted; by 1975, that
share dropped to 17 percent (Gornick, 1976).
Medicare Has Improved Access to Care for Minorities
Before Medicare, segregation policies and practices in many parts
of the country denied African-Americans and members of other
racial and ethnic minority groups access to the same health care as
Caucasians. Medicare required hospitals participating in the
program to be open to people of all races, and more than 1,000
government officials worked with hospitals to ensure that
discrimination practices ceased before hospitals were allowed to
participate in Medicare. In 1963, minorities age 75 years and older
averaged 4.8 visits to the doctor; by 1971, their visits grew to 7.3,
comparable to Caucasian utilization rates. Today, Medicare serves
7.3 million African-American, Hispanic, Asian and other minority
seniors, and people with disabilities.
Medicare Has Helped Disabled Americans
In 1972, Congress extended Medicare coverage to disabled people
on Social Security Disability Insurance (SSDI) and those with end-
stage renal disease (ESRD). In 1973, nearly 2 million persons with
disabilities were enrolled in Medicare. Today, more than 5 million
such Americans are enrolled in Medicare. Since the beginning of
the ESRD program in 1973, over 1 million Americans have
received life-saving renal replacement therapy (either dialysis or
transplantation). Currently there are more than 350,000 persons
alive on renal replacement therapy, and 90,000 of these persons
have a better quality of life due to a successful kidney transplant.
P A G E 3 4 P R O F I L E S O F M E D I C A R E B E N E F I C I A R I E S

P A G E 3 5 P R O F I L E S O F M E D I C A R E B E N E F I C I A R I E S
Life Expectancy at Birth and Average Remaining Years of Life at Age 65, 1950 - 2030
Over the past three decades, there has been significant progress in increasing life expectancy in the U.S.
1 0
8
6
4
2
0
1 9 6 0 ' 7 0
3 . 8
2 . 1
6 . 4 7 . 8
8 . 5
2 . 0 0 . 8
3 . 3
3 . 9 4 . 1
' 8 0 ' 9 0 2 0 0 0
NU
MB
ER
OF
YE
AR
S
L I F E E X P E C T A N C Y A T B I R T H
Y E A R
1 9 5 0
1 9 6 0
1 9 7 0
1 9 8 0
1 9 9 0
2 0 0 0
INCREASES IN LIFE EXPECTANCY AT BIRTH SINCE 1950
(Number of Years, Women) 1 0
8
6
4
2
0
1 9 6 0 ' 7 0 ' 8 0 ' 9 0 2 0 0 0
NU
MB
ER
OF
YE
AR
S
L I F E E X P E C T A N C Y A T A G E 6 5
Y E A R
1 9 5 0
1 9 6 0
1 9 7 0
1 9 8 0
1 9 9 0
2 0 0 0
INCREASES IN AVERAGE REMAINING YEARS OF LIFE AT AGE 65 SINCE 1950
(Number of Years, Women)
S O U R C E : S O C I A L S E C U R I T Y A D M I N I S T R A T I O N / O F F I C E O F T H E A C T U A R Y.
2 0 1 0
2 0 2 0
2 0 3 0
7 1 . 1
7 3 . 2
7 4 . 9
7 7 . 5
7 8 . 9
7 9 . 6
8 0 . 4
8 1 . 1
8 2 . 0
2 0 1 0
2 0 2 0
2 0 3 0
1 5 . 1
1 5 . 9
1 7 . 1
1 8 . 4
1 9 . 0
1 9 . 2
1 9 . 4
1 9 . 8
2 0 . 4
M E N
1 2 . 8
1 2 . 9
1 3 . 1
1 4 . 0
1 5 . 0
1 5 . 9
M E N
6 5 . 6
6 6 . 7
6 7 . 2
6 9 . 9
7 1 . 8
7 3 . 9
7 5 . 4
7 6 . 4
7 7 . 4
1 6 . 4
1 6 . 9
1 7 . 5
W O M E N W O M E N
F I G U R E 1 9
III. Improving and Modernizing the Medicare Program
Medicare,s original benefit package, administration and payment
methods were modeled on the private sector insurance plans
prevalent at the time, such as Blue Cross and Blue Shield plans
(Ball, 1995). Private insurance companies served as intermediaries
to do the actual work of bill payment and to be Medicare,s contact
point with health care providers. To ensure Medicare beneficiaries
would have access to care on the same terms as the privately
insured population, payment methods for hospitals, nursing
homes and home health facilities were based on reasonable costs.
Also, payments for physicians and other suppliers were based on
the lower of the area s prevailing rates or their own customary or
actual charge.
The health care marketplace in 1965 was quite different from that
of today. For instance, managed care plans barely existed outside
of the western United States. Most care was delivered in either a
doctor s office or a hospital. The elderly as a group did not have
access to as many health or social services, or sources of
information about their health care options, as they do today. The
Older Americans Act, also enacted in July of 1965, fostered the
development of many local services for the elderly, including
senior centers and Meals on Wheels.
The Medicare program has adjusted to changes in the private
sector, developed prudent purchasing techniques, and adapted to
changes in the practice of medicine. Many of the changes Medicare
has made have led to similar shifts in the private health care system,
leading to significant savings for consumers, employers, and other
purchasers of health care services.
Changes in Medicare Eligibility
In 1972, Medicare was expanded to include individuals with
disabilities who qualified for Social Security Disability Insurance
(SSDI) (made eligible after a period of 24 months) and individuals
diagnosed with end-stage renal disease (ESRD). Today, more than
5 million Americans with disabilities are enrolled in Medicare.
Changes in Medicare Benefits
Medicare,s benefit package has also been changed since 1965. In
1980, Medicare s home health benefit was expanded; hospice
benefits for the terminally ill were added in 1982; beneficiaries
were able to enroll in HMOs, paid on a risk-basis, beginning in
1985. In 1988, Medicare was expanded to include coverage of
prescription drugs and limit beneficiary out-of-pocket payments in
addition to other changes. Those expansions, included in the
Medicare Catastrophic Coverage Act, were repealed in 1989
before they took effect.
At its inception, Medicare did not cover preventive benefits. Over
time, Congress incrementally expanded coverage to include
benefits such as pap smears, flu shots, and mammograms. In 1997,
Congress significantly expanded preventive benefits to include:
• colorectal cancer screening
• diabetes glucose monitoring
• diabetes education
• bone mass measurement, and
• prostate cancer screening.
P A G E 3 6 P R O F I L E S O F M E D I C A R E B E N E F I C I A R I E S

Changes in Medicare Payment Policy
Much of the major legislative activity in the 1980s and 1990s
focused on making Medicare a more prudent purchaser of health
care services. Hospitals and other Part A providers were moved from
cost-based payment to prospective payment systems. Physicians
and many other Part B suppliers were moved from charge-based
payment to fee schedules. Managed care plans, risk-based payment
was modified to reduce the geographic variation in payment
amounts and to adjust for the relative health status of their patients.
Medicare has new prospective payment systems for home health
care, skilled nursing facility care, and outpatient hospital care.
Changes to Protect Medicare Patients
Medicare has moved aggressively to protect the rights of its
enrollees. In 1980, for example, the federal government began to
oversee the sale of private supplemental, or Medigap, insurance
to beneficiaries to cover costs not covered by Medicare.
Regulation of Medigap insurance was significantly strengthened
in 1990 to eliminate the sale of duplicate or overlapping policies.
The Health Insurance Portability and Accountability Act of 1996
contained a number of tools to reduce fraud and abuse in
Medicare. It established a mandatory appropriation to secure
stable funding for program integrity activities and opened
program integrity contracts to competitive procurement. The
1997 Balanced Budget Act included several important protections
for Medicare patients enrolled in managed care plans. Those
protections were expanded under an Executive Order signed by
President Clinton.
Chronology of Legislative Activity
July 30, 1965 - Medicare is enacted (as Title XVIII of the Social
Security Act) to provide health insurance coverage for the elderly.
Medicaid (Title XIX of the Social Security Act) also is created,
providing matching federal payments to states for health care
services to low-income aged, blind and disabled individuals, and
parents and their dependent children on welfare.
July 1, 1966 - Medicare benefits begin for more than 19 million
individuals enrolled in the program.
1972 - Medicare eligibility is extended to individuals under age
65 with long-term disabilities after 24 months of Social Security
disability benefits and to individuals with end-stage renal disease
(ESRD) after a three-month course of dialysis. About 2 million
individuals subsequently enrolled in Medicare.
1980 - Medicare,s home health benefit is broadened by
eliminating the prior hospitalization requirement and time limits
on visits. Medicare supplemental insurance, also called
Medigap, is brought under federal oversight.
1982 - A prospective risk-contracting option for health
maintenance organizations is added to facilitate plan participation.
Hospice benefits for the terminally ill are covered. Medicare is
made secondary payer for aged workers and their spouses.
Medicare utilization and quality control Peer Review Organizations
are established. Limits are placed on payments for inpatient
hospital services.
P A G E 3 7 P R O F I L E S O F M E D I C A R E B E N E F I C I A R I E S

1983 - An inpatient hospital prospective payment system (PPS),
in which a predetermined rate is paid based on patients, diagnoses,
is adopted to replace cost-based payments. Federal employees are
required to participate in Medicare.
1985 - Medicare coverage is made mandatory for newly hired state
and local government employees.
1988 - The Medicare Catastrophic Coverage Act (MCCA) is
enacted. It includes an outpatient prescription drug benefit, a cap
on patient liability for catastrophic medical expenses, expanded
skilled nursing facility benefits, and modifications to the
cost-sharing and episode-of-illness provisions of Part A. States,
through Medicaid, are required to provide medical assistance for
Medicare cost-sharing expenses for low-income Medicare
beneficiaries.
1989 - MCCA is repealed. A new fee schedule for physician
services, called the Resource-Based Relative Value Scale, or
RBRVS, is enacted and serves as a model of reform to private
insurers and payers. Physicians are required to submit bills to
Medicare on behalf of Medicare patients. Beneficiary liability for
physician bills, above and beyond what Medicare pays, is limited.
1990 - Additional federal standards for Medicare supplemental
insurance policies are established.
1993 - The Hospital Insurance (HI) payroll tax is applied to all
wages rather than the lower Social Security capped amount with
revenues placed in the HI trust fund. Under Medicaid, states are
required to provide additional assistance to low-income Medicare
beneficiaries.
1996 - The Health Insurance Portability and Accountability Act
contains a number of tools to reduce fraud and abuse, establishes a
mandatory appropriation to secure stable funding for program
integrity activities, and opens program integrity contracts to
competitive procurement.
1997 - The Balanced Budget Act of 1997 (BBA) includes the most
extensive legislative changes since the program was enacted. The
BBA:
• reduces payment increases to providers, thereby extending
solvency of the HI trust fund;
• establishes Medicare + Choice, a new array of managed care
and other health plan choices for beneficiaries, with a coor
dinated annual open enrollment process, a major new bene
ficiary education campaign about their health plan choices,
and significant changes in payment rules for health plans;
• expands coverage of preventive benefits;
• creates new home health, skilled nursing facility, inpatient
rehabilitation and outpatient hospital prospective payment
systems for Medicare services;
• improves payment accuracy and helps further restrain the
growth of health care spending;
• creates new approaches to payment and service delivery
through research and demonstrations.
1999 - The Balanced Budget Refinement Act increases payments
for some providers relative to the payment reductions in the BBA
of 1997.
P A G E 3 8 P R O F I L E S O F M E D I C A R E B E N E F I C I A R I E S

IV. Improving the U.S. Health Care System
“I tell my young friends that three generations of Americans were spared the awesome task of taking care of their parents so that they could concentrate on the care and education of their children. The security of the elderly and the health of the American people should be built on the experience and the foundation provided by Medicare and Social Security.”
Former Congressman Charles Vanik, a member of the
Ways and Means Committee when Medicare was
passed by Congress, in a letter to HCFA Administrator
Bruce Vladeck at the 30th Anniversary of Medicare s
implementation, 1996.
In addition to serving the health care needs of the elderly and
people with disabilities, Medicare plays an important role in
supporting and shaping the U.S. health care system. Medicare
covers about 14 percent of the population and finances about
21 percent of the nation,s health care spending [Figure 20]. As
the senior population has increased both in number and as a
proportion of the U.S. population, Medicare,s share of health care
spending has changed over time as Medicare has become a more
important source of financing of health care. For example, in
1970, Medicare financed about 11 percent of all health care
spending [Figure 21]. Medicare paid for 19 percent of all hospital
spending in 1970; by 1998, Medicare,s share rose to 32 percent.
Protecting the Health Care “Safety Net”
Medicare provides special financial support for inner-city and
rural health care facilities that serve a disproportionate share of
low-income and uninsured patients. In fiscal year 2000, Medicare
paid $4.6 billion in payments to these safety net providers,
allowing them to serve Medicare patients as well as many
younger, uninsured Americans.
Training a New Generation of Providers
In fiscal year 2000, Medicare paid nearly $8 billion to U.S.
hospitals to support the training of new physicians and other
health care providers. By playing such an important role in
medical education, Medicare helps ensure that future generations
of Americans will have access to high-quality care.
Ensuring Safety and Quality
Medicare,s role in quality assurance in hospitals, nursing homes
and other settings helps to ensure that all Americans receive high-
quality health care services from those providers. Through its
conditions of participation standards, Medicare establishes quality
and safety requirements for these facilities that apply to all
patients served.
Combating Fraud and Abuse
Since 1993, Medicare has waged an aggressive battle against
fraud and abuse. The result is a record series of investigations,
indictments and convictions, as well as new management tools to
identify improper payments to health care providers. Last year, the
federal government recovered nearly $500 million as a result of
health care prosecutions. Since 1996, aggressive enforcement has
recovered nearly $1.9 billion.
P A G E 3 9 P R O F I L E S O F M E D I C A R E B E N E F I C I A R I E S
The President,s budget proposes to build on these efforts and save
$38 billion over 10 years by expanding anti-fraud policies and
enhancing Medicare,s competitiveness, efficiency, and quality.
In 1995, Department of Health and Human Services Secretary
Donna E. Shalala launched Operation Restore Trust, a ground-
breaking and ongoing anti-fraud project aimed at coordinating
federal, state, local and private resources in targeted areas. In his
fiscal year 2001 budget proposal, President Clinton also unveiled
a new investment of more than $40 million to ensure a swift and
coordinated response to waste, fraud and abuse involving the
private insurance companies, which, by law, process and pay
claims on behalf of Medicare.
The Health Insurance Portability and Accountability Act of 1996
provided Medicare with important new tools to fight fraud and
abuse. It established a mandatory appropriation to secure stable
funding for program integrity activities and opened program
integrity contracts to competitive procurement.
Running an Efficient Program
Medicare,s overall administrative costs are less than 2 percent of
total benefit payments [Figure 22]. Medicare,s administrative costs
are significantly lower than private insurers, which the Blue
Cross/Blue Shield Association estimates at 12 percent for their
plans. Medicare,s administrative costs have been declining,
reflecting greater efficiency through economies of scale and high
levels of electronic claims processing. In fiscal year 1999,
Medicare processed over 148 million claims at a unit cost per
claim of $0.84 for Part A fiscal intermediaries [Figure 23]. Over
the last decade, the number of Part A claims doubled and the cost
per claim was cut in half. Medicare worked with the provider
community and others to computerize claims payment; these
efforts paved the way for others to use this technology. Electronic
submission of claims increased from 74 percent of Part A claims in
1990 to 97 percent in 1999; Part B rates rose from 36 percent to
more than 80 percent over the same period [Figure 24].
Serving as a Prudent Purchaser of Services
Medicare has developed and implemented a series of reforms in
the way it pays for and purchases health care services for its
beneficiaries. These systems have made Medicare a more prudent
purchaser, extended the fiscal solvency of the program,s trust
fund, and provided private purchasers with models for reforming
their own payment structures.
P A G E 4 0 P R O F I L E S O F M E D I C A R E B E N E F I C I A R I E S

National Personal Health Expenditures by Type of Service and Percent Medicare Paid, 1998
Total national personal health spending in 1998 was $1 trillion; Medicare accounted for 21 percent.
MEDICAL DURABLES
0 50 100 150 200 250 300 350 400
$29 BILLION MEDICARE PAYS 36%
HOME HEALTH
OTHER MEDICAL NONDURABLES
$31 BILLION MEDICARE PAYS 0%
HOSPITAL CARE
$383 BILLION MEDICARE PAYS 32%
PHYSICIAN SERVICES
$230 BILLION MEDICARE PAYS 22%
OTHER PROFESSIONALS
$67 BILLION MEDICARE PAYS 14%
NURSING HOME
$88 BILLION MEDICARE PAYS 12%
DENTAL SERVICES
$54 BILLION MEDICARE PAYS 0%
OTHER PERSONAL HEALTH CARE
$32 BILLION MEDICARE PAYS 0%
OTHER PAYERS MEDICARE SPENDING
S O U R C E : H C F A / O F F I C E O F T H E A C T U A R Y.
CATEGORY OF SPENDING
PRESCRIPTION DRUGS
$91 BILLION MEDICARE PAYS 1%
PERSONAL HEALTH SPENDING (BILLIONS OF DOLLARS)
$15 BILLION MEDICARE PAYS 38%
*
N O T E : A C C E S S I S D E F I N E D A S A T L E A S T O N E A V A I L A B L E P L A N I N T H E C O U N T Y W H E R E T H E B E N E F I C I A R Y R E S I D E S . N O T E : M E D I C A R E P A Y M E N T S A R E F R O M M A N A G E D C A R E P L A N S O N LY, S I N C E F E E - F O R - S E R V I C E M E D I C A R E D O E S N O T G E N E R A L LY C O V E R O U T P A T I E N T P R E S C R I P T I O N D R U G S .*
P A G E 4 1 P R O F I L E S O F M E D I C A R E B E N E F I C I A R I E S
F I G U R E 2 0
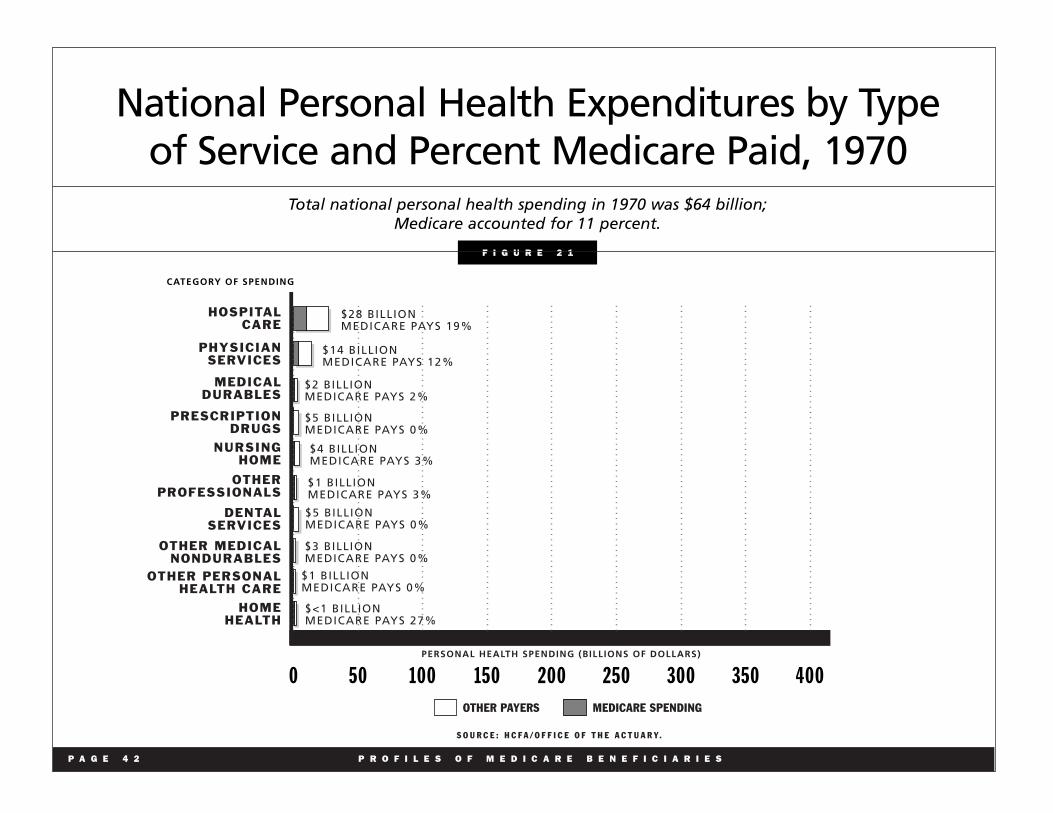
National Personal Health Expenditures by Type of Service and Percent Medicare Paid, 1970
Total national personal health spending in 1970 was $64 billion; Medicare accounted for 11 percent.
0 50 100 150 200 250 300 350 400
HOSPITAL CARE
$28 BILLION MEDICARE PAYS 19%
PHYSICIAN SERVICES
$14 BILLION MEDICARE PAYS 12%
OTHER PROFESSIONALS
$1 BILLION MEDICARE PAYS 3%
NURSING HOME
$4 BILLION MEDICARE PAYS 3%
OTHER MEDICAL NONDURABLES
$3 BILLION MEDICARE PAYS 0%
DENTAL SERVICES
$5 BILLION MEDICARE PAYS 0%
PRESCRIPTION DRUGS
$5 BILLION MEDICARE PAYS 0%
OTHER PERSONAL HEALTH CARE
$1 BILLION MEDICARE PAYS 0%
OTHER PAYERS MEDICARE SPENDING
S O U R C E : H C F A / O F F I C E O F T H E A C T U A R Y.
CATEGORY OF SPENDING
PERSONAL HEALTH SPENDING (BILLIONS OF DOLLARS)
MEDICAL DURABLES
$2 BILLION MEDICARE PAYS 2%
$<1 BILLION MEDICARE PAYS 27%
HOME HEALTH
P A G E 4 2 P R O F I L E S O F M E D I C A R E B E N E F I C I A R I E S
F I G U R E 2 1
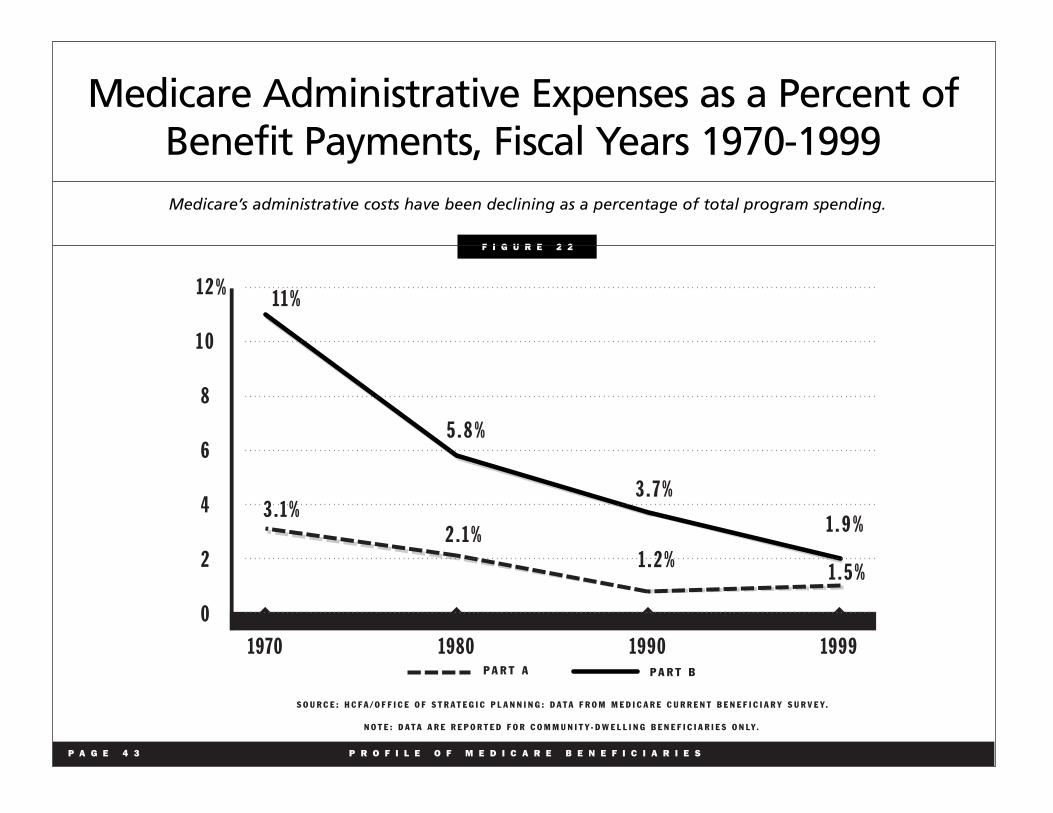
Medicare Administrative Expenses as a Percent of Benefit Payments, Fiscal Years 1970-1999 Medicare’s administrative costs have been declining as a percentage of total program spending.
S O U R C E : H C F A / O F F I C E O F S T R A T E G I C P L A N N I N G : D A T A F R O M M E D I C A R E C U R R E N T B E N E F I C I A R Y S U R V E Y.
P A R T A P A R T B
1 2
1 0
8
6
4
2
0
1970 1980 1990 1999
1 1 %
3 . 1 % 2 . 1 %
1 . 2 % 1 . 5 %
5 . 8 %
3 . 7 %
1 . 9 %
%
N O T E : D A T A A R E R E P O R T E D F O R C O M M U N I T Y - D W E L L I N G B E N E F I C I A R I E S O N L Y.
P A G E 4 3 P R O F I L E O F M E D I C A R E B E N E F I C I A R I E S
F I G U R E 2 2

Medicare Part A Cost Per Claim and Number of Claims, FY 1988 - 1999
F I G U R E 2 3
Over the last decade, the number of Part A claims has doubled while the cost of processing each claim has been cut in half.
0.84
COST PER CLAIM
N U M B E R O F C L A I M S
$2.00
1.75
1.50
1.25
1.00
.75
.50
.25
0
150
140
130
120
110
100
90
80
70
1988 1992 1996
IN D
OL
LA
RS
IN
MIL
LIO
NS
1.57
74
81
89
99 101
109
121
133
142
150 145
148
1.64 1.64 1.67 1.59
1.48 1.33 1.27
1.20
0.91
1998 19991997199519941993199119901989
N O T E : 1 9 9 9 D A T A A R E P R E L I M I N A R Y E S T I M A T E S . C O S T P E R C L A I M I S I N N O M I N A L D O L L A R S .
S O U R C E : H C F A / C E N T E R F O R B E N E F I C I A R Y S E R V I C E S .
1.56
P A G E 4 4 P R O F I L E O F M E D I C A R E B E N E F I C I A R I E S

Electronic Claims, CY 1990-1999
CARRIERFISCAL INTERMEDIARY
73.9
36.4
76.6
42.8
82.7
52.3
90
64.6
80
70
60
50
40
30
20
10
0
1990 1991 1992 1993 1994
S O U R C E : H C F A / C E N T E R F O R B E N E F I C I A R Y S E R V I C E S .
1995 1996 1997 1998 1999
93.5
72.5
95.2
76.8
96.1
78.3
96.3
80
96.7
80.3
97.1
80.7 90
100%
P A G E 4 5 P R O F I L E S O F M E D I C A R E B E N E F I C I A R I E S
F I G U R E 2 4
The rate of electronic submission of Medicare claims has grown considerably over the last decade.

V. Improving Medicare for the Future
“I just hope it lasts, because I could not manage without it.” Medicare beneficiary, Medicare Current Beneficiary Survey, 1999
In many ways, we can only imagine what the world will look like
in 2030. What we do know, however, is that there will be a major
demographic shift. The aging of the population will test our
ingenuity to continue to ensure that programs like Social Security
and Medicare will be available to meet income and health care
needs in 2030 and beyond. The elderly in 2030 will be a more
diverse group than today. About one in three will be members of
racial or ethnic minority groups. They will also be better educated;
about one in four seniors will be college graduates.
While the sheer number of elderly, and their share of the population,
will present challenges to the nation,s ability to finance health care
services, there are encouraging data about declines in the proportion
of the elderly with functional limitations. The incidence of functional
limitations among the elderly has declined since the early 1980s.
According to a 1997 survey, there was less than half the growth in
the actual number of functionally disabled people than might
otherwise have been expected (Manton, et. al., 1997). Moreover,
between 1985 and 1997, the percentage of the population aged 85
and older residing in nursing homes has declined by 13 percent
(Forum, 2000) as home health services, assisted living facilities, and
other alternatives have enabled more elders to live in the community.
At the same time, the elderly are projected to have a longer life
expectancy and the proportion of Medicare beneficiaries who are
over 85 will continue to increase. Over the next 30 years, improved
access to health care and continuing scientific breakthroughs are
expected to result in more than 300,000 Americans living until age
100 or longer (Census Bureau, 1999).
Financing Challenges
In its most recent report, the Medicare Board of Trustees
estimated that Medicare,s Hospital Insurance (HI) trust fund
would remain solvent until 2025. This represents a remarkable
improvement over the 1993 estimate that the HI trust fund would
be insolvent by 1999. Changes made in the Omnibus Budget
Reconciliation Act of 1993 and the Balanced Budget Act of 1997,
along with government-wide fraud and abuse detection and
prevention efforts, prudent management of the program, and the
strong economy, have all helped to significantly delay that date,
while also contributing to paying down the national debt.
Despite this significant achievement, concern remains about the
financing of Medicare once the baby boom generation retires,
starting in 2010. In 2030, 22 percent of Americans will depend
upon Medicare up from 14 percent today. The aging of the
population also means that the number of workers paying
Medicare taxes to support the benefits of a retired or disabled
beneficiary will drop. In 1970, 3.7 workers paid for every retiree.
In 2000, that figure is 3.4 workers. In 2030, it is projected to be
2.2 workers.
The imperative to address the future needs of the Medicare
program and its beneficiaries is reflected in President Clinton,s
proposals for Medicare reform. These proposals include:
P A G E 4 6 P R O F I L E S O F M E D I C A R E B E N E F I C I A R I E S

Coverage for Prescription Drugs
“There are medications that I have been told to take that I don’t take because they are so expensive. I need an allergy medicine daily, 365 days a year. One month of it costs $78. So, I don
,t take it all the time. Then there is medicine my
doctor tells me to take for my joint problems. Again, I don’t buy it because it is so expensive.”
Female Medicare beneficiary in Richmond, VA
As noted earlier, Medicare,s benefit package was modeled on the
private insurance plans prevalent in 1965 when outpatient prescrip
tion drugs were not covered. Today, outpatient drug coverage is a
common feature of private insurance. Yet research has shown that
nearly half of Medicare beneficiaries do not have drug coverage at
some time during the year and about one in three are without drug
coverage for the entire year. In addition, existing coverage is unsta
ble and declining. Seniors without drug coverage purchase one-
third fewer drugs but pay nearly twice as much out of pocket for the
drugs that they do buy, compared with those with coverage. One in
10 beneficiaries without drug coverage reports being unable to pur
chase needed prescriptions a level five times higher than those
with coverage.
The President,s Medicare reform proposal will provide all benefi
ciaries access to a voluntary prescription drug benefit through a
program administered by private sector organizations. When fully
phased in, the plan would cover half of all drug costs up to $5,000
and provide additional protection against catastrophic prescription
drug costs. Under the President s plan, Medicare will contribute at
least 50 percent of the premium for such coverage and provide
special protection to low-income beneficiaries.
Improving Access to Preventive Services
“I am happy that they are finally paying for exams like pap smears and bone density for my wife. They were not paying for them before.”
Medicare beneficiary, Medicare Current Beneficiary Survey, 1999
Medicare coverage of preventive services has expanded signifi
cantly but still covers only a limited set of preventive services
including: pap smears; screening mammography; pelvic and clini
cal breast exams; pneumonia, hepatitis B, and influenza vaccines;
colorectal cancer screening; diabetes glucose monitoring; diabetes
education; bone mass measurement; and prostate cancer screening.
Medicare has nationwide quality improvement activities and pub
lic and provider awareness campaigns, particularly regarding flu,
pneumonia, pap smears and mammograms to increase the utiliza
tion of these important services [Figures 25 and 26].
Since 1991, Medicare has made considerable progress in raising
the rates for both flu and pneumonia shots but needs to make more
progress to reach the Healthy People 2010 goal of 90 percent cov
erage for each vaccination. The Healthy People 2010 goals for
mammograms are 70 percent of women 40 and over receiving a
mammogram within the past two years and 90 percent of women
18 and older receiving a pap test within the previous three years.
Medicare also is working to reach those goals.
Mammograms
Mammography is the most effective method of diagnosing breast
cancer. Women whose cancer is detected at earlier stages have
P A G E 4 7 P R O F I L E S O F M E D I C A R E B E N E F I C I A R I E S
better outcomes. Although early detection reduces mortality
resulting from the disease, Medicare mammography screening
rates are still too low. In response to the lower utilization rates for
minorities, Medicare undertook special efforts to increase
utilization in these communities, including partnering with
minority organizations, the Centers for Disease Control and
Prevention and state health departments to expand outreach in
minority communities [Figure 27]. Medicare also has directed its
contractors for quality improvement, known as Peer Review
Organizations, to increase the percentage of Medicare beneficiaries
who have had a mammogram. Activities aimed at improving these
rates are ongoing in all 50 states.
Pneumonia and Influenza Vaccines
Pneumonia and influenza are the sixth leading causes of death in
the United States. More than 90 percent of the nation s 20,000
annual deaths from flu, and the 40,000 annual deaths from
pneumonia, occur among the elderly. Proper vaccinations,
especially among those living in nursing homes and at high risk for
flu and pneumonia, could prevent many of these deaths. Medicare
has launched an initiative known as standing orders in nursing
homes for flu and pneumonia vaccinations so that all residents are
personally reminded each fall that it is time for their shot, which
they can receive on the spot from an appropriate health care
professional. The evidence shows that such practices are the most
effective method for getting people vaccinated an especially
important service for vulnerable nursing home residents.
Medicare has directed Peer Review Organizations to include
increasing statewide immunization rates for pneumococcal and
influenza vaccines as one of their quality indicators. The main
objective of this Medicare Peer Review Organization initiative is
to decrease the morbidity and mortality associated with
pneumonia in Medicare beneficiaries. Projects underway in all
50 states will help beneficiaries in the future.
To increase use of flu and pneumonia shots, Medicare started
the Good Neighbor Project in Baltimore, which established
links with local organizations to work with physicians and
minority beneficiaries to improve utilization of flu and
pneumonia shots [Figure 28].
Eliminating Cost-Sharing on Preventive Services
President Clinton,s Medicare reform plan would eliminate all
cost-sharing for preventive benefits in Medicare, including
colorectal cancer screening, bone mass measurements, pelvic
exams, prostate cancer screening, diabetes self-management,
and mammographies. The plan also includes a three-year
demonstration project to provide cost-effective smoking
cessation services to beneficiaries and a national health
promotion campaign for all Americans over 50.
Providing Additional Revenue
It is not possible to adequately address the cost of doubling
Medicare,s enrollment by simply reducing what Medicare
spends and increasing premiums and other charges to
beneficiaries. President Clinton has proposed dedicating $115
billion of the non-Social Security surplus to Medicare, thereby
extending the solvency of the HI Trust Fund and eliminating the
need for future excessive cuts and radical restructuring of the
Medicare program.
P A G E 4 8 P R O F I L E S O F M E D I C A R E B E N E F I C I A R I E S

Creating Insurance Options for Early Retirees
The President,s plan would allow Americans between the ages of
62 and 65 to buy into Medicare for approximately $300 a month.
Workers between the ages of 55 and 62 who lose their jobs could
buy in at a slightly higher premium (about $400 a month). The
President s fiscal year 2001 budget includes a new tax credit to
offset part of the cost of this buy-in to encourage more uninsured
early retirees to enroll.
P A G E 4 9 P R O F I L E S O F M E D I C A R E B E N E F I C I A R I E S

P A G E 5 0 P R O F I L E S O F M E D I C A R E B E N E F I C I A R I E S
Utilization of mammography and pap smears has been growing over the decade, but has not yet reached Healthy People 2010 goals.*
60
50
40
30
20
10
0
S O U R C E : H C F A / O F F I C E O F S T R A T E G I C P L A N N I N G : D A T A F R O M M E D I C A R E C U R R E N T B E N E F I C I A R Y S U R V E Y.
M A M M O G R A M P A P S M E A R
34.1 34.9
34.6 33.5
38.9 39.1
39.6 39.0
41.7 42.2
42.7 42.0
45.9 42.7
1992 1 9 9 3 1994 1995 1996 1997 1998
N O T E : D A T A A R E R E P O R T E D F O R F E M A L E B E N E F I C I A R I E S W H O R E P O R T R E C E I V I N G M A M M O G R A M S A N D P A P S M E A R S I N T H E P A S T Y E A R A N D I N C L U D E B O T H P R E V E N T I V E A N D D I A G N O S T I C S E R V I C E S . M C B S S U R V E Y I N C L U D E S F E E - F O R - S E R V I C E A N D M A N A G E D C A R E E N R O L L E E S A S W E L L A S A G E D A N D D I S A B L E D B E N E F I C I A R I E S . D A T A A R E R E P O R T E D F O R C O M M U N I T Y - D W E L L I N G B E N E F I C I A R I E S O N LY.
N O T E : H E A L T H Y P E O P L E 2 0 1 0 G O A L S : 7 0 % O F W O M E N R E C E I V I N G A M A M M O G R A M W I T H I N L A S T 2 Y E A R S A N D 9 0 % O F W O M E N R E C E I V I N G A P A P S M E A R T E S T W I T H I N T H E P A S T 3 Y E A R S .*
%
Female Medicare Beneficiaries Who Report Receiving Mammograms and Pap Smears, 1992-1998
F I G U R E 2 5

Medicare Beneficiaries Who Report Receiving a Preventive Service: Flu and Pneumonia* Vaccinations, 1991-1998
70
60
50
40
30
20
10
0
F L U S H O T P N E U M O N I A
1 9 9 1 1 9 9 2 1 9 9 3 1 9 9 4 1 9 9 5 1 9 9 6 1 9 9 7 1 9 9 8
40.9 20.9
45.7 20.8
48.0 20.8
55.4 23.0
57.3 33.6
61.3 43.0
64.0 48.8
65.6 54.0
S O U R C E : H C F A / O F F I C E O F S T R A T E G I C P L A N N I N G : D A T A F R O M M E D I C A R E C U R R E N T B E N E F I C I A R Y S U R V E Y.
N O T E : D A T A A R E S E L F - R E P O R T E D B Y B E N E F I C I A R I E S A N D I N C L U D E T H E A G E D , D I S A B L E D , F E E - F O R - S E R V I C E A N D M A N A G E D C A R E E N R O L L E E S . D A T A F O R B B A - C O V E R E D P R E V E N T I V E S E R V I C E S ( E . G . , P R O S T A T E C A N C E R S C R E E N I N G , B O N E M A S S M E A S U R E M E N T S , C O L O R E C T A L C A N C E R S C R E E N I N G , A N D D I A B E T E S S E L F - M A N A G E M E N T ) W I L L B E C O L L E C T E D I N T H E F A L L 2 0 0 0 M C B S . D A T A A R E R E P O R T E D F O R C O M M U N I T Y - D W E L L I N G B E N E F I C I A R I E S O N LY.
N O T E : P N E U M O N I A V A C C I N A T I O N S A R E G E N E R A L LY R E C O M M E N D E D O N C E I N A L I F E T I M E – T H U S , T H E N U M B E R S H E R E A R E A C U M U L A T I V E P E R C E N T A G E O F P E R S O N S R E P O R T I N G T H A T T H E Y H A V E E V E R R E C E I V E D T H E S H O T. T H E F L U S H O T I S R E C O M M E N D E D A N N U A L LY – T H E N U M B E R S R E F L E C T A N N U A L R E C E I P T O F T H E S H O T.
N O T E : T H Y P E O P L E 2 0 1 0 G O A L S : 9 0 % R E C E I V I N G A N A N N U A L F L U S H O T A N D 9 0 % R E C E I V I N G A O N E - T I M E P N E U M O N I A S H O T.
*
**
%
P A G E 5 1 P R O F I L E S O F M E D I C A R E B E N E F I C I A R I E S
F I G U R E 2 6
Utilization of flu and pneumonia shots has been growing over the decade, but has not yet reached Healthy People 2010 goals.**
H E A L

P A G E 5 2 P R O F I L E S O F M E D I C A R E B E N E F I C I A R I E S
Female Medicare Beneficiaries Who Report Receiving Mammograms, by Race, 1992-1998
Utilization of mammograms is slightly higher for Caucasians than other racial groups, but rates for all groups are increasing over the decade.
S O U R C E : H C F A / O F F I C E O F S T R A T E G I C P L A N N I N G : D A T A F R O M M E D I C A R E C U R R E N T B E N E F I C I A R Y S U R V E Y .
CAUCASIAN
1995 19971992 1993 1994 1996 1998
60
50
40
30
20
10
0
%
AFRICAN – AMERICAN HISPANIC
28.5 35.2 31.4 35.4
36.9 39.5
38.8 39.9
39.7 42.7
41.0 43.4
43.2 46.7
43.4
37.8
34.1
33.7
34.5
30.3
28.9
N O T E : D A T A R E F L E C T S F E M A L E B E N E F I C I A R I E S W H O R E P O R T R E C E I V I N G M A M M O G R A M S , I N T H E P A S T Y E A R , A N D I N C L U D E B O T H P R E V E N T I V E A N D D I A G N O S T I C S E R V I C E S . M C B S S U R V E Y I N C L U D E S F E E - F O R - S E R V I C E A N D M A N A G E D C A R E E N R O L L E E S A S W E L L A S A G E D A N D D I S A B L E D B E N E F I C I A R I E S . D A T A A R E R E P O R T E D F O R C O M M U N I T Y - D W E L L I N G B E N E F I C I A R I E S O N L Y .
F I G U R E 2 7

Medicare Beneficiaries Who Report Receiving Flu Shots, by Race, 1991-1998
CAUCASIAN
1995 19971992 1993 1994 1996 1998 AFRICAN – AMERICAN HISPANIC
27.5 48.6
28.9 51.0
34.8 59.0
36.3 60.8
42.5 64.4
45.7 67.2
46.9 68.6
S O U R C E : H C F A / O F F I C E O F S T R A T E G I C P L A N N I N G : D A T A F R O M M E D I C A R E C U R R E N T B E N E F I C I A R Y S U R V E Y.
N O T E : D A T A R E F L E C T S B E N E F I C I A R I E S W H O R E P O R T R E C E I V I N G F L U S H O T S . M C B S S U R V E Y I N C L U D E S F E E - F O R - S E R V I C E A N D M A N A G E D C A R E E N R O L L E E S A S W E L L A S A G E D A N D D I S A B L E D B E N E F I C I A R I E S . D A T A A R E R E P O R T E D F O R C O M M U N I T Y - D W E L L I N G B E N E F I C I A R I E S O N L Y.
60
50
40
30
20
10
0
70 %
31.7
34.3
39.6
42.3
49.4
50.5
56.0
25.5 43.4
28.1
1991
P A G E 5 3 P R O F I L E S O F M E D I C A R E B E N E F I C I A R I E S
F I G U R E 2 8
Utilization of flu shots is higher for Caucasians than other racial groups, but rates for all groups are increasing over the decade.
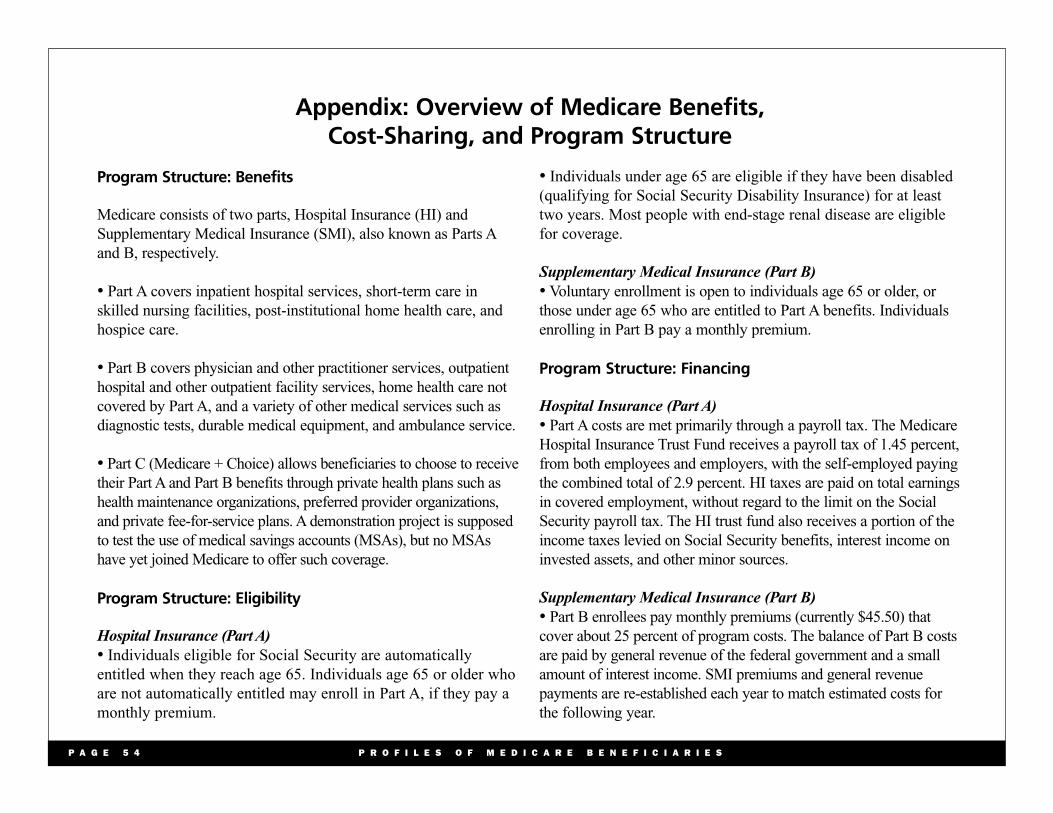
Appendix: Overview of Medicare Benefits, Cost-Sharing, and Program Structure
Program Structure: Benefits
Medicare consists of two parts, Hospital Insurance (HI) and
Supplementary Medical Insurance (SMI), also known as Parts A
and B, respectively.
• Part A covers inpatient hospital services, short-term care in
skilled nursing facilities, post-institutional home health care, and
hospice care.
• Part B covers physician and other practitioner services, outpatient
hospital and other outpatient facility services, home health care not
covered by Part A, and a variety of other medical services such as
diagnostic tests, durable medical equipment, and ambulance service.
• Part C (Medicare + Choice) allows beneficiaries to choose to receive
their Part A and Part B benefits through private health plans such as
health maintenance organizations, preferred provider organizations,
and private fee-for-service plans. A demonstration project is supposed
to test the use of medical savings accounts (MSAs), but no MSAs
have yet joined Medicare to offer such coverage.
Program Structure: Eligibility
Hospital Insurance (Part A) • Individuals eligible for Social Security are automatically
entitled when they reach age 65. Individuals age 65 or older who
are not automatically entitled may enroll in Part A, if they pay a
monthly premium.
• Individuals under age 65 are eligible if they have been disabled
(qualifying for Social Security Disability Insurance) for at least
two years. Most people with end-stage renal disease are eligible
for coverage.
Supplementary Medical Insurance (Part B) • Voluntary enrollment is open to individuals age 65 or older, or
those under age 65 who are entitled to Part A benefits. Individuals
enrolling in Part B pay a monthly premium.
Program Structure: Financing
Hospital Insurance (Part A) • Part A costs are met primarily through a payroll tax. The Medicare
Hospital Insurance Trust Fund receives a payroll tax of 1.45 percent,
from both employees and employers, with the self-employed paying
the combined total of 2.9 percent. HI taxes are paid on total earnings
in covered employment, without regard to the limit on the Social
Security payroll tax. The HI trust fund also receives a portion of the
income taxes levied on Social Security benefits, interest income on
invested assets, and other minor sources.
Supplementary Medical Insurance (Part B) • Part B enrollees pay monthly premiums (currently $45.50) that
cover about 25 percent of program costs. The balance of Part B costs
are paid by general revenue of the federal government and a small
amount of interest income. SMI premiums and general revenue
payments are re-established each year to match estimated costs for
the following year.
P A G E 5 4 P R O F I L E S O F M E D I C A R E B E N E F I C I A R I E S
Glossary
Aged As used here, those 65 years of age and older.
ADL Activities of daily living. These are basic tasks associated with daily
life such as bathing, dressing, going to the bathroom, and eating.
Ambulatory care sensitive condition Medical condition that should not require hospitalization with
appropriate ambulatory treatment (e.g., asthma or diabetes).
Ambulatory surgical center (ASC) A facility that provides surgical services that do not require a hospital
stay. Medicare pays for use of an ambulatory surgical center for
certain approved surgical procedures. Medicare also will pay for
physician and anesthesia services that are provided for the procedure.
Assigned claim A claim for which the physician or supplier agrees to accept the
amount approved by Medicare as the total payment, after the
annual Part B deductible has been met. Medicare pays the
physician or supplier 80 percent of the Medicare-approved
amount. The doctor or supplier can charge the beneficiary only
for the coinsurance, which is the remaining 20 percent of the
approved amount. A participating physician or supplier agrees to
accept assignment on all claims.
Center for Health Plans and Providers (CHPP) This HCFA component is responsible for developing policies
and procedures related to health maintenance organizations,
competitive medical plans and other health care delivery systems
and purchasing arrangements. CHPP is also responsible for
developing purchasing strategies to improve the quality of health
care choice for beneficiaries, and defining the scope of Medicare
benefits and payment policies.
Coinsurance That portion of covered hospital and medical expenses, after
subtraction of any deductible, for which the beneficiary is
responsible.
Deductible The deductible is the amount payable by the beneficiary for
covered services before Medicare reimburses the provider.
Disabled As used here, persons with disabilities under 65 years of age.
Persons with disabilities become eligible for Medicare when they
have been receiving Social Security Disability Insurance benefits
for 24 months. Most individuals under 65 years of age diagnosed
with end-stage renal disease are also eligible to receive Medicare
benefits (in the data used in this report, they are included with the
disabled for analytical purposes).
DHHS U.S. Department of Health and Human Services.
Dual Eligibles Dual eligibles are individuals who are entitled to Medicare Part A
and/or Part B and are eligible for some form of Medicaid benefit.
P A G E 5 5 P R O F I L E S O F M E D I C A R E B E N E F I C I A R I E S
Durable Medical Equipment (DME) Under Medicare, DME includes certain medical supplies and items
such as hospital beds and wheelchairs used in a patient s home.
Elderly As used here, those 65 years and older.
End-stage renal disease (ESRD) Irreversible kidney failure. The patient must either receive a
kidney transplant or periodic kidney dialysis. Most individuals
with ESRD are eligible for benefits.
HCFA Health Care Financing Administration, an agency within the
U.S. Department of Health and Human Services that administers
Medicare, State Children,s Health Insurance Program, and
other programs.
Health professional shortage area A geographic area determined by the U.S. Public Health Service
to have a shortage of physicians or other health professionals.
HMO Health Maintenance Organization. HMOs provide or arrange for a
comprehensive package of health care services for a fixed monthly
premium with nominal copayments permitted.
HMO penetration The percentage of insured lives in a market area enrolled in HMOs.
Home health agency (HHA) An agency that specializes in giving skilled nursing services and
other therapeutic services, such as physical therapy, in patients, homes.
Home health benefit The portion of the Medicare program that pays for care to
homebound beneficiaries. Care must be provided by a home health
agency that participates in the Medicare program. Covered services
include part-time or intermittent skilled nursing care, physical and
speech therapy, occupational therapy, and part-time or intermittent
services of a home health aide.
Hospice A public agency or private organization that is primarily engaged in
providing pain relief, symptom management, and supportive
services to terminally ill people. Medicare beneficiaries may elect to
receive hospice care instead of standard Medicare benefits.
Managed care plan A general term applied to a wide range of insurance plans, including
HMOs, where choice of providers is limited and administrative
measures control utilization of services. The types of Medicare
managed care plans include health maintenance organizations
(HMOs), competitive medical plans (CMPs), and health care
prepayment plans (HCPPs). The Balanced Budget Act of 1997
expands the types of managed care plans that can participate in
Medicare.
MCBS Medicare Current Beneficiary Survey. A survey of approximately
12,000 Medicare beneficiaries that collects information on
demographic characteristics, health status and functioning, insurance
coverage, financial resources, and family supports. Beneficiaries
are reinterviewed periodically to form a continuous profile.
P A G E 5 6 P R O F I L E S O F M E D I C A R E B E N E F I C I A R I E S

Medicaid A joint federal-state program that provides medical assistance for
those with low income. Medicaid is administered by the states and
jointly funded by the states and the federal government. It was
enacted in 1965 by Title XIX of the Social Security Act.
Medicare supplemental insurance (Medigap) Private insurance that supplements Medicare by paying Medicare
deductibles and coinsurance. There are 10 nationally standardized
Medigap policies (plans A - J). Some policies offer coverage not
provided by Medicare, such as coverage for outpatient
prescription drugs and care outside the United States. Also called
Medigap Insurance.
NCHS National Center for Health Statistics. The component of the U.S.
Public Health Service that collects and maintains statistics on
various aspects of public health.
Non-institutionalized Individuals not living in facilities such as nursing homes.
Office of the Actuary (OACT) This HCFA component provides estimates of expenditures for the
Medicare and Medicaid programs and of health expenditures in the
United States.
Office of Information Services (OIS) This HCFA component is responsible for managing HCFA
,s
information technology assets, enterprise databases, and access
paths to data and operational systems.
Office of Strategic Planning (OSP) This HCFA component is responsible for HCFA
,s research and
evaluation program, coordinating demonstration activities,
developing and managing the long-term policy and strategic
planning process, and for developing HCFA statistical publications
including the Statistical Supplement to the Health Care Financing
Review, and the preparation of this chart book.
Participating physician/supplier A physician or supplier who has agreed to accept assignment on all
Medicare claims (see assignment).
Preferred Provider Organization (PPO) A managed care plan that contracts with networks or panels of
providers to furnish services and be paid on a negotiated fee
schedule. Enrollees are offered a financial incentive to use
providers on the preferred list, but may use non-network providers
as well (see managed care plan).
Prospective Payment System (PPS) Medicare
,s reasonable cost payments for inpatient hospitals was
replaced in the mid-1980s by PPS and has since been phased in
for inpatient hospital capital costs as well. Prospective payment
systems are required by the BBA for outpatient hospital services,
home health, skilled nursing facility, and inpatient rehabilitation
services. Prospective payment systems pay providers a fixed
amount, determined in advance, for the costs of each patient based
on the severity of the patient,s health condition and may adjust for
other factors such as geographic location, wages, service to low-
income patients, and teaching activity.
P A G E 5 7 P R O F I L E S O F M E D I C A R E B E N E F I C I A R I E S

Qualified Medicare Beneficiary (QMB) A Medicare beneficiary with limited income and resources, eligible
for Medicaid coverage for the payment of Medicare premiums and
cost-sharing expenses (deductibles and coinsurance).
Risk HMO An HMO that is paid a predetermined per-member payment from
Medicare to provide all necessary covered services to its
Medicare enrollees.
Skilled care Skilled nursing care or skilled rehabilitation services, such as
physical therapy. Medicare pays for nursing home stays requiring
daily skilled care for a condition related to a prior hospitalization.
Medicare also pays for part-time or intermittent skilled care
provided by a home health agency to those who are homebound.
Skilled Nursing Facility (SNF) A facility that is certified by Medicare to provide skilled nursing or
rehabilitation services.
Specified Low Income Medicare Beneficiary (SLMB) A Medicare beneficiary with limited income and resources, but
income greater than a QMB, eligible for Medicaid coverage for the
payment of Medicare Part B premiums.
Supplier A provider of health care services, other than a practitioner, that
is permitted to bill under Medicare Part B. Suppliers include
independent laboratories, durable medical equipment providers,
ambulance services, orthotists, prosthetists, and portable
X-ray providers.
P A G E 5 8 P R O F I L E S O F M E D I C A R E B E N E F I C I A R I E S
Sources
Ball, Robert. What Medicare,s architects had in mind. Health
Affairs. 14(4). Winter 1995.
Census Bureau. Centenarians in the United States. Current Population Reports, Series P23-199RV. 1999.
Congressional Quarterly. Almanac. 89th Congress 1st Session 1965.
Volume XXI.
De Lew, The first 30 Years of Medicare and Medicaid. JAMA. 1995:274 (3): 262-267.
Faulkner LA, Schauffler HH. The effect of health insurance
coverage on the appropriate use of recommended clinical
preventive services. Am J Prev Med, 1997; 13: 453-8.
Federal Interagency Forum on Aging-Related Statistics. Older
Americans: key indicators of well-being, 2000. Chartbook.
Forthcoming. (cited as Forum, 2000 in text)
Gornick, M. Ten years of Medicare: impact on the covered
population. Social Security Bulletin. July, 1976. Social Security
Administration. U.S. Department of Health, Education and Welfare.
Gornick, M., et al. Twenty years of Medicare and Medicaid:
covered populations, use of benefits, and program expenditures.
Health Care Financing Review. 1985 Annual Supplement.
December, 1985.
Gornick, et al. Thirty years of Medicare: impact on the covered
population. Health Care Financing Review Winter 1996.
Gornick, M. Plausible explanations for disparities in the use of
Medicare services and ways to effect a change. Forthcoming in the Health Care Financing Review. Summer 2000.
Harris, Richard. Annals of legislation. Medicare I: all very
Hegelian. The New Yorker. July 2, 1966.
Harris, Richard. Annals of legislation. Medicare II: more than a lot
of statistics. The New Yorker. July 9, 1966.
Health, United States, 1999. National Center for Health Statistics. Hyattsville, MD: 1999.
Ives DG, et al. Impact of Medicare reimbursement on influenza
vaccination rates in the elderly. Preventive Medicine, 1994; 23:
134-141.
Lurie N, et al. Preventive care: Do we practice what we preach?
Am J Public Health, 1987, July; 77(7): 801-4.
Manton, K, et al. Chronic disability trends in elderly United
States populations: 1982-1994. Proceedings of the National Academy of Sciences. 1994: 2593-98.
National Center for Health Statistics. Volume of physician visits by
place of visit and type of service. U.S. July 1963-June 1964. Series
10, no. 18.
National Center for Health Statistics. Physician visits. Volume and interval since last visit. U.S. 1971. Series 10, no. 97.
Stevens, Rosemary. Health care in the early 1960s. Health Care Financing Review Winter 1996.
P A G E 5 9 P R O F I L E S O F M E D I C A R E B E N E F I C I A R I E S
Acknowledgements: This Profile of Medicare was prepared by a number of HCFA and HHS staff including:
Gerry Adler, Nicole Carey, Nancy De Lew, Frank Eppig, Dave Gibson, Catherine Gordon, Robert Jasak, Helen Lazenby, Linda Lebovic,
Katharine Levit, Vadim Lubarsky, Rick McNaney, Solomon Mussey, Andrew Shatto, Richard Sorian (consultant), and Lynnette Williams.
P A G E 6 0 P R O F I L E S O F M E D I C A R E B E N E F I C I A R I E S