medicare hospice policy issues - medpac.gov
TRANSCRIPT

Medicare hospice policy issues
Kim Neuman and Sara SadownikApril 4, 2013
2
Roadmap
Background
Hospice payment reform
Hospices with high live discharge rates
Hospice in nursing facilities

3
Commission’s prior analysis on hospice Analyses found over the period from 2000-2007: Medicare hospice spending more than tripled Number of hospice patients nearly doubled Number of providers grew by ~45%, mostly for-profits ALOS increased ~50% due to growth in very long stays Higher profit margins among hospices with longer stays For-profits had longer stays than nonprofits
Panel of hospice physicians and staff gave reports of: Lax admission and recertification practices at some
hospices Concerns about financial arrangements between some
hospices and nursing homes
4
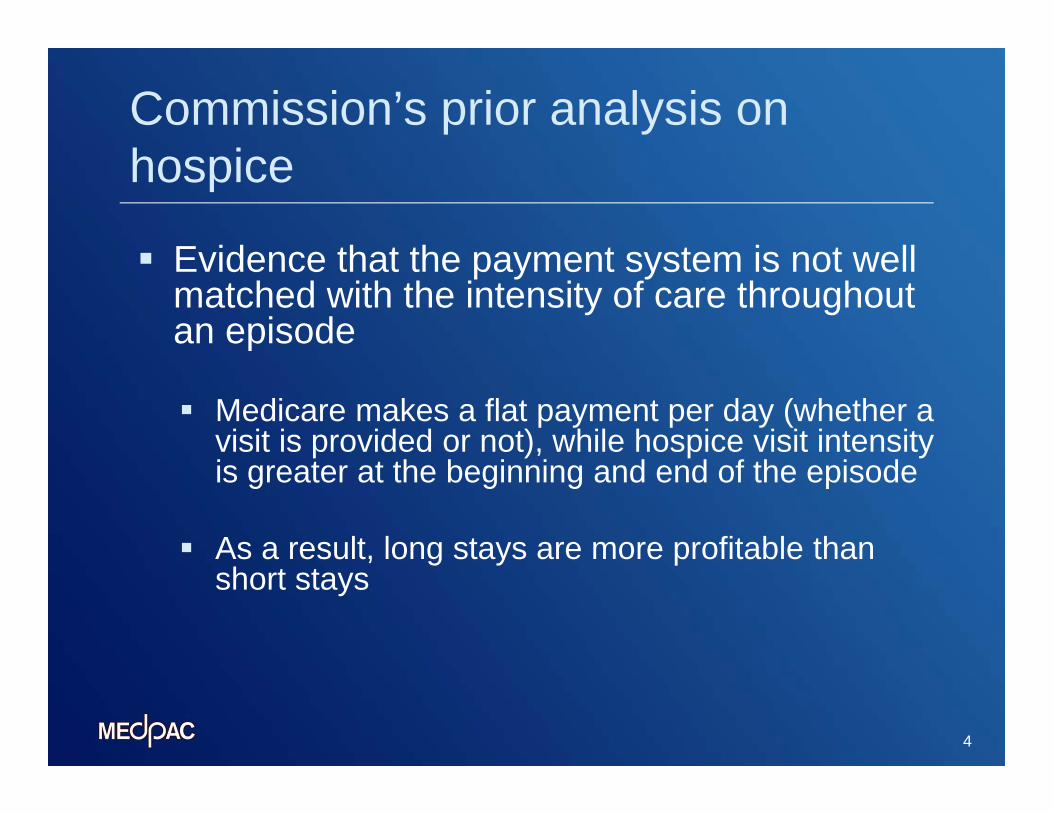
Commission’s prior analysis on hospice
Evidence that the payment system is not well matched with the intensity of care throughout an episode
Medicare makes a flat payment per day (whether a visit is provided or not), while hospice visit intensity is greater at the beginning and end of the episode
As a result, long stays are more profitable than short stays

5
Commission’s prior recommendations on hospiceCommission recommendations (March 2009):
Payment system reform (U-shaped curve)
Increased accountability (physician narrative, face-to-face recertification visit, focused medical review, OIG studies on hospice/nursing facility issues)
More data collection (claims, cost report)

More than half of hospice spending in 2011 was for patients with stays exceeding 180 days
Medicare hospice spending 2011 (billions)
All beneficiaries using hospice $13.8 Beneficiaries with LOS>180 days 7.9
Days 1 to 180 2.6 Days 181+ 5.3
Days 181 to 365 2.5Days 366 to 730 1.9Days 731+ 0.8
6Source: MedPAC analysis of Medicare claims data and common Medicare enrollment file from CMS.
Note: LOS (length of stay). Figures are preliminary and subject to change
• Medicare spent about $2.7 billion on additional hospice services for patients who had already received at least 1 year of hospice

7
Hospice payment reform
Commission’s recommendation: Per diem payments higher at the beginning and end of
episode, lower in middle Budget neutral in the first year
PPACA gave CMS the authority to revise the payment system in 2014 or later as the Secretary determines appropriate CMS is researching payment reform, considering
additional data collection (e.g., DME, supplies, drugs), and considering cost report changes

8
Claims data are available to estimate the labor cost of visits
Claims data are available on date and length of: Hospice visits for 6 types of staff (nurses, aides, social
workers, PT, OT, and ST) Social worker phone calls
Using BLS data on wages and benefits, we can estimate labor cost of visits per day and map out the trajectory of the U-shaped curve

The average labor cost of visits per day follows a U-shaped trajectory
9
$0
$10
$20
$30
$40
$50
$60
$70
$80
$90
10 20 30 40 50 60 70 80 90 100 110 120 130 140 150Day of episode
143045607590120150
Patients’ LOS
(days):
Note: Data only include routine home care days for patients discharged deceased. Visit time data on which the estimates are based include time spent caring for the patient and exclude documentation and travel time. Figures are preliminary and subject to change.Source: MedPAC analysis of Medicare claims data and common Medicare enrollment file from CMS, and wage and benefits data from BLS.
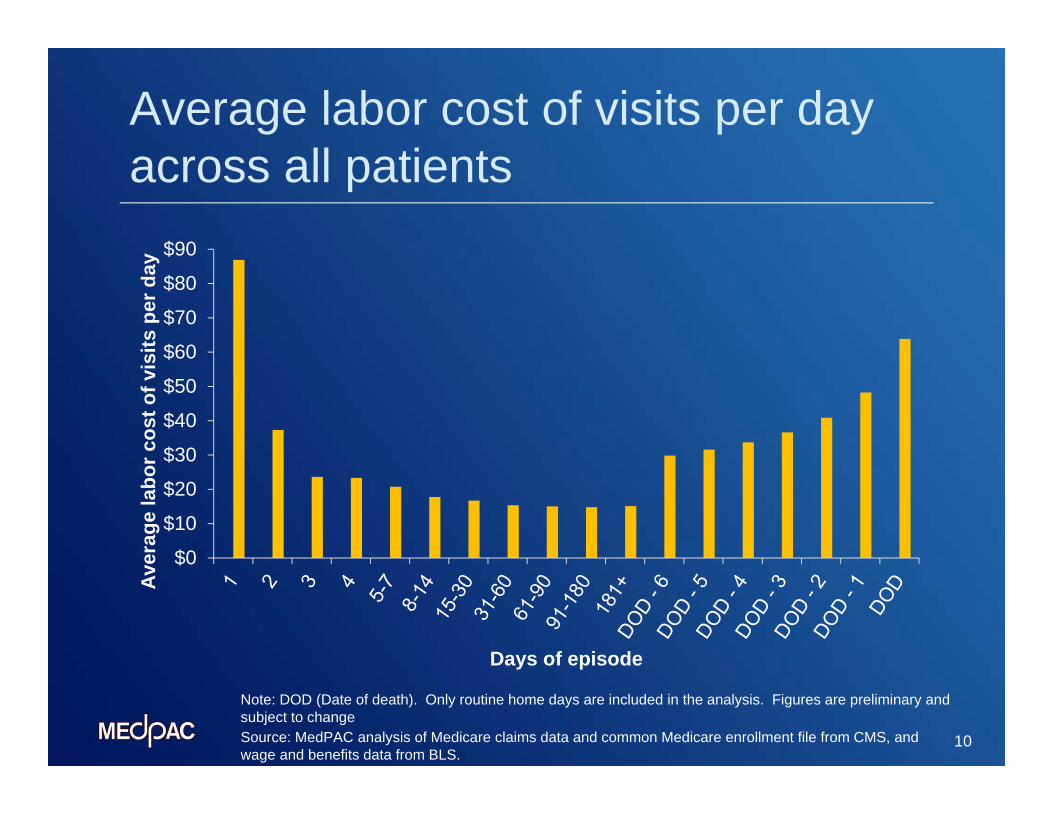
Average labor cost of visits per day across all patients
$0
$10
$20
$30
$40
$50
$60
$70
$80
$90
Aver
age
labo
r cos
t of v
isits
per
day
Days of episode
10
Note: DOD (Date of death). Only routine home days are included in the analysis. Figures are preliminary and subject to changeSource: MedPAC analysis of Medicare claims data and common Medicare enrollment file from CMS, and wage and benefits data from BLS.
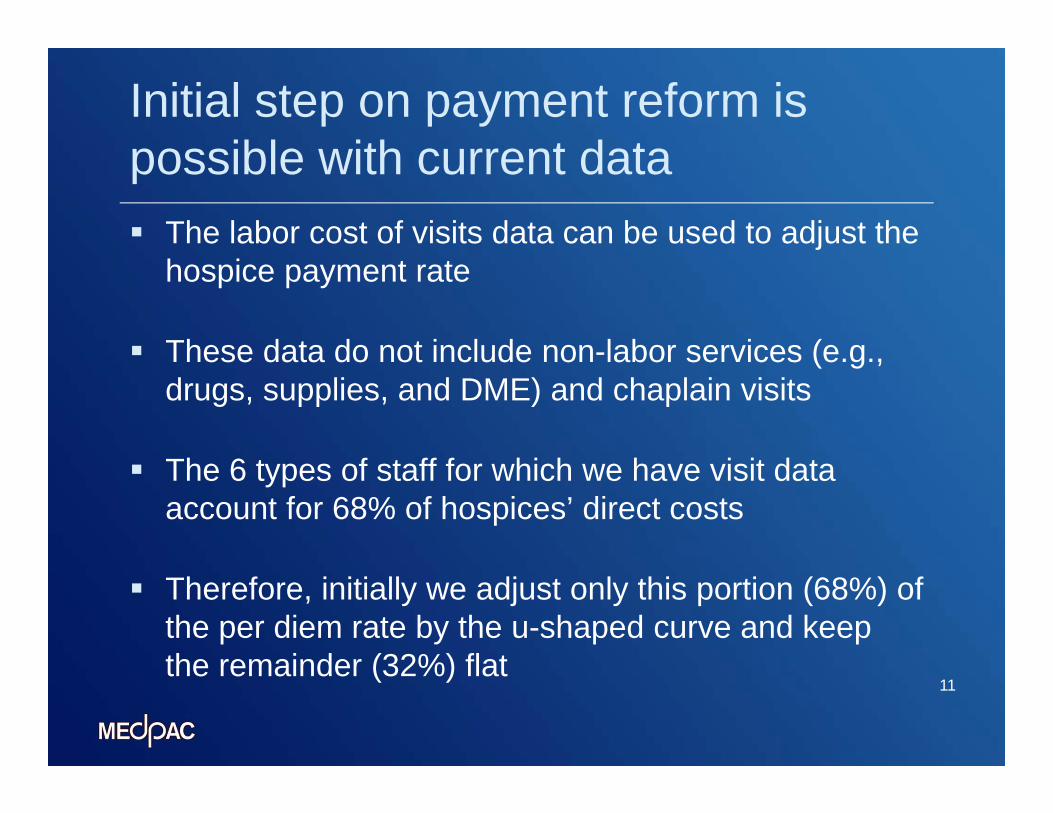
Initial step on payment reform is possible with current data
11
The labor cost of visits data can be used to adjust the hospice payment rate
These data do not include non-labor services (e.g., drugs, supplies, and DME) and chaplain visits
The 6 types of staff for which we have visit data account for 68% of hospices’ direct costs
Therefore, initially we adjust only this portion (68%) of the per diem rate by the u-shaped curve and keep the remainder (32%) flat

12
Illustrative example of potential revised payment system
DaysRelative weight
Per diem payment rate adjusting 68% of base rate ($153)
Percent change from current rate
1 to 7 1.97 $255 66%8 to 14 1.01 155 1%
15 to 30 .95 148 -4%
31+ .86 139 -10%Each of last 7 days
1.15 add-on to applicable
weight above
$120 add-on to applicable rate
above
68 % - 144%depending on
LOS
Note: LOS (length of stay). Payment rates under illustrative model apply to routine home care only. Payment add-on for the last seven days applies for patients discharged deceased. Payment rates are rounded to nearest dollar. Figures are preliminary and subject to change
Source: MedPAC illustrative example of payment reform model.

13
Impacts of illustrative payment model by length of stay
Provider quintile: share of cases > 180 days
Percent change in payments(all hospices)
Actual 2010 margin (freestanding)
Estimated 2010 margin w/ illustrative model (freestanding)
Lowest 6.7 -1.2 4.2Second 2.9 5.9 7.9Third -0.3 12.2 11.7Fourth -2.0 15.6 13.7Highest -3.7 17.1 13.8
Note: Figures are preliminary and subject to change
Source: MedPAC analysis of the effects of illustrative payment model based on analysis of hospice claims, Medicare common enrollment file, and provider of services file from CMS.
• Under the illustrative model, payments would increase by more than 2% for the majority of provider-based (70%), nonprofit (61%), and rural (52%) hospices

14
Conclusions on payment reform
Effects of illustrative payment model are in the expected direction, but modest
Larger changes in payments might be needed to eliminate the higher profitability of long stays
But, a first step in that direction is possible now with current data
Additional changes could be considered later if additional data (e.g., data on non-labor costs or chaplain visits) become available
15
Live discharge analysis: Background
Not every live discharge should be prevented Many potential reasons Concern with providers seeking patients with
very long stays High rates of live discharge among some providers
may indicate questionable business practices

16
Live discharge rates
In 2010, 14% of hospice episodes among all beneficiaries (1.2M episodes) ended in live discharge
Live discharge rate by provider, 2010
1st quartile 11%2nd quartile 17%3rd quartile 25%4th quartile 38%
Source: Acumen analysis of Medicare claims data.
Figures preliminary and subject to change
For-profit hospices 20% more likely than non-profit hospices to discharge patients alive
Above-cap hospices 2x as likely as hospices below the cap to discharge patients alive

17
Long stays in hospice tied to long survival post-discharge 1/3 of all live discharges spent 180+ days in hospice
before discharge Most patients in hospice 180+ days before discharge
had long survival post-discharge 73% alive at 180 days; 56% alive 1 year later
Patients alive 1 year after discharge spent an average 213 days in hospice before discharge $1.2B in Medicare payments for first episode
Patients discharged alive from above-cap hospices ~20% more likely to be alive 180 days after discharge
Figures preliminary and subject to change

18
Spending
For patients with long stays before discharge, average post-discharge spending is less than the hospice payment rate Average payment rate for hospice = $156 / day Spending after hospice for patients who were in
hospice 180+ days before discharge = $70 / day Data supports ensuring that patients are
appropriate candidates for hospice before admission and throughout long episodes
Figures preliminary and subject to change

19
Live discharge summary
Key findings: Long stays before discharge tied to long survival
post-discharge Findings support ensuring that patients are
appropriate candidates before admission and throughout long episodes
High rates of live discharge among some providers may indicate questionable business practices

20
OIG recommended a reduction to hospice payment rate in nursing facilitiesOIG study of hospices that focus on nursing facility patients (2011) found:
These hospices are more likely to be for-profit and treat patients with diagnoses likely to have long stays and have a less complex service mix
OIG recommended: (1) CMS monitor these hospices(2) CMS reduce the payment rate for hospice in nursing facilities
In making the 2nd recommendation, OIG raised the issue of duplicate payment for aide services in nursing homes

21
Hospices provide more aide visits in nursing facilities than the home Nursing facility residents receive more aide visits from
hospice staff than patients at home
Not clear why this occurs since nursing facility residents have access to assistance with activities of daily living through nursing facility staff
If comparable amounts of aide visits were provided in the two settings, the average labor cost of all types of visits combined would be 4 to 7 percent lower in nursing facilities than the home

22
Potential policy option on payment for hospice in nursing facilities Could consider reducing a portion of the hospice
payment rate in nursing facilities based on estimates of the labor cost of visits in the two settings assuming equal provision of aide visits
This would yield a reduction to the hospice payment rate in nursing facilities in the range of 3% to 5%

Summary
Medicare spending on long hospice stays is substantial
PPACA medical review provision should be implemented
Initial step on hospice payment reform is possible with current data
Hospices with high live discharge rates warrant monitoring
Payment reduction for hospice care in nursing facilities could be considered
23