mediobanca presentation - 2010
DESCRIPTION
Mediobanca Presentation - 2010TRANSCRIPT

London, 28 September 2010
Banking & Insurance CEO Conference
“Competing in the age of austerity”
2
Mediobanca well positioned in the “new world”
Mediobanca business model has proved sound and efficient during the crisis
No deleveraging, public or private funds, ECB financing needed
High liquidity and solidity consistently assured, high resilience of income
Market positioning and distribution strengthened in all businesses
Competitive landscape expected to change profoundly
Macro economic and financial scenario still fragile
Regulators expected to reshape the market
Mediobanca well positioned in the “new world”
High reputation and capital base
Business model already compliant with new rules
Revenues enhancement equity story
MB Group
3
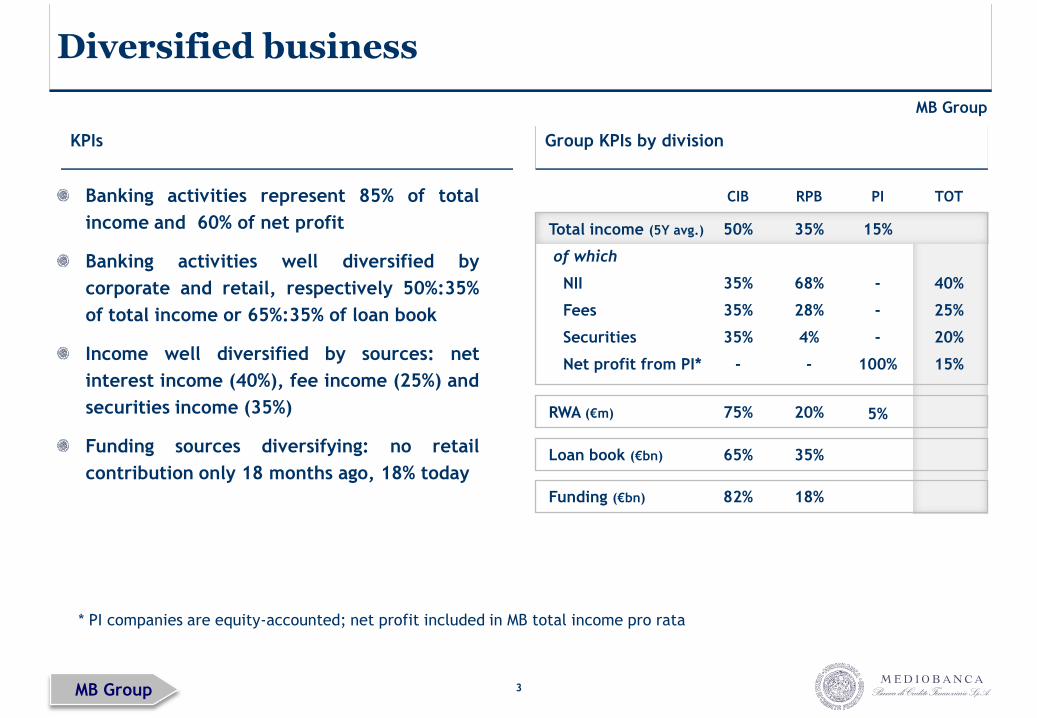
Diversified business
Group KPIs by divisionKPIs
Banking activities represent 85% of total
income and 60% of net profit
Banking activities well diversified by
corporate and retail, respectively 50%:35%
of total income or 65%:35% of loan book
Income well diversified by sources: net
interest income (40%), fee income (25%) and
securities income (35%)
Funding sources diversifying: no retail
contribution only 18 months ago, 18% today
CIB PI
Total income (5Y avg.)
of which
NII
Fees
Securities
Net profit from PI*
50%
35%
35%
35%
-
15%
-
-
-
100%
RPB
35%
68%
28%
4%
-
RWA (€m) 75% 5%20%
Loan book (€bn) 65% 35%
TOT
40%
25%
20%
15%
82% 18%Funding (€bn)
* PI companies are equity-accounted; net profit included in MB total income pro rata
MB Group
MB Group
4
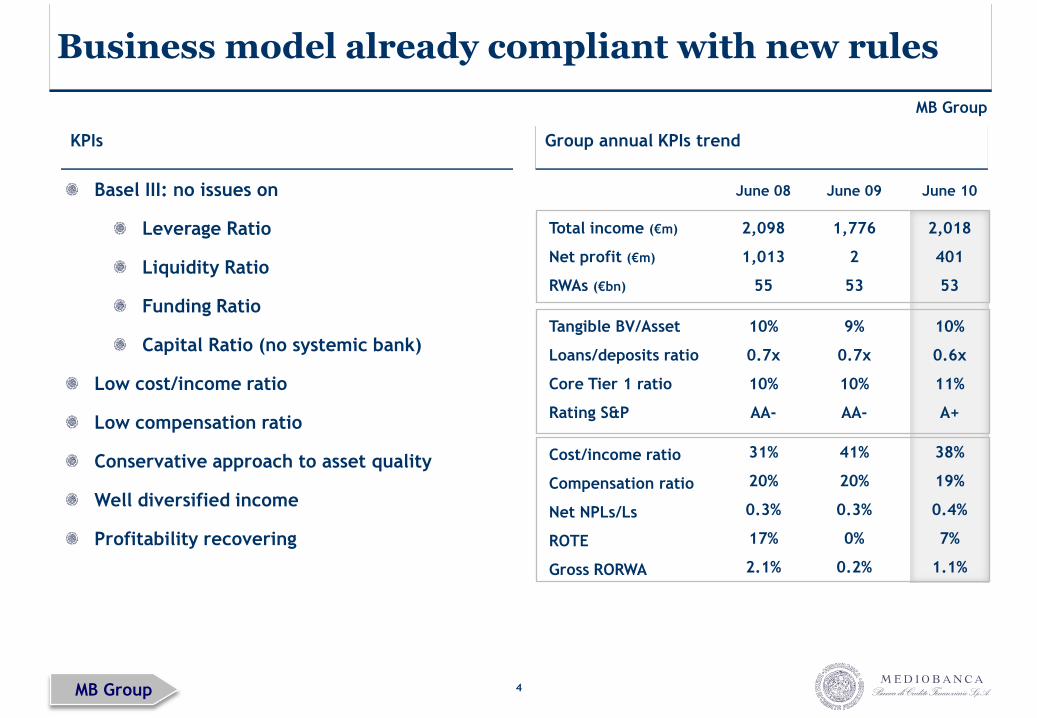
Business model already compliant with new rules
Group annual KPIs trendKPIs
June 09
Total income (€m)
Net profit (€m)
RWAs (€bn)
1,776
2
53
June 08
2,098
1,013
55
Tangible BV/Asset
Loans/deposits ratio
Core Tier 1 ratio
Rating S&P
9%
0.7x
10%
AA-
10%
0.7x
10%
AA-
Cost/income ratio
Compensation ratio
Net NPLs/Ls
ROTE
Gross RORWA
41%
20%
0.3%
0%
0.2%
31%
20%
0.3%
17%
2.1%
June 10
2,018
401
53
10%
0.6x
11%
A+
38%
19%
0.4%
7%
1.1%
Basel III: no issues on
Leverage Ratio
Liquidity Ratio
Funding Ratio
Capital Ratio (no systemic bank)
Low cost/income ratio
Low compensation ratio
Conservative approach to asset quality
Well diversified income
Profitability recovering
MB Group
MB Group
5
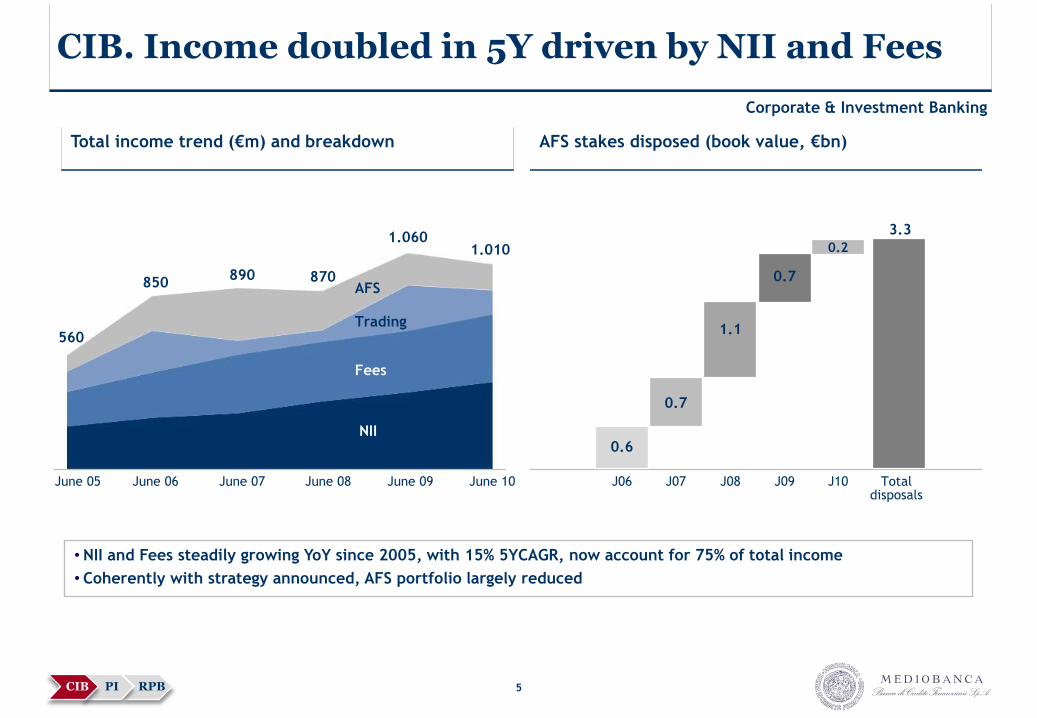
CIB. Income doubled in 5Y driven by NII and Fees
AFS stakes disposed (book value, €bn)Total income trend (€m) and breakdown
• NII and Fees steadily growing YoY since 2005, with 15% 5YCAGR, now account for 75% of total income
• Coherently with strategy announced, AFS portfolio largely reduced
June 10June 09June 08June 07June 06June 05
NII
Fees
Trading
AFS
1.010 1.060
870890850
560
J06 Totaldisposals
0.6
3.3
J07 J08 J09 J10
1.1
0.2
0.7
0.7
RPBPICIB
Corporate & Investment Banking

6
CIB 2010 results : strong 2009 results confirmed
CIB key 2010 trends:
Improved margins: despite 8% reduction in
loan book, NII up 13%, driven by asset re-pricing
and treasury yield enhancement; fees up 10%
Asset quality preserved: cost of risk at 70bps,
back down to June 2009 levels; gross bad loans
reducing in corporate; NPL/Ls at 0.2%
Front office and control staff enhanced:staff employed outside Italy up 27% (to 94), staff
to support corporate activity up 3%; cost/income
ratio 30%
Improved banking results (NII + fees up 12%,
coupled with 13% LLPs reduction) allowed net
profit to grow (6%, to €243m), offsetting weak
securities performance: lower trading
income (negative in 2Q10, reflecting sovereign
debt crisis), and reduced but still material
(€136m) equity writedowns
Main trends KPIs (€m)
Total revenues
NII + Fees
Trading +AFS
Loans (€bn)
1,006
761
245
21.1
-5%
+12%
-36%
-8%
1,061
680
381
23.1
June10
12m
June 09
12m
D
09/10
28%
75
Cost/income
LLPs/Ls (bps)
30%
70
Total costs
Loan provisions
AFS writedowns
Net profit
(302)
(179)
(203)
230
-
-13%
-33%
+6%
(303)
(156)
(136)
243
874
626
248
22.7
June 08
12m
32%
16
(277)
(36)
0
464
Employees (no.) 882 +4850 788
Corporate & Investment Banking
RPBPICIB
7
Consumer credit: Compass
Consumer credit
RPBPICIB
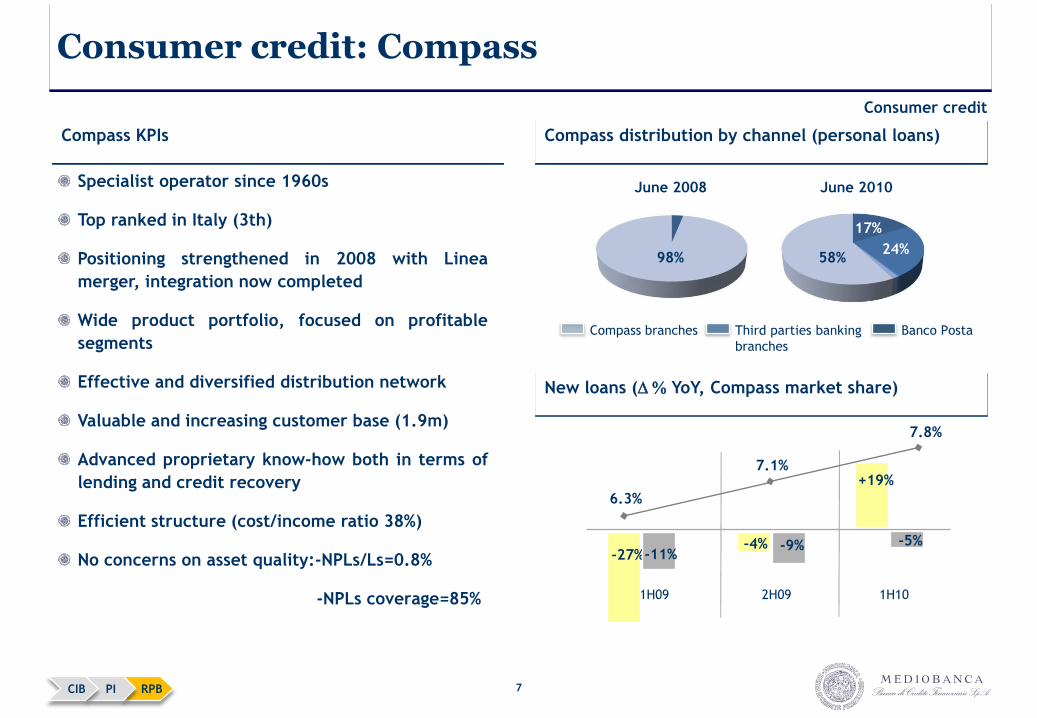
Specialist operator since 1960s
Top ranked in Italy (3th)
Positioning strengthened in 2008 with Linea
merger, integration now completed
Wide product portfolio, focused on profitable
segments
Effective and diversified distribution network
Valuable and increasing customer base (1.9m)
Advanced proprietary know-how both in terms of
lending and credit recovery
Efficient structure (cost/income ratio 38%)
No concerns on asset quality:-NPLs/Ls=0.8%
-NPLs coverage=85%
Compass KPIs Compass distribution by channel (personal loans)
June 2008 June 2010
58%
17%
98%24%
Banco PostaThird parties banking
branches
Compass branches
New loans (D % YoY, Compass market share)
1H09 2H09 1H10
-27%-4%
+19%
-11%-9% -5%
6.3%
7.8%
7.1%
8
Consumer lending: sustainable growth confirmed
RPBPICIB
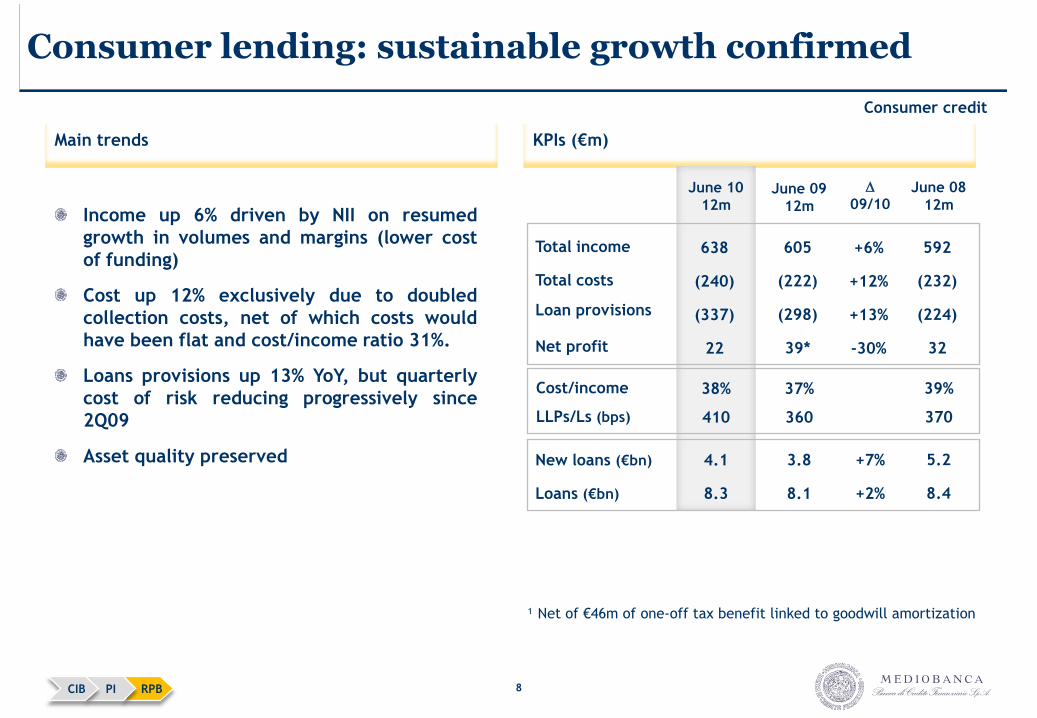
Income up 6% driven by NII on resumed
growth in volumes and margins (lower cost
of funding)
Cost up 12% exclusively due to doubled
collection costs, net of which costs would
have been flat and cost/income ratio 31%.
Loans provisions up 13% YoY, but quarterly
cost of risk reducing progressively since
2Q09
Asset quality preserved
KPIs (€m)Main trends
June 09
12m
June 10
12m
D
09/10
3.8
8.1
New loans (€bn)
Loans (€bn)
+7%
+2%
4.1
8.3
Total income
Total costs
Loan provisions
Net profit
605
(222)
(298)
39*
+6%
+12%
+13%
-30%
638
(240)
(337)
22
37%
360
Cost/income
LLPs/Ls (bps)
38%
410
June 08
12m
5.2
8.4
592
(232)
(224)
32
39%
370
¹ Net of €46m of one-off tax benefit linked to goodwill amortization
Consumer credit
9
Retail banking: funding arm
RPBPICIB
Retail Banking
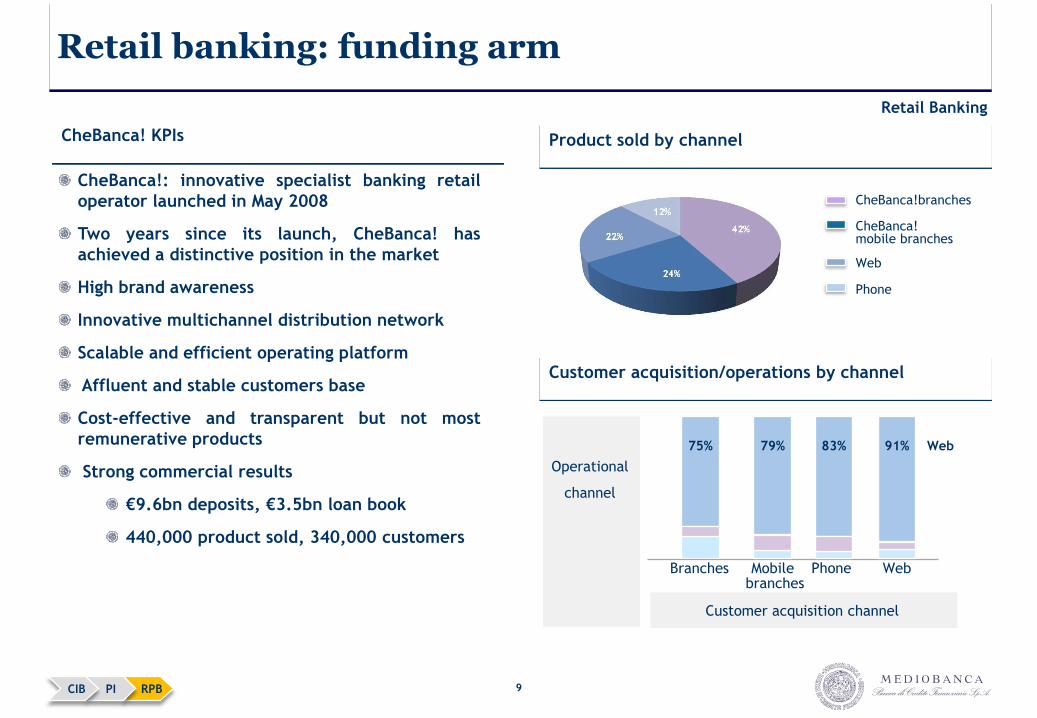
CheBanca!: innovative specialist banking retail
operator launched in May 2008
Two years since its launch, CheBanca! has
achieved a distinctive position in the market
High brand awareness
Innovative multichannel distribution network
Scalable and efficient operating platform
Affluent and stable customers base
Cost-effective and transparent but not most
remunerative products
Strong commercial results
€9.6bn deposits, €3.5bn loan book
440,000 product sold, 340,000 customers
CheBanca! KPIs Product sold by channel
Customer acquisition/operations by channel
75%
WebBranches PhoneMobilebranches
91%83%79%
Operational
channel
Customer acquisition channel
CheBanca!branches
CheBanca!mobile branches
Web
Phone
Web
10
CheBanca! deposits scaling up at reducing cost
RPBPICIB
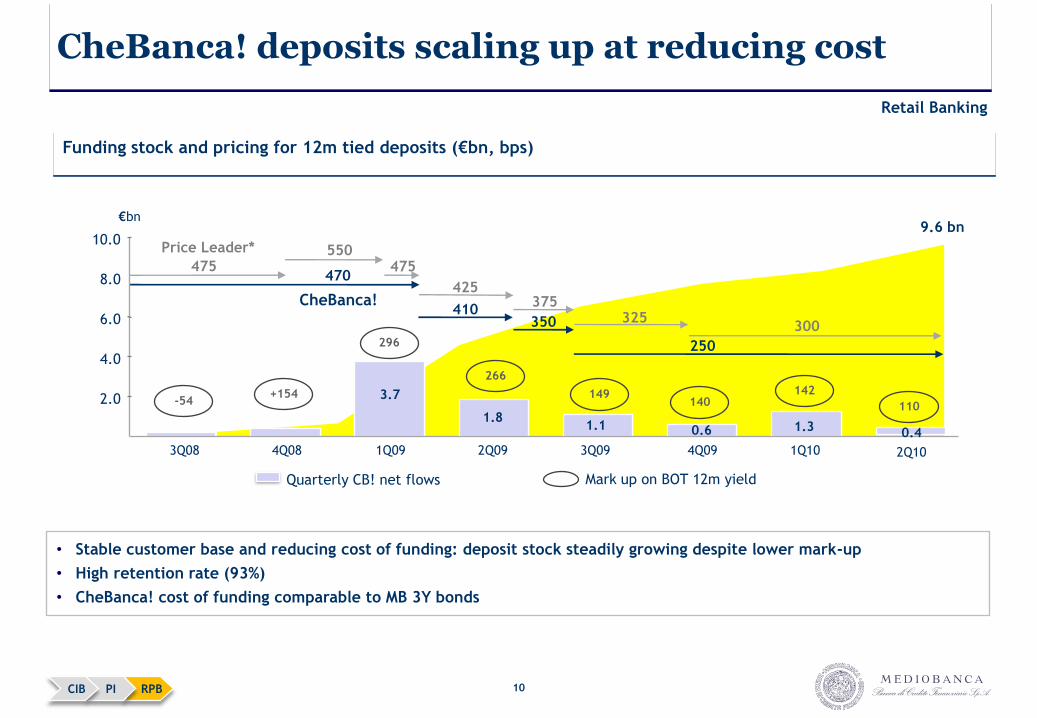
• Stable customer base and reducing cost of funding: deposit stock steadily growing despite lower mark-up
• High retention rate (93%)
• CheBanca! cost of funding comparable to MB 3Y bonds
Funding stock and pricing for 12m tied deposits (€bn, bps)
Price Leader*
CheBanca!
-54+154
296
Mark up on BOT 12m yield
9.6 bn
1.30.61.11.8
3.72.0
4.0
6.0
8.0
10.0
3Q08 4Q08 1Q09 2Q09 3Q09 4Q09 1Q10
€bn
Quarterly CB! net flows
475550
375
300
470
325
475
425
410
250
350
142 140
149
266
0.4
2Q10
110
Retail Banking
11
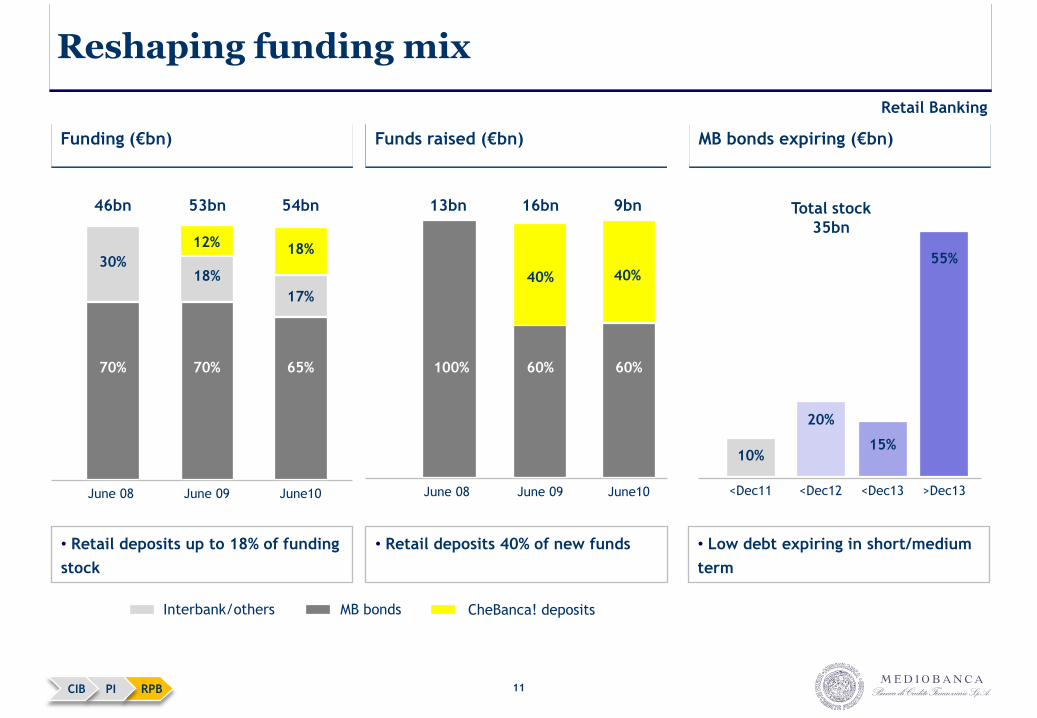
Reshaping funding mix
MB bonds CheBanca! depositsInterbank/others
Funding (€bn)
17%
June10
65%
18%
June 09
70%
30%
June 08
70%
54bn
• Retail deposits up to 18% of funding
stock
12% 18%
53bn46bn
• Retail deposits 40% of new funds
Funds raised (€bn)
June10
60%
June 09
60%
June 08
100%
9bn
40%
16bn13bn
40%
MB bonds expiring (€bn)
<Dec11 <Dec12
10%
Total stock
35bn
15%
<Dec13
55%
>Dec13
• Low debt expiring in short/medium
term
20%
RPBPICIB
Retail Banking
12
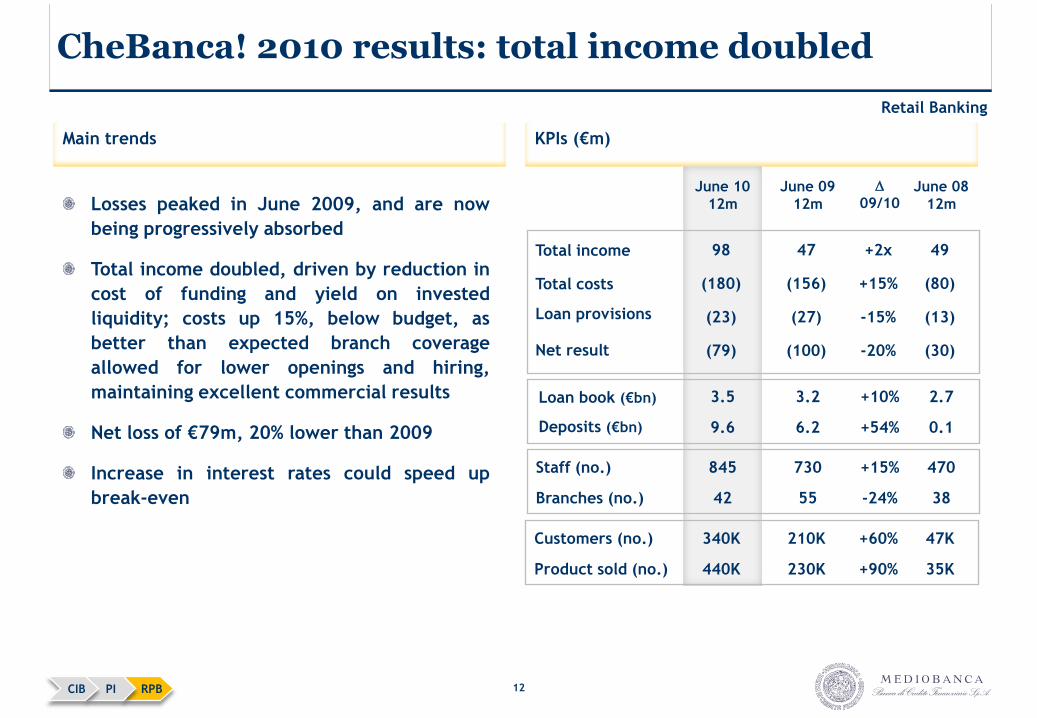
CheBanca! 2010 results: total income doubled
RPBPICIB
KPIs (€m)
Losses peaked in June 2009, and are now
being progressively absorbed
Total income doubled, driven by reduction in
cost of funding and yield on invested
liquidity; costs up 15%, below budget, as
better than expected branch coverage
allowed for lower openings and hiring,
maintaining excellent commercial results
Net loss of €79m, 20% lower than 2009
Increase in interest rates could speed up
break-even
Main trends
3.2
6.2
Loan book (€bn)
Deposits (€bn)
+10%
+54%
3.5
9.6
June 09
12m
June 10
12m
D
09/10
730
55
Staff (no.)
Branches (no.)
+15%
-24%
845
42
Total income
Total costs
Loan provisions
Net result
47
(156)
(27)
(100)
+2x
+15%
-15%
-20%
98
(180)
(23)
(79)
2.7
0.1
June 08
12m
470
38
49
(80)
(13)
(30)
210K
230K
Customers (no.)
Product sold (no.)
+60%
+90%
340K
440K
47K
35K
Retail Banking
13
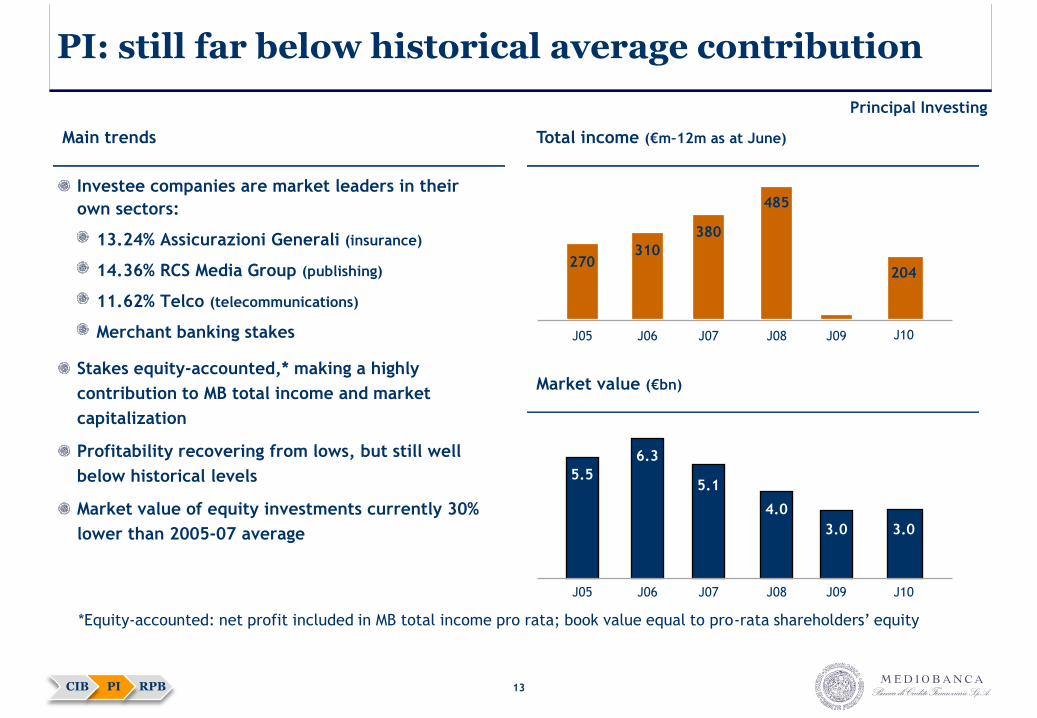
PI: still far below historical average contribution
RPBPICIB
Principal Investing
310
380
485
204270
J06 J07 J08 J09J05 J10
5.1
4.0
3.0 3.0
5.5
6.3
J06 J07 J08 J09J05 J10
Investee companies are market leaders in their
own sectors:
13.24% Assicurazioni Generali (insurance)
14.36% RCS Media Group (publishing)
11.62% Telco (telecommunications)
Merchant banking stakes
Stakes equity-accounted,* making a highly
contribution to MB total income and market
capitalization
Profitability recovering from lows, but still well
below historical levels
Market value of equity investments currently 30%
lower than 2005-07 average
Main trends
Market value (€bn)
Total income (€m–12m as at June)
*Equity-accounted: net profit included in MB total income pro rata; book value equal to pro-rata shareholders’ equity
14
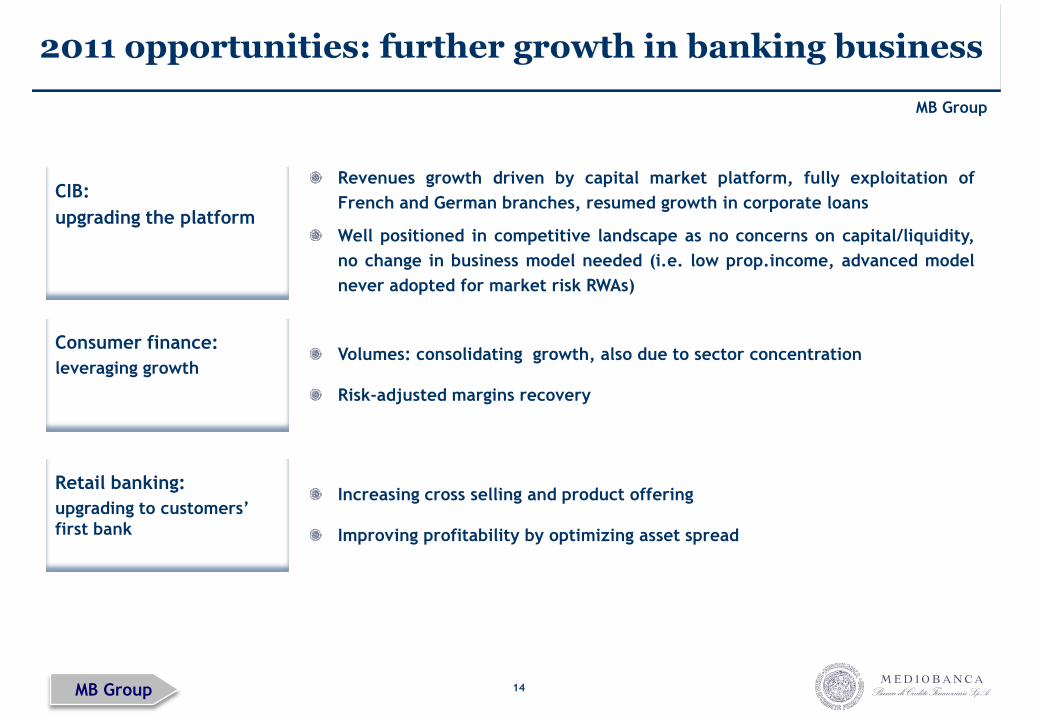
2011 opportunities: further growth in banking business
MB Group
Consumer finance:
leveraging growthVolumes: consolidating growth, also due to sector concentration
Risk-adjusted margins recovery
Retail banking:
upgrading to customers’
first bank
Increasing cross selling and product offering
Improving profitability by optimizing asset spread
CIB:
upgrading the platform
Revenues growth driven by capital market platform, fully exploitation of
French and German branches, resumed growth in corporate loans
Well positioned in competitive landscape as no concerns on capital/liquidity,
no change in business model needed (i.e. low prop.income, advanced model
never adopted for market risk RWAs)
MB Group


16
This presentation contains certain forward-looking statements, estimates and targets with respect to
the operating results, financial condition and business of the Mediobanca Banking Group. Such
statements and information, although based upon Mediobanca’s best knowledge at present, are
certainly subject to unforeseen risk and change. Future results or business performance could differ
materially from those expressed or implied by such forward-looking statements and forecasts. The
statements have been based upon a reference scenario drawing on economic forecasts and
assumptions, including the regulatory environment.
Declaration by Head of Company Financial Reporting
As required by Article 154-bis, paragraph 2 of Italian Legislative Decree 58/98, the undersigned hereby
declares that the stated accounting information contained in this report conforms to the documents,
account ledgers and book entries of the company.
Head of Company Financial Reporting
Massimo Bertolini
Disclaimer
17
Mediobanca Group
Investor Relations
Piazzetta Cuccia 1, 20121 Milan, Italy
Tel. no.: (0039) 02-8829.860 / 647
Fax no.: (0039) 02-8829.550
Email: [email protected]
http://www.mediobanca.it
Investor contact details