medium range ensembles flood forecasts for community level applications
TRANSCRIPT

Bapon Fakhruddin, PhD
Medium Range Ensembles Flood Forecasts for Community Level Applications
8 July 2015|4.1 Piha Meeting Room (16) (L)

Outlines
2
• Background & Objective
• Risk & Vulnerabilities- Agriculture
• Methodology
• Analysis & Results
• Runoff Prediction & Performance
• Flood Risk Map
• Impact Outlook
• Conclusion

Background & Problem Statement
• Despite advances in forecasting, most cases warning system fails (Parker
et al., 2009)
• Generation of long lead flood forecasts is highly challenging and
uncertain. Thus there is very limited application of it. (Fakhruddin, et.al
2012)
• A decision making process is essential in a social context where roles
and responsibilities are clearly shared for appropriate response (Morss
& Wahlb 2007)
3
The major objective of the program is to increase the lead time for flood
forecasting for agriculture risk management.
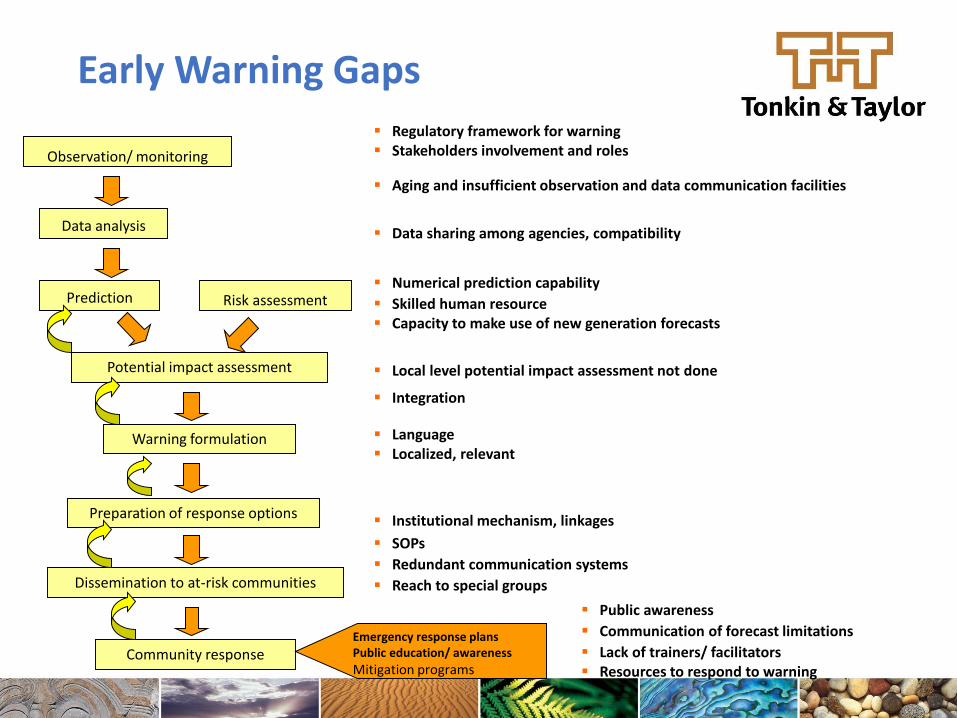
Early Warning Gaps
Dissemination to at-risk communities
Observation/ monitoring
Warning formulation
Community response
Data analysis
Prediction Risk assessment
Emergency response plansPublic education/ awareness
Mitigation programs
Potential impact assessment
Preparation of response options
Aging and insufficient observation and data communication facilities
Numerical prediction capability
Skilled human resource Capacity to make use of new generation forecasts
Local level potential impact assessment not done
Integration
Language Localized, relevant
Institutional mechanism, linkages
SOPs
Redundant communication systems
Reach to special groups
Data sharing among agencies, compatibility
Public awareness
Communication of forecast limitations
Lack of trainers/ facilitators Resources to respond to warning
Regulatory framework for warning Stakeholders involvement and roles

Vulnerability and Risk Assessment
Hydrology
Crop Crop -Season
Jan-March April-June Jul-Sep Oct-Dec
Robi (dry) Kharif -I Kharif II Robi (dry)
Crop
Aus S H
T. Aman S H
Boro
0
100
200
300
400
500
600
700
0
10
20
30
40
50
60
70
80
90
Jan Feb Mar Apr May Jun Jul Aug Sep Oct Nov Dec
Rain
fall
(mm
)
Wate
r Level
(mete
r-P
WD
)
Water Level Rainfall
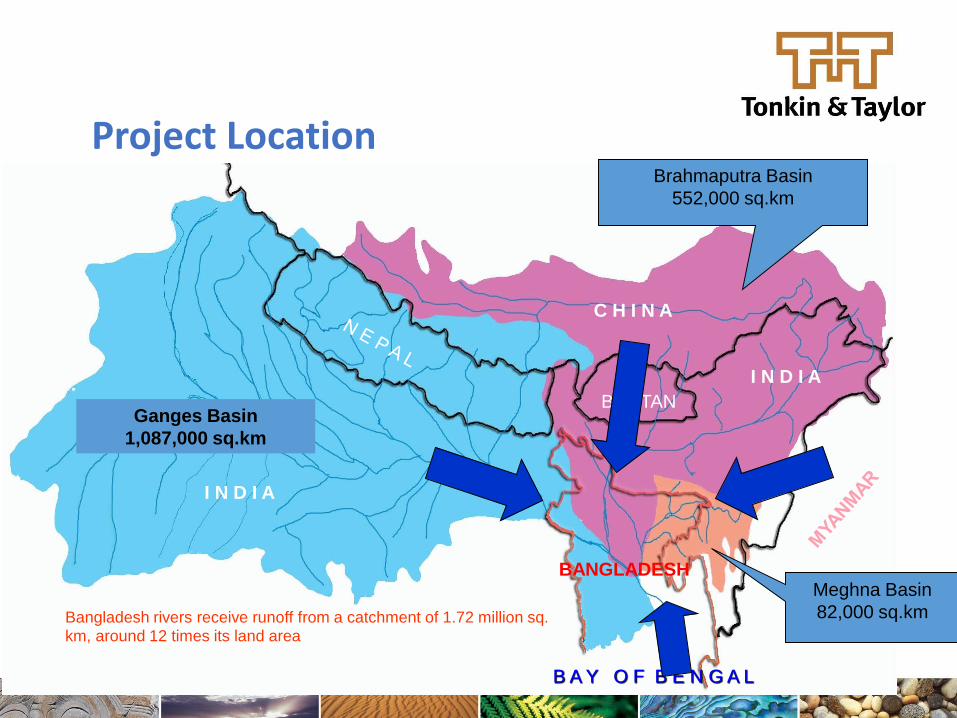
Project Location
Meghna Basin
82,000 sq.km
Brahmaputra Basin
552,000 sq.km
Ganges Basin
1,087,000 sq.km
B A Y O F B E N G A L
BHUTAN
I N D I A
C H I N A
BANGLADESH
I N D I A
Bangladesh rivers receive runoff from a catchment of 1.72 million sq. km, around 12 times its land area

Topography of Bangladesh
• About 50% of the country within 6-7 m of MSL.
• About 68% of the country vulnerable to flood.
• 25 to 30% areas inundated in normal flood

History of Flooding

Methodology- Hydrological Models
ECMWF
Operational
ensemble
forecast
NOAA and NASA
(i.e.CMORPH and GPCP)
satellite precipitation & GTS
rain gauge data
Hydrologic model parameters
Discharge data
Downscaling of forecasts
Statistical correction
Hydrological
Model
• Lumped
• Distributed
• Multi-Model
Discharge
Forecasting
• Accounting for
uncertainties
• Final error
correction
• Generation of
discharge
forecast PDF
• Critical level
probability
forecast
(I). Initial Data
Input
(II). Statistical
Rendering
(III). Hydrolog.
Modeling
(IV). Generation of
Probabilistic Q
(V).
Forecast
Product

Initial Data Input
Initial data comes from number of sources and is
used to either drive the forecasts (e.g.,ECMWF
EPS), correct the forecasts and provide
calibration of the basin discharge
Data is passed on for statistical rendering and to force the hydrological models(Webster et al. 2011)

• Forecast downscaled to computation grid 0.5 x 0.5 degree
• Quantile-to-quantile mapping of downscaled forecasts at
each grid point/ forecast lead time using “Kernel approach”
Statistical Rendering: Correction of EPS systematic error
QR (III)
(I) E (I) S
(Webster et al. 2011)

Vulnerability and Risk Assessment
12
Risk Scoping
Risk
Characterization
Risk Evaluation
Risk Management
Feedback
• Establish target and
criteria through
consultation with
stakeholders
• Identify possible
•Risk event
•Source of stress
•Stress receptors
•Relationship
between sources
and receptor
• Estimate for risk
event and receptor:
•Likelihood of
exposure to
stressors
•Consequences
of exposure to
stress
•Develop risk
profile
•Compare event
and total risks with
targets and criteria
•Assess existing
risk management
practices against
risk profile
•Evaluate
treatment options
•Develop strategy
based on option
(Hay, 2007)
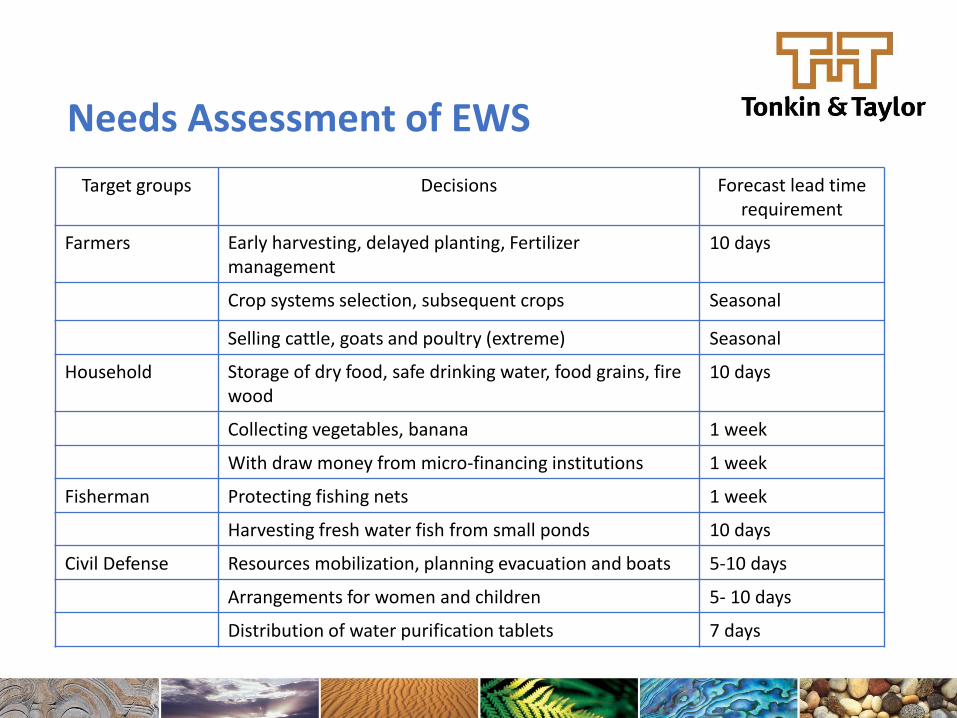
Needs Assessment of EWS
Target groups Decisions Forecast lead time requirement
Farmers Early harvesting, delayed planting, Fertilizer management
10 days
Crop systems selection, subsequent crops Seasonal
Selling cattle, goats and poultry (extreme) Seasonal
Household Storage of dry food, safe drinking water, food grains, fire wood
10 days
Collecting vegetables, banana 1 week
With draw money from micro-financing institutions 1 week
Fisherman Protecting fishing nets 1 week
Harvesting fresh water fish from small ponds 10 days
Civil Defense Resources mobilization, planning evacuation and boats 5-10 days
Arrangements for women and children 5- 10 days
Distribution of water purification tablets 7 days

Ensembles Forecasts for 1-10 Days
7-10 day Ensemble Forecasts 7-10 day Danger Levels
7 day 8 day
9 day 10 day
7 day 8 day
9 day 10 day

Plumes and probability pies for the first Brahmaputra flood July 28-August 6, 2007
Model able to meet three fundamental information needs of communities at risk
Forecast Validation


Forecasts Dissemination
Website
E-mail ( Nationals stakeholders, District and Union Information Centers)
SMS ( SMS to DDMC members in 12 Pilot Unions)
400 stakeholders received
flood early warning during
monsoon through SMS
120 UISCs and 100 different
stakeholders received flood
early warning through e-mail
in local language.

19
Flood Risk Map

Community Response Options

Risk Communications

Community Responses to Flood Forecasts

Economic- Benefits
• In 2008 Flood, Economic Benefits on average per household at pilot areas
• Livestock's = $485 per household
• HH assets = $270 per household
• Agriculture = $180 per household
• Fisheries = $120) per households
• Experiment showed that every USD 1 invested, a return of USD 40.85 in benefits over a ten-year period may be realized (World Bank, 2012).
Average Amount of Saving per Household
0 5000 10000 15000 20000 25000 30000 35000
Save agriculture
Save HH assets
Save Livestock
Save Fishereis
Amount (TK.)

Appreciations
Applications of Medium Range Probabilistic Flood Forecast for Societal Benefits - Lessons Learned from Bangladesh

Thanks you
25
Bapon Fakhruddin
www.shmfakhruddin.net