medium term revenue and expenditure framework …
TRANSCRIPT

MEDIUM TERM
REVENUE AND EXPENDITURE
FRAMEWORK
2013/2014 TO 2015/2016
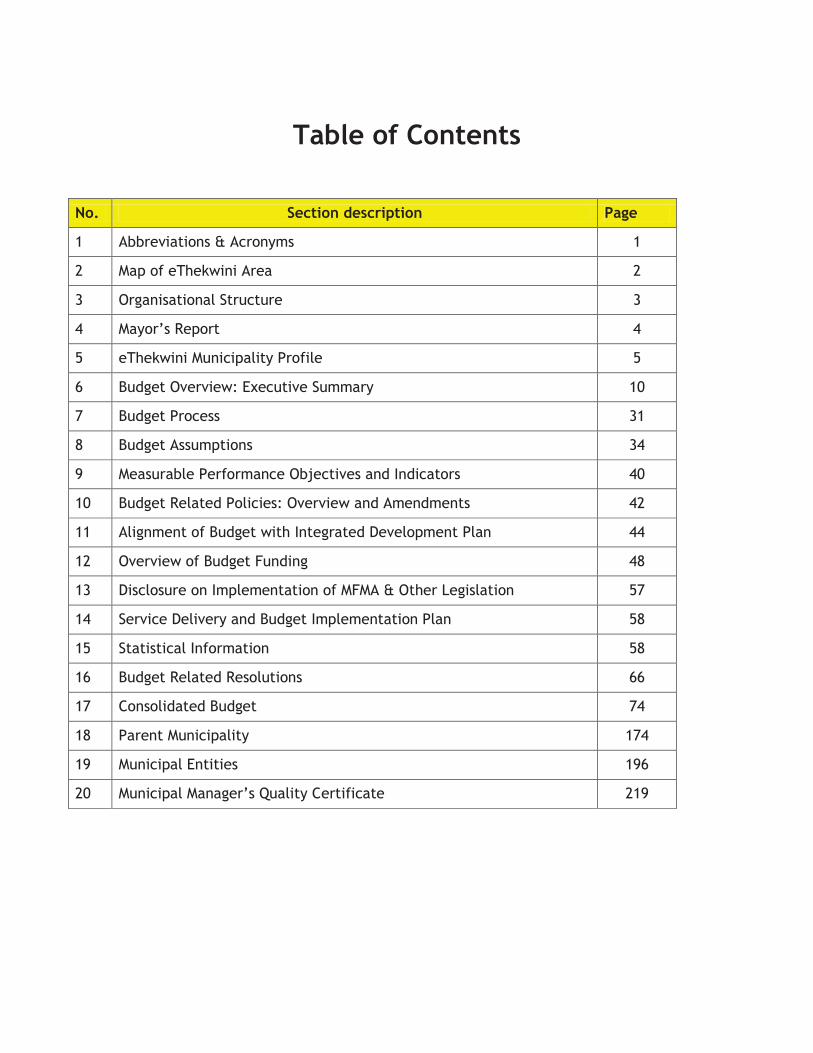
Table of Contents
No. Section description Page
1 Abbreviations & Acronyms 1
2 Map of eThekwini Area 2
3 Organisational Structure 3
4 Mayor’s Report 4
5 eThekwini Municipality Profile 5
6 Budget Overview: Executive Summary 10
7 Budget Process 31
8 Budget Assumptions 34
9 Measurable Performance Objectives and Indicators 40
10 Budget Related Policies: Overview and Amendments 42
11 Alignment of Budget with Integrated Development Plan 44
12 Overview of Budget Funding 48
13 Disclosure on Implementation of MFMA & Other Legislation 57
14 Service Delivery and Budget Implementation Plan 58
15 Statistical Information 58
16 Budget Related Resolutions 66
17 Consolidated Budget 74
18 Parent Municipality 174
19 Municipal Entities 196
20 Municipal Manager’s Quality Certificate 219

1
Abbreviations and Acronyms
CPIX Consumer Price Index DCM Deputy City Manager DoRA Division of Revenue Act DOHS Department of Human Settlements DPLG Department of Provincial and Local Government DTPC Dube Tradeport Corporation EMA EThekwini Municipal Area EXCO Executive Committee GDP Gross Domestic Product GRAP Generally Recognised Accounting Practice IDP Integrated Development Plan IRPTN Integrated Rapid Public Transport Network IT Information Technology Kl Kilolitre Km Kilometre kWh Kilo watt hours KZNPA KwaZulu-Natal Provincial Administration MFMA Municipal Finance Management Act MPRA Municipal Property Rates Act MSFM Municipal Services Financial Model MTREF Medium-term Revenue and Expenditure Framework MW Megawatt NERSA National Electricity Regulator South Africa NT National Treasury PPP Private Public Partnership SALGA South African Local Government Association SDBIP Service Delivery and Budget Implementation Plan TEU Twenty-foot Equivalent Unit TIKZN Trade and Investment KwaZulu-Natal

2
Map of Ethekwini Area

ETHEKWINI MUNICIPALITY
3
EXCO
CITY MANAGER
DCM
COMMUNITY & EMERGENCY
SERVICES
DCM
PROGRAMME MANAGEMENT
DCM
FINANCE
DCM
GOVERNANCE &
INTERNATIONAL RELATIONS
DCM
CORPORATE & HUMAN RESOURCES
DCM
HUMAN SETTLEMENTS &
INFRASTRUCTURE
DCM
ECONOMIC DEVELOPMENT &
PLANNING

4
4. MAYORS REPORT (BUDGET SPEECH) Cities are the lifeblood of nations. The prosperity and future growth of nations is inextricably linked with the growth and development prospects of their Cities. If South Africa is to prosper and grow into the future, its success is dialectically connected with the performance of its cities. If KZN is to prosper as a Province, this will only become possible if its cities are doing well. It is therefore a truism that the performance of eThekwini Municipality is one of the central barometers for measuring the development and growth prospects of not only the people of eThekwini, but also the province as a whole and logically the country at large. This Budget Speech takes place against the backdrop that South Africa will be celebrating 20 Years of Freedom in April 2014. This is an historic milestone since the birth of our democracy. Within this period, we can count significant achievements in terms of service delivery. At the same time we do acknowledge that there still remain a bigger challenge of further expanding these services and infrastructure to those who have not yet been fortunate to access them. It is for this reason that the Theme of this Year’s Budget Speech is: “Positioning ourselves to meet unmet needs and aspirations as we move towards the 20th Anniversary of our Freedom.”It is this recognition about the importance of our performance as a City that has informed how we have structured our priorities and budget for the Mid-Term Expenditure Framework and the annual budget for 2013/2014 Financial Year.
ACHIEVEMENTS: The achievements of the 19 years of democracy can be enumerated. In fact, evidence is there for everyone to see.
It is only prudent that we should reflect on some of the achievements and challenges over the past 10 years.
Our service delivery achievements include (amongst others) the following: - 125 669 housing units have been built between 2002 and 2012 - which is a record unsurpassed by any local
government in the country.
- 67 946 new electricity connections have been achieved between 2008 and 2012
- Solid waste services have been extend to 945 910 formal and 687 000 informal houses (100 % coverage)
- Water Supply to 730 650 formal customers
- 253 000 houses with free basic sanitation
- 518 200 houses with free basic water
- Provision of 106 lane km of new roads and 110 lane km of gravel to ‘black-top’ roads. In addition, we are
rehabilitating some major roads which are assets to the City as their economic impact is huge.
- Construction of 305 km of sidewalks
- And Construction of 46 pedestrian bridges
Over the years we have seen a number of major projects that have changed the face of the City. These include the opening of the new King Shaka International Airport, the development of the Dube Tradeport, the construction of flyover bridges in the Warwick Junction that have made access in and out of the City simpler as well as the investment on the beachfront upgrade. Investments in facilities like the Inkosi Albert Luthuli International Convention Centre (ICC), UShaka Marine Theme Park and the iconic Moses Mabhida stadium have assisted the City in gaining international exposure through the hosting of high level international events like the World Cup, COP 17 Climate Change Conference and most recently the BRICS Summit, to mention but a few. Mr Speaker, these are the tangible achievements that we should all be proud of and this should encourage us to work even harder to extend these services and infrastructure to all our people. On top of that the Municipality has received a number of awards from different institutions in recognition of the service delivery progress. These include:

4.1
SALGA awards for the following :
o Human Settlement award – best delivery of houses
o Blue Drop Status- clean water category
COGTA KZN Awards for the following :
o Best Integrated Development Programme
o Best own Metro in the District Municipality Category
o Best Innovative Infrastructure
Top Business Portfolio Award
o Winner for Promotion of Sustained economic growth
Govan Mbeki Human Settlement Awards by the National Department of Human Settlement
o Recognition for delivering of houses
o South Africa’s “Greenest “ City Award
Fellow Councillors,
Despite our best effort to deliver services, the outlook of the South African society still reflects an unhealthy
picture of inequality, dualism and marginalisation. We still have a dual economy, one for the poor who still require
the provision of basic services and the other for those who are well off whose main concern is about the level of
service that they receive. In fact to be brutally frank and honest, there are still a number of people who
remain dissatisfied and impatient about our progress because they feel that many of their needs and
aspirations remain unfulfilled, their dream deferred! Across the length and breadth of our glorious City,
we can hear their cries of anguish and calls for help. From our own visit to different Wards, we can
physically identify with their needs and feel their pains.
ZANELE’S STORY
At this stage I wish to share with you an anecdotal account of the life of 13 year old, Zanele, who lost her parents
and lives with her siblings on the outskirts of Durban. Life is a daily struggle for her as she has to fend for herself
and her little siblings. At such a tender age she has taken over the role of a parent and has to attend to household
chores before going to school. The only regular source of food for her is the school feeding scheme as well as
donations from Good Samaritans and neighbours.
The life of this 13-year-old girl reflects the kind of life that is being endured by scores of children in many parts of
the City and in the country as a whole. It is a sad reality that we have to keep in mind in all our plans and actions,
and should propel us to utilise every available resource to address the service delivery backlogs. However, it is such
stories that have led our Honourable Premier, Dr Zweli Mkhize, to come up with an intervention programme like
Operation Sukuma Sakhe, through which we have managed to intervene in desperate situations. There are many
real stories to tell about the successful interventions that we have made to assist those that are vulnerable and less
fortunate.
During the Mayoral Izimbizo last year we visited KwaSanti where we found Gogo Meyiwa who was living in a
dilapidated shack which could fall on her at any minute. The condition of that house was so bad that one could
hardly be able to stand while inside.Today I’m happy to tell you that through Operation Sukuma Sakhe we were
able to mobilise resources, and a house has been built for the elderly citizen.
We did the same for the Mkhize siblings from Clermont, who lost four family members after they had eaten
poisonous mushrooms. 18-year-old Siphelele and Siphamandla (9) were the only survivors in their family and on
March 15th this year we managed to hand them keys to a new two-bedroomed house in KwaNdengezi, that was built
using the new housing technology which we hope to utilise to deal with the housing backlog and to eradicate
informal settlements. There are many other similar cases where we have intervened successfully.

4.2
Honourable Speaker, we continue to endure a lot of hazardous situations in our informal settlements. A week does
not pass by without us receiving reports of a fire having left scores of people destitute. We have been working
closely with the Provincial Department of Human Settlements to intervene in such situations by providing interim
relief as well as building material to allow those affected to rebuild their dwellings.
Just in the past week I visited the Khayelisha Informal Settlement in Clairwood where over 240 shacks were razed
by the fire, and over 500 people were left destitute. I and Councillor William Zenzile coordinated efforts to bring
relief to the affected people, and within a few hours graders and dump trucks were on scene to remove all the
debris and level the ground for people to start rebuilding immediately. We did this using our own Municipal
resources which did not necessarily require us to go through protracted tender processes. Housing officials also
assisted in ensuring that the rebuilt shacks were constructed in an orderly manner to allow spaces in between the
houses. What this said to me was the fact that with better coordination and cooperation between us as political
leadership and officials we can make a difference.
PRIORITIES AND PRIORITIES OF PRIORITIES
Mr Speaker, this budget has been informed by inputs from different stakeholders and these have been captured and
reflected in our Integrated Development Plan (IDP). As the Council we have identified the following priorities in the
IDP:
• Service delivery backlogs; • Human settlements; • Economic development • Financial sustainability; • Mitigation and adaption of the municipality for climate change; • Water crisis; • Access to public transport; • Human capital development; • Energy crisis; • Health of society; • Food security; • Sustainable spatial form; • Rural development; • Infrastructure degradation; • Undermining natural capital; • Safer city
However, we have also gone further to identify priorities of priorities. These are priorities that rank as critical
challenges in our pecking order and therefore requiring urgent interventions. Our priorities of priorities have been
influenced by the feedback received from Mayoral Izimbizo, Zonal Budget Hearings, Masakhane and Operation
Sukuma Sakhe programmes. These are:
Eradication of transit camps;
Water crisis affecting western and northern areas of the City;
Slum clearance
Provision of sanitation in both rural and informal settlements;
Electrification of rural areas and informal settlements
Rehabilitation of existing housing stock in the R293 and ex-Own Affairs areas
And as such it is only prudent that I should deal with each one of these priorities of priorities. We believe that if
successfully implemented these will set us on a sound footing as we head towards the third decade of our
democracy.

4.3
Eradication of transit camps and slums clearance
During the Mayoral outreach programme we visited several transit camps that were created as a stop gap measure
to house people who were either on the way of development or found themselves left out of in situ upgrade
projects. There are about 10 400 people living in these transit camps. However during our oversight visits we have
seen the horrible conditions that these people are living under. It is also unfortunate that some of them have
stayed in these camps, which were supposed to be transit sites, for more than seven years. As the Council we have
taken a bold decision to get rid of these camps and to fast track the relocation of people living in these dwellings.
We have set aside R10-million for the piloting of the alternative housing technology programme and we will be
launching the project next month in June. Pieces of land have been identified for this purpose as well as for the
broader project of eliminating slums.
Electrification and provision of sanitation to informal settlements and rural areas
As the Executive Committee and Council we have taken several bold decisions that will assist us in dealing with
some of the challenges of access to services for people living in informal settlements. A pro-active and broad-based
programme aimed at providing a range of basic interim services to a number of prioritised informal settlements
within the Municipality has been developed with a view to addressing these basic issues. The Municipality is working
with the Department of Energy to provide electricity to about 300 000 informal dwellings in eThekwini as part of
the Integrated National Electrification Programme (INEP). The Municipality recently approved R750 million for the
provision of electricity to informal settlements as part of the overall project to provide interim services to informal
settlements that are not on the list of upgrade in the short term. There are 16 informal settlements that have been
earmarked for this programme. And as part of that programme we have also seen the roll out of the provision of
water and sanitation services, including stand pipes and ablution facilities.
Water crisis
Honourable Speaker, as we are moving with speed to unlock development and expand services especially in
northern parts of the City, this also means added pressure on our infrastructure. Coupled with other reasons, this
has led to the shortage of water supply in many parts of the City, especially in the north and western areas. With
the focus of development moving towards the north and a number of projects mushrooming, this will create further
constrains on our resources. While we are awaiting the completion of the Western and Northern Aqueducts, it is
incumbent upon every citizen to use water sparingly and we urge them to report leaking pipes. For those areas
where we still lack capacity we have made provision for the purchase of extra water tankers to supply water to
those communities and 10 000 Jojo tanks for water harvesting. This is also part of the campaign to save water
which was launched recently by the Minister of Water Affairs, Edna Molewa.
GOOD GOVERNANCE
EThekwini Municipality has since its formation in December 2000 continued to receive unqualified audit outcomes with other matters of emphasis. This signifies progress in terms of good governance. However, it is important to note that there were instances where lapses were uncovered in the past through the Manase Report whose recommendations are being implemented currently. In 2013/2014, our commitment is to raise the bar by receiving Clean Audit Outcome. This will entail amongst others:
Cutting irregular spending to zero and strengthening our governance framework in respect of Information
and Communication Technology environment;
Improving the maturity levels of the implementation of the eThekwini Enterprise Risk Management
Framework;
Strengthening the capacity of our Internal Audit Unit and the City Integrity and Investigations Unit and
continuing the path of zero tolerance against fraud and corruption and improving internal control and
performance monitoring and evaluation environment so as to bring us closer to a clean audit outcome; and
Strengthening our oversight role as Councillors.
4.4
Mr Speaker, under your stewardship and guidance, we have established Ward Committees in 101 Wards with the exception of Ward 1 and 7. I want to urge you Mr Speaker to expedite the finalisation of the launch of these Committees in the affected Wards. During the Medium-Term Expenditure Framework we are going to focus primarily on three strategies:
Firstly, at ensuring that Ward Committees are capacitated to strengthen their effectiveness in the quest to
build a developmental and capable state. We will do this by taking them through a training programme
which is accredited by the South African Qualifications Authority;
Secondly, to drive the process of ensuring that every ward has its own Ward-Based Plan developed through
the community based planning model, which informs the City-wide integrated development planning; and
Thirdly, to ensure that Ward Committees are a central nerve for operationalising effective War Rooms and
the implementation of Operation Sukuma Sakhe thus ensuring proper co-ordination of development
interventions at a local level.
Ward committees are going to be the basic nucleus of public participation for councillors as enshrined in
the legislation and Constitution
Honourable Speaker I am delighted to pronounce that there has been a formal gazetting in terms of Section 81 of the Municipal Structures Act, where it has been determined that 17 traditional leaders that have jurisdiction in the eThekwini area will participate in Council proceedings. We are glad to acknowledge the presence of Amakhosi AseNdlunkulu today. We regard their role as critical in driving rural development as you are aware that almost 60 percent of eThekwini land is rural. And also with a view to expanding customer services to all areas, we will increase the services offered at the Sizakala Information Centres especially the ones located in rural areas. We will also initiate discussions with the 12 other Traditional Leaders regarding the establishment of Sizakala Information Centres in their Tribal Courts.
INFRASTRUCTURE-LED DEVELOPMENTAL STATE
President Jacob Zuma has launched an unprecedented capital expenditure programme on infrastructure and as such eThekwini is set to be one of the major beneficiaries of this multi-billion-rand investment. To highlight the importance of infrastructure in development I wish to extract a quote from Price Waterhousecoopers, Cities of the Future: Global Competition, Local Leadership:
I quote:“The enormous complexity of cities today means that the demands on their infrastructure are relentlessly challenging. Not only are the ‘basic needs’ of transport, housing, water and energy under strain, but new demands for effective communication make the supply of, for example, broadband and electronic networks an increasingly important element of infrastructure provision.”
Consistent with this public policy stance, during the Medium-Term Expenditure Framework, as eThekwini Municipality we plan to invest over R17 billion in public infrastructure to propel economic growth, address backlogs, facilitate small micro and medium enterprises, reducing poverty, joblessness and inequalities. More of this investment will see us unlocking bottlenecks in order to create an environment that is conducive to attracting investors. EThekwini is at the centre of national government’s Strategic Infrastructure Programme (SIP2) and we are preparing ourselves to fully participate in this process, especially those projects that a linked to the Port expansion and the King Shaka International Airport.
There are currently a number of programmes and projects being undertaken as part of the City’s priorities in a range of sectors most of which align with National Governments focus on infrastructure development and job creation. Several major infrastructure projects that form part of the SIP’s announced by Government, include the second phase of the 55 km Western Aqueduct, the Aerotropolis, Dube Trade Port, King Shaka International Airport, dig-out port, logistics hub development, dedicated rail and links, Durban to Gauteng rail upgrades - all multibillion rand projects, which are key infrastructure developments of the Provincial Growth and Development Strategy. In support of the expansion around the Port of Durban and the Durban-Free State-Gauteng corridor development, the Municipality has developed a Draft Back of Port Local Area Plan which proposes changes to the future land use and zoning in areas or precincts around the extended Port. The Bridge City Rail Link, the largest rail infrastructure development project in the Durban area is on schedule. Cato Ridge is also one of the strategic areas on the borders of the N3 transport artery. The Cato Ridge Local Area Plan which includes a Cato Ridge Industrial Precinct Plan and a Cato Ridge Village Precinct Plan was recently approved by Council. Cato Ridge will be developed as a support location for the Dube Trade Port and Durban Harbour. Over the next three years the Municipality will be investing in the upgrade of bulk infrastructure in Hammarsdale. This is to improve capacity to accommodate the inflow of recent interest shown in both industrial and business developments in the area. Construction of the Hammarsdale Junction, a retail shopping centre is currently underway and will be opening for business in the near future.

4.5
We are also moving with speed to unlock development challenges in the flagship Cornubia mixed use human settlement development project, which is expected to yield about 25 000 housing units, as well as industrial development in close proximity. Strategically located, Cornubia also presents an opportunity to deal with informal settlement eradication, local economic development, job creation and poverty eradication all in a totally integrated and innovative manner. We are happy to learn that the private sector has responded positively to the available investment opportunities as part of the Cornubia development.
Some of the major capital projects that have been catered for in the MTEF are:
Water loss intervention programme – R150 million
R1,864 billion is set aside for Electricity Infrastructure
R1,96 billion is budgeted for low cost housing and infrastructure
R380 million for the Northern Aqueduct
R924 million for the Western Aqueduct
Roads Rehabilitation and Reconstruction, and new access road - R1,925 billion
R2.148 billion for upgrade and Expansion of Wastewater Treatment Works
New Central Library has a budget of R321 million
R440 million is set aside for economic development projects
R703 million is made available for the provision of ablution blocks in informal settlements.
INTEGRATED RAPID PUBLIC TRANSPORT NETWORK (IRPTN)
One of the goals for transport in eThekwini is to implement an effective, efficient, sustainable and safe public transport system. To achieve a sustainable public transport system, it will be necessary in a number of areas to prioritize public transport upgrades and budget at the expense of car users. To this end and in line with legislative provisions, the eThekwini Transport Authority (ETA) has developed a “wall to wall” integrated rapid public transport network (IRPTN) plan for the entire eThekwini municipal area that responds to the demand of the existing and forecasted activity patterns in accordance with the municipality’s spatial development framework.
The integrated network comprises a system of trunk, feeder and complementary routes that connect bus/minibus services to key nodes on the trunk routes. The IRPTN network will be within 800m (10-15 minute walk) of more than 85 percent of the municipality’s population. The plan will be implemented in a phased approach over the next 10 to 15 years to provide various forms of priority infrastructure for bus trunk services including: transfer stations; park and ride facilities; information, communication technologies; fleet; non-motorised transport facilities; and depots and control centres.
Detailed planning has already begun on phase 1 road and rail corridors. The road based routes start from Bridge City to Warwick, Bridge City to Pinetown, Bridge City to Umhlanga Corridor and the rail corridor starts from Bridge City and Kwamashu via Berea Road to Umlazi and Isipingo. The construction work for phase 1 will start in the next financial year.
The Integrated Freight and Logistics Strategic Framework and Action Plan for eThekwini aims to develop an efficient and integrated freight and logistics system that will ensure regional economic stability. The region’s transportation system requires the optimum integration of the different modes of transport that includes road, rail, aviation, maritime and pipeline with the appropriate modal balances. The integrated freight and logistics strategic framework and action plan for eThekwini will look to develop a multi-dimensional approach to freight planning, infrastructure and operations in the city by developing interventions over a 20 year period that relate to:
Infrastructure: freight routes and roads;
Operational: operational interventions that can ease the port-city-private sector interfaces and breaks in the logistics chain;
Regulatory: legislative and enforcement that would promote compliance in the logistics and freight sector;
Communication and network: it solutions, as well as stakeholder interactions that would ensure information sharing and ongoing management.

4.6
The formulation and implementation of this plan will involve a number of stakeholders and agencies in government and the private sector. A detailed set of interventions ready for implementation will be completed by December 2013, and these will form part of the sip2 national government interventions along the Durban – Free State – Gauteng corridor.
HOUSING
The provision of proper housing remains one of the top priorities of our Municipality. We have seen a number of
protests around the City in recent times and at the centre of the people’s complaints is the issue of proper housing.
Fellow Councillors, we remain committed to our long term plans to eradicate informal settlements in eThekwini. Like all other big Metropolitan Councils, we are faced with a huge backlog when it comes to housing delivery, which stands at over 410 000 units and there were 638 informal settlements scattered around eThekwini which we have managed to reduce to 476. We also have over 10 400 people living in transit camps. I would advise all listening to this speech that the numbers I am referring to are hard to keep down – the reason being that our success in the
delivery of services attracts more people who want settle within our Municipality. This year we are planning to deliver 8500 houses and we are targeting a total of 32 000 by 2016/2017. This is in direct response to a call by the Premier who has set a target of 40 000 houses in the Province, and more than half of these are expected to come from eThekwini. A budget of R 1.9 billion has been set aside over three years for housing delivery and related infrastructure.
Mr Speaker, I am happy to report that the finalisation of the first phase of the Cornubia Human Settlement development is progressing well and we expect the relocation to houses for Phase 1 A to commence in mid July 2013. A number of infrastructure will be upgraded to enable this massive development to be accessible. Cornubia Phase 1B will yield more that 1500 services sites. The Industrial Business Park has sold 70% of 80 hectares of platform to businesses. This indicates the true integration and new job opportunities that will be realised by the communities within that radius. A Social Economic Development Plan is being conceptualised to maximize on the opportunities that will be presented by this development.
I’m also happy to report that upgrades of R293 houses is expected to commence in July 2013.
Through the Storm Damage Programme we have intervened and assisted many families whose houses were destroyed by the inclement weather across the City. Many of these families are found in rural areas and townships, and the impact of this intervention is visible. We are still engaging with the MEC for Human Settlements, Honourable Ravi Pillay to give us more resources in order to deal with the backlog in the repair of houses and infrastructure damaged by the storms.
Let me also take this opportunity to address some of the misconceptions that have been peddled in some quarters related to the housing allocation list. I wish to reiterate what has been pointed out before, the fact that there is no housing waiting list in eThekwini. However we do have a data base that we use to track the number of people living in informal settlements and other structures. We are guided by an allocation policy when it comes to the allocation of houses to beneficiaries, and Councillors are not involved in this process. We hope that this matter will now be put to rest.
CLEAN MY CITY PROGRAMME
On the second of May 2013, I launched the comprehensive and integrated maintenance programme under the theme “Clean My City.” This is in response to our observation that notwithstanding the resources we spent on maintaining our City, the outcomes have not been pleasing. We have observed that a number of challenges remain:
Our CBD, secondary CBD’s and towns, bus and taxi ranks, areas where there is street vending, train stations
and railway servitudes are filthy;
Absence of ablution facilities within the CBD, secondary CBD’s and towns
Illegal dumping
Drainage systems
Pavements
Potholes
Street and traffic lights
Outages
Over-grown verges and trees
4.7
Unsafe and hazardous buildings
Crime and drug abuse
Bad and hijacked buildings
Through this programme we aim to address all of these challenges. The emphasis will be on ensuring that we get value for money from all contractors and co-operatives employed by the City and increase management and supervision of our staff to achieve higher productivity. We also plan to increase enforcement of our by-laws and to introduce new by-laws to tighten the noose around those who have the propensity to litter our streets and to disregard acceptable norms and practices. We therefore call upon all communities, businesses, schools and other educational institutions, trade unions, community-based organisations, religious organisations and the media to join us on this historic Clean My City journey to reclaim our streets, settlements, suburbs and villages. Towards October, a major stakeholders’ summit will be convened with a view to soliciting public responses on how we need to sustain our interventions and to devise strategies for modifying people’s attitudes and behaviour towards littering in the City.
ECONOMIC DEVELOPMENT
TOWNSHIP DEVELOPMENTS 2013/2014
The formation of the eThekwini Municipality in 2000 was coupled with the finalisation of the Long Term Development Framework, that has set as one of its objectives; the unwinding of the Apartheid Legacy. Firstly I must acknowledge the contribution of my predecessor, the former Mayor Councilor Obed Mlaba, who emphasized that development in under-serviced areas was critical for the stability of the City.
Whereas eThekwini Municipality successfully secured grant funding from the Neighbourhood Development Partnership Grant in order to stimulate development in former R293 townships; in this Medium Term Expenditure Framework eThekwini will focus a lot on improving access to and from townships, develop and support development nodes along priority corridors within townships, in order to integrate and normalise those communities as well. As we speak, eThekwini has allocated approximately R20 million towards the Mpumalanga Town Centre in the 2013/2014 financial year. This is in addition to the R30 million and R12 million already invested by National Treasury and KZN COGTA respectively, in the recent past.
At the KwaMnyandu node in Umlazi, eThekwini Municipality has allocated R12 million towards upgrading the public realm, in preparation for the KwaMnyandu Shopping Centre and other developments earmarked for that node. I am particularly proud of the KwaMnyandu Node development, in so far as: it has demonstrated the real potential of both the public and private sector in addressing pro-actively, the challenges associated with broad based empowerment. I sincerely hope that other developers interested in developing in eThekwini’s townships will learn from the Fundamentum Asset Management Group’s approach.
However, I do acknowledge that, due to the high levels of poverty, unemployment, inequality and opportunistic behavior of a few individuals found in our townships, township development requires far greater community facilitation. In rolling out the KwaMashu Furniture Incubator, I will personally ensure that there is sufficient and extensive community consultation in order for this project to be realized and finalized.
I will be expecting quarterly progress reports from the Heads of: eThekwini Transport Authority, Engineering Services and Economic Development, with regards access into and out of townships. The structural economy and settlement patterns found in townships; has to transform and promote sustainable development.
GREEN ECONOMY PROGRAMMES
A green economy is one that results in improved human well-being and social equity, while significantly reducing
environmental risks and ecological scarcities. In its simplest expression, a green economy can be thought of as one
which is low carbon, resource efficient and socially inclusive. Given the threats to human life that are associated
with climate change, habitat fragmentation, and large scale biodiversity loss, it is clear that we are walking an
increasingly tenuous path. In order to adapt, survive and ultimately thrive, the eThekwini Municipality needs to
engage in much more meaningful way in the Green Economy. This will need to be achieved through a strategic and

4.8
focussed approach, and also requires integrated strategies that effectively balance the economic, environmental
and social development initiatives. This balance requires carefully crafted policies and frameworks geared towards
practical action.
In order to support the green economic growth plan, additional research and development will need to be initiated
and embedded into city programmes. This will allow for effective monitoring and validation of projects undertaken
ensuring that correct targets are being met. Importantly, all citizens of the Municipality need to understand that
we have no option but to manage our natural resources in a sustainable way, and we can only hope to achieve this
by fully embracing the green economy. The eThekwini Municipality, together with various partner organisations is
already piloting a Community Ecosystem-based Adaptation (CEBA) initiative. This catchment-based initiative is
bringing businesses and residential communities together around the common cause of ecosystem restoration and
protection.
We now understand that by protecting our natural environment and ecosystems, we also ensure optimal resilience
for communities that face the negative effects and impacts of climate change. The initiative ensures that skills
development and small business support are at the forefront of work undertaken. This model has recently been
recognised at the international level as being the most innovative and productive. The initiative ensures that green
jobs are promoted in all relevant sectors, and particularly in those which relate to alternative energy, sustainable
transport, green buildings, sustainable consumption and production, green cities and towns, and ecosystem
services. Green jobs are defined as those which reduce the environmental impact of enterprises and economic
sectors, ultimately to levels which are sustainable.
The eThekwini Municipality’s reforestation programme, initiated in November 2008 is creating a carbon sink to help
offset carbon dioxide emissions associated with Durban’s hosting of several large events such as Fifa’s 2010 Soccer
World Cup. The holistic reforestation approach works to address the full scope of climate change mitigation and
adaptation, rural development, poverty alleviation and biodiversity conservation. The approach is also directly in
line with the low carbon, resource efficient and socially inclusive prerequisites listed as part of South Africa’s
objectives for a Green Economy.
Durban’s ‘edge’ is that the reforestation projects demonstrate exceptional benefits to local community members,
who grow the trees. These people, referred to as ‘treepreneurs’, are able to exchange their trees for food-stuffs,
household goods, building materials, bicycles, or even school fees. The project also employs full-time and part-
time staff, as well as a large number of other staff on short-term contracts. Reforestation has demonstrated clear
benefits in this regard and Durban is now a recognised global leader in the field. This year the Development Bank of
Southern Africa approved grant funding for the eThekwini Municipality. The Municipal reforestation budget, for the
forthcoming three years, amounts to almost R 27 million and the grant funding, from the National Green Fund,
amounts to almost R 40 million. The grand total thus available for the reforestation programme, for the coming
three years is just over R 66 million.
In addition to these initiatives, we are committed to projects that will further the greening agenda for our City. As such over the next three years we are committed to plant as much as 300 000 trees in all parts of the City. This will provide additional job opportunities, especially for our youth and women, while at the same time instilling a sense of pride in our environment.
TOURISM AND EVENTS
Tourism remains at the centre of our strategy to grow the City’s economy and create employment opportunities. Our City has built a reputation of hosting major events and in recent times we have hosted the Africa Cup of Nations Tournament, the BRICS Summit, TAFI-2013 International Travel Convention, the MTV Africa All-Star, Tourism Indaba and the African Renaissance Conference and Festival. Other events coming up include the Durban July, the Top Gear festival and the Manchester City Tour which will form part of the Nelson Mandela Birthday celebrations in July. Ladies and gentlemen, the number of events that we are hosting as the City is in line with our strategy of having an all year round events calendar, which assists in opening up opportunities for not only the tourism sector, but also other related industries including the hospitality and restaurants. We do not just host these events for the sake of expediency, like it has been suggested by some people. We do this because we believe that events tourism has a

4.9
a huge potential of unlocking the stubborn unemployment rate due to the enormous spin offs for our economy. The recognition of Durban’s reputation as Africa’s Sports and Events Capital also shows that we are reaping the benefits of investing in world class facilities like the Inkosi Albert Luthuli International Convention Centre (ICC), Ushaka Marine Theme Park, the iconic Moses Mabhida stadium as well as the upgrades of the beachfront promenade.
BUDGET
The 2013/2014 Medium Term budget proposes a total consolidated budget of R 33.8 billion, which is comprised of a R 5.4 billion capital budget that continues to reflect consistent efforts to address backlogs in basic services and the renewal of the infrastructure in the City and an operating budget of R 28.4 billion that will make provision for the continuation of the services provided by the Municipality.. This includes the provision of costs to address service delivery backlogs, bulk purchases of water and electricity accounting for 28.4% of the operating expenditure, repairs and maintenance of infrastructure, employee related costs as a result of filling of vacancies and provision for salary increases and the impact of capital spending on the operating expenditure. The provisions in this budget continue to support Government’s commitment to broadening service delivery and expanding investment in infrastructure, while taking into account the constrained fiscal environment. EThekwini has one of the best service delivery programmes in Africa, and we have ensured that over 75 % of residents have access to basic services. Nationally, our Municipality is used as a financial model for financial governance and we are making great strides environmentally.
RATES and TARIFFS
When rates, tariff and other changes were revised local economic conditions, input costs and the affordability of
services were taken into account to ensure the financial sustainability of the City. As a way of cushioning the blow
on our ratepayers, the Municipality has kept electricity increases to a minimum and I am pleased to announce that
tariff increases for electricity will be an average of 5.5%, down from the initial proposal of 8%.
Other tariff increases are as follows:
SERVICE
2013/2014
2014/2015
2015/2016
Assessment Rates 6.9 % 6.9% 6.9%
Water
- Residential
- Business
9.5 %
12.5 %
7%
9%
6.5%
7.5%
Electricity 5.5 % 8% 7.5%
Sanitation 6.9 % 9% 8.6%
Refuse 6.9 % 5.7% 6.2%
LIFE LINE FOR THE INDIGENT
The Municipality recognises the tough economic conditions facing the poorest of the poor. It is for this reason that we continue to develop and implement policies that are meant to cushion the poor from these tough times. A social package totalling approximately R2,7 billion rand is catered for in this budget. The basket of Life Line package for the indigent is a as follows:
Properties valued up to R 185 000 will be exempt from paying rates.
All other properties valued above R 185 000, the first R 120 000 no rates charged
4.10
Pensioners, child-headed households, disability grantees and the medically boarded are exempt from
paying rates on the first R460 000 of their property value (This amount is inclusive of the R120 000
mentioned above). For pensioners there is a cap of R3 million rands of property value.
No rates levied on first R 30 000 value of vacant land
The first 9kl of water is free to households with property values under R 250 000.
The first 50kwh of electricity is free to residents using less than 150kwh per month in Eskom reticulated
areas
The first 65kwh of electricity is free to residents using less than 150kwh per month in eThekwini reticulated
areas
Residential property valued up to R 250 000 exempt from domestic refuse removal tariff
The first 9kl of effluent disposal is exempt for all properties with values under R 250 000
Honourable Speaker, this brings me to a point where I want to talk about some of the challenges that are having a negative impact on development. These include non-revenue water, theft of electricity and cable theft as well as land invasion.
Non Revenue Water
The Municipality loses approximately R400-million in water that is lost and unaccounted for, either through leakages and illegal connections. This totals about 36 percent of the total bulk water purchased from Umngeni Water. While strategies are being put in place to deal with this challenge, especially in terms of infrastructure upgrade and detection of leaks, it is however unacceptable that our people continue to connect onto our mains illegally. We believe that the relief package that the Municipality offers now makes it possible for every poor family to have a legal connection, as long as they are disciplined to utilise the water sparingly. I therefore wish to extend a call to all residents of eThekwini who have illegal water connections to come to our offices so that they could be regularised through the water amnesty which makes it possible to be legal without losing your metre, provided that you come forward and pay a minimum fee of R250.
THEFT OF ELECTRICITY
The Municipality is losing about R40 million a year because of illegal electricity connections and we are also concerned about the number of deaths caused by electrocution due to dangerous connections. This is more so prevalent in areas adjacent to informal settlement. The Municipality continues to implement anti-theft campaigns, including covert operations in informal settlements. The municipality has also used protective structures to secure its electricity meters to prevent unauthorized access to the meters. The rolling out of interim services to informal settlements, including electrification programme will assist in eliminating this challenge. We urge our people to be patient and not connect themselves as this is not only illegal but results in loss of life and limb.
CABLE THEFT
Cable theft continues to pose a serious risk on our electricity network and negatively impacts on the assurance of supply of electricity. This scourge has caused unplanned outages to many parts of the City resulting in serious disruptions to people’s lives and the economy of the city. We call upon our people and stakeholders to report incidents of cable theft to the police or the municipality and to name and shame businesses that are engaged in illicit trade in cable. We call upon the criminal justice system to impose harsher sentences on those found guilty of this odious crime.
LAND INVASION
A worrying trend of the invasion of land by people who are desperate has grown over the past few months. We have taken a firm stand on this issue because we do not want to see any further proliferation of informal settlements which could run out of control if not stopped. We once again appeal to people who are homeless to be patient as

4.11
we are exploring every avenue to speed up housing delivery. We urge them to be vigilant and not to allow themselves to be used by people who have their own agendas.
INTERNATIONAL RELATIONS
Our international relations programme has seen about 16 cooperation agreements signed with different cities across the globe. We also have a focus on Africa and NEPAD. We have accords with the cities of Bulawayo in Zimbabwe, Port Harcourt in Nigeria, Maputo in Mozambique, Libreville in Gabon and Mombasa in Kenya. We are also a designated NEPAD City and we keep in close contact with the NEPAD programme under the Department of International Relations. The Sister City relations have seen programmes in the following areas:
Capacity building
Urban renewal programmes
Urban transport planning
Housing and infrastructure
Economic Development
Trade and Investments
Tourism
Sports, Arts and Culture
We are still to intensify our efforts in this area to yield even more returns for the developmental objectives as a City. In the coming year we are going to have 35 programmes that are going to be run with these Sister Cities. We also have been nominated as a BRICS Partner City by the Honourable Premier of the Province, Dr Zweli Mkhize and we have been directed to convene the next Partner Cities Summit by May next year. The BRICS Partner Cities are St Pietersburg in Russia, Sao Paulo in Brazil, Mumbai in India, and Quingdao in China.
YOUTH DEVELOPMENT
Addressing youth unemployment remains a critical objective of our investments as the City. The recent Census Report has confirmed what we have known for a long time, the fact that the majority of those who are unemployed are young people. It is for this reason that we must continue to invest in programmes and projects that would yield employment opportunities for this sector. To further explore other opportunities for young people, as the Mayor of eThekwini I will be convening a youth summit during the course of this year. We want to create an opportunity to engage young people and to get recommendations from them on how to best address unemployment and skills development. Part of the intervention over the next three years, include the roll out of a healthy lifestyle programme, through which we intend to provide gym facilities and equipment in the 17 Zones of the Metro. We want to explore the utilisation of the community halls and sporting facilities as gyms venues. We applaud those community members that are already taking an initiative in this regard.
We will continue to invest in sports development as well as in arts and culture programmes that will assist in keeping our youth occupied and open up employment opportunities. The creative industry is one of our focus areas in terms of unleashing the vast talents, especially in townships. We are investing about R4,6 million in the Durban Film Office so that we can continue to encourage local productions. The Zibambele Poverty Alleviation programme has been allocated R 75m as part of the Expanded Public Works programme (EPWP), through which we intend to empower local cooperatives.
The Municipality as an employer is also committed to giving our young people an opportunity to get exposed to the work environment through learnerships. As such we have taken a bold decision to drastically increase the amount of student intake from the current 200 to 2000. This number will be increased as and when funding becomes available.
HIV/AIDS AND TEENAGE PREGNANCY
Our youth continue to suffer most from communicable diseases like HIV and AIDS and TB. Through the eThekwini Aids Council we are continuing to implement programmes that now reach Ward level. Working together with the Department of Health in the province we are committed to defeat the scourge of HIV and Aids and the new

4.12
innovations and results do show that our country is heading in the right direction towards an AIDS free society. Some of these achievements in the health sector include the increase in the life expectancy of South Africans to 60 years, the introduction of a single-dose anti-retroviral treatment and the continued reduction in the mother-to-child transmission of HIV which has been reduced from 22 percent to 2.1 percent. While these should be applauded, however, it remains a worry that we continue to get new cases of infections and the number of young girls checking in for ante-natal care is no cause for celebration. This clearly shows that despite the high levels of awareness, people are still not adhering to the preventative measures. I must re-emphasise the message that was delivered to us recently by the MEC for Health, Dr Sibongiseni Dlomo, when he addressed the special sitting of Council, when he called on us as community leaders to take the lead in educating our youth as well as encouraging people to test for HIV. We must also expose Sugar daddies who prey on young and vulnerable girls, thereby increasing chances of getting infected.
ALCOHOL AND SUBSTANCE ABUSE
The War Against Substance Abuse is the next challenge, more difficult and costly than the fight against HIV/AIDS. The extent of this problem can be seen right at our doorstep, at the Albert Park, where an area has become known as Whoonga Park. The young people who have given up on life to become Whoonga addicts, tell horrifying stories of how they left their homes and prefer to live in squalor conditions in order to satisfy their addiction; because the drug is freely available and cheaper at the park. They are now chasing whoonga instead of chasing for their dreams of creating a better life for themselves and their families. Besides the law enforcement interventions that we have implemented, the story of Whoonga Park reflects a societal challenge that requires us to take urgent steps in order to save our youth. The rape and abuse of women and children remains another worrying trend, which at face value is directly linked to substance abuse. In recent times we have witnessed horrifying incidents of rape and murder of young children, women and the elderly. Our hearts goes out to those who have been adversely affected by this scourge and we pledge our support to initiatives aimed at addressing this challenge. As part of our intervention as the Municipality we have ordered responsible departments to ensure that the thick bushy areas, especially around schools are cut in order to eliminate hideouts for criminals.
OPERATION SUKUMA SAKHE
We are speeding up the opening and launching of War Rooms in different parts of the Municipality as we seek to roll out the Operation Sukuma Sakhe Programme in every ward within the eThekwini Municipal Area. Of the 103 Wards in eThekwini, over 90 of them already have operational and fully functional War Rooms. We want every corner of the Municipality to be covered. Since we started with this programme we have made several telling interventions to assist those who are vulnerable, and some of them are cited in the case studies I mentioned earlier. We are also going ensure that we mainstream youth and gender issues into all the programmes of the City throughout the different Clusters, especially where it relates to job creation and economic empowerment.
VOTER REGISTRATION AND ID CAMPAIGN
As mentioned earlier, next year will mark the 20th anniversary of our democracy and as such it is also an important election year for the country. We have already seen an increase in electioneering activities by political parties. With this election also comes a phenomenon of new voters who were born after the attainment of freedom and they will be casting their ballot for the first time, the so-called Mandela’s children. We need to encourage these young people to ensure that they have the necessary Identity Documents and that they register to vote. I also encourage those who are already registered to ensure that they check their names on the Voters roll. People living in informal settlements, which are prone to fires, are encouraged to look after their important documents like IDs and children’s birth certificates. We are supporting the ID campaign led by the Department of Home Affairs to ensure that every qualifying citizen obtain the correct documentation. This has been an ongoing campaign and is not only linked to the elections.

4.13
CONCLUSION Compatriots, as we table this budget for adoption by Council, we are proud of the enormous achievements that have been brought by this democratic government over the past 19 years. Many of our people now have access to basic services and the face of many of the previously disadvantaged areas has improved for the better. On the other side we have acknowledged that the aspirations of many others remain a dream. It is for this reason that we are gearing up to fulfil those dreams of owning a house, having a job, access to clean running water, electricity connection, clean ablution facilities, sport and recreational facilities, health, education, crime free environment as well as safer and healthier communities. We will utilise all available resources to satisfy the aspirations of the vast majority whose dreams remain deferred. As the ANC led Municipality we take direction from the programmes endorsed by the governing party. The January 8 Statement of the African National Congress’s National Executive Committee, delivered here in Durban by His Excellency President Jacob Zuma, commands us as follows: I quote; “We remind all ANC deployees that where infrastructure and resources exist to deliver services, there can
be no excuse for these services not to be delivered. We now know where the gaps exist and it is time to deliver the
services that will improve the lives of our people.”
Fellow Councillors, it is my honour to table the MTEF and 2013/2014 Budget for adoption by this full Council. I thank you.

5
5. ETHEKWINI MUNICIPALITY PROFILE Rich in cultural diversity, Durban is a fast growing metropolitan city with many kilometres of pristine beaches, iconic buildings, vibrant cultures, exceptional creativity and famous hospitality. Durban is a world-class tourist destination offering a wide range of experiences both within the city and in the surrounding countryside. It has a magnificent beachfront along the Indian Ocean with a promenade which stretches for several kilometres.
5.1 VISION OF THE MUNICIPALITY By 2030, eThekwini Municipality will be Africa’s most caring and liveable city.
5.2 MISSION The purpose of the eThekwini Municipality is to facilitate and ensure the provision of infrastructure, services and support, thereby creating an enabling environment for all citizens to utilise their full potential and access opportunities, which will enable them to contribute towards a vibrant and sustainable economy with full employment, therefore creating a better quality of life for all.
5.3 LOCAL ECONOMY The eThekwini Municipal Area is home to Africa’s first multi-model logistics platform and international passenger airport, boasting the largest port in Africa, a global conferencing, sporting and tourist destination. It is the central engine of the regional economy, and plays a major role in the South African economy. It ranks as the third largest economic centre and a very promising global competitor.
5.4 CLIMATE The eThekwini metropolitan has mild sub-tropical climate with sunshine for the most of the year.
5.5 LAND USE The municipality is unique amongst major urban centres in that only 35% of the metropolitan area is predominantly urban, with over 60 000 households living in traditional rural style dwellings.
5.6 STATE OF THE ECONOMY
5.6.1 OVERVIEW In the fifth year after the outbreak of the global financial crisis, global growth has decelerated and unemployment has started to increase again. Over the medium term, the global economy is expected to recover, but growth will not be strong enough to bring down unemployment quickly. The South African Reserve Bank has downgraded its growth forecasts on the back of the weak global demand and production disruptions indicating that economic prospects may not be as strong as was thought previously. Inflation could break the top end of its official target range next year based on new calculations of price data. The household sector continues to be negatively impacted by high unemployment, low savings and high level of debt, resulting in a low level of consumer confidence. Household Consumption Expenditure (HCE) growth should remain moderate this year, at 3.3% year on year. The labour market has deteriorated with the unemployment rate rising to about 25 per cent in the third quarter of 2012. However, National governments large infrastructure package as part of the National Development Plan which sets out an integrated strategy for accelerating growth and eliminating poverty will augur well for a positive investment climate in years to come. Locally, some major private and public sector projects may assist greatly in boosting eThekwini’s growth trajectory above the usual 3% and also help to reduce the burden on unemployment.
5.6.2 ETHEKWINI GDP PERFORMANCE The region’s estimated GDP of R 208, 6 billion during 2012 represents a 2.7% increase over the previous year. This lower increase may be in line with the negative impacts resulting from the global crisis still affecting the national economy with the national projection having being adjusted downward.

6
5.6.3 PORT OF DURBAN
Import activity relating to containerised- and dry bulk cargo decreased between 2011 and 2012. Vehicle movement showed annual increases of 4.1% for imports and 12.5% for exports. This confirms the automotive sector as one of the country’s strong globally competitive sectors. The decrease in exports for containerised, dry, and break-bulk cargo is indicative of the global drop in demand for goods and other commodities, especially from South Africa’s key trading partners such as the Eurozone.
Table 2: Cargo Handling Imports
Cargo 2011 2012 Percentage Change
Containerised cargo 1,378,238 1,301,790 -5.5%
Dry bulk cargo 4,325,350.5 3,959,290.3 -8.5%
Liquid bulk cargo 24,172,200.5 25,460,976.9 5.3%
Break-bulk cargo 1,552,506.8 1,556,156.1 0.2%
Vehicles 280,284 291,838 4.1%
Table 3: Cargo Handling Exports*
Cargo 2011 2012 Percentage Change
Containerised cargo 1,342,677 1,266,334 -5.7%
Dry bulk cargo 6,179,186.1 5,534,430.4 -10.4%
Liquid bulk cargo 2,675,732.1 3,097,189.0 15.8%
Break-bulk cargo 1,543,305.4 1,200,147.5 -22.2%
Vehicles 146,545 164,865 12.5%
5.6.4 AIRCRAFT MOVEMENT
The King Shaka International Airport is currently handling in excess of five million passengers annually. The general trend in terms of visitor numbers tends to mirror the city’s tourism profile viz. more domestic than international visitors. Major international events at the City’s International Conference Centre have continued to show an increase in international passengers in 2012. However passenger volumes to the beginning of this year have shrunk and the airports company puts this down mainly to the decrease in leisure travel. In the 3rd quarter of 2012, the terminal processed 1,447,543 kg of import- and 410,798 kg of export cargo.

7
5.6.5 TOURISM
Tourism spend in recent years still appears to mirror the impact of the recent financial crisis and the corresponding impact on consumers for both international and domestic tourists. The graph shows a dip in 2011 following an increase between 2009 and 2010.
Tourist activity is still dominated by domestic visits to the city. There was a decrease in the number of trips for domestic tourists between 2010 and 2011, and this may be due to the high cost of living where consumers are prioritising on budgeting for food, debt-financing and other necessities to shoulder the effects still being felt by the global financial crisis. There was a slight increase of 0.42% of international tourists over the same period.

8
5.6.6 BUILDING PLANS PASSED
The graph below shows the building plans completed for office, retail and industrial space in the eThekwini region during the years 2006 to 2012.
There were steady increases in building plans completed for office, retail and industrial space since 2006 up until 2008/09 and the effects of the global crisis can be evidenced from the performance of all three sectors since. However, there were slight recoveries in the office and industrial sectors.
In terms of the residential component, according to the ABSA Housing price index, the average nominal house prices in KwaZulu-Natal fell by 11.3% during the second quarter of 2012 year-on-year. Economic growth, employment, inflation, interest rates, household income and debt and consumer confidence is expected to remain key factors to the housing market.
5.7 ECONOMIC / SOCIAL DEVELOPMENT
In a highly global economy where competition for investment has intensified, only those economies that continuously improve their comparative and competitive advantages will weather the economic storm. The revised 2013/14 Spatial Development Framework has identified spatial regions in order to address some of the Spatial Development scenarios and pressures. These include logistics support, trade and investment centre, coastal tourism and recreation, agricultural support etc. The city has several comparative and competitive advantages and has in recent years enhanced these in a bid to stay ahead of the competition for investment. The municipality is on the expansion trail, with a number of strategic areas earmarked for rapid development to fit in with the city’s aim of becoming a regional power house. The second phase of the 55 km Western aqueduct pipeline is underway and will be rolled out over a seven year period. It is expected to significantly strengthen the capacity of bulk water supply to the Western regions, ultimately boosting water supply to the north of the city. There are currently a number of programmes and projects being undertaken as part of the city’s priorities in a range of sectors most of which align with national governments focus on infrastructure development and job creation. Further enhancing the provinces comparative and competitive advantages are several major infrastructure projects that form part of the Strategic Infrastructure Projects (SIP’s) announced by government. Aerotropolis, Dube Trade Port, King Shaka International Airport, dig-out port, logistics hub development, dedicated rail and links, Durban to Gauteng rail upgrades-all multibillion–rand projects, which are key infrastructure developments of the Provincial Growth and Development Strategy.
9
There are plans for the creation of a ‘new city’ around King Shaka Airport and Dube Tradeport. This new airport city will create a world class physical and operational environment geared towards attracting trade, investment and infrastructure to the local economy. Dube Trade Port, with air cargo handling capability, adds a critical element to the provinces collection of logistics platforms and provides it with an important head start over other economies, thus improving its global competitiveness. The long-term strategic objective of the Dube Trade Port project, including the King Shaka International Airport, is the establishment of an Aerotropolis-the first purpose-built Aerotropolis in Africa. This Aerotropolis will create a world-class physical and operational environment geared towards attracting trade, investment and infrastructure. Dube Aerotropolis is set to change the face of the northern area of the city as a major aerotropolis development. Land development opportunities are set to be developed in such a way to maximise connectivity to the Trade Port, airport and other transport corridors. Business opportunities will be abound with provision for logistics, offices, business, parks, warehouses, industrial, retail, tourist resort as well as housing for residential activities. Durban’s bustling harbour, one of the busiest in the world which has contributed to the growth of the city and the province is expected to reach capacity by 2019. Hence a multibillion rand dig-out port has been approved on the old airport site. This will serve as a major catalyst for growth and development in the province with work on the new port estimated to commence by 2015. This project would not only change the face of Durban but will also change the economic and social landscape of the country. Furthermore, a new deal has recently been reached to develop a revised multibillion waterfront development next to Vetch’s Pier. This allows for a new iconic hotel and waterfront development at the mouth of the Durban harbour. Government has announced a massive infrastructure development drive which includes improving the movement of goods and economic integration through Durban-Free State-Gauteng logistics and industrial corridor. The intention is to connect the major economic centres of Gauteng and Durban/Pinetown and at the same time, connect these centres with improved export capacity through sea-ports. Accordingly, Transnet’s long-term framework plan includes the phasing in of major upgrade and expansions including major digging out and expansion of the existing port southwards at Bay Head. Furthermore, a 2050 vision for the Durban-Free State-Gauteng freight corridor has been developed as part of the National Investment and Implementation Plan which allows for confirmed developments of freight rail up to 2050. These developments include a number of projects within the Bay Head, Clairwood, Re-onion, Cato Ridge and other areas. In support of the expansion the municipality has developed a Draft Back of Port Local Area Plan which proposes changes to the future land use and zoning in areas/precincts around the extended Port. The bridge City Rail Link, the largest rail infrastructure development project in the Durban area is on schedule and should be completed by April 2013. One other area is Cato Ridge for its strategic importance on the borders of the N3 transport artery. The Cato Ridge Local Area Plan which includes a Cato Ridge Industrial Precinct Plan and a Cato Ridge Village Precinct Plan was recently approved by Council. Cato Ridge will be developed as a support location for the Dube Trade Port and Durban Harbour. Over the next three years the municipality will be investing in the upgrade of bulk infrastructure in Hammarsdale. This is to improve capacity to accommodate the inflow of recent interest shown in both industrial and business developments in the area. Construction of the Hammarsdale Junction, a retail shopping centre is currently underway.
With regard to housing development, work on the first phase of the flagship Cornubia housing development is in progress and is scheduled for completion in June with the building of 486 housing units. The second phase of the project has gone to tender. Cornubia is a public-private partnership with an estimated value of R 25 billion. It will accommodate about 25 000 units and house about 100 000 people. Strategically located, Cornubia also presents an opportunity to deal with informal settlement eradication, local economic development, job creation and poverty eradication all in a totally integrated and innovative manner. The construction of the state of the art information hub, the central library will further position Durban as an international city and it will regenerate the inner city. This new building will be a landmark civic and design icon that embodies eThekwini’s commitment to the future. As a major anchor in the city, the Central Library will leverage the value of other properties and private and public investment in the area. Furthermore, it will also serve to help retain public and private investment already made in the area.
TOWN CENTRE RENEWALS There are programmes aimed to revitalizing the secondary CBDs as well as projects aimed at developing tourism nodes and corridors. These include Umhlanga, Inanda Heritage Route, Hazelmere Dam, Umgababa, Kingsway Tourism Corridor as well as many others. There are number of town centres within eThekwini which form part of this programme. Initiatives have been identified in each of these for implementation. The Ushukela Drive (Watson Highway) corridor in Tongaat has been planned for upgrade as key entrance into the CBD and to ensure that traffic can be accommodated for current and future developments. In Verulam the planning for the rationalisation of the public transport node is currently underway. A land acquisition and alienation process is underway in Umhlanga Rocks to upgrade roads. In Isipingo the first phase of the road upgrades is programmed to start soon.
10
Other developments in and around the city includes: - The development of the adjacent Clairwood Racecourse into an industrial zone.
- Development of greenfields cited in the eThekwini central business district.
- IRPTN Infrastructure.
- Illovo freight route, automotive supply park (Toyota).
- South Durban Basin: regenerating the industrial base.
- Inner City- iTrump regeneration.
- Strategic investments to boost manufacturing, tourism and agriculture.
- Rural Development projects.
- Agriculture and green energy space.
EVENTS Mega-eventing has become a natural outcome of the huge infrastructure spend, with the city hosting several national and international events. Hosting of events is a trend that is used by the cities of the world to stimulate the local economy through sport and tourism events. During the last year the city successfully hosted the Top Gear festival which was a spectacle par excellence. Being a host city for the recent 2013 Orange African Cup of Nations Tournament has had major spin-offs for the city. In line with the city’s aim to be the country’s sports and events capital, the city has won hosting rights to the Sports and Events Tourism Exchange convention for the next three years. In addition, the City will be the new home for Soccerex African Forum for the next three years. Engagements are also underway for the Tourism Indaba to be a permanent event in Durban.
TOURISM With Durban being the domestic tourism capital, the visitor industry hosts some 1.7m people per annum and contributes approximately R 5.2 billion per annum to the city’s economy. According to the Global Destination Cities Index, Durban is predicted to be the fastest growing tourism City in Africa for 2012, and one of the fastest growing tourist destinations in the world. This news coincides with the City embarking on its first Digital International Marketing Campaign on Global television, having struck an international television marketing deal with National Geographic. In addition, government is on a mission to get more international airlines to fly directly to King Shaka International Airport with the KZN government in negotiations with a number of airlines to get direct flights between Durban and India as well as the possibility of Air Seychelles flying directly to Durban. In its endeavour to continue being the leader in holiday destinations, eThekwini has fast tracked the refurbishment of its beaches for the residents and visitors to enjoy. In this regard, work on the second phase of the beachfront facelift is well underway with some sections already completed and opened to the public for the December holiday season, with the remainder to be completed by May this year. The upgrade is said to give the skyline a picturesque face lift. A world class cruise ship terminal, as part of the Point Waterfront development is on the cards. The terminal would improve boarding for cruise tourism passengers and have a multiplier effect in the tourism sector.
6. BUDGET OVERVIEW: EXECUTIVE SUMMARY
6.1 INTRODUCTION The 2013/2014 Medium Term budget proposes a total consolidated budget of R 33.8 billion which has been developed with an overall planning framework and includes programmes and projects to achieve the city’s strategic objectives. Provisions in this medium term budget continues to support government’s commitment to broadening service delivery and expanding investment in infrastructure, while taking into account the constrained fiscal environment. This budget has been developed to contribute to the municipality achieving the strategic objectives of the IDP. The 2013/2014 MTREF is informed by the municipality’s long-term financial strategy with emphasis on affordability and long-term sustainability. National Treasury’s MFMA Circular No’s 66 and 67 were used to guide the compilation of the 2013/14 MTREF. In addition, this budget format and content incorporates the requirements of the Municipal Budget and Reporting Regulations.

11
Given the economic realities, a conservative approach has been adopted in projections. Spending plans had to be revised and funds reprioritised to ensure key objectives are achieved. The revenue side of municipal budgets continue to be strained and some very tough decisions had to be made. The main challenges experienced during the compilation of the 2013/14 MTREF can be summarised as follows:
- The on-going difficulties in the national and local economy. - The increased cost of bulk purchases which is placing upward pressure on service tariffs. - Affordability of capital projects – original allocations had to be reduced and the operational expenditure
associated with prior year’s capital investments needed to be factored into the budget. - Major strain on capital budget due to increased demand and eradication of backlogs. - Reduction in equitable share and fuel levy grant arising from a change in the formula as well as the impact
of new population census. - Provincial Subsidy for Hostels being stopped - Above inflationary salary increase of 6.85% negotiated by the Central Bargaining Council
6.2 STRATEGIC PRIORITIES FOR THE 2013/2014 YEAR The municipality has identified the following priority areas to be addressed during the 2013/14 financial year. • Service delivery backlogs; • Human settlements; • Economic development • Financial sustainability; • Mitigation and adaption of the municipality for climate change; • Water challenges; • Access to public transport; • Human capital development; • Energy challenges; • Health of society; • Food security; • Sustainable spatial form; • Rural development; • Infrastructure degradation; • Undermining natural capital; • Safer city
6.3 PAST AND CURRENT PERFORMANCE, ACHIEVEMENTS AND CHALLENGES
6.3.1 SERVICE DELIVERY The City places a high level of importance on achieving value for money from its investments, measured in terms of its strategic priorities. Key outputs delivered show significant progress in the eradication of household backlogs by the city. With over 75 % of residents having access to basic services, the municipality has one of the best service delivery programmes in Africa. Nationally, our municipality is used as a financial model for financial governance and we are making great strides environmentally. The municipality has maintained its proud record of always receiving unqualified audit reports which strengthens the municipality’s vision of receiving clean audit reports ahead of government’s clean audit target. eThekwini continues to review and develop sound policies, procedures and systems. Our service delivery achievements include (amongst others) the following: - 125 669 housing units built (2002-2012) - 67 946 new electricity connections (2008-2012) - Solid waste services to 945 910 formal and 687 000 informal houses (100 % coverage) - Water Supply to 730 650 formal customers - 253 000 houses with free basic sanitation - 518 200 houses with free basic water - Provision of 106 lane km of new roads and 110 lane km of gravel to ‘black-top’ roads - Construction of 305 km of sidewalks - Construction of 46 pedestrian bridges

12
In recognition of the service delivery progress, the municipality has received the following awards:
SALGA awards for the following : o Human Settlement award – best delivery of houses o Blue Drop Status- clean water category
COGTA Awards for the following : o Best Integrated Development Programme o Best own Metro in the District Municipality Category o Best Innovative Infrastructure
Top Business Portfolio Award
o Winner for Promotion of Sustained economic growth
Govan Mbeki Human Settlement Awards
o Recognition for delivering of houses o South Africa’s “Greenest “ City Award
Notwithstanding that National Treasury has indicated that the municipality is financially sound, the following challenges need to be acknowledged:
o Sustainability of housing provision from current financing sources o Infrastructure and service delivery backlogs o Minimal level of growth and costs to unblock development o Costs of bulk purchases o Unaccounted for Water and theft of Electricity o Impact of bringing Durban Transport back under the City’s control
6.3.2 INSTITUTIONAL TRANSFORMATION
As part of the Institutional transformation and in an endeavour to strengthen and build an efficient administration, alternate delivery mechanisms are reviewed in order to ensure improved services to communities. In order to enhance operational efficiency, an organisational structure review was undertaken and in line with the municipality’s Institutional Review Framework, high level organograms have been developed. These entail change of names of various clusters, creation of a new cluster ie. Programme Management, expansion of the Office of the City Manager and the streamlining of functions throughout the council. One of the proposals of the new framework is the establishment of a City Planning Commission to align the long-term City Growth and Development Strategy with National and Provincial Government
The Priority Zone Facility Management and the visible streetscape maintenance and urban management has been a success. The principle herein is integrated service delivery whereby contracted urban management or facilities companies provide top-up and management services to a prioritised urban precinct. These programs will be rolled out to other focus areas.
6.3.3 SERVICE DELIVERY STANDARDS, LEVELS OF SERVICES, OUTCOMES, TIMETABLE FOR
ACHIEVEMENT AND FINANCIAL IMPLICATIONS
The municipality has been robustly tackling service delivery backlogs and great strides have been made in recent years. The City is justifiably proud of its excellence in infrastructure delivery and the exceptional expenditure performance record. This record has been achieved through careful, dedicated management of its project pipeline. This ensures that projects are identified early, designed effectively, approved expeditiously and is ready to proceed by the time funds are approved in the annual budget. eThekwini is performing better than the national average for all household infrastructure indicators, with refuse removal being particularly impressive. In the area of current water delivery, 91% of households have water available within 200m of their dwelling.

13
The backlogs in local government are huge. Limited funding and exponential growth in the municipality has increased the level of backlogs. Eradicating backlogs in basic services and housing as well as improving the provision of services by local government are government’s most important goals. The city faces development pressures emanating from backlogs in access to basic services and housing, the need to rehabilitate or replace existing infrastructure, and the need to expand infrastructure services to support economic growth. Urbanisation trends are also pushing the addressing of backlogs even further. The municipality has as part of its infrastructure planning, documented the nature and extent of backlogs in service delivery across the metropolitan area. The following table is a summary of the current backlogs of the municipality together with the timeframes for addressing same:
Vast strides have been made by the municipality to address the service delivery backlogs and specific strategies been put in place. The municipality is committed to ensuring that all backlogs in the provision of infrastructure are removed and as such has embarked on a Municipal Infrastructure Investment Framework. Emphasis is given to the eradication of rural basic service backlogs especially water and sanitation. In urban areas, the primary intervention is the eradication of informal settlements through the provision of housing and a package of household services as well as the provision of interim services to improve living conditions in the settlements.
Whilst the city can pride itself on a successful and large scale mass housing delivery program, not all settlements can be provided with full services and low income housing in the short term due to funding and other constraints. The Informal Settlement Programme is the major focus of eThekwini Housing. The principle intention is to upgrade informal settlements wherever possible and to only relocate residents if upgrading is impossible for health, safety or technical reasons. In order to fast track the general housing backlog within the city a pilot project is being introduced using alternate building technology. The Urban Settlements Development Grant is a key city human settlements funding source and provides for the funding of, inter alia, bulk infrastructure, housing development projects, land acquisition and community facilities all with the targeted view to upgrading the informal settlements across the city in an affordable manner. As informal settlements face a range of basic challenges such as access to services, a pro-active and broad-based programme aimed at providing a range of basic interim services to a number of prioritised informal settlements within the municipality has been developed with a view to addressing these basic issues. In a bid to speed service delivery, the municipality is working with the Department of Energy to provide electricity to about 300 000 informal dwellings in eThekwini as part of the Integrated National Electrification Programme (INEP). The municipality has recently approved plans to roll out the electrification of several informal settlements as part of the programme to provide interim services for people. The programme was aimed at informal settlements where the Department of Human Settlements did not have a plan to build low-cost houses within five years. There are 16 informal settlements earmarked for the programme. In order to address backlogs in community facilities, an innovative model, termed the Social Facilities Accessibility Model, has been developed to match the demand for facilities, based on population numbers and income and age profiles, with the supply and capacity of facilities geographically. This assessment shows the nature and extent of facility backlogs across the municipality and all requests for the construction of new facilities are currently being assessed within this context.
Basic Service
Existing Backlog (households)
Timeframe to address based on current
funding levels
Housing 401 194 81 Years
Water 73 448 37 Years
Sanitation 225 807 15 Years
Electricity 293 448 25 Years
Roads 1 122 (km’s) 94 Years

14
6.3.4 FINANCIAL PERFORMANCE (2011/12 AND 2012/13): PARENT MUNICIPALITY
The 2011/2012 year has been challenging and demanding but due to the emphasis on fiscal prudence and the introduction of austerity measures, this enabled the municipality to weather the financial storm and the slow economic recovery. Revenue and cash streams are effectively managed in assessing the financial affairs of the municipality, and spending decisions are carefully evaluated. The municipality was able to deliver on key objectives set. Despite the effects of the global recession on the economy, the municipality has managed to achieve a collection rate of 97.5% which is the best in the country. Due mainly to a strong balance sheet, the municipality has maintained its credit rating, the best in the municipal sector.
The Kwa-Zulu Natal Portfolio Committee on Finance and the Co-operative Governance and Traditional Affairs praised the municipality for the excellent use of its finances. The financial performance for 2011/2012 is recorded in greater detail in the municipality’s Annual Report. The municipality achieved an unqualified audit report continuing the trend of previous years.
The municipality’s financial performance and position is sound mainly due to the following factors:
Budgets are balanced, being financed from the current financial year’s revenues from all sources.
The municipality operates within its annual budget, as approved by council.
The municipality maintains a positive cash and investments position.
Consistently high revenue collection rates are being achieved.
The municipality has maintained a favourable credit rating.
OPERATING BUDGET
In respect of the 2011/12 financial year, expenditure in the amount of R 21.1 billion was fully funded from the municipality’s revenues and grants and subsidies from National and Provincial Government.
Operating Budget Performance (Current Year)
The financial performance for the eight month period ending February 2013 is summarised in the table below:
Summary Statement of Financial Performance (Parent Municipality)
Description
2012/13 Budget
R’000
February
YTD Budget
R’000
February
YTD Actual
R’000
Forecast
R’000
Total Revenue By Source
(Excluding Capital Transfers)
Total Operating Expenditure
(23 352 488)
23 352 488
(15 568 325)
15 568 325
(15 609 941)
14 373 331
(23 208 889)
23 208 889
SURPLUS
0
0
(1 236 610)
0

15
Operational Expenditure and Income Performance (2012/13)
Expenditure
The year to date results indicates a spend of 62% of the budgeted operating expenditure of R 23 billion. Current spending levels indicate that there will be a 99.1% spend on the operating budget by year end.
The expenditure on employee related costs is at 62.4% of the salaries budget, which is deemed reasonable. Employee related cost is currently 27.3% of the total operating costs, which is slightly lower than in previous years. Repairs and maintenance reflect a slightly lower spending for the eight months (51.3%), when compared to the same period last year (51.8%). The repairs and maintenance expenditure is approximately 9% of the total operating expenditure to date and this is expected to increase to between 10-11 % by year end.
Income:
The proportionate increase in Property Rates income to date (R 218m) is mainly attributable to payments made by annual ratepayers.
A R 144m year to date decrease in the Water-Service Charges is mainly attributable to the illegal connections.
The police fine income to date is lower than anticipated by R 18 million. This is mainly due to the culture of non-payment and adverse economic conditions. However, this is expected to improve in the ensuing months, with the introduction on 1 December 2012 of the fine payment incentive scheme where a 50% reduction is given to those who pay their outstanding fines within 30 days. The municipality’s metropolitan police have collected about R 8.7 million since the commencement of the amnesty period.
The year to date increase in Operating Grants (R 78m), is mainly attributable to the Equitable Share grant received in advance.
CAPITAL BUDGET
The capital budget totalled R 5.3 billion in 2011/12. This was funded by National and Provincial grants in the amount of R 2.4 billion and R 1.9 billion being funded from Council’s internal sources, with the balance of R 1.0 billion from external funding.
Capital Budget Performance (Current Year)
The capital performance for the eight month period ending February 2013 is summarised in the table below:
Summary Statement of Capital Expenditure : February 2013
Description
2012/13 Budget (R’000)
YTD Budget (R’000)
YTD Actual (R’000)
Forecast (R’000)
Total Capital Expenditure
Total Capital Financing
5,285,263
5,285,263
3 523 509
3 523 509
1 875 382
1 875 382
5 384 242
5 384 242
Progressive Capital Budget vs Actual

16
The following chart compares the year to date capital budget to the year to date actual expenditure over the eight months ending February 2013.
The capital expenditure as at the end of February 2013 is approximately R 1.9 billion, which is 35% of the budgeted amount. This is a 2% reduction when compared to the previous year figure of 37%. However, a spend of 101.9% is forecasted for the year.
Conditional Grants
Approximately R 2.8 billion from all sources have been received to date which represents 57.5% of the amount budgeted for. Grants totalling R 300 million is a rollover from the previous financial year and is expected to be spent by year end.
6.4. BACKGROUND TO THE BUDGET PROCESS
The adoption of the 2012/13 Medium Term Budget for the eThekwini Municipality on 30 May 2012 laid the foundation by which strategic functions within the municipality could apply sound financial planning and management over the medium to long term. It facilitated the critical alignment of planning, budgeting and sustainable service delivery in line with eThekwini’s vision of being Africa’s most caring and liveable city.
The purpose of the 2013/14 Medium Term Budget is to comply with the Municipal Finance Management Act (No. 56 of 2003) and is a financial plan to enable the municipality to achieve its vision and mission through the IDP which is informed by our five year programme and community/stakeholder inputs. The draft budget is the start of a journey towards the final budget for approval. It included many processes both politically and administratively, amongst others, consultations with communities in the municipal area.
6.5 BUDGET SUMMARY
6.5.1 MID TERM OUTLOOK: 2013/14 – 2015/16
CAPITAL BUDGET
Municipalities play a critical role in creating an enabling environment for investments and other activities that lead to job creation. Investment in urban infrastructure is important for the development of the local economy, combating poverty and the provision of universal access to municipal services. Rapid inward population migration, declining household sizes and greater economic activity places pressure on existing municipal infrastructure and requires larger investments in the periods ahead. The capital budget is directly informed by the needs submitted by the community through the IDP process. In view of borrowings being maximised and the present economic climate, the high levels of capital expenditure cannot be

17
sustained. The capital budget continues to reflect consistent efforts to address backlogs in basic services and the renewal of the infrastructure of existing network services.To meet the demand for infrastructure; the projected capital expenditure budget for the 2013/14 period is R 5.4 billion. In line with strategic priorities, the major capital investments made by the city have been in Water services and Housing
Over the next three financial years, 2013/14 to 2015/16, capital spending is projected to increase slightly to be R 17.6 billion
The following are some of the MAJOR Capital programmes, which have been included in the MEDIUM Term Capital budget:
PROJECT / ITEM R’ m
Water Loss intervention programme 150.0
Electricity Infrastructure 1 864.9
Low cost Housing and Infrastructure 1 963.4
Northern Aqueduct – Water 380.0
Western Aqueduct – Water 924.0
Solid Waste fleet replacement 134.1
Roads Rehabilitation and Reconstruction, and new access road 1 925.9
Wastewater Treatment Works: Upgrades/Expansion 2 148.6
New Central Library 321.1
Economic Development Projects 440.5
Ablution Blocks-Upgrade: Informal Settlement 703.0
OPERATING BUDGET
The operating budget, which funds the continued provision of services provided by the municipality, increased from R 26.2 billion in 2012/13 to R 28.4 billion in 2013/14, R 30.6 billion in 2014/15 and R 33.1 billion in 2015/16 respectively. The growth is mainly in the following areas:
Cost of addressing service delivery backlogs
Cost of bulk purchases (Water and Electricity)
Repairs and maintenance of infrastructure
Employee related costs as a result of filling of vacancies and provision for salary increase
Impact of capital spending on the operating expenditure
6.5.2. BUDGET ANALYSIS
EXPENDITURE
Bulk purchases take almost 30% of the operating budget. Given projected increases in the bulk prices of both electricity and water, expenditure on this item is likely to grow more rapidly. Expenditure on repairs and maintenance amounts to R 2.9 billion for the 2013/14 year, representing 10% of the total operating budget, which is above the national average and above that of most metros in the country. The municipality acknowledges its obligation to optimally preserve its extended asset base as under spending in maintenance can shorten the life of assets, increase long-term maintenance and refurbishment costs and cause a deterioration in the reliability of services. Aligned to the priority being given to preserving and maintaining the city’s current infrastructure and in line with the approach of recent financial years, 2013/14 again provides for significant and above-CPI level increases to this cost component.
Personnel costs account for a large component of operating expenditure, comprising 23.9% of the operating budget. The multi-year Salary and Wage Collective Agreement for the period 1 July 2012 to 30 June 2015 was taken into consideration. The cost associated with the remuneration of councillors is determined by the Minister of Co-operative Governance and Traditional Affairs in accordance with the Remuneration of Public Office Bearers Act, 1998 (Act 20 of 1998). The most recent proclamation in this regard has been taken into account in compiling the City’s budget. Budget appropriations for depreciation amount to R 1.8 billion, comprising 6.5 % of the operating budget. Finance charges consist primarily of the repayment of interest on long-term borrowings (cost of capital) and equate to 4.1% of the operating expenditure.

18
Some of the major items of operating expenditure are:
DETAILS 2013/014 (R’m) % OF TOTAL BUDGET
Bulk Purchases 8 045.5 28.4
Salaries and Allowances 6 786.4 23.9
Repairs and Maintenance 2 840.8 10.0
Depreciation 1 842.0 6.5
Interest on Loans 1 168.5 4.1
REVENUE Revenue generated from rates and services charges form a significant portion of the revenue basket for the city comprising 67.7% of the total revenue. Electricity charges are the largest revenue source totalling 35.3% or R 10.1 billion and are projected to increase to R 11.9 billion by 2015/16. Operating grants and transfers total R 2.4 billion in the 2013/14 year and increase to R 2.5 billion by 2015/16. Tariff-setting is a pivotal and strategic part of the compilation of any budget. When rates, tariff and other charges were revised local economic conditions, input costs and the affordability of services were taken into account to ensure the financial sustainability of the city. The proposed tariff increases for the medium term are as follows:
SERVICE
2013/2014
2014/2015
2015/2016
Assessment Rates 6.9 % 6.9% 6.9%
Water
- Residential
- Business
9.5 %
12.5 %
7%
9%
6.5%
7.5%
Electricity 5.5 % 8% 7.5%
Sanitation 6.9 % 6.5% 6.5%
Refuse 6.9 % 6.5% 6.5%
The percentage increases of both Eskom and Umgeni Waters’ bulk tariffs are above the inflation rate. Given that these tariff increases are determined by the external bodies, the impact they have on the municipalities tariff are largely outside the control of the City.

19
6.5.3 INFRASTRUCTURE EXPENDITURE TRENDS
Budget of R 1.9 bn over three years
Reduction of the housing delivery program in view of reduced subsidies and land availability
The construction of houses is dependent on National / Provincial subsidies
8 500 new housing units – (2013/14), targeting a total of 32 000 units by 2016/17
Interim services rollout to prioritised informal settlement dwellings
Budget of R 2.4bn over three years
Upward trend due to investment in infrastructure and addressing of backlogs
Provision of R 244m and R 190m has been made for the Western and Northern Aqueduct projects respectively.
Mini Hydro Power Stations- R 40m
CAPITAL
OPERATING
New development budget increased to R 101.9m
Upgrading of housing rental stock : R 60m
Hostels budget: R 299m
CAPITAL
OPERATING
Additional operating expenditure of 464.8m
Bulk water Purchases: 8% average increase
Additional 7 300 water connections
Increase in maintenance: R 65.6m
Water loss in distribution reduction from 35.5% to 34.5%
Collection rate:91% mainly due to economic downturn
Theft of water and illegal connections – major challenge

20
Continuation of Water Loss Programme
CAPITAL
OPERATING
Maintenance budget increased to R 809.9m
Provision of new staff: R 38m
Eskom tariff increase: 8%
Loss in distribution: 5.8%
Collection rate: 98%
Theft of cable and electricity- major challenge
Capital budget of R 1.8bn over next 3 years.
Ongoing extension and reinforcements of existing networks
R 150m replacement of 11kv distribution switchgear for Metro area over the next 3 years
In excess of 10 Major new substations to be commissioned or refurbished
Budget of R 440m over three years
Focus on strategic township development, town centre renewals, Industrial renewals, upgrading of tourism nodes and corridors, sector support
programmes and LED projects
Neighbourhood Development Partnership Grant used to create economic infrastructure in undeveloped areas that attracts private sector investment. Grant has been reduced over the next three years.
CAPITAL
OPERATING
Economic Development Programmes: R 24m
Durban Film Office: R 4.6m
Three Cities International marketing strategy: R 14.1m
Reforestation projects - Buffelsdraai & Inanda Dam : R 10.9m
Business Support operational projects: R 10.9m
Travel and Tourism Trade Show (Tourism Indaba) : R 17.4m

21
CAPITAL
OPERATING
ACSA Bus subsidy : R 5m
IRPTN Planning: R 51.4m
People mover: R 30.1m
Public Conveniences: R 10.5m
Public Transport Ranks maintenance: R 2.7m
Institutional arrangements for buses being reviewed
Capital budget: R 3.5bn over three years
An increase in budget is due to an increase in PTIS grant to fund Transport infrastructure for the implementation
of the IRPTN
Major projects include: - Public Transport Fundamental Restructuring
- PT holding areas - IRPTN - Bayhead-Edwin Swales link
- Freight Management Infrastructure
Capital budget: R 1.9 bn over three years
Increase due to the focus on improvement of road network and infrastructure
Focus on refurbishment and maintenance of existing road networks
Constructed 295 Lane km of new roads, 493 km sidewalks, built 80 pedestrian bridges, resurfaced 1 478 lane km of existing roads and converted 297 lane km of gravel to asphalt roads.
CAPITAL
OPERATING
Operating budget: R 1.3bn
Zibambele Poverty Alleviation: R 75m
Public realm and priority zone maintenance: R 88m

22
CAPITAL OPERATING
Additional net operating expenditure: R 423.9m
Provision for maintenance expenditure: R 269.3m
Sludge disposal initiatives: R 48.4m
Security costs for the protection of assets: R 36.5m
Provision for 5 years VIP pit latrine clearance: R 46.5m
Budget of R 2.2bn over three years
Focus on eradication of sanitation backlogs.
Phoenix Waste Water Treatment Works Expansion: R 80m
Kwa Mashu Waste Water Treatment Works upgrade: R 50m
Provision of Ablution Blocks in Informal settlements: R 233m
Budget of R 259m over three years
Commissioning of Electron Rd transfer station and gradual Closure of The Bisasar Rd landfill site R 120m
Buffelsdraai container Gantry R 15m
Provision for replacement of ageing Solid Waste Fleet R 48m
CAPITAL
OPERATING
Achieving nearly 100% coverage in the municipal areas by utilizing community based contractors to provide refuse removal services to all the informal areas R 243.5m
Waste minimization projects: R 11.8m
Gas to electricity – Expenditure: R 32.9m, Income: R 67.5m
ty
Additional operating costs: Electron Rd transfer station R 7.9m

23
6.6 MAJOR ITEMS OF EXPENDITURE
ITEM/DESCRIPTION R’ m
6.6.1 HUMAN SETTLEMENTS AND INFRASTRUCTURE
Point pump station upgrade
Tongaat Central waste water treatment works expansion
Kwa Mashu waste water treatment works upgrade
Addressing of sanitation backlogs
Expansion of Phoenix water treatment works
Providing ablution facilities in informal settlement sites
Western Aqueduct project and Northern Aqueduct improvements
Water loss management project
Water Reuse Project
Mini Hydro Power Stations
Buffelsdraai Container Gantry
Zibambele poverty alleviation project: roads/verge maintenance
Housing delivery programme: 8 500 units
Rehabilitation and upgrading of housing rental stock
Upgrading and conversion of hostels into family units
Roads rehabilitation and maintenance
Gravel roads maintenance
Electricity network maintenance
Strategic Roads Assets management
Drains cleaning and maintenance
Maintenance of priority routes
Rivers and stream cleaning
Stormwater Infrastructure
Structural maintenance – bridges etc
People mover- Interim
Durban Transport bus service
16.0
50.0
50.0
40.0
80.0
275.0
434.0
50.0
50.0
40.0
15.0
80.0
789.0
6.0
165.0
199.0
371.9
21.7
712.8
156.0
46.0 56.0 20.0 17.5 12.4 30.0
152.8
6.6.2 CORPORATE AND HUMAN RESOURCES
Continual roll out of employee wellness interventions
A Talent Management Framework and strategy implementation
Medical Surveillance: detection and management of occupational diseases
HIV and AIDS counselling and testing services for employees
Management Development Programmes: development of the municipality’s leadership
Adult Basic Education & Training (ABET): general level of education
Learnerships/Skills/Apprenticeships Programmes: Learnerships will be implemented / continued for targeted units
Scarce Skills interventions for maths, science and technology and other technical areas
2.9
2.3
1.3
1.3
5.4
5.0
8.3
1.3
6.6.3 SUSTAINABLE DEVELOPMENT AND CITY ENTERPRISES
Cato Manor ABM operational projects
Umlazi operational projects
Economic programmes, improve and grow the economic base of the city
Durban Film Office programmes
Reforestation project (Buffelsdraai and Inanda)
Durban Tourism bid support and presentations - attraction of major national sporting events
Three Cities international marketing strategy
Tourism Indaba-Travel and Tourism Trade Show
Durban Tourism brand advertising and domestic marketing
Durban Tourism Events
Business Support operational projects
Durban Business Fair-Create platforms for interactions and networking amongst business
Best Practice City Commission
2.7
4.2
24.0
4.6
10.9
5.0
14.1
17.4
8.5
5.3
10.9
8.0
3.1

24
Sector Development and Creative Industries
Town Centre Renewal
Neighbourhood Development Programme-Kwa Mashu
Tourism Development
16.3
77.0
10.0
17.4
6.6.4 GOVERNANCE
Food Aid Programme: 18 soup kitchens
Senior Citizens Programme: special events recognising our senior citizens
Community based planning & implementation
Regeneration and upgrade of City Hall
Printing and distribution of Municipal Gazette: eZasegagasini
Ward Committees training
Renovations to regional centres/administration buildings
Mayoral Imbizo
Security services for councillors and regional centres buildings in the municipal area
13.1
12.9
3.8
15.0
9.7
2.5
10.3
4.00
36.5
6.6.5 OFFICE OF THE CITY MANAGER
Legislative Compliance: rationalisation of the municipalities by-laws
Legal Fees: Litigation
Sale of broadband: Income
Maintenance, management and monitoring of the municipality’s IT network
Programming: Applications and systems software
Special events: special and ad hoc events, conventions / international conferences
Long Term Development Framework (LTDF)
2.6 14.7 22.6 32.4 26.6 82.6 3.6
6.6.6 COMMUNITY AND EMERGENCY SERVICES
Fleet maintenance for Fire & Emergency unit
Specialised fire fighting support vehicles
Public/Private partnership for effective policing of the parking meter system in the city
Electronic traffic enforcement
Disaster risk assessment
CCTV camera repairs
Installation and maintenance of the Emergency Services System
Implementation of Safer Cities Plan
ITRUMP operational projects
External security for safeguarding of council assets
6.5
3.0
3.9
3.7
4.7
5.5
2.7
2.7
4.0
360.0
Providing library facilities 16.0
Water Safety Awareness: learn to swim programme - approximately 5 000 learners
Use of cooperatives / emerging contractors for maintenance of facilities
Grass cutting and weed control: contractors
Provision of pool chemicals at swimming pools: Water quality
Youth sports development and football league
Celebrate Durban Sport Programme: 100 wards
Participation in Kwanaloga Games
Arts and culture interventions
0.5
5.6
49.4
4.3
2.6
1.6
2.5
6.9
6.6.7 TREASURY
Centralisation of Mechanical Plant Workshops
Land and property rights acquisitions
Fleet replacement
Maintenance of vehicle and bus fleet (Grant funded)
Energy saving marketing projects
10.0 5.7
35.0 156.0
3.9

25
6.7 CHALLENGES FACING THE MUNICIPALITY
6.7.1 CLIMATE CHANGE
Climate change is likely to cause a number of challenges for eThekwini Municipality, linked to global impacts such as extreme weather events (e.g. flooding and drought), sea level rise and rainfall variability. Temperatures in Durban are likely to increase and projected annual rainfall changes are likely to include a general wetting and an increase in rainfall. These changes in temperature and rainfall may lead to numerous impacts on water availability, agricultural productivity and food security particularly in subsistence farming areas. Temperature increases will also likely cause the spread of water and vector borne diseases to previously unaffected areas in Durban. Water availability is a key climate change related vulnerability and negative impacts on the availability of water will be felt by people, ecosystems and the economy.
The municipality is leading the climate change revolution in local government and has been for a number of years with the most recent programme being the development of the “Durban Climate Change Strategy (DCCS)”. Furthermore, the KZN Provincial Government has announced new Green Industry Projects which includes the installation of 30 000 Solar Water Heaters on eThekwini home rooftops before 2015. A KZN Climate Change Council has been formed as part of a plan to reduce the impact of climate change.
6.7.2 THEFT OF ELECTRICITY
Many outages are experienced on the electrical network during the year due to theft of electrical infrastructure, causing the majority of temporary blackouts around the city. The Municipality is losing about R40 million a year in illegal electricity connections and is also concerned about the number of deaths caused by electrocution due to dangerous connections. Anti-theft campaigns and mitigation strategies continue to restrain this endemic. As a means to clamp down on this practice the Municipality conducted covert operations in informal settlements. The municipality has also used protective structures to secure its electricity meters to prevent unauthorized access to the meters. A Cable Theft Task Team has been established and works with the South African Police Services, with the team purely concentrating on curbing cable theft. Although many areas within the municipality experience cable theft causing electricity supply disruption, hotspots have been identified by the task team. A total of 44 sub-stations in the city have been identified as ‘hot spots’ for copper theft and the security features of the sub-stations were enhanced with pepper-gas systems being installed. A cable theft hotline number is operational for the residents to report any incidents or suspicious activities.
6.7.3 UNFUNDED MANDATES AND FUNDING REALITIES
Certain non-core functions and services which in terms of the constitution fall under the responsibility of National or Provincial Authorities are being provided by the municipality. These functions include the provision of Health Services, Libraries, Museums, and Housing. The reduction or non – payment of subsidies for these services require the municipality to allocate its own resources to make up the shortfall. Although we have done much to address the development challenges of our city, meeting targets will continue to depend on financial support from Provincial and to a larger extent National Government. We believe that given adequate levels of funding, our city could meet the huge challenges we still face. It is pleasing to note that in order to address their constitutional mandate, the Provincial Department of Arts and Culture has indicated that phasing in of specific funding allocations will continue in respect of the library service (subsidy towards staffing costs). Regarding the Health Service, the ongoing engagement with Province has yielded some positive results in that the level of subsidy is increasing annually towards this function. The transfer of these subsidies is subject to terms and conditions, with reporting requirements, which are agreed upon by both parties under signed Service Level Agreements.
The unfunded mandates for 2013/14 are as follows:
R’m
Libraries 220.4 Health – Other municipal health services 325.4
Museums and Heritage 46.2 Housing: New development and Hostels 247.1
Formal Housing 24.3
863.4

26
6.7.4 SALARIES AND ALLOWANCES
In order to ensure effective utilisation of available budgetary provisions and contain personnel costs, this expenditure is continually being reviewed and the filling of all vacancies currently has to be authorised prior to the recruitment process. As a result the percentage Salaries and Allowances of the total Operating Budget has declined steadily over the years to a level of 23.3%. Whilst this percentage reflects a decreasing trend (mainly due to the bulk electricity purchases increasing at a fast rate thereby driving the relative share of all other expenditure categories down) there has been an increase in the number of posts and positions filled in the past three years. Furthermore, as a result of a review of the temporary council contract staff being undertaken it was resolved to do a further conversion exercise to convert qualifying contract temporary staff to permanent employment with effect from 1 December 2012, subject to criteria.
6.7.5 UNACCOUNTED FOR WATER (LOSS IN DISTRIBUTION)
In view of the substantial investment in the water pipe replacement program, the water loss is still a cause for concern. Water loss management is an ongoing project aimed at reducing the real water losses in the municipal area. Initiatives to reduce the water loss are continuing and based on the intervention plan established, a system of performance monitoring and reporting for each of the identified interventions has been established. The municipality has also implemented the water amnesty project whereby citizens using water illegally could come clean and disclose their illegal water connections.
Every possible measure will be taken to curb the water loss as this has an impact on the setting of an affordable water tariff. It is estimated that for the 2013/14 year the targeted loss in distribution will be a reduction to 34.5%. The effectiveness of the measures put into place will be reviewed on an ongoing basis.
The following interventions are being instituted to reduce the water loss: - Lowering of supply pressure standards to reduce average zone pressure - Conducting of active leak detection to 4000 km of network annually - Rehabilitation and replacement of ageing infrastructure - Replacement of meters in line with the Asset Management Plan
6.7.6 DURBAN TRANSPORT
A review of the institutional arrangements of Durban Transport including the existing operator model has recently been undertaken. Various proposals were considered in order to determine the best way forward. A company was commissioned by the municipality to determine on the most appropriate option for the city’s transport system looking at feasibility, funding and financial implications. The decision on whether to operate Durban’s Transport service as a council unit, a trading service or a municipal entity was guided by the findings of the company. Currently, the City transport system is managed on a month-by-month basis by Transnet Africa. With the assessment having being completed, Council can decide on an institutional mechanism to provide a Durban Transport service with implementation being effected within 12 months. Furthermore an interim contract of 12 months be negotiated with current operator. The Proposed assignment of the transport function to municipalities will impact on the costs to the City as the PRASA and bus subsidies are not adequate and this could severely impact on Local Government Finance.
In order to address the challenge of a faster, more effective public transport for eThekwini residents, the municipality will, in four phases over the next ten years develop an Integrated Rapid Public Transport Network (IRPTN). This will indeed be a milestone for the city in the endeavour to be on par with other global cities in respect of public transport.
6.7.7 HOUSING / HOSTELS
The continued urbanization trends are severally impacting on the City and increases the housing backlogs. In addition the development of affordable, well located housing opportunity is a challenge for the municipality. A number of constraints to land acquisition is adversely impacting on the delivery of low cost housing and needs to be acknowledged. These include amongst others, poor geo-technical conditions high land value, competing land uses, environmental restrictions and the cost of densification etc. The key to the future development is the availability and, where required the acquisition of appropriate land for all formats of housing delivery. Limited funding and increasing development costs as well as long processes of project approval are causing the program to slow down. The assignment of the housing functions with full housing accreditation to the municipality with direct capital flow would help to alleviate the situation. In addition, delays in the awarding of tenders and contracts being deferred have also impacted in the housing delivery program with a significant drop in the number of units being delivered. Furthermore, the cost of servicing housing sites (infrastructure) has increased substantially. Necessary measures on the transfer from rental to ownership will need to be taken to ensure that those tenants that do not wish to

27
transfer be provided with alternate accommodation. The increasing deficit anticipated for the operation of the hostels is cause for serious concern.
6.8 ALIGNMENT WITH NATIONAL AND PROVINCIAL PRIORITIES
The Constitution of South Africa recognises that the national, provincial and local government spheres cannot work independently of each other. It provides for co-operatives governance and that all three spheres of government align their functions, responsibility, policies, strategies and programmes. This includes natural co-operation and support to facilitate the delivery of services, overall development and growth. In local government, as much as there is a specific mandate given to the municipality, we have to endeavour at all times to align our efforts with that of National and Provincial government to bring about a better life for all. In developing this budget, the 12 National Outcomes as adopted by Government, have been taken into consideration. The budget addresses those challenges from a policy perspective and implementation is at an advanced stage in all areas. The municipality is confident that this budget is structured to give effect to the strategic priorities and to support long-term sustained growth and development, in line with National and Provincial objectives and with the key objectives identified in the National Development Plan. Local Government has a crucial role to play in the new growth path and the realisation of many of government’s outcomes. All spheres of government place a high priority on expanding the economy, infrastructure development, job creation, efficient service delivery and poverty alleviation. Local priorities were identified which are mainly in line with the national and provincial priorities.
LOCAL PRIORITIES
Growing the economy and job creation
Expanding and improving municipal infrastructure
Accelerated and improved service delivery to communities
Fighting poverty, and building safe, secure and sustainable communities
Improving skills development to raise productivity
6.9 FINANCIAL STRATEGY, ONGOING VIABILITY AND SUSTAINABILITY
The application of sound financial management principles for the compilation of the city’s financial plan is essential and critical to ensure that the city remains financially viable and that sustainable municipal services are provided economically and equitably to all communities. In terms of its financial strategy, the municipality continues to display a robust financial profile characterised by strong cash generation and high liquidity levels.
The vision of the city will be achieved by growing its economy and meeting people’s needs so that all citizens enjoy a high quality of life with equal opportunities in a city that they are truly proud of. The needs of the community and the high levels of poverty and unemployment places excessive demands on the municipality’s existing financial resources and threatens to constrain the organization financially if these resources are not properly managed.
6.9.1 FINANCIAL STRATEGY
These challenges require the development and implementation of a financial strategy that will generate adequate cash resources, on a sustainable basis:
To provide basic infrastructure and services to the community,
To enable the Municipality to achieve its vision of a high quality of life for all citizens in the city,
To create an environment for business growth and investments conducive to economic development, and
To ensure financial sustainability of the municipality into the future.
Financial sustainability and viability remain the key principles in the financial planning process and, to ensure compliance with the Municipal Finance Management Act, a Financial Strategy for the municipality was developed and adopted by Council. The municipality’s response to addressing its priorities from a financial perspective is as follows:

28
COMPILE A BALANCED AND REALISTIC BUDGET WITH CASH FLOW TO MATCH
The municipality’s budget must set out realistically anticipated revenue from each revenue source.
The following steps will be carried out in respect of expenditure and revenue items, viz.
All Operating Income and Expenditure increases are to be maintained in line with inflation, as far as practicable. Further, annual salary increases are subject to National Bargaining Council negotiations, but every effort shall be made to keep them within the band of inflation proposed by the National Government.
Overall expenditure has been reduced to around 7%
An Asset Management Plan be implemented that will result in programmed maintenance of the municipality’s assets, to enable the optimal use of such assets and to ensure their replacement.
Depreciation Policy
- The Municipality’s depreciation policy is in accordance with the requirements of the Standards of Generally
Recognised Accounting Practice (GRAP).
- Assets are depreciated on a straight line basis over their estimated useful lives.
- The remaining useful lives of assets will be reviewed annually and amended in accordance with the conditional
assessment of the asset.
- The annual depreciation charge will be amended accordingly.
A programe be implemented to reduce the water losses to 25% over a period of five years.
In order to contribute funds for future capital expenditure and to reduce dependence on borrowed funds,
a Capital Replacement Reserve has been established, and funded from the following sources:-
- Any betterment achieved from budgeted Water and Electricity operating results, including savings achieved
through reductions in losses in distribution
- Any betterment in Rate and General operating results
- Dependant on the impact of tariffs, an additional contribution will be considered
To maximize additional revenue sources, the following will be pursued:-
- Maximize investment rates, especially on call account
- Development charge
- Business Tax
- Grant income to be maximized
Surplus Policy - The surplus generated annually will be reviewed and a cash backed element will be ring-fenced to finance the
provision of future infrastructure and other capital projects.
CAPITAL EXPENDITURE
The 10 year financial model is informed by the IDP and the current service delivery backlogs. At this stage, capital expenditure is projected for the MTREF period. The capital budget is split appropriately between economic, social and rehabilitation , environmental and administration expenditure.
FINANCIAL INDICATORS
The key indicators below form the parameters within which the municipality aims to operate in order to achieve the objectives set out in this document.

29
Balance Sheet Ratios:
- Gearing Ratio:-
Calculated as Borrowings over Income. Currently the industry norm is 40% but National Treasury has indicated some years ago that 50% is acceptable for municipalities. We are currently at 39% with curtailed borrowings.
- Current Ratio:-
Calculated as Current Assets over Current Liabilities will be maintained at 1.2:1
No. of Days Cash and Investment on hand:
The accepted norm is 90 days. The strategy is to build the municipality’s cash reserves to meet this requirement. The days cash on hand is anticipated to be 89 days by year end, amounting to R 5 billion.
Revenue Ratios:
- Debtors days:-
In respect of key services this will be closely monitored. With the municipality strictly implementing a council approved comprehensive Debt Collection and Credit Control Policy, conservative approach to collection practices, the number of debtor days outstanding is projected to be maintained at around the current average levels of approximately 130 days.
- Bad Debts Provision:
Will be prudent into consideration the actual collection rate and impairment. Any debt over 120 days will be provided for.
FREE BASIC SERVICES
The municipality is required to make available free basic services to a large component of poor households. The cost of free basic services impacts on the city’s finances and therefore there is a need to ensure adequate growth in the rates base by promoting economic development as this impacts on the city’s ability to cross-subsidise. This also impacts on the extent that higher-end consumers subsidise indigent consumers and hence the level of tariff increases (Item 8.2 refers).
The implementation of this strategy will contribute considerably towards ensuring financial viability and sustainability of the organisation into the future. The budget of the municipality is funded in accordance with the requirements set out in the MFMA, thereby ensuring the municipality remains as a going concern and is able to sustain existing services and progressively extend services.
6.9.2 THE MUNICIPAL INFRASTRUCTURE INVESTMENT FRAMEWORK
The municipality has embarked on a Municipal Infrastructure Investment Framework for the city. The municipality is committed to ensuring that all backlogs in the provision of infrastructure are removed. However, this must be done in such a way so as to ensure that the municipality, which is at the forefront of infrastructure delivery, remains financially viable and have the capacity to operate and maintain this infrastructure.
The Municipal Infrastructure Investment Framework (MIIF) thus aims to establish:
The extent of infrastructure to be provided;
The capital expenditure required to provide this infrastructure;
The extent to which financing is available for this capital expenditure;
The operating expenditure required to ensure that the infrastructure provided is properly operated and maintained;
The extent to which revenue can be raised to cover this operating expenditure, within the provisions of the Municipal Fiscal Framework.
The framework also considers the monitoring systems required to assess progress with respect to infrastructure delivery as well as processes to ensure that systems and management capacity are in place in municipalities to manage the infrastructure, with the emphasis on a municipal infrastructure asset management strategy.

30
6.9.3 MUNICIPAL SERVICE FINANCIAL MODELLING FOR ETHEKWINI
In order to determine the overall sustainability of eThekwini finances, a Municipal Services Financial Model (MSFM) has been completed for the municipality. The MSFM calculates the capital expenditure required over ten years to meet service delivery targets and assesses the capital finance sources available. It also calculates the operating expenditure required to operate and maintain infrastructure adequately and determines whether operating revenue available will be sufficient to cover this expenditure.
The model has provided valuable insights into the overall functioning of the municipality. Maintaining financial viability is obviously critical to the achievement of all other objectives and hence the results of the MSFM must be used to align the capital and operating budget spend in order to achieve this long term financial sustainability.
The model has been applied to the 2014/15 and 2015/16 capital budget, allowing us to prioritise more effectively.
6.9.4 INFRASTRUCTURE DELIVERY MANAGEMENT SYSTEMS (IDMS)
In order to customise the Infrastructure Delivery Management System (IDMS) for local government, the municipality is participating as a pilot in the programme. The IDMS is described as the process that makes up public sector infrastructure/construction delivery and directly related procurement management, and is seen by National Treasury and other stake holders as the model for the best practice infrastructure delivery. National Treasury credits eThekwini Municipality as being well ahead with most of the infrastructure delivery process especially regarding infrastructure planning and construction procurement.
The Engineering Unit will manage the process within the city through collaboration with National Treasury, CIDB and other stakeholders, both internal and external, ensuring technical cohesion and aligned support service. Our alignment as a city with the principle of IDMS as outlined by National Treasury is envisaged as an opportunity to:
improve multi-year portfolio, programme and project management principles both within and well beyond the current MTEF cycle.
improve project strategy, planning and prioritisation through improved alignment with IDP and other objective driven strategies
consolidate related input, processing output to a single source system leading to improved reporting, visibility and accessibility.
In doing so will improve infrastructure delivery, be fully aligned to National Treasury’s infrastructure alignment model developed through their infrastructure Delivery Improvement Programme and additionally have the benefit of the assistance of National Treasury resources.
6.10 MUNICIPAL ENTITIES
Inkosi Albert Luthuli International Convention Centre (ICC)
Developed as a catalyst for economic growth for Durban and KZN, the Centre has contributed significantly to the sustainability of the hotel, restaurant, transport, retail and logistics sectors. Opened in 1997 and with the addition of the arena in 2007, the ICC has been transformed into the largest flat floor, column free exhibition/conference space in Africa. The ICC has made tremendous contribution to the economic prosperity of the city and the province and reflects its success as a municipal entity. It has contributed to putting the city on the global conferencing map and has become a vital catalyst for economic growth, for the City, KZN, and South Africa. During the 2012 financial year the ICC has managed to achieve excellent results, setting a new revenue record and achieved a positive net profit. The revenue generated for 2012 has been the highest since the establishment of the ICC. Tight controls over costs contributed to increasing the operating profit which is an extremely positive return in investment to the stakeholders. One of the first of its kind in South Africa, ICC has recently celebrated its 15th anniversary. Having contributed R 3 .11 billion in the last year to the GDP, the ICC has further demonstrated the important role that it plays in the South African Economy. 2012 has been a record year with the ICC being the best performing convention centre in the country.
The ICC will continue to focus on growing its core business and retaining the status as Africa’s Leading Meetings and Conference Centre. Having hosted some of the biggest most high profile conferences in the world, the multi-award-winning ICC was this year named Africa’s Meeting and Conference Centre by the World Travel Awards for the 11th time in 12 years.

31
Durban Marine Theme Park (Ushaka Marine World)
uShaka Marine World is the largest marine theme park in Africa and consists of four divisions covering 16 hectares.
Paid footfall into the two main components of the park came in at 1 315 018 visitors. A number of projects were completed during the past year including the addition of a wet area to Ushaka Kids World, an energy saving project, various new animals exhibits and a new slide for ‘Wet ‘ and Wild which opened in December 2012. The growth in footfall has continued and Ushaka remains a key destination within KZN and Durban for both tourists and locals. The park is a strategic asset for the City in terms of both tourism and urban renewal in the Point Precinct. In the 9 years of its existence, uShaka has contributed approximately R 2 billion towards the local GDP and created around 12 000 jobs(direct and indirect). In the short term (i.e. 2/3 years), a consolidation approach will be adopted with an emphasis on utilizing scarce funds for priority maintenance projects, as well as quick revenue enhancing opportunities.
The operating company management contract is due to expire on 31 March 2013 and the municipality has resolved not to renew the contract. Accordingly the Board of the Durban Marine Theme Park will manage the organisation with its own staff complement, expertise and resources. All staff employed by the Management company will be transferred to the Theme Park and it is anticipated that there will be a minimal disruption to operations.
The medium term will move towards the re-capitalisation phase with more significant upgrades required to ensure the longevity of the park and continued footfall growth. It is envisaged that with the park being able to generate savings in management fees under the new structure, these funds could be deployed in introducing new attractions and keeping the park “fresh”. UShaka is entering an exciting next phase of its life cycle with the opportunity to introduce an iconic new attraction or two for Durban. This idea will form a key part of the strategy going forward in the era without a management company involved and together with the City, various options will be explored in terms of enhancing uShaka as a major draw card for Durban.
In compliance with the Municipal Finance Management Act, both the municipal entities have submitted their budgets and business plans for consideration by the Municipality.
7. BUDGET PROCESS
7.1 OVERVIEW
Budgeting is primarily about the choices that the municipality has to make between competing priorities and fiscal realities. The budget process is an effective process that every local government must undertake to ensure good governance and accountability. The process outlines the current and future direction that the city would follow in order to meet legislative stipulations. The budget process enables the city to optimally involve residents and other stakeholders in the budgeting process.
The budget preparation process is guided by the following legislative requirements:
Municipal Budget and Reporting Regulations
Municipal Finance Management Act
Municipal Systems Act and
Municipal Structures Act
Section 21 of the MFMA requires that a time schedule setting out the process to draft the IDP and prepare the budget be tabled ten months before the financial year. In compliance with this requirement the IDP and budget time schedule was tabled before council in August 2012. The main aim of the timetable is to ensure integration between the Integrated Development Plan, the budget and allied process towards tabling a balanced budget.
In October 2012, a budget workshop was held as a prelude to the commencement of the budget process to review the 2012/13 budget and to enable strategic discussions pertaining to the budget process. The workshop dealt with past performance trends of operating and capital budgets, identified budget realities going forward and set the criteria and basis to be used in the appropriation of financial resources amongst city functions during the budget cycle. Thereafter budget instructions (broad expenditure parameters) were issued to departments by the Budget Office.
Budget meetings were also held with various clusters. At these meetings, budget strategy, budget policies and the alignment of the operating budget with the IDP were discussed. The IDP’s strategic focus areas informed the development of the budget, in addition to assessing the relative capacity to implement the budget, taking affordability considerations into account.

32
During February 2013, further deliberations were held on the budget with the various Cluster Heads and their teams with a view to assessing the budget and reducing the deficit in order to ensure that the increase in rates and tariffs to balance the budget was restricted to an acceptable level. Furthermore, the City Manager hosted a ‘ BUDGET LEKGOTLA’ in February with senior municipal officials and councillors. The workshop was an information sharing session and covered a wide range of national, provincial and local government initiatives. Budget consultations and presentations were made to the Durban Chamber of Commerce and Industry during November 2012 and March 2013.
The mechanism through which the needs of the municipality are identified and priorities set is the Integrated Development Plan (IDP). The capital budget is then accordingly allocated to cover the higher priority projects in the IDP. The first draft of the capital budget for the MTEF commencing 2013/14 reflected an over subscription. A series of meetings were held to ensure that the budget is prioritised, balanced and aligned to Councils IDP. A review of the capital borrowings and capital spending took place as the trend in borrowings is not sustainable in view of the increased financial charges and the impacts on tariffs.
The following principles were applied in formulating the medium term capital budget:
Access modelling used when considering requests for community facilities
The 2012/13 capital budget as approved in the previous years MTEF has been used as a base
Budget must be aligned to the IDP
All grant funding had to be verified
Borrowing to be kept to a minimum
A strategic approach with regards to the prioritization of the capital budget has been undertaken using the Municipal Services Financial Model (MSFM) as well as the access modelling tools. The intention was to align our budgeting with the priorities that stem from the IDP and National and Provincial priorities with a view to overall sustainability. The 2012/13 MTEF was utilized as a base for the 2013/14 MTEF. Additional project requests by the departments as a result of changes in priorities were considered. A review of projects was done in order to determine that contract commitment for multi-year projects that commenced in 2012/13 were given priority.
During the prioritization process of the capital budget, the impact of capital projects on future operating budgets
was assessed and considered prior to these projects being approved. Both the operating and capital budgets have
been evaluated through a prioritisation mechanism that ensures alignment to the development strategy of the
municipality.
The budget process AS PER MFMA
Planning
Strategising
Preparing
Tabling
Approving
Finalising
Schedule key dates and review previous
processes
Review IDP, previous performance & current
trends
Prepare draft budget and draft policies, consider
national and provincial priorities
Table draft budget, IDP & policies. Consult and
consider formal input from relevant stakeholders
Council approval of budget and related policies
Approve and publish SDBIP and performance
agreements

33
7.2 POLITICAL OVERSIGHT OF THE BUDGET PROCESS
The key to strengthening the link between priorities and spending plans lies in enhancing political oversight of the budget process. Strengthening the link between Government’s priorities and spending plans is not an end in itself, but the goal should be enhanced service delivery aimed at improving the quality of life for all people within the City. The Strategic Management Team has a significant role to play in the financial planning process.
Section 53(1)(a) of the MFMA states that the mayor of a municipality must provide political guidance over the budget process and the priorities that must guide the preparation of the budget. The Strategic Management Team and the Executive Committee advise Council accordingly. Political oversight of the budget process allows Government, and in particular, the municipality to manage the tension between competing policy priorities and fiscal realities.
7.3 PROCESS FOR CONSULTATIONS WITH EACH GROUP OF STAKEHOLDERS AND OUTCOMES
Section 22 of the MFMA requires that after tabling of the annual budget in Council, the municipality must make public the annual budget and also invite the local community to submit representations thereon. Management within the local government has a significant role to play in strengthening the link between the citizen and governments overall priorities and spending plans. The municipality prides itself of enjoying the reputation of actively engaging many of its citizens as possible in its planning, budgeting, implementation and monitoring processes. In order to strength public participation, the municipality has been rolling out its outreach programme in all 17 zones during the year. Accordingly, the tabling of the draft Budget in council will be followed by extensive publication of the budget documentation in the council’s newspaper, Metro eZasegagasini. Copies of the tabled budget in both electronic and printed formats will be submitted to National Treasury as well as the Kwazulu-Natal Provincial Treasury and the Provincial Department of Co-operative Governance and Traditional Affairs. The tabled budget will also be published on the council’s website. In terms of the Municipal Systems Act and in conjunction with the Municipal Finance Management Act, hearings on the budgets will be held during April 2013 in 17 zones in the eThekwini region with each zone comprising of between five to seven wards. Other key target groups for the budget hearing would include:
- Durban Chamber of Commerce and Industry - Civic Bodies - Religious Organisations - National Treasury
7.4 SCHEDULE OF KEY DEADLINES RELATING TO BUDGET PROCESS The budget time schedule for the compilation of the 2013/14 budget cycle was approved in August 2012, well before the start of the budget year and in compliance with the MFMA.
The table below provides an extract of the key deadlines relating to the budget process:
DETAILS DATE
Tabling of Annual Budget: Council 28 March 2013
Regional Hearings on the Budget April-May 2013
Approval of Final Budget 29 May 2013
Approval of SDBIP by the Mayor 28 June 2013
Submission of Approved budget to National Treasury/ DPLG/Provincial Treasury 13 June 2013

34
8. BUDGET ASSUMPTIONS
8.1 KEY FINANCIAL ASSUMPTIONS
Budget assumptions and parameters are determined in advance of the budget process to allow budgets to be constructed to support the achievement of the longer-term financial and strategic targets. The assumptions and principles applied in the development of this budget are mainly based upon guidelines from National Treasury (expenditure growth) and other external bodies such as the National Electricity Regulator of South Africa (NERSA), Umgeni Water and other major service providers. The municipal fiscal environment is influenced by a variety of macro economic control measures. National Treasury determines the ceiling of year-on-year increases in the total operating budget, whilst the National Electricity Regulator (NER) regulates electricity tariff increases. Various government departments also affect municipal service delivery through the level of grants and subsidies.
The following key assumptions underpinned the preparation of the medium-term budget:
8.2 CREDIT RATING OUTLOOK
A credit rating is an independent opinion on the ability of an entity to pay its financial obligations, in full and on time. The Global Credit Rating Company (GCR) reviewed the credit ratings for eThekwini Municipality, following a detailed analysis of the municipality’s 2011/12 financial statements and medium-term expenditure budgets and have accorded the following:
Long term: The rating of AA- has been maintained in the ‘double A band’. The rating is defined as having a very high credit quality.
Short term: The rating of A1 has been maintained. The rating is defined as having a very high certainty of timely payment.
Despite the sovereign credit rating dropping, the municipality has once again maintained its excellent, investment grade credit rating. The rating panel were of the opinion that eThekwini continues to reflect a healthy credit rating profile. The rating has been at this highest attainable level in the South African municipal sector for the past ten years. A rating of this nature is crucial for borrowings undertaken and extremely important for the capital expenditure programme.
8.3 BORROWING AND INVESTMENT OF FUNDS
BORROWINGS
The Municipal Finance Management Act No. 56 of 2003 permits long term borrowing by municipalities only to finance capital expenditure, property, plant and equipment.
The eThekwini Municipality’s Infrastructure Financing Strategy is to:
Maximise internally generated funds and national transfers from other spheres of government.
Minimize borrowings.
Pursue alternate funding sources e.g. Development charges, and public private partnerships.
Description 2013/14 2014/15 2015/16
% % %
CPI-Inflation 5.9 5.6 5.4
Remuneration Increase 6.85 6 6
Telephones 5 6 6
Fuel and Oil 12 10 10
Postage & Revenue Stamps 6 6 6
Printing & Stationery 6 6 6

35
CAPITAL EXPENDITURE
The City’s capital expenditure has been funded from a mix of government transfers, internally generated funds and external loans. The 2012/13 Capital Budget of R5,3 billion is being financed by R2,8 billion from government grants, R1,7 billion of internally generated funds and R750 million in external loans.
The graph below shows the Total Capital Budget since 2007 and indicates its funding sources. The figures in the 10 bars are in billions.
Funding of Capex 2007 – 2016
*Loans comprise, on average, only 20% of the funding mix. 2007 – 2012 are Actuals. 2013 to 2016 are Forecasts.
It will be observed that Loans comprise the smallest portion of the funding mix for Capital Expenditure, with Grants being the largest contributor.
BASIC SERVICE DELIVERY
The table below indicates the Capital spend on ‘Basic Service Delivery’ items over the past three years. One will observe that the bulk of the Capital is spent on ‘Basic Service Delivery’ infrastructure. This pattern of expenditure is expected to be maintained for the foreseeable future.
Capital utilised for Infrastructure
2010 2011 2012
Procurement and Infrastructure R’000 % R’000 % R’000 %
Housing & Hostels 136,177 41,917 213,850
Roads & Storm water 1,405,087 994,021 884,789
Transport 0 13,698 120,461
Procurement 239 534 1,093
Sanitation 448,043 350,677 426,008
Solid Waste 118,190 66,177 159,435
Water 1,709,154 1,094,962 483,294
Electricity Services 683,238 585,308 567,382
4,500,128 69 3,147,294 83 2,856,312 83
Total Capital Expenditure 6,493,670 3,776,253 3,443,694

36
The table below indicates the actual borrowings and the future loans to be taken to continue the service delivery programme.
Actual Forecast
2012 2013 2014 2015
R’m R’m R’m R’m
Total debt 10,679.0 10,590.0 10,663.0 10,500.0
Loans Raised 1,000,0 750,0 1,000,0 1,000,0
It should be noted that the net loan book over the MTEF period reduces by R 179m and the gearing reduces to 39%.
FUTURE CAPITAL PROGRAMME FOCUS
Following a sharp reduction in 2012 (R3,5 billion) the eThekwini’s capital programme is expected to regain momentum going forward, rising by a significant R2 billion to R5,3 billion in 2012/13. It will average an annual R5,8 billion from 2012/13 to 2014/2015. The primary focus of the City’s capex programme of R 17.6 billion over the next 3 years remains road transport, at 31% of annual aggregate capital spend. In view of the delegation of housing infrastructural responsibilities from provincial government to eThekwini, this is expected to represent an average annual 15% of the capital budget. In terms of the MSFM model, the major portion (40%) of the capital budget is allocated towards social development projects, 30% each towards rehabilitation projects and economic development.
An aggressive focus will also be placed on rolling out sanitation facilities, which has generally lagged other key services. The bulk of the remaining projects will focus on erecting new, as well as replacing dilapidated electricity and water assets. Overall, expansionary capex is expected to represent approximately 70% of total infrastructure spend from 2012/13 to 2014/15 with the balance allocated to uplifting existing assets.
LONG TERM BORROWING
APPROACH
Long term borrowings in eThekwini have risen gradually between 2007 and 2012 and have been mainly in the form of annuity loans, with a significant proportion borrowed from the Development Bank of South Africa. The dominance of annuity loans within eThekwini’s borrowing portfolio is largely due to the ability of the City to source competitive interest rates from commercial banks. While a bond issuance is a viable option for eThekwini, in part due to an excellent credit rating of AA - issued by the Global Credit Rating Company, annuity loans are preferred.
This is because they are a cheaper source of finance and are less risky for the City, as the principal is paid over the duration of the loan instead of a bullet payment at the end of the term. The City has in the past preferred fixed interest rate annuity loans as they eliminate interest risk associated with variable rate loans.
The eThekwini Municipality new loan profile for 2012/13 is as follows:
INSTITUTION Fixed Interest Rate*
Duration in Years
R m Status
ABSA 8.69% 15 750 Draw Down by 28/06/2013
*It is anticipated that the R750m loan will be drawn down on the 28 June 2013.
The above mentioned loan is unsecured which is an acknowledgement by lenders of the municipality’s sound financial standing and reputation to meet its loan obligations.
DEBT CAPACITY INDICATORS
The City tracks a number of key debt capacity indicators, with the prudential limits for each of these ratios being summarised below:
Gearing should preferably be maintained at 40 per cent of total revenues.
Debt service costs should not exceed 10 per cent of total operating revenues.
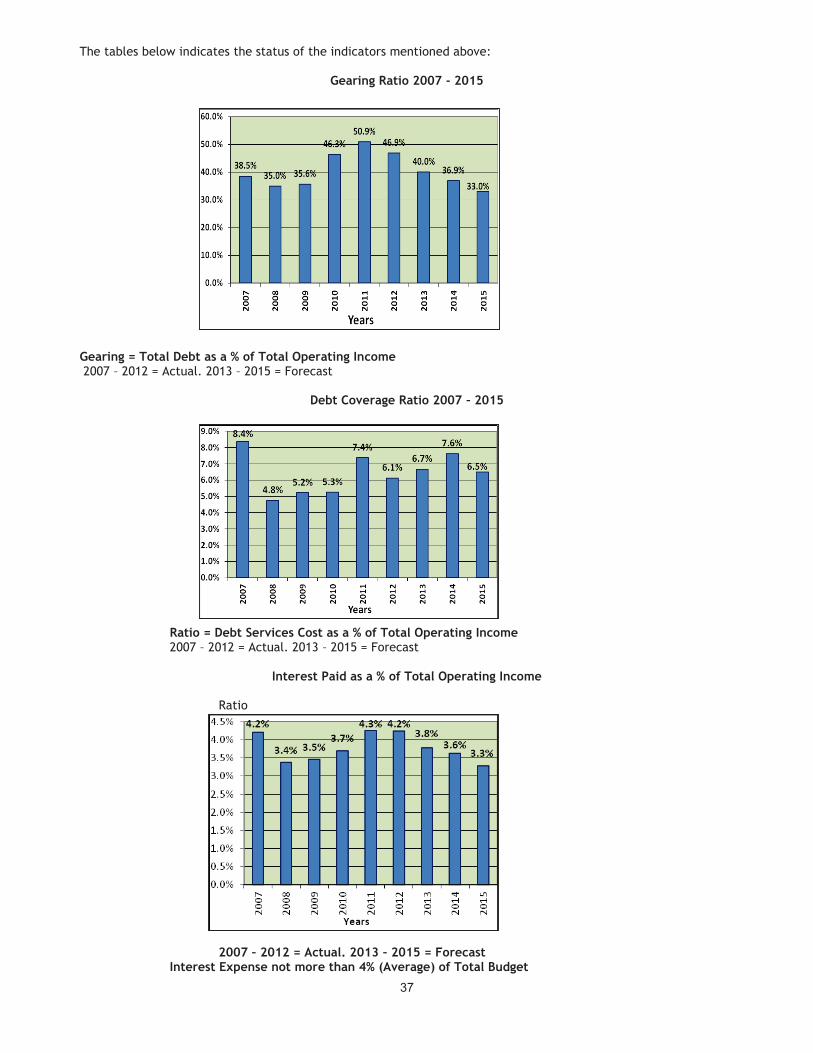
37
The tables below indicates the status of the indicators mentioned above:
Gearing Ratio 2007 - 2015
Gearing = Total Debt as a % of Total Operating Income 2007 – 2012 = Actual. 2013 – 2015 = Forecast
Debt Coverage Ratio 2007 – 2015
Ratio = Debt Services Cost as a % of Total Operating Income 2007 – 2012 = Actual. 2013 – 2015 = Forecast
Interest Paid as a % of Total Operating Income Ratio 2007 – 2012 = Actual. 2013 – 2015 = Forecast Interest Expense not more than 4% (Average) of Total Budget

38
The graphs shown above indicate that the City has not breached any of the prudential ratios set, except the Gearing Ratio for three years, including the World Cup event. At that time National Treasury was also advocating a more aggressive capital spend. The borrowings are therefore sustainable and affordable. FUTURE TREND Government grants are budgeted to fund the bulk of capex spend annually (2013: 54%; 2014: 55%; 2015: 61%), underpinned by the recent introduction of the urban development settlement grant. The City has revised medium term borrowing forecasts significantly downward. During the previous Budget review, the City expected to source around R 2 billion in new loans annually from 2012 to 2014. However, only R 1 billion was raised in 2012, while for 2013 a R 750 million loan (compared to a budget of R1,5 billion), and a further R1 billion in each of 2014 and 2015 is contemplated. In view of the sustained strong growth in income, gearing is forecast to fall to 40% in 2013 (2012: 47%), and further to 37% in 2014 and 33% in 2015. Furthermore, liquidity metrics are expected to remain sound, with days cash on hand forecast to be maintained above 85 days over the next 3 years.
Forecast Balance Actual Forecast
Sheet (Rm) 2012 2013 2014 2015 Short term debt 772.3 1,156.8 1,021 1,010.0 Long term debt 9,906.7 9,433.2 9,642.0 9,490.0
Total debt 10,679.0 10,590.0 10,663.0 10,500.0 Cash & cash investments* 4,804.1 5,000 5,200 5,300 Key ratios Total debt: income (%) 47.4 40.0 36.9 33.0 Cash cover S/T debt (x) 6.2 4.3 5.1 5.2 Cash on hand (days)* 92 89 87 85
*Includes unspent conditional grants
INVESTMENTS Investments made with the various financial institutions are strictly in compliance with Municipal Finance Management Act and the Investment Regulations. The investment returns achieved are as follows: -
30 June 2012 30 June 2013 % %
Average rate of return on investments 5.8 5.4 *
Cash which is surplus to immediate requirements is invested in short term money market instruments in terms of a stringent investment policy which specifies that cash holdings only be placed across ‘the big 4’ South African banks and Investec. Cash and investments are expected to be around R5 billion at the end of the current financial year. However, it must be remembered that not all of this amount represents ‘unrestricted’ cash. The following amounts are ring fenced, viz. Self-Insurance Fund R1 billion; Unspent Grants presently R0,5 billion and the Durban Pension Fund R60 million. A Cash holding of R5 billion represents 89 Days Cash on Hand. The National Treasury norm is 90 days Cash on Hand so there is consequently no further leeway to utilise internally generated funds for the Capital Budget.
________________________________________________________________________________ *-indicative rate *-forecast

39
RISKS ASSOCIATED WITH AGGRESSIVE CAPITAL BUDGET
The following risks need to be acknowledged before any consideration can be given to increasing the utilisation of internally generated funds for the financing of the Capital Budget, viz:
Whilst the City presently enjoys a healthy debtors collection rate, sustained high tariff increases being
passed onto consumers may present a challenge in terms of sustaining these levels in the future.
Depreciation provisions every year have to be ‘cash backed’, after providing for the National Treasury norm
for Days Cash on Hand of 90 days. This places a significant higher demand on cash resources.
8.4 PRICE MOVEMENTS ON SPECIFICS
The tariff for 2012/2013 bulk water purchases from Umgeni Water is R 4.28 per kl. Umgeni Water has advised that there will be an 8% average increase, inclusive of the capital unit charge for the construction of the Springrove Dam, in the tariff for the 2013/2014 financial year. The increase is above the current inflation rate to fund future infrastructure development projects. A dispute has been declared regarding this tariff increase and Council will be updated on the progress. A provision of R 1.45 billion has been made in respect of bulk purchases of water.
Purchase of bulk electricity from Eskom amounts to R 6.4 billion. This budget provision includes an estimated 8% increase in the Eskom price of bulk electricity supplied to municipalities as approved by NERSA.
8.5 TIMING OF REVENUE COLLECTION
Consumers are billed monthly in respect of services in the form of a consolidated bill. All annual residential and commercial ratepayers have been converted to monthly ratepayers. However, government departments and companies with more than 150 accounts are allowed to pay annually (by October).
8.6 AVERAGE SALARY INCREASES
The budgeted salary increase is 6.85% for the fiscal year. This takes into account the multi-year Salary and Wage Collective Agreement for the period 1 July 2012 to 30 June 2015. The agreement provides for a wage increase based on the average CPI for the period 1 February 2012 until 31 January 2013, plus 1.25% for the 2013/14 financial year. Provision has been made for actual positions and vacancies together with notch increases. As a result of the annualised effect of vacancies filled during 2012/2013, the conversion of temporary staff, the year on year increase on employee related costs is 10.5%.
8.7 CHANGING DEMAND CHARACTERISTICS (DEMAND FOR SERVICES)
South African cities continue to face significant development challenges despite progress in expanding access to basic services. Rapid urbanisation has brought about greatly increased demands for land, housing, water and sanitation, electricity and transport in large cities. Infrastructure and service delivery functions need to interact effectively to promote efficiency, employment and integrated development. The current pace of urban population growth is outstripping economic growth, presenting major challenges to municipalities. Cities are seen as havens for jobs, better livelihood, access to superior infrastructure and business opportunities by rural communities. eThekwini finds itself in a difficult situation since its good track record of service delivery is attracting further in-migration.
8.8 ABILITY OF THE MUNICIPALITY TO SPEND AND DELIVER ON THE PROGRAMS
Municipalities play a critical role in creating an enabling environment for investments and other activities that lead to job creation. In this regard the 2012/13 capital project spending is estimated to progress to a rate of 101.9% of the capital budget. The achievements and rate of spending during the first half of 2012/13 provide some confidence that this level of spending can be achieved. The municipality has demonstrated over a number of years that it has the ability to spend and deliver on its programmes in its area of jurisdiction. It is anticipated that 99% of the operating budget will be spent in the 2012/13 financial year. Indications are that there might be a slight under spending on employee related costs due to delays in filling of vacancies.

40
CONTRACTS HAVING FUTURE BUDGETARY IMPLICATIONS In terms of the City’s Supply Chain Management Policy, no contracts are awarded beyond the medium-term revenue and expenditure framework (three years). In ensuring adherence to this contractual time frame limitation, all reports submitted to either the Bid Evaluation and Adjudication Committees must obtain formal financial comments from the Financial Management Division of the Treasury Department.
8.9 COST OF SERVICE DELIVERY VS AFFORDABILITY
Over the past few years the functions the eThekwini Municipality has been expected to perform increased according to the needs of the community. Poverty and unemployment is also prevalent in the municipal area. In order to provide assistance to the poorest of the poor the municipality has developed a social welfare package to assist those residents who cannot afford to pay for Services (Refer to Section 9.2 for details).
9. MEASURABLE PERFORMANCE OBJECTIVES AND INDICATORS
9.1 KEY FINANCIAL RATIOS / INDICATORS
The benchmarks reflected in the table below are based on actual audited results in the 2011/12 financial year:
Financial Benchmarks Basis of Calculation 2011/2012
Debt to Asset Ratio Total Debt / Total Assets 0.46:1
Debt to Revenue Total Debt / Annual Income 0.95:1
Average Interest Paid on Debt Interest Paid / Total Interest Bearing Debt 0.08:1
Capital Charges to Operating Expenditure
Interest and Principal Paid / Operating Expenditure
0.06:1
Interest as a % of Operating Expenditure
Interest Paid / Operating Expenditure 4.06%
Credit Rating Calculated by Global Credit Rating Company Short term: A1 Long term: AA-
Current Ratio Current Assets / Current Liabilities 1.38:1
Creditors System Efficiency % of Creditors paid within terms 100%
Electricity Distribution Losses Total units purchased less total units sold / Total units purchased
5.8%
Water Distribution Losses Total units purchased less total units sold / Total units purchased
35.2%
The financial benchmarks reflected in the table above indicate that the municipality continues to maintain its financially healthy status.
9.2 FREE AND SUBSIDISED BASIC SERVICES
One of the objectives of a local authority is to ensure the provision of services to communities in a sustainable manner. The constitution stipulates that a municipality must structure and manage its administration, budgeting and planning to give priority to the basic needs of the community and to promote their social and economic development.

41
To cater for the indigent, the municipality as part of its welfare package provides a basket of free basic services in accordance with a defined level of service. The basic social package is an affirmation of the municipality’s commitment to push back the frontiers of poverty by providing a social welfare to those residents who cannot afford to pay, because of adverse social and economic realities. The estimated cost of the social package (i.e. income foregone) amounts to approximately R 2.7 billion for the 2013/14 budget year. Details of the initiatives proposed to be carried out by the council in this regard are detailed below.
*- There has been a revision to the sanitation\sewerage free basic services as indicated in the above table. Previously the first 9kl of effluent disposal was free to all households. The assistance to the qualifying households are regulated by council’s budget related policies which are reviewed annually based on modelling the impacts of the tariffs on all residential properties. The cost of this social package is partially funded from the equitable share of R 1.8 billion provided by National Government.
9.3 DRINKING WATER QUALITY AND WASTE WATER MANAGEMENT eThekwini Water Services performs the role of the water service authority whilst Umgeni Water is the water service provider for the municipal area. eThekwini Water and Sanitation Unit is committed to providing safe drinking water of the highest quality as well as treating waste water responsibility so that it does not negatively impact on human health or our environment.
SERVICE SOCIAL PACKAGE APPROX. COST R’M
EST.NO. OF HOUSEHOLDS
Assessment Rates
Properties valued up to R 185 000 will be exempt from paying rates. All other properties valued above R 185 000, the first R 120 000 no rates charged
369 670
Pensioners, child-headed households, disability grantees and the medically boarded are exempt from paying rates on the first R 460 000 of their property value (This amount is inclusive of the R 120 000 mentioned above). Rebate increases from R 259 per month to R 278 per month.
No rates levied on first R 30 000 value of vacant land
52 505
28 553
1 585.4 450 728
Water The first 9kl of water is free to households with property values
under R 250 000.
582.0
518 200
Electricity The first 50kwh of electricity is free to residents using less than 150kwh per month in Eskom reticulated areas
The first 65kwh of electricity is free to residents using less than 150kwh per month in eThekwini reticulated areas
1.1
74.4
2 320
82 546
Refuse Removal
Residential property valued up to R 250 000 exempt from domestic refuse removal tariff
352.8
763 153
Sewerage/ Sanitation
The first 9kl of effluent disposal is exempt for all properties with values under R 250 000 (Revised).*
178.5
218 368
Total 2 774.6

42
BLUE DROP CERTIFICATION
The municipality continues to manage drinking water within its area of jurisdiction with distinction. This is evidenced by the municipality improving on the Blue Drop status scoring 98.8% in 2012 and coming fourth in the country. This prestigious award is only granted if 95% compliance with certification standards is met. GREEN DROP RATINGS
Waste water treatment works operated by the City are authorised to discharge treatment effluent to rivers and the marine environment. The water and sanitation unit of the municipality was awarded a Green Drop award in recognition of excellence in the management of waste water in 2011/12. The Green Drop regulation programme was established by the Department of Water Affairs to certify the waste water systems of all municipalities and water service providers. The unit was recognised for the best Green Drop performance in the province with a score of 90.6%. Budgetary provision for the upgrades and maintenance of water reticulation and sewerage treatment works is made in the MTREF to ensure that systems are capacitated to deliver at acceptable standards.
10. BUDGET RELATED POLICIES: OVERVIEW AND AMENDMENTS
The MFMA and the Municipal Budget and Reporting Regulations require budget related policies to be reviewed, and where applicable, to be updated on an annual basis. The main purpose of budget related policies is to govern and guide the budget process and inform the projections of the medium term.
The following are budget related policies which have been approved by Council, or have been reviewed /amended and / or are currently being reviewed / amended in line with National Guidelines and other legislation.
10.1 ASSESSMENT RATES POLICY
As required in terms of section 5 of the MPRA, the Rates Policy has been reviewed for the 2013/14 financial year and the amended policy was adopted by Council on 2013/02/27 for public comment.
The applicable assessment rate tariffs are reflected in the Resolutions to Council on the budget.
10.2 CREDIT CONTROL AND DEBT COLLECTION POLICY
As required in terms of section 97 of the Municipal Systems Act, the new credit control and debt collection policy was approved by council on 2010-06-03. The primary objective of this policy is to ensure that all monies due and payable to the municipality in respect of services are collected efficiently and promptly. The policy has been reviewed for the 2013/14 financial year.
10.3 TARIFF POLICY
The Municipal Systems Act requires a municipality to have a tariff determination policy. Accordingly, council adopted a tariff policy on 2013-02-27. The objective of the policy which is consistently applied to all tariffs is to ensure that:
The tariffs of the municipality comply with the legislation prevailing at the time of implementation
The municipal services are financially sustainable, affordable, and equitable
The needs of the indigent, aged and physically challenged are taken into consideration
The policy is drawn in line with the principles as outlined in the Municipal Systems Act.
10.4 WATER POLICY
The initial water policy was approved by council on 2005-06-22 which has subsequently been amended and provides for amongst others things: level of services, provision of water services, payment for services etc.
The Council’s tariffs are affected by the following factors: Bulk purchase cost: Umgeni Water
Unaccounted for water
Debtors collection rate
Cost of free basic water

43
10.5 SUPPLY CHAIN MANAGEMENT POLICIES
The current policy reflects and represents the context of a specific government policy that finds expressions within the provisions of the Municipal Finance Management Act 56 of 2003. The principal objectives of the policy are to provide, promote, and implement theoretical guidelines, governing processes and procedures within the supply chain management.
The SCM Policy was adopted by council on 2005-09-22 for implementation. This policy is used in conjunction with the Targeted Procurement Policy, originally approved in July 2003, and amended in December 2011 (in keeping with the new Preferential Procurement Regulations of June 2011).
Late in 2008, the Supply Chain Management Unit began a Category Management process to ensure alignment with the creation of an SCM Centre of Excellence which the municipality is currently implementing. This SCM Centre of Excellence will usher in a New Procurement Policy Application and approach in line with International Best Practices, practices that will for the first time harness the municipality spending power and give the municipality much greater flexibility to buy locally.
SCM Policy Review Project
As all SCM processes are required to adhere to the SCM policy, a review of the SCM Policy is required. The review of the SCM policy is currently being undertaken in a phased approach.
Phase 1: Updating the current policy to bring the policy in line with current legislation and policies.
Phase 2: The phase will involve a review of the structure and format of the policy, and develop a new policy which is ground breaking in both format and application. This will also involve the development of guidelines, tools, templates and procedures to support the effective implementation of the policy.
10.6 INVESTMENT / CASH MANAGEMENT AND BORROWING POLICIES
As required by the Municipal Finance Management Act, and in conformity with the Municipal Cash Management Regulations an Investment Framework policy and Guidelines has been adopted by Council on 2004-11-30.
The main objectives of the policy are to:
Maximise returns from authorised investments consistent with minimising risk
Maintain adequate liquidity to meet cash flow needs.
Undertake the investment of funds not immediately required for operational purposes
Ensure diversification of permitted investments
Ensure compliance with all legislation governing the investment of funds.
The Municipality has also prepared a borrowing policy in compliance with the Municipal Finance Management Act and the Municipal Regulations on Debt Disclosure.
10.7 VIREMENTS BUDGET POLICY
In order to give departmental heads greater flexibility in managing their budgets, Virements budget procedures are in place for the revision of budgets (within votes – i.e. Output Unit) via a Virements budget. These procedures provide guidance to managers of when they may shift funds within votes.
To ensure compliance with Section 28 of the MFMA, and the Municipal Budget and Reporting Regulations, procedures were formulated with regards to the transfer of funds and the adjustment budget reporting.
10.8 ASSET MANAGEMENT PLAN
The goal of infrastructure asset management is to meet a required level of service in the most cost effective manner, which is achieved through the management of assets’ life cycle, for present and future generations.

44
National Government has legislated (MFMA), the need for local government to formulate active asset management programmes.
An infrastructure asset management plan technically analyses the life cycle of an asset, and predicts when maintenance needs to be done to the asset before it deteriorates to such an extent that it no longer meets the community’s needs. The municipality is on a drive to introduce good asset management practices in all units and has embarked on the development of a whole of City Infrastructure Asset Management Plan. The purpose of the Asset Management Plan is to improve the management of the city’s assets, predict future asset problems and identify future maintenance costs of all the infrastructure assets. The City has utilized a computerized system to carry out Phase 1 and Phase 2 of this exercise. The program covered problematic areas, and High Level Strategic Areas. Findings from Phase 1 & 2 have allowed the various Departments to improve the Asset Register and provide a high confidence level of services in the area covered. In addition maintenance programs were formulated based on the location and condition of the infrastructure. The future program will complete all assets owned by the eThekwini Municipality to an acceptable level of componentization thereby enabling us to undertake more advanced asset management techniques to be undertaken on those assets that represent the greatest risk to the municipality. Early indicators are that we will require to spend a lot more in maintenance and rehabilitation of assets.
10.9 ACCOUNTING POLICY In order to ensure that the financial statements are compliant with GRAP, the accounting policies were realigned
and approved by council on 2006-06-29. The latest amendments to the accounting policies were approved by
council on 2012-07-24.
10.10 FUNDING AND RESERVES POLICY A funding and reserves policy has been formulated and was approved by the council at its meeting on 2010-05-03. The policy is aimed at ensuring that the Municipality procures sufficient and cost effective funding in order to achieve its capital expenditure objectives in an optimum manner.
10.11 BUDGET POLICY The Budget Policy was approved by council on 23 February 2011.
11. ALIGNMENT OF BUDGET WITH INTEGRATED DEVELOPMENT PLAN Integrated developmental planning in the South African context is (amongst others) an approach to planning aimed at involving the municipality, stakeholders and the community to jointly find the best solutions towards sustainable development. The integrated development planning further provides a strategic environment for managing and guiding all planning, development and decision making in the municipality. The IDP is the result of the planning processes and comprises of a five year period which correlates with the term of the political incumbents. 11.1 THE IDP STRATEGIC FOCUS AREAS To ensure that the municipality is a more responsive, efficient, effective and accountable local government we will outline, precisely how we intend to translate our Long Term 2030 Municipality Vision into an effective plan that aligns the municipal budgets, monitoring and evaluating mechanisms as well as timeframes for delivery. The municipality has taken the strategic direction to achieve closer alignment between the Long Term Development objectives and the IDP (in context of International, National, Provincial and Local development policies). The development of the strategic approach for the Municipality is guided by – but not limited to – the following; Millennium Development Goals (MDGs) The aim of the MDGs is to encourage development by improving social and economic conditions. It provides a framework for the entire international community to work together towards a common end i.e. making sure that human development reaches everyone, everywhere.

45
National Development Plan (Vision 2030) The intention of this plan is to improve service delivery for citizens of South Africa, whilst integrating national, provincial and local policies and programmes into a single, target orientated and long term based plan. In this plan a collective approach of improving the lives of the citizens is applied, and communities themselves have a role to play in this regard. National Government Programme of Action 2009-2014 The government has identified 10 priority areas in its programme of action, with an intention to turn around the global economic slowdown, whilst at the same time ensuring that the needs of all its citizens are met. National Priorities (State of the Nations Address 2013) Highlights have been identified on relative progress made with regards to health, education, the fight against crime, human settlements, energy, water provision and rural development. Challenges are, however, still identified in unemployment, poverty and inequality, women and youth development. Cooperation between government departments and parastatals has seen the city engaging strongly in an effort to improve infrastructure, corridor development, industrial development, skills, education, human settlement, access to basic services, economic development, job creation, governance, social cohesion and crime prevention, Provincial Priorities (State of the Province Address 2013) In response to the State of the Province Address, the municipality has made a tremendous contribution towards the provision of infrastructure and infrastructure revolution, especially roads, freight and harbour, skills enhancement, economic development, poverty alleviation, provision of housing and adequate human settlement pattern, improving health and healthy lifestyle, mitigation against climate change, supporting informal traders, and employment creation. The municipality also responds to youth development and further ensures rural development in eThekwini. Provincial Growth and Development Strategy In line with the National vision 2030, the Provincial Growth and developmental Strategy will ensure economic growth and improved quality of life in KwaZulu-Natal. An integrated service delivery mechanisms will be applied by various stakeholders in an effort to create employment opportunities, skills enhancement, effective and efficient governance, human and community development, improved infrastructure and adequate utilization of spatial form. National Spatial Development Perspective (NSDP) The NSDP represents a key instrument in the State’s drive towards ensuring greater economic growth, buoyant and sustained job creation and the eradication of poverty. It provides a framework for deliberating the future development of the national space economy and recommends mechanisms to bring about optimum alignment between infrastructure investment and development programmes within localities. Provincial Spatial Economic Development Strategy (PSEDS) The objectives of the PGDS are: eradication of extreme poverty and hunger, achievement of universal primary education, promotion of gender equality & empowerment of women, reduction in child mortality, improvement of maternal health, combating HIV-AIDS, malaria and other diseases, developing a global partnership for development, as well as ensuring environmental sustainability. Long Term Development Framework Many cities around the world are competing with one another on the global open market to become economically competitive and in doing so, are inadvertently creating unsustainable environments. Against this background then, it is clear that the municipality has indeed a direct role to play in the facilitation and management of long-term planning and development processes that consider the issue of sustainability. The municipality has reviewed its Long Term Development Framework (LTDF) to ensure that sustainability in all its facets is embedded into the Municipality and influences the IDP.
46
11.2 DEVELOPMENT CHALLENGES
Significant strides have been made to address the key development challenges in the municipality. While significant progress has been made in all areas, there is still some distance to go towards addressing the following challenges:
� High rates of unemployment and low economic growth; � High levels of poverty; � Low levels of skills development and literacy; � Limited access to basic household and community services; � Increased incidents of HIV/AIDS and communicable diseases; � Loss of natural capital; � Unsustainable developmental practises; � High levels of crime and risk; � Ensuring adequate energy and water supply; � Ensuring food security; � Infrastructure degradation; � Climate change; � Ensuring financial sustainability; � Ineffectiveness and inefficiency of inward-looking local government still prevalent in the municipality. The essence of our IDP is to achieve a balance between meeting basic needs, strengthening the economy and developing people skills and a technology base for the future. In an effort to achieve our 2030 vision, these three Strategic Focus Areas of intervention for the next five years need to be balanced and integrated. Given the strategic framework that has been outlined it is clear that the city’s budget must be a pro-growth budget that meets basic needs and builds on existing skills and technology. The city’s delivery plan is organised into eight separate but related plans. They are interrelated because:
All the programmes and projects are filtered through the common set of filters described above.
The plans, programmes and projects are supportive of each other, to ensure greater impact in delivery.
Where contradictions or overlaps are found to exist, these will duly be brought into alignment.
The eight plans are:
Developing and Sustaining our Spatial, Natural and Built Environment.
Creating a Prosperous, Diverse Economy and Generate Employment Opportunities.
Creating a Quality Living Environment.
Fostering a Socially Equitable Environment.
Creating a Platform for Growth, Empowerment and Skills Development
Embracing our cultural diversity, arts and heritage.
Engendering a more Responsive Local Government.
Financially Accountable and Sustainable City. The delivery of these plans should ensure that the people of eThekwini are able to:
Live in harmony
Be proud of the city
Feel protected
Feel that the basic needs are being met
11.3 MUNICIPAL KEY DEVELOPMENT DIALOGUES
In an attempt to give life and meaning to our city’s set of principles and development dialogues that were adopted as part of our IDP, we have instituted a process that systematically filters every programme, project and initiative in terms of key development dialogues that the city have chosen.

47
11.4 POLITICAL PRIORITIES AND LINKAGES TO THE IDP
The IDP is an all-encompassing plan which provides the framework for development within a municipality. It aims to co-ordinate the work of local and other spheres of government in coherent plans to improve the quality of life for all the people living in the area.
All operating and capital programs in the 2013/14 medium-term budget have been assessed through a prioritisation mechanism that was developed to ensure that there is alignment to the development strategy of the municipality. The IDP formed the basis of the priorities identified in the strategic plan and all resources are focused on the achievement of the priorities.
11.5 IDP OVERVIEW AND KEY AMENDMENTS
The Municipal Systems Act requires that each Municipality prepare an Integrated Development Plan to serve as a tool for transforming local governments towards facilitation and management of development within their areas of jurisdiction. The IDP is a five year plan whose principal purpose is to ensure the development of the local community in an integrated manner which involves strategic business units within the municipality, relevant strategic stakeholders and the community.
In the five year review, the Eight Point Plan of action will continue to guide the municipality, but has once again been refined and refocused our strategic programmes, so as to respond more effectively to key challenges.
11.6 IDP REVIEW PROCESS AND STAKEHOLDER PARTICPATION
The IDP is reviewed yearly to inculcate a democratic approach to local governance by ensuring all stakeholders get an opportunity to voice their opinions in influencing the shape, form, direction and pace of development in their localities. The municipality is committed to addressing the needs of the people and values the inputs from communities and stakeholders.
The third generation of eThekwini’s Integrated Development Plan (IDP) is now undergoing its final review and focuses on translating our City Vision into action. As set out in the Municipal Systems Act (2000), in the review of the five year IDP, a stakeholder consultation process is necessary. Of critical importance is for the municipality to ensure that there is thorough consultation with the community and strategic stakeholders.

48
11.7 LINK BETWEEN THE IDP AND THE BUDGET
In compliance with the Municipal Structures Act (1998) and Municipal Financial Management Act (2003), our city budget is informed and aligned to the IDP objectives. The IDP determines and prioritises the needs of the community. The budgetary allocations for both the capital and operating expenditure are undertaken in a manner that will not only ensure that our IDP outcomes are achieved but also to ensure that our city’s 2030 vision is realised.
We have come a long way in capital budgeting – away from departmental budgeting. Based on such models as the Multi Criteria Dimension Model (MCDM) and Capital Investment Management System (CIMS), the city is able to link its budget with its programmes, and is able to adequately spread its capital budget geographically as well in accordance with the IDP eight-point plan. In terms of the operating budget we have made excellent progress but are now more committed than ever to ensure that critical operating budget resources are prioritised in terms of stated IDP outcomes.
More importantly, the Performance Management System (PMS) allows the municipality an opportunity to monitor and evaluate individual and organisational performance in meeting our IDP outcomes and vision. As with previous year’s, our IDP remains the strategic driver of both our budget and performance management system.
12. OVERVIEW OF BUDGET FUNDING
FISCAL OVERVIEW
The Municipality continues to display a sound financial profile and high liquidity levels, which is mainly attributable to:
Balanced budgets being funded from current financial year’s revenue. Prior year’s surpluses have not been used to support the operating budget.
The municipality operates within its annual budget, as approved by council.
The municipality maintains a positive cash and investments position.
In compliance with relevant statutory requirements, the Financial Plan (Medium Term Revenue and Expenditure
Framework-MTREF) is reviewed and updated annually.
FUNDING OF CAPITAL BUDGET
The Capital budget is funded by the allocations made to the city by National and Provincial Government in the form of grants, as well as public contributions and donations, borrowings and internally generated funds.
12.1 LOAN DEBT AND INVESTMENTS
In terms of funding the capital budget, the municipality is in a fortunate position to undertake much needed service delivery programmes from both internally generated reserves and long term external funding. In the latter case, the municipality with its sound financial credentials has financing options available that are in line with the MFMA and the Municipal Borrowing Framework. Section 45 of the MFMA guides short term borrowing in the city. In line with the anticipated budget performance, and taking into account the National and Provincial grant allocations, the municipality will continue to fund each financial year’s operating budget from current revenues.
Investments for the municipality are done in accordance and adherence with the Municipal Investment Regulation of the MFMA, Councils Investment Policy and other relevant legislation. Cash flow forecasts and cash needs by the city provide guidance for the type of investments employed. The investments are made with primary regard to the risk profile, liquidity needs of the city and the return on investments. In so far as the investment and borrowing activities are concerned, all the requirements of the MFMA have been complied with.

49
The ability of the Municipality (Parent) to deliver on progress depends a lot on its funding sources which are summarised as follows:
Funding of Operating Budget Funding is obtained from various sources, the major sources being service charges such as electricity, water, sanitation, and refuse collection, property rates, grants and subsidies received from National and Provincial governments. The table below identifies the sources of funding for the 2013/14 financial year (parent municipality):
INCOME R’m % Assessment Rates 5 007.9 17.8 Service Charges 14 215.9 50.7 Fines, Licences and permits 132.6 0.5 Grant and Subsidies 5 543.1 19.7 Rental of Facilities and Equipment 393.7 1.4 Interest on Investments 366.9 1.3 Penalties and Collection Charges 129.1 0.5 Fuel Levy 1 822.8 6.5 Other Income 444.3 1.6
TOTAL 28 056.3 100
68.5%of the Operating Budget is funded from assessment rates and services charges (tariffs)
12.2 SOURCES OF FUNDING
The major own Revenue sources of the municipality are service charges and property taxes. Together with grants from government, these make up the total revenue. This high level of independent and relative stable income sources of revenue is one of the key factors that support the sound financial position of the municipality. In addition to the obvious need to grow the city’s revenue by increasing its tax base, other means for securing funding for council projects must be explored in a variety of ways. The city faces invidious choices in attempting to finance the projected levels of investment in infrastructure. Sources of capital finance are already stretched with limited scope for further borrowing, consumer pressure to restrict tariff and tax increases, and little likelihood of a structural upward adjustment in grant allocations.
Further, efficiencies in the borrowing programme will continue to be sought to lock in lower cost and longer term borrowing, plus the introduction of new revenue sources such as development charges.
2013/2014
RM
2014/2015
RM
2015/2016
RM
Total Capital Budget
5, 432
5, 767 6, 442
Funded as follows: Grant Funding Internal Funding External Funding
3, 122 1, 310 1, 000
3, 577 1, 190 1, 000
4, 079 1, 363 1, 000
5, 432
5, 767 6, 442

50
In the case of eThekwini, a basket of differential tariff increases determines the most acceptable and equitable funding regime taking into consideration the actual cost of delivering services, budget priorities and national legislation, regulations and policy guidelines.
12.3 SAVINGS AND EFFICIENCIES In order to monitor and improve efficiencies the Treasury: Special Projects and Cost Savings Department in conjunction with the Organizational Development Unit will be gathering key productivity measures from line Managers relevant to their departments across the municipality. Amongst other reasons, the key objective is to look more critically at service delivery, eliminate backlogs and constantly improve processes. The ISO9001 standards will be introduced within the SCM unit and will later be rolled out to all other clusters in a phased approach. This will ensure that all key processes and standard operating practices (SOPs) are well documented for smoother operations, training staff and keeping customers abreast off what service levels to expect. A centralized program office has been approved and is being setup to ensure that projects are not done in silos and to avoid duplicated effort amongst the various Clusters in the Municipality. In order to leverage the purchasing decisions within the municipality the Category Management of goods and services will be fully explored to reduce costs and ensure added value. This ensures that commonly used goods and services are not separately purchased by the various units but are sourced through a single process to maximize leverage in the market, by focusing on the supplier base for the relevant category. This is in conjunction with the national price referencing system and the appointment of the ” Chief Procurement Officer” by National Treasury, as proposed by the Minister of Finance in his 2013 Budget Speech. A Contracts Register Database is in place for all contracts above R 200 000, and this will be fully automated in the near future to track the various stages of the procurement request, contract award, contract payment control to budget and having procurement plans in place for expiring renewable contracts for the 2 subsequent financial years. In order to get to the automated tracking of contracts a few sub projects have been initiated to get the historical orders and contract details cleaned up. The automated contract tracking, monitoring and control on the JDE System, will be piloted within the City Fleet Unit by 30 June 2013 and thereafter rolled to the other clusters within the Municipality. The second phase of the contracts register will look at all contracts below R200 000 on a similar automated tracking process. With salaries and wages being a major expenditure of the operating budget, overtime will continue to be monitored closely. Staff that work overtime on a regular basis or work excessive overtime will be closely scrutinized with departmental heads who will be held accountable. This will ensure that overtime worked is absolutely essential and that the same employees are not called on continually to work overtime where staff rotation is possible or employing additional staff would be more cost effective. Managers will also carry out monthly verification of active employees to certify that employees processed on the payroll have indeed been on duty and to ensure that terminated employees are timeously and correctly processed on the payroll. All sections will be updating procedure manuals. Business processes are to be critically analyzed to effect process improvements, to eliminate any bottlenecks and to implement innovative ideas to improve productivity. The Quality Circles program previously introduced within all departments of the Treasury Cluster will be revitalized. The team based approach to measure at operational level its Quality, Costs, Delivery or Speed of services provided with the aim of continuously improving processes within their sections, reducing costs and delivering a more efficient service to customers both externally and internally. The interfaces between the payroll system – DRL, the Revenue and Expenditure systems will be completed so that the integration will provide better control of staff resigning, being transferred, retiring and deceased and to ensure that salary overpayments are avoided and systems accesses are terminated timeously and is automated as far as possible. In addition user access authorizations and access to programs and functions within the various financial systems are being reviewed with access tightly controlled in relation to the staff duty schedule and job designation.

51
SUPPLY CHAIN MANAGEMENT
Strategic Approach to SCM
Six key-enablers to SCM excellence have been adopted, as follows:
• Organisation & Structure - Focused teams with clearly defined responsibility, authority & accountability for
sourcing activities
• Procurement Processes - Best-in-class strategic sourcing, measurement, approvals, conditioning,
negotiation and supplier relationship management processes
• Learning / Skills - Strategic Sourcing team using deconstructing price methodologies, use of purchase to
pay, and educated key stakeholders
• Strategic Sourcing - Significant savings resulting from lower supplier prices.
• People - Right people in the right position, empowered and driven by accountability
• Technology - Use of best-in-class spend analysis, e-sourcing & e-procurement tools
These are further broken down into parallel projects that will support the SCM Unit in moving forward whilst
aspiring towards a state of excellence.
ISO 9001 Project
The ISO 9001 Quality Management System was identified as a suitable framework around which a Quality Management System to be developed for Supply Chain Management (SCM). The underlying principle of the Quality Management System is to ensure all processes are documented and continually reviewed for continued compliance and effectiveness.
ISO 9001 set of standards is used to implement a Quality Management System. The purpose of a quality management system is to ensure:
• Inefficiencies and non-compliance with formal processes and procedures is highlighted. • Standardised method of working. • In short “Document what you do and show that you have done this”.
P2P (Procure-To-Pay)
The P2P project falls within the ISO 9001 projects and aims to document the “as-is” processes for all procurement (procure to pay) processes. The ISO project requires that all business processes within SCM are documented.
Business Process Improvement Initiatives – BPI2
Through the review and analysis of the processes within SCM has allowed for problem areas to be highlighted and/or identified. Initiatives are then put in place to address the problem/inefficiency. The following initiatives have (to date) been identified as BPI2 initiatives:
§ Procurement Schedule – initiative aims to assist with procurement planning. § Contracts Register – addresses the absence of a concise and reliable register of contracts. § Supplier Address Book Consolidation – addresses the situation where suppliers have more than one account
number. § Invoice logging and tracking – involves scanning supplier invoice on receipt, and tracking the invoice until
payment. § Reviewing processes where purchase orders are not placed with Suppliers by SCM officials.

52
Contract/Tender Request Tracking System
The purpose of the system is to track a new contract/tender through the various bid committees. The system will also provide data for key management and monitoring reports, efficiently and effectively.
Procurement Scheduling and Contract Register
This initiative addresses the requirement for preparation of a procurement schedule, the linking of the procurement schedule to the Contract/Tender tracking system, and finally monitoring the contract in a contract register. This initiative aims to implement a single system to manage the procurement schedule (procurement demand), procurement process, and the monitoring the contract within a contract register.
Assuring SCM effectiveness and efficiency
The projects being undertaken in SCM aim to improve the compliance, efficiency and image of SCM. In order to measure the operations (and improvements thereof) the following key indicators are also to be developed, monitored and reported on:
§ Percentage of the value of contracts awarded that commence in accordance with procurement plans. § Percentage of spend through corporate contracts and framework agreements, as opposed to quotations or
other procurement methods. § SCM Process Predictability – average time from tender advert to on-site, including time to process through bid
committees, appeals etc. § The percentage of corporate spend placed with targeted enterprises. § Internal client satisfaction with the SCM function.
§ Supplier satisfaction with the municipality.
12.4 INVESTMENTS – CASH BACKED
Adequate provision has been made by way of external investments to ensure that cash is available on the maturity of investments. Investment income is utilized to fund the budget. The permissible reserves are cash backed in terms of the MFMA.
12.5 GRANT ALLOCATIONS
Municipalities play a critical role in furthering government’s objective of providing services to all while facilitating
local economic development. Local Government conditional grants are being reformed to provide targeted support
to different types of municipalities. The human settlements and public transport functions are being devolved to
urban municipalities. The Local government equitable share formula has been reviewed with data from the 2011
census. The formula also includes specific funding for the maintenance of basic services. The following projected
grant allocations to the municipality in terms of the 2013 Division of Revenue Bill have been included in this
medium term budget:

53
GRANT 2013/14 R m
2014/15 R m
2015/16 R m
Electricity Demand Side Management Grant
10.0 5.0 0
Financial Management Grant
1.3 1.3 1.3
Public Transport Infrastructure and Systems Grant
707.4 884.8 937.3
Equitable Share 1 869.8 1 990.9 2 101.1
Urban Settlements Development Grant
1 581.0 1 800.1 1 863.7
General Fuel Levy 1 822.8 1 932.3 2 021.1
Infrastructure Skills Development Grant
33.0 55.5 74.3
Neighbourhood Development Partnership Grant
3.5 70.0 75.0
Integrated National Electrification Programme Grant
35.0 35.0 40.0
Expanded Public Works Programme Integrated Grant
47.4 0 0
Public Transport Network Operations Grant
71.4 110.8 162.7
Integrated City Development Grant 9.5 0 0
12.6 COLLECTION RATES FOR EACH REVENUE SOURCE
In accordance with relevant legislation and national directives, the municipality’s projected revenue collection rates are based on realistic and sustainable trends. The rate of revenue collection is the cash collected from consumers expressed as a percentage of the amount billed. The average monthly collection rate and projections for the year are as follows:
REVENUE SOURCE Average 2011/12
Average 2012/13
Rates 98.9 98.1
Electricity 95.2 98.2
Water 92.2 92.5
The total average collection rate is projected at an average of 95% and is based on a combination of actual collection rates achieved to date, and the estimated outcomes for the current financial period.

54
Electricity
Despite the slowdown in the economy and the effects on both business and residential consumers, projections indicate a higher collection rate. The disconnection policy is being applied for non-payment and the largest debts are being targeted in order to yield a higher collection rate.
Water
The programme put in place to encourage customers to pay their current accounts in return for a reduction in the debt they have incurred should yield an improvement in the collection rate.
DEBTORS AGE ANALYSIS AS AT 28 February 2013 (PARENT MUNICIPALITY)
0 – 30 Days 31 – 60 Days 61 – 90 Days Over 90 Days Total
R’000 % R’000 % R’000 % R’000 % R’000
Debtors at 28.02.2013
832.202 14.8 211 428 3.7 174 031 3.1 4 412 964 78.4 5 630 625
The total amount outstanding of approximately R5,63 billion is exclusive of provision for bad debts amounting to
R2,59 billion and represents an increase of approximately R98.4 million when compared to February 2012. The table indicates that approximately R1,82 billion of debt over 90 days is considered recoverable. The provision for bad debt is not going to be written off. It will be pursued until it is not feasible to recover.
Government debt of R187.2 million includes unconfirmed accounts of R43.5 million which is being investigated by the Real Estate Department. The unconfirmed accounts will be recovered once all the property ownerships are confirmed and this confirmation process is expected to be concluded by the end of the year. Business debt of R138,6 million is subjected to litigation and has been handed over to the Council’s panel of attorneys. Residential debt amounting to R1,5 billion includes properties valued at less than R250 000 that qualify for Debt Relief Programme and individual properties in the Ingonyama Trust area amounting to approximately R302.4 million.
All debt will be pursed until it is not feasible to recover where after it will be written off. Several reports are currently before the Finance and Procurement Committee of Council to consider the write off of arrear debt on various account grouping, which includes, water debtors, Ingonyama rates debtors, housing rental stock debtors and debt accrued for services where there is no legal contract in place.
Notwithstanding the identification of irrecoverable debt and the current reports before council is there a strong belief that the change in the credit control and control and debt collection policy that was introduced in the 2012/13 financial year will yield the desired results. Council has maintained an average monthly collection rate of 104%. Results as per the midyear review by National Treasury shows a decrease in debt on a year on year basis of R 31 million rand.
Furthermore, Council has supported the notion to contest the ruling of the Appeal Court, that Ingonyama land is State land for period 2005 to 2008 and as such not rateable, by taking the matter to the Constitutional Court.
Active credit control and debt collection activities are undertaken all the time. In January 2013 the following activities were undertaken:
26 170 customers were disconnected for electricity and water
1 648 final demands were issued
449 customers were red-lined with the credit bureau
253 customers were handed over to legal to issue summons

55
DEBTORS AS AT 28 February 2013
TOTAL (R’000)
TOTAL GROSS CONSUMER DEBTORS 5,630,625
PROVISION FOR BAD DEBTS (Estimated) 2,591,214
NET CONSUMER DEBTORS 3,039,411
CURRENT (0 – 90 DAYS) 1,217,662
COLLECTABLE DEBT MORE THAN 90 DAYS 1,821,749
BREAKDOWN OF COLLECTABLE DEBT OF MORE THAN 90 DAYS:
GOVERNMENT (Refer details below) 187,178
BUSINESSES 138,606
RESIDENTIAL 1,495,965
TOTAL 1,821,749
12.7 LEVELS OF RATES, SERVICE CHARGES AND OTHER FEES AND CHARGES
The City’s revenue quantum is determined by setting a package of tariffs which are not only affordable to the rate payers and the users of its services but deemed to be at fair and realistic levels when viewed in context of its programmes to assist those who do not have the means to pay. To maintain an effective, efficient and well-run city, tariff increases are inevitable. Tariff-setting plays a major role in ensuring desired levels of revenue by assisting in the compilation of a credible and balanced budget to accommodate the acceleration of basic services. The setting of tariffs for the 2013/14 financial year continues to be guided by a tariff policy, which provides a framework within which the eThekwini municipality can implement fair, transparent and affordable charges for the provision of services.
The tariff level setting process was largely influenced by the considerable increase on bulk electricity purchases and the disproportionate increase above CPI levels. This has distorted the city’s average tariff and charges increases.
The following principles and guidelines have been considered in the draft 2013/14 MTREF:
Realistic revenue estimates through a conservative, objective and analytical process.
Identification and pursuance of grants from national, provincial and other agencies.
The impact of inflation and other cost drivers.
Credible collection rates.
The ability of the community to pay for services rendered.
Local economic conditions.
As in the past, the above principles dictate the annual increase in the tariffs charged to the consumers and the ratepayers.
RATES
Property tax represents the second most substantial tax revenue for the municipality. It is a well founded tax with a long and sustained history. This source of revenue is a relative stable source as it is not substantially affected by economic cycles, as is the case with other tariffs. Property rates cover the cost of the provision of general services. Determining the effective property rate tariff is therefore an integral part of the municipality’s budgeting process. The municipality is currently levying rates on The General Valuation Roll 2012 and relative supplementary valuation rolls. The implementation date for the General Valuation Roll 2012 was 1 July 2012. The levying of rates in terms of the Municipal Property Rates Act whereby properties are valued based on market value as at the date of valuation, is being applied for this Medium Term Budget. A 1% growth in the rate base is anticipated mainly due to new developments.
56
Valuation Roll
In compliance with the Municipal Property Rates Act, the municipality has released its second general valuation roll, GV 2012 on 2012-02-10. A valuation date of 1 July 2011 has been determined, with implementation of the valuation roll being with effect from 1 July 2012. The valuation roll was open for inspection to the public until the end of March 2012 during which time owners could lodge an objection against any entry in the valuation roll. Approximately 10 600 objections were received (compared to 50 000 in 2008 i.e. less than 1.5%) with the review of objections still underway.
ELECTRICITY AND WATER
The increase in water and electricity tariffs is consistent with National Policy on the provision of free basic services, Council’s Indigent relief measures and tariff policies. The tariff increases are necessary due to the increase in the cost of bulk purchases, maintenance of existing infrastructure, new infrastructure provision and to ensure the financial sustainability of the services.
In the review of the tariffs for water and electricity , the municipality ensures that the level of tariffs are cost – reflective including the cost of maintenance and renewal of networks and the cost associated with reticulation expansion and that the associated structure of the tariffs encourage efficient and sustainable consumption.
SEWERAGE
With effect from the 2011/12 year, a new volume based sewage disposal charge system was introduced based on the percentage of water consumption. A flat tariff is charged to Non-Domestic Consumers and a stepped tariff to Domestic Consumers in line with the consumption bands for water. The progressive nature of the existing domestic stepped tariff structure for the both water and sanitation allows for the needs of the indigent. It is also designed to discourage high water consumption levels which have an impact in on the size of both the water and sanitation portions of a consumer’s bill. It enables all consumers to adjust their consumption level to ensure availability.
REFUSE REMOVAL
The increase in the domestic refuse removal tariff for the 2013/14 year is mainly due to salary increases, conversion of agency staff to permanent and the increased cost of the purchase of refuse bags.
DEVELOPMENT CHARGES
The city has been actively participating in national deliberations to enhance the performance of municipal development charges. Levying some limited development charges in certain sub-regions of the municipal area have been recognised as insufficient, inefficient and a constraint to the ability of the city to roll out a more extensive infrastructure plan in support of property development. A Draft policy has been issued and the enabling by-laws are being revised. National Treasury’s framework that will set norms and standards to ensure that these charges facilitate, and not stifle, new property developments are awaited. The revised approach will support the recovery of the costs of bulk infrastructure provision across all sub-regions. However, in the interim, bulk infrastructure charges at cost effective rates will be phased in.
GENERAL
The following are other general contributory factors for the increase in levels of rates and service charges:
The cost of bulk purchases
The impact of capital spend on the operating budget
Salary increase with effect from 1 July 2013
Provision for the filling of critical vacancies
Rollout of infrastructure and the provision of basic services
Increased maintenance of network and structures

57
The tariffs and charges for the 2013/14 year are reflected on a separate document for approval together with the budget.
13. DISCLOSURE ON IMPLEMENTATION OF MFMA AND OTHER LEGISLATION
Compliance with the MFMA implementation requirements has been substantially adhered to through the following activities: BUDGET
This annual budget has been developed taking the MFMA, Municipal Budget and Reporting Regulations, and National Treasury requirements into account. Budgets are being tabled and approved within the required legislative timeframes. IDP
The 2013/14 review process is underway, with community consultation already undertaken as required by legislation. ANNUAL REPORT
The 2011/12 Annual Report has been developed taking into account the MFMA and National Treasury requirements. The report was noted by council at its meeting held on 25 January 2013 and thereafter entered the public participation phase. The Annual report was adopted by council on 28 March 2013.
IN-YEAR REPORTING 100% compliance with regards to monthly, quarterly and annual reports to Council, Provincial and National treasury. BUDGET AND TREASURY OFFICES A Budget and Treasury Office has been established in accordance with the MFMA and National Treasury requirements AUDIT COMMITTEE
The Audit Committee, an independent external committee established since 1 July 2005, provides an oversight function over the financial management and performance of the municipality.
MUNICIPAL PUBLIC ACCOUNTS COMMITTEE This committee ensures that the administration, municipal agencies and entities are held accountable for their management of municipal funds and assets, and to ensure the efficient and effective utilisation of council resources. ETHICS COMMITTEE Council, on 2012-02-29, approved the establishment of the Ethics Committee to ensure compliance with the Code of Conduct and to investigate and make a finding in any alleged breach.
58
14. SERVICE DELIVERY AND BUDGET IMPLEMENTATION PLAN (SDBIP) The SDBIP is a key management, implementation and monitoring tool, which provides operational content to the end-of-year service delivery targets, set in the budget and IDP. It is the mechanism that ensures that the IDP and Budget are aligned. The focus of the SDBIP is both financial and non-financial measurable performance objectives in the form of service delivery targets and other performance indicators. The SDBIP of eThekwini Municipality is developed according to the eight point plan as set out in the Municipal IDP. It contains the Strategic Focus Areas, Programmes, projects and sub-projects as well as annual and quarterly targets. The project achievement is reported on in the SDBIP at the end of each quarter in the quarterly actuals. The electronic capturing of SDBIP data commenced during the 2009/10 financial year. There have since been several enhancements on the system, to add value to the SDBIP reporting process. Some of the functions on this web based system include email reminders to stakeholders, reports reflecting projects that have under-achieved and linkages to the Organisational Scorecard and Individual Performance Management System. Evidence to support the actual achievements, can be uploaded into the system and several validation rules have been built in to ensure, reasons for under performance, and measures to improve on targets not achieved are submitted.
15. STATISTICAL INFORMATION COMMUNITY AND EMERGENCY SERVICES
HEALTH
Environmental Health:
Number of air pollution monitoring stations 16
Number of industries with scheduled trade permits 3 137
Number of informal settlements with ablution blocks 61
Number of Environmental Impact assessments commented on 55
Number of building plans commented on 270
Number of Major Hazard installations inspected 43
Clinical Services:
Number of clinics 59
Number of mobile clinic services and health posts 39
Number of children under 1 year fully immunized 27 417
Number of patients screened and treated for chronic medical conditions 294 433
Number of women screened for cervical cancer 33 200
Number of vaccinations undertaken 368 268
Social Development:
Number of clinics with food gardens 12
Number of schools with food gardens 12 Number of TB awareness sessions 65
PARKS RECREATION AND CULTURE
Number of Swimming Pools 52
Number of Soccer Fields 328
Number of Cricket Wickets 57
Number of Hockey Fields 5
Number of Rugby Fields 8
Number of Bowling Greens 6
Number of Netball Courts 36

59
Number of Volley Ball Courts/Combi-Courts 51
Number of Stadia 10
Number of Community Halls 163
Number of Golf Courses 2
Number of Cemeteries 50
Number of Crematoria 2
Number of Developed Horticultural Parks 238
Number of Nurseries (ha) 9
Number of Developed Playground sites 540
Number of burials (excluding paupers) 4 500
Number of cremations 1 100
Number of graveyards maintained 6 921
Number of Public Conveniences 129
Number of Natural Resource Areas maintained 10
Number of libraries 86
Number of library membership 307 663
Number of books issued 432 196
Number of museums 10
Number of museum visitors – Durban Art Gallery 70 000 Number of museum visitors – Natural Science Museums 150 000 Number of museum visitors – Local History Museums 100 000
Area of Developed Horticultural Parks 2 142
Area of verges maintained (ha) 515
METRO POLICE
Police stations 14
Satellite stations 11
Total number of staff 2 314
Number of motor vehicles 480
Number of motor bikes 79
Number of firearms 2 044
Number of fines prosecuted - annually 750 000
EMERGENCY SERVICES
Number of fire stations 19
Number of staff 666
Number of vehicles 152
Number of fires attended to 9 834
Number of special services attended to 5 251
Emergency Management and Control Centre:
Number of staff 117
Number of vehicles 24
Number of calls attended to annually 209 000
OFFICE OF THE CITY MANAGER
INFORMATION TECHNOLOGY
Number of bills printed per month 750 000
Number of payslips for staff 20 000

60
Number of letters and notices 600 000
Number of fines processed per month 80 000
Number of online mainframe transactions 650 000
LEGAL SERVICES
Number of prosecutions 63 028
Number of pages translated 3 710
Number of meetings where translation service was provided 692
Number of trade licences issued 510
Number of premises inspected 50 310
INTERNAL AUDIT
General Audits 133
Systems Review 68
Special Investigations 10
OMBUDSPERSON AND HEAD:INVESTIGATIONS
Investigative Services:
Metro Police Cases 140
Loss Control Cases 130
Investigation Cases 100
Number of calls received from Whistle Blowers per month 108
SUSTAINABLE DEVELOPMENT AND CITY ENTERPRISES
BUSINESS SUPPORT AND MARKETS
Business Support:
Number of permit holders 48 000
SMMEs showcasing at Main Fair 538
Visitors to SMME Fairs 13 223
Number of traders at container parks 131
Retail Markets:
Number of Retail Markets Managed 16
Number of Flea Markets Managed 8
Number of traders at Central Market 256
Durban National Fresh Produce Market (Bulk Market):
Projected turnover 13/14 (R’m)
1 050
National market share (%) 10.45
Number of buyers as at January 2013 1 879
Number of suppliers as at January 2013 2 207
Number of Transactions 1 034 058
Ripening Rooms capacity (pallets) 810
Cold Rooms capacity (pallets) 804

61
DURBAN TOURISM
Events: 67
Direct Financial Impact (R’m) 7 600
Number of part-time jobs created – days worked 15 396
Number of permanent jobs created 7
Direct socio-economic impact (R’bn) 50
Media Exposure value (R’m) 4
New Event Co-ordinators trained
Tourism :
Number of domestic visitors (million) 8.8
Number of International Visitors (million) 1
Visitors to the Durban Tourism offices:
Walk –in 89 500
Telephone 60 346
Indaba – May 2012 1 458
Number of Exhibitors 10 790
Number of visitors 240
Socio – economic impact (R’m)
ECONOMIC DEVELOPMENT
SECTOR SUPPORT:
Number of Strategic Township Development Projects 4
Number of Town Centre Renewal Projects 6
Number of Upgrade of Tourism Nodes and Corridors Projects 5
DURBAN FILM OFFICE:
Commercials 15
Feature Films 13
Documentaries 44
Stills 40
Music Videos 10
Series 26
DEVELOPMENT PLANNING, ENVIRONMENT & MANAGEMENT
Number of building applications approved 5 056
Number of building and land use contraventions served 2 133
Number of summonses served 1 824
Number of signage applications received (Jan – Dec 2011) 500 Number of unauthorised signs removed (Jan – Dec 2011) 70 000
Number of unauthorised trailers removed 10
Estimated value of approved applications (R’bn)
5.7
62
HUMAN SETTLEMENTS AND INFRASTRUCTURE
ENGINEERING
Length of surface roads and streets (km’s) 6 411
Length of maintained unsurfaced roads and streets (km’s) 1 180
Number of Stormwater complaints attended to 1 362
Total length of flood lines calculated (km’s) 1 487
ETHEKWINI TRANSPORT AUTHORITY
Number of traffic signals to be installed in the current year 19
Number of traffic signals converted to LED’s by June 2012/2013 510
Number of traffic signals to be converted to LED’s in 2012/2013 250
Number of new traffic signals to be installed in 2013/2014 12
Number of bus shelters 30
Number of taxi ranks 2
Number of bus ranks 7
WATER
Total length of pipelines (km) 11 500
Number of Consumers 945 910
Units purchased/purified (ml/d) 860
Storage Facilities 474
Pump Stations 44
Purification Works 5
SANITATION
Number of wastewater treatment works 31
Number of Wastewater Pump Station 300
Number of UD Toilets installed 80 000
Effluent flows into the Treatment Works (kl/d) 560 000
Total Length of Sewer Pipelines (km’s) 7 697
SOLID WASTE
Number of depots 14
Number of fleet workshop 4
Number of community based contractors 372
Job creation through community based contractors 3 772
Number of skips (business, permanent and casual) 879
Number of landfill sites 4
Number of transfer stations 7
Number of garden refuse sites 13
Vehicle fleet complement 536
Number of recycling drop off centres 20
Number of recycling buy-back centres 5
Number of tons removed & disposed 973 121
Number of houses serviced 1 001 000
Number of refuse bags distributed (black) (million) 98
Street litter bags (million) 1.4

63
Orange bags – recycling (million) 9.5
ELECTRICITY
Number of customer base 665 430
Number of reticulation faults attended to 283 097
Number of FBE beneficiaries 82 546
HOUSING
Housing stock (Rental / Selling): 11
Hostels 7 015
Rental Stock 8 500
New houses to be constructed
CORPORATE HUMAN RESOURCES
OCCUPATIONAL HEALTH
Number of Clinics 7
Attendance at clinics 23 000
Primary medical care 9 000
Medical surveillance employees Wellness and sick leave management
10 000 4 000
SKILLS DEVELOPMENT UNIT
Number of In-Service 257
Number of Apprenticeships 32
Economic Sectoral Programmes 395
Management Development Programmes 85
Support to EPWP (ABET programmes) 155
MANAGEMENT SERVICES
Summary of Projects
Productivity Interventions 2
Business Process Re-engineering 8
Wastage Elimination 30
Organisational Development 4
HUMAN RESOURCES
Arbitration awards 129
Appointments 1 896

64
GOVERNANCE
CITY HALL Number of City Hall bookings for the year (up to end Jan 2013) 240 Number of Printing jobs and duplicating jobs 11 604 Number of Council meetings 12 Number of Events and Special Programmes 145
COMMUNITY PARTICIPATION
Number of soup kitchens 18
Number of indigent people fed per month 156 400
Number of grant-in-aid beneficiaries 150
Co –operatives recruitment and administration 50
REGIONAL CENTRES
Number of Customers Accessing One Stop Shops 674 515
Number of services accessed at Regional One Stop Shops 55 206
Number of Buildings maintained 65
COMMUNICATIONS
Number of copies of eZasegagasini printed and distributed fortnightly 400 000
Number of copies of the Workplace printed and distributed monthly 15 000
Number of alternative reading material of the eZasegagasini Metro – per issue 172
INTERNATIONAL GOVERNANCE
Unit specific, special and adhoc events 223
Sister City agreements through 45 active projects. 13
Inter-municipal co-operation projects 10
Incoming international delegates 35
TREASURY
REAL ESTATE
Number of leases/ tenancies administered p.a 1 354
Value of leases/ tenancies (R’m) 168.2
Number of properties sold 75
Value of properties sold (R’m) 65.3
Number of properties on valuation roll 503 366
Value of properties on valuation roll (R’bn) 426.1
FINANCE
Number of billed monthly customers 750 000
Average number of queries handled by counter staff in a month 144 400
Average revenue clearance certificates issued per month 3 700
Average number of calls received per month – Call Centre 53 200
Average number of correspondence received per month -letters 39 710

65
CITY FLEET
Total fleet (Vehicle and Plant) 6 045
Average age of light vehicles reduced from 13 to (years) 5
Vehicle availability (%) 97
Workshop productivity increased from 40% to approx. (%) 98
DURBAN TRANSPORT
Total Bus Fleet 537
Bus Availability (%) 95
Total Replacement Value of buses (R’m) 913
SUPPLY CHAIN MANAGEMENT
Total number of tenders awarded 1 531
Value of tenders awarded (R’bn) 5.2
Number of tenders awarded to PBE’s 580
Number of tenders awarded to BBE’s 868
Number of tenders awarded to WBE’s 412
Number of tenders awarded to DPBE’s 1
Number of tenders awarded to SMME’s 1 135
Number of tenders awarded to unregistered companies/suppliers 249
Value of tenders awarded to unregistered companies/ suppliers (R’m) 397
Vendors: 37 664
Black business enterprise 25 572
Priority business enterprise 18 835
Women owned business enterprise 6 168
Disable person owned business enterprise 50
Small medium micro enterprise 27 889
Fully accredited vendors 17 571
Desktop accredited vendors 17 794

�
�
�
�
�
�
����������
�
�
�
�
�
�
�
�
66
16. BUDGET RELATED RESOLUTIONS
16.1 The following resolutions approving the 2013/14 – 2015/16 Medium Term Revenue and Expenditure Framework (MTREF) are submitted to the Executive Committee for consideration and adjustment where necessary.
That note be taken of the contents of the budget documentation circulated in accordance with the Municipal Finance Management Act, No.56 of 2003.
16.2 ESTIMATES OF INCOME AND EXPENDITURE (i) That in terms of section 24 of the Municipal Finance Management Act, 56 of 2003, the annual budget of the municipality for the financial year 2013/14; and indicative allocations for the two projected outer years 2014/15 and 2015/16; and the multi-year and single year capital appropriations are approved as set-out in the following tables of the budget document:
Budgeted Financial Performance (Revenue and Expenditure by Standard Classification) – (Table A2; Page 75)
Budgeted Financial Performance (Revenue and Expenditure by Municipal Vote) – (Table A3; Page 78) Budgeted Financial Performance (Revenue by Source and Expenditure by Type) - (Table A4; Page 81) Multi-year and single year capital appropriations by municipal vote and standard classification and associated funding by source (Table A5; Page 82)
(ii) That the financial position, cash flow, cash-backed reserve/accumulated surplus, asset management and basic service delivery targets are adopted as set out in the following tables:
Budgeted Financial Position (Table A6 ; Page 85)
Budgeted Cash Flows (Table A7 ; Page 86) Asset Management (Table A9 ; Page 88) Basic Service Delivery Measurement (Table A10 ; Page 89)
16.3 MUNICIPAL ENTITIES
That the Municipal Entities budget as reflected on pages 196 to 218 be approved
16.4 RECAPITULATION: VALUATION OF RATEABLE PROPERTY That it be recorded that the recapitulation certificate summarising the valuations of rateable property, as certified by the City Valuer, are laid on the table. The following resolutions, pertaining to property rates (items 16.5 to 16.10) and in conformity with the provisions of Section 14 of the Local Government: Municipal Property Rates Act 6 of 2004 and Sections 17 (3) (a) (ii) and 24 (2) (c) (i) of the Local Government: Municipal Finance Management Act 56 of 2003, be adopted.

67
16.5 DETERMINATION OF RATES In terms of the amended Rates Policy adopted by Council on 27 February 2013, the Municipality may levy different Rates for different categories of Property. That the rate randage for the said financial year for the eThekwini Municipality, be and is hereby assessed and levied for the following categories at:
Residential at 0.976 cents in the Rand
Agricultural at 0.244 cents in the Rand
Industrial at 2.856 cents in the Rand
Business and commercial at 2.213 cents in the Rand
Public service infrastructure at 0.244 cents in the Rand
Vacant land at 4.674 cents in the Rand
Unauthorised or illegal development 4.674 cents in the Rand
Rural Residential at 0.976 cents in the Rand
Development Phasing Line at 3.506 cents in the Rand
Multiple-Use Property will be dealt with in accordance with the Rates Policy.
16.6 EXEMPTIONS, REBATES AND REDUCTIONS
That the following reductions on the market value of the property and rebates on the rates payable, be and are hereby granted in accordance with the Rates Policy.
16.6.1 RESIDENTIAL PROPERTY
That in addition to the statutory reduction of R 15 000, a further reduction of R 105 000 be and is hereby approved for property values exceeding R 185 000.
16.6.2 PUBLIC BENEFIT ORGANISATIONS That on application and approval, only Public Benefit Organisations listed in clause 7.5 of the Municipality’s Rates Policy 2013/2014 shall receive an exemption from rates
16.6.3 SENIOR CITIZENS, DISABILITY GRANTEES / MEDICALLY BOARDED PERSONS AND CHILD HEADED HOUSEHOLDS
(i) That in addition to the reduction in 16.6.1 above, a rebate not exceeding R 3 336 or such lesser
amount as may otherwise be payable, be and is hereby approved for qualifying pensioners, disability grantees / medically boarded persons and child headed households.
(ii) That it be and is hereby resolved to place a maximum limit of R3 million on the value of the property,
in order to qualify for the senior citizens rebate in (i) above.
16.6.4 LIFE RIGHTS SCHEMES AND RETIREMENT VILLAGES That on application and approval, a 25% rebate be granted to Life Rights Schemes and Retirement Villages registered in terms of the Housing Development Scheme for Retired Persons Act 65 of 1988.
16.6.5 SCHOOLS NOT FOR GAIN That a rebate of 50% be and is hereby granted to qualifying schools not for gain.

68
16.6.6 BED AND BREAKFAST UNDERTAKINGS That on application and approval a rebate of 50% be granted to all Bed and Breakfast establishments, that
have a valid Registration Certificate issued by eThekwini Municipality.
16.6.7 GUEST HOUSE UNDERTAKINGS That on application and approval a rebate of 25% be granted to all Guest House undertakings, that have a
valid Registration Certificate issued by eThekwini Municipality.
16.6.8 BACK–PACKER LODGES, HOLIDAY ACCOMODATION AND STUDENT ACCOMMODATION
(i) That on application and approval, the following rebates shall apply to Back-packer establishments that have a valid Registration Certificate issued by eThekwini Municipality:
a) Where up to 9 beds are available to guests, a rebate not exceeding 50% will apply;
b) Where up to 20 beds are available to guests, a rebate not exceeding 25% will apply;
(ii) That on application and approval, property let out for the purposes of Holiday Accommodation for
reward, be granted a rebate of 25%
(iii) That on application, property let out for the purposes of Student Accommodation, be granted a rebate of 25%.
16.6.9 NATURAL AND OTHER DISASTERS (i) That on application and approval a temporary rebate of 75% be granted in respect of property
damaged by disaster for a period of six months or a portion thereof. (ii) That on application and approval, that a further temporary rebate of 75% be granted thereafter for a
period not exceeding six months. (iii) That the rebate is granted on the category of property prior to damage.
16.6.10 VACANT LAND
That a reduction of R 30 000 on Vacant Land outside the Development Phasing Line be and is hereby approved in accordance with the Rates Policy.
16.6.11 MUNICIPAL PROPERTIES Except for Trading Services, Municipal leases and Housing suspensive sale agreements, property owned by the Municipality or occupied by the Municipality for development housing, is exempt from rates.
16.6.12 NATURE RESERVES AND CONVERSATION AREAS That on application and approval, nature reserves and conservation areas shall be excluded from rates.

69
16.6.13 ECONOMIC DEVELOPMENT
Developments that fall within the Development node approved by Council may receive a rebate as approved by Council on application and will be limited to : (i) For a period of three years from date the development plan is approved, for investments with a
property market value between R150 million to R300 million;
(ii) For a period of five years from the date the development plan is approved, for investments with a property market value between R300 million to R1 billion, post development; and
(iii) The rebates in (i) and (ii) above will be deferred to the next financial year and will be apportioned on completion and transfer of units within the development in accordance with the rates policy.
16.6.14 SPECIAL RATING AREAS
(i) That the Special Rating Areas as indicated in Annexure A be and are hereby established.
(ii) That in respect of the Special Rating Areas additional rates, as indicated in Annexure A hereto, be approved and levied in respect of each category of property within the boundaries of the Special Rating Area.
16.7 PHASING IN OF RATES
That the following phasing in of rates be and are hereby approved subject to Section 21 of The Local Government: Municipal Property Rates Act 6 of 2004:
(i) A rate levied on newly rateable property must be phased in over a period of three financial years.
(ii) A rate levied on property belonging to a Land Reform Beneficiary or his or her heirs must, after ten
years from the date on which such beneficiary’s title was registered in the office of the Registrar of
Deeds, be phased in over a period of three financial years.
The phasing in discount on properties referred to in (i) and (ii) above will apply as follows:
(a) 75% in the first year
(b) 50% in the second year
(c) 25% in the third year
(iii) A rate levied on newly rateable property owned and used by organizations conducting specified public benefit activities and registered in terms of the Income Tax Act for those activities must be phased in over a period of four financial years, with the following phasing in discounts:
(a) 100% in the first year (b) 75% in the second year (c) 50% in the third year (d) 25% in the fourth year
16.8 DATE OF OPERATION OF DETERMINATION OF RATES That this determination comes into operation on 1 July 2013.

70
16.9 FINAL DATE FOR PAYMENT OF RATES (i) Where rates are payable in monthly instalments, such payments shall be in twelve (12) equal or near
equal instalments payable 21 days from the date of account.
(ii) Where rates are payable annually the final date for payment shall be 31 October 2013, provided that
where this date falls on a Sunday or public holiday payment shall occur on the last working day prior
to such Sunday or public holiday.
16.10 ADMINISTRATION CHARGE ON ARREAR RATES That the administration charge on arrear rates as referred to in Section 11.6 of the Credit Control and Debt Collection Policy is determined at 10%.Collection of arrear rates is in accordance with the Credit Control and Debt Collection Policy. Interest on Arrears The CFO in conjunction with the Executive Committee shall have the delegated authority to set the interest rate on arrear accounts. The interest rate is currently at prime plus 1%.
16.11 OTHER TARIFFS AND CHARGES (i) That other tariffs and charges as circulated with the budget document in terms of section 24(2)(c)(i) and
(ii) be approved for the financial year commencing 1July 2013.
(iii) That the average Electricity Tariff increase of 5.5%, be hereby approved by the Committee, it being
recorded that in view of the application approving this tariff increase is yet to processed by NERSA, a report on any future impact of this application on eThekwini’s electricity tariff will need to be considered by the Committee.
16.12 DOMESTIC WATER DEBT RELIEF PROGRAM That it be and is hereby resolved to place a maximum limit of R250 000 on the rateable value of the property
in order to qualify for the Water Debt Relief Program. 16.13 ELECTRICITY DEBT RECOVERY USING THE 80/20% OR 50/50% PREPAYMENT SYSTEM That it be and is hereby resolved to place a maximum limit of R250 000 on the rateable value of the property in order for a private residential property to qualify for the electricity 80/20% or 50/50% prepayment debt
recovery facility.
16.14 BUDGET RELATED POLICIES
(i) RATES POLICY That the Rates Policy has been reviewed in terms of Section 5 of the Municipal Property Rates Act 6 of 2004 and Section 17(3)(e) of the Local Government: Municipal Finance Management Act 56 of 2003, and the amended policy was adopted for comment, by Council on 27 February 2013.
(ii) CREDIT CONTROL AND DEBT COLLECTION POLICY
The Credit Control and Debt Collection Policy be and is hereby adopted with the budget.

71
(iii) TARIFF POLICY The Tariff Policy has been adopted by Council on 27 February 2013.
(iv) FUNDING AND RESERVES POLICY
That the Funding and Reserves Policy adopted by Council on 3 May 2010 remains unchanged.
(v) BUDGET POLICY That the Budget Policy approved by Council on 23 February 2011 remains unchanged.
(vi) OTHER BUDGET RELATED POLICIES
That in terms of Section 24(2)(c)(v) of the Municipal Finance Management Act, 56 of 2003, there are no proposed amendments to any other budget related policies.
16.15 CAPITAL EXPENDITURE ESTIMATE
That in those instances where information has been provided in terms of Section 19(2)(b) of the Municipal Finance Management Act No. 56 of 2003, the approval of the capital budget constitutes project approval for the specific projects as reflected in the detailed capital budget. Where information in terms of Section 19(2)(b) is not provided, specific project approval is to be sought from Council during the course of the year.
That the spend on the capital budget for the first 6 months of the financial year is targeted at not less than 35%.
16.16 BORROWINGS TO FINANCE THE CAPITAL BUDGET
That authority be granted to the Chief Financial Officer for the raising of appropriate long term debt in terms
of Section 46 of the Municipal Finance Management Act No 56 of 2003, to finance in part the capital budget of the municipality over the MTREF period.
16.17 HOUSING/HOSTELS DEFICIT
That the estimated Formal Housing Deficit of R 30m for the 2013/2014 financial year be met from the Rate Fund. That the estimated New Development Housing and Hostels deficit of R 247.1m be funded from the Rate Fund. Appropriate interventions need to be escalated by the Executive Committee including, inter alia, the phased introduction of economic rentals, the constructive engagement of the Provincial State Authorities to secure additional funding and strategies to reduce electricity and water consumption. That submission be made to the KZN Department of Human Settlements to provide a subsidy towards the operating cost of Hostels. It being noted that a subsidy of R60m per annum provided over the past three years is no longer forthcoming. That the 8 500 housing units built per annum and currently provided for is dependent on additional funding being sourced, in negotiations with the Provincial Authorities, and that a report on any future impact of the funding sourced, will need to be considered by the Committee.
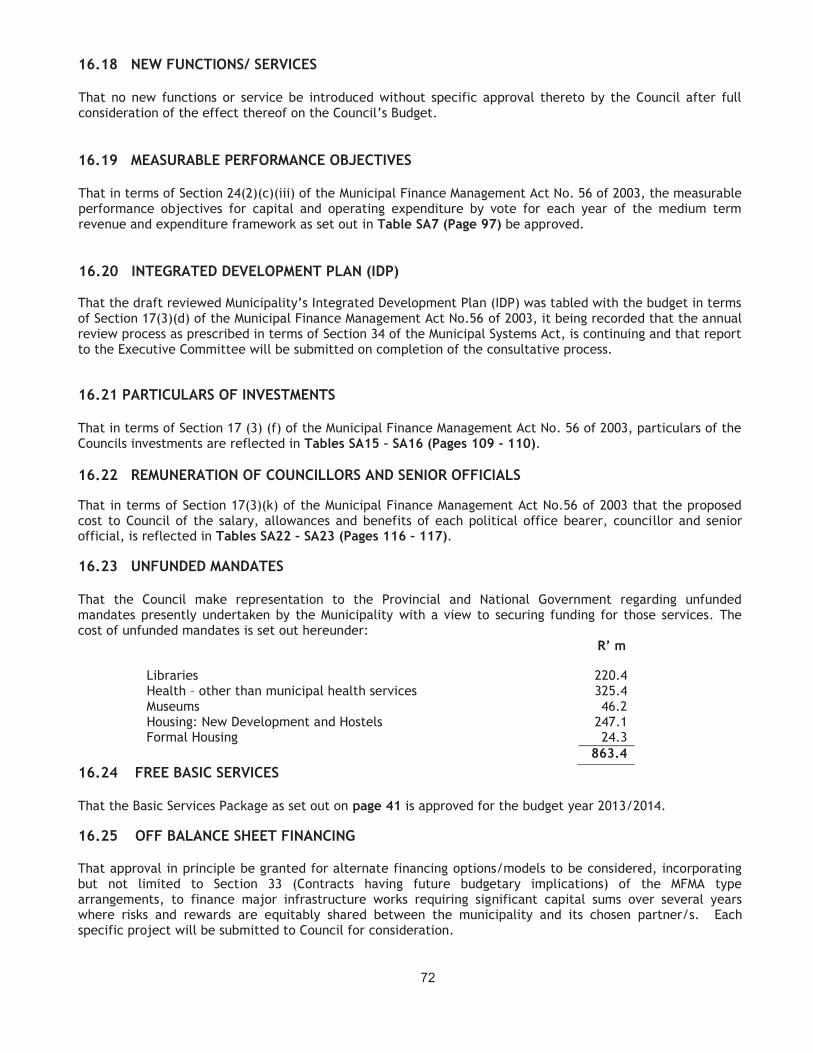
72
16.18 NEW FUNCTIONS/ SERVICES That no new functions or service be introduced without specific approval thereto by the Council after full consideration of the effect thereof on the Council’s Budget.
16.19 MEASURABLE PERFORMANCE OBJECTIVES That in terms of Section 24(2)(c)(iii) of the Municipal Finance Management Act No. 56 of 2003, the measurable performance objectives for capital and operating expenditure by vote for each year of the medium term revenue and expenditure framework as set out in Table SA7 (Page 97) be approved.
16.20 INTEGRATED DEVELOPMENT PLAN (IDP) That the draft reviewed Municipality’s Integrated Development Plan (IDP) was tabled with the budget in terms of Section 17(3)(d) of the Municipal Finance Management Act No.56 of 2003, it being recorded that the annual review process as prescribed in terms of Section 34 of the Municipal Systems Act, is continuing and that report to the Executive Committee will be submitted on completion of the consultative process.
16.21 PARTICULARS OF INVESTMENTS That in terms of Section 17 (3) (f) of the Municipal Finance Management Act No. 56 of 2003, particulars of the Councils investments are reflected in Tables SA15 – SA16 (Pages 109 - 110).
16.22 REMUNERATION OF COUNCILLORS AND SENIOR OFFICIALS
That in terms of Section 17(3)(k) of the Municipal Finance Management Act No.56 of 2003 that the proposed cost to Council of the salary, allowances and benefits of each political office bearer, councillor and senior official, is reflected in Tables SA22 – SA23 (Pages 116 – 117).
16.23 UNFUNDED MANDATES
That the Council make representation to the Provincial and National Government regarding unfunded mandates presently undertaken by the Municipality with a view to securing funding for those services. The cost of unfunded mandates is set out hereunder:
R’ m
Libraries 220.4 Health – other than municipal health services 325.4 Museums 46.2 Housing: New Development and Hostels 247.1 Formal Housing 24.3
863.4
16.24 FREE BASIC SERVICES That the Basic Services Package as set out on page 41 is approved for the budget year 2013/2014.
16.25 OFF BALANCE SHEET FINANCING
That approval in principle be granted for alternate financing options/models to be considered, incorporating but not limited to Section 33 (Contracts having future budgetary implications) of the MFMA type arrangements, to finance major infrastructure works requiring significant capital sums over several years where risks and rewards are equitably shared between the municipality and its chosen partner/s. Each specific project will be submitted to Council for consideration.

73
ANNEXURE A – 2013/14
ADDITIONAL RATES LEVIED ON SPECIAL RATING AREAS (16.6.13 REFERS)
Special Rating Areas Residential Business and Commercial
Industrial Vacant Land
Agriculture
a) Precincts bordered by Monty Naicker, Dorothy Nyembe, Anton Lembede and Dr Yusuf Dadoo Streets.
0.000970 0.002911 0 0 0
b) Precinct bordered by Soldiers Way, Dr AB Xuma Road, Florence Nzama Street and Bram Fischer Road.
0.000163 0.000489 0.000570 0.000814 0
c) Precinct bordered by Dorothy Nyembe Street, Margaret Mncadi Avenue, Beach Walk and Anton Lembede Street.
0.000163 0.000489 0.000570 0.000814 0
d) Precinct bordered by Soldiers Way, Bram Fischer Road, Sylvester Ntuli, KE Masinga and Archie Gumede (Place) Roads.
0.000163 0.000489 0.000570 0.000814 0
e) Precinct bordered by OR Tambo Parade, Dr Pixley KaSeme Street Mall, Rutherford and Gillespie Streets (South Beach Area).
0.001454 0.004362 0 0.007271 0
f) Umhlanga Promenade Precinct bordered by Ocean Way (South), Lot 430 (North), Lagoon Drive (West) and the Indian Ocean (East).
0.000772 0.002317 0
0.003861 0
g) Precinct bordered by Burlington Road, Burlington Drive, Nagel Road, Windsor Road, Midmar Road and Henley Road.
0.002994 0.008982 0 0.014969 0
h) Umhlanga Village Precinct bordered by Flamingo Lane, Ocean Way, Lagoon Drive, McCauland Crescent, Weaver Crescent and the Ruth First Highway.
0 0.001744 0 0.002907 0
i) Giba Gorge bordered by N3 Highway (South), Reservoir Road,Jan Smuts Avenue, Galloway Lane, Mountbatten Place, Alexander Drive, King Cetshwayo Highway (East), Portion 157 of Clifton (North) to Saint Helier Road (West)
0.000489 0 0 0.000489 0.000489
j) Maytime Community bordered by M13 Highway, Woodside Avenue, Haygarth Road, Abrey Road, Msonti, Quilhall Lane, Alexander Avenue, Mtonbi and Victory Road.
0.003661 0.003661 0.003661 0.003661 0
K) Area consisting the length of Florida Road, from Lilian Road to Mitchell’s Park, including properties on both sides of Florida Road.
0 0.006180 0.006180 0 0

�
�
�
�
�
�
�����������
� ����
�
�
�
�
�
�
�

�
�
�
�
�
�
�
� ���������
�
�
�
�
�
�
�

Description 2009/10 2010/11 2011/12
R thousandsAudited
Outcome
Audited
Outcome
Audited
Outcome
Original
Budget
Adjusted
Budget
Full Year
Forecast
Budget Year
2013/14
Budget Year
+1 2014/15
Budget Year
+2 2015/16
Financial Performance
Property rates 4,236,363 4,152,655 4,465,624 4,844,103 4,844,103 4,757,306 5,136,991 5,481,787 5,849,070
Service charges 7,841,497 9,891,173 11,394,607 13,513,490 13,514,185 13,087,424 14,216,001 15,454,433 16,707,877
Investment revenue 201,693 134,414 231,693 239,754 244,707 330,529 374,237 469,488 540,070
Transfers recognised - operational 1,483,128 1,631,911 1,858,822 2,126,964 2,266,351 2,140,176 2,359,637 2,447,577 2,542,976
Other own revenue 3,060,289 2,498,777 2,998,807 2,937,906 3,004,146 2,960,677 3,110,885 3,270,255 3,419,606
Total Revenue (excluding capital transfers and
contributions)
16,822,969 18,308,930 20,949,553 23,662,218 23,873,492 23,276,112 25,197,750 27,123,541 29,059,599
Employee costs 4,633,319 4,913,878 6,576,031 6,104,168 6,140,726 5,827,673 6,681,852 7,252,891 7,670,289
Remuneration of councillors 73,969 77,919 84,752 83,766 83,821 72,007 104,516 110,792 117,282
Depreciation & asset impairment 1,236,808 1,466,639 1,523,993 1,849,181 1,849,292 1,789,637 1,842,045 1,907,251 1,984,435
Finance charges 484,290 692,817 860,878 1,247,576 1,232,749 1,074,415 1,168,516 1,190,426 1,158,521
Materials and bulk purchases 4,594,662 5,537,591 6,710,935 7,858,874 7,858,874 7,704,085 8,051,963 8,740,816 9,494,365
Transfers and grants 139,488 132,121 126,094 174,319 183,945 174,266 203,713 202,213 209,443
Other expenditure 6,004,371 4,505,898 4,831,700 6,433,395 6,613,239 6,446,397 6,923,469 7,429,316 7,897,019
Total Expenditure 17,166,908 17,326,863 20,714,382 23,751,279 23,962,645 23,088,482 24,976,074 26,833,705 28,531,354
Surplus/(Deficit) (343,939) 982,066 235,171 (89,061) (89,153) 187,631 221,676 289,836 528,245
Transfers recognised - capital 2,271,869 981,135 1,550,919 2,831,077 2,886,944 2,809,306 3,183,431 3,581,313 4,084,292
Contributions recognised - capital & contributed assets – – – – – – – – –
Surplus/(Deficit) after capital transfers &
contributions
1,927,930 1,963,202 1,786,090 2,742,016 2,797,791 2,996,937 3,405,108 3,871,148 4,612,537
Share of surplus/ (deficit) of associate – – – – – – – – –
Surplus/(Deficit) for the year 1,927,930 1,963,202 1,786,090 2,742,016 2,797,791 2,996,937 3,405,108 3,871,148 4,612,537
Capital expenditure & funds sources
Capital expenditure 6,499,769 3,785,340 3,515,471 5,308,715 5,316,481 5,332,481 5,466,767 5,795,074 6,469,880
Transfers recognised - capital 2,271,869 981,135 1,550,919 2,831,077 2,886,944 2,809,307 3,183,432 3,581,313 4,084,292
Public contributions & donations – – – 55,000 55,000 55,000 – – –
Borrowing 1,000,000 2,000,000 1,000,000 1,500,000 750,000 750,000 1,000,000 1,000,000 1,000,000
Internally generated funds 3,227,900 804,205 964,552 922,638 1,624,537 1,718,174 1,283,335 1,213,761 1,385,588
Total sources of capital funds 6,499,769 3,785,340 3,515,471 5,308,715 5,316,481 5,332,481 5,466,767 5,795,074 6,469,880
Financial position
Total current assets 8,171,034 9,339,088 11,541,307 10,061,804 10,156,826 11,907,309 12,612,193 13,066,690 13,668,578
Total non current assets 30,698,209 33,270,450 35,170,973 39,106,205 38,482,923 38,322,125 42,024,408 45,961,095 50,498,505
Total current liabilities 7,368,332 7,490,248 8,222,796 7,215,541 7,644,022 8,576,821 8,718,510 8,926,260 9,249,998
Total non current liabilities 10,048,230 11,381,642 12,965,746 12,690,466 12,049,180 12,269,210 12,354,132 12,371,827 12,317,070
Community wealth/Equity 21,452,681 23,737,648 25,523,738 29,262,002 28,946,547 29,383,403 33,563,959 37,729,698 42,600,015
Cash flows
Net cash from (used) operating 2,553,965 3,646,105 4,505,075 4,940,053 4,648,381 5,023,164 5,546,506 5,362,240 6,133,239
Net cash from (used) investing (6,411,993) (3,692,192) (3,452,933) (5,320,148) (5,297,809) (5,318,428) (4,925,758) (5,222,506) (5,831,925)
Net cash from (used) financing 2,609,419 1,592,956 699,315 704,476 (45,524) 56,628 (101,872) 36,725 (17,400)
Cash/cash equivalents at the year end 1,727,157 3,274,026 5,025,483 4,051,298 3,031,965 4,786,847 5,305,724 5,482,183 5,766,097
Cash backing/surplus reconciliation
Cash and investments available 1,890,553 3,274,026 5,025,483 3,611,112 3,610,280 5,302,378 5,861,255 6,098,564 6,440,308
Application of cash and investments 2,006,150 1,985,879 2,473,797 284,929 1,859,875 2,856,248 3,309,271 3,609,297 4,098,494
Balance - surplus (shortfall) (115,597) 1,288,147 2,551,686 3,326,183 1,750,405 2,446,130 2,551,984 2,489,267 2,341,814
Asset management
Asset register summary (WDV) 30,279,149 32,979,461 34,878,719 38,715,439 38,092,157 37,934,205 41,626,346 45,547,353 50,067,991
Depreciation & asset impairment 1,236,808 1,466,639 1,523,993 1,849,181 1,849,292 1,789,637 1,842,045 1,907,251 1,984,435
Renewal of Existing Assets 1,390,567 3,381,242 1,166,087 1,870,236 1,878,002 1,894,002 1,829,573 1,964,510 2,061,572
Repairs and Maintenance 2,193,111 1,793,026 1,821,525 2,489,703 2,092,971 2,602,380 2,840,845 3,009,159 3,124,453
Free services
Cost of Free Basic Services provided 1,128,804 1,339,310 1,305,152 940,808 1,130,808 1,135,130 1,188,671 1,265,100 1,345,180
Revenue cost of free services provided 2,115,160 2,408,283 2,642,169 2,185,430 2,387,430 2,381,430 2,774,656 2,958,783 3,156,524
Households below minimum service level
Water: 82 60 74 73 74 87 80 75 70
Sanitation/sewerage: 221 210 235 219 283 212 202 214 224
Energy: 340 334 345 358 358 358 363 368 373
Refuse: – – – – – – – – –
ETH eThekwini - Table A1 Consolidated Budget Summary
Current Year 2012/132013/14 Medium Term Revenue &
Expenditure Framework
74

ETH eThekwini - Table A2 Consolidated Budgeted Financial Performance (revenue and expenditure by standard classification)
Standard Classification Description 2009/10 2010/11 2011/12
R thousandAudited
Outcome
Audited
Outcome
Audited
Outcome
Original
Budget
Adjusted
Budget
Full Year
Forecast
Budget Year
2013/14
Budget Year
+1 2014/15
Budget Year
+2 2015/16
Revenue - Standard
Governance and administration 5,651,663 6,264,882 6,474,434 8,184,129 8,219,461 7,719,987 8,644,199 9,402,310 10,007,223
Executive and council 4,576 3,022 5,775 2,995 2,955 3,040 12,364 2,917 2,936
Budget and treasury office 5,404,158 6,064,853 6,225,076 7,962,447 7,997,818 7,480,813 8,388,280 9,150,874 9,742,005
Corporate services 242,928 197,007 243,584 218,687 218,687 236,133 243,555 248,519 262,282
Community and public safety 1,809,796 539,551 1,172,769 1,516,109 1,623,424 1,474,800 1,510,985 1,407,537 1,714,773
Community and social services 32,571 29,685 30,063 93,764 102,857 47,674 205,193 202,888 213,930
Sport and recreation 87,295 85,401 97,851 84,462 102,439 78,735 62,394 73,094 79,773
Public safety 247,012 113,850 136,419 111,044 111,044 111,427 116,752 123,606 130,772
Housing 1,392,085 259,218 851,754 1,156,795 1,237,040 1,166,921 1,052,799 930,732 1,211,520
Health 50,833 51,396 56,682 70,044 70,044 70,044 73,846 77,216 78,778
Economic and environmental services 2,255,835 634,887 994,528 1,150,952 1,284,716 1,213,902 1,293,403 1,542,686 1,644,087
Planning and development 1,126,655 211,420 212,639 102,353 225,629 155,128 100,796 120,109 125,914
Road transport 1,119,064 415,281 780,067 1,046,928 1,053,611 1,053,198 1,188,027 1,407,944 1,498,507
Environmental protection 10,115 8,186 1,822 1,671 5,476 5,576 4,580 14,634 19,665
Trading services 9,061,406 11,492,316 13,381,592 15,247,597 15,247,597 15,285,945 16,516,738 17,908,022 19,301,475
Electricity 5,996,744 7,390,903 8,756,686 10,016,891 10,016,891 9,874,587 10,413,767 11,344,382 12,296,916
Water 2,101,297 2,752,069 2,698,040 3,335,940 3,335,940 3,054,093 3,588,648 3,888,259 4,161,618
Waste water management 411,645 701,394 1,211,246 1,129,160 1,129,160 1,467,721 1,568,750 1,674,612 1,784,239
Waste management 551,721 647,950 715,620 765,605 765,605 889,544 945,573 1,000,769 1,058,702
Other 316,137 358,429 477,148 394,506 385,239 390,785 415,857 444,298 476,333
Total Revenue - Standard 19,094,838 19,290,065 22,500,471 26,493,293 26,760,437 26,085,419 28,381,182 30,704,853 33,143,891
Expenditure - Standard
Governance and administration 2,253,254 2,254,660 3,311,099 3,192,182 3,221,832 2,900,369 3,209,666 3,359,922 3,509,299
Executive and council 190,852 200,868 225,446 235,420 263,734 234,123 287,979 304,963 324,544
Budget and treasury office 1,065,176 973,087 2,098,709 1,528,127 1,510,496 1,351,087 1,447,240 1,524,825 1,585,710
Corporate services 997,226 1,080,705 986,944 1,428,635 1,447,602 1,315,159 1,474,448 1,530,134 1,599,045
Community and public safety 3,774,677 2,703,032 3,119,599 3,864,111 3,987,288 3,875,828 4,337,797 4,607,972 4,763,824
Community and social services 438,297 484,709 530,584 650,708 658,853 638,674 733,962 780,008 828,379
Sport and recreation 696,206 529,752 791,559 1,085,396 1,102,330 1,083,236 1,131,143 1,214,093 1,277,559
Public safety 808,556 863,506 1,185,551 1,269,336 1,287,285 1,360,864 1,365,456 1,472,281 1,553,343
Housing 1,568,222 536,825 311,428 592,973 674,663 549,392 840,142 821,590 774,409
Health 263,397 288,241 300,479 265,698 264,157 243,662 267,093 320,000 330,134
Economic and environmental services 2,139,493 2,085,267 2,120,321 2,405,902 2,473,100 2,484,595 2,557,141 2,798,629 2,977,160
Planning and development 670,949 616,324 544,602 747,771 802,396 684,815 759,226 832,979 878,369
Road transport 1,365,912 1,366,173 1,458,122 1,528,215 1,538,332 1,668,989 1,643,204 1,792,772 1,912,486
Environmental protection 102,632 102,770 117,597 129,917 132,372 130,791 154,711 172,879 186,304
Trading services 8,582,949 9,866,318 11,671,470 13,724,545 13,722,733 13,323,110 14,322,103 15,479,555 16,659,849
Electricity 5,262,276 6,101,389 7,427,376 8,705,915 8,705,915 8,396,333 8,894,788 9,615,073 10,401,421
Water 1,867,263 2,386,128 2,585,215 3,171,412 3,171,412 3,113,877 3,438,506 3,722,652 3,992,549
Waste water management 791,635 682,192 883,323 960,992 959,179 911,038 1,016,580 1,095,377 1,178,794
Waste management 661,776 696,608 775,556 886,227 886,227 901,861 972,229 1,046,453 1,087,084
Other 416,535 417,586 491,893 564,537 557,693 504,580 549,367 587,627 621,223
Total Expenditure - Standard 17,166,908 17,326,863 20,714,382 23,751,277 23,962,645 23,088,482 24,976,074 26,833,705 28,531,354
Surplus/(Deficit) for the year 1,927,930 1,963,202 1,786,090 2,742,016 2,797,792 2,996,937 3,405,108 3,871,148 4,612,537
Current Year 2012/132013/14 Medium Term Revenue &
Expenditure Framework
75

ETH eThekwini - Table A2 Consolidated Budgeted Financial Performance (revenue and expenditure by standard classification)
Standard Classification Description 2009/10 2010/11 2011/12
R thousandAudited
Outcome
Audited
Outcome
Audited
Outcome
Original
Budget
Adjusted
Budget
Full Year
Forecast
Budget Year
2013/14
Budget Year
+1 2014/15
Budget Year
+2 2015/16
Revenue - Standard
Municipal governance and administration 5,651,663 6,264,882 6,474,434 8,184,129 8,219,461 7,719,987 8,644,199 9,402,310 10,007,223
Executive and council 4,576 3,022 5,775 2,995 2,955 3,040 12,364 2,917 2,936
Mayor and Council 2,521 3,022 1,669 2,748 2,708 2,793 2,565 2,658 2,677
Municipal Manager 2,056 4,106 247 247 247 9,798 259 259
Budget and treasury office 5,404,158 6,064,853 6,225,076 7,962,447 7,997,818 7,480,813 8,388,280 9,150,874 9,742,005
Corporate services 242,928 197,007 243,584 218,687 218,687 236,133 243,555 248,519 262,282
Human Resources 23,243 19,647 20,975 22,347 22,347 22,981 29,200 12,264 12,878
Information Technology 9,005 22,957 21,915 21,500 21,500 21,494 22,569 23,923 25,358
Property Services 118,646 95,433 122,034 123,556 123,556 123,728 127,633 137,764 141,819
Other Admin 92,035 58,970 78,660 51,285 51,285 67,931 64,153 74,568 82,227
Community and public safety 1,809,796 539,551 1,172,769 1,516,109 1,623,424 1,474,800 1,510,985 1,407,537 1,714,773
Community and social services 32,571 29,685 30,063 93,764 102,857 47,674 205,193 202,888 213,930
Libraries and Archives 5,893 7,550 7,588 64,808 70,651 20,452 161,474 169,868 179,441
Museums & Art Galleries etc 319 1,297 631 4,632 7,332 3,005 18,088 6,136 6,303
Community halls and Facilities 5,024 4,156 4,724 4,850 4,850 4,930 5,183 5,494 5,824
Cemeteries & Crematoriums 17,030 11,979 12,062 13,902 13,902 14,004 14,844 15,735 16,650
Other Social 4,305 4,703 5,058 5,572 6,122 5,284 5,603 5,655 5,712
Sport and recreation 87,295 85,401 97,851 84,462 102,439 78,735 62,394 73,094 79,773
Public safety 247,012 113,850 136,419 111,044 111,044 111,427 116,752 123,606 130,772
Police 82,039 106,934 129,172 103,862 103,862 102,574 108,027 114,444 121,226
Fire 6,237 6,913 7,117 7,178 7,178 7,626 7,435 7,794 8,097
Street Lighting 158,736 – –
Other 3 130 5 5 1,227 1,290 1,368 1,450
Housing 1,392,085 259,218 851,754 1,156,795 1,237,040 1,166,921 1,052,799 930,732 1,211,520
Health 50,833 51,396 56,682 70,044 70,044 70,044 73,846 77,216 78,778
Clinics 1,231 1,167 569 46,641 46,641 46,641 73,757 77,121 78,683
Ambulance – –
Other 49,601 50,229 56,114 23,402 23,402 23,402 90 95 95
Economic and environmental services 2,255,835 634,887 994,528 1,150,952 1,284,716 1,213,902 1,293,403 1,542,686 1,644,087
Planning and development 1,126,655 211,420 212,639 102,353 225,629 155,128 100,796 120,109 125,914
Economic Development/Planning 1,083,463 211,420 170,608 54,712 174,239 99,643 53,219 72,287 77,292
Town Planning/Building
enforcement
35,901 33,058 38,218 41,968 46,057 37,626 37,203 37,985
Licensing & Regulation 7,292 8,973 9,422 9,422 9,428 9,952 10,619 10,637
Road transport 1,119,064 415,281 780,067 1,046,928 1,053,611 1,053,198 1,188,027 1,407,944 1,498,507
Roads 392,110 59,358 211,749 242,063 242,063 242,084 198,347 198,547 198,760
Public Buses 209,640 182,469 351,320 155,144 161,827 157,910 798 798 798
Vehicle Licensing and Testing 26,770 36,900 37,810 28,825 28,825 32,413 34,049 35,510 37,049
Other 490,544 136,553 179,189 620,896 620,896 620,791 954,833 1,173,088 1,261,900
Environmental protection 10,115 8,186 1,822 1,671 5,476 5,576 4,580 14,634 19,665
Pollution Control 5,949 437 299 1,671 1,671 1,671 1,771 1,875 1,875
Biodiversity & Landscape 4,167 7,749 1,523 3,805 3,905 2,809 12,759 17,790
Trading services 9,061,406 11,492,316 13,381,592 15,247,597 15,247,597 15,285,945 16,516,738 17,908,022 19,301,475
Electricity 5,996,744 7,390,903 8,756,686 10,016,891 10,016,891 9,874,587 10,413,767 11,344,382 12,296,916
Electricity Distribution 5,996,744 7,372,393 8,732,946 9,949,300 9,949,300 9,846,544 10,382,442 11,309,549 12,258,251
Electricity Generation 18,511 23,741 67,591 67,591 28,043 31,325 34,833 38,665
Water 2,101,297 2,752,069 2,698,040 3,335,940 3,335,940 3,054,093 3,588,648 3,888,259 4,161,618
Water Distribution 2,101,297 2,752,069 2,698,040 3,335,940 3,335,940 3,054,093 3,588,648 3,888,259 4,161,618
Water Storage –
Waste water management 411,645 701,394 1,211,246 1,129,160 1,129,160 1,467,721 1,568,750 1,674,612 1,784,239
Sewerage 390,737 685,644 1,210,716 1,129,138 1,129,138 1,467,698 1,568,727 1,674,589 1,784,216
Storm Water Management 20,908 15,750 530 23 23 23 23 23 23
Public Toilets –
Waste management 551,721 647,950 715,620 765,605 765,605 889,544 945,573 1,000,769 1,058,702
Solid Waste 551,721 647,950 715,620 765,605 765,605 889,544 945,573 1,000,769 1,058,702
Other 316,137 358,429 477,148 394,506 385,239 390,785 415,857 444,298 476,333
Air Transport 5,052 5,391 6,216 6,865 7,115 6,955 7,626 7,906 8,802
Tourism 511 839 794 669 669 1,354 767 803 840
Markets 68,928 67,176 73,877 77,243 77,243 76,659 82,588 87,720 93,996
ICC 112,488 134,930 243,376 132,581 132,581 138,186 143,000 152,316 162,265
USHAKA MARINE 129,158 150,093 152,885 177,148 167,631 167,631 181,876 195,553 210,430
Total Revenue - Standard 19,094,838 19,290,065 22,500,471 26,493,293 26,760,437 26,085,419 28,381,182 30,704,853 33,143,891
Current Year 2012/132013/14 Medium Term Revenue &
Expenditure Framework
76
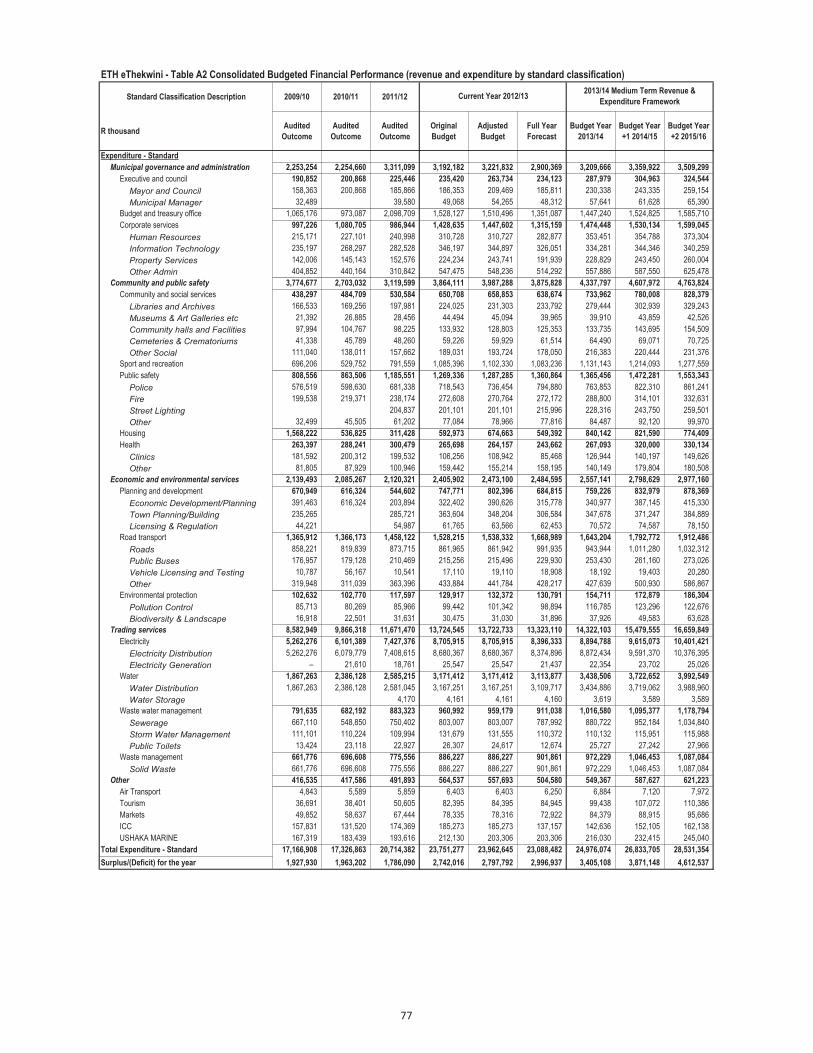
ETH eThekwini - Table A2 Consolidated Budgeted Financial Performance (revenue and expenditure by standard classification)
Standard Classification Description 2009/10 2010/11 2011/12
R thousandAudited
Outcome
Audited
Outcome
Audited
Outcome
Original
Budget
Adjusted
Budget
Full Year
Forecast
Budget Year
2013/14
Budget Year
+1 2014/15
Budget Year
+2 2015/16
Current Year 2012/132013/14 Medium Term Revenue &
Expenditure Framework
Expenditure - Standard
Municipal governance and administration 2,253,254 2,254,660 3,311,099 3,192,182 3,221,832 2,900,369 3,209,666 3,359,922 3,509,299
Executive and council 190,852 200,868 225,446 235,420 263,734 234,123 287,979 304,963 324,544
Mayor and Council 158,363 200,868 185,866 186,353 209,469 185,811 230,338 243,335 259,154
Municipal Manager 32,489 39,580 49,068 54,265 48,312 57,641 61,628 65,390
Budget and treasury office 1,065,176 973,087 2,098,709 1,528,127 1,510,496 1,351,087 1,447,240 1,524,825 1,585,710
Corporate services 997,226 1,080,705 986,944 1,428,635 1,447,602 1,315,159 1,474,448 1,530,134 1,599,045
Human Resources 215,171 227,101 240,998 310,728 310,727 282,877 353,451 354,788 373,304
Information Technology 235,197 268,297 282,528 346,197 344,897 326,051 334,281 344,346 340,259
Property Services 142,006 145,143 152,576 224,234 243,741 191,939 228,829 243,450 260,004
Other Admin 404,852 440,164 310,842 547,475 548,236 514,292 557,886 587,550 625,478
Community and public safety 3,774,677 2,703,032 3,119,599 3,864,111 3,987,288 3,875,828 4,337,797 4,607,972 4,763,824
Community and social services 438,297 484,709 530,584 650,708 658,853 638,674 733,962 780,008 828,379
Libraries and Archives 166,533 169,256 197,981 224,025 231,303 233,792 279,444 302,939 329,243
Museums & Art Galleries etc 21,392 26,885 28,456 44,494 45,094 39,965 39,910 43,859 42,526
Community halls and Facilities 97,994 104,767 98,225 133,932 128,803 125,353 133,735 143,695 154,509
Cemeteries & Crematoriums 41,338 45,789 48,260 59,226 59,929 61,514 64,490 69,071 70,725
Other Social 111,040 138,011 157,662 189,031 193,724 178,050 216,383 220,444 231,376
Sport and recreation 696,206 529,752 791,559 1,085,396 1,102,330 1,083,236 1,131,143 1,214,093 1,277,559
Public safety 808,556 863,506 1,185,551 1,269,336 1,287,285 1,360,864 1,365,456 1,472,281 1,553,343
Police 576,519 598,630 681,338 718,543 736,454 794,880 763,853 822,310 861,241
Fire 199,538 219,371 238,174 272,608 270,764 272,172 288,800 314,101 332,631
Street Lighting 204,837 201,101 201,101 215,996 228,316 243,750 259,501
Other 32,499 45,505 61,202 77,084 78,966 77,816 84,487 92,120 99,970
Housing 1,568,222 536,825 311,428 592,973 674,663 549,392 840,142 821,590 774,409
Health 263,397 288,241 300,479 265,698 264,157 243,662 267,093 320,000 330,134
Clinics 181,592 200,312 199,532 106,256 108,942 85,468 126,944 140,197 149,626
Other 81,805 87,929 100,946 159,442 155,214 158,195 140,149 179,804 180,508
Economic and environmental services 2,139,493 2,085,267 2,120,321 2,405,902 2,473,100 2,484,595 2,557,141 2,798,629 2,977,160
Planning and development 670,949 616,324 544,602 747,771 802,396 684,815 759,226 832,979 878,369
Economic Development/Planning 391,463 616,324 203,894 322,402 390,626 315,778 340,977 387,145 415,330
Town Planning/Building
enforcement
235,265 285,721 363,604 348,204 306,584 347,678 371,247 384,889
Licensing & Regulation 44,221 54,987 61,765 63,566 62,453 70,572 74,587 78,150
Road transport 1,365,912 1,366,173 1,458,122 1,528,215 1,538,332 1,668,989 1,643,204 1,792,772 1,912,486
Roads 858,221 819,839 873,715 861,965 861,942 991,935 943,944 1,011,280 1,032,312
Public Buses 176,957 179,128 210,469 215,256 215,496 229,930 253,430 261,160 273,026
Vehicle Licensing and Testing 10,787 56,167 10,541 17,110 19,110 18,908 18,192 19,403 20,280
Other 319,948 311,039 363,396 433,884 441,784 428,217 427,639 500,930 586,867
Environmental protection 102,632 102,770 117,597 129,917 132,372 130,791 154,711 172,879 186,304
Pollution Control 85,713 80,269 85,966 99,442 101,342 98,894 116,785 123,296 122,676
Biodiversity & Landscape 16,918 22,501 31,631 30,475 31,030 31,896 37,926 49,583 63,628
Trading services 8,582,949 9,866,318 11,671,470 13,724,545 13,722,733 13,323,110 14,322,103 15,479,555 16,659,849
Electricity 5,262,276 6,101,389 7,427,376 8,705,915 8,705,915 8,396,333 8,894,788 9,615,073 10,401,421
Electricity Distribution 5,262,276 6,079,779 7,408,615 8,680,367 8,680,367 8,374,896 8,872,434 9,591,370 10,376,395
Electricity Generation – 21,610 18,761 25,547 25,547 21,437 22,354 23,702 25,026
Water 1,867,263 2,386,128 2,585,215 3,171,412 3,171,412 3,113,877 3,438,506 3,722,652 3,992,549
Water Distribution 1,867,263 2,386,128 2,581,045 3,167,251 3,167,251 3,109,717 3,434,886 3,719,062 3,988,960
Water Storage 4,170 4,161 4,161 4,160 3,619 3,589 3,589
Waste water management 791,635 682,192 883,323 960,992 959,179 911,038 1,016,580 1,095,377 1,178,794
Sewerage 667,110 548,850 750,402 803,007 803,007 787,992 880,722 952,184 1,034,840
Storm Water Management 111,101 110,224 109,994 131,679 131,555 110,372 110,132 115,951 115,988
Public Toilets 13,424 23,118 22,927 26,307 24,617 12,674 25,727 27,242 27,966
Waste management 661,776 696,608 775,556 886,227 886,227 901,861 972,229 1,046,453 1,087,084
Solid Waste 661,776 696,608 775,556 886,227 886,227 901,861 972,229 1,046,453 1,087,084
Other 416,535 417,586 491,893 564,537 557,693 504,580 549,367 587,627 621,223
Air Transport 4,843 5,589 5,859 6,403 6,403 6,250 6,884 7,120 7,972
Tourism 36,691 38,401 50,605 82,395 84,395 84,945 99,438 107,072 110,386
Markets 49,852 58,637 67,444 78,335 78,316 72,922 84,379 88,915 95,686
ICC 157,831 131,520 174,369 185,273 185,273 137,157 142,636 152,105 162,138
USHAKA MARINE 167,319 183,439 193,616 212,130 203,306 203,306 216,030 232,415 245,040
Total Expenditure - Standard 17,166,908 17,326,863 20,714,382 23,751,277 23,962,645 23,088,482 24,976,074 26,833,705 28,531,354
Surplus/(Deficit) for the year 1,927,930 1,963,202 1,786,090 2,742,016 2,797,792 2,996,937 3,405,108 3,871,148 4,612,537
77

ETH eThekwini - Table A3 Consolidated Budgeted Financial Performance (revenue and expenditure by municipal vote)
Vote Description 2009/10 2010/11 2011/12
R thousandAudited
Outcome
Audited
Outcome
Audited
Outcome
Original
Budget
Adjusted
Budget
Full Year
Forecast
Budget Year
2013/14
Budget Year
+1 2014/15
Budget Year
+2 2015/16
Revenue by Vote
Vote 1 - Office of the City Manager 118,510 158,667 190,780 154,539 155,556 157,269 165,490 174,744 184,522
Vote 2 - Finance 5,842,071 6,028,376 6,186,375 8,353,032 8,333,826 7,830,182 8,580,754 9,363,888 9,966,726
Vote 3 - Governance 5,210 2,068 3,365 6,260 6,770 6,016 5,849 6,018 6,119
Vote 4 - Corporate and Human Resources 23,821 20,109 21,404 22,897 22,897 23,075 29,200 12,264 12,878
Vote 5 - Economic Development and Planning 1,150,679 273,679 150,699 105,627 241,166 182,091 114,931 202,178 219,654
Vote 6 - Community and Emergency Services 123,486 100,601 105,430 210,612 222,133 140,714 309,184 301,875 315,460
Vote 7 - Human Settlements and Infrastructure 3,036,535 2,038,709 3,168,779 3,868,061 4,008,847 4,355,001 4,466,882 4,741,903 5,368,019
Vote 8 - Electricity 6,155,480 7,510,183 8,949,656 9,949,300 9,949,300 9,846,544 10,382,442 11,309,549 12,258,251
Vote 9 - Water 2,101,297 2,752,069 3,190,097 3,335,940 3,335,940 3,054,093 3,588,648 3,888,259 4,161,618
Vote 10 - Formal Housing 231,467 57,295 66,561 102,977 109,222 110,289 332,927 271,513 186,637
Vote 11 - Markets 59,584 57,895 64,848 67,455 67,455 67,374 72,370 76,886 82,510
Vote 12 - Airport 5,052 5,391 6,216 6,865 7,115 6,955 7,626 7,906 8,802
Vote 13 - ICC 112,488 134,930 243,376 132,581 132,581 138,186 143,000 152,316 162,265
Vote 14 - USHAKA MARINE 129,158 150,093 152,885 177,148 167,631 167,631 181,876 195,553 210,430
Total Revenue by Vote 19,094,838 19,290,065 22,500,471 26,493,293 26,760,437 26,085,419 28,381,182 30,704,853 33,143,891
Expenditure by Vote to be appropriated
Vote 1 - Office of the City Manager 960,134 1,035,524 1,235,714 1,261,950 1,339,192 1,350,919 1,323,344 1,433,251 1,480,061
Vote 2 - Finance 1,496,987 1,319,163 1,431,233 2,199,736 2,217,276 2,008,415 2,161,948 2,264,072 2,370,930
Vote 3 - Governance 276,073 310,299 345,064 390,107 419,208 367,503 460,703 477,084 507,097
Vote 4 - Corporate and Human Resources 231,323 244,907 260,354 337,233 337,232 308,350 380,712 382,645 402,838
Vote 5 - Economic Development and Planning 628,602 657,659 682,341 807,263 835,274 782,909 870,295 922,392 974,500
Vote 6 - Community and Emergency Services 1,548,316 1,715,740 1,854,919 2,115,057 2,123,842 2,068,075 2,252,831 2,469,165 2,603,244
Vote 7 - Human Settlements and Infrastructure 4,175,668 3,092,833 4,388,740 3,985,472 4,038,703 3,951,732 4,193,852 4,565,384 4,857,727
Vote 8 - Electricity 5,262,276 6,101,389 7,427,376 8,881,468 8,881,468 8,590,892 9,100,750 9,835,121 10,635,896
Vote 9 - Water 1,867,263 2,386,128 2,585,215 3,171,412 3,171,412 3,113,877 3,438,506 3,722,652 3,992,549
Vote 10 - Formal Housing 356,031 105,164 89,284 145,910 152,210 152,150 371,100 311,390 227,433
Vote 11 - Markets 34,241 37,509 40,296 51,862 51,848 46,947 56,483 58,911 63,928
Vote 12 - Airport 4,844 5,589 5,860 6,403 6,403 6,250 6,884 7,120 7,972
Vote 13 - ICC 157,831 131,520 174,369 185,273 185,273 137,157 142,636 152,105 162,138
Vote 14 - USHAKA MARINE 167,319 183,439 193,616 212,130 203,306 203,306 216,030 232,415 245,040
Total Expenditure by Vote 17,166,908 17,326,863 20,714,382 23,751,277 23,962,646 23,088,482 24,976,074 26,833,705 28,531,354
Surplus/(Deficit) for the year 1,927,930 1,963,202 1,786,090 2,742,016 2,797,791 2,996,937 3,405,108 3,871,148 4,612,537
Current Year 2012/132013/14 Medium Term Revenue &
Expenditure Framework
78

ETH eThekwini - Table A3 Consolidated Budgeted Financial Performance (revenue and expenditure by municipal vote)A
Vote Description 2009/10 2010/11 2011/12
R thousandAudited
Outcome
Audited
Outcome
Audited
Outcome
Original
Budget
Adjusted
Budget
Full Year
Forecast
Budget Year
2013/14
Budget Year
+1 2014/15
Budget Year
+2 2015/16
Revenue by Vote
Vote 1 - Office of the City Manager 118,510 158,667 190,780 154,539 155,556 157,269 165,490 174,744 184,522
1.1 - City Manager's Office – –
1.2 - Corporate GIS – 75
1.3 - Audit 3 1 1 –
1.4 - Information Technology 9,005 22,957 21,915 21,500 21,500 21,494 22,569 23,923 25,358
1.5 - Corporate Policy 6 71 472 2 944 38 40 42 45
1.6 - Ombudsperson & Investigations – – –
1.7 - Legal Services 576 530 610 350 350 750 805 825 845
1.8 - Performance Management 111 47 800 –
1.9 - Metropolitan Police 108,809 135,059 166,982 132,687 132,687 134,987 142,077 149,955 158,275 Vote 2 - Finance 5,842,071 6,028,376 6,186,375 8,353,032 8,333,826 7,830,182 8,580,754 9,363,888 9,966,726
2.1 - Deputy City Manager 3 –
2.2 - Expenditure 29 23 82 5 5 8 5 5 5
2.3 - Income 198,183 127,967 167,328 184,284 184,284 184,284 182,687 185,126 186,571
2.4 - Finance and Major Projects 80,915 53,175 58,489 40,885 40,885 49,691 52,147 62,523 70,395
2.5 - Internal Control & Business Systems 17,025 7,388 11,897 3,590 3,590 3,592 3,590 3,590 3,590
2.6 - Real Estate 118,539 110,863 121,940 123,446 123,446 123,622 127,523 137,648 141,696
2.7 - City Fleet 10,329 5,779 15,951 9,028 9,028 16,545 10,325 10,325 10,325
2.8 - Durban Energy Office 1,666 30,020 9,377 – 14,901 14,902
2.9 - INK 26,995 – –
2.10 - Durban Transport 229,196 182,469 351,320 155,144 161,827 157,910 798 798 798
2.11 - Assessment Rates 4,086,153 4,070,801 4,353,757 4,723,314 4,723,314 4,639,649 5,022,921 5,368,618 5,736,856
2.12 - Miscellaneous 1,082,372 1,394,384 1,088,494 3,045,745 3,066,216 2,633,251 3,173,693 3,587,829 3,808,935
2.13- Supply Chain Management 17,661 18,511 7,739 67,591 6,331 6,728 7,064 7,426 7,555 Vote 3 - Governance 5,210 2,068 3,365 6,260 6,770 6,016 5,849 6,018 6,119
3.1 - Deputy City Manager –
3.2 - City Hall Administration & City Secretariat 2,521 1,195 1,679 2,748 2,708 2,793 2,565 2,658 2,677
3.3 - Communications 14 9 2 –
3.4 - Regional Centres 607 850 1,266 1,511 2,061 1,223 1,284 1,361 1,443
3.5 - Community Participation & Action Support 0 14 – –
3.6 - SDB – – –
3.7 - International & Governance Relations 2,068 418 2,000 2,000 2,000 2,000 2,000 2,000
Vote 4 - Corporate and Human Resources 23,821 20,109 21,404 22,897 22,897 23,075 29,200 12,264 12,878
4.1 - Deputy City Manager 35 –
4.2 - Human Resources 39 31 27 –
4.3 - Skills Development 23,203 19,616 20,947 22,347 22,347 22,981 29,200 12,264 12,878
4.4 - Occupational Health and Safety 1 1 1 –
4.5 - Management Services and Org. Development 543 461 430 550 550 94
Vote 5 - Economic Development and Planning 1,150,679 273,679 150,699 105,627 241,166 182,091 114,931 202,178 219,654
5.1 - Deputy City Manager 29 – –
5.2 - Economic Development & Facilitation 196,491 76,209 12,652 10,000 15,509 10,324 3,557 70,002 75,002
5.3 - City Enterprises 1,268 839 1,063 669 669 1,394 767 803 840
5.4 - Business Support 6,930 8,455 8,526 9,283 9,283 8,888 9,357 10,004 10,002
5.5 - Retail Markets 9,344 9,282 9,072 9,789 9,789 9,285 10,218 10,834 11,486
5.6 - Development Planning & Management 34,619 35,877 26,790 30,743 38,298 42,486 40,001 49,502 55,289
5.7 - Area Based Management 62,136 3,877 20,566 30 30 31 32 33 35
5.8 - Strategic Projects 839,891 139,112 72,029 45,114 167,589 109,684 51,000 61,000 67,000 Vote 6 - Community and Emergency Services 123,486 100,601 105,430 210,612 222,133 140,714 309,184 301,875 315,460
6.1 - Deputy City Manager 1,000 – – 9,539
6.2 - Emergency Services 6,213 6,913 7,117 7,178 7,178 7,626 7,435 7,794 8,097
6.3 - Disaster Management 3 – – –
6.4 - Emergency Control Centre 130 5 5 1,227 1,290 1,368 1,450
6.5 - Security Management –
6.6 - Deputy City Manager 50 – –
6.7 - Health 56,779 51,724 56,981 71,715 71,715 71,715 75,617 79,091 80,653
6.8 - Parks, Recreation, Cemetries and Culture 60,444 41,961 40,202 131,715 143,235 60,146 215,303 213,622 225,260
Vote 7 - Human Settlements and Infrastructure3,036,535 2,038,709 3,168,779 3,868,061 4,008,847 4,355,001 4,466,882 4,741,903 5,368,019
7.1 - Deputy City Manager 1,970 1,797 3,106 247 247 247 259 259 259
7.2 - Housing 1,160,620 219,160 785,193 1,053,818 1,127,818 1,056,632 719,872 659,219 1,024,883
7.3 - Engineering 431,655 110,739 243,024 292,026 297,551 292,045 246,293 199,146 199,393
7.4 - eThekwini Transport Authority 472,364 136,553 187,379 620,896 620,896 620,791 954,833 1,173,088 1,261,900
7.5 - Sanitation 411,645 916,719 1,210,716 1,129,138 1,129,138 1,467,698 1,568,727 1,674,589 1,784,216
7.6 - Cleansing and Solid Waste 6,560 5,251 715,620 6,331 765,605 889,544 945,573 1,000,769 1,058,702
7.7 - Gas to Electricity 551,721 648,490 23,741 765,605 67,591 28,043 31,325 34,833 38,665 Vote 8 - Electricity 6,155,480 7,510,183 8,949,656 9,949,300 9,949,300 9,846,544 10,382,442 11,309,549 12,258,251
8.1 - Electricity 6,155,480 7,510,183 8,949,656 9,949,300 9,949,300 9,846,544 10,382,442 11,309,549 12,258,251
Vote 9 - Water 2,101,297 2,752,069 3,190,097 3,335,940 3,335,940 3,054,093 3,588,648 3,888,259 4,161,618
9.1 - Water 2,101,297 2,752,069 3,190,097 3,335,940 3,335,940 3,054,093 3,588,648 3,888,259 4,161,618
Vote 10 - Formal Housing 231,467 57,295 66,561 102,977 109,222 110,289 332,927 271,513 186,637
10.1 - Formal Housing 231,467 57,295 66,561 102,977 109,222 110,289 332,927 271,513 186,637
Vote 11 - Markets 59,584 57,895 64,848 67,455 67,455 67,374 72,370 76,886 82,510
11.1 - Markets 59,584 57,895 64,848 67,455 67,455 67,374 72,370 76,886 82,510
Vote 12 - Airport 5,052 5,391 6,216 6,865 7,115 6,955 7,626 7,906 8,802
12.1 - Airport 5,052 5,391 6,216 6,865 7,115 6,955 7,626 7,906 8,802
Vote 13 - ICC 112,488 134,930 243,376 132,581 132,581 138,186 143,000 152,316 162,265 - ICC 112,488 134,930 243,376 132,581 132,581 138,186 143,000 152,316 162,265
Vote 14 - USHAKA MARINE 129,158 150,093 152,885 177,148 167,631 167,631 181,876 195,553 210,430
- USHAKA MARINE 129,158 150,093 152,885 177,148 167,631 167,631 181,876 195,553 210,430
Total Revenue by Vote 19,094,838 19,290,065 22,500,471 26,493,293 26,760,437 26,085,419 28,381,182 30,704,853 33,143,891
Current Year 2012/132013/14 Medium Term Revenue &
Expenditure Framework
79

ETH eThekwini - Table A3 Consolidated Budgeted Financial Performance (revenue and expenditure by municipal vote)A
Vote Description 2009/10 2010/11 2011/12
R thousandAudited
Outcome
Audited
Outcome
Audited
Outcome
Original
Budget
Adjusted
Budget
Full Year
Forecast
Budget Year
2013/14
Budget Year
+1 2014/15
Budget Year
+2 2015/16
Current Year 2012/132013/14 Medium Term Revenue &
Expenditure Framework
Expenditure by Vote
Vote 1 - Office of the City Manager 960,134 1,035,524 1,235,714 1,261,950 1,339,192 1,350,919 1,323,344 1,433,251 1,480,061
1.1 - City Manager's Office 55,410 46,847 171,840 75,502 133,176 119,956 95,081 122,832 129,883
1.2 - Corporate GIS 13,014 12,521 15,537 17,699 18,088 17,005 18,980 20,581 22,206
1.3 - Audit 27,198 27,171 30,211 37,714 37,712 34,880 38,766 41,040 42,311
1.4 - Information Technology 235,197 268,202 282,528 346,197 344,897 326,051 334,281 344,346 340,259
1.5 - Corporate Policy 12,415 14,538 18,011 20,586 21,172 18,473 21,332 22,731 24,043
1.6 - Ombudsperson & Investigations 11,895 11,868 12,421 16,533 16,533 12,678 17,224 19,123 20,013
1.7 - Legal Services 47,549 52,441 59,923 62,843 62,843 59,352 66,786 71,867 74,152
1.8 - Performance Management 3,157 3,305 5,289 5,453 5,443 5,809 9,000 9,639 10,127
1.9 - Metropolitan Police 554,299 598,630 639,954 679,424 699,329 756,714 721,895 781,091 817,067
Vote 2 - Finance 1,496,987 1,319,163 1,431,233 2,199,736 2,217,276 2,008,415 2,161,948 2,264,072 2,370,930
2.1 - Deputy City Manager 5,938 5,580 4,577 6,733 6,733 4,843 7,266 7,655 8,101
2.2 - Expenditure 90,436 95,446 90,071 117,362 117,362 103,826 116,487 122,177 128,915
2.3 - Income 311,356 327,208 365,936 422,734 422,708 389,143 358,954 379,160 388,207
2.4 - Finance and Major Projects 78,694 91,663 105,121 126,012 126,012 107,695 114,393 121,263 128,300
2.5 - Internal Control & Business Systems 40,084 44,444 46,003 64,161 64,156 46,093 65,891 68,974 72,349
2.6 - Real Estate 79,973 79,899 74,846 122,841 122,778 75,187 96,863 96,818 101,827
2.7 - City Fleet 212,823 225,681 234,368 256,011 256,694 250,290 261,459 274,374 293,244
2.8 - Durban Energy Office 4,160 3,895 5,357 12,859 13,859 8,390 10,792 11,394 11,388
2.9 - INK 6,724 4,907 7,214 7,214 6,493 6,982 7,101 7,422
2.10 - Durban Transport 164,455 179,128 210,469 215,256 215,496 229,930 253,430 261,160 273,026
2.11 - Assessment Rates – 9,956 14,005 71,879 71,879 75,011 87,064 101,769 102,724
2.12 - Miscellaneous 490,337 227,929 231,517 751,126 732,571 650,574 713,825 740,941 777,537
2.13- Supply Chain Management 18,731 21,610 44,056 25,547 59,813 60,940 68,544 71,285 77,889 Vote 3 - Governance 276,073 310,299 345,064 390,107 419,208 367,503 460,703 477,084 507,097
3.1 - Deputy City Manager 3,495 4,006 4,460 4,760 4,756 4,802 2,475 2,627 2,783
3.2 - City Hall Administration & City Secretariat 156,140 164,809 185,866 186,353 209,469 185,811 230,338 243,335 259,154
3.3 - Communications 29,792 31,714 30,849 41,869 41,994 33,872 46,155 49,217 52,157
3.4 - Regional Centres 52,421 59,427 68,431 72,489 78,600 74,395 78,921 85,707 91,471
3.5 - Community Participation & Action Support 25,318 38,679 43,138 67,573 67,467 53,670 84,499 77,329 82,109
3.6 - SDB – 4,293 4,161 6,444 6,333 4,035 6,660 6,984 7,373
3.7 - International & Governance Relations 8,907 7,371 8,159 10,619 10,589 10,918 11,655 11,885 12,051
Vote 4 - Corporate and Human Resources 231,323 244,907 260,354 337,233 337,232 308,350 380,712 382,645 402,838
4.1 - Deputy City Manager 3,438 5,447 5,428 9,220 9,220 9,207 9,669 10,216 10,741
4.2 - Human Resources 112,383 122,180 133,093 170,199 170,199 151,149 181,156 191,730 202,492
4.3 - Skills Development 73,224 69,860 72,223 95,485 95,485 94,392 123,294 111,319 116,602
4.4 - Occupational Health and Safety 28,193 31,596 32,376 41,114 41,113 33,399 44,104 46,597 48,870
4.5 - Management Services and Org. Development 14,085 15,824 17,234 21,215 21,215 20,203 22,489 22,782 24,133
Vote 5 - Economic Development and Planning 628,602 657,659 682,341 807,263 835,274 782,909 870,295 922,392 974,500
5.1 - Deputy City Manager 2,237 2,391 637 3,183 3,183 1,749 9,610 10,162 11,706
5.2 - Economic Development & Facilitation 34,165 51,410 53,525 85,938 102,740 84,248 107,013 115,296 127,408
5.3 - City Enterprises 95,409 87,349 87,792 134,922 132,032 127,015 148,641 159,911 167,281
5.4 - Business Support 41,099 46,107 52,352 59,028 60,918 60,920 67,301 71,095 74,477
5.5 - Retail Markets 18,614 21,265 27,153 26,473 26,468 25,975 27,896 30,004 31,758
5.6 - Development Planning & Management 146,025 164,212 178,766 200,516 204,506 202,715 219,107 236,732 253,727
5.7 - Area Based Management 38,038 10,098 7,960 14,390 14,390 13,175 14,745 15,776 16,623
5.8 - Strategic Projects 253,015 274,826 274,155 282,812 291,037 267,113 275,982 283,416 291,521
Vote 6 - Community and Emergency Services 1,548,316 1,715,740 1,854,919 2,115,057 2,123,842 2,068,075 2,252,831 2,469,165 2,603,244
6.1 - Deputy City Manager 5,353 11,800 15,757 17,737 17,677 16,996 20,628 21,921 23,165
6.2 - Emergency Services 199,270 217,896 235,828 262,601 262,601 263,233 276,682 301,234 318,978
6.3 - Disaster Management 4,802 6,591 7,669 15,453 13,741 14,007 17,318 18,340 19,359
6.4 - Emergency Control Centre 26,143 36,327 48,711 64,319 66,023 63,964 67,526 74,123 81,015
6.5 - Security Management 33,007 46,416 51,925 56,225 56,231 57,071 59,746 60,192 64,001
6.6 - Deputy City Manager 1,492 10,521 17,639 18,469 18,469 18,492 20,203 24,006 25,317
6.7 - Health 335,715 355,418 372,269 350,075 350,438 327,183 366,796 425,117 434,705
6.8 - Parks, Recreation, Cemetries and Culture 942,534 1,030,771 1,105,119 1,330,178 1,338,661 1,307,129 1,423,932 1,544,232 1,636,705
Vote 7 - Human Settlements and Infrastructure4,175,668 3,092,833 4,388,740 3,985,472 4,038,703 3,951,732 4,193,852 4,565,384 4,857,727
7.1 - Deputy City Manager 12,344 10,081 11,994 12,056 12,056 11,809 14,243 14,945 15,250
7.2 - Housing 1,212,191 325,643 904,529 447,063 522,453 397,242 469,043 510,201 546,976
7.3 - Engineering 1,139,517 897,812 1,378,155 1,317,310 1,322,663 1,377,664 1,379,998 1,487,613 1,531,731
7.4 - eThekwini Transport Authority 321,028 320,801 380,167 444,884 451,684 438,353 438,182 512,106 598,714
7.5 - Sanitation 791,635 745,745 842,094 818,073 818,073 803,366 897,804 970,363 1,052,946
7.6 - Cleansing and Solid Waste 661,776 40,221 853,040 886,227 886,227 901,861 972,229 1,046,453 1,087,084
7.7 - Gas to Electricity 37,177 752,531 18,761 59,860 25,547 21,437 22,354 23,702 25,026
Vote 8 - Electricity 5,262,276 6,101,389 7,427,376 8,881,468 8,881,468 8,590,892 9,100,750 9,835,121 10,635,896
8.1 - Electricity 5,262,276 6,101,389 7,427,376 8,881,468 8,881,468 8,590,892 9,100,750 9,835,121 10,635,896
Vote 9 - Water 1,867,263 2,386,128 2,585,215 3,171,412 3,171,412 3,113,877 3,438,506 3,722,652 3,992,549
9.1 - Water 1,867,263 2,386,128 2,585,215 3,171,412 3,171,412 3,113,877 3,438,506 3,722,652 3,992,549
Vote 10 - Formal Housing 356,031 105,164 89,284 145,910 152,210 152,150 371,100 311,390 227,433
10.1 - Formal Housing 356,031 105,164 89,284 145,910 152,210 152,150 371,100 311,390 227,433 Vote 11 - Markets 34,241 37,509 40,296 51,862 51,848 46,947 56,483 58,911 63,928
11.1 - Markets 34,241 37,509 40,296 51,862 51,848 46,947 56,483 58,911 63,928
Vote 12 - Airport 4,844 5,589 5,860 6,403 6,403 6,250 6,884 7,120 7,972
12.1 - Airport 4,844 5,589 5,860 6,403 6,403 6,250 6,884 7,120 7,972
Vote 13 - ICC 157,831 131,520 174,369 185,273 185,273 137,157 142,636 152,105 162,138
- ICC 157,831 131,520 174,369 185,273 185,273 137,157 142,636 152,105 162,138
Vote 14 - USHAKA MARINE 167,319 183,439 193,616 212,130 203,306 203,306 216,030 232,415 245,040
- USHAKA MARINE 167,319 183,439 193,616 212,130 203,306 203,306 216,030 232,415 245,040 Total Expenditure by Vote 17,166,908 17,326,863 20,714,382 23,751,277 23,962,646 23,088,482 24,976,074 26,833,705 28,531,354
Surplus/(Deficit) for the year 1,927,930 1,963,202 1,786,090 2,742,016 2,797,791 2,996,937 3,405,108 3,871,148 4,612,537
80

ETH eThekwini - Table A4 Consolidated Budgeted Financial Performance (revenue and expenditure)
Description 2009/10 2010/11 2011/12
R thousandAudited
Outcome
Audited
Outcome
Audited
Outcome
Original
Budget
Adjusted
Budget
Full Year
Forecast
Budget Year
2013/14
Budget Year
+1 2014/15
Budget Year
+2 2015/16
Revenue By Source
Property rates 4,086,153 4,070,801 4,353,757 4,711,969 4,711,969 4,625,172 5,007,906 5,352,702 5,719,985
Property rates - penalties & collection charges 150,210 81,854 111,867 132,134 132,134 132,134 129,085 129,085 129,085
Service charges - electricity revenue 5,777,841 7,022,871 8,376,497 9,581,538 9,581,538 9,479,766 10,012,505 10,921,640 11,858,171
Service charges - water revenue 1,562,168 1,833,505 1,894,285 2,622,062 2,622,062 2,339,396 2,824,247 3,049,451 3,254,767
Service charges - sanitation revenue 68,187 559,237 635,928 671,356 671,356 665,583 731,182 797,816 866,353
Service charges - refuse revenue 343,263 374,399 405,204 425,382 425,382 428,034 461,142 487,262 517,671
Service charges - other 90,038 101,161 82,693 213,153 213,848 174,646 186,924 198,264 210,915
Rental of facilities and equipment 435,830 433,768 494,955 349,152 349,173 397,550 393,693 413,397 423,816
Interest earned - external investments 201,693 134,414 231,693 239,754 244,707 330,529 374,237 469,488 540,070
Interest earned - outstanding debtors 101,914 85,955 92,526 94,145 95,655 101,171 103,859 108,403 113,176
Fines 80,143 129,284 129,165 104,400 104,400 103,295 108,163 114,352 120,968
Licences and permits 17,732 20,263 28,369 21,361 21,361 23,311 24,406 25,288 26,214
Agency services 10,377 9,377 11,718 8,385 8,385 11,409 12,058 12,744 13,470
Transfers recognised - operational 1,483,128 1,631,911 1,858,822 2,126,964 2,266,351 2,140,176 2,359,637 2,447,577 2,542,976
Other revenue 2,335,349 1,771,811 2,176,810 2,328,441 2,393,150 2,281,140 2,434,475 2,561,788 2,687,680
Gains on disposal of PPE 78,944 48,319 65,265 32,021 32,021 42,801 34,231 34,281 34,282
Total Revenue (excluding capital transfers and
contributions)
16,822,969 18,308,930 20,949,553 23,662,218 23,873,492 23,276,112 25,197,750 27,123,541 29,059,599
Expenditure By Type
Employee related costs 4,633,319 4,913,878 6,576,031 6,104,168 6,140,726 5,827,673 6,681,852 7,252,891 7,670,289
Remuneration of councillors 73,969 77,919 84,752 83,766 83,821 72,007 104,516 110,792 117,282
Debt impairment 574,189 628,768 394,630 550,000 614,000 500,941 536,625 578,446 593,203
Depreciation & asset impairment 1,236,808 1,466,639 1,523,993 1,849,181 1,849,292 1,789,637 1,842,045 1,907,251 1,984,435
Finance charges 484,290 692,817 860,878 1,247,576 1,232,749 1,074,415 1,168,516 1,190,426 1,158,521
Bulk purchases 4,531,944 5,495,517 6,666,970 7,839,667 7,839,667 7,696,470 8,045,483 8,738,481 9,491,963
Other materials 62,718 42,074 43,965 19,207 19,207 7,615 6,480 2,335 2,401
Contracted services 830,311 2,107,650 2,873,358 3,076,758 3,085,421 3,128,309 3,409,928 3,579,823 3,738,132
Transfers and grants 139,488 132,121 126,094 174,319 183,945 174,266 203,713 202,213 209,443
Other expenditure 4,543,821 1,768,604 1,556,637 2,805,537 2,912,620 2,814,441 2,975,494 3,268,769 3,563,525
Loss on disposal of PPE 56,050 877 7,075 1,100 1,198 2,706 1,423 2,278 2,159
Total Expenditure 17,166,908 17,326,863 20,714,382 23,751,279 23,962,645 23,088,482 24,976,074 26,833,705 28,531,354
Surplus/(Deficit) (343,939) 982,066 235,171 (89,061) (89,153) 187,631 221,676 289,836 528,245
Transfers recognised - capital 2,271,869 981,135 1,550,919 2,831,077 2,886,944 2,809,306 3,183,431 3,581,313 4,084,292
Surplus/(Deficit) after capital transfers &
contributions
1,927,930 1,963,202 1,786,090 2,742,016 2,797,791 2,996,937 3,405,108 3,871,148 4,612,537
Taxation
Surplus/(Deficit) after taxation 1,927,930 1,963,202 1,786,090 2,742,016 2,797,791 2,996,937 3,405,108 3,871,148 4,612,537 Attributable to minorities
Surplus/(Deficit) attributable to municipality
1,927,930 1,963,202 1,786,090 2,742,016 2,797,791 2,996,937 3,405,108 3,871,148 4,612,537
Share of surplus/ (deficit) of associate
Surplus/(Deficit) for the year 1,927,930 1,963,202 1,786,090 2,742,016 2,797,791 2,996,937 3,405,108 3,871,148 4,612,537
Current Year 2012/132013/14 Medium Term Revenue &
Expenditure Framework
81

ETH eThekwini - Table A5 Consolidated Budgeted Capital Expenditure by vote, standard classification and funding
Vote Description 2009/10 2010/11 2011/12
R thousandAudited
Outcome
Audited
Outcome
Audited
Outcome
Original
Budget
Adjusted
Budget
Full Year
Forecast
Budget Year
2013/14
Budget Year
+1 2014/15
Budget Year
+2 2015/16
Capital expenditure - Vote
Multi-year expenditure to be appropriated
Vote 1 - Office of the City Manager 21,600 69,492 73,863 7,200 6,902 6,902 67,635 72,468 101,468
Vote 2 - Finance 87,380 72,834 249,496 5,000 101,747 101,747 71,680 97,450 61,785
Vote 3 - Governance 13,620 1,274 12,051 16,400 13,914 13,914 9,900 23,680 14,310
Vote 4 - Corporate and Human Resources 6,933 2,889 2,333 – – – 9,090 2,250 810
Vote 5 - Economic Development and Planning 1,322,185 164,287 84,221 180,148 209,685 209,685 227,097 271,860 326,550
Vote 6 - Community and Emergency Services 119,212 69,159 65,364 156,083 131,736 131,736 211,954 349,760 331,818
Vote 7 - Human Settlements and Infrastructure 1,893,644 1,278,863 1,346,351 3,443,220 3,123,387 3,123,387 3,185,480 3,157,455 3,469,764
Vote 8 - Electricity 683,238 585,308 567,382 539,850 674,106 674,106 542,826 621,598 641,103
Vote 9 - Water 1,695,864 1,083,991 290,601 688,589 627,960 627,960 699,430 800,900 761,100
Vote 10 - Formal Housing – – 213,809 – – – – – –
Vote 11 - Markets 2,686 2,560 1,927 9,438 9,438 9,438 2,250 2,430 16,200
Vote 12 - Airport – 102 52 – – – – – –
Vote 13 - ICC – – – – – – – – –
Vote 14 - USHAKA MARINE – – – – – – – – –
Capital multi-year expenditure sub-total 5,846,362 3,330,759 2,907,450 5,045,928 4,898,875 4,898,875 5,027,342 5,399,851 5,724,908
Single-year expenditure to be appropriated
Vote 1 - Office of the City Manager 185,825 44,405 191,756 95,702 97,567 97,567 31,842 23,625 6,300
Vote 2 - Finance 156,073 152,308 75,880 67,800 97,944 97,944 38,900 47,300 54,147
Vote 3 - Governance 3,263 33,333 5,299 – 2,486 2,486 1,800 – –
Vote 4 - Corporate and Human Resources 1,564 1,419 52,742 – 1,986 1,986 1,080 – –
Vote 5 - Economic Development and Planning 17,606 1,734 40,322 – 1,000 1,000 – – –
Vote 6 - Community and Emergency Services 54,220 10,268 4,914 11,083 37,057 37,057 2,700 10,224 23,004
Vote 7 - Human Settlements and Infrastructure 213,526 195,876 201,845 – 12,229 12,229 256,700 224,370 574,500
Vote 8 - Electricity – – – 62,250 133,621 133,621 25,972 20,754 12,671
Vote 9 - Water 11,863 781 2,374 2,500 2,500 2,500 45,000 40,500 45,000
Vote 10 - Formal Housing 13 37 41 – – – – – –
Vote 11 - Markets 3,302 571 587 – – – 810 450 1,350
Vote 12 - Airport 52 105 52 – – – – – –
Vote 13 - ICC 6,099 2,213 23,805 15,000 15,000 31,000 20,000 20,000 20,000
Vote 14 - USHAKA MARINE – 11,531 8,404 8,452 16,218 16,218 14,621 8,000 8,000
Capital single-year expenditure sub-total 653,406 454,581 608,021 262,787 417,608 433,608 439,425 395,223 744,972
Total Capital Expenditure - Vote 6,499,768 3,785,340 3,515,471 5,308,715 5,316,483 5,332,483 5,466,767 5,795,074 6,469,880
Capital Expenditure - Standard
Governance and administration 473,490 251,102 488,066 84,200 212,399 212,399 134,250 170,680 131,052
Executive and council 33,508 20,739 85,352 16,400 18,886 18,886 13,500 23,680 14,310
Budget and treasury office 45,995 230,363 323,777 67,800 191,532 191,532 110,580 144,750 115,932
Corporate services 393,987 78,937 – 1,981 1,981 10,170 2,250 810
Community and public safety 318,984 179,148 285,689 1,339,175 1,314,982 1,314,980 972,037 1,039,797 1,666,240
Community and social services 54,425 – 127,283 94,783 94,783 80,536 202,363 208,202
Sport and recreation 117,620 45,584 30,388 12,300 12,300 12,300 24,612 45,826 52,798
Public safety 63,733 33,144 25,998 15,583 50,210 50,210 47,321 59,021 67,940
Housing 130,102 41,931 213,850 1,167,509 1,139,989 1,139,987 789,306 707,587 1,327,400
Health 7,529 4,063 15,453 16,500 17,700 17,700 30,262 25,000 9,900
Economic and environmental services 2,734,122 1,199,212 1,073,388 1,785,953 1,617,767 1,617,767 2,155,201 2,283,040 2,396,741
Planning and development 1,326,573 160,452 59,107 333,100 354,713 354,713 323,127 360,330 424,200
Road transport 1,394,580 1,038,760 1,014,281 1,450,153 1,260,354 1,260,354 1,797,874 1,887,853 1,948,691
Environmental protection 12,969 – 2,700 2,700 2,700 34,200 34,857 23,850
Trading services 2,954,257 2,127,076 1,636,119 2,065,497 2,129,679 2,129,679 2,166,428 2,270,137 2,228,047
Electricity 683,238 585,308 567,382 539,850 674,106 674,106 568,798 642,352 653,774
Water 1,709,152 1,099,205 483,294 691,089 630,508 630,508 744,430 841,400 806,100
Waste water management 448,043 350,972 426,008 654,758 656,258 656,258 770,400 700,750 677,400
Waste management 113,824 91,590 159,435 179,800 168,807 168,807 82,800 85,635 90,773
Other 18,916 28,803 32,209 33,890 41,654 57,656 38,851 31,420 47,800
Total Capital Expenditure - Standard 6,499,769 3,785,340 3,515,471 5,308,715 5,316,481 5,332,481 5,466,767 5,795,074 6,469,880
Funded by:
National Government 1,357,163 981,135 1,550,919 1,854,077 1,834,857 1,851,577 2,404,086 2,872,101 2,997,479
Provincial Government 630,878 977,000 981,864 950,782 761,883 703,936 1,068,824
District Municipality
Other transfers and grants 283,828 70,223 6,948 17,463 5,276 17,989
Transfers recognised - capital 2,271,869 981,135 1,550,919 2,831,077 2,886,944 2,809,307 3,183,432 3,581,313 4,084,292
Public contributions & donations 55,000 55,000 55,000
Borrowing 1,000,000 2,000,000 1,000,000 1,500,000 750,000 750,000 1,000,000 1,000,000 1,000,000
Internally generated funds 3,227,900 804,205 964,552 922,638 1,624,537 1,718,174 1,283,335 1,213,761 1,385,588
Total Capital Funding 6,499,769 3,785,340 3,515,471 5,308,715 5,316,481 5,332,481 5,466,767 5,795,074 6,469,880
Current Year 2012/132013/14 Medium Term Revenue &
Expenditure Framework
82
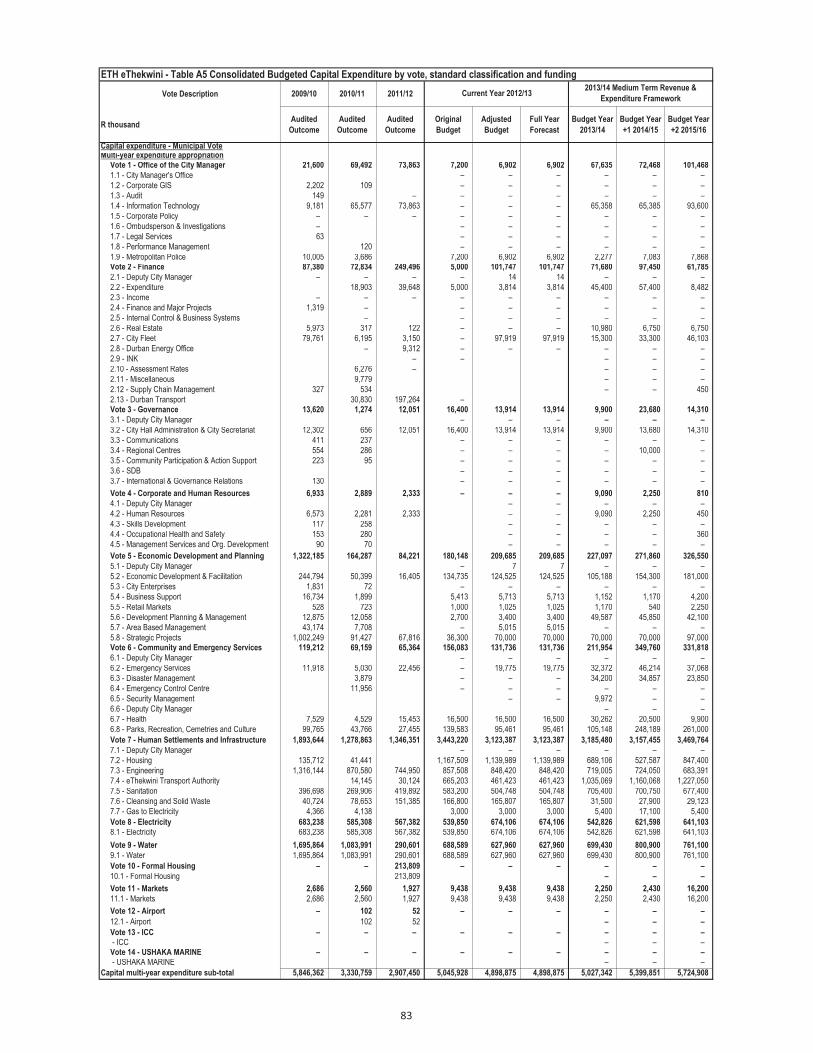
ETH eThekwini - Table A5 Consolidated Budgeted Capital Expenditure by vote, standard classification and funding
Vote Description 2009/10 2010/11 2011/12
R thousandAudited
Outcome
Audited
Outcome
Audited
Outcome
Original
Budget
Adjusted
Budget
Full Year
Forecast
Budget Year
2013/14
Budget Year
+1 2014/15
Budget Year
+2 2015/16
Capital expenditure - Municipal VoteMulti-year expenditure appropriation
Vote 1 - Office of the City Manager 21,600 69,492 73,863 7,200 6,902 6,902 67,635 72,468 101,468
1.1 - City Manager's Office – – – – – –
1.2 - Corporate GIS 2,202 109 – – – – – –
1.3 - Audit 149 – – – – – – –
1.4 - Information Technology 9,181 65,577 73,863 – – – 65,358 65,385 93,600
1.5 - Corporate Policy – – – – – – – – –
1.6 - Ombudsperson & Investigations – – – – – – –
1.7 - Legal Services 63 – – – – – –
1.8 - Performance Management 120 – – – – – –
1.9 - Metropolitan Police 10,005 3,686 7,200 6,902 6,902 2,277 7,083 7,868 Vote 2 - Finance 87,380 72,834 249,496 5,000 101,747 101,747 71,680 97,450 61,785
2.1 - Deputy City Manager – – – – 14 14 – – –
2.2 - Expenditure 18,903 39,648 5,000 3,814 3,814 45,400 57,400 8,482
2.3 - Income – – – – – – – – –
2.4 - Finance and Major Projects 1,319 – – – – – – –
2.5 - Internal Control & Business Systems – – – – – – –
2.6 - Real Estate 5,973 317 122 – – – 10,980 6,750 6,750
2.7 - City Fleet 79,761 6,195 3,150 – 97,919 97,919 15,300 33,300 46,103
2.8 - Durban Energy Office – 9,312 – – – – – –
2.9 - INK – – – – –
2.10 - Assessment Rates 6,276 – – – –
2.11 - Miscellaneous 9,779 – – –
2.12 - Supply Chain Management 327 534 – – 450
2.13 - Durban Transport 30,830 197,264 – Vote 3 - Governance 13,620 1,274 12,051 16,400 13,914 13,914 9,900 23,680 14,310
3.1 - Deputy City Manager – – – – – –
3.2 - City Hall Administration & City Secretariat 12,302 656 12,051 16,400 13,914 13,914 9,900 13,680 14,310
3.3 - Communications 411 237 – – – – – –
3.4 - Regional Centres 554 286 – – – – 10,000 –
3.5 - Community Participation & Action Support 223 95 – – – – – –
3.6 - SDB – – – – – –
3.7 - International & Governance Relations 130 – – – – – –
Vote 4 - Corporate and Human Resources 6,933 2,889 2,333 – – – 9,090 2,250 810
4.1 - Deputy City Manager – – – – –
4.2 - Human Resources 6,573 2,281 2,333 – – 9,090 2,250 450
4.3 - Skills Development 117 258 – – – – –
4.4 - Occupational Health and Safety 153 280 – – – – 360
4.5 - Management Services and Org. Development 90 70 – – – – –
Vote 5 - Economic Development and Planning 1,322,185 164,287 84,221 180,148 209,685 209,685 227,097 271,860 326,550
5.1 - Deputy City Manager – 7 7 – – –
5.2 - Economic Development & Facilitation 244,794 50,399 16,405 134,735 124,525 124,525 105,188 154,300 181,000
5.3 - City Enterprises 1,831 72 – – – – – –
5.4 - Business Support 16,734 1,899 5,413 5,713 5,713 1,152 1,170 4,200
5.5 - Retail Markets 528 723 1,000 1,025 1,025 1,170 540 2,250
5.6 - Development Planning & Management 12,875 12,058 2,700 3,400 3,400 49,587 45,850 42,100
5.7 - Area Based Management 43,174 7,708 – 5,015 5,015 – – –
5.8 - Strategic Projects 1,002,249 91,427 67,816 36,300 70,000 70,000 70,000 70,000 97,000 Vote 6 - Community and Emergency Services 119,212 69,159 65,364 156,083 131,736 131,736 211,954 349,760 331,818
6.1 - Deputy City Manager – – – – – –
6.2 - Emergency Services 11,918 5,030 22,456 – 19,775 19,775 32,372 46,214 37,068
6.3 - Disaster Management 3,879 – – – 34,200 34,857 23,850
6.4 - Emergency Control Centre 11,956 – – – – – –
6.5 - Security Management – – 9,972 – –
6.6 - Deputy City Manager – – –
6.7 - Health 7,529 4,529 15,453 16,500 16,500 16,500 30,262 20,500 9,900
6.8 - Parks, Recreation, Cemetries and Culture 99,765 43,766 27,455 139,583 95,461 95,461 105,148 248,189 261,000
Vote 7 - Human Settlements and Infrastructure 1,893,644 1,278,863 1,346,351 3,443,220 3,123,387 3,123,387 3,185,480 3,157,455 3,469,764
7.1 - Deputy City Manager – – – – – –
7.2 - Housing 135,712 41,441 1,167,509 1,139,989 1,139,989 689,106 527,587 847,400
7.3 - Engineering 1,316,144 870,580 744,950 857,508 848,420 848,420 719,005 724,050 683,391
7.4 - eThekwini Transport Authority 14,145 30,124 665,203 461,423 461,423 1,035,069 1,160,068 1,227,050
7.5 - Sanitation 396,698 269,906 419,892 583,200 504,748 504,748 705,400 700,750 677,400
7.6 - Cleansing and Solid Waste 40,724 78,653 151,385 166,800 165,807 165,807 31,500 27,900 29,123
7.7 - Gas to Electricity 4,366 4,138 3,000 3,000 3,000 5,400 17,100 5,400
Vote 8 - Electricity 683,238 585,308 567,382 539,850 674,106 674,106 542,826 621,598 641,103 8.1 - Electricity 683,238 585,308 567,382 539,850 674,106 674,106 542,826 621,598 641,103
Vote 9 - Water 1,695,864 1,083,991 290,601 688,589 627,960 627,960 699,430 800,900 761,100
9.1 - Water 1,695,864 1,083,991 290,601 688,589 627,960 627,960 699,430 800,900 761,100
Vote 10 - Formal Housing – – 213,809 – – – – – –
10.1 - Formal Housing 213,809 – – –
Vote 11 - Markets 2,686 2,560 1,927 9,438 9,438 9,438 2,250 2,430 16,200
11.1 - Markets 2,686 2,560 1,927 9,438 9,438 9,438 2,250 2,430 16,200
Vote 12 - Airport – 102 52 – – – – – –
12.1 - Airport 102 52 – – –
Vote 13 - ICC – – – – – – – – – - ICC – – – Vote 14 - USHAKA MARINE – – – – – – – – – - USHAKA MARINE – – –
Capital multi-year expenditure sub-total 5,846,362 3,330,759 2,907,450 5,045,928 4,898,875 4,898,875 5,027,342 5,399,851 5,724,908
Current Year 2012/132013/14 Medium Term Revenue &
Expenditure Framework
83

ETH eThekwini - Table A5 Consolidated Budgeted Capital Expenditure by vote, standard classification and funding
Vote Description 2009/10 2010/11 2011/12
R thousandAudited
Outcome
Audited
Outcome
Audited
Outcome
Original
Budget
Adjusted
Budget
Full Year
Forecast
Budget Year
2013/14
Budget Year
+1 2014/15
Budget Year
+2 2015/16
Current Year 2012/132013/14 Medium Term Revenue &
Expenditure Framework
Capital expenditure - Municipal Vote
Single-year expenditure appropriationVote 1 - Office of the City Manager 185,825 44,405 191,756 95,702 97,567 97,567 31,842 23,625 6,300 1.1 - City Manager's Office 350 350 1.2 - Corporate GIS 414 318 279 1.3 - Audit 218 10,972 1,378 310 310 1.4 - Information Technology 179,115 704 578 95,702 95,521 95,521 31,842 23,625 6,300 1.5 - Corporate Policy 188 68 8 120 120 1.6 - Ombudsperson & Investigations 29 69 26 100 100 1.7 - Legal Services 248 46 103 78 78 1.8 - Performance Management 170 30,752 187,823 90 90 1.9 - Metropolitan Police 5,443 1,476 1,561 998 998 Vote 2 - Finance 156,073 152,308 75,880 67,800 97,944 97,944 38,900 47,300 54,147 2.1 - Deputy City Manager 67 526 54 11 11 2.2 - Expenditure 22,900 3,781 3,781 2.3 - Income 36,212 535 718 61,911 61,911 2.4 - Finance and Major Projects 879 66,867 2,401 113 113 2.5 - Internal Control & Business Systems 492 53 1,516 1,516 2.6 - Real Estate 1,370 346 128 8,700 7,522 7,522 2.7 - City Fleet 116,260 83,933 72,313 36,200 23,062 23,062 38,900 47,300 54,147 2.8 - Durban Energy Office 511 48 266 28 28 2.9 - INK 282 2.10 - Assessment RatesVote 3 - Governance 3,263 33,333 5,299 – 2,486 2,486 1,800 – – 3.1 - Deputy City Manager3.2 - City Hall Administration & City Secretariat 545 545 1,800 3.3 - Communications 279 222 3,763 385 385 3.4 - Regional Centres 393 19,271 137 1,392 1,392 3.5 - Community Participation & Action Support 204 120 72 75 75 3.6 - SDB 221 13,162 39 39 3.7 - International & Governance Relations 2,166 558 1,327 50 50 Vote 4 - Corporate and Human Resources 1,564 1,419 52,742 – 1,986 1,986 1,080 – – 4.1 - Deputy City Manager 103 47 35 50 50 4.2 - Human Resources 1,158 123 505 1,338 1,338 4.3 - Skills Development 192 709 577 229 229 4.4 - Occupational Health and Safety 240 240 1,080 4.5 - Management Services and Org. Development 111 540 51,625 129 129 Vote 5 - Economic Development and Planning 17,606 1,734 40,322 – 1,000 1,000 – – – 5.1 - Deputy City Manager 16 68 120 5.2 - Economic Development & Facilitation 3,199 85 98 877 877 5.3 - City Enterprises 1,773 491 370 5.4 - Business Support 8,367 467 39,011 5.5 - Retail Markets 23 3 25 123 123 5.6 - Development Planning & Management 919 572 367 5.7 - Area Based Management 1,299 45 144 5.8 - Strategic Projects 2,010 3 187 Vote 6 - Community and Emergency Services 54,220 10,268 4,914 11,083 37,057 37,057 2,700 10,224 23,004 6.1 - Deputy City Manager 30 30 6.2 - Emergency Services 34,512 5,332 573 8,383 8,644 8,644 2,700 5,724 23,004 6.3 - Disaster Management 2,700 2,950 2,950 6.4 - Emergency Control Centre 920 600 814 6.5 - Security Management 933 618 594 12,611 12,611 6.6 - Deputy City Manager 418 178 201 6.7 - Health 2,812 948 2,409 1,200 1,200 4,500 6.8 - Parks, Recreation, Cemetries and Culture 14,625 2,592 323 11,622 11,622 Vote 7 - Human Settlements and Infrastructure 213,526 195,876 201,845 – 12,229 12,229 256,700 224,370 574,500 7.1 - Deputy City Manager 54 384 252 7.2 - Housing 411 139 616 790 790 200,000 180,000 480,000 7.3 - Engineering 11,321 48,189 96,163 1,175 1,175 10,800 3,735 38,250 7.4 - eThekwini Transport Authority 77,295 57,299 90,648 124 124 7.5 - Sanitation 51,345 81,066 6,116 4,800 4,800 7.6 - Cleansing and Solid Waste 73,100 8,799 8,050 5,340 5,340 45,900 40,635 56,250 7.7 - Gas to ElectricityVote 8 - Electricity – – – 62,250 133,621 133,621 25,972 20,754 12,671 8.1 - Electricity 62,250 133,621 133,621 25,972 20,754 12,671 Vote 9 - Water 11,863 781 2,374 2,500 2,500 2,500 45,000 40,500 45,000 9.1 - Water 11,863 781 2,374 2,500 2,500 2,500 45,000 40,500 45,000 Vote 10 - Formal Housing 13 37 41 – – – – – – 10.1 - Formal Housing 13 37 41 Vote 11 - Markets 3,302 571 587 – – – 810 450 1,350 11.1 - Markets 3,302 571 587 810 450 1,350 Vote 12 - Airport 52 105 52 – – – – – – 12.1 - Airport 52 105 52 Vote 13 - ICC 6,099 2,213 23,805 15,000 15,000 31,000 20,000 20,000 20,000 - ICC 6,099 2,213 23,805 15,000 15,000 31,000 20,000 20,000 20,000 Vote 14 - USHAKA MARINE – 11,531 8,404 8,452 16,218 16,218 14,621 8,000 8,000 - USHAKA MARINE 11,531 8,404 8,452 16,218 16,218 14,621 8,000 8,000
Capital single-year expenditure sub-total 653,406 454,581 608,021 262,787 417,608 433,608 439,425 395,223 744,972 Total Capital Expenditure 6,499,768 3,785,340 3,515,471 5,308,715 5,316,483 5,332,483 5,466,767 5,795,074 6,469,880
84

ETH eThekwini - Table A6 Consolidated Budgeted Financial Position
Description 2009/10 2010/11 2011/12
R thousandAudited
Outcome
Audited
Outcome
Audited
Outcome
Original
Budget
Adjusted
Budget
Full Year
Forecast
Budget Year
2013/14
Budget Year
+1 2014/15
Budget Year
+2 2015/16
ASSETS
Current assets
Cash 512,601 684,619 783,420 560,181 559,349 903,160 931,998 957,892 988,449
Call investment deposits 1,757,795 3,131,771 4,874,465 3,700,000 3,700,000 5,000,000 5,500,000 5,700,000 6,000,000
Consumer debtors 2,494,738 2,594,830 2,754,804 2,574,723 2,670,577 2,802,464 2,892,549 3,032,737 3,213,138
Other debtors 3,149,482 2,669,216 2,847,456 2,999,320 2,999,320 2,935,861 3,009,173 3,084,317 3,161,340
Current portion of long-term receivables 27,254 42,060 40,418 5,718 5,718 13,471 13,741 14,015 14,296
Inventory 229,164 216,592 240,744 221,862 221,862 252,353 264,732 277,729 291,355
Total current assets 8,171,034 9,339,088 11,541,307 10,061,804 10,156,826 11,907,309 12,612,193 13,066,690 13,668,578
Non current assets
Long-term receivables 281,971 283,474 286,277 278,400 278,400 299,518 300,820 306,776 312,852
Investments – –
Investment property 373,733 383,486 376,451 257,284 257,284 254,898 249,800 244,804 239,908
Investment in Associate
Property, plant and equipment 29,578,927 31,960,298 33,870,555 38,059,027 37,435,745 36,983,736 40,611,607 44,499,457 48,984,930
Agricultural
Biological
Intangible 326,489 635,677 631,713 399,128 399,128 695,571 764,939 803,092 843,153
Other non-current assets 137,089 7,515 5,977 112,366 112,366 88,402 97,242 106,966 117,662
Total non current assets 30,698,209 33,270,450 35,170,973 39,106,205 38,482,923 38,322,125 42,024,408 45,961,095 50,498,505
TOTAL ASSETS 38,869,243 42,609,538 46,712,280 49,168,009 48,639,749 50,229,434 54,636,601 59,027,785 64,167,083
LIABILITIES
Current liabilities
Bank overdraft 379,843 542,364 632,402 649,069 649,069 600,782 570,743 559,328 548,141
Borrowing 524,300 693,058 773,025 941,638 1,156,000 1,156,000 1,021,000 1,078,000 1,160,700
Consumer deposits 789,937 938,219 1,066,311 1,025,250 1,025,250 1,119,664 1,175,281 1,233,983 1,295,621
Trade and other payables 5,501,850 5,124,035 5,438,383 4,428,222 4,642,341 5,412,157 5,669,032 5,778,144 5,974,268
Provisions 172,402 192,572 312,675 171,362 171,362 288,218 282,454 276,805 271,268
Total current liabilities 7,368,332 7,490,248 8,222,796 7,215,541 7,644,022 8,576,821 8,718,510 8,926,260 9,249,998
Non current liabilities
Borrowing 8,150,386 9,516,893 10,013,000 10,127,511 9,486,225 9,486,225 9,464,425 9,386,425 9,225,725
Provisions 1,897,844 1,864,749 2,952,746 2,562,955 2,562,955 2,782,985 2,889,707 2,985,402 3,091,345
Total non current liabilities 10,048,230 11,381,642 12,965,746 12,690,466 12,049,180 12,269,210 12,354,132 12,371,827 12,317,070
TOTAL LIABILITIES 17,416,562 18,871,890 21,188,542 19,906,007 19,693,202 20,846,031 21,072,642 21,298,087 21,567,068
NET ASSETS 21,452,681 23,737,648 25,523,738 29,262,002 28,946,547 29,383,403 33,563,959 37,729,698 42,600,015
COMMUNITY WEALTH/EQUITY
Accumulated Surplus/(Deficit) 9,877,310 11,330,891 12,544,057 11,688,401 15,235,858 15,989,728 19,938,909 24,311,655 29,491,602
Reserves 11,575,371 12,406,757 12,979,681 17,573,601 13,710,689 13,393,675 13,625,050 13,418,043 13,108,413
Minorities' interests
TOTAL COMMUNITY WEALTH/EQUITY 21,452,681 23,737,648 25,523,738 29,262,002 28,946,547 29,383,403 33,563,959 37,729,698 42,600,015
Current Year 2012/132013/14 Medium Term Revenue &
Expenditure Framework
85

ETH eThekwini - Table A7 Consolidated Budgeted Cash Flows
Description 2009/10 2010/11 2011/12
R thousandAudited
Outcome
Audited
Outcome
Audited
Outcome
Original
Budget
Adjusted
Budget
Full Year
Forecast
Budget Year
2013/14
Budget Year
+1 2014/15
Budget Year
+2 2015/16
CASH FLOW FROM OPERATING ACTIVITIES
Receipts
Ratepayers and other 13,543,393 16,542,605 18,777,127 20,617,228 20,683,182 20,112,587 21,702,892 23,355,070 25,066,037
Government - operating 1,483,128 1,631,911 1,858,821 2,126,964 2,266,351 2,140,176 2,359,637 2,447,577 2,542,976
Government - capital 2,271,869 981,135 1,550,919 2,831,077 2,886,944 2,809,306 3,183,431 3,581,313 4,084,292
Interest 303,606 134,414 313,605 239,754 339,409 430,747 478,095 577,892 653,246
Dividends
Payments
Suppliers and employees (14,413,764) (14,819,022) (16,998,635) (19,453,074) (20,475,497) (19,221,644) (20,805,321) (23,205,539) (24,843,841)
Finance charges (484,290) (692,817) (855,068) (1,247,576) (868,063) (1,073,742) (1,168,515) (1,191,860) (1,160,028)
Transfers and Grants (149,977) (132,121) (141,694) (174,319) (183,945) (174,266) (203,713) (202,213) (209,443)
NET CASH FROM/(USED) OPERATING ACTIVITIES 2,553,965 3,646,105 4,505,075 4,940,053 4,648,381 5,023,164 5,546,506 5,362,240 6,133,239
CASH FLOWS FROM INVESTING ACTIVITIES
Receipts
Proceeds on disposal of PPE 103,521 81,732 72,685 32,021 32,021 42,801 34,231 34,281 34,282
Decrease (Increase) in non-current debtors 25,198 25,698 (10,452) 5,718 (32,000) 23,963 (5,840) (5,956) (6,076)
Decrease (increase) other non-current receivables 21,685 (49,172) 51,392 (21,118)
Decrease (increase) in non-current investments – (32,741) (31,593) (30,597) (32,465) (34,439)
Payments
Capital assets (6,562,397) (3,799,622) (3,515,166) (5,308,715) (5,316,481) (5,332,481) (4,923,552) (5,218,366) (5,825,692)
NET CASH FROM/(USED) INVESTING ACTIVITIES (6,411,993) (3,692,192) (3,452,933) (5,320,148) (5,297,809) (5,318,428) (4,925,758) (5,222,506) (5,831,925)
CASH FLOWS FROM FINANCING ACTIVITIES
Receipts
Short term loans
Borrowing long term/refinancing 2,900,000 2,006,824 1,007,524 1,500,000 750,000 750,000 1,000,000 1,000,000 1,000,000
Increase (decrease) in consumer deposits 150,330 123,241 30,790 30,790 94,414 55,907 58,702 61,638
Payments
Repayment of borrowing (290,581) (564,198) (431,450) (826,314) (826,314) (787,786) (1,157,779) (1,021,977) (1,079,038)
NET CASH FROM/(USED) FINANCING ACTIVITIES 2,609,419 1,592,956 699,315 704,476 (45,524) 56,628 (101,872) 36,725 (17,400)
NET INCREASE/ (DECREASE) IN CASH HELD (1,248,609) 1,546,869 1,751,457 324,381 (694,952) (238,636) 518,876 176,459 283,914
Cash/cash equivalents at the year begin: 2,975,766 1,727,157 3,274,026 3,726,917 3,726,917 5,025,483 4,786,847 5,305,724 5,482,183
Cash/cash equivalents at the year end: 1,727,157 3,274,026 5,025,483 4,051,298 3,031,965 4,786,847 5,305,724 5,482,183 5,766,097
Current Year 2012/132013/14 Medium Term Revenue &
Expenditure Framework
86

ETH eThekwini - Table A8 Consolidated Cash backed reserves/accumulated surplus reconciliation
Description 2009/10 2010/11 2011/12
R thousandAudited
Outcome
Audited
Outcome
Audited
Outcome
Original
Budget
Adjusted
Budget
Full Year
Forecast
Budget Year
2013/14
Budget Year
+1 2014/15
Budget Year
+2 2015/16
Cash and investments available
Cash/cash equivalents at the year end 1,727,157 3,274,026 5,025,483 4,051,298 3,031,965 4,786,847 5,305,724 5,482,183 5,766,097
Other current investments > 90 days 163,396 0 (0) (440,186) 578,315 515,531 555,531 616,381 674,211
Non current assets - Investments – – – – – – – – –
Cash and investments available: 1,890,553 3,274,026 5,025,483 3,611,112 3,610,280 5,302,378 5,861,255 6,098,564 6,440,308
Application of cash and investments
Unspent conditional transfers 672,725 767,738 599,421 – – 482,500 300,000 250,000 200,000
Unspent borrowing – – – – – – – – –
Statutory requirements
Other working capital requirements (500,554) (1,207,474) (1,044,359) (1,246,351) (1,125,466) (919,158) (632,539) (678,533) (687,189)
Other provisions
Long term investments committed – – – – – – – – –
Reserves to be backed by cash/investments 1,833,979 2,425,615 2,918,735 1,531,280 2,985,341 3,292,906 3,641,810 4,037,830 4,585,683
Total Application of cash and investments: 2,006,150 1,985,879 2,473,797 284,929 1,859,875 2,856,248 3,309,271 3,609,297 4,098,494
Surplus(shortfall) (115,597) 1,288,147 2,551,686 3,326,183 1,750,405 2,446,130 2,551,984 2,489,267 2,341,814
Current Year 2012/132013/14 Medium Term Revenue &
Expenditure Framework
87

ETH eThekwini - Table A9 Consolidated Asset Management
Description 2009/10 2010/11 2011/12
R thousandAudited
Outcome
Audited
Outcome
Audited
Outcome
Original
Budget
Adjusted
Budget
Full Year
Forecast
Budget Year
2013/14
Budget Year
+1 2014/15
Budget Year
+2 2015/16
CAPITAL EXPENDITURE
Total New Assets 5,109,202 404,098 2,349,384 3,438,479 3,438,479 3,438,479 3,637,194 3,830,564 4,408,308
Infrastructure - Road transport 957,683 – 288,059 343,180 113,930 113,930 262,320 341,215 275,012
Infrastructure - Electricity 572,443 – 349,281 249,700 383,956 383,956 183,516 227,196 253,455
Infrastructure - Water 1,666,421 – 13,000 583,689 521,479 521,479 602,150 547,450 579,150
Infrastructure - Sanitation 398,641 – 352,095 360,200 360,200 360,200 542,050 516,050 474,300
Infrastructure - Other 164,443 – 383,135 814,354 865,647 865,647 1,125,519 1,259,738 1,501,950
Infrastructure 3,759,631 – 1,385,570 2,351,123 2,245,212 2,245,212 2,715,555 2,891,649 3,083,867
Community 558,590 – 18,565 108,300 100,547 100,547 127,989 200,307 194,600
Heritage assets – – – 5,000 5,610 5,610 3,500 – –
Investment properties 15,514 141,409 5,000 – – – – – –
Other assets 709,156 262,689 888,174 961,206 1,021,000 1,021,000 790,150 738,608 1,129,841
Intangibles 66,311 – 52,075 12,850 66,110 66,110 – – –
Total Renewal of Existing Assets 1,390,567 3,381,242 1,166,087 1,870,236 1,878,002 1,894,002 1,829,573 1,964,510 2,061,572
Infrastructure - Road transport 1,052 1,088,270 25,527 940,031 940,031 940,031 526,234 497,028 593,229
Infrastructure - Electricity – 481,054 210,950 210,950 210,950 210,950 271,900 332,356 320,857
Infrastructure - Water – 1,386,987 64,400 64,400 64,400 64,400 97,280 253,450 181,950
Infrastructure - Sanitation – 13,335 206,000 206,000 206,000 206,000 228,350 184,700 198,600
Infrastructure - Other 440 68,746 200,053 200,053 200,053 200,053 186,350 118,130 208,123
Infrastructure 1,492 3,038,392 706,930 1,621,434 1,621,434 1,621,434 1,310,114 1,385,664 1,502,759
Community 605 56,661 55,016 76,783 76,783 76,783 91,671 175,536 159,585
Heritage assets – – 15,900 15,900 15,900 15,900 11,250 12,600 12,960
Investment properties – – – – – – – – –
Other assets 1,388,470 177,552 382,741 150,619 158,385 174,385 411,606 386,930 381,768
Intangibles – 108,637 5,500 5,500 5,500 5,500 4,932 3,780 4,500
Total Capital Expenditure
Infrastructure - Road transport 958,735 1,088,270 313,586 1,283,211 1,053,961 1,053,961 788,554 838,243 868,241
Infrastructure - Electricity 572,443 481,054 560,231 460,650 594,906 594,906 455,416 559,552 574,312
Infrastructure - Water 1,666,421 1,386,987 77,400 648,089 585,879 585,879 699,430 800,900 761,100
Infrastructure - Sanitation 398,641 13,335 558,095 566,200 566,200 566,200 770,400 700,750 672,900
Infrastructure - Other 164,883 68,746 583,188 1,014,407 1,065,700 1,065,700 1,311,869 1,377,868 1,710,073
Infrastructure 3,761,123 3,038,392 2,092,500 3,972,557 3,866,646 3,866,646 4,025,669 4,277,313 4,586,626
Community 559,195 56,661 73,581 185,083 177,330 177,330 219,660 375,843 354,185
Heritage assets – – 15,900 20,900 21,510 21,510 14,750 12,600 12,960
Investment properties 15,514 141,409 5,000 – – – – – –
Other assets 2,097,626 440,241 1,270,915 1,111,825 1,179,385 1,195,385 1,201,756 1,125,538 1,511,609
Intangibles 66,311 108,637 57,575 18,350 71,610 71,610 4,932 3,780 4,500
TOTAL CAPITAL EXPENDITURE - Asset class 6,499,769 3,785,340 3,515,471 5,308,715 5,316,481 5,332,481 5,466,767 5,795,074 6,469,880
ASSET REGISTER SUMMARY - PPE (WDV)
Infrastructure - Road transport 5,268,754 7,099,108 7,412,694 10,027,833 10,027,833 10,027,833 10,816,387 11,654,630 12,522,871
Infrastructure - Electricity 3,315,436 3,665,620 4,225,851 5,536,098 5,536,098 5,536,098 5,991,514 6,551,066 7,125,378
Infrastructure - Water 5,291,166 6,368,101 6,445,501 7,972,545 7,972,545 7,972,545 8,671,975 9,472,875 10,233,975
Infrastructure - Sanitation 2,530,962 2,690,354 3,248,449 4,546,087 4,546,087 4,546,087 5,316,487 6,017,237 6,690,137
Infrastructure - Other 1,951,274 520,425 1,103,613 1,014,407 1,014,407 1,014,407 2,326,276 3,704,144 5,414,217
Infrastructure 18,357,592 20,343,608 22,436,108 29,096,970 29,096,970 29,096,970 33,122,639 37,399,952 41,986,578
Community 3,915,036 4,313,301 4,386,882 4,650,484 4,650,484 4,650,484 4,870,144 5,245,987 5,600,172
Heritage assets 17,881 9,992 30,892 410,620 410,620 410,620 425,370 437,970 450,930
Investment properties 373,733 383,486 376,451 257,284 257,284 254,898 249,800 244,804 239,908
Other assets 7,288,418 7,293,397 7,016,673 3,900,953 3,277,671 2,825,662 2,193,454 1,415,548 947,250
Intangibles 326,489 635,677 631,713 399,128 399,128 695,571 764,939 803,092 843,153
TOTAL ASSET REGISTER SUMMARY - PPE (WDV)30,279,149 32,979,461 34,878,719 38,715,439 38,092,157 37,934,205 41,626,346 45,547,353 50,067,991
EXPENDITURE OTHER ITEMS
Depreciation & asset impairment 1,236,808 1,466,639 1,523,993 1,849,181 1,849,292 1,789,637 1,842,045 1,907,251 1,984,435
Repairs and Maintenance by Asset Class 2,193,111 1,793,026 1,821,525 2,489,703 2,092,971 2,602,380 2,840,845 3,009,159 3,124,453
Infrastructure - Road transport 459,222 339,933 339,933 447,959 425,906 604,083 449,565 488,408 486,400
Infrastructure - Electricity 389,176 391,033 390,249 656,322 656,322 646,943 697,555 752,369 811,508
Infrastructure - Water 425,498 396,483 396,483 398,270 197,340 436,510 459,007 533,022 616,316
Infrastructure - Sanitation 245,779 232,193 232,193 253,307 119,417 257,929 267,655 284,256 301,913
Infrastructure - Other 5,357 5,417 5,417 5,086 5,231 4,984 7,533 8,313 8,782
Infrastructure 1,525,032 1,365,060 1,364,275 1,760,944 1,404,216 1,950,449 1,881,317 2,066,367 2,224,918
Community 383,954 139,507 139,507 238,120 131,783 130,832 137,477 148,240 157,383
Heritage assets – – – – – – – – –
Investment properties – – – – – – – – –
Other assets 284,126 288,459 317,743 490,639 556,972 521,099 822,051 794,552 742,152
TOTAL EXPENDITURE OTHER ITEMS 3,429,919 3,259,665 3,345,518 4,338,884 3,942,262 4,392,017 4,682,890 4,916,411 5,108,888
Renewal of Existing Assets as % of total capex21.4% 89.3% 33.2% 35.2% 35.3% 35.5% 33.5% 33.9% 31.9%
Renewal of Existing Assets as % of deprecn"112.4% 230.5% 76.5% 101.1% 101.6% 105.8% 99.3% 103.0% 103.9%
R&M as a % of PPE 7.4% 5.6% 5.4% 6.5% 5.6% 7.0% 7.0% 6.8% 6.4%
Renewal and R&M as a % of PPE 12.0% 16.0% 9.0% 11.0% 10.0% 12.0% 11.0% 11.0% 10.0%
Current Year 2012/132013/14 Medium Term Revenue &
Expenditure Framework
88

ETH eThekwini - Table A10 Consolidated basic service delivery measurement
2009/10 2010/11 2011/12
Outcome Outcome OutcomeOriginal
Budget
Adjusted
Budget
Full Year
Forecast
Budget Year
2013/14
Budget Year
+1 2014/15
Budget Year
+2 2015/16
Household service targets
Water:
Piped water inside dwelling 636,000 648,000 614,000 634,000 614,000 625,000 635,000 650,000 662,000
Piped water inside yard (but not in dwelling) 38,000 44,000 45,000 68,000 44,000 65,000 72,000 77,000 84,000
Using public tap (at least min.service level) 201,000 211,000 213,000 226,000 213,000 224,000 234,000 239,000 245,000
Other water supply (at least min.service level) 56,000
Minimum Service Level and Above sub-total 875,000 903,000 872,000 928,000 927,000 914,000 941,000 966,000 991,000
Using public tap (< min.service level)
Other water supply (< min.service level) 82,000 60,000 74,000 73,000 74,000 87,000 80,000 75,000 70,000
No water supply
Below Minimum Service Level sub-total 82,000 60,000 74,000 73,000 74,000 87,000 80,000 75,000 70,000
Total number of households 957,000 963,000 946,000 1,001,000 1,001,000 1,001,000 1,021,000 1,041,000 1,061,000
Sanitation/sewerage:
Flush toilet (connected to sewerage) 543,000 549,000 517,000 560,000 450,000 495,000 505,000 515,000 525,000
Flush toilet (with septic tank) 37,000 37,000 37,000 35,000 108,000 107,000 112,000 117,000 122,000
Chemical toilet 89,000 92,000 78,000 90,000 78,000
Pit toilet (ventilated) 40,000 40,000 35,000 38,000 35,000 125,000 120,000 115,000 112,000
Other toilet provisions (> min.service level) 26,000 35,000 44,000 59,000 47,000 62,000 82,000 80,000 78,000
Minimum Service Level and Above sub-total 735,000 753,000 711,000 782,000 718,000 789,000 819,000 827,000 837,000
Bucket toilet
Other toilet provisions (< min.service level) 221,000 210,000 235,000 219,000 283,000 212,000 202,000 214,000 224,000
No toilet provisions
Below Minimum Service Level sub-total 221,000 210,000 235,000 219,000 283,000 212,000 202,000 214,000 224,000
Total number of households 956,000 963,000 946,000 1,001,000 1,001,000 1,001,000 1,021,000 1,041,000 1,061,000
Energy:
Electricity (at least min.service level) 326,700 324,000 331,795 335,000 335,000 335,000 345,000 355,000 365,000
Electricity - prepaid (min.service level) 290,370 305,000 305,000 308,000 308,000 308,000 313,000 318,000 323,000
Minimum Service Level and Above sub-total 617,070 629,000 636,795 643,000 643,000 643,000 658,000 673,000 688,000
Electricity (< min.service level)
Electricity - prepaid (< min. service level)
Other energy sources 340,000 334,000 345,000 358,000 358,000 358,000 363,000 368,000 373,000
Below Minimum Service Level sub-total 340,000 334,000 345,000 358,000 358,000 358,000 363,000 368,000 373,000
Total number of households 957,070 963,000 981,795 1,001,000 1,001,000 1,001,000 1,021,000 1,041,000 1,061,000
Refuse:
Removed at least once a week 957,000 963,000 982,000 1,001,000 1,001,000 1,001,000 1,021,000 1,041,000 1,061,000
Minimum Service Level and Above sub-total 957,000 963,000 982,000 1,001,000 1,001,000 1,001,000 1,021,000 1,041,000 1,061,000
Below Minimum Service Level sub-total – – – – – – – – –
Total number of households 957,000 963,000 982,000 1,001,000 1,001,000 1,001,000 1,021,000 1,041,000 1,061,000
Households receiving Free Basic Service
Water (6 kilolitres per household per month) 359,000 336,000 347,021 516,000 518,000 580,000 349,021 350,021 351,021
Sanitation (free minimum level service) 359,000 248,000 16,147 607,000 494,000 484,000 193,817 210,017 226,217
Electricity/other energy (50kwh per household per month) 61,000 64,185 64,500 65,100 65,000 65,000 84,866 85,716 85,579
Refuse (removed at least once a week) 530,000 687,000 687,000 696,000 696,000 696,000 763,153 766,153 769,153
Cost of Free Basic Services provided (R'000)
Water (6 kilolitres per household per month) 659,542 772,428 802,500 353,000 522,000 522,400 582,000 616,900 654,000
Sanitation (free sanitation service) 179,495 270,000 183,200 229,000 250,000 249,600 178,400 190,000 202,400
Electricity/other energy (50kwh per household per month) 31,626 38,741 44,552 64,643 64,643 69,130 75,471 82,400 88,580
Refuse (removed once a week) 258,141 258,141 274,900 294,165 294,165 294,000 352,800 375,800 400,200
Total cost of FBS provided (minimum social package) 1,128,804 1,339,310 1,305,152 940,808 1,130,808 1,135,130 1,188,671 1,265,100 1,345,180
Highest level of free service provided
Property rates (R value threshold) 120,000 120,000 120,000 353,000 120,000 120,000 120,000 120,000 120,000
Water (kilolitres per household per month) 9 9 9 229,000 9 9 9 9 9
Sanitation (kilolitres per household per month) 9 9 9 64,643 9 9 9 9 9
Sanitation (Rand per household per month) – – – – – – – – –
Electricity (kwh per household per month)
Refuse (average litres per week) – – – – – – – – –
Revenue cost of free services provided (R'000)
Property rates (R15 000 threshold rebate) 456,837 466,744 507,152 560,382 560,382 560,382 713,629 762,686 815,330
Property rates (other exemptions, reductions and
rebates) 530,098 602,229 698,546 685,452 697,452 691,452 872,213 932,173 996,515
Water 659,542 772,428 873,921 353,000 522,000 522,000 582,042 616,965 653,983
Sanitation 179,495 270,000 235,000 229,000 250,000 250,000 178,446 190,045 202,398
Electricity/other energy 31,047 38,741 52,630 63,431 63,431 63,431 75,493 81,147 88,106
Refuse 258,141 258,141 274,920 294,165 294,165 294,165 352,833 375,767 400,192
Total revenue cost of free services provided
(total social package) 2,115,160 2,408,283 2,642,169 2,185,430 2,387,430 2,381,430 2,774,656 2,958,783 3,156,524
Description
Current Year 2012/132013/14 Medium Term Revenue &
Expenditure Framework
89

�
�
�
�
�
�
�
������������ ��
�������
�
�
�
�
�
�

ETH eThekwini - Supporting Table SA1 Supportinging detail to 'Budgeted Financial Performance'
2009/10 2010/11 2011/12
Audited
Outcome
Audited
Outcome
Audited
Outcome
Original
Budget
Adjusted
Budget
Full Year
Forecast
Budget Year
2013/14
Budget Year
+1 2014/15
Budget Year
+2 2015/16
R thousand
REVENUE ITEMS:
Property rates
Total Property Rates 5,073,088 5,139,774 5,600,619 5,969,780 5,969,780 5,882,984 6,593,748 7,047,561 7,531,830
less Revenue Foregone 986,935 1,068,973 1,246,862 1,257,811 1,257,811 1,257,811 1,585,842 1,694,859 1,811,845
Net Property Rates 4,086,153 4,070,801 4,353,757 4,711,969 4,711,969 4,625,172 5,007,906 5,352,702 5,719,985
Service charges - electricity revenue
Total Service charges - electricity revenue 5,777,841 7,022,871 8,376,497 9,640,329 9,640,329 9,547,966 10,084,456 11,000,124 11,943,385
less Revenue Foregone 58,791 58,791 68,200 71,951 78,484 85,214
Net Service charges - electricity revenue 5,777,841 7,022,871 8,376,497 9,581,538 9,581,538 9,479,766 10,012,505 10,921,640 11,858,171
Service charges - water revenue
Total Service charges - water revenue 1,562,168 2,493,047 2,696,811 3,524,903 3,524,903 2,861,396 3,406,290 3,666,416 3,908,750
less Revenue Foregone 659,542 802,526 902,841 902,841 522,000 582,042 616,965 653,983
Net Service charges - water revenue 1,562,168 1,833,505 1,894,285 2,622,062 2,622,062 2,339,396 2,824,247 3,049,451 3,254,767
Service charges - sanitation revenue
Total Service charges - sanitation revenue 68,187 738,732 818,255 865,535 865,535 859,761 909,628 987,862 1,068,752
less Revenue Foregone 179,495 182,327 194,179 194,179 194,179 178,447 190,046 202,399
Net Service charges - sanitation revenue 68,187 559,237 635,928 671,356 671,356 665,583 731,182 797,816 866,353
Service charges - refuse revenue
Total refuse removal revenue 343,263 632,540 680,124 719,546 719,546 722,199 813,975 863,030 917,863
Total landfill revenue –
less Revenue Foregone 258,141 274,920 294,165 294,165 294,165 352,833 375,767 400,192
Net Service charges - refuse revenue 343,263 374,399 405,204 425,382 425,382 428,034 461,142 487,262 517,671
Other Revenue by source
Fuel levy 895,448 1,147,254 1,424,593 1,690,569 1,690,569 1,690,569 1,822,833 1,932,203 2,021,084
Regional Service Levies - Turnover
Public Contributions and Donations 31,978 9,876 1,759
Reversal of Loss on Impairment of Loans 198
Development Income 871,948
Fair Value Adjustment 34,858 13,561 263
Other revenue 500,919 601,120 750,195 637,872 702,581 590,571 611,642 629,585 666,596
Total 'Other' Revenue 2,335,349 1,771,811 2,176,810 2,328,441 2,393,150 2,281,140 2,434,475 2,561,788 2,687,680
EXPENDITURE ITEMS:
Employee related costs
Basic Salaries and Wages 3,339,862 3,560,919 3,832,722 4,619,758 4,588,370 4,428,912 5,125,976 5,526,066 5,874,863
Pension and UIF Contributions 990,961 597,029 1,896,333 757,792 759,794 722,077 844,153 913,146 945,627
Medical Aid Contributions 111,978 219,586 232,405 390,105 390,105 366,719 446,429 494,039 516,480
Overtime 204,151 337,280 342,807 295,876 341,260 363,518 320,322 354,935 378,669
Performance Bonus 8,368 8,368
Motor Vehicle Allowance 108,879 134,493 167,610 161,960 169,417 165,970 181,030 191,308 198,601
Cellphone Allowance 4,072 5,568 11,645 13,198 13,198 15,037 15,951 16,959 17,524
Housing Allowances 24,293 19,298 19,196 24,001 23,847 20,631 21,594 23,658 24,443
Other benefits and allowances 93,114 181,136 156,181 100,430 113,715 40,729 75,214 59,511 61,060
Payments in lieu of leave 11,471 6,689 9,943 11,342 11,345 11,344 13,051 13,899 14,733
Long service awards 885 855 849 1,005 750 751
sub-total 4,888,781 5,061,998 6,668,842 6,383,715 6,420,273 6,135,786 7,044,723 7,594,272 8,032,751
Less: Employees costs capitalised to PPE255,462 148,120 92,811 279,547 279,547 308,112 362,871 341,381 362,462
Total Employee related costs 4,633,319 4,913,878 6,576,031 6,104,168 6,140,726 5,827,673 6,681,852 7,252,891 7,670,289
Depreciation & asset impairment
Depreciation of Property, Plant & Equipment 1,236,808 1,466,639 1,523,993 1,849,181 1,849,292 1,789,637 1,842,045 1,907,251 1,984,435
Total Depreciation & asset impairment 1,236,808 1,466,639 1,523,993 1,849,181 1,849,292 1,789,637 1,842,045 1,907,251 1,984,435
Bulk purchases
Electricity Bulk Purchases 3,454,403 4,414,590 5,510,492 6,501,707 6,501,707 6,349,467 6,590,747 7,189,186 7,841,965
Water Bulk Purchases 1,077,541 1,080,927 1,156,478 1,337,959 1,337,959 1,347,004 1,454,737 1,549,295 1,649,999
Total bulk purchases 4,531,944 5,495,517 6,666,970 7,839,667 7,839,667 7,696,470 8,045,483 8,738,481 9,491,963
Transfers and grants
Cash transfers and grants 139,488 132,121 126,094 174,319 183,945 174,266 203,713 202,213 209,443
Non-cash transfers and grants – – – – – – – – –
Total transfers and grants 139,488 132,121 126,094 174,319 183,945 174,266 203,713 202,213 209,443
Description
Current Year 2012/132013/14 Medium Term Revenue &
Expenditure Framework
90

ETH eThekwini - Supporting Table SA1 Supportinging detail to 'Budgeted Financial Performance'
2009/10 2010/11 2011/12
Audited
Outcome
Audited
Outcome
Audited
Outcome
Original
Budget
Adjusted
Budget
Full Year
Forecast
Budget Year
2013/14
Budget Year
+1 2014/15
Budget Year
+2 2015/16
R thousand
Description
Current Year 2012/132013/14 Medium Term Revenue &
Expenditure Framework
Contracted services
Ablution Facilities 3,202 6,158 4,316
Cash Receipting Fees 27,376 29,384 30,017 34,236 30,068 38,513 39,154 39,144 40,464
Cleaning Services 24,161 24,160 26,710 33,255 33,255 32,880 36,286 37,957 40,049
Consultant Fees 129,199 95,155 271,552 251,710 255,206 236,505 197,916 201,541 216,354
Consulting Engineers – – 47 23 23 25 26 28
Contract Disconnections 10,733 10,733 16,800 16,800 16,631 17,598 18,654 19,773
Contractors - Computers 6,571 3,426 15,370 15,370 15,000 20,000 21,200 22,472
Contractors Charges 203,667 220,047 237,627 294,925 292,957 280,323 312,475 340,836 361,585
Contractors - Maintenance 1,229,694 1,821,525 1,814,533 1,795,637 1,896,406 2,125,600 2,211,409 2,274,615
Contracts 22,375 16,580 15,811 20,861 20,457 28,989 29,918 31,275 32,166
Durban Beach Monitoring 2,275 1,875 1,964 2,077 2,077 2,077 2,193 2,316 2,445
Easy Pay 259 280 249 307 307 270 283 297 312
Management Fees 10,917 14,789 15,155 19,446 19,446 19,321 20,441 21,575 22,861
Meter Readings 2,491 2,491 4,104 4,104 4,136 4,417 4,773 5,164
Property Management Fees 502 463 –
Public Conveniences 9,909 9,762 9,509 11,000 9,900 10,136 10,543 11,176 11,846
Public Transport 122,237 129,933 143,362 147,420 150,620 145,117 152,755 162,505 172,878
Security 225,568 273,487 264,644 338,042 357,154 364,756 399,315 431,969 470,333
Shark Meshing Fees 8,355 9,190 9,742 10,229 10,326 10,326 10,946 11,602 12,299
Super Vending 11,000 11,000 9,500 11,000 11,660 12,359
Forensic Investigation 5,000 4,000 5,000 5,000 5,000
Turnover Fees 416 14,789 391 430 430 430 447 474 502
Valuation Roll Maintenance 16,382 8,925 17,030 48,000 48,000 10,000 10,600 11,236 11,236
Valuations Appeals Board 605 1,566 2,065 2,000 2,000 2,000 2,000 2,120 2,247
Vehicle Tracking 3,110 4,764 6,005 969 969 969 1,017 1,078 1,143
sub-total 830,311 2,107,650 2,873,358 3,076,758 3,085,421 3,128,309 3,409,928 3,579,823 3,738,132
Allocations to organs of state:
Electricity
Water
Sanitation
Other
Total contracted services 830,311 2,107,650 2,873,358 3,076,758 3,085,421 3,128,309 3,409,928 3,579,823 3,738,132
Other Expenditure By Type
Collection costs
Contributions to 'other' provisions
Consultant fees
Audit fees 16,783 14,275 19,216 21,120 21,120 18,992 19,836 21,026 22,288
General expenses 924,073 851,122 497,094 1,540,508 1,473,977 1,411,030 1,594,712 1,730,624 1,860,105
Repairs and maintenance (to be deleted) 1,965,682
Development Expenditure 871,948
Loss on Impairment of Loan 46,488 –
Loss on Impairment of Investment in Municipal Entity 2,889 56,929 35,557
Loss on Write-off of Servitudes –
Fair Value Adjustment 65,848 – 6,006
Staduim Operating Costs 63,309 77,207 86,460 85,182 78,104 82,079 86,498
2010 World Cup Costs 1,806
AFCON,Soccerex and Football 69,473 55,252 14,206 18,900 19,800
Street Lighting 21,497 17,061 36,500 49,334 49,334 48,057 52,421 57,181 62,084
Electricity 158,736 203,671 217,363 291,450 292,669 271,531 296,458 324,272 351,419
Water 158,206 222,755 225,348 236,627 252,357 282,753 302,687 334,409 368,432
Fuel and Oil 112,885 136,219 139,933 160,876 160,196 174,225 185,385 202,101 221,573
Hire of Ext Plant and Vehicle 17,375 14,237 17,902 66,057 77,849 55,595 53,164 58,976 62,651
IRPTN Planning 2,944 51,667 105,022 97,022 96,082 51,366 90,248 141,147
Licensing Software 38,112 35,735 29,491 53,380 52,172 54,400 58,005 61,708 66,455
Bus Transport Operational Costs 59,425 84,038 85,138 74,865 79,708 84,605 89,804
Asset Management 23,556 32,684 24,674 32,532 27,067 27,307 22,142 23,417 24,766
Telephones 47,648 40,869 38,326 45,874 48,355 43,712 44,182 47,115 49,423
Printing and Stationery 20,122 19,786 20,308 25,313 26,029 24,705 27,129 28,382 27,476
Postage 19,663 20,860 21,792 24,817 24,812 24,164 25,401 26,889 28,157
Refuse Bags 32,312 36,149 37,022 68,590 68,590 66,589 70,587 76,838 81,448
Total 'Other' Expenditure 4,543,821 1,768,604 1,556,637 2,805,537 2,912,620 2,814,441 2,975,494 3,268,769 3,563,525
by Expenditure Item
Employee related costs 83,367 100,456 108,168 114,117 114,117 153,000 165,188 178,238 193,307
Other materials 62,703 42,074 43,965 19,207 19,207 7,615 6,480 2,335 2,401
Contracted Services 1,716,698 1,215,007 1,037,648 1,814,533 1,795,637 1,896,406 2,191,600 2,057,992 2,175,448
Other Expenditure 330,342 435,488 631,744 541,845 164,010 545,359 477,577 770,595 753,297
Total Repairs and Maintenance Expenditure 2,193,111 1,793,026 1,821,525 2,489,703 2,092,971 2,602,380 2,840,845 3,009,159 3,124,453
91
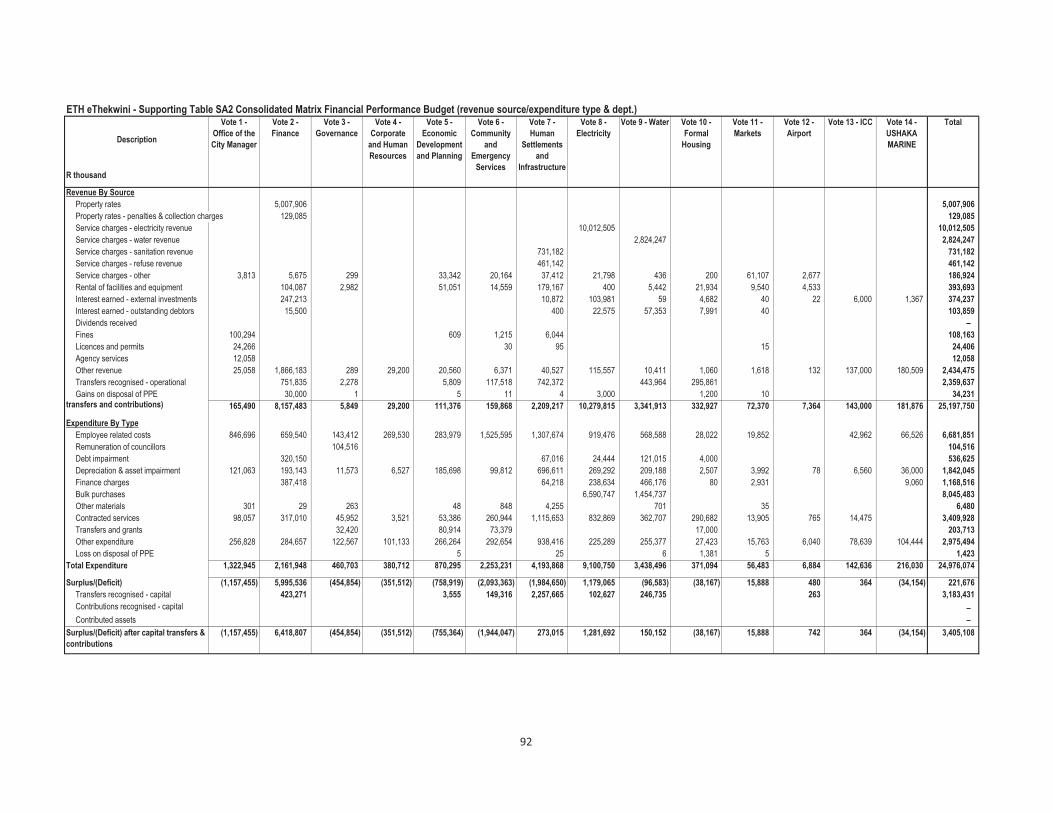
ETH eThekwini - Supporting Table SA2 Consolidated Matrix Financial Performance Budget (revenue source/expenditure type & dept.)
Description
R thousand
Revenue By Source
Property rates 5,007,906 5,007,906
Property rates - penalties & collection charges 129,085 129,085
Service charges - electricity revenue 10,012,505 10,012,505
Service charges - water revenue 2,824,247 2,824,247
Service charges - sanitation revenue 731,182 731,182
Service charges - refuse revenue 461,142 461,142
Service charges - other 3,813 5,675 299 33,342 20,164 37,412 21,798 436 200 61,107 2,677 186,924
Rental of facilities and equipment 104,087 2,982 51,051 14,559 179,167 400 5,442 21,934 9,540 4,533 393,693
Interest earned - external investments 247,213 10,872 103,981 59 4,682 40 22 6,000 1,367 374,237
Interest earned - outstanding debtors 15,500 400 22,575 57,353 7,991 40 103,859
Dividends received –
Fines 100,294 609 1,215 6,044 108,163
Licences and permits 24,266 30 95 15 24,406
Agency services 12,058 12,058
Other revenue 25,058 1,866,183 289 29,200 20,560 6,371 40,527 115,557 10,411 1,060 1,618 132 137,000 180,509 2,434,475
Transfers recognised - operational 751,835 2,278 5,809 117,518 742,372 443,964 295,861 2,359,637
Gains on disposal of PPE 30,000 1 5 11 4 3,000 1,200 10 34,231 transfers and contributions) 165,490 8,157,483 5,849 29,200 111,376 159,868 2,209,217 10,279,815 3,341,913 332,927 72,370 7,364 143,000 181,876 25,197,750
Expenditure By Type
Employee related costs 846,696 659,540 143,412 269,530 283,979 1,525,595 1,307,674 919,476 568,588 28,022 19,852 42,962 66,526 6,681,851
Remuneration of councillors 104,516 104,516
Debt impairment 320,150 67,016 24,444 121,015 4,000 536,625
Depreciation & asset impairment 121,063 193,143 11,573 6,527 185,698 99,812 696,611 269,292 209,188 2,507 3,992 78 6,560 36,000 1,842,045
Finance charges 387,418 64,218 238,634 466,176 80 2,931 9,060 1,168,516
Bulk purchases 6,590,747 1,454,737 8,045,483
Other materials 301 29 263 48 848 4,255 701 35 6,480
Contracted services 98,057 317,010 45,952 3,521 53,386 260,944 1,115,653 832,869 362,707 290,682 13,905 765 14,475 3,409,928
Transfers and grants 32,420 80,914 73,379 17,000 203,713
Other expenditure 256,828 284,657 122,567 101,133 266,264 292,654 938,416 225,289 255,377 27,423 15,763 6,040 78,639 104,444 2,975,494
Loss on disposal of PPE 5 25 6 1,381 5 1,423
Total Expenditure 1,322,945 2,161,948 460,703 380,712 870,295 2,253,231 4,193,868 9,100,750 3,438,496 371,094 56,483 6,884 142,636 216,030 24,976,074
Surplus/(Deficit) (1,157,455) 5,995,536 (454,854) (351,512) (758,919) (2,093,363) (1,984,650) 1,179,065 (96,583) (38,167) 15,888 480 364 (34,154) 221,676
Transfers recognised - capital 423,271 3,555 149,316 2,257,665 102,627 246,735 263 3,183,431
Contributions recognised - capital –
Contributed assets –
Surplus/(Deficit) after capital transfers &
contributions
(1,157,455) 6,418,807 (454,854) (351,512) (755,364) (1,944,047) 273,015 1,281,692 150,152 (38,167) 15,888 742 364 (34,154) 3,405,108
Vote 6 -
Community
and
Emergency
Services
Vote 1 -
Office of the
City Manager
Vote 2 -
Finance
Vote 3 -
Governance
Vote 4 -
Corporate
and Human
Resources
Vote 5 -
Economic
Development
and Planning
Vote 12 -
Airport
Vote 13 - ICC Vote 14 -
USHAKA
MARINE
TotalVote 7 -
Human
Settlements
and
Infrastructure
Vote 8 -
Electricity
Vote 9 - Water Vote 10 -
Formal
Housing
Vote 11 -
Markets
92

ETH eThekwini - Supporting Table SA3 Supportinging detail to 'Budgeted Financial Position'
2009/10 2010/11 2011/12
Audited
Outcome
Audited
Outcome
Audited
Outcome
Original
Budget
Adjusted
Budget
Full Year
Forecast
Budget Year
2013/14
Budget Year
+1 2014/15
Budget Year
+2 2015/16
R thousand
ASSETS
Call investment deposits
Call deposits < 90 days 1,430,751 2,450,000 3,500,000 3,300,000 3,300,000 4,500,000 5,000,000 5,200,000 5,500,000
Other current investments > 90 days 327,044 681,771 1,374,465 400,000 400,000 500,000 500,000 500,000 500,000
Total Call investment deposits 1,757,795 3,131,771 4,874,465 3,700,000 3,700,000 5,000,000 5,500,000 5,700,000 6,000,000
Consumer debtors
Consumer debtors 4,388,978 4,351,170 4,692,630 4,835,890 4,741,043 4,759,871 4,881,153 5,069,088 5,285,458
Less: Provision for debt impairment (1,894,240) (1,756,340) (1,937,826) (2,261,167) (2,070,466) (1,957,407) (1,988,604) (2,036,351) (2,072,320)
Total Consumer debtors 2,494,738 2,594,830 2,754,804 2,574,723 2,670,577 2,802,464 2,892,549 3,032,737 3,213,138
Debt impairment provision
Balance at the beginning of the year 1,753,969 1,709,640 1,756,340 2,111,595 1,937,826 1,937,826 1,957,407 1,988,604 2,036,351
Contributions to the provision 572,984 324,315 379,028 550,000 614,000 500,941 536,625 578,446 593,203
Bad debts written off (305,443) (277,615) (197,542) (400,428) (481,360) (481,360) (505,428) (530,699) (557,234)
Balance at end of year 2,021,510 1,756,340 1,937,826 2,261,167 2,070,466 1,957,407 1,988,604 2,036,351 2,072,320
Property, plant and equipment (PPE)
PPE at cost/valuation (excl. finance leases) 36,014,458 39,650,835 42,954,044 49,182,985 48,266,613 47,814,604 53,241,932 58,994,117 65,420,765
Leases recognised as PPE
Less: Accumulated depreciation 6,435,531 7,690,537 9,083,489 11,123,958 10,830,868 10,830,868 12,630,325 14,494,660 16,435,835
Total Property, plant and equipment (PPE) 29,578,927 31,960,298 33,870,555 38,059,027 37,435,745 36,983,736 40,611,607 44,499,457 48,984,930
LIABILITIES
Current liabilities - Borrowing
Short term loans (other than bank overdraft)
Current portion of long-term liabilities 524,300 693,058 773,025 941,638 1,156,000 1,156,000 1,021,000 1,078,000 1,160,700
Total Current liabilities - Borrowing 524,300 693,058 773,025 941,638 1,156,000 1,156,000 1,021,000 1,078,000 1,160,700
Trade and other payables
Trade and other creditors 4,829,125 4,356,297 4,838,962 4,428,222 4,642,341 4,929,657 5,369,032 5,528,144 5,774,268
Unspent conditional transfers 672,725 767,738 599,421 – 482,500 300,000 250,000 200,000
VAT
Total Trade and other payables 5,501,850 5,124,035 5,438,383 4,428,222 4,642,341 5,412,157 5,669,032 5,778,144 5,974,268
Non current liabilities - Borrowing
Borrowing 8,150,386 9,516,893 10,013,000 10,127,511 9,486,225 9,486,225 9,464,425 9,386,425 9,225,725
Finance leases (including PPP asset element)
Total Non current liabilities - Borrowing 8,150,386 9,516,893 10,013,000 10,127,511 9,486,225 9,486,225 9,464,425 9,386,425 9,225,725
Provisions - non-current
Retirement benefits 1,634,468 1,610,806 2,664,486 2,142,755 2,142,755 2,362,785 2,398,227 2,434,200 2,470,713
List other major provision items
Refuse landfill site rehabilitation 48,640 60,751 66,306 45,000 45,000 45,000 60,000 55,000 50,000
Other 214,736 193,192 221,954 375,200 375,200 375,200 431,480 496,202 570,632
Total Provisions - non-current 1,897,844 1,864,749 2,952,746 2,562,955 2,562,955 2,782,985 2,889,707 2,985,402 3,091,345
CHANGES IN NET ASSETS
Accumulated Surplus/(Deficit)
Accumulated Surplus/(Deficit) - opening balance 8,022,353 9,301,751 10,757,967 11,834,246 11,252,672 12,499,276 16,020,966 19,915,625 24,328,861
GRAP adjustments (226,760) 3,521
Restated balance 7,795,593 9,305,271 10,757,967 11,834,246 11,252,672 12,499,276 16,020,966 19,915,625 24,328,861
Surplus/(Deficit) 1,927,930 1,963,202 1,786,090 2,742,016 2,797,791 2,996,937 3,405,108 3,871,148 4,612,537
Appropriations to Reserves (49,000) – (4,073,307)
Transfers from Reserves 202,787 62,418 636,000 636,000 26,045 23,441 21,097 18,987
Depreciation offsets – – 549,447 549,395 467,470 489,394 503,785 531,217
Other adjustments
Accumulated Surplus/(Deficit) 9,877,310 11,330,891 12,544,057 11,688,401 15,235,858 15,989,728 19,938,909 24,311,655 29,491,602
Reserves
Housing Development Fund 341,225 278,807 260,454 191,729 191,729 234,409 210,968 189,871 170,884
Capital replacement 775,354 1,377,913 1,838,199 508,710 1,930,528 2,176,096 2,488,781 2,786,979 3,286,192
Self-insurance 717,400 768,895 820,082 830,842 863,084 882,401 950,338 1,029,716 1,118,448
Other reserves 9,741,392 9,947,165 10,026,969 16,042,321 10,725,348 10,100,769 9,974,963 9,411,477 8,532,889
Revaluation 33,977 33,977
Total Reserves 11,575,371 12,406,757 12,979,681 17,573,601 13,710,689 13,393,675 13,625,050 13,418,043 13,108,413
TOTAL COMMUNITY WEALTH/EQUITY 21,452,681 23,737,648 25,523,738 29,262,002 28,946,547 29,383,403 33,563,959 37,729,698 42,600,015
Total capital expenditure includes expenditure on nationally significant priorities:
Provision of basic services 4,268,380 1,103,800 181,929
2010 World Cup
Meet service needs and address backlogs 3,677,146
Description
Current Year 2012/132013/14 Medium Term Revenue &
Expenditure Framework
93

ETH eThekwini - Supporting Table SA4 Reconciliation of IDP strategic objectives and budget (revenue)
Strategic Objective GoalGoal
Code2009/10 2010/11 2011/12
R thousand
Audited
Outcome
Audited
Outcome
Audited
Outcome
Original
Budget
Adjusted
Budget
Full Year
Forecast
Budget Year
2013/14
Budget Year
+1 2014/15
Budget Year
+2 2015/16
Develop and Sustain our
Spatial,Natural and Built
Environment
Develop, manage and regulate
the Built and Natural
Environment
1 30,484 43,337 26,882 30,766 34,216 38,303 37,215 36,767 37,521
Climate protection planning 9,762 8,076 255 1,671 2,241 2,341 4,580 14,634 19,665
Developing a Prosperous,
Diverse Economy and
Employment Creation
Support and grow new and
existing businesses
2 201,885 405,581 444,636 323,414 363,006 365,360 339,756 363,731 389,605
Provide Secondary Support to
business enterprise
82,660 86,819 86,819 85,839 92,262 97,724 103,998
Creating a Quality Living
Environment
Meet Infrastructure &
Household Service Needs and
Backlogs
3 10,541,878 11,461,221 13,539,218 14,995,062 15,082,724 14,593,014 15,916,124 17,134,660 18,387,703
Address community services
backlogs
50,831 59,863 68,657 191,449 194,528 161,145 310,023 357,140 393,554
Fostering a Socially Equitable
Environment
Promoting the safety of citizens 4 113,379 141,980 102,288 139,870 139,870 143,840 150,801 159,116 167,821
Promoting the health of citizens 50,831 51,396 11,349 70,044 70,044 70,044 73,846 77,216 78,778
Creating a Platform for
Growth,Empowerment and
Skills Development
Develop Human Capital 5 23,203 19,616 15,831 22,347 22,347 22,981 29,200 12,264 12,878
Develop the City as a learning
City
19,480 3,877 26 30 30 31 32 33 35
Healthy and productive
employees
39,679 5 – – – – – –
Embracing our cultural
diversity,arts and heritage
Ensure inclusive acess to arts,
culture,aports,recreation and
heritage resources
6 319 1,298 402 4,632 5,232 989 2,447 2,571 4
Promote sport development
and recreation within the city
39,685 78,751 50,864 55,030 70,144 74,960 61,523 71,900 78,292
Good Governance and
Responsive Local
Government
Ensure accessibility and
promote governance.
7 2,695 944 2,940 3,514 4,455 3,261 3,324 3,403 3,487
Create an efficient, effective
and accountable government
12,817 27,020 21,752 25,395 25,460 25,378 26,198 27,665 29,139
Financially Accountable and
Sustainable City
Strategic and sustainable
budgeting, Grow and diversify
our revenues ,Value for money
expenditure,Sound financial
management & reporting ,
Durban Energy Office and INK
ABM
8 5,686,043 6,082,979 6,675,954 7,712,176 7,772,376 7,688,628 8,150,419 8,764,718 9,357,117
Allocations to other priorities
Total Revenue (excluding capital transfers and contributions) 16,822,969 18,385,939 21,043,718 23,662,218 23,873,492 23,276,112 25,197,750 27,123,541 29,059,599
Current Year 2012/132013/14 Medium Term Revenue &
Expenditure Framework
94

ETH eThekwini - Supporting Table SA5 Reconciliation of IDP strategic objectives and budget (operating expenditure)
Strategic Objective GoalGoal
Code2009/10 2010/11 2011/12
R thousand
Audited
Outcome
Audited
Outcome
Audited
Outcome
Original
Budget
Adjusted
Budget
Full Year
Forecast
Budget Year
2013/14
Budget Year
+1 2014/15
Budget Year
+2 2015/16
Develop and Sustain our
Spatial,Natural and Built
Environment
Develop, manage and regulate
the Built and Natural Environment
1 239,186 241,585 250,427 301,720 304,475 281,191 291,313 303,100 306,086
Climate protection planning 102,632 102,219 115,764 129,917 132,928 130,791 154,711 172,879 186,304
Developing a Prosperous,
Diverse Economy and
Employment Creation
Support and grow the economy 2 723,052 692,805 585,826 742,314 763,887 679,939 768,875 824,457 879,719
Provide Secondary Support to
business enterprise
93,954 104,881 152,544 161,356 139,242 133,841 151,680 160,010 170,163
Creating a Quality Living
Environment
Meet Infrastructure & Household
Service Needs and Backlogs
3 10,657,454 10,955,534 14,097,309 15,456,819 15,692,153 15,146,215 16,435,203 17,666,135 18,869,526
Address community services
backlogs
983,705 1,027,869 1,147,809 1,395,002 1,256,214 1,360,098 1,471,766 1,640,124 1,789,587
Fostering a Socially
Equitable Environment
Promoting the safety of citizens 4 873,508 914,859 1,051,144 1,092,917 1,066,417 1,103,452 1,089,901 1,192,088 1,236,575
Promoting the health of citizens 263,395 206,990 273,703 334,299 380,203 379,734 408,434 468,240 488,576
Creating a Platform for
Growth,Empowerment and
Skills Development
Develop Human Capital 5 73,224 69,860 64,208 95,485 95,172 94,392 123,294 111,319 116,602
Develop the City as a learning
City
38,038 10,098 7,960 14,390 13,855 13,175 14,745 15,776 16,623
Healthy and productive
employees
141,946 157,218 154,657 215,243 215,243 188,485 230,157 243,469 256,701
Embracing our cultural
diversity,arts and heritage
Empower ans create economic
opportunities for arts,cutlture and
heritage
6 36,579 43,835 44,357 69,361 69,598 65,695 65,657 70,975 81,859
Promote sport development and
recreation within the city
318,095 363,364 504,011 516,950 541,373 548,824 547,710 573,292 595,479
Good Governance and
Responsive Local
Government
Ensure accessibility and promote
governance.
7 128,854 156,016 155,071 219,581 224,860 195,363 249,222 253,853 269,203
Create an efficient, effective and
accountable government
594,787 635,579 799,564 838,468 918,156 824,655 887,268 952,856 983,411
Financially Accountable and
Sustainable City
Strategic and sustainable
budgeting, Grow and diversify our
revenues ,Value for money
expenditure,Sound financial
management & reporting and
Durban Energy Office
8 1,898,499 1,644,152 1,310,031 2,167,458 2,148,869 1,942,632 2,086,138 2,185,132 2,284,940
Allocations to other priorities
Total Expenditure 17,166,908 17,326,863 20,714,382 23,751,279 23,962,645 23,088,482 24,976,074 26,833,705 28,531,354
Current Year 2012/132013/14 Medium Term Revenue &
Expenditure Framework
95

ETH eThekwini - Supporting Table SA6 Reconciliation of IDP strategic objectives and budget (capital expenditure)
Strategic Objective GoalGoal
Code2009/10 2010/11 2011/12
R thousand
Audited
Outcome
Audited
Outcome
Audited
Outcome
Original
Budget
Adjusted
Budget
Full Year
Forecast
Budget Year
2013/14
Budget Year
+1 2014/15
Budget Year
+2 2015/16
Develop and Sustain our
Spatial,Natural and Built
Environment
Develop, manage and regulate
the built and natural
environment
A 12,875 117,305 2,700 5,435 5,435 3,587 3,150 3,600
Developing a Prosperous,
Diverse Economy and
Employment Creation
Support and grow economy B 1,296,208 118,887 91,316 582,288 311,630 327,630 179,192 208,190 283,499
Creating a Quality Living
Environment
Meet Infrastructure &
Household Service Needs and
Backlogs
C 4,499,562 3,129,781 2,743,478 4,086,586 4,603,142 4,603,142 4,753,608 4,865,577 5,504,139
Address community services
backlogs
D 117,346 61,184 130,129 145,826 69,983 69,983 132,108 255,429 260,651
Fostering a Socially
Equitable Environment
Promoting the safety of citizens E 63,733 32,577 25,998 15,583 47,830 47,830 81,521 93,878 91,790
Promoting the health of citizens F 7,529 4,810 15,453 16,500 16,500 16,500 30,262 25,000 9,900
Creating a Platform for
Growth,Empowerment and
Skills Development
Develop Human Capital H 43,291 7,966 36,000 12,092 22,197 18,532
Healthy and productive
employees
G 8,290 3,701 3,958 1,080 – 360
Embracing our cultural
diversity,arts and heritage
Ensure inclusive acess to arts,
culture,aports,recreation and
heritage resources
I 15,103 190,073 26,573 26,573 29,297 59,263 62,699
Promote sport development
and recreation within the city
J 274 5,928 10,257 10,754 10,754 13,650 2,700 4,118
Good Governance and
Responsive Local
Government
Ensure accessibility and
promote governance.
K 3,520 724 17,349 16,400 17,010 17,010 13,500 23,680 14,310
Create an efficient, effective
and accountable government
L 204,015 120,204 142,860 95,702 96,565 96,565 106,290 91,260 100,350
Financially Accountable
and Sustainable City
Strategic and sustainable
budgeting, Grow and diversify
our revenues ,Value for money
expenditure,Sound financial
management & reporting,
Durban Energy Office and INK
M 243,126 190,743 323,899 110,800 111,059 111,059 110,580 144,750 115,932
Allocations to other priorities
Total Capital Expenditure 6,499,769 3,787,882 3,515,471 5,308,715 5,316,481 5,332,481 5,466,767 5,795,074 6,469,880
Current Year 2012/132013/14 Medium Term Revenue &
Expenditure Framework
96
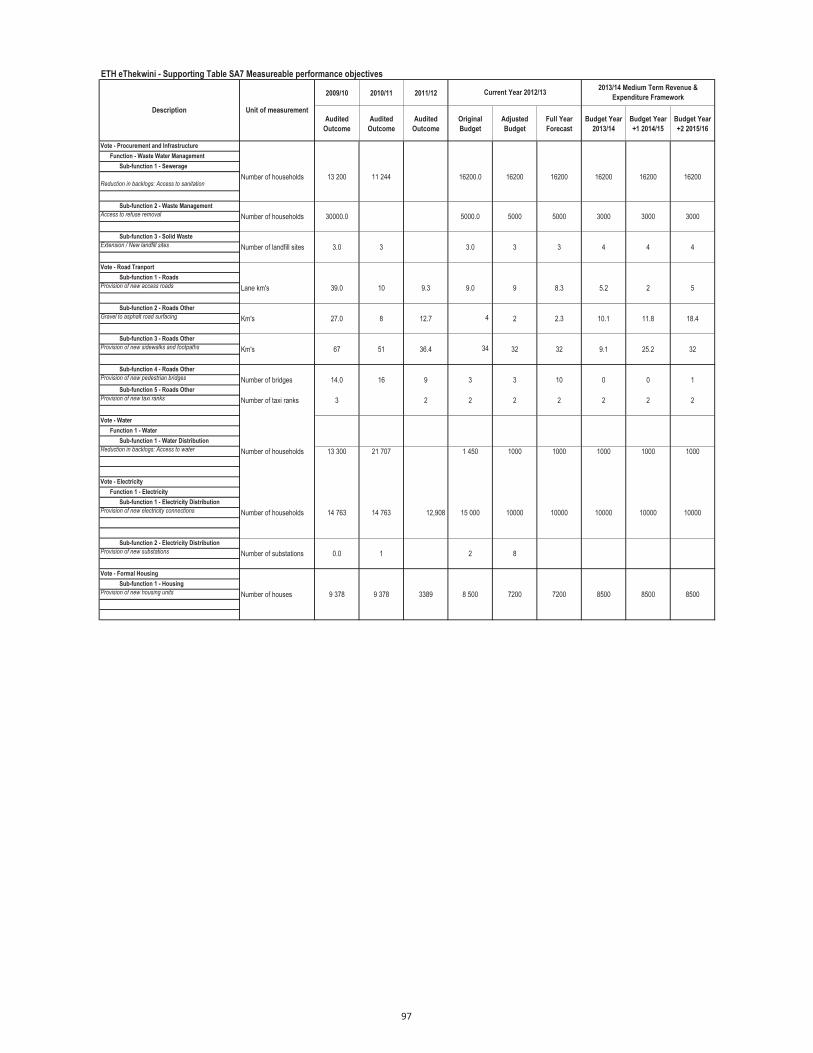
ETH eThekwini - Supporting Table SA7 Measureable performance objectives
2009/10 2010/11 2011/12
Audited
Outcome
Audited
Outcome
Audited
Outcome
Original
Budget
Adjusted
Budget
Full Year
Forecast
Budget Year
2013/14
Budget Year
+1 2014/15
Budget Year
+2 2015/16
Vote - Procurement and Infrastructure
Function - Waste Water Management
Sub-function 1 - Sewerage
Reduction in backlogs: Access to sanitationNumber of households 13 200 11 244 16200.0 16200 16200 16200 16200 16200
Sub-function 2 - Waste Management
Access to refuse removal Number of households 30000.0 5000.0 5000 5000 3000 3000 3000
Sub-function 3 - Solid Waste
Extension / New landfill sites Number of landfill sites 3.0 3 3.0 3 3 4 4 4
Vote - Road Tranport
Sub-function 1 - Roads
Provision of new access roads Lane km's 39.0 10 9.3 9.0 9 8.3 5.2 2 5
Sub-function 2 - Roads Other
Gravel to asphalt road surfacing Km's 27.0 8 12.7 4 2 2.3 10.1 11.8 18.4
Sub-function 3 - Roads Other
Provision of new sidewalks and footpaths Km's 67 51 36.4 34 32 32 9.1 25.2 32
Sub-function 4 - Roads Other
Provision of new pedestrian bridges Number of bridges 14.0 16 9 3 3 10 0 0 1
Sub-function 5 - Roads Other
Provision of new taxi ranks Number of taxi ranks 3 2 2 2 2 2 2 2
Vote - Water
Function 1 - Water
Sub-function 1 - Water Distribution
Reduction in backlogs: Access to water Number of households 13 300 21 707 1 450 1000 1000 1000 1000 1000
Vote - Electricity
Function 1 - Electricity
Sub-function 1 - Electricity Distribution
Provision of new electricity connections Number of households 14 763 14 763 12,908 15 000 10000 10000 10000 10000 10000
Sub-function 2 - Electricity Distribution
Provision of new substations Number of substations 0.0 1 2 8
Vote - Formal Housing
Sub-function 1 - Housing
Provision of new housing units Number of houses 9 378 9 378 3389 8 500 7200 7200 8500 8500 8500
Description Unit of measurement
Current Year 2012/132013/14 Medium Term Revenue &
Expenditure Framework
97

ETH eThekwini - Supporting Table SA8 Performance indicators and benchmarks
2009/10 2010/11 2011/12
Audited
Outcome
Audited
Outcome
Audited
Outcome
Original
Budget
Adjusted
Budget
Full Year
Forecast
Budget Year
2013/14
Budget Year
+1 2014/15
Budget Year
+2 2015/16
Borrowing Management
Credit Rating AA AA AA -AA -AA -AA
Capital Charges to Operating
Expenditure
Interest & Principal Paid /Operating
Expenditure
4.5% 7.3% 6.2% 8.7% 8.6% 8.1% 9.3% 8.2% 7.8%
Capital Charges to Own Revenue Finance charges & Repayment of
borrowing /Own Revenue
5.1% 7.5% 6.8% 9.6% 9.5% 8.8% 10.2% 9.0% 8.4%
Borrowed funding of 'own' capital
expenditure
Borrowing/Capital expenditure excl.
transfers and grants and contributions
68.6% 71.6% 51.3% 61.9% 31.6% 30.4% 43.8% 45.2% 41.9%
Safety of Capital
Gearing Long Term Borrowing/ Funds &
Reserves
70.4% 76.7% 77.1% 57.6% 69.2% 70.8% 69.5% 70.0% 70.4%
Liquidity
Current Ratio Current assets/current liabilities 1.1 1.2 1.4 1.4 1.3 1.4 1.4 1.5 1.5
Current Ratio adjusted for aged
debtors
Current assets less debtors > 90
days/current liabilities
1.1 1.2 1.4 1.4 1.3 1.4 1.4 1.5 1.5
Liquidity Ratio Monetary Assets/Current Liabilities 0.3 0.5 0.7 0.6 0.6 0.7 0.7 0.7 0.8
Revenue Management
Annual Debtors Collection Rate
(Payment Level %)
Last 12 Mths Receipts/Last 12 Mths
Billing
90.2% 100.4% 99.9% 96.8% 97.1% 0.0% 96.7% 96.6%
Current Debtors Collection Rate (Cash
receipts % of Ratepayer & Other
revenue)
89.9% 100.3% 99.9% 97.0% 97.0% 0.0% 96.8% 96.6%
Outstanding Debtors to Revenue Total Outstanding Debtors to Annual
Revenue
35.4% 30.5% 28.3% 24.8% 24.9% 26.0% 24.7% 23.7% 23.1%
Longstanding Debtors Recovered Debtors > 12 Mths Recovered/Total
Debtors > 12 Months Old
Creditors Management
Creditors System Efficiency % of Creditors Paid Within Terms
(within`MFMA' s 65(e))
100.0% 100.0% 100.0% 100.0% 100.0% 100.0% 100.0% 100.0% 100.0%
Creditors to Cash and Investments 279.6% 133.1% 96.3% 109.3% 153.1% 103.0% 101.2% 100.8% 100.1%
Other Indicators
Total Volume Losses (kW)567719675 630883534 664796777 664796778 664796778 664796778 664796778 664796778 664796778
Total Cost of Losses (Rand '000)160 263 364 414 414 414 447 483 519
Total Volume Losses (kℓ)124847528 104321876 112121754 103925373.1 103925373.1 111028949 106498653 101856672 97352230
Total Cost of Losses (Rand '000)406,129 360,328 410,926 444,697 444,697 475,093 496,284 503,172 509,152
Employee costs Employee costs/(Total Revenue -
capital revenue)
27.5% 26.8% 31.4% 25.8% 25.7% 25.0% 26.5% 26.7% 26.4%
Remuneration Total remuneration/(Total Revenue -
capital revenue)
28.0% 27.3% 31.8% 26.2% 26.1% 25.3% 26.9% 27.2% 26.8%
Repairs & Maintenance R&M/(Total Revenue excluding capital
revenue)
13.0% 9.8% 8.7% 10.5% 8.8% 11.2% 11.3% 11.1% 10.8%
Finance charges & Depreciation FC&D/(Total Revenue - capital
revenue)
10.2% 11.8% 11.4% 13.1% 12.9% 12.3% 11.9% 11.4% 10.8%
IDP regulation financial viability
indicators
i. Debt coverage (Total Operating Revenue - Operating
Grants)/Debt service payments due
within financial year)
22.0 22.4 17.9 18.5 18.5 18.5 14.3 14.2 15.3
ii.O/S Service Debtors to Revenue Total outstanding service
debtors/annual revenue received for
services
45.3% 36.7% 34.5% 29.8% 30.3% 31.5% 30.0% 28.7% 27.8%
iii. Cost coverage (Available cash + Investments)/monthly
fixed operational expenditure
1.6 2.8 3.4 2.5 1.9 3.1 3.2 3.0 3.0
Water Distribution Losses (2)
Description of financial indicator Basis of calculation
Current Year 2012/132013/14 Medium Term Revenue &
Expenditure Framework
Electricity Distribution Losses (2)
98

ETH eThekwini - Supporting Table SA9 Social, economic and demographic statistics and assumptions2009/10 2010/11 2011/12 Current Year
2012/13
Outcome Outcome Outcome Original Budget Outcome Outcome Outcome
Demographics
Population 2,817,420 3,114,379 3,468,086 3,699,290 3,717,786 3,717,786 3,750,000 3,768,000 3,789,000 3,804,000
Females aged 5 - 14 536,391 580,134 623,000 629,000 629,000 693,000 699,000 705,000 711,000
Males aged 5 - 14 269,443 327,387 332,000 332,000 345,000 358,000 371,000 385,000
Females aged 15 - 34 542,853 265,558 1,313,000 1,328,000 1,328,000 1,354,000 1,369,000 1,384,000 1,399,000
Males aged 15 - 34 544,107 761,398 773,000 773,000 823,000 835,000 848,000 862,000
Unemployment 330,847 477,012 510,000 497,000 497,000 548,000 604,000 665,000 734,000
Monthly household income (no. of households)
No income
0-2400 10,594 13,782 4,832 1,500 712 207 159 123 94 73
R2400-R6000 29,499 53,260 26,863 15,048 10,227 4,910 4,357 3,866 3,430 3,044
R6000-R12000 92,628 105,941 73,625 56,958 49,831 43,768 33,670 29,876 28,420 27,034
R12000-R18000 62,363 87,247 82,605 72,274 66,287 60,193 46,306 41,088 40,992 40,895
R18000-R30000 112,458 125,131 110,192 102,444 96,728 92,496 71,156 63,139 62,321 61,515
R30000-R42000 88,760 88,208 92,250 95,649 96,323 99,831 76,798 68,145 68,681 69,222
R42000-R54000 49,534 57,755 69,720 73,406 74,907 76,632 58,952 52,310 53,854 55,443
R54000-R72000 39,240 57,799 77,290 79,038 78,509 77,114 59,323 52,639 55,064 57,600
R72000-R96000 41,670 46,506 64,743 66,771 66,941 66,870 51,442 45,646 47,108 48,617
R96000-R132000 46,485 46,960 60,376 71,263 72,883 70,065 53,900 47,827 49,153 49,153
R132000-R192000 36,398 48,662 68,403 76,310 78,471 77,917 59,940 53,187 55,955 58,867
R192000-R360000 20,448 53,319 92,415 98,171 103,004 110,980 85,375 75,756 84,798 94,921
R360000-R600000 5,545 21,268 47,574 56,523 60,647 61,999 47,695 42,321 49,711 58,392
R600000-R1200000 2,046 5,325 23,801 30,709 36,421 44,716 34,399 30,523 37,491 46,050
R1200000-R2400000 436 665 4,932 7,046 8,712 10,345 7,959 7,062 8,722 10,772
R2400000+ 43 144 727 978 1,093 1,023 787 698 862 1,066
Poverty profiles (no. of households)
< R2 060 per household per month
Family of four living on less than R 1998 per month 774,000 970,000 960,000 1,028,000 1,111,000 1,111,786 1,112,572 1,112,650
Household/demographics (000)
Number of people in municipal area 2,817,420 3,114,379 3,468,086 3,699,290 3,717,786 3,750,000 3,776,000 3,802,000 3,828,000
Number of poor people in municipal area 773,721 987,825 920,000 1,028,289 798,000 702,000 617,000 543,000
Number of households in municipal area 663,962 814,617 833,859 957,000 963,349 1,001,000 1,021,000 1,041,000 1,061,000
Number of poor households in municipal area 290,000 300,741 325,000 335,000 345,000 355,000 Housing statistics
Formal 470,094 595,685 636,932
Informal 193,868 218,932 196,927
Total number of households 663,962 814,617 833,859 - - - - - - -
Dwellings provided by municipality 9,378 4,752 8,500 7,200 8,500 8,500
Total new housing dwellings - - - 9,378 4,752 - 8,500 7,200 8,500 8,500
Economic
Inflation/inflation outlook (CPIX) 7.0% 4.9% 5.9% 5.6% 5.6% 5.6%
Interest rate - borrowing 10.0% 9.5% 9.0% 10.5% 10.0% 10.0%
Interest rate - investment 8.5% 6.0% 5.4% 5.6% 6.0% 7.0%
Remuneration increases 11.8% 8.5% 6.0% 6.0% 6.5% 6.5%
Consumption growth (electricity) 0.0% 1.5% 1.5% 1.5% 1.0% 1.0%
Consumption growth (water) 1.0% 1.5% 1.5% 1.5% 1.0% 1.0%
Collection rates
Property tax/service charges 93.7% 98.0% 98.0% 98.0% 98.0% 98.0%
Rental of facilities & equipment 100.0% 100.0% 100.0% 100.0% 100.0% 100.0%
Interest - external investments 100.0% 100.0% 100.0% 100.0% 100.0% 100.0%
2013/14 Medium Term Revenue & Expenditure
FrameworkDescription of economic indicator Basis of calculation 1996 Census 2001 Census 2007 Survey
99

ETH eThekwini Supporting Table SA10 Funding measurement
2009/10 2010/11 2011/12
Audited
Outcome
Audited
Outcome
Audited
Outcome
Original
Budget
Adjusted
Budget
Full Year
Forecast
Budget Year
2013/14
Budget Year
+1 2014/15
Budget Year
+2 2015/16
Funding measures
Cash/cash equivalents at the year end - R'000 18(1)b 1,727,157 3,274,026 5,025,483 4,051,298 3,031,965 4,786,847 5,305,724 5,482,183 5,766,097
Cash + investments at the yr end less applications - R'000 18(1)b (115,597) 1,288,147 2,551,686 3,326,183 1,750,405 2,446,130 2,551,984 2,489,267 2,341,814
Cash year end/monthly employee/supplier payments 18(1)b 1.6 2.8 3.4 2.5 1.9 3.1 3.2 3.0 3.0
Surplus/(Deficit) excluding depreciation offsets: R'000 18(1) 1,927,930 1,963,202 1,786,090 3,291,462 3,347,186 3,464,407 3,894,502 4,374,933 5,143,754
Service charge rev % change - macro CPIX target exclusive 18(1)a,(2) N.A. 10.3% 6.9% 9.7% (6.0%) (8.8%) (0.6%) 2.2% 1.7%
Cash receipts % of Ratepayer & Other revenue 18(1)a,(2) 89.9% 100.3% 99.9% 97.0% 97.0% 96.9% 96.8% 96.6% 96.6%
Debt impairment expense as a % of total billable revenue 18(1)a,(2) 4.6% 4.3% 2.4% 2.9% 3.3% 2.7% 2.7% 2.7% 2.6%
Capital payments % of capital expenditure 18(1)c;19 101.0% 100.4% 100.0% 100.0% 100.0% 100.0% 90.1% 90.0% 90.0%
Borrowing receipts % of capital expenditure (excl. transfers) 18(1)c 68.6% 71.6% 51.3% 60.5% 30.9% 29.7% 43.8% 45.2% 41.9%
Grants % of Govt. legislated/gazetted allocations 18(1)a 100.4% 103.0% 101.7%
Current consumer debtors % change - incr(decr) 18(1)a N.A. (6.4%) 6.3% (1.1%) 1.7% 1.3% 4.2% 3.6% 4.2%
Long term receivables % change - incr(decr) 18(1)a N.A. 0.5% 1.0% (2.8%) 0.0% 7.6% 8.1% 2.0% 2.0%
R&M % of Property Plant & Equipment 20(1)(vi) 7.4% 5.6% 5.4% 6.5% 5.6% 7.0% 7.0% 6.8% 6.4%
Asset renewal % of capital budget 20(1)(vi) 21.4% 89.3% 33.2% 35.2% 35.3% 35.5% 33.5% 33.9% 31.9%
DescriptionMFMA
section
Current Year 2012/132013/14 Medium Term Revenue &
Expenditure Framework
100

ETH eThekwini - Supporting Table SA11 Property rates summary
2009/10 2010/11 2011/12
Audited
OutcomeAudited Outcome
Audited
OutcomeOriginal Budget
Adjusted
Budget
Full Year
Forecast
Budget Year
2013/14
Budget Year
+1 2014/15
Budget Year
+2 2015/16
Valuation:
Date of valuation: 2011/7/1 2011/7/1
Financial year valuation used
Municipal by-laws s6 in place? (Y/N) Yes Yes Yes Yes Yes Yes Yes Yes Yes
Municipal/assistant valuer appointed? (Y/N) Yes Yes Yes Yes Yes Yes Yes Yes Yes
Municipal partnership s38 used? (Y/N) No No No No No No No No No
No. of assistant valuers (FTE) 35 30 100 100 100 40 40 40
No. of data collectors (FTE) 50 50 50 50 50 50 50 50
No. of internal valuers (FTE) 4 4 23 23 23 24 24 24
No. of external valuers (FTE) 6 6 6 6 6 5 5 5
No. of additional valuers (FTE)
Valuation appeal board established? (Y/N) Yes
Implementation time of new valuation roll (mths) 01/07/12
No. of properties 364,090 500,116 505,437 505,437 505,437 505,437 505,437
No. of sectional title values 115,600 115,558 115,558 115,558 115,558 115,558 115,558
No. of unreasonably difficult properties s7(2)
No. of supplementary valuations 3 3 3 3 3 3 3 3 3
No. of valuation roll amendments 7,421
No. of objections by rate payers 839
No. of appeals by rate payers 408 410 112 7,099
No. of successful objections 334 363 100 4,126
No. of successful objections > 10% 31,232 27,404 18,962 4,610
Supplementary valuation 92,348,500 2,297,775,700 224,702,500 11,772,763,300
Public service infrastructure value (Rm) 474 1,456 152 8,510
Municipality owned property value (Rm)
Valuation reductions:
Valuation reductions-public infrastructure (Rm)
Valuation reductions-nature reserves/park (Rm)
Valuation reductions-mineral rights (Rm)
Valuation reductions-R15,000 threshold (Rm)
Valuation reductions-public worship (Rm)
Valuation reductions-other (Rm)
Total valuation reductions: – – – – – – – – –
Total value used for rating (Rm) 366,825 421,670
Total land value (Rm)
Total value of improvements (Rm)
Total market value (Rm) 366,825 421,670
Rating:
Residential rate used to determine rate for other
categories? (Y/N) No No No No No No No No No
Differential rates used? (Y/N) Yes Yes Yes Yes Yes Yes Yes Yes Yes
Limit on annual rate increase (s20)? (Y/N) No No No No No No No No No
Special rating area used? (Y/N) Yes Yes Yes Yes Yes Yes Yes Yes Yes
Phasing-in properties s21 (number) No No No No No No No No No
Rates policy accompanying budget? (Y/N) Yes Yes Yes Yes Yes Yes Yes Yes Yes
Fixed amount minimum value (R'000)
Non-residential prescribed ratio s19? (%)
Rate revenue:
Rate revenue budget (R '000) 4,086,153 4,070,801 4,353,757 4,711,969 4,711,969 4,625,172 5,007,906 5,352,702 5,719,985
Rate revenue expected to collect (R'000) 4,086,153 4,070,801 4,353,757 4,711,969 4,711,969 4,625,172 5,007,906 5,352,702 5,719,985
Expected cash collection rate (%) 100.0% 100.0% 100.0% 100.0% 100.0% 100.0% 100.0% 100.0% 100.0%
Special rating areas (R'000)
Rebates, exemptions - indigent (R'000) 430,924 466,744 465,696 365,555 365,555 365,555 204,460 218,567 233,649
Rebates, exemptions - pensioners (R'000) 117,143 126,881 102,919 306,895 306,895 306,895 321,486 343,669 367,382
Rebates, exemptions - bona fide farm. (R'000)
Rebates, exemptions - other (R'000) 438,867 478,348 595,627 585,385 585,385 585,385 1,059,896 1,132,623 1,210,814
Phase-in reductions/discounts (R'000)
Total rebates,exemptns,reductns,discs (R'000) 986,934 1,071,973 1,164,242 1,257,835 1,257,835 1,257,835 1,585,842 1,694,859 1,811,845
Description
Current Year 2012/132013/14 Medium Term Revenue & Expenditure
Framework
101
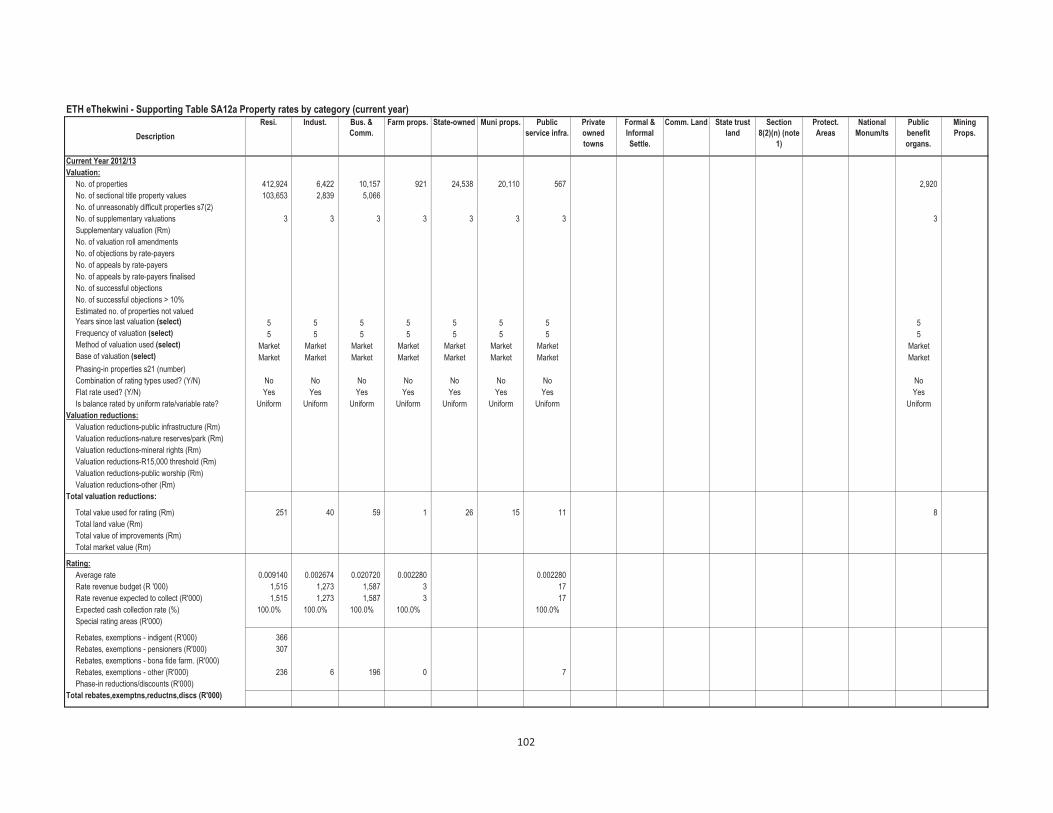
ETH eThekwini - Supporting Table SA12a Property rates by category (current year)
Description
Resi. Indust. Bus. &
Comm.
Farm props. State-owned Muni props. Public
service infra.
Private
owned
towns
Formal &
Informal
Settle.
Comm. Land State trust
land
Section
8(2)(n) (note
1)
Protect.
Areas
National
Monum/ts
Public
benefit
organs.
Mining
Props.
Current Year 2012/13
Valuation:
No. of properties 412,924 6,422 10,157 921 24,538 20,110 567 2,920
No. of sectional title property values 103,653 2,839 5,066
No. of unreasonably difficult properties s7(2)
No. of supplementary valuations 3 3 3 3 3 3 3 3
Supplementary valuation (Rm)
No. of valuation roll amendments
No. of objections by rate-payers
No. of appeals by rate-payers
No. of appeals by rate-payers finalised
No. of successful objections
No. of successful objections > 10%
Estimated no. of properties not valued
Years since last valuation (select) 5 5 5 5 5 5 5 5
Frequency of valuation (select) 5 5 5 5 5 5 5 5
Method of valuation used (select) Market Market Market Market Market Market Market Market
Base of valuation (select) Market Market Market Market Market Market Market Market
Phasing-in properties s21 (number)
Combination of rating types used? (Y/N) No No No No No No No No
Flat rate used? (Y/N) Yes Yes Yes Yes Yes Yes Yes Yes
Is balance rated by uniform rate/variable rate? Uniform Uniform Uniform Uniform Uniform Uniform Uniform Uniform
Valuation reductions:
Valuation reductions-public infrastructure (Rm)
Valuation reductions-nature reserves/park (Rm)
Valuation reductions-mineral rights (Rm)
Valuation reductions-R15,000 threshold (Rm)
Valuation reductions-public worship (Rm)
Valuation reductions-other (Rm)
Total valuation reductions:
Total value used for rating (Rm) 251 40 59 1 26 15 11 8
Total land value (Rm)
Total value of improvements (Rm)
Total market value (Rm)
Rating:
Average rate 0.009140 0.002674 0.020720 0.002280 0.002280
Rate revenue budget (R '000) 1,515 1,273 1,587 3 17
Rate revenue expected to collect (R'000) 1,515 1,273 1,587 3 17
Expected cash collection rate (%) 100.0% 100.0% 100.0% 100.0% 100.0%
Special rating areas (R'000)
Rebates, exemptions - indigent (R'000) 366
Rebates, exemptions - pensioners (R'000) 307
Rebates, exemptions - bona fide farm. (R'000)
Rebates, exemptions - other (R'000) 236 6 196 0 7
Phase-in reductions/discounts (R'000)
Total rebates,exemptns,reductns,discs (R'000)
102
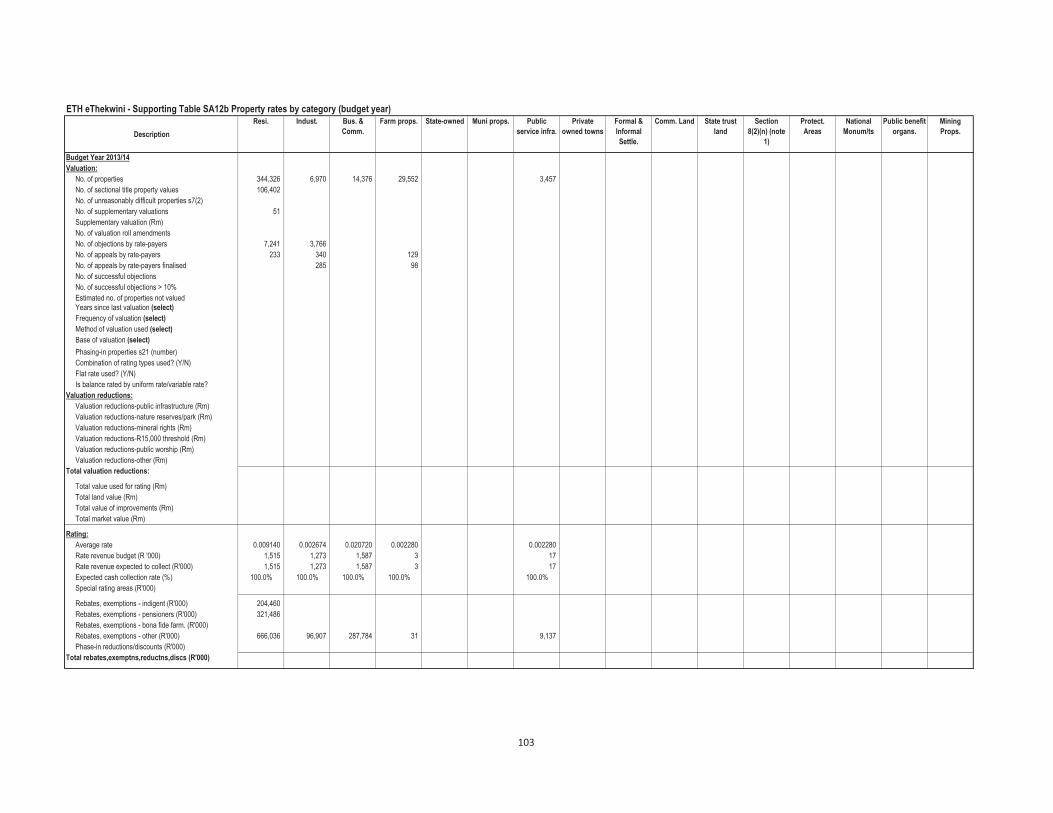
ETH eThekwini - Supporting Table SA12b Property rates by category (budget year)
Description
Resi. Indust. Bus. &
Comm.
Farm props. State-owned Muni props. Public
service infra.
Private
owned towns
Formal &
Informal
Settle.
Comm. Land State trust
land
Section
8(2)(n) (note
1)
Protect.
Areas
National
Monum/ts
Public benefit
organs.
Mining
Props.
Budget Year 2013/14
Valuation:
No. of properties 344,326 6,970 14,376 29,552 3,457
No. of sectional title property values 106,402
No. of unreasonably difficult properties s7(2)
No. of supplementary valuations 51
Supplementary valuation (Rm)
No. of valuation roll amendments
No. of objections by rate-payers 7,241 3,766
No. of appeals by rate-payers 233 340 129
No. of appeals by rate-payers finalised 285 98
No. of successful objections
No. of successful objections > 10%
Estimated no. of properties not valued
Years since last valuation (select)
Frequency of valuation (select)
Method of valuation used (select)
Base of valuation (select)
Phasing-in properties s21 (number)
Combination of rating types used? (Y/N)
Flat rate used? (Y/N)
Is balance rated by uniform rate/variable rate?
Valuation reductions:
Valuation reductions-public infrastructure (Rm)
Valuation reductions-nature reserves/park (Rm)
Valuation reductions-mineral rights (Rm)
Valuation reductions-R15,000 threshold (Rm)
Valuation reductions-public worship (Rm)
Valuation reductions-other (Rm)
Total valuation reductions:
Total value used for rating (Rm)
Total land value (Rm)
Total value of improvements (Rm)
Total market value (Rm)
Rating:
Average rate 0.009140 0.002674 0.020720 0.002280 0.002280
Rate revenue budget (R '000) 1,515 1,273 1,587 3 17
Rate revenue expected to collect (R'000) 1,515 1,273 1,587 3 17
Expected cash collection rate (%) 100.0% 100.0% 100.0% 100.0% 100.0%
Special rating areas (R'000)
Rebates, exemptions - indigent (R'000) 204,460
Rebates, exemptions - pensioners (R'000) 321,486
Rebates, exemptions - bona fide farm. (R'000)
Rebates, exemptions - other (R'000) 666,036 96,907 287,784 31 9,137
Phase-in reductions/discounts (R'000)
Total rebates,exemptns,reductns,discs (R'000)
103

ETH eThekwini - Supporting Table SA13a Service Tariffs by category
2013/14 Medium Term Revenue & Expenditure
Framework
Budget Year
2013/14
Budget Year +1
2014/15
Budget Year +2
2015/16
Property rates (rate in the Rand)
Residential properties 0.9c 0.852c 0.907c 0.914c 0.978c 1.044c 1.12c
Residential properties - vacant land
Formal/informal settlements
Small holdings
Farm properties - used 0.24c 0.213c 0.227c 0.228c 0.244c 0.261c 0.279c
Farm properties - not used
Industrial properties 2.58c 2.493c 2.655c 2.674c 2.859c 3.057c 3.268c
Business and commercial properties 2.01c 1.932c 2.057c 2.072c 2.215c 2.368c 2.532c
Communal land - residential
Communal land - small holdings
Communal land - farm property
Communal land - business and commercial
Communal land - other
State-owned properties
Municipal properties
Public service infrastructure 0.24c 0.213c 0.227c 0.228c 0.244c 0.261c 0.279c
Privately owned towns serviced by the owner
State trust land 3.78c 4.080c 4.345c 4.376c 4.68c 5.00c 5.35c
Restitution and redistribution properties
Protected areas 3.78c 4.080c 4.345c 4.376c 4.68c 5.00c 5.35c
National monuments properties
Exemptions, reductions and rebates (Rands)
Residential properties
R15 000 threshhold rebate 15,000 15,000 15,000 15,000 15,000 15,000 15,000
General residential rebate 58,599,045 456,837,000 507,151,929
Indigent rebate or exemption 430,924,153 466,744,299 507,151,929 365,554,523 389,386,255 414,833,697
Pensioners/social grants rebate or exemption 117,143,366 126,880,793 112,080,777 306,895,028 314,084,884 334,562,376
Temporary relief rebate or exemption
Bona fide farmers rebate or exemption
Other rebates or exemptions
Water tariffs
Domestic
Basic charge/fixed fee (Rands/month) 69 76 83 90 - - -
Service point - vacant land (Rands/month)
Water usage - flat rate tariff (c/kl) Up to 9 KLl - - -
Water usage - life line tariff Up to 9 KLl - - -
Water usage - Block 1 (c/kl) >9 KL up to 25 KL 770 847 997 997 1,229 1,315 1,407
Water usage - Block 2 (c/kl) >25 KL up to 30 KL 1,026 1,129 1,329 1,329 1,637 1,752 1,875
Water usage - Block 3 (c/kl) >30 KL up to 45 KL 1,584 1,741 2,049 2,049 2,524 2,701 2,890
Water usage - Block 4 (c/kl) > 45 KL 1,742 1,914 2,254 2,254 2,777 2,971 3,179
Other
Current Year
2012/13Description
Provide description of
tariff structure where
appropriate
2009/10 2010/11 2011/12
104

ETH eThekwini - Supporting Table SA13a Service Tariffs by category
2013/14 Medium Term Revenue & Expenditure
Framework
Budget Year
2013/14
Budget Year +1
2014/15
Budget Year +2
2015/16
Current Year
2012/13Description
Provide description of
tariff structure where
appropriate
2009/10 2010/11 2011/12
Waste water tariffs
Domestic
Basic charge/fixed fee (Rands/month)
Service point - vacant land (Rands/month)
Waste water - flat rate tariff (c/kl)
Volumetric charge - Block 1 (c/kl) Up to 9 KLl - 410 437 - 350 373 397
Volumetric charge - Block 2 (c/kl) >9 KL up to 25 KL - 545 580 437 670 714 760
Volumetric charge - Block 3 (c/kl) >25 KL up to 30 KL - 841 896 580 1,040 1,108 1,180
Volumetric charge - Block 4 (c/kl) >30 KL up to 45 KL - 927 987 896 1,160 1,235 1,315
Other
Electricity tariffs
Domestic
Basic charge/fixed fee (Rands/month) c/kwh - SCALE 3 and
4-3 Phase and Single
64 79 94 103 111 120 129
Service point - vacant land (Rands/month)
FBE c/kwh - Free Basic
Electricity portion -
64 79 94 103 111 120 129
Life-line tariff - meter (describe structure)
Life-line tariff - prepaid
Flat rate tariff - meter (c/kwh)
Flat rate tariff - prepaid(c/kwh)
Meter - IBT Block 1 (c/kwh) (fill in thresholds)
Meter - IBT Block 2 (c/kwh) (fill in thresholds)
Meter - IBT Block 3 (c/kwh) (fill in thresholds)
Meter - IBT Block 4 (c/kwh) (fill in thresholds)
Meter - IBT Block 5 (c/kwh) (fill in thresholds)
Prepaid - IBT Block 1 (c/kwh) (fill in thresholds)
Prepaid - IBT Block 2 (c/kwh) (fill in thresholds)
Prepaid - IBT Block 3 (c/kwh) (fill in thresholds)
Prepaid - IBT Block 4 (c/kwh) (fill in thresholds)
Prepaid - IBT Block 5 (c/kwh) (fill in thresholds)
Other c/kwh - SCALE 8/9-
Prepaid Electricity
64 79 94 103 111 120 129
Waste management tariffs
Domestic
Street cleaning charge
Basic charge/fixed fee
80l bin - once a week
250l bin - once a week
105

ETH eThekwini - Supporting Table SA13b Service Tariffs by category - explanatory
2013/14 Medium Term Revenue & Expenditure
Framework
Budget Year
2013/14
Budget Year +1
2014/15
Budget Year +2
2015/16
Property rates (rate in the Rand)
Residential properties 0.9c 0.852c 0.907c 0.914c 0.978 1.044 1.12
Agriculture 0.24c 0.213c 0.227c 0.228c 0.244 0.261 0.279
Industrial properties 2.58c 2.493c 2.655c 2.674c 2.859 3.057 3.268
Business and commercial properties 2.01c 1.932c 2.057c 2.072c 2.215 2.368 2.532
Public services infrastructure 0.24c 0.213c 0.227c 0.227c 0.244 0.261 0.279
Vacant Land 3.78c 4.080c 4.345c 4.376c 4.68 5.00 5.35
Nature Reserves/Conservation Areas
Unauthorised/Illegal Development 3.78c 4.080c 4.345c 4.376c 4.68 5.00 5.35
(Rands)
Residential properties
R 15 000 threshhold rebate 456,837,000 466,744,299 507,151,929 560,382,471 596,868,236 635,809,658
General residential rebate
Indigent rebate or exemption 430,924,153 466,744,299 507,151,929 365,554,523 389,386,255 414,833,697
Pensioners rebate or exemption 117,143,366 126,880,793 112,080,777 306,895,028 314,084,884 334,562,376
Water tariffs
Domestic 76 83 90 N/A N/A N/A
Basic charges/fixed fee (Rands/month) Fixed Charge
equal to R 250 000 Up to 9 KLI
Water usage-Property Value >R 250 000 Up to 9 KLI 950 1,040 1,113 1,191
Water usage - Block 1 (c/kl) > 9 KL up to 25 KL 847 927 997 1,122 1,229 1,315 1,407
Water usage - Block 2 (c/kl) > 25 KL up to 30 KL 1,129 1,236 1,329 1,495 1,637 1,752 1,875
Water usage - Block 3 (c/kl) > 30 KL up to 45 KL 1,741 1,906 2,049 2,305 2,524 2,701 2,890
Water usage - Block 4 > 45 KL 1,914 2,096 2,254 2,536 2,777 2,971 3,179
Waste water tariffs
Domestic
Volumetric charge Up to 9 KLI N/A N/A N/A N/A 210 224 239
Volumetric charge - Block 1 (c/kl) > 9 KL up to 25 KL N/A 410 437 465 350 373 397
Volumetric charge - Block 2 (c/kl) > 25 KL up to 30 KL N/A 545 580 618 670 714 760
Volimetric charge - Block 3 (c/kl) > 30 KL up to 45 KL N/A 841 896 954 1,040 1,108 1,180
Volimetric charge - Block 4 (c/kl) > 45 kl N/A 927 987 1,051 1,160 1,235 1,315
Electricity tariffs
Domestic
SCALE 3 and 4-3 Phase and
Phase Residential respectively
Basic charge/fixed fee (Rands/month) 64.30 c/kwh 79.08 c/kwh 93.71 c/kwh 102.89 c/kwh 111.12 c/kwh 120.0 c/kwh 129.0 c/kwh
SCALE 8/9 Prepaid Electricity
Dispensor 64.30 c/kwh 79.08 c/kwh 93.71 c/kwh 102.89 c/kwh 111.12 c/kwh 120.0 c/kwh 129.0 c/kwh
SCALE 12-Free Basic Electricity
customer using less than 150
kwh per month 58.59 c/kwh 65.33 c/kwh 71.54 c/kwh 75.41 c/kwh 81.44 c/kwh 87.95 c/kwh 94.54 c/kwh
FBE Free Basic Electricity portion -
65kwh free per month 64.30 c/kwh 79.08 c/kwh 93.71 c/kwh 102.89 c/kwh 111.12 c/kwh 120.0 c/kwh 129.0 c/kwh
Current Year
2012/13Description
Provide description of tariff
structure where appropriate2009/10 2010/11 2011/12
106

ETH eThekwini - Supporting Table SA13b Service Tariffs by category - explanatory
2013/14 Medium Term Revenue & Expenditure
Framework
Budget Year
2013/14
Budget Year +1
2014/15
Budget Year +2
2015/16
Current Year
2012/13Description
Provide description of tariff
structure where appropriate2009/10 2010/11 2011/12
Waste management tariffs
Domestic
Residential Charge -Rands a) Property value less than and
equal to R 190 000 No Charge No Charge No Charge N/A N/A N/A N/A
a) Property value less than and
equal to R 250 000 N/A N/A N/A No Charge No Charge No Charge No Charge
b) Property value greater than
R 190 000 and less than or
equal to R 300 000 18 19 21 N/A N/A N/A N/A
b) Property value greater than
R 250 000 and less than or
equal to
N/A N/A N/A 22 23 25 27
R 350 000
c) Property value greater than
R 300 000 and less than or
equal to
31 33 35 N/A N/A N/A N/A
R 400 000
c) Property value greater than
R 350 000 and less than or
equal to
N/A N/A N/A 38 40 43 46
R 450 000
d) Property value greater than
R 400 000 and less than or
equal to
40 43 46 N/A N/A N/A N/A
R 500 000
d) Property value greater than
R 450 000 and less than or
equal to
N/A N/A N/A 49 52 56 59
R 550 000
e) Property value greater than
R 500 000 and less than or
equal to
53 57 61 N/A N/A N/A N/A
R 750 000
e) Property value greater than
R 550 000 and less than or
equal to
N/A N/A N/A 65 69 74 79
R 800 000
f) Property value greater than
R 750 000 and less than or
equal
71 76 81 N/A N/A N/A N/A
R 1000 000
f) Property value greater than
R 800 000 and less than or
equal to
N/A N/A N/A 87 93 99 105
R 1 100 000
c) Property value greater than 88 95 101 N/A N/A N/A N/A
R 1000 000
c) Property value greater than N/A N/A N/A 108 115 122 131
R 1 100 000
107

ETH eThekwini - Supporting Table SA14 Household bills
2009/10 2010/11 2011/12 2013/14 Medium Term Revenue & Expenditure Framework
Audited
Outcome
Audited
Outcome
Audited
Outcome
Original
Budget
Adjusted
Budget
Full Year
Forecast
Budget Year
2013/14
Budget Year
2013/14
Budget Year
+1 2014/15
Budget Year
+2 2015/16Rand/cent % incr.
Income Range'
Rates and services charges:
Property rates 434.21 411.80 438.38 441.77 441.77 441.77 6.9% 472.25 504.84 539.67
Electricity: Basic levy
Electricity: Consumption 642.96 790.80 937.10 1040.18 1,040.18 1,040.18 5.5% 1,097.39 1,185.18 1,274.07
Water: Basic levy 76.16 83.43 89.71 0.00 – – –
Water: Consumption 191.78 210.12 225.97 339.77 339.77 339.77 9.5% 372.05 398.09 423.97
Sanitation – 69.64 74.19 78.98 78.98 78.98 6.9% 84.83 90.34 96.22
Refuse removal 53.00 56.97 60.67 64.92 64.92 64.92 6.9% 69.40 73.91 78.72
Other
sub-total 1,398.11 1,622.76 1,826.02 1,965.62 1,965.62 1,965.62 6.6% 2,095.92 2,252.36 2,412.65
VAT on Services 134.95 169.53 194.27 213.24 213.24 213.24 230.95 248.81 266.92
Total large household bill: 1,533.06 1,792.29 2,020.29 2,178.86 2,178.86 2,178.86 6.8% 2,326.87 2,501.17 2,679.57
% increase/-decrease 16.9% 12.7% 7.8% – – 6.8% 7.5% 7.1%
'Affordable Range'
Rates and services charges:
Property rates 284.40 269.80 287.22 289.43 289.43 289.43 6.9% 309.40 330.75 353.57
Electricity: Basic levy
Electricity: Consumption 321.48 395.40 468.55 520.09 520.09 520.09 5.5% 548.70 592.59 637.04
Water: Basic levy 76.16 83.43 89.71 0.00 – – –
Water: Consumption 135.40 148.32 159.52 265.02 265.02 265.02 9.5% 290.19 310.51 330.69
Sanitation – 49.20 52.44 55.85 55.85 55.85 6.9% 59.70 63.58 67.71
Refuse removal 40.00 43.00 45.80 49.01 49.01 49.01 6.9% 52.39 55.80 59.42
Other
sub-total 857.44 989.15 1,103.24 1,179.40 1,179.40 1,179.40 6.9% 1,260.38 1,353.23 1,448.43
VAT on Services 80.23 100.71 114.24 124.60 124.60 124.60 134.96 145.26 155.72
Total small household bill: 937.67 1,089.86 1,217.48 1,304.00 1,304.00 1,304.00 7.0% 1,395.34 1,498.49 1,604.15
% increase/-decrease 16.2% 11.7% 7.1% – – 7.0% 7.4% 7.1%
-0.28 -0.39 -1.00 -
'Indigent' Household receiving free basic
Rates and services charges:
Property rates 134.72 127.80 136.05 137.10 137.10 137.10 6.9% 146.56 156.67 167.48
Electricity: Basic levy
Electricity: Consumption 225.04 276.78 327.99 364.07 364.07 364.07 5.5% 384.09 414.82 445.93
Water: Basic levy 76.16 83.43 89.71 0.00 – – –
Water: Consumption 93.17 101.97 109.67 208.92 208.92 208.92 9.5% 228.77 244.78 260.69
Sanitation – 33.83 36.05 38.41 38.41 38.41 6.9% 41.00 43.67 46.50
Refuse removal 18.00 19.35 20.61 22.05 22.05 22.05 6.9% 23.57 25.10 26.73
Other
sub-total 547.09 643.16 720.08 770.55 770.55 770.55 6.9% 823.99 885.04 947.33
VAT on Services 57.73 72.15 81.76 88.68 88.68 88.68 96.12 103.46 110.91
Total small household bill: 604.82 715.31 801.84 859.23 859.23 859.23 7.1% 920.11 988.50 1,058.24
% increase/-decrease 18.3% 12.1% 7.2% – – 7.1% 7.4% 7.1%
DescriptionCurrent Year 2012/13
108

ETH eThekwini - Supporting Table SA15 Investment particulars by type
2009/10 2010/11 2011/12
Audited
Outcome
Audited
Outcome
Audited
Outcome
Original
Budget
Adjusted
Budget
Full Year
Forecast
Budget Year
2013/14
Budget Year
+1 2014/15
Budget Year
+2 2015/16
R thousand
Parent municipality
Securities - National Government – – –
Listed Corporate Bonds
Deposits - Bank 1,645,000 3,040,000 3,500,000 3,700,000 5,000,000 5,000,000 5,500,000 5,700,000 6,000,000
Deposits - Public Investment Commissioners
Deposits - Corporation for Public Deposits
Bankers Acceptance Certificates
Negotiable Certificates of Deposit - Banks
Guaranteed Endowment Policies (sinking)
Repurchase Agreements - Banks 27,044 – –
Municipal Bonds
Municipality sub-total 1,672,044 3,040,000 3,500,000 3,700,000 5,000,000 5,000,000 5,500,000 5,700,000 6,000,000
Consolidated total: 1,672,044 3,040,000 3,500,000 3,700,000 5,000,000 5,000,000 5,500,000 5,700,000 6,000,000
Investment type
Current Year 2012/132013/14 Medium Term Revenue &
Expenditure Framework
109

ETH eThekwini - Supporting Table SA16 Investment particulars by maturity
Investments by MaturityPeriod of
Investment
Capital
Guarantee
(Yes/ No)
Variable or
Fixed
interest rate
Commission
Paid (Rands)
Commission
Recipient
Monetary
value
Interest to
be realised
Name of institution & investment ID Yrs/Months Rand thousand
Parent municipality
Funds Re Investments - Deposit Various Fixed Yes Fixed No No Various 5,500,000 275,000
Municipality sub-total 5,500,000 275,000
TOTAL INVESTMENTS AND INTEREST 5,500,000 275,000
Type of
Investment
Expiry date
of
investment
110
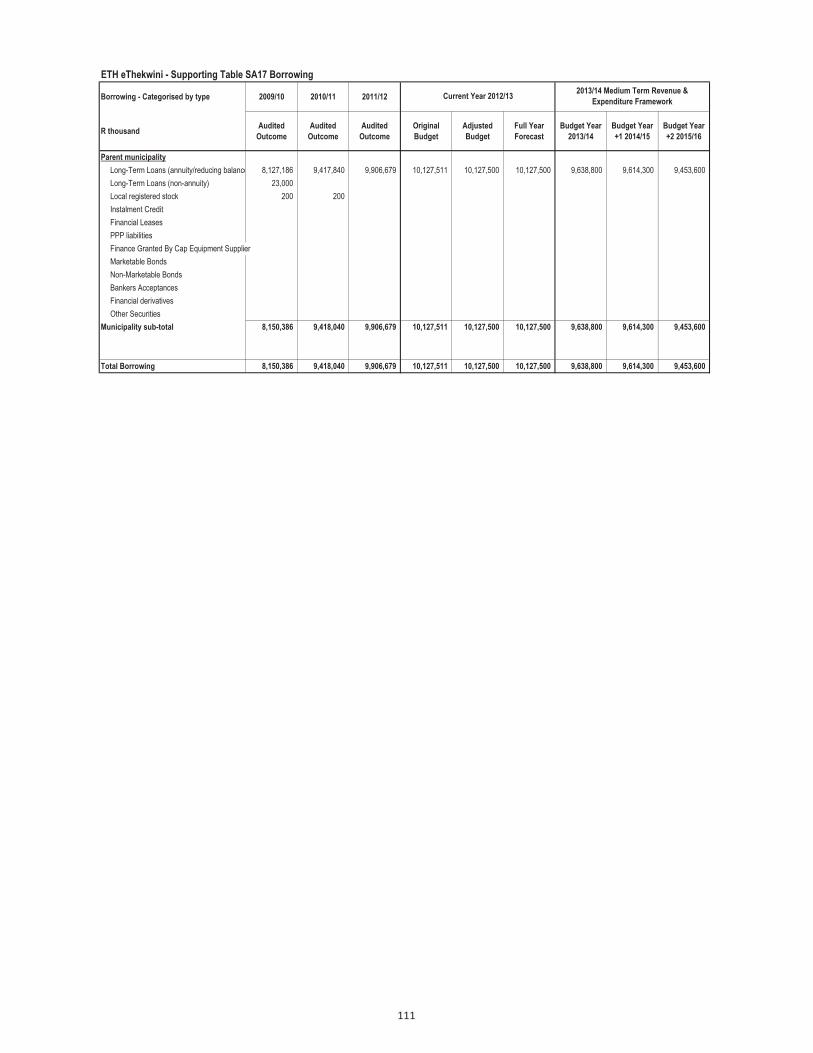
ETH eThekwini - Supporting Table SA17 Borrowing
Borrowing - Categorised by type 2009/10 2010/11 2011/12
R thousandAudited
Outcome
Audited
Outcome
Audited
Outcome
Original
Budget
Adjusted
Budget
Full Year
Forecast
Budget Year
2013/14
Budget Year
+1 2014/15
Budget Year
+2 2015/16
Parent municipality
Long-Term Loans (annuity/reducing balance) 8,127,186 9,417,840 9,906,679 10,127,511 10,127,500 10,127,500 9,638,800 9,614,300 9,453,600
Long-Term Loans (non-annuity) 23,000
Local registered stock 200 200
Instalment Credit
Financial Leases
PPP liabilities
Finance Granted By Cap Equipment Supplier
Marketable Bonds
Non-Marketable Bonds
Bankers Acceptances
Financial derivatives
Other Securities
Municipality sub-total 8,150,386 9,418,040 9,906,679 10,127,511 10,127,500 10,127,500 9,638,800 9,614,300 9,453,600
Total Borrowing 8,150,386 9,418,040 9,906,679 10,127,511 10,127,500 10,127,500 9,638,800 9,614,300 9,453,600
Current Year 2012/132013/14 Medium Term Revenue &
Expenditure Framework
111

ETH eThekwini - Supporting Table SA18 Transfers and grant receipts
Description 2009/10 2010/11 2011/12
R thousandAudited
Outcome
Audited
Outcome
Audited
OutcomeOriginal Budget
Adjusted
Budget
Full Year
Forecast
Budget Year
2013/14
Budget Year +1
2014/15
Budget Year +2
2015/16
RECEIPTS:
Operating Transfers and Grants
National Government: 1,148,170 1,476,613 1,593,483 1,886,384 1,990,005 1,914,807 1,950,205 2,081,249 2,257,894
Local Government Equitable Share 1,068,190 1,368,401 1,526,576 1,698,832 1,698,831 1,698,832 1,797,179 1,913,706 2,019,594
RSC Levy Replacement –
Finance Management 750 1,000 15,750 1,500 1,500 1,500 1,250 1,250 1,250
Water Services Operating Subsidy 151 –
Urban Settlements Development 9,064 76,314 11,564 – – –
Municipal Infrastructure Grant 4,990 5,058 –
NRF 48 49 24
2010 FIFA World Cup 60,000 26,000
DLGTA 6,925
EPWP 16,105 42,356 47,882 42,356 47,381 – –
NDOT 19,075 44,208 –
Infrastructure Skills Development 25,930 25,930 22,930 33,000 55,473 74,337
DME 1,000
Public Transport 14,040 40,925 108,703 109,626 108,703 71,395 110,820 162,713
2013 AFCON 28,923 28,923
Provincial Government: 249,575 187,098 149,381 235,832 269,332 218,420 400,269 349,134 262,854
Health subsidy 50,745 44,540 56,111 69,573 69,573 69,573 73,051 76,703 78,264
Housing 196,771 120,000 61,541 123,463 133,463 125,313 285,950 225,917 141,667
Art and Culture 397 2,914 4,983 36,665 40,164 4,034 36,268 41,214 37,304
Office of the Premier : KZN 142 282 282 – – – –
Local Government and Traditional Affairs 1,662 16,800 5,000
KZNPA Subsidy 2,702 26,746 5,850 20,850 19,500 5,000 5,300 5,618
Public Transport –
Other grant providers: 30,248 21,089 97,585 4,747 7,014 6,948 9,164 17,194 22,228
European Union 1,338 83 1,500 1,917 1,500 1,500 – –
Public Sponsorship 10 226 301 1,226 1,240 1,254 1,254
ECORAT 81 –
DANIDA 3,523 5,113 –
DLGTA 500 500 500
DBSA 436 350 –
Public Contribution 2,782 2,666 23 – 200 200 200
DMOSS 450 –
International World Maths 520 –
HENVINET 67 –
Developers Contribution 12,039 2,319 2,752 –
Department of Environment Affairs and Tourism 1,200 9,549 1,021 1,021 1,021 1,082 1,147 1,147
CIFAL 560 11 2,011 2,000 2,000 2,000 2,000 2,000 2,000
Rockerfeller Foundation 1,488 –
ACCA 20 70 70
Fire Learnership 2,324 –
Mondi Paper 6,577 919 683 –
CARNEGIE 5,485 180
LGSETA 564 9 – 31 33 34 37
Leeds Grant 152
Technology Innovation AG 2,259
LTDF 525
UNESCO 192
DIRCO 80,365
Restoration : Green Fund 500 600 2,609 12,559 17,590
Total Operating Transfers and Grants 1,427,992 1,684,799 1,840,449 2,126,964 2,266,351 2,140,176 2,359,637 2,447,577 2,542,976
Capital Transfers and Grants
National Government: 1,942,195 797,474 1,342,046 1,854,077 1,834,857 1,851,577 2,404,086 2,872,101 2,997,479
Municipal Infrastructure Grant 525,700 590,854 1,067,074 –
Urban Settlements Development 1,278,496 1,239,615 1,275,996 1,580,999 1,800,075 1,863,667
Public Transport and Systems 562,886 70,000 160,792 490,000 495,760 490,000 707,366 884,751 937,287
Water Affairs 56,015 13,363 4,000 –
2010 FIFA World Cup Stadiums Development 465,393 14,789 –
Equitable Share 58,806 46,134 55,226 70,580 70,580 70,580 72,627 77,275 81,525
Levy Replacement –
Electricity Demand Side Management 24,000 10,000 5,000
Electrification Programme 35,000 30,500 5,000 5,000 5,000 20,000 35,000 40,000
Minerals and Energy 57,600 13,902
Expanded Public Works 43,243 1,554 –
Disater Funds –
Neighbourhood Development Partnership 172,553 25,781 10,000 10,000 10,000 3,555 70,000 75,000
Intergrated City Development 9,539
Sanedi Grant 454
Provincial Government: 165,993 197,077 31,954 977,000 981,864 950,782 761,883 703,936 1,068,824 Sport and Recreation 50,000 ICT 1,531 1,586 Department of Information Technology 2,989 Art and Culture 9,726 56,500 61,364 15,380 122,577 126,349 127,324 Local Government and Traditional Affairs 2,989 Trade and Industry 108,484 Housing 119,401 920,500 920,500 920,500 639,306 577,587 941,500 Department of Minerals and Energy 25,000 21,000 14,902 2010 KZN Provincial Grant 50,497 Municipal Transport Authority 591 1,228
Other grant providers: 77,083 25,935 2,922 – 70,223 6,948 17,463 5,276 17,989
European Union 708
DANIDA 14,697 5,590
Tsonga Sun 23,000 59,500
Lotto 4,100 13,200 1,000 6,300
Royal Netherlands 2,773 1,667 1,233
Nature Reserve 5,157 2,863 2,863
Municipal Transport Authority 1,881
Dubai Municiopality 17
Cell Operator(Vodacom) 2,543 4,166
Public Contributions 10,194 1,689 3,485 3,485 263 276 289
AFD 22,915
Schools Projects 2,641
CCTV Images 135
CARNEGIE 600 4,000 4,000 11,400
Massification 5,000
Trade and Investments 209
Total Capital Transfers and Grants 2,185,271 1,020,486 1,376,922 2,831,077 2,886,944 2,809,306 3,183,432 3,581,313 4,084,292
TOTAL RECEIPTS OF TRANSFERS & GRANTS 3,613,263 2,705,285 3,217,371 4,958,040 5,153,296 4,949,482 5,543,069 6,028,890 6,627,268
Current Year 2012/132013/14 Medium Term Revenue & Expenditure
Framework
112
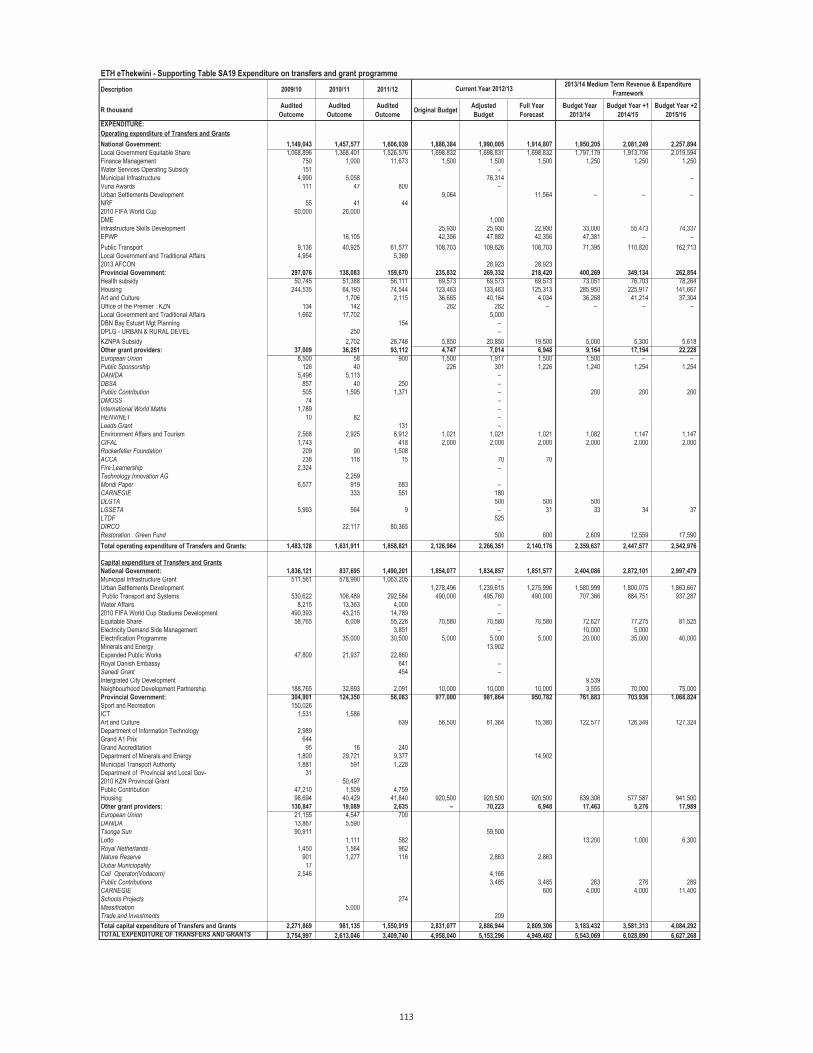
ETH eThekwini - Supporting Table SA19 Expenditure on transfers and grant programme
Description 2009/10 2010/11 2011/12
R thousandAudited
Outcome
Audited
Outcome
Audited
OutcomeOriginal Budget
Adjusted
Budget
Full Year
Forecast
Budget Year
2013/14
Budget Year +1
2014/15
Budget Year +2
2015/16
EXPENDITURE:
Operating expenditure of Transfers and Grants
National Government: 1,149,043 1,457,577 1,606,039 1,886,384 1,990,005 1,914,807 1,950,205 2,081,249 2,257,894
Local Government Equitable Share 1,068,896 1,368,401 1,526,576 1,698,832 1,698,831 1,698,832 1,797,179 1,913,706 2,019,594
Finance Management 750 1,000 11,673 1,500 1,500 1,500 1,250 1,250 1,250
Water Services Operating Subsidy 151 –
Municipal Infrastructure 4,990 5,058 76,314 –
Vuna Awards 111 47 800 –
Urban Settlements Development 9,064 11,564 – – –
NRF 55 41 44
2010 FIFA World Cup 60,000 26,000
DME 1,000
Infrastructure Skills Development 25,930 25,930 22,930 33,000 55,473 74,337
EPWP 16,105 42,356 47,882 42,356 47,381 – –
Public Transport 9,136 40,925 61,577 108,703 109,626 108,703 71,395 110,820 162,713
Local Government and Traditional Affairs 4,954 5,369
2013 AFCON 28,923 28,923
Provincial Government: 297,076 138,083 159,670 235,832 269,332 218,420 400,269 349,134 262,854
Health subsidy 50,745 51,388 56,111 69,573 69,573 69,573 73,051 76,703 78,264
Housing 244,535 64,193 74,544 123,463 133,463 125,313 285,950 225,917 141,667
Art and Culture 1,706 2,115 36,665 40,164 4,034 36,268 41,214 37,304
Office of the Premier : KZN 134 142 282 282 – – – –
Local Government and Traditional Affairs 1,662 17,702 5,000
DBN Bay Estuart Mgt Planning 154 –
DPLG - URBAN & RURAL DEVEL 250 –
KZNPA Subsidy 2,702 26,746 5,850 20,850 19,500 5,000 5,300 5,618
Other grant providers: 37,009 36,251 93,112 4,747 7,014 6,948 9,164 17,194 22,228
European Union 8,500 58 900 1,500 1,917 1,500 1,500 – –
Public Sponsorship 126 40 226 301 1,226 1,240 1,254 1,254
DANIDA 5,496 5,113 –
DBSA 857 40 250 –
Public Contribution 505 1,595 1,371 – 200 200 200
DMOSS 74 –
International World Maths 1,789 –
HENVINET 10 82 –
Leeds Grant 131 –
Environment Affairs and Tourism 2,568 2,925 6,912 1,021 1,021 1,021 1,082 1,147 1,147
CIFAL 1,743 418 2,000 2,000 2,000 2,000 2,000 2,000
Rockerfeller Foundation 209 90 1,508
ACCA 238 116 15 70 70
Fire Learnership 2,324 –
Technology Innovation AG 2,259
Mondi Paper 6,577 919 683 –
CARNEGIE 333 551 180
DLGTA 500 500 500
LGSETA 5,993 564 9 – 31 33 34 37
LTDF 525
DIRCO 22,117 80,365
Restoration : Green Fund 500 600 2,609 12,559 17,590
Total operating expenditure of Transfers and Grants: 1,483,128 1,631,911 1,858,821 2,126,964 2,266,351 2,140,176 2,359,637 2,447,577 2,542,976
Capital expenditure of Transfers and Grants
National Government: 1,836,121 837,695 1,490,201 1,854,077 1,834,857 1,851,577 2,404,086 2,872,101 2,997,479
Municipal Infrastructure Grant 511,561 578,990 1,063,205 –
Urban Settlements Development 1,278,496 1,239,615 1,275,996 1,580,999 1,800,075 1,863,667
Public Transport and Systems 530,622 106,489 292,584 490,000 495,760 490,000 707,366 884,751 937,287
Water Affairs 8,215 13,363 4,000 –
2010 FIFA World Cup Stadiums Development 490,393 43,215 14,789 –
Equitable Share 58,765 6,009 55,226 70,580 70,580 70,580 72,627 77,275 81,525
Electricity Demand Side Management 3,851 – 10,000 5,000
Electrification Programme 35,000 30,500 5,000 5,000 5,000 20,000 35,000 40,000
Minerals and Energy 13,902
Expanded Public Works 47,800 21,937 22,860
Royal Danish Embassy 641 –
Sanedi Grant 454 –
Intergrated City Development 9,539
Neighbourhood Development Partnership 188,765 32,693 2,091 10,000 10,000 10,000 3,555 70,000 75,000
Provincial Government: 304,901 124,350 58,083 977,000 981,864 950,782 761,883 703,936 1,068,824
Sport and Recreation 150,026
ICT 1,531 1,586
Art and Culture 639 56,500 61,364 15,380 122,577 126,349 127,324
Department of Information Technology 2,989
Grand A1 Prix 644
Grand Accreditation 95 16 240
Department of Minerals and Energy 1,800 29,721 9,377 14,902
Municipal Transport Authority 1,881 591 1,228
Department of Provincial and Local Gov- 31
2010 KZN Provincial Grant 50,497
Public Contribution 47,210 1,509 4,759
Housing 98,694 40,429 41,840 920,500 920,500 920,500 639,306 577,587 941,500
Other grant providers: 130,847 19,089 2,635 – 70,223 6,948 17,463 5,276 17,989
European Union 21,155 4,547 700
DANIDA 13,867 5,590
Tsonga Sun 90,911 59,500
Lotto 1,111 582 13,200 1,000 6,300
Royal Netherlands 1,450 1,564 962
Nature Reserve 901 1,277 116 2,863 2,863
Dubai Municiopality 17
Cell Operator(Vodacom) 2,546 4,166
Public Contributions 3,485 3,485 263 276 289
CARNEGIE 600 4,000 4,000 11,400
Schools Projects 274
Massification 5,000
Trade and Investments 209
Total capital expenditure of Transfers and Grants 2,271,869 981,135 1,550,919 2,831,077 2,886,944 2,809,306 3,183,432 3,581,313 4,084,292
TOTAL EXPENDITURE OF TRANSFERS AND GRANTS 3,754,997 2,613,046 3,409,740 4,958,040 5,153,296 4,949,482 5,543,069 6,028,890 6,627,268
Current Year 2012/132013/14 Medium Term Revenue & Expenditure
Framework
113

ETH eThekwini - Supporting Table SA20 Reconciliation of transfers, grant receipts and unspent funds
Description 2009/10 2010/11 2011/12
R thousandAudited
Outcome
Audited
Outcome
Audited
Outcome
Original
Budget
Adjusted
Budget
Full Year
Forecast
Budget Year
2013/14
Budget Year
+1 2014/15
Budget Year
+2 2015/16
Operating transfers and grants:
National Government:
Balance unspent at beginning of the year 54,412 53,539 72,575
Current year receipts 1,148,170 1,476,613 1,593,483 1,886,384 1,990,006 1,914,807 1,950,205 2,081,249 2,257,894
Conditions met - transferred to revenue 1,149,043 1,457,577 1,606,039 1,886,384 1,990,006 1,914,807 1,950,205 2,081,249 2,257,894
Conditions still to be met - transferred to liabilities 53,539 72,575 60,019
Provincial Government:
Balance unspent at beginning of the year 59,122 9,053 56,344
Current year receipts 249,575 188,298 158,931 236,853 270,353 199,941 396,351 344,981 258,383
Conditions met - transferred to revenue 299,644 141,007 166,582 236,853 270,353 218,420 400,269 349,134 262,854
Conditions still to be met - transferred to liabilities 9,053 56,344 48,693
District Municipality:
Balance unspent at beginning of the year
Current year receipts
Conditions met - transferred to revenue – – – – – – – – –
Conditions still to be met - transferred to liabilities
Other grant providers:
Balance unspent at beginning of the year 52,204 48,011 34,574 36,409
Current year receipts 30,248 19,889 88,036 3,726 5,993 25,427 13,081 21,347 26,699
Conditions met - transferred to revenue 34,441 33,326 86,201 3,726 5,993 6,948 9,164 17,194 22,228
Conditions still to be met - transferred to liabilities 48,011 34,574 36,409
Total operating transfers and grants revenue 1,483,127 1,631,910 1,858,822 2,126,964 2,266,352 2,140,176 2,359,637 2,447,577 2,542,976
Total operating transfers and grants - CTBM 110,603 163,493 145,121 – – – – – –
Capital transfers and grants:
National Government:
Balance unspent at beginning of the year 256,494 362,568 322,347 198,244 295,579 150,464 59,814
Current year receipts 1,942,195 797,474 1,342,046 1,854,077 1,834,857 1,851,577 2,404,086 2,872,101 2,997,479
Conditions met - transferred to revenue 1,836,121 837,695 1,490,201 1,854,077 1,834,857 1,754,242 2,419,086 2,872,101 2,997,479
Conditions still to be met - transferred to liabilities 362,568 322,347 198,244 295,579 150,464 109,814 87,852
Provincial Government:
Balance unspent at beginning of the year 325,686 186,778 259,505 233,376 186,921 149,536 140,186
Current year receipts 165,993 197,077 31,954 977,000 981,864 950,782 761,883 703,936 1,068,824
Conditions met - transferred to revenue 304,901 124,350 58,083 977,000 981,864 997,237 799,268 713,286 1,096,862
Conditions still to be met - transferred to liabilities 186,778 259,505 233,376 186,921 149,536 140,186 112,148
District Municipality:
Balance unspent at beginning of the year
Current year receipts
Conditions met - transferred to revenue – – – – – – – – –
Conditions still to be met - transferred to liabilities
Other grant providers:
Balance unspent at beginning of the year 66,540 12,776 22,393 22,680
Current year receipts 77,083 25,935 2,922 6,557 6,948 17,463 5,276 17,989
Conditions met - transferred to revenue 130,847 19,089 2,635 – 6,557 29,628 17,463 5,276 17,989
Conditions still to be met - transferred to liabilities 12,776 22,393 22,680
Total capital transfers and grants revenue 2,271,869 981,135 1,550,919 2,831,077 2,823,278 2,781,106 3,235,817 3,590,663 4,112,330
Total capital transfers and grants - CTBM 562,122 604,245 454,300 – – 482,500 300,000 250,000 200,000
TOTAL TRANSFERS AND GRANTS REVENUE 3,754,997 2,613,045 3,409,741 4,958,040 5,089,630 4,921,282 5,595,454 6,038,240 6,655,306
TOTAL TRANSFERS AND GRANTS - CTBM 672,725 767,738 599,421 – – 482,500 300,000 250,000 200,000
Current Year 2012/132013/14 Medium Term Revenue &
Expenditure Framework
114
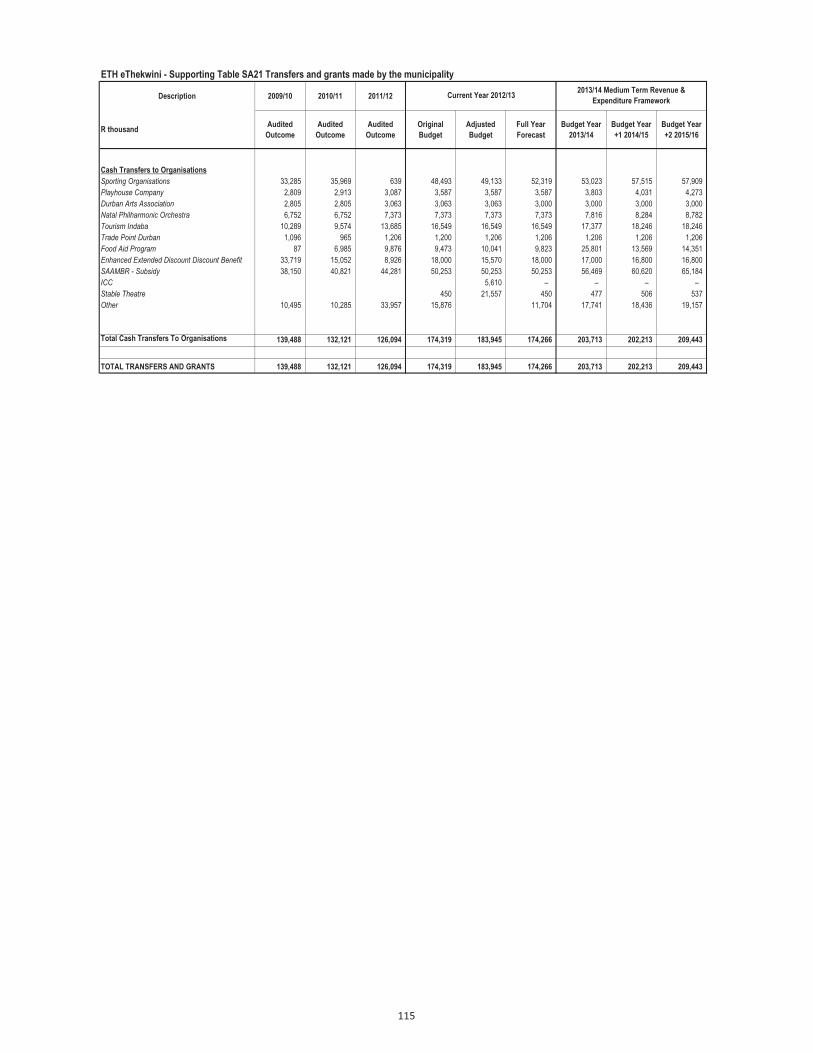
ETH eThekwini - Supporting Table SA21 Transfers and grants made by the municipality
Description 2009/10 2010/11 2011/12
R thousandAudited
Outcome
Audited
Outcome
Audited
Outcome
Original
Budget
Adjusted
Budget
Full Year
Forecast
Budget Year
2013/14
Budget Year
+1 2014/15
Budget Year
+2 2015/16
Cash Transfers to Organisations
Sporting Organisations 33,285 35,969 639 48,493 49,133 52,319 53,023 57,515 57,909
Playhouse Company 2,809 2,913 3,087 3,587 3,587 3,587 3,803 4,031 4,273
Durban Arts Association 2,805 2,805 3,063 3,063 3,063 3,000 3,000 3,000 3,000
Natal Philharmonic Orchestra 6,752 6,752 7,373 7,373 7,373 7,373 7,816 8,284 8,782
Tourism Indaba 10,289 9,574 13,685 16,549 16,549 16,549 17,377 18,246 18,246
Trade Point Durban 1,096 965 1,206 1,200 1,206 1,206 1,206 1,206 1,206
Food Aid Program 87 6,985 9,876 9,473 10,041 9,823 25,801 13,569 14,351
Enhanced Extended Discount Discount Benefit 33,719 15,052 8,926 18,000 15,570 18,000 17,000 16,800 16,800
SAAMBR - Subsidy 38,150 40,821 44,281 50,253 50,253 50,253 56,469 60,620 65,184
ICC 5,610 – – – –
Stable Theatre 450 21,557 450 477 506 537
Other 10,495 10,285 33,957 15,876 11,704 17,741 18,436 19,157
Total Cash Transfers To Organisations 139,488 132,121 126,094 174,319 183,945 174,266 203,713 202,213 209,443
TOTAL TRANSFERS AND GRANTS 139,488 132,121 126,094 174,319 183,945 174,266 203,713 202,213 209,443
Current Year 2012/132013/14 Medium Term Revenue &
Expenditure Framework
115

ETH eThekwini - Supporting Table SA22 Summary councillor and staff benefits
Summary of Employee and Councillor remuneration 2009/10 2010/11 2011/12
R thousandAudited
Outcome
Audited
Outcome
Audited
Outcome
Original
Budget
Adjusted
Budget
Full Year
Forecast
Budget Year
2013/14
Budget Year
+1 2014/15
Budget Year
+2 2015/16
A B C D E F G H I
Councillors (Political Office Bearers plus Other)
Basic Salaries and Wages 45,339 50,515 56,889 54,876 54,876 43,977 57,250 61,303 64,575
Pension and UIF Contributions 5,719 5,917 4,973 5,462 5,462 5,462 5,782 6,120 6,432
Medical Aid Contributions 474 1,706 3,321 1,528 1,528 1,528 1,617 1,710 1,784
Motor Vehicle Allowance 16,831 17,611 19,569 19,334 19,334 18,474 20,470 21,315 22,250
Cellphone Allowance 2,566 2,566 2,566 2,717 2,878 3,034
Housing Allowances
Other benefits and allowances 3,383 2,171 – – – – 16,680 17,466 19,207
Sub Total - Councillors 71,746 77,920 84,752 83,766 83,766 72,008 104,516 110,792 117,282
% increase 8.6% 8.8% (1.2%) – (14.0%) 45.1% 6.0% 5.9%
Senior Managers of the Municipality
Basic Salaries and Wages 13,429 13,430 13,493 15,460 14,642 14,720 15,203 16,267 17,325
Pension and UIF Contributions 614 760 696 1,448 1,232 1,250 1,774 1,889 2,012
Medical Aid Contributions 207 264 225 284 265 270 352 375 399
Overtime –
Performance Bonus 1,218 832 994 1,125 1,063 1,100 1,099 1,170 1,246
Motor Vehicle Allowance 2,281 2,106 1,829 3,191 2,896 2,950 3,436 3,659 3,897
Cellphone Allowance 102 127 127
Other benefits and allowances 1,524 1,769 1,656 1,886 1,769 1,850 2,151 2,291 2,440
Sub Total - Senior Managers of Municipality 19,273 19,161 18,893 23,497 21,994 22,267 24,015 25,651 27,319
% increase (0.6%) (1.4%) 24.4% (6.4%) 1.2% 7.9% 6.8% 6.5%
Other Municipal Staff
Basic Salaries and Wages 2,917,134 3,433,681 5,071,887 4,295,565 4,269,566 4,028,506 4,619,152 5,037,825 5,305,963
Pension and UIF Contributions 549,981 578,480 591,566 719,163 746,809 717,725 829,798 888,609 948,908
Medical Aid Contributions 274,990 212,779 305,642 371,648 385,857 370,824 427,179 459,114 490,269
Overtime 320,822 327,230 236,626 285,259 298,723 287,089 330,719 355,443 379,563
Performance Bonus 6,867 7,230 6,870 7,120 7,385 7,476
Motor Vehicle Allowance 137,495 –
Cellphone Allowance 9,725 4,605 12,503 13,272 12,579 13,124 13,526 13,874
Housing Allowances 45,831 18,723 16,821 22,922 20,255 20,075 23,593 29,948 33,615
Other benefits and allowances 265,267 155,121 207,048 248,265 258,271 248,213 285,934 307,310 328,164
Payments in lieu of leave 67,695 22,652 10,832 11,265 10,460 10,862 11,212 11,368
Long service awards 845 872 856 867 873 881
Post-retirement benefit obligations
Sub Total - Other Municipal Staff 4,521,245 4,793,709 6,456,847 5,973,870 6,012,120 5,703,197 6,548,348 7,111,245 7,520,081
% increase 6.0% 34.7% (7.5%) 0.6% (5.1%) 14.8% 8.6% 5.7%
Total Parent Municipality 4,612,264 4,890,790 6,560,492 6,081,133 6,117,880 5,797,472 6,676,879 7,247,688 7,664,682
6.0% 34.1% (7.3%) 0.6% (5.2%) 15.2% 8.5% 5.8%
Board Members of Entities
Board Fees 359 483 648 290 290 412 469 485 501
Sub Total - Board Members of Entities 359 483 648 290 290 412 469 485 501
% increase 34.5% 34.2% (55.2%) – 42.1% 13.8% 3.3% 3.4%
Senior Managers of Entities
Basic Salaries and Wages 8,811 8,229 9,153 11,873 11,432 10,750 11,670 12,370 13,112
Pension and UIF Contributions 992 795 767 1,390 1,349 1,057 1,194 1,265 1,342
Medical Aid Contributions 50 121 101 64 64 130 134 142 150
Performance Bonus 221 258 1,264 1,182 572 572 612 655
Motor Vehicle Allowance 278 36 60 150 145 74 79 84 89
Sub Total - Senior Managers of Entities 10,352 9,181 10,339 14,741 14,172 12,583 13,649 14,474 15,348
% increase (11.3%) 12.6% 42.6% (3.9%) (11.2%) 8.5% 6.0% 6.0%
Other Staff of Entities
Basic Salaries and Wages 70,360 77,462 76,489 79,046 79,611 74,219 80,780 85,439 90,846
Pension and UIF Contributions 6,567 8,062 6,458 9,021 8,965 10,120 9,835 10,811 11,397
Medical Aid Contributions 1,034 1,007 885 290 271 1,257 1,345 1,439 1,539
Overtime 2,565 2,791 3,568 2,013 2,013 2,017 1,868 1,983 2,103
Performance Bonus 97 619 873 1,690 1,580 2,013 2,012 1,848 1,656
Other benefits and allowances 1,826 1,886 1,679
Sub Total - Other Staff of Entities 82,449 91,827 89,952 92,060 92,440 89,626 95,840 101,521 107,541
% increase 11.4% (2.0%) 2.3% 0.4% (3.0%) 6.9% 5.9% 5.9%
Total Municipal Entities 93,160 101,491 100,939 107,091 106,902 102,621 109,958 116,479 123,390
TOTAL SALARY, ALLOWANCES & BENEFITS4,705,424 4,992,281 6,661,431 6,188,224 6,224,782 5,900,093 6,786,837 7,364,167 7,788,072
% increase 6.1% 33.4% (7.1%) 0.6% (5.2%) 15.0% 8.5% 5.8%
TOTAL MANAGERS AND STAFF 4,633,319 4,913,878 6,576,031 6,104,168 6,140,726 5,827,673 6,681,852 7,252,891 7,670,289
Current Year 2012/132013/14 Medium Term Revenue & Expenditure
Framework
116

ETH eThekwini - Supporting Table SA23 Salaries, allowances & benefits (political office bearers/councillors/senior managers)
Disclosure of Salaries, Allowances & Benefits 1.Contributions In-kind benefits Total Package
Rand per annum 1. 2.
Councillors
Speaker 1 513,216 94,260 282,602 890,078
Chief Whip 1 480,204 89,310 208,676 778,190
Executive Mayor 1 645,276 114,072 290,872 1,050,220
Deputy Executive Mayor 1 513,216 94,260 221,338 828,814
Executive Committee 10 2,520,372 327,192 1,043,386 3,890,950
Total for all other councillors 191 46,015,868 7,055,624 44,005,902 97,077,394
Total Councillors 205 50,688,152 7,774,718 46,052,776 104,515,646
Senior Managers of the Municipality
Municipal Manager (MM) 1 2,213,055 190,856 166,340 2,570,251
Chief Finance Officer 1 1,140,328 253,810 743,569 79,823 2,217,530
Deputy City Manager: Governance 1 1,140,328 252,937 619,969 79,823 2,093,057
Deputy City Manager: Procurement & Infrastructure 1 1,140,328 252,937 619,969 79,823 2,093,057
Deputy City Manager: Health, Safety & Social Services 1 1,572,806 156,544 119,451 1,848,802
Deputy City Manager: Safety & Security 1 1,049,953 233,391 462,334 73,497 1,819,174 1
List of each offical with packages >= senior manager 1
Deputy City Manager: Corporate & Human Resources 1 1,049,953 233,391 462,334 73,497 1,819,174
Deputy City Manager: Sustainable Development & City Enterprises 1 1,049,953 233,391 462,334 73,497 1,819,174
Head - Internal Audit 1 910,648 208,316 402,435 63,745 1,585,145
Head - Geographical Information & Policy 1 1,073,962 226,534 470,260 75,177 1,845,934
Head - Strategic Projects 1 828,262 193,486 367,009 57,978 1,446,735
Head - Legal Services 1 1,275,098 315,587 103,690 1,694,375
Head - Performance Management 1 758,669 14,104 337,084 53,107 1,162,964
Total Senior Managers of the Municipality 15 15,203,343 2,102,296 5,610,285 1,099,448 24,015,372
TOTAL COST OF COUNCILLOR, DIRECTOR and EXECUTIVE
REMUNERATION220 65,891,495 9,877,014 51,663,061 1,099,448 128,531,018
No.
Salary Allowances Performance
Bonuses
117

ETH eThekwini - Supporting Table SA24 Summary of personnel numbers
Summary of Personnel Numbers
Number PositionsPermanent
employees
Contract
employeesPositions
Permanent
employees
Contract
employeesPositions
Permanent
employees
Contract
employees
Municipal Council and Boards of Municipal Entities
Councillors (Political Office Bearers plus Other Councillors) 205 205 205 205 205 205 –
Board Members of municipal entities 15 15 9 15 15 9 15 15 –
Municipal employees
Municipal Manager and Senior Managers 25 22 7 19 19 6 19 19 6
Other Managers 690 596 40 691 669 34 691 669 34
Professionals 1,186 1,004 92 1,183 1,119 73 1,183 1,119 73
Finance 30 22 1 26 25 1 26 25 1
Spatial/town planning 37 32 3 38 36 2 38 36 2
Information Technology 26 25 – 28 28 – 28 28 –
Roads 32 31 – 35 35 – 35 35 –
Electricity 60 51 1 58 57 1 58 57 1
Water 78 57 4 67 64 3 67 64 3
Sanitation
Refuse 5 4 – 4 4 – 4 4 –
Other 918 782 83 927 870 66 927 870 66
Technicians 1,240 1,083 33 1,241 1,216 25 1,241 1,216 25
Finance – – – – – – – – –
Spatial/town planning 49 49 – 55 55 – 55 55 –
Information Technology 12 11 – 12 12 – 12 12 –
Roads 51 44 1 50 49 1 50 49 1
Electricity 94 88 1 100 99 1 100 99 1
Water 101 73 2 84 82 2 84 82 2
Sanitation
Refuse 2 2 – 2 2 – 2 2 –
Other 931 816 29 938 917 21 938 917 21
Clerks (Clerical and administrative) 5,829 3,937 1,895 5,448 4,379 1,604 5,930 5,381 549
Service and sales workers 5,671 4,043 1,067 5,363 4,539 824 5,838 5,541 297
Skilled agricultural and fishery workers 56 49 – 55 55 – 55 55 –
Craft and related trades 4,038 3,414 160 3,956 3,832 124 3,956 3,832 124
Plant and Machine Operators 2,937 2,379 163 2,797 2,671 126 2,797 2,671 126
Elementary Occupations 4,286 3,667 256 4,314 4,116 198 4,314 4,116 198
TOTAL PERSONNEL NUMBERS 26,178 20,414 3,722 25,287 22,835 3,023 26,244 24,839 1,432
% increase (3.4%) 11.9% (18.8%) 3.8% 8.8% (52.6%)
Total municipal employees headcount 25,339 19,579 3,173 24,431 21,979 2,452 23,054 21,286 1,768
Finance personnel headcount 1,555 1,232 96 1,457 1,383 74 1,857 1,704 153
Human Resources personnel headcount 456 323 97 438 363 75 438 363 75
2011/12 Current Year 2012/13 Budget Year 2013/14
118

ETH eThekwini - Supporting Table SA25 Consolidated budgeted monthly revenue and expenditure
Description
R thousand July August Sept. October November December January February March April May JuneBudget Year
2013/14
Budget Year
+1 2014/15
Budget Year
+2 2015/16
Revenue By Source
Property rates 296,827 408,367 356,370 734,295 419,153 416,003 344,401 340,600 211,261 350,423 370,273 759,934 5,007,906 5,352,702 5,719,985
Property rates - penalties & collection charges 12,598 11,733 12,628 (2,840) 2,757 7,571 9,725 13,009 17,587 19,084 5,215 20,016 129,085 129,085 129,085
Service charges - electricity revenue 1,108,920 757,397 814,516 833,606 826,959 778,498 801,707 806,464 897,885 844,309 944,647 597,596 10,012,505 10,921,640 11,858,171
Service charges - water revenue 178,524 213,896 216,239 209,693 201,030 204,800 245,226 257,194 248,571 243,673 249,577 355,826 2,824,247 3,049,451 3,254,767
Service charges - sanitation revenue 53,736 59,067 61,165 58,620 52,996 58,367 64,119 76,131 61,086 45,712 65,044 75,139 731,182 797,816 866,353
Service charges - refuse revenue 38,408 38,035 38,887 39,493 39,416 40,203 38,020 38,963 37,730 41,669 37,147 33,172 461,142 487,262 517,671
Service charges - other 11,811 15,913 11,035 13,350 19,925 16,820 16,631 25,865 13,411 12,592 12,982 16,589 186,924 198,264 210,915
Rental of facilities and equipment 42,017 24,373 32,444 32,384 42,336 35,125 24,087 38,088 42,164 22,800 41,590 16,284 393,693 413,397 423,816
Interest earned - external investments 22,446 21,576 30,426 21,175 21,177 32,838 22,079 23,318 25,994 23,848 17,510 111,848 374,237 469,488 540,070
Interest earned - outstanding debtors 9,717 10,077 10,618 9,518 8,978 10,098 14,980 7,216 7,000 7,206 9,916 (1,464) 103,859 108,403 113,176
Dividends received – – – – – – – – – – – – – – –
Fines 4,279 9,305 10,878 6,592 5,969 22,821 10,000 12,031 8,253 6,684 7,319 4,031 108,163 114,352 120,968
Licences and permits 171 7,040 3,413 4,087 3,723 2,989 3,278 3,784 2,180 1,988 2,055 (10,303) 24,406 25,288 26,214
Agency services 665 800 730 678 1,108 1,060 1,047 800 909 1,010 1,200 2,051 12,058 12,744 13,470
Transfers recognised - operational 792,262 25,330 63,499 34,341 (26,102) 581,356 85,117 135,685 (27,750) 175,541 99,093 421,265 2,359,637 2,447,577 2,542,976
Other revenue 16,128 607,394 81,084 69,108 28,627 528,978 347,120 19,154 90,508 126,967 61,844 457,563 2,434,475 2,561,788 2,687,680
Gains on disposal of PPE – 245 10 116 12,066 (1,858) 1,013 (354) 818 53 914 21,208 34,231 34,281 34,282
Total Revenue (excluding capital transfers and contributions)2,588,507 2,210,549 1,743,944 2,064,217 1,660,118 2,735,669 2,028,550 1,797,950 1,637,607 1,923,558 1,926,326 2,880,755 25,197,750 27,123,541 29,059,599
Expenditure By Type
Employee related costs 431,225 488,050 481,881 503,161 797,012 492,247 509,578 494,793 508,763 507,688 514,351 953,103 6,681,852 7,252,891 7,670,289
Remuneration of councillors 7,385 7,325 7,352 7,314 7,366 7,374 6,758 8,951 4,778 17,943 5,958 16,011 104,516 110,792 117,282
Debt impairment 11,266 11,896 11,831 12,606 11,518 52,192 14,634 110,827 64,770 43,148 45,174 146,764 536,625 578,446 593,203
Depreciation & asset impairment 157,136 157,757 156,685 160,813 161,462 162,886 157,421 156,580 132,289 159,648 163,588 115,778 1,842,045 1,907,251 1,984,435
Finance charges 62,898 62,898 276,984 60,198 70,198 156,147 70,018 70,018 105,610 153,235 81,235 (922) 1,168,516 1,190,426 1,158,521
Bulk purchases 954,347 962,119 580,829 596,855 595,442 683,779 600,711 611,164 664,958 632,521 645,606 517,152 8,045,483 8,738,481 9,491,963
Other materials 3,518 4,287 4,029 4,119 5,058 2,484 2,216 2,903 949 1,021 1,106 (25,210) 6,480 2,335 2,401
Contracted services 173,110 15,757 224,628 224,808 442,580 230,123 263,404 284,492 354,387 295,722 474,017 426,899 3,409,928 3,579,823 3,738,132
Transfers and grants 22,159 (446) 6,043 25,664 17,355 18,448 8,695 12,167 5,628 26,899 18,113 42,987 203,713 202,213 209,443
Other expenditure 173,215 148,135 203,993 225,201 216,280 217,771 219,379 178,567 212,086 236,866 237,450 706,551 2,975,494 3,268,769 3,563,525
Loss on disposal of PPE – (41) 88 114 2,617 43 805 69 9 8 32 (2,322) 1,423 2,278 2,159
Total Expenditure 1,996,258 1,857,736 1,954,343 1,820,855 2,326,888 2,023,494 1,853,620 1,930,530 2,054,228 2,074,699 2,186,630 2,896,791 24,976,074 26,833,705 28,531,354
Surplus/(Deficit) 592,249 352,812 (210,400) 243,362 (666,771) 712,175 174,930 (132,580) (416,621) (151,141) (260,304) (16,036) 221,676 289,836 528,245
Transfers recognised - capital 350,217 50,879 80,470 100,901 112,512 108,829 100,907 126,621 228,969 240,238 25,341 1,657,546 3,183,431 3,581,313 4,084,292
Contributions recognised - capital – – – –
Contributed assets – – – –
Surplus/(Deficit) after capital transfers &
contributions942,467 403,692 (129,929) 344,263 (554,259) 821,004 275,837 (5,960) (187,651) 89,097 (234,963) 1,641,510 3,405,108 3,871,148 4,612,537
Taxation – – – –
Attributable to minorities – – – –
Share of surplus/ (deficit) of associate – – – –
Surplus/(Deficit) 942,467 403,692 (129,929) 344,263 (554,259) 821,004 275,837 (5,960) (187,651) 89,097 (234,963) 1,641,510 3,405,108 3,871,148 4,612,537
Budget Year 2013/14Medium Term Revenue and Expenditure
Framework
119
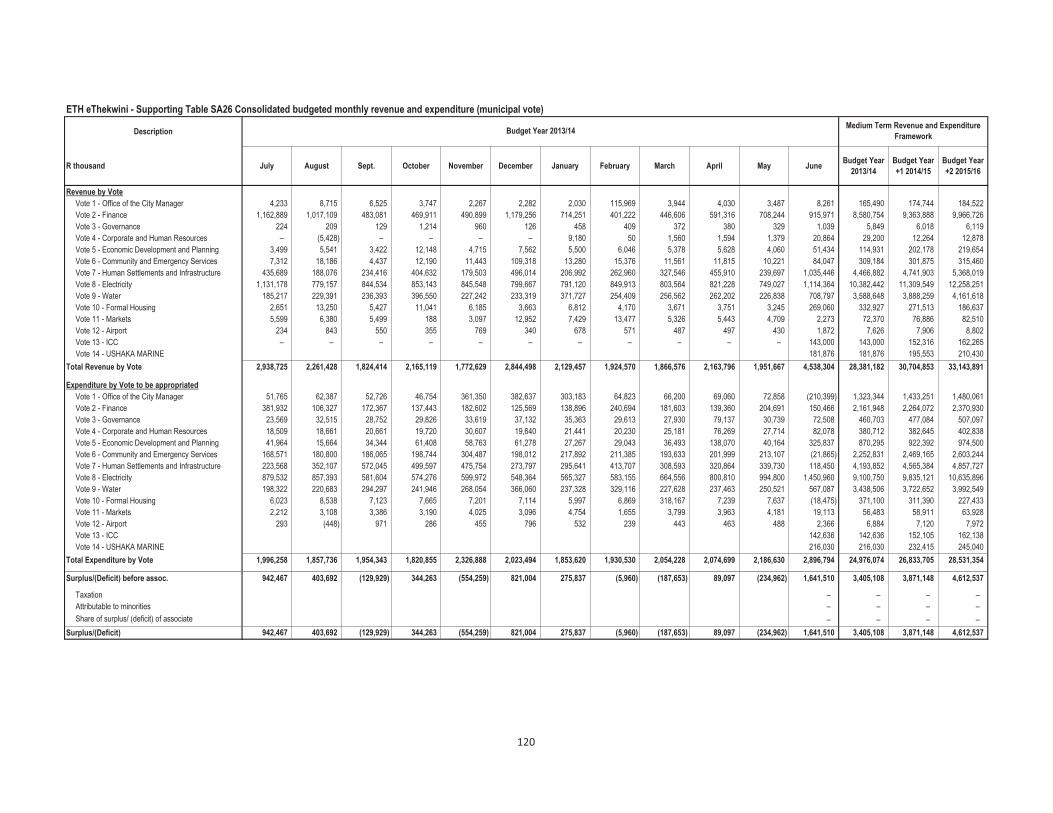
ETH eThekwini - Supporting Table SA26 Consolidated budgeted monthly revenue and expenditure (municipal vote)
Description
R thousand July August Sept. October November December January February March April May JuneBudget Year
2013/14
Budget Year
+1 2014/15
Budget Year
+2 2015/16
Revenue by Vote
Vote 1 - Office of the City Manager 4,233 8,715 6,525 3,747 2,267 2,282 2,030 115,969 3,944 4,030 3,487 8,261 165,490 174,744 184,522
Vote 2 - Finance 1,162,889 1,017,109 483,081 469,911 490,899 1,179,256 714,251 401,222 446,606 591,316 708,244 915,971 8,580,754 9,363,888 9,966,726
Vote 3 - Governance 224 209 129 1,214 960 126 458 409 372 380 329 1,039 5,849 6,018 6,119
Vote 4 - Corporate and Human Resources – (5,428) – – – – 9,180 50 1,560 1,594 1,379 20,864 29,200 12,264 12,878
Vote 5 - Economic Development and Planning 3,499 5,541 3,422 12,148 4,715 7,562 5,500 6,046 5,378 5,628 4,060 51,434 114,931 202,178 219,654
Vote 6 - Community and Emergency Services 7,312 18,186 4,437 12,190 11,443 109,318 13,280 15,376 11,561 11,815 10,221 84,047 309,184 301,875 315,460
Vote 7 - Human Settlements and Infrastructure 435,689 188,076 234,416 404,632 179,503 496,014 206,992 262,960 327,546 455,910 239,697 1,035,446 4,466,882 4,741,903 5,368,019
Vote 8 - Electricity 1,131,178 779,157 844,534 853,143 845,548 799,667 791,120 849,913 803,564 821,228 749,027 1,114,364 10,382,442 11,309,549 12,258,251
Vote 9 - Water 185,217 229,391 236,393 396,550 227,242 233,319 371,727 254,409 256,562 262,202 226,838 708,797 3,588,648 3,888,259 4,161,618
Vote 10 - Formal Housing 2,651 13,250 5,427 11,041 6,185 3,663 6,812 4,170 3,671 3,751 3,245 269,060 332,927 271,513 186,637
Vote 11 - Markets 5,599 6,380 5,499 188 3,097 12,952 7,429 13,477 5,326 5,443 4,709 2,273 72,370 76,886 82,510
Vote 12 - Airport 234 843 550 355 769 340 678 571 487 497 430 1,872 7,626 7,906 8,802
Vote 13 - ICC – – – – – – – – – – – 143,000 143,000 152,316 162,265
Vote 14 - USHAKA MARINE 181,876 181,876 195,553 210,430
Total Revenue by Vote 2,938,725 2,261,428 1,824,414 2,165,119 1,772,629 2,844,498 2,129,457 1,924,570 1,866,576 2,163,796 1,951,667 4,538,304 28,381,182 30,704,853 33,143,891
Expenditure by Vote to be appropriated
Vote 1 - Office of the City Manager 51,765 62,387 52,726 46,754 361,350 382,637 303,183 64,823 66,200 69,060 72,858 (210,399) 1,323,344 1,433,251 1,480,061
Vote 2 - Finance 381,932 106,327 172,367 137,443 182,602 125,569 138,896 240,694 181,603 139,360 204,691 150,466 2,161,948 2,264,072 2,370,930
Vote 3 - Governance 23,569 32,515 28,752 29,826 33,619 37,132 35,363 29,613 27,930 79,137 30,739 72,508 460,703 477,084 507,097
Vote 4 - Corporate and Human Resources 18,509 18,661 20,661 19,720 30,607 19,640 21,441 20,230 25,181 76,269 27,714 82,078 380,712 382,645 402,838
Vote 5 - Economic Development and Planning 41,964 15,664 34,344 61,408 58,763 61,278 27,267 29,043 36,493 138,070 40,164 325,837 870,295 922,392 974,500
Vote 6 - Community and Emergency Services 168,571 180,800 186,065 198,744 304,487 198,012 217,892 211,385 193,633 201,999 213,107 (21,865) 2,252,831 2,469,165 2,603,244
Vote 7 - Human Settlements and Infrastructure 223,568 352,107 572,045 499,597 475,754 273,797 295,641 413,707 308,593 320,864 339,730 118,450 4,193,852 4,565,384 4,857,727
Vote 8 - Electricity 879,532 857,393 581,604 574,276 599,972 548,364 565,327 583,155 664,556 800,810 994,800 1,450,960 9,100,750 9,835,121 10,635,896
Vote 9 - Water 198,322 220,683 294,297 241,946 268,054 366,060 237,328 329,116 227,628 237,463 250,521 567,087 3,438,506 3,722,652 3,992,549
Vote 10 - Formal Housing 6,023 8,538 7,123 7,665 7,201 7,114 5,997 6,869 318,167 7,239 7,637 (18,475) 371,100 311,390 227,433
Vote 11 - Markets 2,212 3,108 3,386 3,190 4,025 3,096 4,754 1,655 3,799 3,963 4,181 19,113 56,483 58,911 63,928
Vote 12 - Airport 293 (448) 971 286 455 796 532 239 443 463 488 2,366 6,884 7,120 7,972
Vote 13 - ICC 142,636 142,636 152,105 162,138
Vote 14 - USHAKA MARINE 216,030 216,030 232,415 245,040
Total Expenditure by Vote 1,996,258 1,857,736 1,954,343 1,820,855 2,326,888 2,023,494 1,853,620 1,930,530 2,054,228 2,074,699 2,186,630 2,896,794 24,976,074 26,833,705 28,531,354
Surplus/(Deficit) before assoc. 942,467 403,692 (129,929) 344,263 (554,259) 821,004 275,837 (5,960) (187,653) 89,097 (234,962) 1,641,510 3,405,108 3,871,148 4,612,537
Taxation – – – –
Attributable to minorities – – – –
Share of surplus/ (deficit) of associate – – – –
Surplus/(Deficit) 942,467 403,692 (129,929) 344,263 (554,259) 821,004 275,837 (5,960) (187,653) 89,097 (234,962) 1,641,510 3,405,108 3,871,148 4,612,537
Budget Year 2013/14Medium Term Revenue and Expenditure
Framework
120

ETH eThekwini - Supporting Table SA27 Consolidated budgeted monthly revenue and expenditure (standard classification)
Description
R thousand July August Sept. October November December January February March April May JuneBudget Year
2013/14
Budget Year
+1 2014/15
Budget Year
+2 2015/16
Revenue - Standard
Governance and administration 1,101,479 1,027,488 381,023 423,172 535,752 1,303,778 530,823 618,791 471,579 739,736 678,811 831,767 8,644,199 9,402,310 10,007,223
Executive and council 114 105 38 259 33 31 197 303 204 208 180 10,692 12,364 2,917 2,936
Budget and treasury office 1,085,001 1,018,348 359,519 403,668 507,004 1,295,029 505,263 601,315 449,358 717,028 659,165 787,581 8,388,280 9,150,874 9,742,005
Corporate services 16,363 9,035 21,466 19,245 28,715 8,718 25,363 17,173 22,016 22,500 19,466 33,493 243,555 248,519 262,282
Community and public safety 363,133 44,423 134,357 80,738 16,777 39,858 73,171 27,239 109,524 111,931 96,835 413,000 1,510,985 1,407,537 1,714,773
Community and social services 2,513 2,087 31,254 4,153 1,879 1,885 2,940 2,921 3,156 3,226 2,791 146,388 205,193 202,888 213,930
Sport and recreation 1,210 10,877 18,883 38,299 3,323 6,033 6,930 4,406 3,000 3,066 2,652 (36,284) 62,394 73,094 79,773
Public safety 6,172 11,950 6,575 8,732 1,933 25,274 7,072 11,399 9,730 9,944 8,603 9,366 116,752 123,606 130,772
Housing 353,232 19,504 77,644 29,554 9,641 6,666 56,229 8,509 89,547 91,515 79,172 231,586 1,052,799 930,732 1,211,520
Health 6 5 0 0 0 0 0 4 4,091 4,181 3,617 61,943 73,846 77,216 78,778 Economic and environmental services 51,467 2,053 113,789 37,004 32,318 347,436 33,430 34,062 60,083 59,799 54,036 467,924 1,293,403 1,542,686 1,644,087
Planning and development 18,849 6,629 18,664 15,738 11,137 2,385 9,553 3,073 3,764 2,243 4,243 4,519 100,796 120,109 125,914
Road transport 32,594 (4,576) 95,039 21,267 21,182 345,051 23,875 30,868 55,994 57,225 49,507 460,001 1,188,027 1,407,944 1,498,507
Environmental protection 25 0 86 – – – 2 122 324 331 287 3,404 4,580 14,634 19,665 Trading services 1,415,531 1,178,084 1,187,869 1,622,601 1,171,361 1,138,459 1,483,232 1,228,173 1,218,124 1,244,902 1,115,559 2,512,842 16,516,738 17,908,022 19,301,475
Electricity 1,131,178 779,157 844,534 853,143 845,548 799,667 791,120 849,913 803,564 821,228 749,027 1,145,689 10,413,767 11,344,382 12,296,916
Water 185,217 229,391 236,393 396,550 227,242 233,319 371,727 254,409 256,562 262,202 226,838 708,797 3,588,648 3,888,259 4,161,618
Waste water management 58,179 128,913 65,412 173,508 56,591 62,276 153,330 78,250 96,485 98,606 85,307 511,894 1,568,750 1,674,612 1,784,239
Waste management 40,957 40,622 41,529 199,401 41,980 43,198 167,056 45,601 61,514 62,866 54,387 146,462 945,573 1,000,769 1,058,702
Other 7,114 9,381 7,376 1,605 16,421 15,029 8,802 16,304 7,267 7,427 6,425 312,705 415,857 444,298 476,333
Total Revenue - Standard 2,938,725 2,261,428 1,824,414 2,165,120 1,772,629 2,844,560 2,129,457 1,924,570 1,866,576 2,163,796 1,951,667 4,538,238 28,381,182 30,704,853 33,143,891
Expenditure - Standard
Governance and administration 237,036 255,046 205,540 252,238 335,454 304,002 267,874 260,732 379,667 276,941 289,472 145,663 3,209,666 3,359,922 3,509,299
Executive and council 20,435 28,878 21,043 22,798 26,740 36,491 24,903 25,278 21,897 22,843 24,099 12,573 287,979 304,963 324,544
Budget and treasury office 105,164 124,244 81,417 117,165 162,153 115,773 132,231 115,407 195,818 118,477 74,064 105,326 1,447,240 1,524,825 1,585,710
Corporate services 111,437 101,924 103,080 112,275 146,561 151,738 110,739 120,047 161,951 135,621 191,309 27,764 1,474,448 1,530,134 1,599,045
Community and public safety 336,703 250,343 331,949 392,976 519,369 401,698 396,660 372,138 381,817 335,722 346,183 272,238 4,337,797 4,607,972 4,763,824
Community and social services 55,185 42,789 49,036 70,826 74,710 115,223 47,431 49,971 77,977 60,482 63,807 26,524 733,962 780,008 828,379
Sport and recreation 71,538 83,976 85,361 93,349 130,533 129,485 116,438 114,269 96,014 89,730 94,664 25,788 1,131,143 1,214,093 1,277,559
Public safety 102,930 42,318 43,863 70,663 136,380 87,104 117,353 125,027 142,475 117,335 115,787 264,221 1,365,456 1,472,281 1,553,343
Housing 80,605 51,772 133,093 129,053 152,769 50,311 96,890 51,670 45,717 47,692 50,314 (49,745) 840,142 821,590 774,409
Health 26,445 29,489 20,597 29,085 24,978 19,575 18,548 31,201 19,635 20,483 21,610 5,450 267,093 320,000 330,134
Economic and environmental services 195,900 105,416 354,535 187,280 409,116 174,851 209,855 200,203 228,821 248,734 124,850 117,581 2,557,141 2,798,629 2,977,160
Planning and development 67,895 54,459 129,797 45,458 51,975 59,623 77,782 67,572 62,533 96,531 31,839 13,762 759,226 832,979 878,369
Road transport 117,214 40,863 213,971 132,313 339,948 105,147 119,506 120,720 153,997 139,382 79,485 80,659 1,643,204 1,792,772 1,912,486
Environmental protection 10,791 10,093 10,767 9,508 17,194 10,080 12,567 11,911 12,290 12,822 13,527 23,160 154,711 172,879 186,304
Trading services 1,214,036 1,244,252 1,045,741 977,208 1,050,649 1,130,116 968,820 1,089,661 1,051,364 1,200,199 1,412,302 1,937,755 14,322,103 15,479,555 16,659,849
Electricity 879,532 857,393 581,604 574,276 599,972 548,364 565,327 583,155 664,556 800,810 994,800 1,244,998 8,894,788 9,615,073 10,401,421
Water 198,322 220,683 294,297 241,946 268,054 366,060 237,328 329,116 227,628 237,463 250,521 567,087 3,438,506 3,722,652 3,992,549
Waste water management 86,023 87,542 87,123 87,667 87,201 140,768 85,997 86,869 78,000 77,239 77,637 34,513 1,016,580 1,095,377 1,178,794
Waste management 50,158 78,633 82,716 73,319 95,424 74,923 80,169 90,521 81,179 84,686 89,343 91,156 972,229 1,046,453 1,087,084 Other 12,583 2,680 16,578 11,155 12,299 12,828 10,411 7,795 12,560 13,103 13,823 423,552 549,367 587,627 621,223
Total Expenditure - Standard 1,996,258 1,857,736 1,954,343 1,820,857 2,326,888 2,023,494 1,853,620 1,930,529 2,054,228 2,074,699 2,186,630 2,896,789 24,976,074 26,833,705 28,531,354
Surplus/(Deficit) before assoc. 942,467 403,692 (129,929) 344,263 (554,259) 821,066 275,837 (5,960) (187,652) 89,097 (234,963) 1,641,449 3,405,108 3,871,148 4,612,537
Share of surplus/ (deficit) of associate – – – –
Surplus/(Deficit) 942,467 403,692 (129,929) 344,263 (554,259) 821,066 275,837 (5,960) (187,652) 89,097 (234,963) 1,641,449 3,405,108 3,871,148 4,612,537
Budget Year 2013/14Medium Term Revenue and Expenditure
Framework
121

ETH eThekwini - Supporting Table SA28 Consolidated budgeted monthly capital expenditure (municipal vote)
Description
R thousand July August Sept. October Nov. Dec. January Feb. March April May JuneBudget Year
2013/14
Budget Year
+1 2014/15
Budget Year
+2 2015/16
Multi-year expenditure to be appropriated
Vote 1 - Office of the City Manager 6,521 7,190 12,205 9,698 10,701 12,189 6,688 14,195 10,851 12,205 16,720 (51,528) 67,635 72,468 101,468
Vote 2 - Finance 4,313 4,755 8,072 6,414 7,077 8,061 4,423 9,388 7,177 8,072 11,058 (7,130) 71,680 97,450 61,785
Vote 3 - Governance 527 581 986 783 864 984 540 1,146 876 986 1,350 277 9,900 23,680 14,310
Vote 4 - Corporate and Human Resources 397 437 742 590 651 741 407 863 660 742 1,017 1,843 9,090 2,250 810
Vote 5 - Economic Development and Planning 6,127 6,756 11,468 9,112 10,054 11,452 6,284 13,338 10,196 11,468 15,710 115,132 227,097 271,860 326,550
Vote 6 - Community and Emergency Services 8,459 9,328 15,836 12,582 13,883 15,814 8,677 18,417 14,080 15,836 21,693 57,349 211,954 349,760 331,818
Vote 7 - Human Settlements and Infrastructure 134,174 147,936 251,148 199,542 220,184 250,804 137,615 292,088 223,281 251,148 344,038 733,522 3,185,480 3,157,455 3,469,764
Vote 8 - Electricity 22,183 24,501 41,595 33,048 36,467 41,538 22,792 48,291 36,915 41,522 56,880 137,094 542,826 621,598 641,103
Vote 9 - Water 29,033 32,010 54,343 43,177 47,644 54,269 29,777 63,202 48,314 54,343 74,443 168,875 699,430 800,900 761,100
Vote 10 - Formal Housing – – – –
Vote 11 - Markets 119 132 223 177 196 223 122 260 199 223 306 70 2,250 2,430 16,200
Vote 12 - Airport – – – –
Vote 13 - ICC – – – –
Vote 14 - USHAKA MARINE – – – –
Capital multi-year expenditure sub-total 211,853 233,626 396,618 315,123 347,721 396,075 217,325 461,188 352,549 396,545 543,215 1,155,504 5,027,342 5,399,851 5,724,908
Single-year expenditure to be appropriated
Vote 1 - Office of the City Manager 31,842 31,842 23,625 6,300
Vote 2 - Finance 38,900 38,900 47,300 54,147
Vote 3 - Governance 1,800 1,800 – –
Vote 4 - Corporate and Human Resources 1,080 1,080 – –
Vote 5 - Economic Development and Planning – – – –
Vote 6 - Community and Emergency Services 2,700 2,700 10,224 23,004
Vote 7 - Human Settlements and Infrastructure 256,700 256,700 224,370 574,500
Vote 8 - Electricity 25,972 25,972 20,754 12,671
Vote 9 - Water 45,000 45,000 40,500 45,000
Vote 10 - Formal Housing – – – –
Vote 11 - Markets 810 810 450 1,350
Vote 12 - Airport – – – –
Vote 13 - ICC 20,000 20,000 20,000 20,000
Vote 14 - USHAKA MARINE 14,621 14,621 8,000 8,000
Capital single-year expenditure sub-total – – – – – – – – – – – 439,425 439,425 395,223 744,972
Total Capital Expenditure 211,853 233,626 396,618 315,123 347,721 396,075 217,325 461,188 352,549 396,545 543,215 1,594,929 5,466,767 5,795,074 6,469,880
Budget Year 2013/14Medium Term Revenue and Expenditure
Framework
122
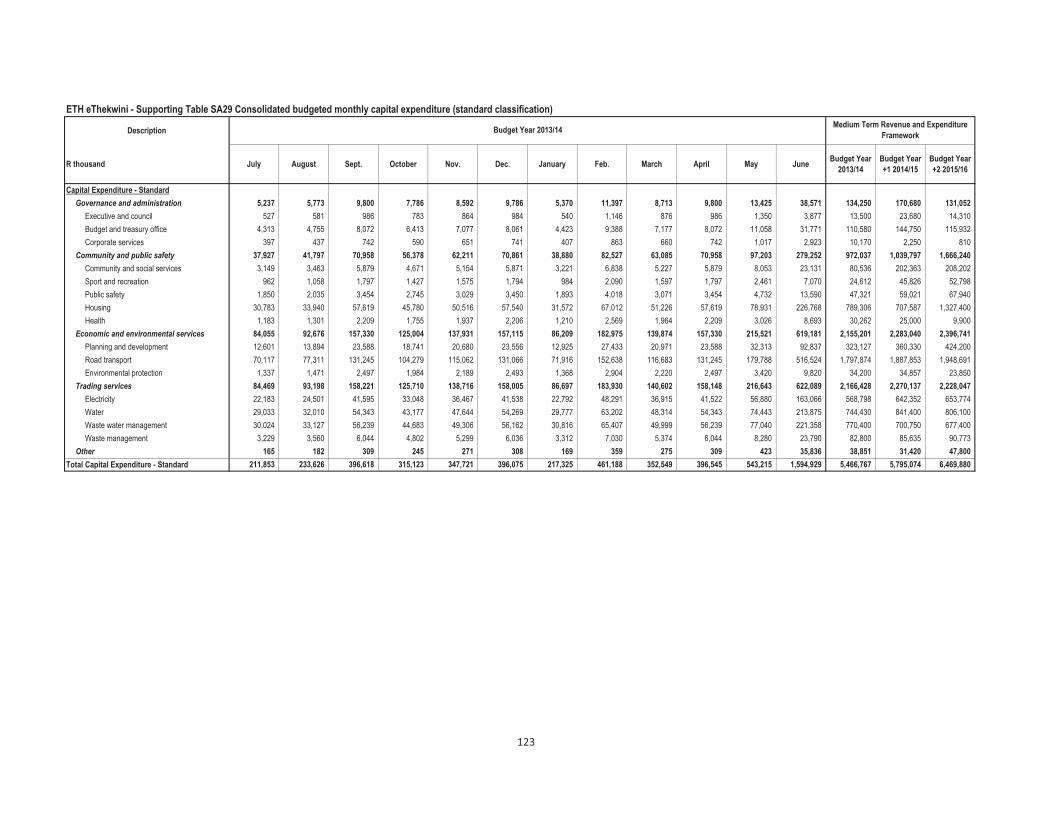
ETH eThekwini - Supporting Table SA29 Consolidated budgeted monthly capital expenditure (standard classification)
Description
R thousand July August Sept. October Nov. Dec. January Feb. March April May JuneBudget Year
2013/14
Budget Year
+1 2014/15
Budget Year
+2 2015/16
Capital Expenditure - Standard
Governance and administration 5,237 5,773 9,800 7,786 8,592 9,786 5,370 11,397 8,713 9,800 13,425 38,571 134,250 170,680 131,052
Executive and council 527 581 986 783 864 984 540 1,146 876 986 1,350 3,877 13,500 23,680 14,310
Budget and treasury office 4,313 4,755 8,072 6,413 7,077 8,061 4,423 9,388 7,177 8,072 11,058 31,771 110,580 144,750 115,932
Corporate services 397 437 742 590 651 741 407 863 660 742 1,017 2,923 10,170 2,250 810
Community and public safety 37,927 41,797 70,958 56,378 62,211 70,861 38,880 82,527 63,085 70,958 97,203 279,252 972,037 1,039,797 1,666,240
Community and social services 3,149 3,463 5,879 4,671 5,154 5,871 3,221 6,838 5,227 5,879 8,053 23,131 80,536 202,363 208,202
Sport and recreation 962 1,058 1,797 1,427 1,575 1,794 984 2,090 1,597 1,797 2,461 7,070 24,612 45,826 52,798
Public safety 1,850 2,035 3,454 2,745 3,029 3,450 1,893 4,018 3,071 3,454 4,732 13,590 47,321 59,021 67,940
Housing 30,783 33,940 57,619 45,780 50,516 57,540 31,572 67,012 51,226 57,619 78,931 226,768 789,306 707,587 1,327,400
Health 1,183 1,301 2,209 1,755 1,937 2,206 1,210 2,569 1,964 2,209 3,026 8,693 30,262 25,000 9,900
Economic and environmental services 84,055 92,676 157,330 125,004 137,931 157,115 86,209 182,975 139,874 157,330 215,521 619,181 2,155,201 2,283,040 2,396,741
Planning and development 12,601 13,894 23,588 18,741 20,680 23,556 12,925 27,433 20,971 23,588 32,313 92,837 323,127 360,330 424,200
Road transport 70,117 77,311 131,245 104,279 115,062 131,066 71,916 152,638 116,683 131,245 179,788 516,524 1,797,874 1,887,853 1,948,691
Environmental protection 1,337 1,471 2,497 1,984 2,189 2,493 1,368 2,904 2,220 2,497 3,420 9,820 34,200 34,857 23,850
Trading services 84,469 93,198 158,221 125,710 138,716 158,005 86,697 183,930 140,602 158,148 216,643 622,089 2,166,428 2,270,137 2,228,047
Electricity 22,183 24,501 41,595 33,048 36,467 41,538 22,792 48,291 36,915 41,522 56,880 163,066 568,798 642,352 653,774
Water 29,033 32,010 54,343 43,177 47,644 54,269 29,777 63,202 48,314 54,343 74,443 213,875 744,430 841,400 806,100
Waste water management 30,024 33,127 56,239 44,683 49,306 56,162 30,816 65,407 49,999 56,239 77,040 221,358 770,400 700,750 677,400
Waste management 3,229 3,560 6,044 4,802 5,299 6,036 3,312 7,030 5,374 6,044 8,280 23,790 82,800 85,635 90,773
Other 165 182 309 245 271 308 169 359 275 309 423 35,836 38,851 31,420 47,800
Total Capital Expenditure - Standard 211,853 233,626 396,618 315,123 347,721 396,075 217,325 461,188 352,549 396,545 543,215 1,594,929 5,466,767 5,795,074 6,469,880
Budget Year 2013/14Medium Term Revenue and Expenditure
Framework
123

ETH eThekwini - Supporting Table SA30 Consolidated budgeted monthly cash flow
MONTHLY CASH FLOWS
R thousand July August Sept. October November December January February March April May JuneBudget Year
2013/14
Budget Year
+1 2014/15
Budget Year
+2 2015/16
Cash Receipts By Source 1
Property rates 296,827 408,367 356,370 734,295 419,153 416,003 344,401 340,600 211,261 350,423 370,273 759,934 5,007,906 5,352,702 5,719,985
Property rates - penalties & collection charges 12,598 11,733 12,628 (2,840) 2,757 7,571 9,725 13,009 17,587 19,084 5,215 20,016 129,085 129,085 129,085
Service charges - electricity revenue 1,108,920 757,397 814,516 833,606 826,959 778,498 801,707 806,464 897,885 844,309 944,647 597,596 10,012,505 10,921,640 11,858,171
Service charges - water revenue 178,524 213,896 216,239 209,693 201,030 204,800 245,226 257,194 248,571 243,673 249,577 355,826 2,824,247 3,049,451 3,254,767
Service charges - sanitation revenue 53,736 59,067 61,165 58,620 52,996 58,367 64,119 76,131 61,086 45,712 65,044 75,139 731,182 797,816 866,353
Service charges - refuse revenue 38,408 38,035 38,887 39,493 39,416 40,203 38,020 38,963 37,730 41,669 37,147 33,172 461,142 487,262 517,671
Service charges - other 11,811 15,913 11,035 13,350 19,925 16,820 16,631 25,865 13,411 12,592 12,982 16,589 186,924 198,264 210,915
Rental of facilities and equipment 42,017 24,373 32,444 32,384 42,336 35,125 24,087 38,088 42,164 22,800 41,590 16,284 393,693 413,397 423,816
Interest earned - external investments 22,446 21,576 30,426 21,175 21,177 32,838 22,079 23,318 25,994 23,848 17,510 111,848 374,237 469,488 540,070
Interest earned - outstanding debtors 9,717 10,077 10,618 9,518 8,978 10,098 14,980 7,216 7,000 7,206 9,916 (1,464) 103,859 108,403 113,176
Fines 4,279 9,305 10,878 6,592 5,969 22,821 10,000 12,031 8,253 6,684 7,319 4,031 108,163 114,352 120,968
Licences and permits 171 7,040 3,413 4,087 3,723 2,989 3,278 3,784 2,180 1,988 2,055 (10,303) 24,406 25,288 26,214
Agency services 665 800 730 678 1,108 1,060 1,047 800 909 1,010 1,200 2,051 12,058 12,744 13,470
Transfer receipts - operational 792,262 25,330 63,499 34,341 (26,102) 581,356 85,117 135,685 (27,750) 175,541 99,093 421,265 2,359,637 2,447,577 2,542,976
Other revenue 16,128 607,394 81,084 69,108 28,627 528,978 347,120 19,154 90,508 126,967 61,844 (165,332) 1,811,579 1,853,068 1,924,622
Cash Receipts by Source 2,588,507 2,210,304 1,743,933 2,064,101 1,648,052 2,737,528 2,027,537 1,798,304 1,636,789 1,923,505 1,925,412 2,236,652 24,540,624 26,380,539 28,262,259
Other Cash Flows by Source
Transfer receipts - capital 80,470 100,901 112,512 108,829 100,907 126,621 228,969 240,238 25,341 2,058,643 3,183,432 3,581,313 4,084,292
Contributions recognised - capital & Contributed assets –
Proceeds on disposal of PPE 34,231 – 34,231 34,281 34,282
Short term loans –
Borrowing long term/refinancing 1,000,000 – 1,000,000 1,000,000 1,000,000
Increase (decrease) in consumer deposits 55,907 – 55,907 58,702 61,638
Decrease (Increase) in non-current debtors (8,840) 3,000 (5,840) (5,956) (6,076)
Decrease (increase) other non-current receivables (5,840) 5,840
Decrease (increase) in non-current investments (30,597) – (30,597) (32,465) (34,439)
Total Cash Receipts by Source 2,588,507 2,210,304 1,824,404 2,165,002 1,760,564 2,846,357 2,128,444 1,924,924 1,865,758 2,163,743 2,995,614 4,304,135 28,777,756 31,016,414 33,401,956
Cash Payments by Type
Employee related costs 431,225 488,050 481,881 503,161 797,012 492,247 509,578 494,793 508,763 507,688 514,351 953,103 6,681,852 7,252,891 7,670,289
Remuneration of councillors 7,385 7,325 7,352 7,314 7,366 7,374 6,758 8,951 4,778 17,943 5,958 16,011 104,516 110,792 117,282
Finance charges 62,898 62,898 276,984 60,198 70,198 156,147 70,018 70,018 105,610 153,235 81,235 (922) 1,168,516 1,190,426 1,158,521
Bulk purchases - Electricity 763,477 769,695 464,663 477,484 476,354 547,023 480,569 488,931 531,967 506,017 516,484 568,081 6,590,747 7,189,186 7,841,965
Bulk purchases - Water & Sewer 190,869 192,424 116,166 119,371 119,088 136,756 120,142 122,233 132,992 126,504 129,121 (50,929) 1,454,737 1,549,295 1,649,999
Other materials 3,518 4,287 4,029 4,119 5,058 2,484 2,216 2,903 949 1,021 1,106 (25,210) 6,480 2,335 2,401
Contracted services 173,110 15,757 224,628 224,808 442,580 230,123 263,404 284,492 354,387 295,722 474,017 426,899 3,409,928 3,579,823 3,738,132
Transfers and grants - other 22,159 (446) 6,043 25,664 17,355 18,448 8,695 12,167 5,628 26,899 18,113 42,987 203,713 202,213 209,443
Other expenditure 173,215 148,135 203,993 225,201 216,280 217,771 219,379 178,567 212,086 236,866 237,450 288,118 2,557,061 3,522,652 3,825,280
Cash Payments by Type 1,827,856 1,688,124 1,785,739 1,647,322 2,151,292 1,808,373 1,680,759 1,663,054 1,857,160 1,871,896 1,977,836 2,218,139 22,177,549 24,599,612 26,213,312 Other Cash Flows/Payments by Type
Capital assets 5,160,539 (236,987) 4,923,552 5,218,366 5,825,692
Repayment of borrowing 1,156,800 979 1,157,779 1,021,977 1,079,038
Other Cash Flows/Payments –
Total Cash Payments by Type 1,827,856 1,688,124 1,785,739 1,647,322 2,151,292 1,808,373 1,680,759 1,663,054 1,857,160 1,871,896 8,295,175 1,982,131 28,258,880 30,839,955 33,118,042
NET INCREASE/(DECREASE) IN CASH HELD 760,651 522,180 38,665 517,680 (390,728) 1,037,983 447,685 261,870 8,599 291,848 (5,299,561) 2,322,005 518,876 176,459 283,914
Cash/cash equivalents at the month/year begin: 4,786,847 5,547,499 6,069,678 6,108,343 6,626,023 6,235,295 7,273,278 7,720,963 7,982,834 7,991,433 8,283,280 2,983,719 4,786,847 5,305,724 5,482,183
Cash/cash equivalents at the month/year end: 5,547,499 6,069,678 6,108,343 6,626,023 6,235,295 7,273,278 7,720,963 7,982,834 7,991,433 8,283,280 2,983,719 5,305,724 5,305,724 5,482,183 5,766,097
Budget Year 2013/14Medium Term Revenue and Expenditure
Framework
124

ETH eThekwini - Supporting Table SA31 Aggregated entity budget
Description 2009/10 2010/11 2011/12
R millionAudited
Outcome
Audited
Outcome
Audited
Outcome
Original
Budget
Adjusted
Budget
Full Year
Forecast
Budget Year
2013/14
Budget Year
+1 2014/15
Budget Year
+2 2015/16
Financial Performance
Property rates
Service charges
Investment revenue 7 5 8 5 6 7 7 7 8
Transfers recognised - operational
Other own revenue 235 280 388 305 294 299 318 340 365
Contributions recognised - capital & contributed assets
Total Revenue (excluding capital transfers and contributions)242 285 396 310 300 306 325 348 373
Employee costs 93 101 100 107 107 102 109 116 123
Remuneration of Board Members 0 0 –
Depreciation & asset impairment 69 72 1 72
Finance charges 7 8 9 8 9 9 9 9 9
Materials and bulk purchases 16 18 19 25 23 23 24 25 26
Transfers and grants
Other expenditure 140 148 240 186 250 206 217 235 249
Total Expenditure 326 347 368 398 389 341 359 385 407
Surplus/(Deficit) (84) (62) 28 (88) (88) (35) (34) (37) (34)
Capital expenditure & funds sources
Capital expenditure 6 2 32 23 31 47 35 28 28
Transfers recognised - operational
Public contributions & donations
Borrowing
Internally generated funds 6 2 32 23 31 47 35 28 28
Total sources 6 2 32 23 31 47 35 28 28
Financial position
Total current assets 136 158 193 134 131 173 166 153 143
Total non current assets 715 1,192 667 1,114 1,120 668 659 644 629
Total current liabilities 50 60 53 64 64 64 66 65 65
Total non current liabilities 301 321 328 229 229 229 229 228 227
Equity 500 968 478 954 958 549 530 504 480
Cash flows
Net cash from (used) operating (24) 15 25 (37) (54) (27) (13) (23) (21)
Net cash from (used) investing (31) (9) 15 (1) (1) 15 5 12 12
Net cash from (used) financing 18 10 (1) (1) (1) (1) (1) (1) (1)
Cash/cash equivalents at the year end 123 138 178 131 122 164 156 143 133
Current Year 2012/132013/14 Medium Term Revenue &
Expenditure Framework
125

ETH eThekwini - Supporting Table SA32 List of external mechanisms
External mechanismPeriod of
agreement 1.
Monetary value
of agreement 2.
Name of organisation Number R thousand
Durban Golf Club Development (PTY)LTD 12 3 Maintenance of Papwa Sewgolum Golf Course 30 June 2014 2,655
PAPWA Sewgolum Golf Academy 12 3 Maintenance of Windsor Park Golf Course 30 June 2014 5,761
Natal Sharks Board 12 INDEFINITE Maintenance of sharks net on eThekwini beaches INDEFINITE 10,946
Inanda Community Development Trust Yrs 30 Rendering of Recreational Services 03 February 2027 81
Top Admin Services (PTY) LTD Yrs 1 Management and maintenance 30 June 2014 6,300
P.A.P. Poverty and Alleviation Program Yrs 1 Cut Grass / bush clearing 30 June 2014 470
P.A.P. Poverty and Alleviation Program Yrs 1 Cut Grass / rec. grounds 30 June 2014 1,400
P.A.P. Poverty and Alleviation Program Yrs 1 Cut Grass / Verge maintenance 30 June 2014 50,139
B H Mkhize Mths 3 Cleaning of Various Libraries Adhoc 1
Bambithuba Womans' Development Yrs ongoing Yard Maintenance / Various Libraries 30 June 2014 27
D & A Garden & Cleaning Services Yrs ongoing Cleaning of Various Libraries 30 June 2014 85
EK'Thuleni Trading cc Yrs ongoing Cleaning of Various Libraries 30 June 2014 65
General Cleaning Services Yrs ongoing Cleaning of Various Libraries 30 June 2014 722
Gotec Investments Mths 2 Cleaning of Various Libraries Adhoc 10
I B Shozi Mths 2 Cleaning of Various Libraries Adhoc 6
Just Pest Control Mths 2 Cleaning of Various Libraries 30 June 2014 48
L L Hadebe Mths 2 Cleaning of Various Libraries Adhoc 1
Mangcengeza Trading Enterprise Yrs ongoing Cleaning of Various Libraries 30 June 2014 545
Nice equipment Mths 4 Cleaning of Various Libraries Adhoc 2
N N Projects Yrs ongoing Cleaning of Various Libraries 30 June 2014 497
North Coast Maintenance Services Yrs ongoing Cleaning of Various Libraries 30 June 2014 557
Rafelin Cleaning Services Yrs ongoing Cleaning of Various Libraries 30 June 2014 844
Rentokil Steiner Hygiene Services Yrs ongoing Hygiene Services 30 June 2014 54
Steiner Hygiene (Pty) Ltd. Yrs ongoing Hygiene Services 30 June 2014 10
Supercare Hygiene Services Yrs ongoing Hygiene Services 30 June 2014 47
T Dlamini Mths 2 Cleaning of Various Libraries Adhoc 2
Thembalethu Construction Yrs ongoing Cleaning of Various Libraries 30 June 2014 47
Towel Cabinet Services Yrs ongoing Hygiene Services 30 June 2014 58
Umjuluko Wegazi Trading Yrs ongoing Grass cutting and Yard Maintenance 30 June 2014 51
Unongaxamatshe Cleaning Services Yrs ongoing Yard Maintenance / Various Libraries 30 June 2014 131
Vini's Garden Services Yrs ongoing Cleaning of Various Libraries 30 June 2014 394
Shisabhe Contractors cc Yrs ongoing Cleaning of Various Libraries 30 June 2014 203
Naidoo's Garden Services cc Yrs ongoing Cleaning of Various Libraries 30 June 2014 206
Magna Solutions Yrs 3 Monitoring of red robot violation 30 September 2013 4,284
Techni/Power Security System cc Yrs 3 Maintenance of CCTV cameras 30 April 2014 5,627
Alagu Trading cc Mths 36 Refuse Removal/Informal Areas 13 January 2015 732
A M Trading Enterprise Mths 39 Refuse Removal/Informal Areas 09 December 2013 762
A. J. Dlamini (6807145649085) Mths 24 Refuse Removal/Informal Areas 31 October 2013 519
Africa Red Rows Trading and Projects cc Mths 36 Refuse Removal/Informal Areas 23 January 2014 692
Africa Red Rows Trading and Projects cc Mths 35 Refuse Removal/Informal Areas 02 January 2015 739
Aislea Trading Enterprise Mths 39 Refuse Removal/Informal Areas 09 December 2013 862
Amadlokovu Amahle Construction and Trading Mths 35 Refuse Removal/Informal Areas 07 August 2015 722
Amadwala Trading 132 cc Mths 39 Refuse Removal/Informal Areas 09 December 2013 829
Amadwala Trading 73 cc Mths 39 Refuse Removal/Informal Areas 09 December 2013 794
Amagabhisa Civils & Construction cc Mths 36 Refuse Removal/Informal Areas 13 January 2015 813
Amagagu Trading cc Mths 36 Refuse Removal/Informal Areas 13 January 2015 739
Amahlanga Trading cc Mths 36 Refuse Removal/Informal Areas 15 April 2014 743
Amandla Emicabango Trading 35 cc Mths 36 Refuse Removal/Informal Areas 13 January 2015 770
Amantusi Trading cc Mths 35 Refuse Removal/Informal Areas 07 March 2014 751
Amanzi Ahlo Bile Trading Mths 36 Refuse Removal/Informal Areas 24 June 2015 754
Amavelase Trading Enterprise cc Mths 36 Refuse Removal/Informal Areas 13 January 2015 779
Amile Trading Enterprise cc Mths 36 Refuse Removal/Informal Areas 13 April 2015 833
Asizameni Sonke Trading cc Mths 36 Refuse Removal/Informal Areas 13 January 2015 797
Ayandamalungelo Contracts & Trading cc Mths 24 Refuse Removal/Informal Areas 31 October 2013 488
Azo Investments cc Mths 36 Refuse Removal/Informal Areas 13 January 2015 902
1020 Ilember Trading cc Mths 38 Refuse Removal/Informal Areas 09 December 2013 580
Baphiwe Muthwa Construction and Trading cc Mths 38 Refuse Removal/Informal Areas 09 December 2013 792
Banana City Co/operative Mths Mth to Mth Refuse Removal/Informal Areas Mth to Mth 168
Bantu Batho Management Services Mths 35 Refuse Removal/Informal Areas 07 August 2015 827
Baphiwe Muthwa Construction and Trading Mths 36 Refuse Removal/Informal Areas 13 January 2015 756
Bayekuphi Trading cc Mths 36 Refuse Removal/Informal Areas 13 January 2015 734
Benzi Cleaning Services Mths 36 Refuse Removal/Informal Areas 13 January 2015 824
Best Enough Trading and Projects 293 cc Mths 39 Refuse Removal/Informal Areas 09 December 2013 1,004
Best Gasa Trading Mths 36 Refuse Removal/Informal Areas 13 January 2015 809
Bhathus Contracting and Trading cc Mths 36 Refuse Removal/Informal Areas 13 January 2015 734
Bhekizizwe Construction cc Mths 36 Refuse Removal/Informal Areas 13 January 2015 643
Bhulantshi Trading Enterprise Mths 36 Refuse Removal/Informal Areas 19 February 2015 743
Yrs/ Mths Service provided
Expiry date of service
delivery agreement or
contract
126

ETH eThekwini - Supporting Table SA32 List of external mechanisms
External mechanismPeriod of
agreement 1.
Monetary value
of agreement 2.
Name of organisation Number R thousand
Yrs/ Mths Service provided
Expiry date of service
delivery agreement or
contract
Big Fuze Construction and Trading CC Mths 36 Refuse Removal/Informal Areas 24 June 2015 851
Bizeecorp 112 cc Mths 36 Refuse Removal/Informal Areas 13 January 2015 737
Blue Shine Dru Trading and PROJ 110 Mths 36 Refuse Removal/Informal Areas 13 January 2015 793
Bonding Mode Trade 1023 cc Mths 24 Refuse Removal/Informal Areas 31 October 2013 357
Bonganjalo Business Enterprise cc Mths 39 Refuse Removal/Informal Areas 09 December 2013 798
Bonisiweh Trading cc Mths 36 Refuse Removal/Informal Areas 13 January 2015 766
Bophelo Ke Mpho Trading and Projects Mths 36 Refuse Removal/Informal Areas 24 June 2015 918
Bright Idea Project 2024cc Mths 36 Refuse Removal/Informal Areas 29 July 2015 730
Bright Idea Projects 844cc Mths 36 Refuse Removal/Informal Areas 13 January 2015 752
BTM Construction cc Mths 36 Refuse Removal/Informal Areas 13 January 2015 824
BTS Projects and Enterprise cc Mths 36 Refuse Removal/Informal Areas 19 September 2013 764
Bucks Bub Trading 11 Mths 36 Refuse Removal/Informal Areas 13 January 2015 770
Buhle Bamambo Trading Enterprise Mths 36 Refuse Removal/Informal Areas 24 June 2015 800
Burgers Trading cc Mths 26 Refuse Removal/Informal Areas 09 December 2013 408
Celmans Investment cc Mths 38 Refuse Removal/Informal Areas 09 December 2013 780
Chisamba Cleaning & Catering Services cc Mths 35 Refuse Removal/Informal Areas 05 March 2015 731
Coral Blue trading 98 Mths 36 Refuse Removal/Informal Areas 13 January 2015 770
Core KZN Catering Supplies Mths 36 Refuse Removal/Informal Areas 19 February 2015 734
Cronett Construction & Cleaning Services Mths 39 Refuse Removal/Informal Areas 09 December 2013 576
Crystal Dawn Trading 38 CC Mths 36 Refuse Removal/Informal Areas 13 January 2015 800
Deborah 1 Trading Enterprise (Pty) Ltd Mths 36 Refuse Removal/Informal Areas 13 January 2015 793
Dibongs Trading Enterprise cc Mths 36 Refuse Removal/Informal Areas 13 January 2015 700
Dimba's Cleaning & Waste Removal cc Mths 39 Refuse Removal/Informal Areas 09 December 2013 1,094
Divine Dollar Trading 41CC Mths 36 Refuse Removal/Informal Areas 24 June 2015 770
Dlelanga Construction cc Mths 24 Refuse Removal/Informal Areas 31 October 2013 475
Dlovukazi Trading 11 Mths 36 Refuse Removal/Informal Areas 24 June 2015 824
Donald Duck Trading 15 Mths 36 Refuse Removal/Informal Areas 24 June 2015 770
DSB Built Environment Project cc Mths 36 Refuse Removal/Informal Areas 13 January 2015 514
Dubandlela Business Enterprise cc Mths 36 Refuse Removal/Informal Areas 13 January 2015 622
Emthobeni Contractors cc Mths 38 Refuse Removal/Informal Areas 09 December 2013 752
Enyakatho Trading cc Mths 39 Refuse Removal/Informal Areas 09 December 2013 746
Esibhambeni Trading cc Mths 39 Refuse Removal/Informal Areas 09 December 2013 817
Ethabo Trading Enterprise Mths 35 Refuse Removal/Informal Areas 09 September 2015 731
Eyethu Cleaning & Gardening Services CC Mths 36 Refuse Removal/Informal Areas 08 July 2015 608
Famous Trio Contracting & Trading cc Mths 36 Refuse Removal/Informal Areas 13 January 2015 739
Fano & Jiji Trading Enterprise cc Mths 36 Refuse Removal/Informal Areas 13 January 2015 735
Feziwe Zozi Construction cc Mths 39 Refuse Removal/Informal Areas 09 December 2013 743
Fikisiwe Trading Enterprise cc Mths 44 Refuse Removal/Informal Areas 31 October 2013 992
G K Rainbow Construction CS CC Mths 36 Refuse Removal/Informal Areas 13 January 2015 734
Gilonki Omkhulu Trading Enterprise cc Mths 36 Refuse Removal/Informal Areas 13 January 2015 796
Giwethelo Trading Enterprise Mths 35 Refuse Removal/Informal Areas 07 August 2015 714
Godide Investments Mths 36 Refuse Removal/Informal Areas 13 January 2015 765
Gold and Silver Construction cc Mths 36 Refuse Removal/Informal Areas 19 February 2015 732
Golden Rewards 1621 t/a Eyatho Projects Mths 36 Refuse Removal/Informal Areas 13 January 2015 804
GS Zuma t/a Power Cleaning Services Mths 36 Refuse Removal/Informal Areas 13 January 2015 734
GS Zuma t/a Power Cleaning Services Mths 24 Refuse Removal/Informal Areas 31 October 2013 495
Gwala Rememberance Trading cc Mths 36 Refuse Removal/Informal Areas 13 January 2015 713
Hanifa Contractors cc Mths 39 Refuse Removal/Informal Areas 09 December 2013 1,126
Hlabana Educational Consultants cc Mths 36 Refuse Removal/Informal Areas 13 January 2015 441
Hlabangani and Mdunge Trading cc Mths 39 Refuse Removal/Informal Areas 09 December 2013 850
Hlengiwe T/A Nolwandle Projects Mths 39 Refuse Removal/Informal Areas 09 December 2013 845
Hlwanyela Trading 5 cc Mths 36 Refuse Removal/Informal Areas 13 May 2015 919
Hlwanyela Trading 6 cc Mths 24 Refuse Removal/Informal Areas 31 October 2013 515
Howlong Trading 6cc Mths 36 Refuse Removal/Informal Areas 13 January 2015 754
Ibanga Contracting Services cc Mths 39 Refuse Removal/Informal Areas 09 December 2013 901
Iminiyenkululeko Trading Enterprise cc Mths 39 Refuse Removal/Informal Areas 09 December 2013 895
Impovani Trading cc Mths 24 Refuse Removal/Informal Areas 31 October 2013 488
Imvukuzane Co/operativa Limited Mths 38 Refuse Removal/Informal Areas 09 December 2013 755
Incanga Trading cc Mths 39 Refuse Removal/Informal Areas 09 December 2013 928
Ingelosi Trading 267 cc Mths 36 Refuse Removal/Informal Areas 13 January 2015 721
Inhlanitano Trading enterprise Mths 34 Refuse Removal/Informal Areas 09 August 2015 643
Inkemba Yethu Contracting and services Mths 36 Refuse Removal/Informal Areas 13 January 2015 804
Inkosi Inomusa Trading Enterprise cc Mths 24 Refuse Removal/Informal Areas 31 October 2013 356
Inkosi Inomusa Trading Enterprise cc Mths 36 Refuse Removal/Informal Areas 13 January 2015 739
Insonyama Trading Enterprise cc Mths 24 Refuse Removal/Informal Areas 31 October 2013 491
Intshisekelo Yabasha Trading cc Mths 35 Refuse Removal/Informal Areas 06 October 2014 716
Iphangwa Trading Enterprise Mths 36 Refuse Removal/Informal Areas 13 January 2015 691
127

ETH eThekwini - Supporting Table SA32 List of external mechanisms
External mechanismPeriod of
agreement 1.
Monetary value
of agreement 2.
Name of organisation Number R thousand
Yrs/ Mths Service provided
Expiry date of service
delivery agreement or
contract
Is'xaxa Trading Enterprise Mths 36 Refuse Removal/Informal Areas 13 January 2015 734
Isakabuli Trading cc Mths 36 Refuse Removal/Informal Areas 13 January 2015 719
Isamkelo Sekhethelo Trading cc Mths 44 Refuse Removal/Informal Areas 09 December 2013 1,045
Isawale Trading cc Mths 36 Refuse Removal/Informal Areas 13 January 2015 756
Isinqawenqawe Trading Enterprise Mths 24 Refuse Removal/Informal Areas 31 October 2013 475
Isithunzi Consulting cc Mths 36 Refuse Removal/Informal Areas 15 April 2014 650
Isizindasabantu Mths 35 Refuse Removal/Informal Areas 07 August 2015 715
Isolengweni Trading cc Mths 39 Refuse Removal/Informal Areas 09 December 2013 871
Ithubelihle Construction & Projects cc Mths 24 Refuse Removal/Informal Areas 31 October 2013 485
Izinhlaba Cleaning Services & Projects Mths 36 Refuse Removal/Informal Areas 13 January 2015 752
JM Shuping and Associates CC Mths 35 Refuse Removal/Informal Areas 07 August 2015 714
Jolomu Trading cc Mths 36 Refuse Removal/Informal Areas 13 January 2015 717
Kanathu Trading Mths 35 Refuse Removal/Informal Areas 07 August 2015 710
Khayalombuso Trading and Supply Mths 36 Refuse Removal/Informal Areas 13 April 2015 731
Khe Investments cc Mths 36 Refuse Removal/Informal Areas 10 June 2014 743
Khethakanye Trading Projects 191 Mths 35 Refuse Removal/Informal Areas 09 February 2015 609
Khethathina Business Enterprise cc Mths 38 Refuse Removal/Informal Areas 10 December 2013 773
Khethezakhe Trading Services cc Mths 38 Refuse Removal/Informal Areas 10 December 2013 782
Khethimfundo Trading & Services Mths 36 Refuse Removal/Informal Areas 13 January 2015 653
Khumalo Thembisile L (7405101168080) Mths 24 Refuse Removal/Informal Areas 31 October 2013 171
Khonzokwakhe Trading cc Mths 36 Refuse Removal/Informal Areas 13 January 2015 823
Kop Trading Enterprise cc Mths 24 Refuse Removal/Informal Areas 31 October 2013 586
Kukhona Construction cc Mths 39 Refuse Removal/Informal Areas 09 December 2013 857
Kuyanambitheka Catering & Trading cc Mths 39 Refuse Removal/Informal Areas 09 December 2013 761
Kuyanambitheka Catering and Trading Mths 36 Refuse Removal/Informal Areas 13 January 2015 665
Kwakhulekhaya Catering & Trading Mths 14 Refuse Removal/Informal Areas 09 December 2013 237
Kwamatimba Projects cc Mths 46 Refuse Removal/Informal Areas 01 December 2015 938
Kwela Musa Trading Mths 36 Refuse Removal/Informal Areas 13 January 2015 804
Kwenza Manje Trading 118 cc Mths 35 Refuse Removal/Informal Areas 02 January 2015 691
L P H M Trading Enterprise cc Mths 36 Refuse Removal/Informal Areas 13 January 2015 612
L. C Herc Trading Enterprise 8 Mths 36 Refuse Removal/Informal Areas 24 June 2015 739
Labhecebomvu Trading Enterprise cc Mths 39 Refuse Removal/Informal Areas 09 December 2013 464
Labhecelibomvu Trading Enteprise cc Mths 36 Refuse Removal/Informal Areas 13 January 2015 721
Lalalulaza Trading Mths 36 Refuse Removal/Informal Areas 15 April 2014 732
Langasikothe Cleaning Services cc Mths 39 Refuse Removal/Informal Areas 09 December 2013 829
Legal Gentleman Investment cc Mths 36 Refuse Removal/Informal Areas 13 January 2015 831
Lerumo La Sethaba Enterprise 41 Mths 36 Refuse Removal/Informal Areas 19 September 2013 788
Lethusizo Trading cc Mths 36 Refuse Removal/Informal Areas 31 January 2015 765
L N Mohlokoane (6308105680087) Mths 39 Refuse Removal/Informal Areas 09 December 2013 938
Lingolight Trading cc Mths 39 Refuse Removal/Informal Areas 09 December 2013 860
Lipekwa Trading Enterprise 5 Mths 36 Refuse Removal/Informal Areas 24 July 2014 743
Lugajui 1 Trading Enterprise cc Mths 39 Refuse Removal/Informal Areas 09 December 2013 707
Lungza Management Consultants cc Mths 36 Refuse Removal/Informal Areas 13 January 2015 772
Luyanda Olwazi Ulwazi Trading cc Mths 35 Refuse Removal/Informal Areas 06 October 2014 722
Macolocolo Trading Enterprise cc Mths 36 Refuse Removal/Informal Areas 13 January 2015 731
Madala B. D. (5911250716084) Mths 24 Refuse Removal/Informal Areas 31 October 2013 538
Madawuse Business Trading cc Mths 24 Refuse Removal/Informal Areas 31 October 2013 485
Makalishi Trading Enterprise cc Mths 36 Refuse Removal/Informal Areas 13 January 2015 766
Malusisi Contracting & Trading cc Mths 36 Refuse Removal/Informal Areas 13 January 2015 679
Malusisi Contracting & Trading cc Mths 36 Refuse Removal/Informal Areas 24 June 2015 805
Mampakwana Trading Enterprise cc Mths 36 Refuse Removal/Informal Areas 13 January 2015 711
Mandlafo Trading cc Mths 36 Refuse Removal/Informal Areas 13 January 2015 714
Mashalofu Business Enterprise Mths 35 Refuse Removal/Informal Areas 02 October 2015 744
Masifundisane Trading cc Mths 37 Refuse Removal/Informal Areas 31 January 2015 761
Masoshumpu Trading Enterprise Mths 36 Refuse Removal/Informal Areas 13 January 2015 787
Masuku Cleaners 1cc Mths 39 Refuse Removal/Informal Areas 09 December 2013 804
Mataka Gogo Trading cc Mths 37 Refuse Removal/Informal Areas 31 January 2015 796
Mathula Landscaping & Civil Construction Mths 36 Refuse Removal/Informal Areas 13 January 2015 551
Mathula Landscaping & Civil Construction Mths 36 Refuse Removal/Informal Areas 13 January 2015 819
Mbambos Waste Removal Mths 36 Refuse Removal/Informal Areas 13 January 2015 735
Mbuso's Contracting and Trading cc Mths 39 Refuse Removal/Informal Areas 09 December 2013 862
Mdabukelwa Tree Felling cc Mths 24 Refuse Removal/Informal Areas 31 October 2013 478
Mdimbaz Contracting & Trading cc Mths 39 Refuse Removal/Informal Areas 09 December 2013 796
Mdimbaz Contracting & Trading cc Mths 36 Refuse Removal/Informal Areas 13 January 2015 796
Meridian Hardware & Construction Mths 36 Refuse Removal/Informal Areas 27 May 2015 829
Meydura Trading Services Mths 35 Refuse Removal/Informal Areas 02 January 2015 800
Mgadeni Trading Enterprise cc Mths 39 Refuse Removal/Informal Areas 09 December 2013 772
128
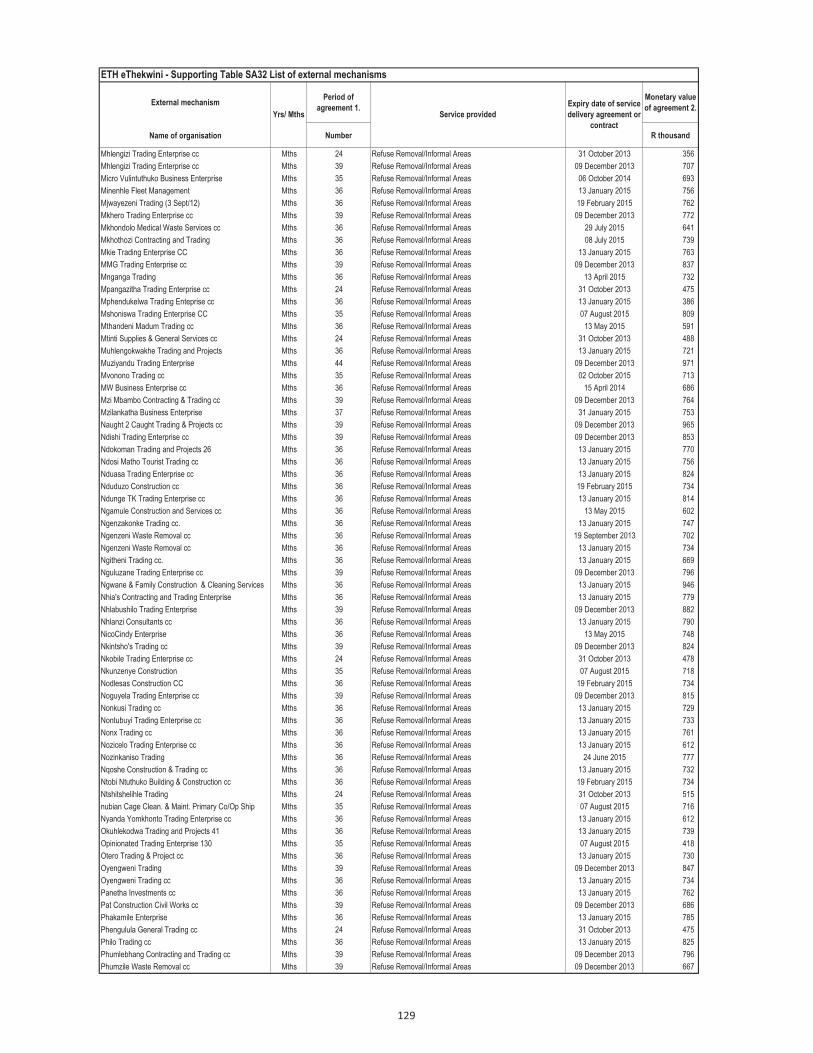
ETH eThekwini - Supporting Table SA32 List of external mechanisms
External mechanismPeriod of
agreement 1.
Monetary value
of agreement 2.
Name of organisation Number R thousand
Yrs/ Mths Service provided
Expiry date of service
delivery agreement or
contract
Mhlengizi Trading Enterprise cc Mths 24 Refuse Removal/Informal Areas 31 October 2013 356
Mhlengizi Trading Enterprise cc Mths 39 Refuse Removal/Informal Areas 09 December 2013 707
Micro Vulintuthuko Business Enterprise Mths 35 Refuse Removal/Informal Areas 06 October 2014 693
Minenhle Fleet Management Mths 36 Refuse Removal/Informal Areas 13 January 2015 756
Mjwayezeni Trading (3 Sept/12) Mths 36 Refuse Removal/Informal Areas 19 February 2015 762
Mkhero Trading Enterprise cc Mths 39 Refuse Removal/Informal Areas 09 December 2013 772
Mkhondolo Medical Waste Services cc Mths 36 Refuse Removal/Informal Areas 29 July 2015 641
Mkhothozi Contracting and Trading Mths 36 Refuse Removal/Informal Areas 08 July 2015 739
Mkie Trading Enterprise CC Mths 36 Refuse Removal/Informal Areas 13 January 2015 763
MMG Trading Enterprise cc Mths 39 Refuse Removal/Informal Areas 09 December 2013 837
Mnganga Trading Mths 36 Refuse Removal/Informal Areas 13 April 2015 732
Mpangazitha Trading Enterprise cc Mths 24 Refuse Removal/Informal Areas 31 October 2013 475
Mphendukelwa Trading Enteprise cc Mths 36 Refuse Removal/Informal Areas 13 January 2015 386
Mshoniswa Trading Enterprise CC Mths 35 Refuse Removal/Informal Areas 07 August 2015 809
Mthandeni Madum Trading cc Mths 36 Refuse Removal/Informal Areas 13 May 2015 591
Mtinti Supplies & General Services cc Mths 24 Refuse Removal/Informal Areas 31 October 2013 488
Muhlengokwakhe Trading and Projects Mths 36 Refuse Removal/Informal Areas 13 January 2015 721
Muziyandu Trading Enterprise Mths 44 Refuse Removal/Informal Areas 09 December 2013 971
Mvonono Trading cc Mths 35 Refuse Removal/Informal Areas 02 October 2015 713
MW Business Enterprise cc Mths 36 Refuse Removal/Informal Areas 15 April 2014 686
Mzi Mbambo Contracting & Trading cc Mths 39 Refuse Removal/Informal Areas 09 December 2013 764
Mzilankatha Business Enterprise Mths 37 Refuse Removal/Informal Areas 31 January 2015 753
Naught 2 Caught Trading & Projects cc Mths 39 Refuse Removal/Informal Areas 09 December 2013 965
Ndishi Trading Enterprise cc Mths 39 Refuse Removal/Informal Areas 09 December 2013 853
Ndokoman Trading and Projects 26 Mths 36 Refuse Removal/Informal Areas 13 January 2015 770
Ndosi Matho Tourist Trading cc Mths 36 Refuse Removal/Informal Areas 13 January 2015 756
Nduasa Trading Enterprise cc Mths 36 Refuse Removal/Informal Areas 13 January 2015 824
Nduduzo Construction cc Mths 36 Refuse Removal/Informal Areas 19 February 2015 734
Ndunge TK Trading Enterprise cc Mths 36 Refuse Removal/Informal Areas 13 January 2015 814
Ngamule Construction and Services cc Mths 36 Refuse Removal/Informal Areas 13 May 2015 602
Ngenzakonke Trading cc. Mths 36 Refuse Removal/Informal Areas 13 January 2015 747
Ngenzeni Waste Removal cc Mths 36 Refuse Removal/Informal Areas 19 September 2013 702
Ngenzeni Waste Removal cc Mths 36 Refuse Removal/Informal Areas 13 January 2015 734
Ngitheni Trading cc. Mths 36 Refuse Removal/Informal Areas 13 January 2015 669
Nguluzane Trading Enterprise cc Mths 39 Refuse Removal/Informal Areas 09 December 2013 796
Ngwane & Family Construction & Cleaning Services Mths 36 Refuse Removal/Informal Areas 13 January 2015 946
Nhia's Contracting and Trading Enterprise Mths 36 Refuse Removal/Informal Areas 13 January 2015 779
Nhlabushilo Trading Enterprise Mths 39 Refuse Removal/Informal Areas 09 December 2013 882
Nhlanzi Consultants cc Mths 36 Refuse Removal/Informal Areas 13 January 2015 790
NicoCindy Enterprise Mths 36 Refuse Removal/Informal Areas 13 May 2015 748
Nkintsho's Trading cc Mths 39 Refuse Removal/Informal Areas 09 December 2013 824
Nkobile Trading Enterprise cc Mths 24 Refuse Removal/Informal Areas 31 October 2013 478
Nkunzenye Construction Mths 35 Refuse Removal/Informal Areas 07 August 2015 718
Nodlesas Construction CC Mths 36 Refuse Removal/Informal Areas 19 February 2015 734
Noguyela Trading Enterprise cc Mths 39 Refuse Removal/Informal Areas 09 December 2013 815
Nonkusi Trading cc Mths 36 Refuse Removal/Informal Areas 13 January 2015 729
Nontubuyi Trading Enterprise cc Mths 36 Refuse Removal/Informal Areas 13 January 2015 733
Nonx Trading cc Mths 36 Refuse Removal/Informal Areas 13 January 2015 761
Nozicelo Trading Enterprise cc Mths 36 Refuse Removal/Informal Areas 13 January 2015 612
Nozinkaniso Trading Mths 36 Refuse Removal/Informal Areas 24 June 2015 777
Nqoshe Construction & Trading cc Mths 36 Refuse Removal/Informal Areas 13 January 2015 732
Ntobi Ntuthuko Building & Construction cc Mths 36 Refuse Removal/Informal Areas 19 February 2015 734
Ntshitshelihle Trading Mths 24 Refuse Removal/Informal Areas 31 October 2013 515
nubian Cage Clean. & Maint. Primary Co/Op Ship Mths 35 Refuse Removal/Informal Areas 07 August 2015 716
Nyanda Yomkhonto Trading Enterprise cc Mths 36 Refuse Removal/Informal Areas 13 January 2015 612
Okuhlekodwa Trading and Projects 41 Mths 36 Refuse Removal/Informal Areas 13 January 2015 739
Opinionated Trading Enterprise 130 Mths 35 Refuse Removal/Informal Areas 07 August 2015 418
Otero Trading & Project cc Mths 36 Refuse Removal/Informal Areas 13 January 2015 730
Oyengweni Trading Mths 39 Refuse Removal/Informal Areas 09 December 2013 847
Oyengweni Trading cc Mths 36 Refuse Removal/Informal Areas 13 January 2015 734
Panetha Investments cc Mths 36 Refuse Removal/Informal Areas 13 January 2015 762
Pat Construction Civil Works cc Mths 39 Refuse Removal/Informal Areas 09 December 2013 686
Phakamile Enterprise Mths 36 Refuse Removal/Informal Areas 13 January 2015 785
Phengulula General Trading cc Mths 24 Refuse Removal/Informal Areas 31 October 2013 475
Philo Trading cc Mths 36 Refuse Removal/Informal Areas 13 January 2015 825
Phumlebhang Contracting and Trading cc Mths 39 Refuse Removal/Informal Areas 09 December 2013 796
Phumzile Waste Removal cc Mths 39 Refuse Removal/Informal Areas 09 December 2013 667
129

ETH eThekwini - Supporting Table SA32 List of external mechanisms
External mechanismPeriod of
agreement 1.
Monetary value
of agreement 2.
Name of organisation Number R thousand
Yrs/ Mths Service provided
Expiry date of service
delivery agreement or
contract
Phuthumisa Trading Enterprise Mths 35 Refuse Removal/Informal Areas 07 August 2015 592
Pletty Trading Enterprise cc Mths 36 Refuse Removal/Informal Areas 13 January 2015 735
Pride of Nation Trading & Projects cc Mths 39 Refuse Removal/Informal Areas 09 December 2013 864
Princee Boy ZN Trading cc Mths 36 Refuse Removal/Informal Areas 13 January 2015 791
Pulata Contractors cc Mths 39 Refuse Removal/Informal Areas 09 December 2013 862
Puleng BusinessTrading cc Mths 36 Refuse Removal/Informal Areas 13 January 2015 788
Qalani Investments cc Mths 36 Refuse Removal/Informal Areas 13 January 2015 776
Qhantsi Trading Enterprise Mths 36 Refuse Removal/Informal Areas 23 November 2013 864
Qili Trading Enterprise cc Mths 36 Refuse Removal/Informal Areas 13 January 2015 734
Qokweni Contractors Mths 36 Refuse Removal/Informal Areas 13 January 2015 765
Qondeni Trading Enterprise cc Mths 36 Refuse Removal/Informal Areas 13 January 2015 765
Qoqo Contracting Services cc Mths 36 Refuse Removal/Informal Areas 13 January 2015 719
Qubees Trading Enterprise Mths 36 Refuse Removal/Informal Areas 19 February 2015 734
Qhubeza Trading (Pty) Ltd Mths 38 Refuse Removal/Informal Areas 09 December 2013 646
Ready to Trade 63 cc Mths 36 Refuse Removal/Informal Areas 13 January 2015 734
Red Devil Investments 15 Mths 36 Refuse Removal/Informal Areas 13 January 2015 770
S B Majola Construction cc Mths 36 Refuse Removal/Informal Areas 13 January 2015 756
S' Thuthumela Trading cc Mths 36 Refuse Removal/Informal Areas 13 January 2015 781
Sagemo Trading Enterprise cc Mths 36 Refuse Removal/Informal Areas 13 January 2015 732
Sakhaingcebo Trading cc. Mths 36 Refuse Removal/Informal Areas 13 January 2015 797
Sakhamuzi Trading 49cc Mths 36 Refuse Removal/Informal Areas 13 May 2015 713
Sandile's Plumbing Services Mths 36 Refuse Removal/Informal Areas 13 January 2015 783
Sandra Mkhunya Trading Enterprise cc Mths 36 Refuse Removal/Informal Areas 13 January 2015 797
Sanelez Contracting & Trading Mths 36 Refuse Removal/Informal Areas 22 May 2014 743
Sasikude Trading cc Mths 36 Refuse Removal/Informal Areas 13 January 2015 770
Sbonisiwe Investment cc Mths 36 Refuse Removal/Informal Areas 13 January 2015 599
Sekhoba Trading 21 CC Mths 36 Refuse Removal/Informal Areas 13 January 2015 770
Senatla Trading Enterprise 174 Mths 36 Refuse Removal/Informal Areas 19 February 2015 739
Senzakahle Konke Trading Enterprise Mths 36 Refuse Removal/Informal Areas 29 July 2015 753
Sesiphambili Trading cc Mths 35 Refuse Removal/Informal Areas 02 January 2015 714
Sgege Construction cc Mths 36 Refuse Removal/Informal Areas 13 January 2015 765
Shake the Blue Trading & Projects Mths 35 Refuse Removal/Informal Areas 02 October 2015 726
Shine The Way 1409 cc Mths 35 Refuse Removal/Informal Areas 09 September 2015 828
Shiyankomo Cleaning & Construction Mths 36 Refuse Removal/Informal Areas 13 January 2015 821
Shwelezeni Trading and Projects Mths 36 Refuse Removal/Informal Areas 13 April 2015 793
Sibusiso Ngidi Trading Enterprise Mths 35 Refuse Removal/Informal Areas 07 August 2015 893
Signature Brand Trading 35 Mths 36 Refuse Removal/Informal Areas 24 June 2015 732
Sihlesomusa Trading Enterprise cc Mths 24 Refuse Removal/Informal Areas 31 October 2013 357
Sisoka Business Enterprise Mths 36 Refuse Removal/Informal Areas 13 January 2015 790
Sithokomele Business Enterprise Mths 36 Refuse Removal/Informal Areas 13 January 2015 779
Sithuthukile Trading Mths 35 Refuse Removal/Informal Areas 09 February 2015 863
Siyakha Kahle Cleaning Services Mths 39 Refuse Removal/Informal Areas 09 December 2013 830
Siza Kancane Trading Enterprise 5 cc Mths 36 Refuse Removal/Informal Areas 13 January 2015 765
Sizisa Ukhanyo Trading 22 cc Mths 24 Refuse Removal/Informal Areas 31 October 2013 356
Sizisa Ukhanyo Trading 22 cc Mths 24 Refuse Removal/Informal Areas 31 October 2013 132
Siznosiza Trading Mths 36 Refuse Removal/Informal Areas 13 January 2015 809
Skills Magnate Training Consultants Mths 35 Refuse Removal/Informal Areas 02 October 2015 722
Skylark Investments 11 cc Mths 24 Refuse Removal/Informal Areas 31 October 2013 489
Smakade Trading CC Mths 36 Refuse Removal/Informal Areas 13 January 2015 824
Smanyane Construction cc Mths 36 Refuse Removal/Informal Areas 13 January 2015 790
Smooth Tomatoe Trading cc Mths 39 Refuse Removal/Informal Areas 09 December 2013 829
Snqawunqawu Trading cc Mths 36 Refuse Removal/Informal Areas 13 January 2015 657
Sodondo Trading Mths 35 Refuse Removal/Informal Areas 07 August 2015 770
Songololo Trading cc Mths 36 Refuse Removal/Informal Areas 13 January 2015 917
Sonotha Business Enterprise Mths 39 Refuse Removal/Informal Areas 09 December 2013 1,094
Sozesiwe Construction & Projects cc Mths 24 Refuse Removal/Informal Areas 31 October 2013 475
Space Way Trading cc Mths 36 Refuse Removal/Informal Areas 13 January 2015 665
Special Peak Trading & Projects cc Mths 39 Refuse Removal/Informal Areas 09 December 2013 995
Star Caller Trading and Projects cc Mths 36 Refuse Removal/Informal Areas 13 January 2015 714
Stuku's Contractors cc Mths 39 Refuse Removal/Informal Areas 09 December 2013 859
Sya/Mzamo Business Enterprise cc Mths 35 Refuse Removal/Informal Areas 06 October 2014 707
Tastey Pot Trading Enterprise Mths 39 Refuse Removal/Informal Areas 09 December 2013 796
Tendu Multiplex cc Mths 36 Refuse Removal/Informal Areas 13 January 2015 791
Tentamount Trading 133 Mths 35 Refuse Removal/Informal Areas 07 August 2015 600
Thanda Bangani Tra. & Projects cc Mths 36 Refuse Removal/Informal Areas 13 January 2015 713
Thembisile Maud Mpanza t/a Sisekelo Mths 39 Refuse Removal/Informal Areas 09 December 2013 830
Third Power Trading Enterprise Mths 45 Refuse Removal/Informal Areas 02 December 2015 961
130
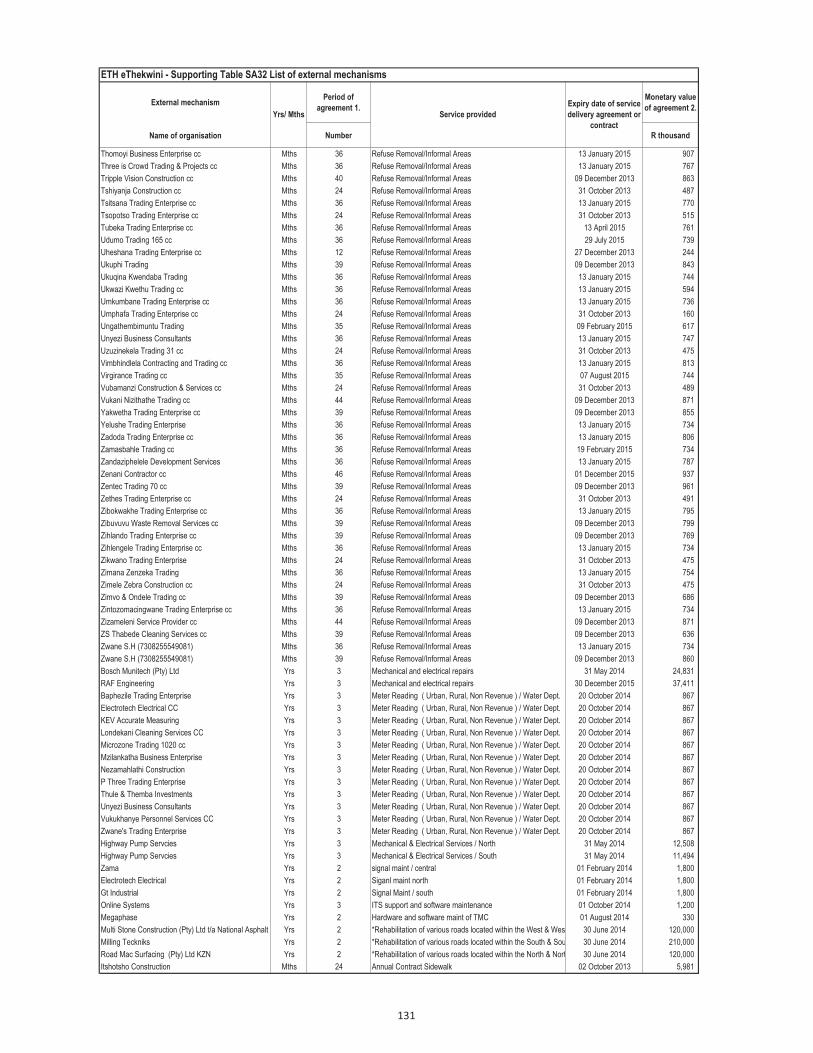
ETH eThekwini - Supporting Table SA32 List of external mechanisms
External mechanismPeriod of
agreement 1.
Monetary value
of agreement 2.
Name of organisation Number R thousand
Yrs/ Mths Service provided
Expiry date of service
delivery agreement or
contract
Thomoyi Business Enterprise cc Mths 36 Refuse Removal/Informal Areas 13 January 2015 907
Three is Crowd Trading & Projects cc Mths 36 Refuse Removal/Informal Areas 13 January 2015 767
Tripple Vision Construction cc Mths 40 Refuse Removal/Informal Areas 09 December 2013 863
Tshiyanja Construction cc Mths 24 Refuse Removal/Informal Areas 31 October 2013 487
Tsitsana Trading Enterprise cc Mths 36 Refuse Removal/Informal Areas 13 January 2015 770
Tsopotso Trading Enterprise cc Mths 24 Refuse Removal/Informal Areas 31 October 2013 515
Tubeka Trading Enterprise cc Mths 36 Refuse Removal/Informal Areas 13 April 2015 761
Udumo Trading 165 cc Mths 36 Refuse Removal/Informal Areas 29 July 2015 739
Uheshana Trading Enterprise cc Mths 12 Refuse Removal/Informal Areas 27 December 2013 244
Ukuphi Trading Mths 39 Refuse Removal/Informal Areas 09 December 2013 843
Ukuqina Kwendaba Trading Mths 36 Refuse Removal/Informal Areas 13 January 2015 744
Ukwazi Kwethu Trading cc Mths 36 Refuse Removal/Informal Areas 13 January 2015 594
Umkumbane Trading Enterprise cc Mths 36 Refuse Removal/Informal Areas 13 January 2015 736
Umphafa Trading Enterprise cc Mths 24 Refuse Removal/Informal Areas 31 October 2013 160
Ungathembimuntu Trading Mths 35 Refuse Removal/Informal Areas 09 February 2015 617
Unyezi Business Consultants Mths 36 Refuse Removal/Informal Areas 13 January 2015 747
Uzuzinekela Trading 31 cc Mths 24 Refuse Removal/Informal Areas 31 October 2013 475
Vimbhindlela Contracting and Trading cc Mths 36 Refuse Removal/Informal Areas 13 January 2015 813
Virgirance Trading cc Mths 35 Refuse Removal/Informal Areas 07 August 2015 744
Vubamanzi Construction & Services cc Mths 24 Refuse Removal/Informal Areas 31 October 2013 489
Vukani Nizithathe Trading cc Mths 44 Refuse Removal/Informal Areas 09 December 2013 871
Yakwetha Trading Enterprise cc Mths 39 Refuse Removal/Informal Areas 09 December 2013 855
Yelushe Trading Enterprise Mths 36 Refuse Removal/Informal Areas 13 January 2015 734
Zadoda Trading Enterprise cc Mths 36 Refuse Removal/Informal Areas 13 January 2015 806
Zamasbahle Trading cc Mths 36 Refuse Removal/Informal Areas 19 February 2015 734
Zandaziphelele Development Services Mths 36 Refuse Removal/Informal Areas 13 January 2015 787
Zenani Contractor cc Mths 46 Refuse Removal/Informal Areas 01 December 2015 937
Zentec Trading 70 cc Mths 39 Refuse Removal/Informal Areas 09 December 2013 961
Zethes Trading Enterprise cc Mths 24 Refuse Removal/Informal Areas 31 October 2013 491
Zibokwakhe Trading Enterprise cc Mths 36 Refuse Removal/Informal Areas 13 January 2015 795
Zibuvuvu Waste Removal Services cc Mths 39 Refuse Removal/Informal Areas 09 December 2013 799
Zihlando Trading Enterprise cc Mths 39 Refuse Removal/Informal Areas 09 December 2013 769
Zihlengele Trading Enterprise cc Mths 36 Refuse Removal/Informal Areas 13 January 2015 734
Zikwano Trading Enterprise Mths 24 Refuse Removal/Informal Areas 31 October 2013 475
Zimana Zenzeka Trading Mths 36 Refuse Removal/Informal Areas 13 January 2015 754
Zimele Zebra Construction cc Mths 24 Refuse Removal/Informal Areas 31 October 2013 475
Zimvo & Ondele Trading cc Mths 39 Refuse Removal/Informal Areas 09 December 2013 686
Zintozomacingwane Trading Enterprise cc Mths 36 Refuse Removal/Informal Areas 13 January 2015 734
Zizameleni Service Provider cc Mths 44 Refuse Removal/Informal Areas 09 December 2013 871
ZS Thabede Cleaning Services cc Mths 39 Refuse Removal/Informal Areas 09 December 2013 636
Zwane S.H (7308255549081) Mths 36 Refuse Removal/Informal Areas 13 January 2015 734
Zwane S.H (7308255549081) Mths 39 Refuse Removal/Informal Areas 09 December 2013 860
Bosch Munitech (Pty) Ltd Yrs 3 Mechanical and electrical repairs 31 May 2014 24,831
RAF Engineering Yrs 3 Mechanical and electrical repairs 30 December 2015 37,411
Baphezile Trading Enterprise Yrs 3 Meter Reading ( Urban, Rural, Non Revenue ) / Water Dept. 20 October 2014 867
Electrotech Electrical CC Yrs 3 Meter Reading ( Urban, Rural, Non Revenue ) / Water Dept. 20 October 2014 867
KEV Accurate Measuring Yrs 3 Meter Reading ( Urban, Rural, Non Revenue ) / Water Dept. 20 October 2014 867
Londekani Cleaning Services CC Yrs 3 Meter Reading ( Urban, Rural, Non Revenue ) / Water Dept. 20 October 2014 867
Microzone Trading 1020 cc Yrs 3 Meter Reading ( Urban, Rural, Non Revenue ) / Water Dept. 20 October 2014 867
Mzilankatha Business Enterprise Yrs 3 Meter Reading ( Urban, Rural, Non Revenue ) / Water Dept. 20 October 2014 867
Nezamahlathi Construction Yrs 3 Meter Reading ( Urban, Rural, Non Revenue ) / Water Dept. 20 October 2014 867
P Three Trading Enterprise Yrs 3 Meter Reading ( Urban, Rural, Non Revenue ) / Water Dept. 20 October 2014 867
Thule & Themba Investments Yrs 3 Meter Reading ( Urban, Rural, Non Revenue ) / Water Dept. 20 October 2014 867
Unyezi Business Consultants Yrs 3 Meter Reading ( Urban, Rural, Non Revenue ) / Water Dept. 20 October 2014 867
Vukukhanye Personnel Services CC Yrs 3 Meter Reading ( Urban, Rural, Non Revenue ) / Water Dept. 20 October 2014 867
Zwane's Trading Enterprise Yrs 3 Meter Reading ( Urban, Rural, Non Revenue ) / Water Dept. 20 October 2014 867
Highway Pump Servcies Yrs 3 Mechanical & Electrical Services / North 31 May 2014 12,508
Highway Pump Servcies Yrs 3 Mechanical & Electrical Services / South 31 May 2014 11,494
Zama Yrs 2 signal maint / central 01 February 2014 1,800
Electrotech Electrical Yrs 2 Siganl maint north 01 February 2014 1,800
Gt Industrial Yrs 2 Signal Maint / south 01 February 2014 1,800
Online Systems Yrs 3 ITS support and software maintenance 01 October 2014 1,200
Megaphase Yrs 2 Hardware and software maint of TMC 01 August 2014 330
Multi Stone Construction (Pty) Ltd t/a National Asphalt Yrs 2 *Rehabilitation of various roads located within the West & West Central Region of eThekwini Municipality as and when required30 June 2014 120,000
Milling Teckniks Yrs 2 *Rehabilitation of various roads located within the South & South Central Region of eThekwini Municipality as and when required30 June 2014 210,000
Road Mac Surfacing (Pty) Ltd KZN Yrs 2 *Rehabilitation of various roads located within the North & North Central Region of eThekwini Municipality as and when required30 June 2014 120,000
Itshotsho Construction Mths 24 Annual Contract Sidewalk 02 October 2013 5,981
131

ETH eThekwini - Supporting Table SA32 List of external mechanisms
External mechanismPeriod of
agreement 1.
Monetary value
of agreement 2.
Name of organisation Number R thousand
Yrs/ Mths Service provided
Expiry date of service
delivery agreement or
contract
Kholwa Construction Mths 24 Road Reserve Maintenance 1 27 July 2013 7,810
Megaphase Trading 380 cc Mths 24 Annual Contract for Road Marking 09 May 2014 4,108
Forward Infra (PTY) Ltd Mths 24 Annual Contract for Road Marking 08 May 2014 3,596
Forward Infra (PTY) Ltd Mths 24 Annual Contract for Road Marking 08 May 2014 2,281
Imbhenge, KZN Mobile, Sidoyi JV Mths 24 Annual Contract for Guradrails Repair 13 May 2014 5,919
Mahlaselondwe Trading Mths 24 Annual Contract for Guradrails Repair 13 May 2014 7,407
Sibahlesenkosi, Dinwayiniand Amanifa JV Mths 24 Annual Contract for Guradrails Repair 13 May 2014 3,804
Sibahlesenkosi, Dinwayiniand Amanifa JV Mths 24 Annual Contract for Guradrails Repair 13 May 2014 3,391
Imbhenge Trading Enterprise Mths 24 Annual Contract for Guradrails Repair 13 May 2014 3,407
Saikin Projects Mths 24 Concrete Puch outs on Edwin Swales 17 May 2014 2,422
BMK Engineering Mths 24 Task Order : Stream Cleaning 06 June 2014 4,819
Amabombo Mths 24 RRM 19 February 2015 10,712
Kholwa Construction Mths 24 RRM 19 February 2015 10,426
Bhenezuzi Construction Mths 24 RRM 19 February 2015 8,959
Uhlanga Trading Mths 24 RRM 19 February 2015 11,603
Kholwa Construction Mths 24 RRM 19 February 2015 10,426
Celusiphathe Vesankosi Mths 36 Sihlanzimvelo / Stream cleaning 31 January 2016 739
Inkayishana Contracting Mths 36 Sihlanzimvelo / Stream cleaning 31 January 2016 860
Masobaya Trading Projects Mths 36 Sihlanzimvelo / Stream cleaning 31 January 2016 860
Ngqonduzethu Cleaning Mths 36 Sihlanzimvelo / Stream cleaning 31 January 2016 860
Nguluzana Co/Operative Mths 36 Sihlanzimvelo / Stream cleaning 31 January 2016 860
Nkilitha Primary Co/Operative Mths 36 Sihlanzimvelo / Stream cleaning 31 January 2016 860
Vakasha Nathi Primary Co/op Mths 36 Sihlanzimvelo / Stream cleaning 31 January 2016 860
Banakile Multi/Purpose co/op Mths 36 Sihlanzimvelo / Stream cleaning 31 January 2016 860
Sinqobile Farm and Services Mths 36 Sihlanzimvelo / Stream cleaning 31 January 2016 860
Umnsinsi Agricultural Primary Mths 36 Sihlanzimvelo / Stream cleaning 31 January 2016 860
Umqokolo cleaning & Trading Mths 36 Sihlanzimvelo / Stream cleaning 31 January 2016 860
Ngapha naNgapha Contracting Services Mths 36 Sihlanzimvelo / Stream cleaning 31 January 2016 860
Inkanyiso Primary Co/Operatrive Mths 36 Sihlanzimvelo / Stream cleaning 31 January 2016 860
Esikhumulweni Manufacter Co/op Mths 36 Sihlanzimvelo / Stream cleaning 31 January 2016 860
Dube Bhambayi Promary Co/op Mths 36 Sihlanzimvelo / Stream cleaning 31 January 2016 860
Utalagu Co/op Mths 36 Sihlanzimvelo / Stream cleaning 31 January 2016 860
Isinama Contractors Primary Co/Op Mths 36 Sihlanzimvelo / Stream cleaning 31 January 2016 860
Bewise Primary Co/op Mths 36 Sihlanzimvelo / Stream cleaning 31 January 2016 860
Ntuzuma Primary Co/op Mths 36 Sihlanzimvelo / Stream cleaning 31 January 2016 860
Ezimangweni Refuse Collection Mths 36 Sihlanzimvelo / Stream cleaning 31 January 2016 860
Siyazisenzani Cleaning and Trading Mths 36 Sihlanzimvelo / Stream cleaning 31 January 2016 860
Vuka Behlezi sewing co/op Mths 36 Sihlanzimvelo / Stream cleaning 31 January 2016 860
Nobanjani Co/Operative Mths 36 Sihlanzimvelo / Stream cleaning 31 January 2016 860
CZibaFarming and Trading Mths 36 Sihlanzimvelo / Stream cleaning 31 January 2016 860
Mxenge 80 Co/Operative Mths 36 Sihlanzimvelo / Stream cleaning 31 January 2016 860
Mathebathebane Agriculture Mths 36 Sihlanzimvelo / Stream cleaning 31 January 2016 860
Siyaphuthuma Primary Co/op Mths 36 Sihlanzimvelo / Stream cleaning 31 January 2016 860
Noxhaka Contracting Co/op Mths 36 Sihlanzimvelo / Stream cleaning 31 January 2016 860
Abapondisi Supply and Construction Co/op Mths 36 Sihlanzimvelo / Stream cleaning 31 January 2016 860
Mazcon Mths 36 Gravel Road Maintenance for West Region 12 August 2015 54,013
Melki Mths 36 Gravel Road Maintenance for South Region 12 August 2015 68,618
Mageza James Mths 36 Gravel Road Maintenance for North Region 12 August 2015 49,343
Kwa Mashu Dry Cleaners Yrs 3 Cleaning 31 December 2014 1,291
Zimiphi Trading Yrs 3 Cleaning 31 December 2014 1,291
Frafelin Cleaning Yrs 3 Cleaning 30 September 2015 538
Klaarwater Youth Club Yrs 3 Cleaning 31 December 2015 381
Matengu Investments Yrs 2 Inspection of Standing Poles 31 January 2015 5,108
Mr Pest & Timber Preservation Yrs 2 Inspection of Standing Poles 31 January 2015 5,108
Zama Traffic Signals Yrs 2 Underground Drilling & Boring 31 January 2015 5,000
Kevin Pratt Yrs 2 House Services 28 February 2015 1,500
Dentris Electrical Yrs 2 House Services 28 February 2015 1,500
DJF Electrical Yrs 2 House Services 28 February 2015 1,500
Atam Electrical Yrs 2 House Services 28 February 2015 1,500
Kuntwela Yrs 2 House Services 28 February 2015 1,500
Mzungezwa Projects Yrs 2 House Services 28 February 2015 1,500
Mpiyonke Construction Yrs 2 House Services 28 February 2015 1,500
Howard Yrs 2 House Services 28 February 2015 1,500
Khombezakhe Contractors Yrs 2 House Services 28 February 2015 1,500
ES Electrical Yrs 2 House Services 28 February 2015 1,500
Ubambo Bambo Yrs 2 House Services 28 February 2015 1,500
Biytech Yrs 2 House Services 28 February 2015 1,500
132
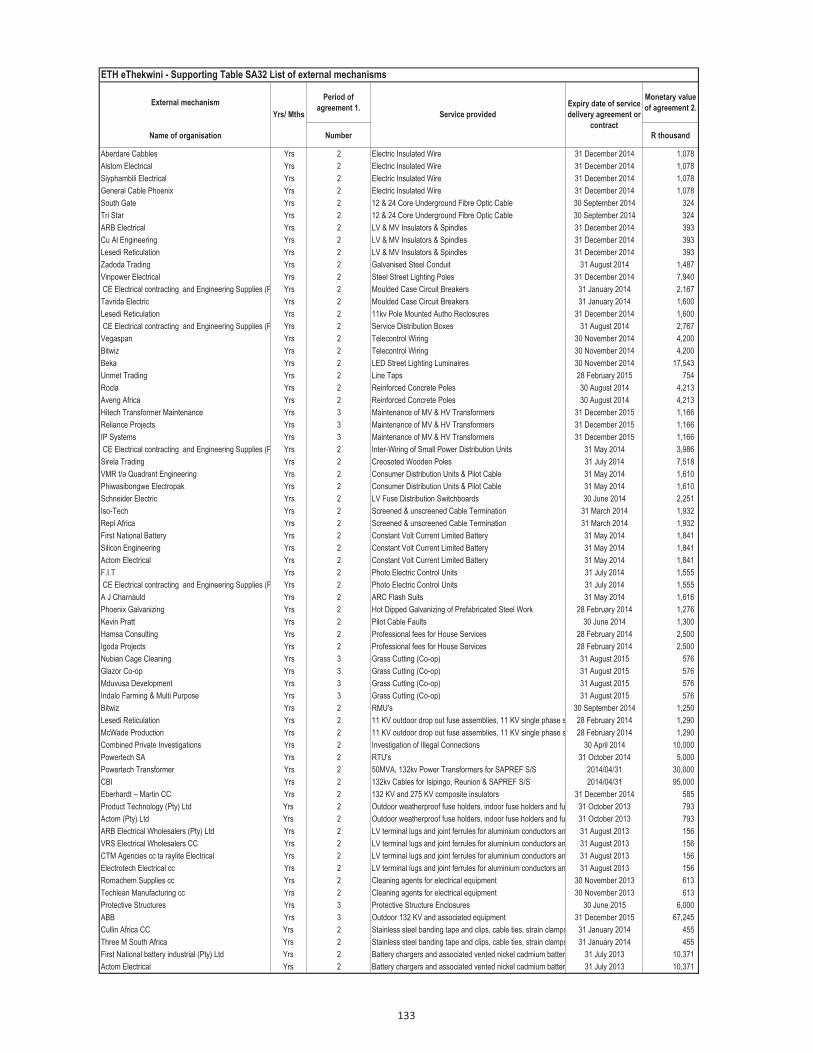
ETH eThekwini - Supporting Table SA32 List of external mechanisms
External mechanismPeriod of
agreement 1.
Monetary value
of agreement 2.
Name of organisation Number R thousand
Yrs/ Mths Service provided
Expiry date of service
delivery agreement or
contract
Aberdare Cabbles Yrs 2 Electric Insulated Wire 31 December 2014 1,078
Alstom Electrical Yrs 2 Electric Insulated Wire 31 December 2014 1,078
Siyphambili Electrical Yrs 2 Electric Insulated Wire 31 December 2014 1,078
General Cable Phoenix Yrs 2 Electric Insulated Wire 31 December 2014 1,078
South Gate Yrs 2 12 & 24 Core Underground Fibre Optic Cable 30 September 2014 324
Tri Star Yrs 2 12 & 24 Core Underground Fibre Optic Cable 30 September 2014 324
ARB Electrical Yrs 2 LV & MV Insulators & Spindles 31 December 2014 393
Cu Al Engineering Yrs 2 LV & MV Insulators & Spindles 31 December 2014 393
Lesedi Reticulation Yrs 2 LV & MV Insulators & Spindles 31 December 2014 393
Zadoda Trading Yrs 2 Galvanised Steel Conduit 31 August 2014 1,487
Vinpower Electrical Yrs 2 Steel Street Lighting Poles 31 December 2014 7,940
CE Electrical contracting and Engineering Supplies (Pty) LtdYrs 2 Moulded Case Circuit Breakers 31 January 2014 2,167
Tavrida Electric Yrs 2 Moulded Case Circuit Breakers 31 January 2014 1,600
Lesedi Reticulation Yrs 2 11kv Pole Mounted Autho Reclosures 31 December 2014 1,600
CE Electrical contracting and Engineering Supplies (Pty) LtdYrs 2 Service Distribution Boxes 31 August 2014 2,767
Vegaspan Yrs 2 Telecontrol Wiring 30 November 2014 4,200
Bitwiz Yrs 2 Telecontrol Wiring 30 November 2014 4,200
Beka Yrs 2 LED Street Lighting Luminaires 30 November 2014 17,543
Unmet Trading Yrs 2 Line Taps 28 February 2015 754
Rocla Yrs 2 Reinforced Concrete Poles 30 August 2014 4,213
Aveng Africa Yrs 2 Reinforced Concrete Poles 30 August 2014 4,213
Hitech Transformer Maintenance Yrs 3 Maintenance of MV & HV Transformers 31 December 2015 1,166
Reliance Projects Yrs 3 Maintenance of MV & HV Transformers 31 December 2015 1,166
IP Systems Yrs 3 Maintenance of MV & HV Transformers 31 December 2015 1,166
CE Electrical contracting and Engineering Supplies (Pty) LtdYrs 2 Inter-Wiring of Small Power Distribution Units 31 May 2014 3,986
Sirela Trading Yrs 2 Creosoted Wooden Poles 31 July 2014 7,518
VMR t/a Quadrant Engineering Yrs 2 Consumer Distribution Units & Pilot Cable 31 May 2014 1,610
Phiwasibongwe Electropak Yrs 2 Consumer Distribution Units & Pilot Cable 31 May 2014 1,610
Schneider Electric Yrs 2 LV Fuse Distribution Switchboards 30 June 2014 2,251
Iso-Tech Yrs 2 Screened & unscreened Cable Termination 31 March 2014 1,932
Repl Africa Yrs 2 Screened & unscreened Cable Termination 31 March 2014 1,932
First National Battery Yrs 2 Constant Volt Current Limited Battery 31 May 2014 1,841
Silicon Engineering Yrs 2 Constant Volt Current Limited Battery 31 May 2014 1,841
Actom Electrical Yrs 2 Constant Volt Current Limited Battery 31 May 2014 1,841
F.I.T Yrs 2 Photo Electric Control Units 31 July 2014 1,555
CE Electrical contracting and Engineering Supplies (Pty) LtdYrs 2 Photo Electric Control Units 31 July 2014 1,555
A J Charnauld Yrs 2 ARC Flash Suits 31 May 2014 1,616
Phoenix Galvanizing Yrs 2 Hot Dipped Galvanizing of Prefabricated Steel Work 28 February 2014 1,276
Kevin Pratt Yrs 2 Pilot Cable Faults 30 June 2014 1,300
Hamsa Consulting Yrs 2 Professional fees for House Services 28 February 2014 2,500
Igoda Projects Yrs 2 Professional fees for House Services 28 February 2014 2,500
Nubian Cage Cleaning Yrs 3 Grass Cutting (Co-op) 31 August 2015 576
Glazor Co-op Yrs 3 Grass Cutting (Co-op) 31 August 2015 576
Mduvusa Development Yrs 3 Grass Cutting (Co-op) 31 August 2015 576
Indalo Farming & Multi Purpose Yrs 3 Grass Cutting (Co-op) 31 August 2015 576
Bitwiz Yrs 2 RMU's 30 September 2014 1,250
Lesedi Reticulation Yrs 2 11 KV outdoor drop out fuse assemblies, 11 KV single phase switches and 11 KV outdoor gang operated link switches28 February 2014 1,290
McWade Production Yrs 2 11 KV outdoor drop out fuse assemblies, 11 KV single phase switches and 11 KV outdoor gang operated link switches28 February 2014 1,290
Combined Private Investigations Yrs 2 Investigation of Illegal Connections 30 April 2014 10,000
Powertech SA Yrs 2 RTU's 31 October 2014 5,000
Powertech Transformer Yrs 2 50MVA, 132kv Power Transformers for SAPREF S/S 2014/04/31 30,000
CBI Yrs 2 132kv Cables for Isipingo, Reunion & SAPREF S/S 2014/04/31 95,000
Eberhardt – Martin CC Yrs 2 132 KV and 275 KV composite insulators 31 December 2014 585
Product Technology (Pty) Ltd Yrs 2 Outdoor weatherproof fuse holders, indoor fuse holders and fuse switch dis connectors31 October 2013 793
Actom (Pty) Ltd Yrs 2 Outdoor weatherproof fuse holders, indoor fuse holders and fuse switch dis connectors31 October 2013 793
ARB Electrical Wholesalers (Pty) Ltd Yrs 2 LV terminal lugs and joint ferrules for aluminium conductors and conductors 31 August 2013 156
VRS Electrical Wholesalers CC Yrs 2 LV terminal lugs and joint ferrules for aluminium conductors and conductors 31 August 2013 156
CTM Agencies cc ta raylite Electrical Yrs 2 LV terminal lugs and joint ferrules for aluminium conductors and conductors 31 August 2013 156
Electrotech Electrical cc Yrs 2 LV terminal lugs and joint ferrules for aluminium conductors and conductors 31 August 2013 156
Romachem Supplies cc Yrs 2 Cleaning agents for electrical equipment 30 November 2013 613
Techlean Manufacturing cc Yrs 2 Cleaning agents for electrical equipment 30 November 2013 613
Protective Structures Yrs 3 Protective Structure Enclosures 30 June 2015 6,000
ABB Yrs 3 Outdoor 132 KV and associated equipment 31 December 2015 67,245
Cullin Africa CC Yrs 2 Stainless steel banding tape and clips, cable ties, strain clamps, smart bands, smart band semi releasable heads, wire connecto31 January 2014 455
Three M South Africa Yrs 2 Stainless steel banding tape and clips, cable ties, strain clamps, smart bands, smart band semi releasable heads, wire connecto31 January 2014 455
First National battery industrial (Pty) Ltd Yrs 2 Battery chargers and associated vented nickel cadmium battery banks31 July 2013 10,371
Actom Electrical Yrs 2 Battery chargers and associated vented nickel cadmium battery banks31 July 2013 10,371
133
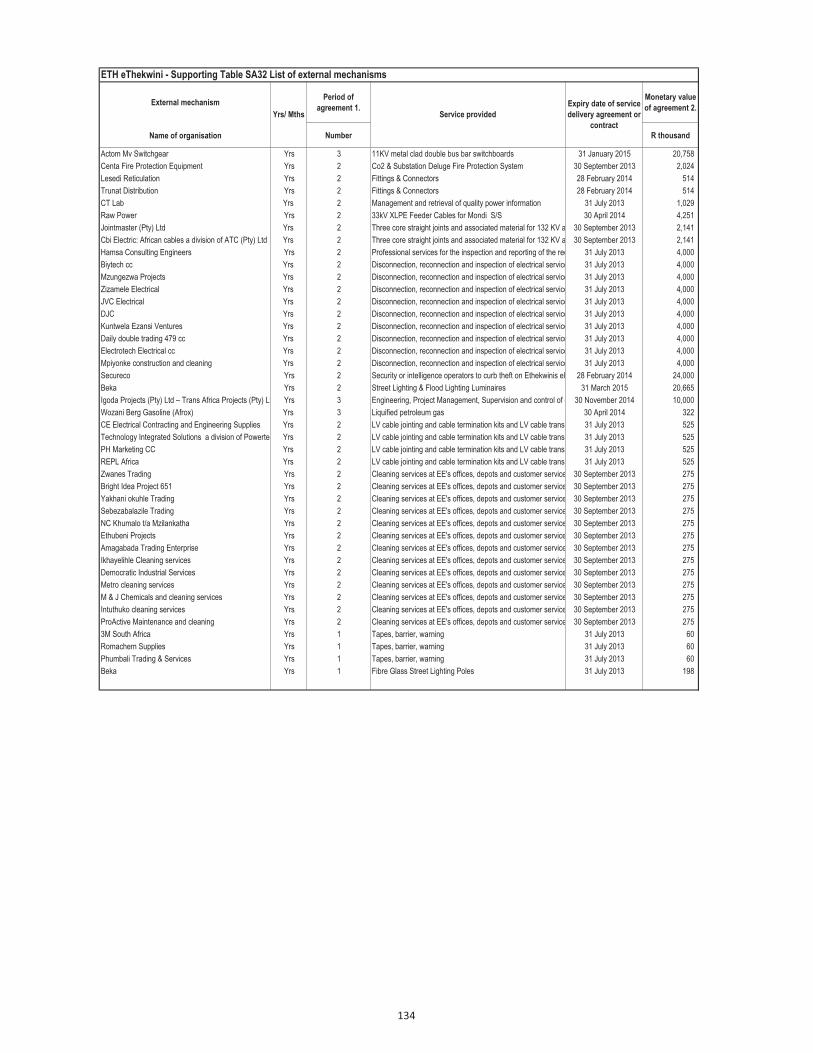
ETH eThekwini - Supporting Table SA32 List of external mechanisms
External mechanismPeriod of
agreement 1.
Monetary value
of agreement 2.
Name of organisation Number R thousand
Yrs/ Mths Service provided
Expiry date of service
delivery agreement or
contract
Actom Mv Switchgear Yrs 3 11KV metal clad double bus bar switchboards 31 January 2015 20,758
Centa Fire Protection Equipment Yrs 2 Co2 & Substation Deluge Fire Protection System 30 September 2013 2,024
Lesedi Reticulation Yrs 2 Fittings & Connectors 28 February 2014 514
Trunat Distribution Yrs 2 Fittings & Connectors 28 February 2014 514
CT Lab Yrs 2 Management and retrieval of quality power information 31 July 2013 1,029
Raw Power Yrs 2 33kV XLPE Feeder Cables for Mondi S/S 30 April 2014 4,251
Jointmaster (Pty) Ltd Yrs 2 Three core straight joints and associated material for 132 KV and 33 KV fluid filled cables30 September 2013 2,141
Cbi Electric: African cables a division of ATC (Pty) Ltd Yrs 2 Three core straight joints and associated material for 132 KV and 33 KV fluid filled cables30 September 2013 2,141
Hamsa Consulting Engineers Yrs 2 Professional services for the inspection and reporting of the required maintenance for eThekwini Electricty's distribution netw31 July 2013 4,000
Biytech cc Yrs 2 Disconnection, reconnection and inspection of electrical services/meters31 July 2013 4,000
Mzungezwa Projects Yrs 2 Disconnection, reconnection and inspection of electrical services/meters31 July 2013 4,000
Zizamele Electrical Yrs 2 Disconnection, reconnection and inspection of electrical services/meters31 July 2013 4,000
JVC Electrical Yrs 2 Disconnection, reconnection and inspection of electrical services/meters31 July 2013 4,000
DJC Yrs 2 Disconnection, reconnection and inspection of electrical services/meters31 July 2013 4,000
Kuntwela Ezansi Ventures Yrs 2 Disconnection, reconnection and inspection of electrical services/meters31 July 2013 4,000
Daily double trading 479 cc Yrs 2 Disconnection, reconnection and inspection of electrical services/meters31 July 2013 4,000
Electrotech Electrical cc Yrs 2 Disconnection, reconnection and inspection of electrical services/meters31 July 2013 4,000
Mpiyonke construction and cleaning Yrs 2 Disconnection, reconnection and inspection of electrical services/meters31 July 2013 4,000
Secureco Yrs 2 Security or intelligence operators to curb theft on Ethekwinis electrical network28 February 2014 24,000
Beka Yrs 2 Street Lighting & Flood Lighting Luminaires 31 March 2015 20,665
Igoda Projects (Pty) Ltd – Trans Africa Projects (Pty) Ltd Joint VentureYrs 3 Engineering, Project Management, Supervision and control of contract 896030 November 2014 10,000
Wozani Berg Gasoline (Afrox) Yrs 3 Liquified petroleum gas 30 April 2014 322
CE Electrical Contracting and Engineering Supplies Yrs 2 LV cable jointing and cable termination kits and LV cable transition jointing kits31 July 2013 525
Technology Integrated Solutions a division of Powertech SA (Pty) Ltd Yrs 2 LV cable jointing and cable termination kits and LV cable transition jointing kits31 July 2013 525
PH Marketing CC Yrs 2 LV cable jointing and cable termination kits and LV cable transition jointing kits31 July 2013 525
REPL Africa Yrs 2 LV cable jointing and cable termination kits and LV cable transition jointing kits31 July 2013 525
Zwanes Trading Yrs 2 Cleaning services at EE's offices, depots and customer services 30 September 2013 275
Bright Idea Project 651 Yrs 2 Cleaning services at EE's offices, depots and customer services 30 September 2013 275
Yakhani okuhle Trading Yrs 2 Cleaning services at EE's offices, depots and customer services 30 September 2013 275
Sebezabalazile Trading Yrs 2 Cleaning services at EE's offices, depots and customer services 30 September 2013 275
NC Khumalo t/a Mzilankatha Yrs 2 Cleaning services at EE's offices, depots and customer services 30 September 2013 275
Ethubeni Projects Yrs 2 Cleaning services at EE's offices, depots and customer services 30 September 2013 275
Amagabada Trading Enterprise Yrs 2 Cleaning services at EE's offices, depots and customer services 30 September 2013 275
Ikhayelihle Cleaning services Yrs 2 Cleaning services at EE's offices, depots and customer services 30 September 2013 275
Democratic Industrial Services Yrs 2 Cleaning services at EE's offices, depots and customer services 30 September 2013 275
Metro cleaning services Yrs 2 Cleaning services at EE's offices, depots and customer services 30 September 2013 275
M & J Chemicals and cleaning services Yrs 2 Cleaning services at EE's offices, depots and customer services 30 September 2013 275
Intuthuko cleaning services Yrs 2 Cleaning services at EE's offices, depots and customer services 30 September 2013 275
ProActive Maintenance and cleaning Yrs 2 Cleaning services at EE's offices, depots and customer services 30 September 2013 275
3M South Africa Yrs 1 Tapes, barrier, warning 31 July 2013 60
Romachem Supplies Yrs 1 Tapes, barrier, warning 31 July 2013 60
Phumbali Trading & Services Yrs 1 Tapes, barrier, warning 31 July 2013 60
Beka Yrs 1 Fibre Glass Street Lighting Poles 31 July 2013 198
134
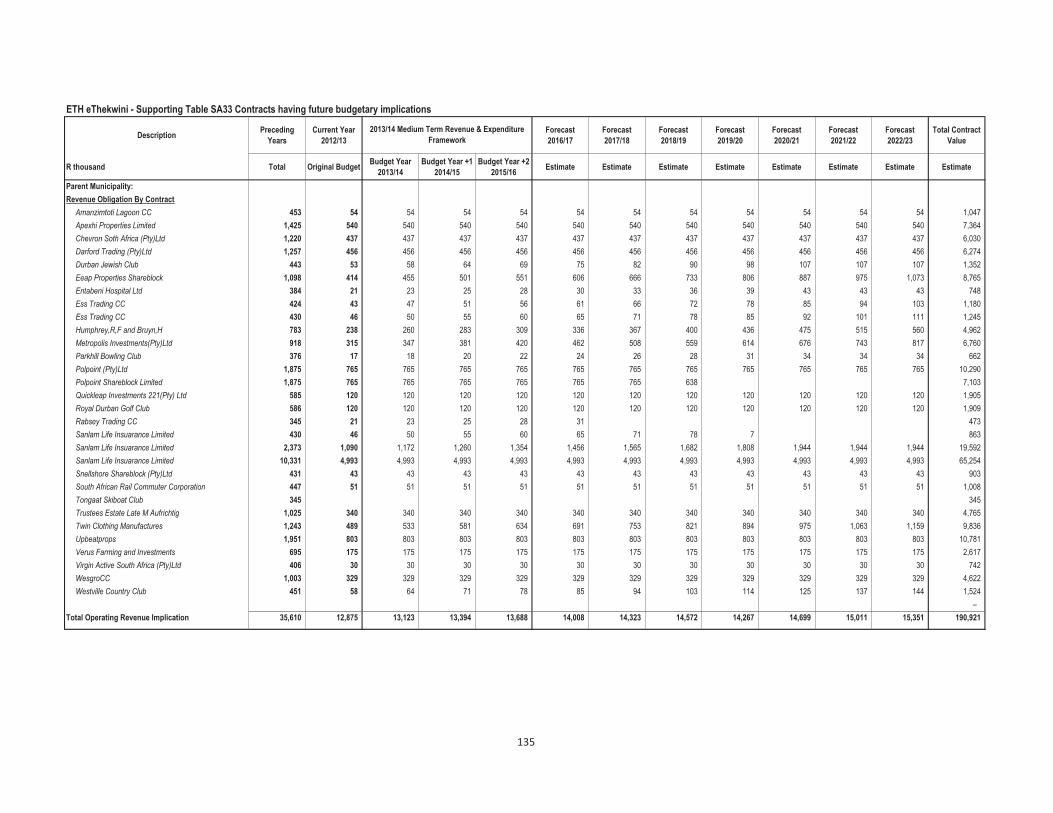
ETH eThekwini - Supporting Table SA33 Contracts having future budgetary implications
DescriptionPreceding
Years
Current Year
2012/13
Forecast
2016/17
Forecast
2017/18
Forecast
2018/19
Forecast
2019/20
Forecast
2020/21
Forecast
2021/22
Forecast
2022/23
Total Contract
Value
R thousand Total Original BudgetBudget Year
2013/14
Budget Year +1
2014/15
Budget Year +2
2015/16Estimate Estimate Estimate Estimate Estimate Estimate Estimate Estimate
Parent Municipality:
Revenue Obligation By Contract
Amanzimtoti Lagoon CC 453 54 54 54 54 54 54 54 54 54 54 54 1,047
Apexhi Properties Limited 1,425 540 540 540 540 540 540 540 540 540 540 540 7,364
Chevron Soth Africa (Pty)Ltd 1,220 437 437 437 437 437 437 437 437 437 437 437 6,030
Darford Trading (Pty)Ltd 1,257 456 456 456 456 456 456 456 456 456 456 456 6,274
Durban Jewish Club 443 53 58 64 69 75 82 90 98 107 107 107 1,352
Eeap Properties Shareblock 1,098 414 455 501 551 606 666 733 806 887 975 1,073 8,765
Entabeni Hospital Ltd 384 21 23 25 28 30 33 36 39 43 43 43 748
Ess Trading CC 424 43 47 51 56 61 66 72 78 85 94 103 1,180
Ess Trading CC 430 46 50 55 60 65 71 78 85 92 101 111 1,245
Humphrey,R,F and Bruyn,H 783 238 260 283 309 336 367 400 436 475 515 560 4,962
Metropolis Investments(Pty)Ltd 918 315 347 381 420 462 508 559 614 676 743 817 6,760
Parkhill Bowling Club 376 17 18 20 22 24 26 28 31 34 34 34 662
Polpoint (Pty)Ltd 1,875 765 765 765 765 765 765 765 765 765 765 765 10,290
Polpoint Shareblock Limited 1,875 765 765 765 765 765 765 638 7,103
Quickleap Investments 221(Pty) Ltd 585 120 120 120 120 120 120 120 120 120 120 120 1,905
Royal Durban Golf Club 586 120 120 120 120 120 120 120 120 120 120 120 1,909
Rabsey Trading CC 345 21 23 25 28 31 473
Sanlam Life Insuarance Limited 430 46 50 55 60 65 71 78 7 863
Sanlam Life Insuarance Limited 2,373 1,090 1,172 1,260 1,354 1,456 1,565 1,682 1,808 1,944 1,944 1,944 19,592
Sanlam Life Insuarance Limited 10,331 4,993 4,993 4,993 4,993 4,993 4,993 4,993 4,993 4,993 4,993 4,993 65,254
Snellshore Shareblock (Pty)Ltd 431 43 43 43 43 43 43 43 43 43 43 43 903
South African Rail Commuter Corporation 447 51 51 51 51 51 51 51 51 51 51 51 1,008
Tongaat Skiboat Club 345 345
Trustees Estate Late M Aufrichtig 1,025 340 340 340 340 340 340 340 340 340 340 340 4,765
Twin Clothing Manufactures 1,243 489 533 581 634 691 753 821 894 975 1,063 1,159 9,836
Upbeatprops 1,951 803 803 803 803 803 803 803 803 803 803 803 10,781
Verus Farming and Investments 695 175 175 175 175 175 175 175 175 175 175 175 2,617
Virgin Active South Africa (Pty)Ltd 406 30 30 30 30 30 30 30 30 30 30 30 742
WesgroCC 1,003 329 329 329 329 329 329 329 329 329 329 329 4,622
Westville Country Club 451 58 64 71 78 85 94 103 114 125 137 144 1,524
–
Total Operating Revenue Implication 35,610 12,875 13,123 13,394 13,688 14,008 14,323 14,572 14,267 14,699 15,011 15,351 190,921
2013/14 Medium Term Revenue & Expenditure
Framework
135

ETH eThekwini - Supporting Table SA34a Consolidated capital expenditure on new assets by asset class
Description 2009/10 2010/11 2011/12
R thousandAudited
Outcome
Audited
Outcome
Audited
Outcome
Original
Budget
Adjusted
Budget
Full Year
Forecast
Budget Year
2013/14
Budget Year
+1 2014/15
Budget Year
+2 2015/16
Capital expenditure on new assets by Asset Class/Sub-class
Infrastructure 3,759,631 – 1,385,570 2,351,123 2,245,212 2,245,212 2,715,555 2,891,649 3,083,867
Infrastructure - Road transport 957,683 – 288,059 343,180 113,930 113,930 262,320 341,215 275,012
Roads, Pavements & Bridges 920,036 140,604 265,570 39,104 39,104 256,470 307,915 251,000
Storm water 37,647 147,455 77,610 74,826 74,826 5,850 33,300 24,012
Infrastructure - Electricity 572,443 – 349,281 249,700 383,956 383,956 183,516 227,196 253,455
Generation 332,231 –
Transmission & Reticulation 202,006 342,781 246,450 380,706 380,706 177,891 221,571 247,065
Street Lighting 38,206 6,500 3,250 3,250 3,250 5,625 5,625 6,390
Infrastructure - Water 1,666,421 – 13,000 583,689 521,479 521,479 602,150 547,450 579,150
Dams & Reservoirs 45,744 8,550 26,000 26,000 26,000 62,400 45,500 26,000
Water purification – – – – – -
Reticulation 1,620,677 4,450 557,689 495,479 495,479 539,750 501,950 553,150
Infrastructure - Sanitation 398,641 – 352,095 360,200 360,200 360,200 542,050 516,050 474,300
Reticulation 398,641 337,296 321,200 321,200 321,200 396,550 426,550 425,300
Sewerage purification – 14,799 39,000 39,000 39,000 145,500 89,500 49,000
Infrastructure - Other 164,443 – 383,135 814,354 865,647 865,647 1,125,519 1,259,738 1,501,950
Waste Management 42,209 122,230 146,800 135,307 135,307 23,400 18,900 22,050
Transportation 25,684 87,802 124,500 230,446 230,446 952,119 1,097,338 1,092,200
Gas 800 – – – – 13,500 1,800
Other 95,750 173,103 543,054 499,894 499,894 150,000 130,000 385,900
Community 558,590 – 18,565 108,300 100,547 100,547 127,989 200,307 194,600
Parks & gardens 510 –
Sportsfields & stadia – 2,350 –
Swimming pools – 3,082 3,000 3,000 3,000
Community halls 3,533 1,810 – – –
Libraries 7,488 100 77,900 37,900 37,900 47,600 129,870 150,800
Recreational facilities 540,788 – – –
Fire, safety & emergency – – 21,888 21,888
Security and policing – 2,700 13,059 13,059 36,477 41,940 31,718
Buses – – – – –
Clinics – 10,713 16,500 16,500 16,500 30,262 25,000 9,900
Museums & Art Galleries 274 8,200 8,200 8,200 13,200 3,497 2,182
Cemeteries 6,507 –
Social rental housing – –
Other – – – 450
Heritage assets – – – 5,000 5,610 5,610 3,500 – –
Buildings
Other 5,000 5,610 5,610 3,500
Investment properties 15,514 141,409 5,000 – – – – – –
Housing development 15,514 141,409 5,000
Other assets 709,156 262,689 888,174 961,206 1,021,000 1,021,000 790,150 738,608 1,129,841
General vehicles 178,790 80,810 43,200 99,521 99,521 43,200 55,800 71,100
Specialised vehicles – – 119,441 18,383 18,383 18,383 19,800 5,724 23,004
Plant & equipment 156,765 159,895 291,713 81,623 84,213 84,213 36,900 31,635 37,597
Computers - hardware/equipment 8,445 90,164 35,390 19,500 19,739 19,739 43,371 21,150 14,355
Furniture and other office equipment 2,664 12,630 71,506 – – –
Abattoirs – – – – –
Markets 6,198 424 – – –
Civic Land and Buildings – 3,000 3,000 3,000
Other Buildings 75,605 27,431 9,000 9,000 9,000 34,182 25,300 61,800
Other Land 18,225 11,850 7,000 7,000 7,000 1,152 1,170 5,400
Surplus Assets - (Investment or Inventory) – – – – – – – –
Other 262,464 249,609 779,500 780,144 780,144 611,545 597,829 916,585
Agricultural assets – – – – – – – – –
List sub-class
Biological assets – – – – – – – – –
List sub-class
Intangibles 66,311 – 52,075 12,850 66,110 66,110 – – –
Computers - software & programming 61,522 51,075 12,850 66,110 66,110
Other (list sub-class) 4,789 1,000
Total Capital Expenditure on new assets 5,109,202 404,098 2,349,384 3,438,479 3,438,479 3,438,479 3,637,194 3,830,564 4,408,308
Specialised vehicles – – 119,441 18,383 18,383 18,383 19,800 5,724 23,004
Refuse 92,000 10,000 10,000 10,000 17,100
Fire 15,254 8,383 8,383 8,383 2,700 5,724 23,004
Conservancy 12,187
Ambulances
Current Year 2012/132013/14 Medium Term Revenue &
Expenditure Framework
136

ETH eThekwini - Supporting Table SA34b Consolidated capital expenditure on existing assets by asset class
Description 2009/10 2010/11 2011/12
R thousandAudited
Outcome
Audited
Outcome
Audited
Outcome
Original
Budget
Adjusted
Budget
Full Year
Forecast
Budget Year
2013/14
Budget Year
+1 2014/15
Budget Year
+2 2015/16
Capital expenditure on renewal of existing assets by Asset Class/Sub-class
Infrastructure 1,492 3,038,392 706,930 1,621,434 1,621,434 1,621,434 1,310,114 1,385,664 1,502,759
Infrastructure - Road transport 1,052 1,088,270 25,527 940,031 940,031 940,031 526,234 497,028 593,229
Roads, Pavements & Bridges 1,052 1,035,838 11,579 926,083 926,083 926,083 458,882 494,328 576,939
Storm water – 52,432 13,948 13,948 13,948 13,948 67,352 2,700 16,290
Infrastructure - Electricity – 481,054 210,950 210,950 210,950 210,950 271,900 332,356 320,857
Generation
Transmission & Reticulation 467,372 207,950 207,950 207,950 207,950 271,900 332,356 320,857
Street Lighting 13,682 3,000 3,000 3,000 3,000
Infrastructure - Water – 1,386,987 64,400 64,400 64,400 64,400 97,280 253,450 181,950
Dams & Reservoirs 16,459 3,000 3,000 3,000 3,000
Water purification 126,355 500 500 500 500
Reticulation 1,244,173 60,900 60,900 60,900 60,900 97,280 253,450 181,950
Infrastructure - Sanitation – 13,335 206,000 206,000 206,000 206,000 228,350 184,700 198,600
Reticulation 13,335 81,500 81,500 81,500 81,500 94,850 167,400 105,300
Sewerage purification 124,500 124,500 124,500 124,500 133,500 17,300 93,300
Infrastructure - Other 440 68,746 200,053 200,053 200,053 200,053 186,350 118,130 208,123
Waste Management 440 31,579 10,000 10,000 10,000 10,000 1,673
Transportation – 14,000 14,000 14,000 14,000 115,950 62,730 103,350
Gas – – – – – 5,400 3,600 3,600
Other – 37,167 176,053 176,053 176,053 176,053 65,000 51,800 99,500
Community 605 56,661 55,016 76,783 76,783 76,783 91,671 175,536 159,585
Parks & gardens – 6,773 6,773 6,773 6,773 4,235 13,437 9,900
Sportsfields & stadia – – 15,800 15,800 15,800 25,420 26,494 31,437
Swimming pools – 1,748 2,800 2,800 2,800 14,592 33,832 35,861
Community halls – 2,350 2,350 2,350 2,350 2,163 2,332 2,471
Libraries – 20,247 14,600 14,600 14,600 14,600 11,989 49,770 35,100
Recreational facilities 605 21,768 12,085 17,000 17,000 17,000
Fire, safety & emergency – 2,916 – – – – 32,372 46,214 37,068
Security and policing – 128 – – – –
Buses – – – – –
Clinics – 6,212 – – – –
Museums & Art Galleries – 4,929 2,057 2,057 2,057 2,057 450 4,118
Cemeteries – 461 15,403 15,403 15,403 15,403 450 3,457 3,630
Social rental housing – – – –
Heritage assets – – 15,900 15,900 15,900 15,900 11,250 12,600 12,960
Buildings 15,900 15,900 15,900 15,900 11,250 12,600 12,960
Investment properties – – – – – – – – –
Housing development
Other assets 1,388,470 177,552 382,741 150,619 158,385 174,385 411,606 386,930 381,768
General vehicles 277,844 2,000 2,000 2,000 2,000 29,900 41,900 49,400
Specialised vehicles – – 5,000 5,000 5,000 5,000 4,500 4,500 10,000
Plant & equipment 979,180 199,224 7,710 7,710 7,710 23,256 28,404 44,623
Computers - hardware/equipment 83,064 21,552 4,700 4,700 4,700 900 –
Furniture and other office equipment 28,348 150 150 150 150 711 396 945
Abattoirs – – – – –
Markets – 9,471 9,005 9,005 9,005 9,005 3,420 2,970 18,450
Civic Land and Buildings – – – – –
Other Buildings 12,582 50,198 61,908 38,152 45,918 61,918 117,601 124,120 72,730
Other Land – 59,794 – – – 8,087 4,500 4,500
Surplus Assets - (Investment or Inventory) – – – –
Other 7,452 58,089 83,902 83,902 83,902 83,902 223,231 180,140 181,120 Agricultural assets – – – – – – – – –
Biological assets – – – – – – – – –
Intangibles – 108,637 5,500 5,500 5,500 5,500 4,932 3,780 4,500
Computers - software & programming 108,637 5,500 5,500 5,500 5,500 4,932 3,780 4,500
Total Capital Expenditure on renewal of existing assets 1,390,567 3,381,242 1,166,087 1,870,236 1,878,002 1,894,002 1,829,573 1,964,510 2,061,572
Specialised vehicles – – 5,000 5,000 5,000 5,000 4,500 4,500 10,000
Refuse
Fire
Conservancy 5,000 5,000 5,000 5,000 4,500 4,500 10,000
Renewal of Existing Assets as % of total capex21.4% 89.3% 33.2% 35.2% 35.3% 35.5% 33.5% 33.9% 31.9%
Renewal of Existing Assets as % of deprecn"112.4% 230.5% 76.5% 101.1% 101.6% 105.8% 99.3% 103.0% 103.9%
Current Year 2012/132013/14 Medium Term Revenue &
Expenditure Framework
137
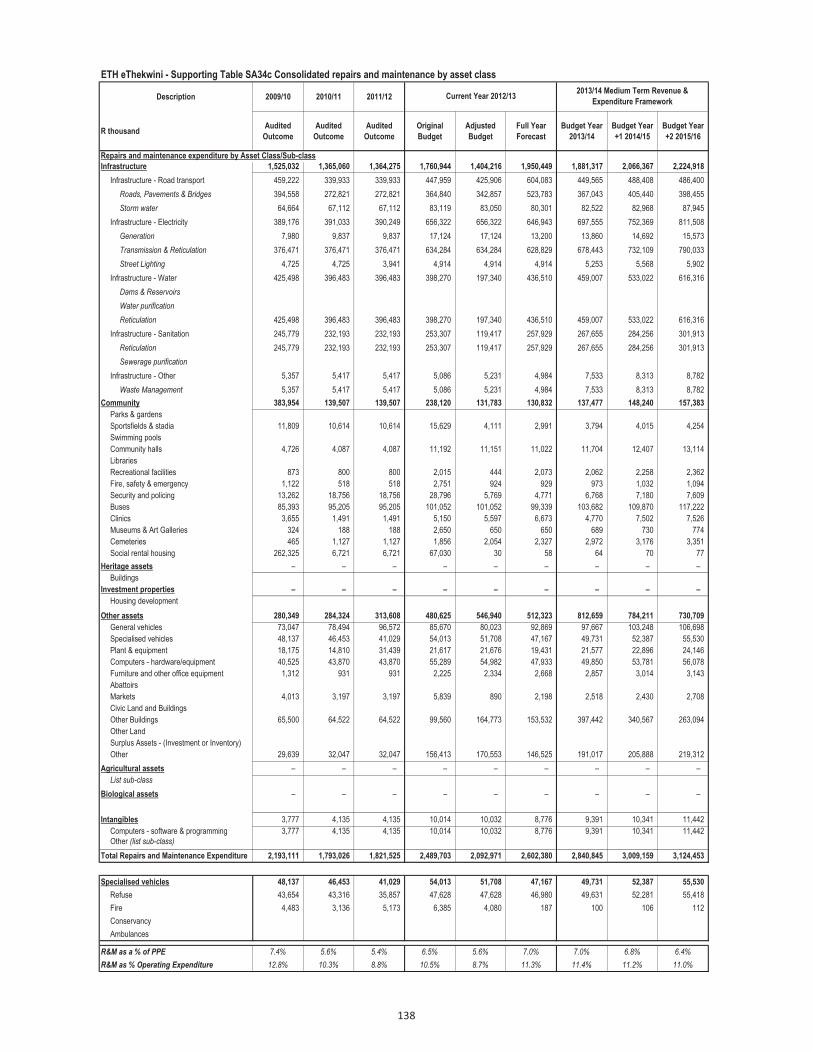
ETH eThekwini - Supporting Table SA34c Consolidated repairs and maintenance by asset class
Description 2009/10 2010/11 2011/12
R thousandAudited
Outcome
Audited
Outcome
Audited
Outcome
Original
Budget
Adjusted
Budget
Full Year
Forecast
Budget Year
2013/14
Budget Year
+1 2014/15
Budget Year
+2 2015/16
Repairs and maintenance expenditure by Asset Class/Sub-class
Infrastructure 1,525,032 1,365,060 1,364,275 1,760,944 1,404,216 1,950,449 1,881,317 2,066,367 2,224,918
Infrastructure - Road transport 459,222 339,933 339,933 447,959 425,906 604,083 449,565 488,408 486,400
Roads, Pavements & Bridges 394,558 272,821 272,821 364,840 342,857 523,783 367,043 405,440 398,455
Storm water 64,664 67,112 67,112 83,119 83,050 80,301 82,522 82,968 87,945
Infrastructure - Electricity 389,176 391,033 390,249 656,322 656,322 646,943 697,555 752,369 811,508
Generation 7,980 9,837 9,837 17,124 17,124 13,200 13,860 14,692 15,573
Transmission & Reticulation 376,471 376,471 376,471 634,284 634,284 628,829 678,443 732,109 790,033
Street Lighting 4,725 4,725 3,941 4,914 4,914 4,914 5,253 5,568 5,902
Infrastructure - Water 425,498 396,483 396,483 398,270 197,340 436,510 459,007 533,022 616,316
Dams & Reservoirs
Water purification
Reticulation 425,498 396,483 396,483 398,270 197,340 436,510 459,007 533,022 616,316
Infrastructure - Sanitation 245,779 232,193 232,193 253,307 119,417 257,929 267,655 284,256 301,913
Reticulation 245,779 232,193 232,193 253,307 119,417 257,929 267,655 284,256 301,913
Sewerage purification
Infrastructure - Other 5,357 5,417 5,417 5,086 5,231 4,984 7,533 8,313 8,782
Waste Management 5,357 5,417 5,417 5,086 5,231 4,984 7,533 8,313 8,782
Community 383,954 139,507 139,507 238,120 131,783 130,832 137,477 148,240 157,383
Parks & gardens
Sportsfields & stadia 11,809 10,614 10,614 15,629 4,111 2,991 3,794 4,015 4,254
Swimming pools
Community halls 4,726 4,087 4,087 11,192 11,151 11,022 11,704 12,407 13,114
Libraries
Recreational facilities 873 800 800 2,015 444 2,073 2,062 2,258 2,362
Fire, safety & emergency 1,122 518 518 2,751 924 929 973 1,032 1,094
Security and policing 13,262 18,756 18,756 28,796 5,769 4,771 6,768 7,180 7,609
Buses 85,393 95,205 95,205 101,052 101,052 99,339 103,682 109,870 117,222
Clinics 3,655 1,491 1,491 5,150 5,597 6,673 4,770 7,502 7,526
Museums & Art Galleries 324 188 188 2,650 650 650 689 730 774
Cemeteries 465 1,127 1,127 1,856 2,054 2,327 2,972 3,176 3,351
Social rental housing 262,325 6,721 6,721 67,030 30 58 64 70 77
Heritage assets – – – – – – – – –
Buildings
Investment properties – – – – – – – – –
Housing development
Other assets 280,349 284,324 313,608 480,625 546,940 512,323 812,659 784,211 730,709
General vehicles 73,047 78,494 96,572 85,670 80,023 92,869 97,667 103,248 106,698
Specialised vehicles 48,137 46,453 41,029 54,013 51,708 47,167 49,731 52,387 55,530
Plant & equipment 18,175 14,810 31,439 21,617 21,676 19,431 21,577 22,896 24,146
Computers - hardware/equipment 40,525 43,870 43,870 55,289 54,982 47,933 49,850 53,781 56,078
Furniture and other office equipment 1,312 931 931 2,225 2,334 2,668 2,857 3,014 3,143
Abattoirs
Markets 4,013 3,197 3,197 5,839 890 2,198 2,518 2,430 2,708
Civic Land and Buildings
Other Buildings 65,500 64,522 64,522 99,560 164,773 153,532 397,442 340,567 263,094
Other Land
Surplus Assets - (Investment or Inventory)
Other 29,639 32,047 32,047 156,413 170,553 146,525 191,017 205,888 219,312
Agricultural assets – – – – – – – – –
List sub-class
Biological assets – – – – – – – – –
Intangibles 3,777 4,135 4,135 10,014 10,032 8,776 9,391 10,341 11,442
Computers - software & programming 3,777 4,135 4,135 10,014 10,032 8,776 9,391 10,341 11,442
Other (list sub-class)
Total Repairs and Maintenance Expenditure 2,193,111 1,793,026 1,821,525 2,489,703 2,092,971 2,602,380 2,840,845 3,009,159 3,124,453
Specialised vehicles 48,137 46,453 41,029 54,013 51,708 47,167 49,731 52,387 55,530
Refuse 43,654 43,316 35,857 47,628 47,628 46,980 49,631 52,281 55,418
Fire 4,483 3,136 5,173 6,385 4,080 187 100 106 112
Conservancy
Ambulances
R&M as a % of PPE 7.4% 5.6% 5.4% 6.5% 5.6% 7.0% 7.0% 6.8% 6.4%
R&M as % Operating Expenditure 12.8% 10.3% 8.8% 10.5% 8.7% 11.3% 11.4% 11.2% 11.0%
Current Year 2012/132013/14 Medium Term Revenue &
Expenditure Framework
138

ETH eThekwini - Supporting Table SA34d Consolidated Depreciation by asset class
Description 2009/10 2010/11 2011/12
R thousandAudited
Outcome
Audited
Outcome
Audited
Outcome
Original
Budget
Adjusted
Budget
Full Year
Forecast
Budget Year
2013/14
Budget Year
+1 2014/15
Budget Year
+2 2015/16
Depreciation by Asset Class/Sub-class
Infrastructure 454,316 420,143 677,527 989,419 989,419 984,944 1,011,315 1,050,994 1,092,109
Infrastructure - Road transport 177,056 61,375 425,368 438,821 438,821 424,507 438,820 452,851 472,741
Roads, Pavements & Bridges 161,194 44,195 281,792 403,155 403,155 390,004 403,154 416,044 434,318
Storm water 15,862 17,180 143,576 35,666 35,666 34,503 35,666 36,807 38,423
Infrastructure - Electricity 133,003 141,552 161,047 247,395 247,395 267,123 269,292 285,247 292,728
Generation 43,865 46,678 54,824 84,114 84,114 90,823 91,559 96,984 99,528
Transmission & Reticulation 79,826 84,395 94,645 145,324 145,324 157,067 158,344 167,725 172,125
Street Lighting 9,312 10,479 11,578 17,956 17,956 19,233 19,389 20,538 21,076
Infrastructure - Water 44,809 75,258 12,579 122,141 122,141 118,157 122,141 126,046 131,582
Dams & Reservoirs 3,936 4,531 3,967 122,141 122,141 118,157 122,141 126,046 131,582
Water purification 19 6 1,087
Reticulation 40,854 70,721 7,525
Infrastructure - Sanitation 63,656 80,750 19,622 134,055 134,055 129,682 134,055 138,341 144,417
Reticulation 63,065 753 19,616
Sewerage purification 591 79,997 6 134,055 134,055 129,682 134,055 138,341 144,417
Infrastructure - Other 35,792 61,208 58,911 47,007 47,007 45,474 47,007 48,510 50,641
Waste Management 32,404 49,078 39,835 39,835 38,535 39,835 41,108 42,914
Transportation
Gas 50,626
Other 3,388 12,130 8,285 7,173 7,173 6,939 7,173 7,402 7,727
Community 88,858 136,260 130,604 65,998 65,998 63,845 65,998 68,108 71,100
Parks & gardens
Sportsfields & stadia
Swimming pools
Community halls 2 10 195
Libraries 3 8,703 14,076 298 298 288 298 307 321
Recreational facilities 61,009 81,933 75,231 42,864 42,864 41,466 42,864 44,234 46,177
Fire, safety & emergency 1,583 1,586 1,060
Security and policing 1,042 1,049 662
Buses
Clinics 22,761 40,413 38,810 17,191 17,191 16,631 17,191 17,741 18,520
Museums & Art Galleries 8 125 258
Cemeteries 2,450 2,441 312
Social rental housing
Other 5,645 5,645 5,461 5,645 5,826 6,082
Heritage assets 2,745 4,325 – 67,095 67,095 64,906 67,095 69,240 72,281
Buildings 2,745 4,325 67,095 64,906 64,906 67,095 69,240 72,281
Investment properties 391 1,805 2,527 – – – – – –
Housing development 391 1,805 2,527
Other assets 597,122 807,063 651,223 680,910 681,021 631,675 651,878 671,687 699,648
General vehicles 148,863 233,992 250,743 123,702 123,702 119,667 123,702 127,657 133,264
Specialised vehicles – – – – – – – – –
Plant & equipment 98,898 311,972 116,957 132,219 132,219 127,906 132,218 136,446 142,439
Computers - hardware/equipment 75,911 79,516 97,949 139,739 139,739 135,181 139,739 144,207 150,541
Furniture and other office equipment 7,878 10,701 12,419
Abattoirs
Markets 5,989 6,195 3,963 37,248 37,248 36,033 37,248 38,439 40,127
Civic Land and Buildings
Other Buildings 75,854 83,763 90,257 147,430 147,430 142,621 147,430 152,143 158,826
Other Land
Surplus Assets - (Investment or Inventory)
Other 183,729 80,924 78,936 100,572 100,683 70,268 71,541 72,795 74,451
Agricultural assets – – – – – – – – –
List sub-class
Biological assets – – – – – – – – –
List sub-class
Intangibles 93,376 97,043 62,112 45,759 45,759 44,266 45,759 47,222 49,296
Computers - software & programming 93,376 97,043 62,112 45,759 45,759 44,266 45,759 47,222 49,296
Total Depreciation 1,236,808 1,466,639 1,523,993 1,849,181 1,849,292 1,789,637 1,842,045 1,907,251 1,984,435
Specialised vehicles – – – – – – – – –
Refuse
Fire
Conservancy
Ambulances
Current Year 2012/132013/14 Medium Term Revenue &
Expenditure Framework
139
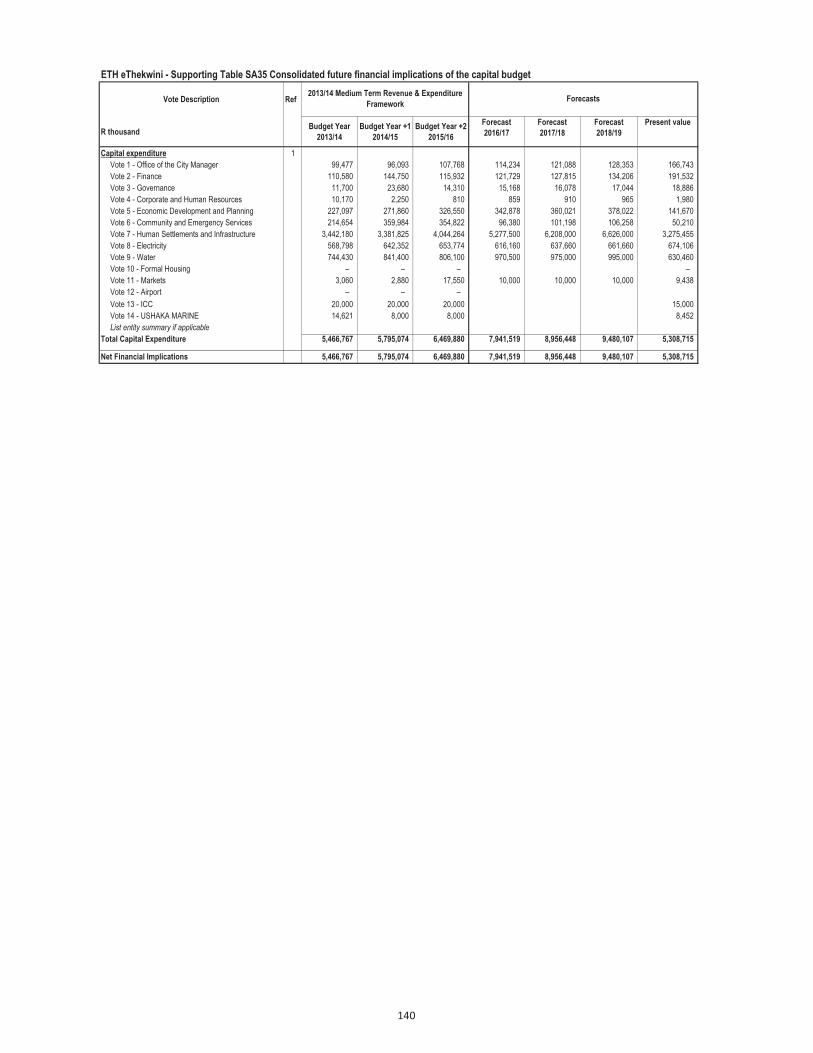
ETH eThekwini - Supporting Table SA35 Consolidated future financial implications of the capital budget
Vote Description Ref
R thousandBudget Year
2013/14
Budget Year +1
2014/15
Budget Year +2
2015/16
Forecast
2016/17
Forecast
2017/18
Forecast
2018/19
Present value
Capital expenditure 1
Vote 1 - Office of the City Manager 99,477 96,093 107,768 114,234 121,088 128,353 166,743
Vote 2 - Finance 110,580 144,750 115,932 121,729 127,815 134,206 191,532
Vote 3 - Governance 11,700 23,680 14,310 15,168 16,078 17,044 18,886
Vote 4 - Corporate and Human Resources 10,170 2,250 810 859 910 965 1,980
Vote 5 - Economic Development and Planning 227,097 271,860 326,550 342,878 360,021 378,022 141,670
Vote 6 - Community and Emergency Services 214,654 359,984 354,822 96,380 101,198 106,258 50,210
Vote 7 - Human Settlements and Infrastructure 3,442,180 3,381,825 4,044,264 5,277,500 6,208,000 6,626,000 3,275,455
Vote 8 - Electricity 568,798 642,352 653,774 616,160 637,660 661,660 674,106
Vote 9 - Water 744,430 841,400 806,100 970,500 975,000 995,000 630,460
Vote 10 - Formal Housing – – – –
Vote 11 - Markets 3,060 2,880 17,550 10,000 10,000 10,000 9,438
Vote 12 - Airport – – –
Vote 13 - ICC 20,000 20,000 20,000 15,000
Vote 14 - USHAKA MARINE 14,621 8,000 8,000 8,452
List entity summary if applicable
Total Capital Expenditure 5,466,767 5,795,074 6,469,880 7,941,519 8,956,448 9,480,107 5,308,715
Net Financial Implications 5,466,767 5,795,074 6,469,880 7,941,519 8,956,448 9,480,107 5,308,715
2013/14 Medium Term Revenue & Expenditure
FrameworkForecasts
140

ETH eThekwini - Supporting Table SA36 Consolidated detailed capital budget
Municipal Vote/Capital project Asset Class Asset Sub-Class
R thousand 3 3
Audited
Outcome
2011/12
Current Year
2012/13 Full
Year Forecast
Budget Year 2013/14Budget Year +1
2014/15
Budget Year +2
2015/16
Parent municipality:
Vote 1 - Office of City Manager Computer Equipment Various 7 Other Assets Computers - hardware /equipment 66,668 54,745 4,896 4,500 6,300
Computer Software Various 7 Other Assets 2,682 2,700 3,150
Equipment Various 7 Other Assets Other 89,622 81,810 90,450
Development Various 7 Other Assets Other 76 70,000 70,000 97,000
Roads Various 7 Infrastructure - Road transport Roads, Pavements & Bridges 4,461 6,000
Recreation Various 7 Community Recreational facilities 127,666
Plant & Equipment Various 7 Other Assets Plant & equipment 3,913 41,174
Vote 2 - Treasury Buildings Various 8 Other Assets Other Buildings 3,700 28,350 39,150 38,250
Plant & Equipment Various 8 Other Assets Plant & equipment 369,441 8,100 8,100 26,482
Vehicles Various 8 Other Assets General vehicles 226,635 36,200 29,000 41,000 46,700
Real Estates Various 8 Other Assets Other Assets 5,130 4,500 4,500
Computer Software Various 8 Other Assets 40,000 52,000
Computer Equipment Various 8 95,562 43,259
Plant & Equipment Various 8 32,683 27,900
Vote 3 - Governance City Hall Various 7 Other Assets Other Assets 21,053 16,400 11,250 12,600 12,960
Computer Software Various 7 Other Assets 2,250 1,080 1,350
Computer Equipment Various 7 60
Regional Centres Various 7 Other Assets Other Buildings 550 10,000
Vote 4 - Human Resources Buildings Various 7 Other Assets Other Buildings 44 536 10,170 2,250 810
Furniture & Equipment Various 7 Other Assets Furniture and other office equipment 5,092 110
Vote 5 - Sustainable Dev. & City Enterprises CBD Regeneration Various 2 Infrastructure - Road transport Roads, Pavements & Bridges 104,366 90,250 145,800 174,500
Car parks & fencing Various 2 247 10,557
Cultural Various 2 838 17,385
Plant & Equipment Various 2 Other Assets Plant & equipment 8,434 700 810 450 1,350
Computer Equipment Various 2 Other Assets Computers - hardware/equipment 401 2,000
Heritage Various 2 Other Assets Other Assets 3,500
Development Various 2 Other Assets Other Assets 21,538 21,400 15,000
Land Various 2 Other Assets Other Land 1,396 2,735
Buildings Various 2 Other Assets Other Buildings 45,036 5,000 4,739 4,320 7,800
Sector Support Various 2 Other Assets Other Buildings 467 5,500 13,500 11,000
Strategic Projects Various 5 Community Sportsfields & stadia 15,400 14,500 14,500
Strategic Projects Various 2 Other Assets Other 62,029 15,000 1,800 4,500
Vote 6 - Safety & Security Specialised vehicles Various 4 Other Assets Specialised vehicles - Fire 8,383 2,700 5,724 23,004
Fire Stations Various 4 1,740 7,200
Buildings Various 4 Other Assets Other Buildings 13,380 18,482 9,972
Fire & Emergency Various 4 Community Security and policing 11,325 32,372 46,214 37,068
Plant & Equipment Various 4 2,743 2,165
Metro Police / Disaster Man. Various 4 Community Security and policing 14 11,600 36,477 41,940 31,718
Program/Project descriptionProject
number
IDP
Goal
code
2
Prior year outcomes 2013/14 Medium Term Revenue & Expenditure Framework
141

ETH eThekwini - Supporting Table SA36 Consolidated detailed capital budget
Municipal Vote/Capital project Asset Class Asset Sub-Class
R thousand 3 3
Audited
Outcome
2011/12
Current Year
2012/13 Full
Year Forecast
Budget Year 2013/14Budget Year +1
2014/15
Budget Year +2
2015/16
Program/Project descriptionProject
number
IDP
Goal
code
2
Prior year outcomes 2013/14 Medium Term Revenue & Expenditure Framework
Vote 7 - Health & Social Services Clinics Various 4 Community Clinics 6,765 16,500 30,262 25,000 9,900
Buildings Various 4 1,013
Parks Recreation & Culture Various 6 Community Recreational facilities 36,318 107,310 105,148 248,189 261,000
Vote 8 - Human Settlement & Infra. Housing Various 3 Infrastructure - Other Generation 1,139,199 789,306 707,587 1,327,400
Roads, ETA, Stormwater, CSW Various 3 Infrastructure - Road transport Roads, Pavements & Bridges 572,633 2,158,645 2,560,174 2,572,161 2,585,914
Buildings Various 3 Other Assets Other Buildings 822,317 31,500 38,700 50,400
Computer Equipment Various 3 Other Assets Computers - hardware/equipment 4,899 900 900
Infrastructure Various 3 Other Assets Specialised vehicles - Conservancy 1,883 7,200 4,742 9,000
Plant & Equipment Various 3 Other Assets Plant & equipment 8,572 10,103 2,700 2,835 7,650
Vehicles Various 3 Other Assets General vehicles 745 43,200 37,800 53,100
Gas to Electricity Various 3 Other Assets Gas 3,740 5,400 17,100 5,400
Land Various 3 Other Assets Other Land 3,634 5,400
Vote 9 - Electricity Electricity Various 3 Infrastructure - Electricity Transmission & Reticulation 493,106 509,400 449,791 553,927 567,922
Street Lighting Various 3 Street Lighting 12,451 71,596 5,625 5,625 6,390
Computer Software Various 3 Intangibles Computers - software & programming 9,806 8,922
Computer Equipment Various 3 Other Assets Computers - hardware/equipment – 7,500 42,975 16,380 8,685
Plant & Equipment Various 3 Other Assets Plant & equipment 1,861 56,788 22,626 27,954 43,362
Furniture & Equipment Various 3 Other Assets Furniture and other office equipment – 850 711 396 945
Specialised Vehicles Various 3 Other Assets Specialised vehicles - Conservancy 42,278 4,500 4,500 10,000
General Vehicles Various 3 Other Assets General vehicles 3,496 900 900 2,700
Other Land Various 3 Other Assets Other Land 4,372 4,500 4,500 4,500
Buildings Various Other Assets Other Buildings 19,050 37,170 28,170 9,270
Vote 10 - Water Dams & Reservoirs Various 3 Infrastructure - Water Dams & Reservoirs 47,084 62,400 43,500 26,000
Water Various 3 Reticulation 390,633 561,665 637,030 757,400 735,100
Specialised Vehicles Various 3 Other Assets Other Assets 19,840 17,100 18,000 18,000
Plant & Equipment Various Other Assets Other Assets 19,844 37,765 27,900 22,500 27,000
Buildings Various 3 Other Assets Buildings 21,659
Vote 11 - Formal Housing 41
Vote 12 Markets Markets Various 3 Community Markets 2,252 9,438 3,420 2,970 18,450
Parent Capital expenditure 3,483,262 5,285,263 5,432,146 5,767,074 6,441,880
Entities:
ICC Plant & Equipment 2 Other Assets Plant & equipment 23,805 15,000 20,000 20,000 20,000
USHAKA MARINE Plant & Equipment 2 Other Assets Plant & equipment 8,404 8,452 14,621 8,000 8,000
Entity Capital expenditure 32,209 23,452 34,621 28,000 28,000
Total Capital expenditure 3,515,471 5,308,715 5,466,767 5,795,074 6,469,880
142
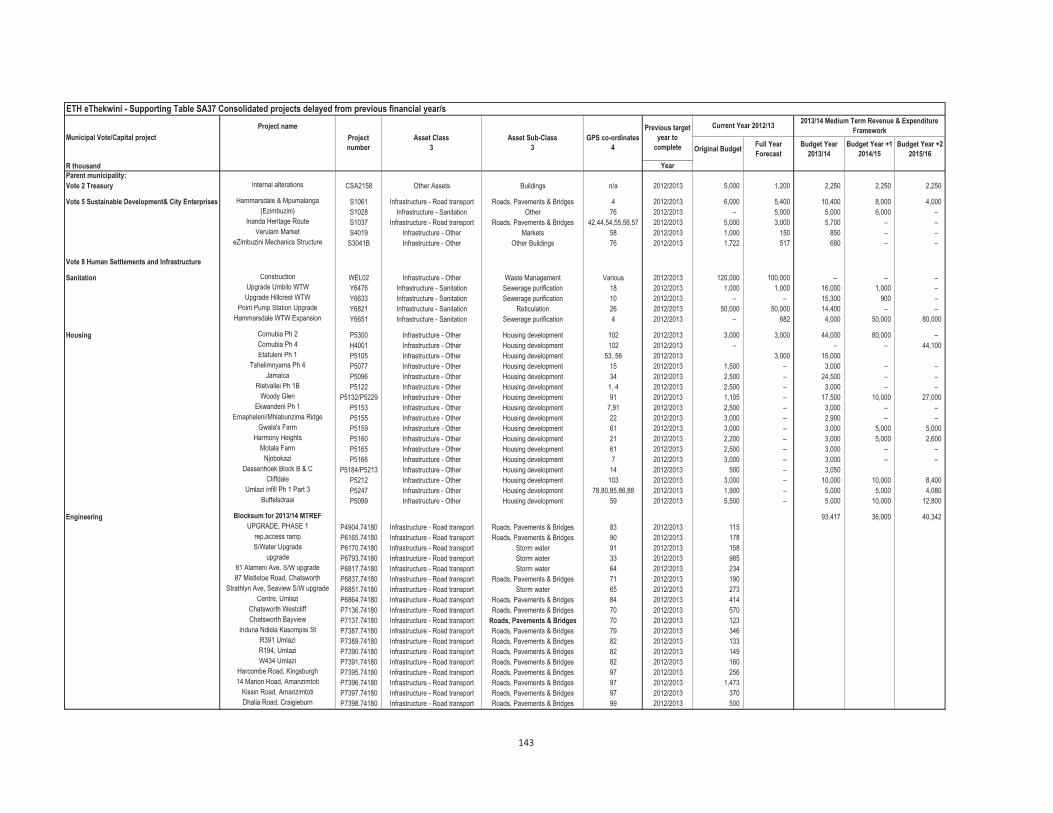
ETH eThekwini - Supporting Table SA37 Consolidated projects delayed from previous financial year/s
Project name
Original BudgetFull Year
Forecast
Budget Year
2013/14
Budget Year +1
2014/15
Budget Year +2
2015/16
R thousand Year
Parent municipality:
Vote 2 Treasury Internal alterations CSA2158 Other Assets Buildings n/a 2012/2013 5,000 1,200 2,250 2,250 2,250
Vote 5 Sustainable Development& City Enterprises Hammarsdale & Mpumalanga S1061 Infrastructure - Road transport Roads, Pavements & Bridges 4 2012/2013 6,000 5,400 10,400 8,000 4,000
(Ezimbuzini) S1028 Infrastructure - Sanitation Other 76 2012/2013 – 5,000 5,000 6,000 –
Inanda Heritage Route S1037 Infrastructure - Road transport Roads, Pavements & Bridges 42,44,54,55,56,57 2012/2013 5,000 3,000 5,700 – –
Verulam Market S4019 Infrastructure - Other Markets 58 2012/2013 1,000 150 850 – –
eZimbuzini Mechanics Structure S3041B Infrastructure - Other Other Buildings 76 2012/2013 1,722 517 680 – –
Vote 8 Human Settlements and Infrastructure
Sanitation Construction WEL02 Infrastructure - Other Waste Management Various 2012/2013 120,000 100,000 – – –
Upgrade Umbilo WTW Y6476 Infrastructure - Sanitation Sewerage purification 18 2012/2013 1,000 1,000 16,000 1,000 –
Upgrade Hillcrest WTW Y6633 Infrastructure - Sanitation Sewerage purification 10 2012/2013 – – 15,300 900 –
Point Pump Station Upgrade Y6821 Infrastructure - Sanitation Reticulation 26 2012/2013 50,000 50,000 14,400 – –
Hammarsdale WTW Expansion Y6651 Infrastructure - Sanitation Sewerage purification 4 2012/2013 – 682 4,000 50,000 80,000
Housing Cornubia Ph 2 P5300 Infrastructure - Other Housing development 102 2012/2013 3,000 3,000 44,000 80,000 –
Cornubia Ph 4 H4001 Infrastructure - Other Housing development 102 2012/2013 – – – 44,100
Etafuleni Ph 1 P5105 Infrastructure - Other Housing development 53, 56 2012/2013 3,000 15,000
Tshelimnyama Ph 4 P5077 Infrastructure - Other Housing development 15 2012/2013 1,500 – 3,000 – –
Jamaica P5096 Infrastructure - Other Housing development 34 2012/2013 2,500 – 24,500 – –
Rietvallei Ph 1B P5122 Infrastructure - Other Housing development 1, 4 2012/2013 2,500 – 3,000 – –
Woody Glen P5132/P5229 Infrastructure - Other Housing development 91 2012/2013 1,105 – 17,500 10,000 27,000
Ekwandeni Ph 1 P5153 Infrastructure - Other Housing development 7,91 2012/2013 2,500 – 3,000 – –
Emapheleni/Mhlabunzima Ridge P5155 Infrastructure - Other Housing development 22 2012/2013 3,000 – 2,900 – –
Gwala's Farm P5159 Infrastructure - Other Housing development 61 2012/2013 3,000 – 3,000 5,000 5,000
Harmony Heights P5160 Infrastructure - Other Housing development 21 2012/2013 2,200 – 3,000 5,000 2,600
Motala Farm P5165 Infrastructure - Other Housing development 61 2012/2013 2,500 – 3,000 – –
Njobokazi P5166 Infrastructure - Other Housing development 7 2012/2013 3,000 – 3,000 – –
Dassenhoek Block B & C P5184/P5213 Infrastructure - Other Housing development 14 2012/2013 500 – 3,050
Cliffdale P5212 Infrastructure - Other Housing development 103 2012/2013 3,000 – 10,000 10,000 8,400
Umlazi infill Ph 1 Part 3 P5247 Infrastructure - Other Housing development 78,80,85,86,88 2012/2013 1,900 – 5,000 5,000 4,080
Buffelsdraai P5099 Infrastructure - Other Housing development 59 2012/2013 5,500 – 5,000 10,000 12,800
Engineering Blocksum for 2013/14 MTREF 93,417 36,000 40,342
UPGRADE, PHASE 1 P4904.74180 Infrastructure - Road transport Roads, Pavements & Bridges 83 2012/2013 115
rep,access ramp P6165.74180 Infrastructure - Road transport Roads, Pavements & Bridges 90 2012/2013 178
S/Water Upgrade P6170.74180 Infrastructure - Road transport Storm water 91 2012/2013 158
upgrade P6793.74180 Infrastructure - Road transport Storm water 33 2012/2013 985
81 Alameni Ave. S/W upgrade P6817.74180 Infrastructure - Road transport Storm water 64 2012/2013 234
87 Mistletoe Road, Chatsworth P6837.74180 Infrastructure - Road transport Roads, Pavements & Bridges 71 2012/2013 190
Strathlyn Ave, Seaview S/W upgrade P6851.74180 Infrastructure - Road transport Storm water 65 2012/2013 273
Centre, Umlazi P6864.74180 Infrastructure - Road transport Roads, Pavements & Bridges 84 2012/2013 414
Chatsworth Westcliff P7136.74180 Infrastructure - Road transport Roads, Pavements & Bridges 70 2012/2013 570
Chatsworth Bayview P7137.74180 Infrastructure - Road transport Roads, Pavements & Bridges 70 2012/2013 123
Induna Ndlela Kasompisi St P7387.74180 Infrastructure - Road transport Roads, Pavements & Bridges 79 2012/2013 346
R391 Umlazi P7389.74180 Infrastructure - Road transport Roads, Pavements & Bridges 82 2012/2013 133
R194, Umlazi P7390.74180 Infrastructure - Road transport Roads, Pavements & Bridges 82 2012/2013 149
W434 Umlazi P7391.74180 Infrastructure - Road transport Roads, Pavements & Bridges 82 2012/2013 160
Harcombe Road, Kingsburgh P7395.74180 Infrastructure - Road transport Roads, Pavements & Bridges 97 2012/2013 256
14 Marion Road, Amanzimtoti P7396.74180 Infrastructure - Road transport Roads, Pavements & Bridges 97 2012/2013 1,473
Kissin Road, Amanzimtoti P7397.74180 Infrastructure - Road transport Roads, Pavements & Bridges 97 2012/2013 370
Dhalia Road, Craigieburn P7398.74180 Infrastructure - Road transport Roads, Pavements & Bridges 99 2012/2013 500
Previous target
year to
complete
Current Year 2012/132013/14 Medium Term Revenue & Expenditure
FrameworkMunicipal Vote/Capital project Project
number
Asset Class
3
Asset Sub-Class
3
GPS co-ordinates
4
143

ETH eThekwini - Supporting Table SA37 Consolidated projects delayed from previous financial year/s
Project name
Original BudgetFull Year
Forecast
Budget Year
2013/14
Budget Year +1
2014/15
Budget Year +2
2015/16
R thousand Year
Previous target
year to
complete
Current Year 2012/132013/14 Medium Term Revenue & Expenditure
FrameworkMunicipal Vote/Capital project Project
number
Asset Class
3
Asset Sub-Class
3
GPS co-ordinates
4
Greenwood Park P7400.74180 Infrastructure - Road transport Roads, Pavements & Bridges 36 2012/2013 500
Kwaximba P7401.74180 Infrastructure - Road transport Roads, Pavements & Bridges 1 2012/2013 1,000
Chartwell Dr, Assagay P7404.74180 Infrastructure - Road transport Roads, Pavements & Bridges 8 2012/2013 415
Nzinga/MacMac Dr, Waterfall P7406.74180 Infrastructure - Road transport Roads, Pavements & Bridges 9 2012/2013 294
Niagra Dr, Waterfall P7407.74180 Infrastructure - Road transport Roads, Pavements & Bridges 9 2012/2013 200
David dr/Marion rd, waterfall P7408.74180 Infrastructure - Road transport Roads, Pavements & Bridges 9 2012/2013 343
Patrick Duncan Rd, Kloof P7409.74180 Infrastructure - Road transport Roads, Pavements & Bridges 10 2012/2013 798
Dan Pienaar rd, kloof P7411.74180 Infrastructure - Road transport Roads, Pavements & Bridges 10 2012/2013 189
100 Stockville rd, Stockville P7413.74180 Infrastructure - Road transport Roads, Pavements & Bridges 10 2012/2013 200
Surrey lane, Everton P7414.74180 Infrastructure - Road transport Roads, Pavements & Bridges 10 2012/2013 291
Leslie/Ashley dr, Hillcrest P7417.74180 Infrastructure - Road transport Roads, Pavements & Bridges 10 2012/2013 366
St Wendolins P7419.74180 Infrastructure - Road transport Roads, Pavements & Bridges 16 2012/2013 200
Sara Close - Clare Estate S/W upgrade P7421.74180 Infrastructure - Road transport Storm water 23 2012/2013 490
Seventeenth ave, Clermont P7422.74180 Infrastructure - Road transport Roads, Pavements & Bridges 23 2012/2013 199
Chesterville, Molife Rd P7423.74180 Infrastructure - Road transport Roads, Pavements & Bridges 24 2012/2013 4,500
Chester Terrace P7425.74180 Infrastructure - Road transport Roads, Pavements & Bridges 24 2012/2013 700
11 Fyfe Ave, Westville P7427.74180 Infrastructure - Road transport Roads, Pavements & Bridges 24 2012/2013 315
Ester Roberts P7432.74180 Infrastructure - Road transport Roads, Pavements & Bridges 31 2012/2013 250
Musgrave P7435.74180 Infrastructure - Road transport Roads, Pavements & Bridges 31 2012/2013 182
Prince uMhlangane Road P7440.74180 Infrastructure - Road transport Roads, Pavements & Bridges 35 2012/2013 680
Fairydene P7444.74180 Infrastructure - Road transport Roads, Pavements & Bridges 37 2012/2013 3,190
Riverdene Park P7445.74180 Infrastructure - Road transport Roads, Pavements & Bridges 37 2012/2013 300
24 Impangele Road, Kwa Mashu P7446.74180 Infrastructure - Road transport Roads, Pavements & Bridges 41 2012/2013 4,000
Amanzimtoti Road, KwaMashu P7447.74180 Infrastructure - Road transport Roads, Pavements & Bridges 41 2012/2013 1,471
150 Nkonjane Road, Kwa Mashu P7448.74180 Infrastructure - Road transport Roads, Pavements & Bridges 41 2012/2013 580
Bheki Zulu rd, Kwamashu P7451.74180 Infrastructure - Road transport Roads, Pavements & Bridges 43 2012/2013 204
A1765 Siyathokoza rd, KwaMashu P7452.74180 Infrastructure - Road transport Roads, Pavements & Bridges 44 2012/2013 151
469/470 Emaplazini, kwamashu P7454.74180 Infrastructure - Road transport Roads, Pavements & Bridges 44 2012/2013 389
Sigwegwe Road, KwaMashu P7455.74180 Infrastructure - Road transport Roads, Pavements & Bridges 46 2012/2013 3,204
Zulu Road, KwaMashu P7457.74180 Infrastructure - Road transport Roads, Pavements & Bridges 46 2011/2012 1,083
Mtungwa Road, KwaMashu P7459.74180 Infrastructure - Road transport Roads, Pavements & Bridges 46 2012/2013 808
upgrade P7460.74180 Infrastructure - Road transport Storm water 46 2012/2013 1,498
Cardinal Road, Phoenix P7462.74180 Infrastructure - Road transport Roads, Pavements & Bridges 48 2012/2013 722
Sandpark Road P7465.74180 Infrastructure - Road transport Roads, Pavements & Bridges 51 2012/2013 594
King Bhekezulu, Ntuzuma P7468.74180 Infrastructure - Road transport Roads, Pavements & Bridges 55 2012/2013 2,688
Isithwalandwe road Intuzuma P7470.74180 Infrastructure - Road transport Roads, Pavements & Bridges 55 2012/2013 637
109390 Ntuzuma P7471.74180 Infrastructure - Road transport Roads, Pavements & Bridges 55 2012/2013 2,486
Rietriver P7475.74180 Infrastructure - Road transport Roads, Pavements & Bridges 58 2012/2013 4,184
Upgrade of culvert, Flamingo Heights P7480.74180 Infrastructure - Road transport Roads, Pavements & Bridges 62 2012/2013 1,500
Starr Street, Verulam (N.R) P7481.74180 Infrastructure - Road transport Roads, Pavements & Bridges 62 2012/2013 114
Industrial Park Road/ Phoenix highway P7492.74180 Infrastructure - Road transport Roads, Pavements & Bridges 48 2012/2013 1,112
99 Sibisi Road, Kwa-Mashu P7498.74180 Infrastructure - Road transport Roads, Pavements & Bridges 45 2012/2013 556
32 Mgonswane Street, Kwa-Mashu P7499.74180 Infrastructure - Road transport Roads, Pavements & Bridges 41 2012/2013 841
42 Mthombothi Road, Kwa-Mashu P7500.74180 Infrastructure - Road transport Roads, Pavements & Bridges 41 2012/2013 152
47 Vukuthu Road, Kwa-Mashu P7501.74180 Infrastructure - Road transport Roads, Pavements & Bridges 41 2012/2013 427
Pascoe Rd P7503.74180 Infrastructure - Road transport Roads, Pavements & Bridges 28 2012/2013 148
68 Huntley Rd, Malvern P7504.74180 Infrastructure - Road transport Roads, Pavements & Bridges 63 2012/2013 150
Bluff Golf Course Area P7507.74180 Infrastructure - Road transport Roads, Pavements & Bridges 66 2012/2013 1,647
Currie Rd, Windermere P7512.74180 Infrastructure - Road transport Roads, Pavements & Bridges 28 2012/2013 300
1485 Letokuhle Rd, Cato Manor P7515.74180 Infrastructure - Road transport Roads, Pavements & Bridges 29 2012/2013 188
Astoria Rd, Mt Vernon P7516.74180 Infrastructure - Road transport Roads, Pavements & Bridges 65 2012/2013 194
Sandy Close, Bellair P7517.74180 Infrastructure - Road transport Roads, Pavements & Bridges 65 2012/2013 237
144

ETH eThekwini - Supporting Table SA37 Consolidated projects delayed from previous financial year/s
Project name
Original BudgetFull Year
Forecast
Budget Year
2013/14
Budget Year +1
2014/15
Budget Year +2
2015/16
R thousand Year
Previous target
year to
complete
Current Year 2012/132013/14 Medium Term Revenue & Expenditure
FrameworkMunicipal Vote/Capital project Project
number
Asset Class
3
Asset Sub-Class
3
GPS co-ordinates
4
42 The Crescent, Hillary P7518.74180 Infrastructure - Road transport Roads, Pavements & Bridges 65 2012/2013 400
66 Sir Arthour Rd, Morningside P7520.74180 Infrastructure - Road transport Roads, Pavements & Bridges 28 2012/2013 100
Acutts Drive, Hillcrest P7524.74180 Infrastructure - Road transport Roads, Pavements & Bridges 9 2012/2013 296
Battersea Avenue, Reservoir Hills P7525.74180 Infrastructure - Road transport Roads, Pavements & Bridges 9 2012/2013 341
Gwaca Road,KwaMashu, K-Section P7528.74180 Infrastructure - Road transport Roads, Pavements & Bridges 41 2012/2013 1,129
Mashu,C-Sec P7529.74180 Infrastructure - Road transport Roads, Pavements & Bridges 41 2012/2013 500
Umfolozi, Kwa-Mashu,C-Section P7530.74180 Infrastructure - Road transport Roads, Pavements & Bridges 41 2012/2013 250
B5, Newlands West P7531.74180 Infrastructure - Road transport Roads, Pavements & Bridges 41 2012/2013 400
C extention (Isolezwa), KwaMashu P7532.74180 Infrastructure - Road transport Roads, Pavements & Bridges 41 2012/2013 245
D95 Lwandle Rd, KwaDabeka P7534.74180 Infrastructure - Road transport Roads, Pavements & Bridges 20 2012/2013 374
Emergency repair - Allen Place, Phoenix P7784.74180 Infrastructure - Road transport Roads, Pavements & Bridges 51 2011/2012 837
48 Burne Road, Athlone Park P7836.74180 Infrastructure - Road transport Roads, Pavements & Bridges 93 2012/2013 176
PL.,CAPELL,MAYFLOWER. P7893.74180 Infrastructure - Road transport Roads, Pavements & Bridges 31 2012/2013 5,200
Emer.S/W P7897.74180 Infrastructure - Road transport Roads, Pavements & Bridges 41 2012/2013 626
collapsed stormwater pipes P7902.74180 Infrastructure - Road transport Storm water 97 2012/2013 1,075
beach access P7903.74180 Infrastructure - Road transport Storm water 26 2012/2013 2,650
canal repair P7906.74180 Infrastructure - Road transport Storm water 90 2012/2013 2,000
replacement of collapsed open drain P7907.74180 Infrastructure - Road transport Storm water 10 2012/2013 350
Amaotana, InandA-Phase 1 P7912.74180 Infrastructure - Road transport Storm water 53 2012/2013 1,197
Upper Amaotana, InandA-Phase 3 P7913.74180 Infrastructure - Road transport Storm water 53 2012/2013 1,041
Rockview Road: Amanzimtoti P8009.74180 Infrastructure - Road transport Roads, Pavements & Bridges 93 2012/2013 3,000
Nyati road: Amanzimtoti North P8010.74180 Infrastructure - Road transport Roads, Pavements & Bridges 93 2012/2013 6,400
Freight Route Infrastructure P4366 Infrastructure - Road transport Roads, Pavements & Bridges Various 2012/2013 3,500 2,700 45,000 4,500
Bellair Road upgrade Phase 2 P4149 Infrastructure - Road transport Roads, Pavements & Bridges 29/31 2012/2013 500 30,000 40,000 40,000
Umlaas RVR GX11 WRD79 PED P6156 Infrastructure - Road transport Roads, Pavements & Bridges 79 2012/2013 4,900 – – 9,000
Cluster, Engineering Unit, Roads P3965 Infrastructure - Road transport Roads, Pavements & Bridges Various 2012/2013 80,975 321,193 310,562 383,381
Access for disavled P7362.74180 Infrastructure - Road transport Roads, Pavements & Bridges Internal 2012/2013 500 5,400 5,400 –
Office Rationalisation C1347.74180 Infrastructure - Road transport Roads, Pavements & Bridges Internal 2012/2013 3,231 18,000 24,300 –
Road B55, Folweni P4381 Infrastructure - Road transport Roads, Pavements & Bridges 95 2011/2012 600 3,000
Road 71 (Bra Mbatha) Kwamakhutha P4383 Infrastructure - Road transport Roads, Pavements & Bridges 94 2011/2012 300 1,000
Phelakwakhe CRL, KwaMakhuta P4712 Infrastructure - Road transport Roads, Pavements & Bridges 94 2011/2012 400 1,350
Rhe Maponondo Lane (Makiligi Crl) P4713 Infrastructure - Road transport Roads, Pavements & Bridges 67 2011/2012 600 1,000
Thasoso Dr, Folwenei P4714 Infrastructure - Road transport Roads, Pavements & Bridges 95 2011/2012 300 2,640
Folweni P4872 Infrastructure - Road transport Roads, Pavements & Bridges 95 2011/2012 300 1,680
58159 RD, (Cilo Rd) Folweni P4873 Infrastructure - Road transport Roads, Pavements & Bridges 95 2011/2012 300 415
BONGANI NZAMA AVENUE P4874 Infrastructure - Road transport Roads, Pavements & Bridges 94 2011/2012 300 1,135
Dudu Mkhize CRL, KwaMakhuta P4876 Infrastructure - Road transport Roads, Pavements & Bridges 94 2011/2012 600 2,100
Mkhandeni ST, Folweni P4877 Infrastructure - Road transport Roads, Pavements & Bridges 95 2011/2012 300 1,105
Mvunge CR, Folweni P4878 Infrastructure - Road transport Roads, Pavements & Bridges 95 2011/2012 200 1,660
Claremont Ward 22 LOW LEV P4999 Infrastructure - Road transport Roads, Pavements & Bridges 22 2011/2012 – 1,500
Rd P4692 Infrastructure - Road transport Roads , Pavements , Bridges 60 2011/2012 225 2,000
Cedarville Road Extension P4672 Infrastructure - Road transport Roads , Pavements , Bridges 25 2011/2012 570 400
sidewalk P 4864 Infrastructure - Road transport Roads , Pavements , Bridges 50 2011/2012 320 800
Vote 9 - Electricity Electrification of Informal Settlements 81053 Infrastructure - Electricity Transmission & Reticulation various 2012/2013 6,000 9,000 12,000 15,000
Westville Control Buildings 80323 Infrastructure - Electricity Transmission & Reticulation 24 2012/2013 3,000 10,000 1,000 1,000
Communication Networks 80190 Other Assets Other various 2012/2013 3,800 10,800 18,000 20,000
Smart Metering - Demand Management 80133 Other Assets Plant & equipment various 2012/2013 3,600 28,000 84,000 50,000
Klaarwater Substation Transformers 80622 Infrastructure - Electricity Transmission & Reticulation 63 2012/2013 1,900 42,000 22,000 –
145

�
�
�
�
�
�
�
�������������
���� �
�
�
�
�
�
�

Corporate & Human Resources0.2%
Governance 0.2%
Community and Emergency Services
4.0%
Sustainable Dev. & City Enterprises
2.9%
Treasury 2.0%
Office of the City Manager 3%
Human Settlements and Infrastructure
87.6%
2013/14 Budget Year Capital expenditure program per vote
146

Corporate & Human Resources 0.2%
Governance 0.2%
Community and Emergency Services
3.9%
Economic and Development Planning
3.6%
Finance 2.0%
Office of the City Manager 3%
Human Settlements and Infrastructure
87.0%
2013/14 Budget Year Capital expenditure program per vote
147

09/10 AUD 10/11 AUD 11/12 AUD CY 12/13 BUD CY 12/13 ADJ CY 12/13 FCST Budget Year
13/14 Budget Year +1
14/15 Budget Year +2
15/16
Finance 5,842,071 6,028,376 6,186,375 8,353,032 8,333,826 7,830,182 8,580,754 9,363,888 9,966,725
Human Settlements and Infrastructure 11,524,779 12,358,256 15,375,093 17,256,278 17,403,309 17,365,927 18,770,899 20,211,224 21,974,525
Community and Emergency Services 123,486 100,601 105,430 210,612 222,133 140,714 309,184 301,875 315,460
Economic Development and Planning 1,456,961 621,988 618,024 489,676 615,948 562,237 519,803 634,839 683,661
Corporate & Human Resources 23,821 20,109 21,404 22,897 22,897 23,075 29,200 12,264 12,878
Office of the City Manager 118,510 158,667 190,780 154,539 155,556 157,269 165,490 174,744 184,522
Governance 5,210 2,068 3,365 6,260 6,770 6,016 5,849 6,018 6,119
5,000,000
10,000,000
15,000,000
20,000,000
25,000,000
30,000,000
35,000,000
Rm
Revenue by Municipal Vote classification - Chart A1
148

09/10 AUD 10/11 AUD 11/12 AUD CY 12/13 BUD CY 12/13 ADJ CY 12/13 FCST Budget Year
13/14 Budget Year +1
14/15 Budget Year +2
15/16
Human Settlements and Infrastructure 11,661,238 11,685,514 14,490,615 16,184,262 16,243,793 15,808,646 17,104,208 18,434,547 19,713,605
Community and Emergency Services 1,548,316 1,715,740 1,854,919 2,115,057 2,123,842 2,068,064 2,252,831 2,469,165 2,603,244
Finance 1,496,987 1,319,163 1,431,233 2,199,736 2,217,276 2,008,415 2,161,948 2,264,072 2,370,930
Economic Development and Planning 992,837 1,015,716 1,096,482 1,262,931 1,282,104 1,176,569 1,292,328 1,372,943 1,453,578
Office of the City Manager 960,134 1,035,524 1,235,714 1,261,950 1,339,192 1,350,919 1,323,344 1,433,251 1,480,061
Governance 276,073 310,299 345,064 390,107 419,208 367,503 460,703 477,084 507,097
Corporate & Human Resources 231,323 244,907 260,354 337,233 337,232 308,350 380,712 382,645 402,838
5,000,000
10,000,000
15,000,000
20,000,000
25,000,000
30,000,000
Rm
Expenditure by Municipal Vote - Chart A2a
149

09/10 AUD 10/11 AUD 11/12 AUD CY 12/13 BUD CY 12/13 ADJ CY 12/13
FCST Budget Year
13/14 Budget Year
+1 14/15 Budget Year
+2 15/16
Corporate & Human Resources 231,323 244,907 260,354 337,233 337,232 308,350 380,712 382,645 402,838
Governance 276,073 310,299 345,064 390,107 419,208 367,503 460,703 477,084 507,097
Office of the City Manager 960,134 1,035,524 1,235,714 1,261,950 1,339,192 1,350,919 1,323,344 1,433,251 1,480,061
Economic Development and Planning 992,837 1,015,716 1,096,482 1,262,931 1,282,104 1,176,569 1,292,328 1,372,943 1,453,578
Finance 1,496,987 1,319,163 1,431,233 2,199,736 2,217,276 2,008,415 2,161,948 2,264,072 2,370,930
Community and Emergency Services 1,548,316 1,715,740 1,854,919 2,115,057 2,123,842 2,068,064 2,252,831 2,469,165 2,603,244
Human Settlements and Infrastructure 11,661,238 11,685,514 14,490,615 16,184,262 16,243,793 15,808,646 17,104,208 18,434,547 19,713,605
5,000,000
10,000,000
15,000,000
20,000,000
25,000,000
Rm
Expenditure by Municipal Vote - Chart A2 (b Trend)
150

09/10 AUD 10/11 AUD 11/12 AUD CY 12/13 BUD CY 12/13 ADJ CY 12/13
FCST Budget Year
13/14 Budget Year
+1 14/15 Budget Year
+2 15/16
Budget & Treasury Office 5,404,158 6,064,853 6,225,076 7,962,447 7,997,818 7,480,813 8,388,280 9,150,874 9,742,005
Electricity 5,996,744 7,390,903 8,756,686 10,016,891 10,016,891 9,874,587 10,413,767 11,344,382 12,296,916
Water 2,101,297 2,752,069 2,698,040 3,335,940 3,335,940 3,054,093 3,588,648 3,888,259 4,161,618
Waste Management 551,721 647,950 715,620 765,605 765,605 889,544 945,573 1,000,769 1,058,702
Housing 1,392,085 259,218 851,754 1,156,795 1,237,040 1,166,921 1,052,799 930,732 1,211,520
Planning & Development 1,126,655 211,420 212,639 102,353 225,629 155,128 100,796 120,109 125,914
Public Safety 247,012 113,850 136,419 111,044 111,044 111,427 116,752 123,606 130,772
Road Transport 1,119,064 415,281 780,067 1,046,928 1,053,611 1,053,198 1,188,027 1,407,944 1,498,507
Community & Social Services 32,571 29,685 30,063 93,764 102,857 47,674 205,193 202,888 213,930
Health 50,833 51,396 56,682 70,044 70,044 70,044 73,846 77,216 78,778
Sport and Recreation 87,295 85,401 97,851 84,462 102,439 78,735 62,394 73,094 79,773
Executive & Council 4,576 3,022 5,775 2,995 2,955 3,040 12,364 2,917 2,936
Waste Water Management 411,645 701,394 1,211,246 1,129,160 1,129,160 1,467,721 1,568,750 1,674,612 1,784,239
Environmental Protection 10,115 8,186 1,822 1,671 5,476 5,576 4,580 14,634 19,665
Corporate Services 242,928 197,007 243,584 218,687 218,687 236,133 243,555 248,519 262,282
5,000,000
10,000,000
15,000,000
20,000,000
25,000,000
30,000,000
35,000,000
Rm
Revenue by standard classification - Chart A3
151

09/10 AUD 10/11 AUD 11/12 AUD CY 12/13
BUD CY 12/13
ADJ CY 12/13
FCST Budget Year
13/14 Budget Year
+1 14/15 Budget Year
+2 15/16
Electricity 5,262,276 6,101,389 7,427,376 8,705,915 8,705,915 8,396,333 8,894,788 9,615,073 10,401,421
Water 1,867,263 2,386,128 2,585,215 3,171,412 3,171,412 3,113,877 3,438,506 3,722,652 3,992,549
Budget & Treasury Office 1,065,176 973,087 2,098,709 1,528,127 1,510,496 1,351,087 1,447,240 1,524,825 1,585,710
Road Transport 1,365,912 1,366,173 1,458,122 1,528,215 1,538,332 1,668,989 1,643,204 1,792,772 1,912,486
Waste Water Management 791,635 682,192 883,323 960,992 959,179 911,038 1,016,580 1,095,377 1,178,794
Public Safety 808,556 863,506 1,185,551 1,287,285 1,360,864 1,365,456 1,472,281 1,742,281 1,553,343
Sport and Recreation 696,206 529,752 791,559 1,085,396 1,102,330 1,083,236 1,131,143 1,214,093 1,277,559
Waste Management 661,776 696,608 775,556 886,227 886,227 901,861 972,229 1,046,453 1,087,084
Planning & Development 670,949 616,324 544,602 747,771 802,396 684,815 759,226 832,979 878,369
Community & Social Services 438,297 484,709 530,584 650,708 658,853 638,674 733,962 780,008 828,379
Health 263,397 288,241 300,479 265,698 264,157 243,662 267,093 320,000 330,134
Housing 1,568,222 536,825 311,428 592,973 674,663 549,392 840,142 821,590 774,409
Executive & Council 190,852 200,868 225,446 235,420 263,734 234,123 287,979 304,963 324,544
Environmental Protection 102,632 102,770 117,597 129,917 132,372 130,791 154,711 172,879 186,304
Corporate Services 997,226 1,080,705 986,944 1,428,635 1,447,602 1,315,159 1,474,448 1,530,134 1,599,045
5,000,000
10,000,000
15,000,000
20,000,000
25,000,000
30,000,000
Rm
Expenditure by standard classification - Chart A4
152

09/10 AUD 10/11 AUD 11/12 AUD CY 12/13 BUD CY 12/13 ADJ CY 12/13
FCST Budget Year
13/14 Budget Year
+1 14/15 Budget Year
+2 15/16
Property rates 4,086,153 4,070,801 4,353,757 4,711,969 4,711,969 4,625,172 5,007,906 5,352,702 5,719,985
Service charges - electricity revenue 5,777,841 7,022,871 8,376,497 9,581,538 9,581,538 9,479,766 10,012,505 10,921,640 11,858,171
Transfers recognised - capital 2,271,869 981,135 1,550,919 2,831,077 2,886,944 2,809,306 3,183,431 3,581,313 4,084,292
Service charges - water revenue 1,562,168 1,833,505 1,894,285 2,622,062 2,622,062 2,339,396 2,824,247 3,049,451 3,254,767
Transfers recognised - Operational 1,483,128 1,631,911 1,858,822 2,126,964 2,266,351 2,140,176 2,359,637 2,447,577 2,542,976
5,000,000
10,000,000
15,000,000
20,000,000
25,000,000
30,000,000
Rm
Revenue by Source - Major - Chart A5(a)
153

Transfers recognised - Operational
Service charges - water revenue Transfers recognised - capital Service charges - electricity
revenue Property rates
09/10 AUD 1,483,128 1,562,168 2,271,869 5,777,841 4,086,153
10/11 AUD 1,631,911 1,833,505 981,135 7,022,871 4,070,801
11/12 AUD 1,858,822 1,894,285 1,550,919 8,376,497 4,353,757
CY 12/13 BUD 2,126,964 2,622,062 2,831,077 9,581,538 4,711,969
CY 12/13 ADJ 2,266,351 2,622,062 2,886,944 9,581,538 4,711,969
CY 12/13 FCST 2,140,176 2,339,396 2,809,306 9,479,766 4,625,172
Budget Year 13/14 2,359,637 2,824,247 3,183,431 10,012,505 5,007,906
Budget Year +1 14/15 2,447,577 3,049,451 3,581,313 10,921,640 5,352,702
Budget Year +2 15/16 2,542,976 3,254,767 4,084,292 11,858,171 5,719,985
2,000,000
4,000,000
6,000,000
8,000,000
10,000,000
12,000,000
14,000,000
Rm
Revenue by Source - Major - Chart A5(b) - source trend
154

09/10 AUD 10/11 AUD 11/12 AUD CY 12/13
BUD CY 12/13
ADJ CY 12/13
FCST Budget Year
13/14 Budget Year
+1 14/15 Budget Year
+2 15/16
Interest earned - external investments 201,693 134,414 231,693 239,754 244,707 330,529 374,237 469,488 540,070
Fines 80,143 129,284 129,165 104,400 104,400 103,295 108,163 114,352 120,968
Other revenue 2,335,349 1,771,811 2,176,810 2,328,441 2,393,150 2,281,140 2,434,475 2,561,788 2,687,680
Service charges - refuse 343,263 374,399 405,204 425,382 425,382 428,034 461,142 487,262 517,671
Rental of facilities and equipment 435,830 433,768 494,955 349,152 349,173 397,550 393,693 413,397 423,816
Service charges - other 90,038 101,161 82,693 213,153 213,848 174,646 186,924 198,264 210,915
Interest earned - outstanding debtors 101,914 85,955 92,526 94,145 95,655 101,171 103,859 108,403 113,176
Service charges - sanitation revenue 68,187 559,237 635,928 671,356 671,356 665,583 731,182 797,816 866,353
Gains on disposal of PPE 78,944 48,319 65,265 32,021 32,021 42,801 34,231 34,281 34,282
Licences and permits 17,732 20,263 28,369 21,361 21,361 23,311 24,406 25,288 26,214
Contributed assets
Property rates - penalties & collection charges 150,210 81,854 111,867 132,134 132,134 132,134 129,085 129,085 129,085
Agency services 10,377 9,377 11,718 8,385 8,385 11,409 12,058 12,744 13,470
Dividends received
1,000,000
2,000,000
3,000,000
4,000,000
5,000,000
6,000,000
Rm
Revenue by Source - Minor - Chart A6
155

09/10 AUD 10/11 AUD 11/12 AUD CY 12/13 BUD CY 12/13 ADJ CY 12/13 FCST Budget Year
13/14 Budget Year +1
14/15 Budget Year +2
15/16
Employee related costs 4,633,319 4,913,878 6,576,031 6,104,168 6,140,726 5,827,673 6,681,852 7,252,891 7,670,289
Bulk purchases 4,531,944 5,495,517 6,666,970 7,839,667 7,839,667 7,696,470 8,045,483 8,738,481 9,491,963
Other expenditure 4,543,821 1,768,604 1,556,637 2,805,537 2,912,620 2,814,441 2,975,494 3,268,769 3,563,525
Depreciation & asset impairment 1,236,808 1,466,639 1,523,993 1,849,181 1,849,292 1,789,637 1,842,045 1,907,251 1,984,435
5,000,000
10,000,000
15,000,000
20,000,000
25,000,000
Rm
Expenditure by Type - Major - Chart A7(a)
156

09/10 AUD 10/11 AUD 11/12 AUD CY 12/13 BUD CY 12/13 ADJ CY 12/13 FCST Budget Year
13/14 Budget Year +1
14/15 Budget Year +2
15/16
Finance charges 484,290 692,943 2,682,403 1,247,576 1,232,749 1,074,415 1,168,516 1,190,426 1,158,521
Contracted services 830,311 2,107,650 1,051,833 3,076,758 3,085,421 3,128,309 3,409,928 3,579,823 3,738,132
Debt impairment 574,189 628,768 394,630 550,000 614,000 500,941 536,625 578,446 593,203
Grants and subsidies 139,488 132,121 126,094 174,319 183,945 174,266 203,713 202,213 209,443
Remuneration of councillors 73,969 77,919 84,752 83,766 83,821 72,007 104,516 110,792 117,282
Loss on disposal of PPE 56,050 877 7,075 1,100 1,198 2,706 1,423 2,278 2,159
1,000,000
2,000,000
3,000,000
4,000,000
5,000,000
6,000,000
7,000,000
Rm
Expenditure by Type - Minor - Chart A7(b)
157
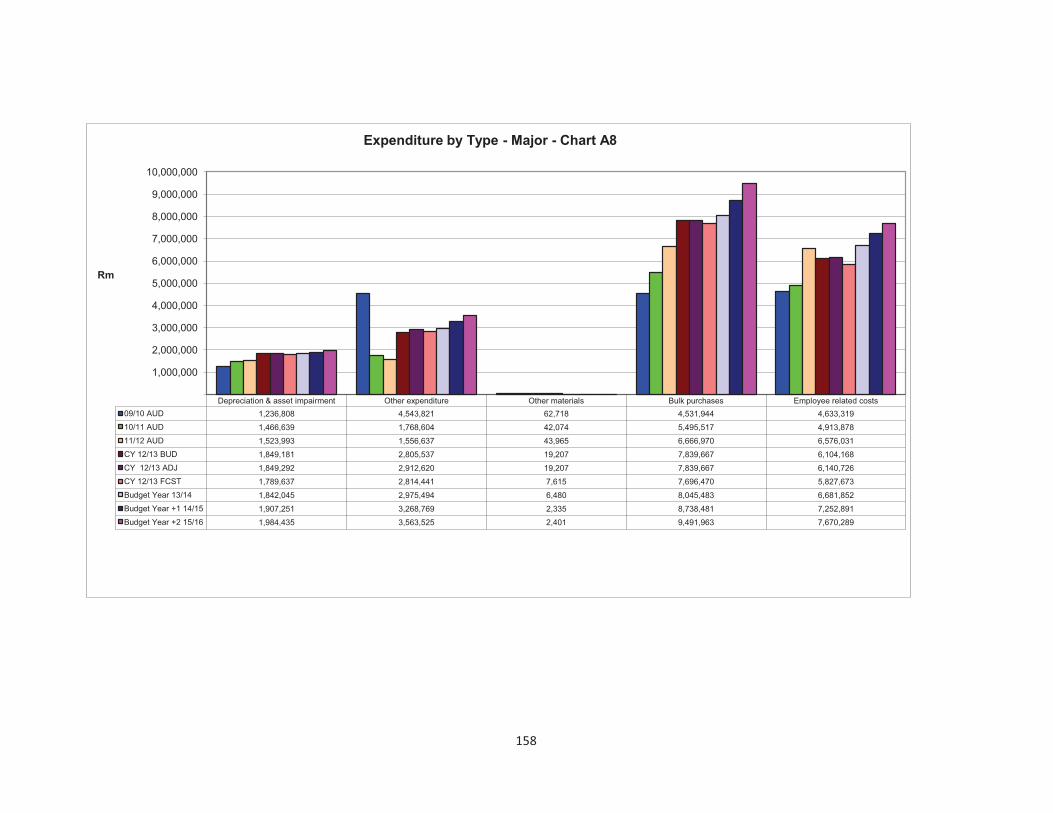
Depreciation & asset impairment Other expenditure Other materials Bulk purchases Employee related costs
09/10 AUD 1,236,808 4,543,821 62,718 4,531,944 4,633,319
10/11 AUD 1,466,639 1,768,604 42,074 5,495,517 4,913,878
11/12 AUD 1,523,993 1,556,637 43,965 6,666,970 6,576,031
CY 12/13 BUD 1,849,181 2,805,537 19,207 7,839,667 6,104,168
CY 12/13 ADJ 1,849,292 2,912,620 19,207 7,839,667 6,140,726
CY 12/13 FCST 1,789,637 2,814,441 7,615 7,696,470 5,827,673
Budget Year 13/14 1,842,045 2,975,494 6,480 8,045,483 6,681,852
Budget Year +1 14/15 1,907,251 3,268,769 2,335 8,738,481 7,252,891
Budget Year +2 15/16 1,984,435 3,563,525 2,401 9,491,963 7,670,289
1,000,000
2,000,000
3,000,000
4,000,000
5,000,000
6,000,000
7,000,000
8,000,000
9,000,000
10,000,000
Rm
Expenditure by Type - Major - Chart A8
158

09/10 AUD 10/11 AUD 11/12 AUD CY 12/13 BUD CY 12/13 ADJ CY 12/13 FCST Budget Year 13/14 Budget Year +1
14/15 Budget Year +2
15/16
Human Settlements and Infrastructure 4,499,562 3,175,228 2,864,250 4,733,159 4,603,142 4,603,142 4,753,608 4,865,577 5,504,138
Office of the City Manager 1,204,825 192,561 142,860 139,202 236,785 236,785 169,477 166,093 204,768
1,000,000
2,000,000
3,000,000
4,000,000
5,000,000
6,000,000
Rm
Capital expenditure by Municipal Vote (Major) - Chart A9
159

09/10 AUD 10/11 AUD 11/12 AUD CY 12/13 BUD CY 12/13 ADJ CY 12/13 FCST Budget Year
13/14 Budget Year +1
14/15 Budget Year +2
15/16
Finance 243,453 161,102 323,899 67,800 111,059 111,059 110,580 144,750 115,932
Economic and Development Planning 347,671 152,503 91,316 187,688 183,399 199,399 194,778 232,740 275,100
Community and Emergency Services 178,877 80,905 71,839 164,466 164,440 164,440 214,654 359,984 354,822
Governance 16,884 21,274 17,349 16,400 17,010 17,010 13,500 23,680 14,310
Corporate & Human Resources 8,497 4,307 3,958 646 646 10,170 2,250 810
100,000
200,000
300,000
400,000
500,000
600,000
700,000
800,000
900,000
Rm
Capital expenditure by Municipal Vote (Minor) - Chart A10
160

09/10 AUD 10/11 AUD 11/12 AUD CY 12/13
BUD CY 12/13
ADJ CY 12/13
FCST Budget Year
13/14 Budget Year
+1 14/15 Budget Year
+2 15/16
Planning & Development 1,326,573 160,452 59,107 333,100 418,628 418,628 323,127 360,330 424,200
Housing 130,102 41,931 213,850 1,167,509 1,139,889 1,139,889 789,306 707,587 1,327,400
Water 1,709,152 1,099,205 483,294 691,089 621,089 621,089 744,430 841,400 806,100
Electricity 683,238 585,308 567,382 539,850 674,106 674,106 568,798 642,352 653,774
Road Transport 1,394,580 1,038,760 1,014,281 1,450,153 1,294,993 1,294,993 1,797,874 1,887,853 1,948,691
Waste Water Management 448,043 350,972 426,008 654,758 654,758 654,758 770,400 700,750 677,400
Budget & Treasury Office 45,995 230,363 323,777 67,800 111,059 111,059 110,580 144,750 115,932
Waste Management 113,824 91,590 159,435 179,800 168,307 168,307 82,800 85,635 90,773
Community & Social Services 54,425 127,283 95,010 95,010 80,536 202,363 208,202
Sport and Recreation 117,620 45,584 30,388 12,300 12,300 12,300 24,612 45,826 52,798
Health 7,529 4,063 15,453 16,500 16,500 16,500 30,262 25,000 9,900
Executive & Council 33,508 20,739 85,352 16,400 17,010 17,010 13,500 23,680 14,310
Public Safety 63,733 33,144 25,998 15,583 47,830 47,830 47,321 59,021 67,940
Environmental Protection 12,969 2,700 2,700 2,700 34,200 34,857 23,850
Corporate Services 393,987 78,937 646 646 10,170 2,250 810
1,000,000
2,000,000
3,000,000
4,000,000
5,000,000
6,000,000
7,000,000
Rm
Capital expenditure by Standard Classification - Chart A11
161

09/10 AUD 10/11 AUD 11/12 AUD CY 12/13
BUD CY 12/13
ADJ CY 12/13
FCST Budget Year
13/14 Budget Year
+1 14/15 Budget Year
+2 15/16
Corporate & Human Resources 8497 4307 3958 0 646 646 10170 2250 810
Governance 16884 21274 17349 16400 17010 17010 13500 23680 14310
Community and Emergency Services 178877 80905 71839 164466 164440 164440 214654 359984 354822
Sustainable Dev. & City Enterprises 335532 135524 56541 154798 142743 142743 157097 201860 229550
Treasury 243453 161102 325376 67800 111059 111059 110580 144750 115482
Office of the City Manager 1204825 192561 142860 139202 236785 236785 169477 166093 204768
Human Settlements and Infrastructure 4505602 3178463 2865340 4742597 4612580 4612580 4756668 4868457 5521638
0
1000000
2000000
3000000
4000000
5000000
6000000
Rm
Capital expenditure by Municipal Vote (Major - Trend) - Chart A12
162
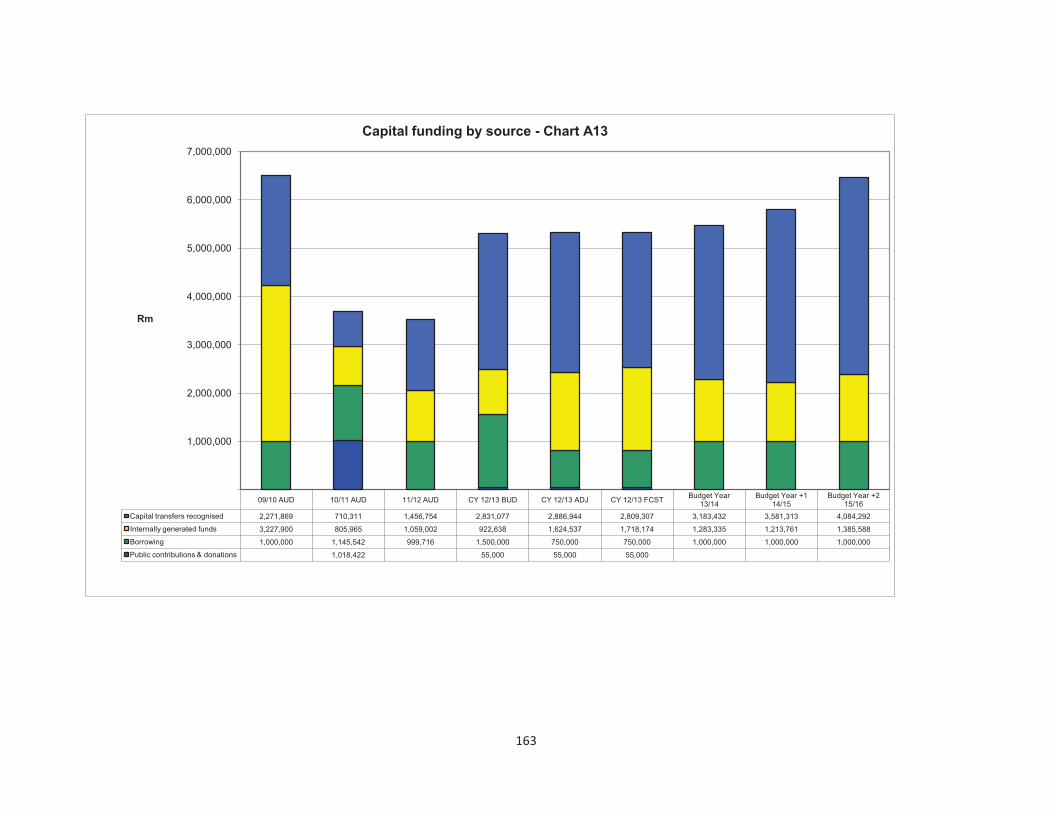
09/10 AUD 10/11 AUD 11/12 AUD CY 12/13 BUD CY 12/13 ADJ CY 12/13 FCST Budget Year
13/14 Budget Year +1
14/15 Budget Year +2
15/16
Capital transfers recognised 2,271,869 710,311 1,456,754 2,831,077 2,886,944 2,809,307 3,183,432 3,581,313 4,084,292
Internally generated funds 3,227,900 805,965 1,059,002 922,638 1,624,537 1,718,174 1,283,335 1,213,761 1,385,588
Borrowing 1,000,000 1,145,542 999,716 1,500,000 750,000 750,000 1,000,000 1,000,000 1,000,000
Public contributions & donations 1,018,422 55,000 55,000 55,000
1,000,000
2,000,000
3,000,000
4,000,000
5,000,000
6,000,000
7,000,000
Rm
Capital funding by source - Chart A13
163

09/10 AUD 10/11 AUD 11/12 AUD CY 12/13 BUD CY 12/13 ADJ CY 12/13
FCST Budget Year
13/14 Budget Year
+1 14/15 Budget Year
+2 15/16
Creating Quality Living Environment 10,592,709 11,521,084 13,607,875 15,186,511 15,277,252 14,754,159 16,273,264 17,491,800 18,781,257
Financial Accountable and Sustainable City 5,686,043 6,082,979 6,675,954 7,712,176 7,772,376 7,688,628 8,150,419 8,764,718 9,357,117
Developing a Prosperous,Diverse Economy and Employment
201,885 405,581 527,296 410,233 449,825 451,199 432,018 461,455 493,603
Other objectives 342,334 376,295 232,594 353,299 374,039 382,128 421,353 406,323 427,620
5,000,000
10,000,000
15,000,000
20,000,000
25,000,000
30,000,000
35,000,000
Rm
IDP Strategic Objectives - Revenue - Chart A14
164

09/10 AUD
10/11 AUD
11/12 AUD
CY 12/13 BUD
CY 12/13 ADJ
CY 12/13 FCST
Budget Year 13/14
Budget Year +1 14/15
Budget Year +2 15/16
Creating Quality Living Environment 11,641,159 11,983,402 15,245,118 16,851,821 16,948,367 16,506,313 17,906,969 19,306,259 20,659,113
Financial Accountable and Sustainable City 1,898,499 1,644,152 1,310,031 2,167,458 2,148,869 1,942,632 2,086,138 2,185,132 2,284,940
Developing a Prosperous,Diverse Economy and Employment 817,006 797,686 738,369 903,670 903,129 813,780 920,555 984,467 1,049,882
Fostering a Socially Equitable Environment 1,136,904 1,121,849 1,324,847 1,427,215 1,446,620 1,483,186 1,498,335 1,660,328 1,725,151
Good Governance and Responsive Local Government 723,640 791,595 954,635 1,058,048 1,143,016 1,020,018 1,136,490 1,206,709 1,252,614
Develop and Sustain our Spatial,Natural and Bulit Environment 341,818 343,804 366,191 431,637 437,403 411,982 446,024 475,979 492,390
Creating a Platform for Growth, Empowerment and Skills Dev 253,208 237,176 226,824 325,118 324,270 296,052 368,196 370,564 389,926
Embracing our Cultural Diversity,art and heritage 354,675 407,199 548,367 586,311 610,971 614,519 613,367 644,267 677,338
5,000,000
10,000,000
15,000,000
20,000,000
25,000,000
30,000,000
Rm
IDP Strategic Objectives - Expenditure - Chart A15
165

09/10 AUD 10/11 AUD 11/12 AUD CY 12/13 BUD CY 12/13 ADJ CY 12/13
FCST Budget Year
13/14 Budget Year
+1 14/15 Budget Year
+2 15/16
Creating Quality Living Environment 4,616,908 3,190,965 2,873,607 4,232,412 4,673,125 4,673,125 4,885,716 5,121,006 5,764,790
Embracing our Cultural Diversity 274 21,031 200,330 37,327 37,327 42,947 61,963 66,817
Developing a Prosperous,Diverse Economy and Employment
1,296,208 118,887 91,316 582,288 311,630 327,630 179,192 208,190 283,499
Financial Accountable and Sustainable City 243,126 190,743 323,899 110,800 111,059 111,059 110,580 144,750 115,932
Other objectives 343,253 287,287 205,618 182,885 183,340 183,340 248,332 259,165 238,842
1,000,000
2,000,000
3,000,000
4,000,000
5,000,000
6,000,000
7,000,000
Rm
IDP Strategic Objectives - Capital Expenditure - Chart A16
166

09/10 AUD 10/11 AUD 11/12 AUD CY 12/13 BUD CY 12/13 ADJ CY 12/13 FCST Budget Year 13/14 Budget Year +1 14/15 Budget Year +2 15/16
Borrowing 22.00% 22.40% 17.90% 18.50% 18.50% 18.50% 14.50% 14.50% 15.50%
0.00%
5.00%
10.00%
15.00%
20.00%
25.00%
Debt (borrowing as a % of total revenue collection) - Chart A17
167
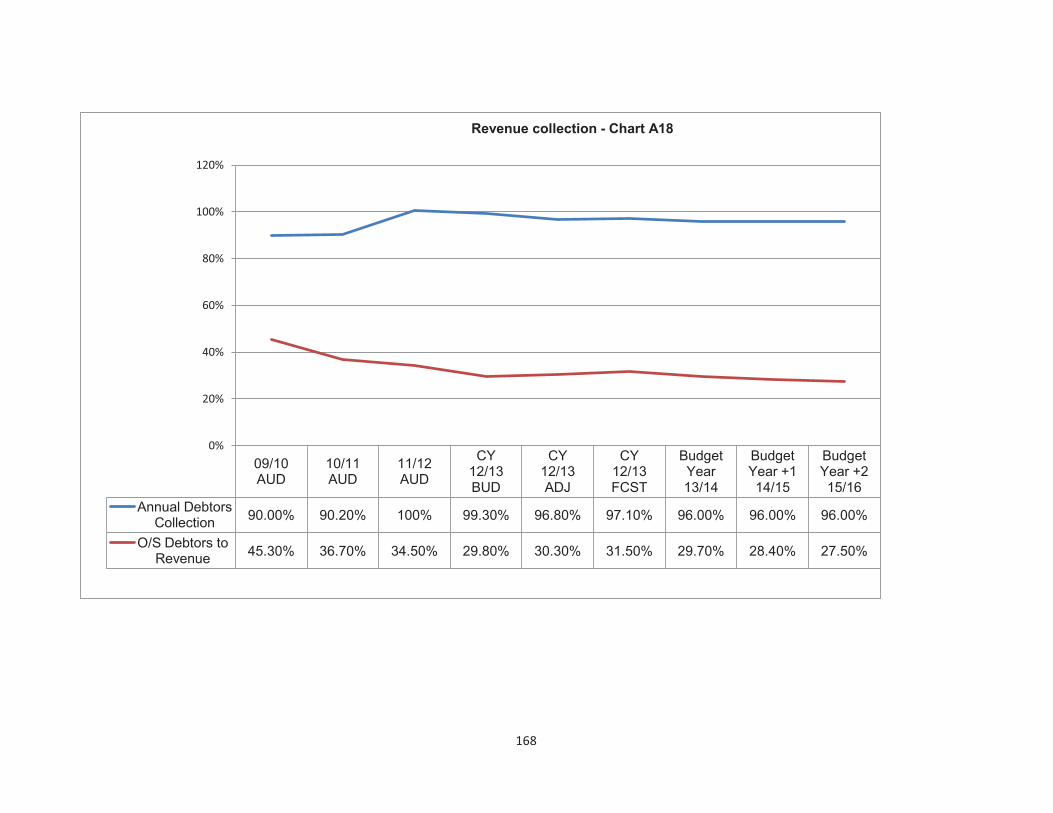
09/10 AUD
10/11 AUD
11/12 AUD
CY 12/13 BUD
CY 12/13 ADJ
CY 12/13 FCST
Budget Year 13/14
Budget Year +1 14/15
Budget Year +2 15/16
Annual Debtors Collection
90.00% 90.20% 100% 99.30% 96.80% 97.10% 96.00% 96.00% 96.00%
O/S Debtors to Revenue
45.30% 36.70% 34.50% 29.80% 30.30% 31.50% 29.70% 28.40% 27.50%
0%
20%
40%
60%
80%
100%
120%
Revenue collection - Chart A18
168
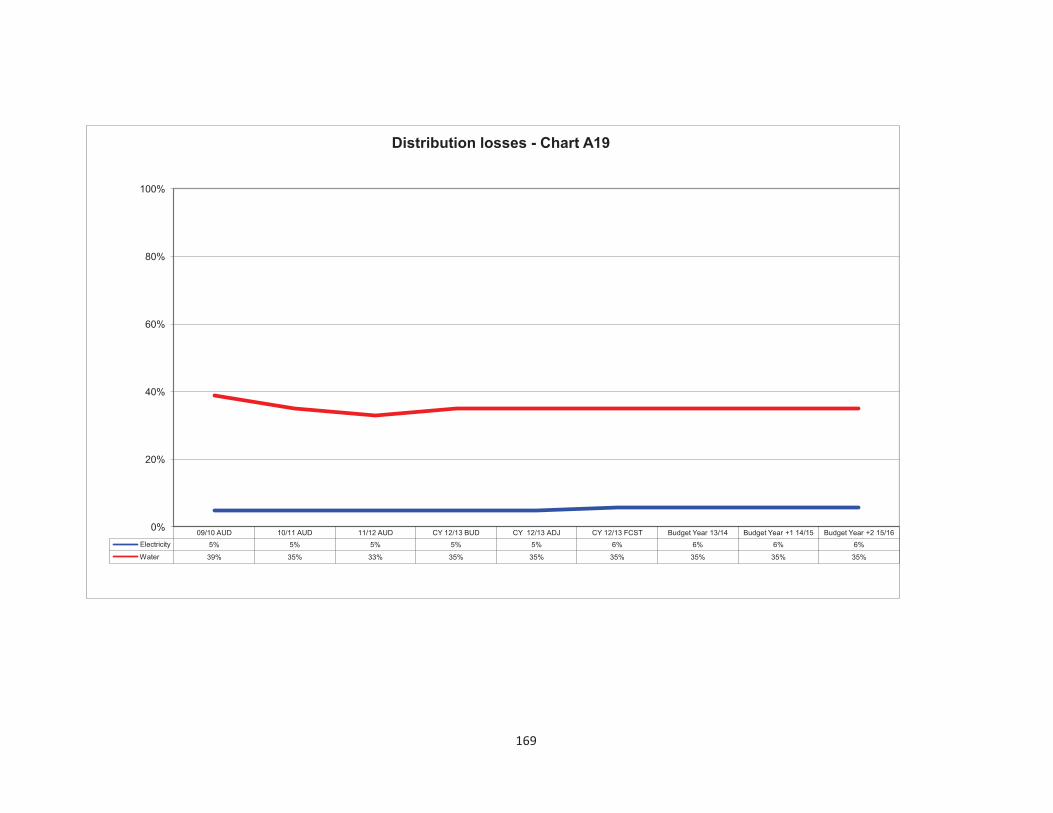
09/10 AUD 10/11 AUD 11/12 AUD CY 12/13 BUD CY 12/13 ADJ CY 12/13 FCST Budget Year 13/14 Budget Year +1 14/15 Budget Year +2 15/16
Electricity 5% 5% 5% 5% 5% 6% 6% 6% 6%
Water 39% 35% 33% 35% 35% 35% 35% 35% 35%
0%
20%
40%
60%
80%
100%
Distribution losses - Chart A19
169

09/10 AUD 10/11 AUD 11/12 AUD CY 12/13 BUD CY 12/13 ADJ CY 12/13 FCST Budget Year
13/14 Budget Year +1
14/15 Budget Year +2
15/16
Borrowed capex funding 69% 72% 51% 62% 31% 30% 43% 45% 42%
0%
20%
40%
60%
80%
100%
Borrowed capex funding - Chart A20
170

09/10 AUD 10/11 AUD 11/12 AUD CY 12/13 BUD CY 12/13 ADJ CY 12/13 FCST Budget Year
13/14 Budget Year +1
14/15 Budget Year +2
15/16
Employee costs 27.5% 26.8% 31.4% 25.8% 25.7% 25.0% 26.5% 26.7% 26.4%
Remuneration 28.0% 26.1% 31.7% 26.2% 26.1% 25.3% 26.9% 27.1% 26.8%
Repairs & Maintenance 13.0% 9.8% 8.6% 10.5% 8.8% 11.2% 11.3% 11.1% 10.8%
Finance charges & Depreciation 10.2% 11.8% 11.4% 13.1% 12.9% 12.3% 11.9% 11.4% 10.8%
0.0%
20.0%
40.0%
60.0%
80.0%
100.0%
Expenditure analysis (of Total Revenue) - Chart A21
171
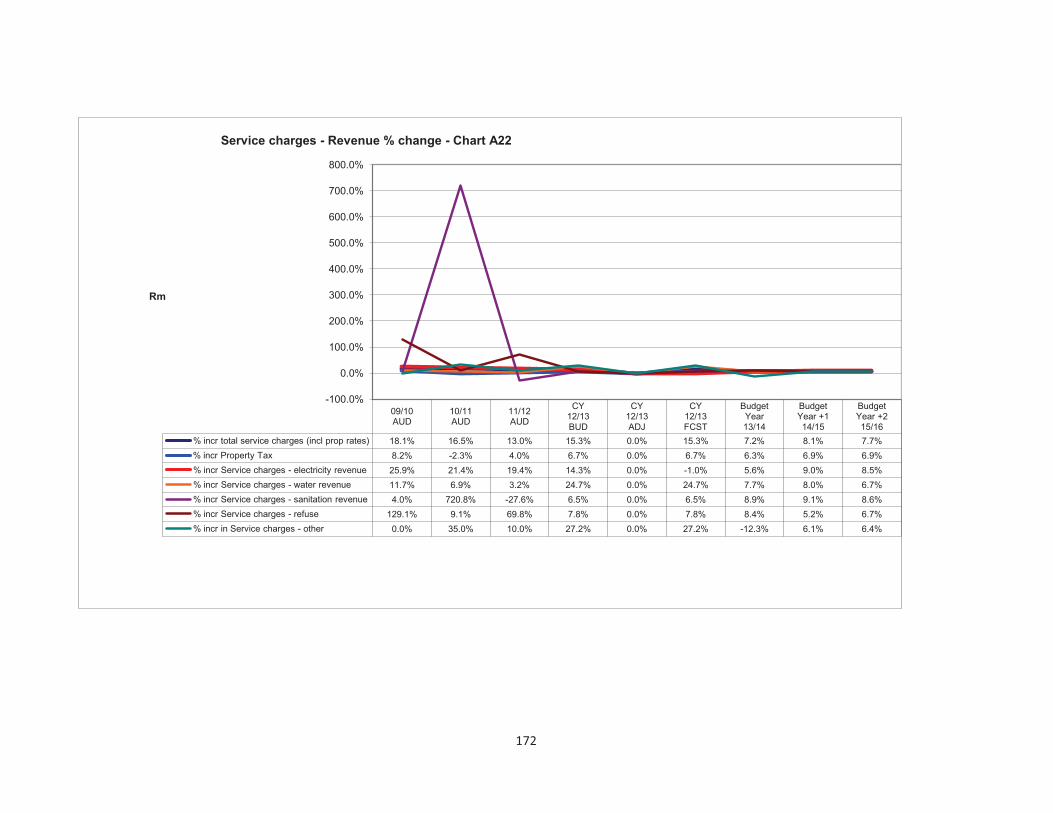
09/10 AUD
10/11 AUD
11/12 AUD
CY 12/13 BUD
CY 12/13 ADJ
CY 12/13 FCST
Budget Year 13/14
Budget Year +1 14/15
Budget Year +2 15/16
% incr total service charges (incl prop rates) 18.1% 16.5% 13.0% 15.3% 0.0% 15.3% 7.2% 8.1% 7.7%
% incr Property Tax 8.2% -2.3% 4.0% 6.7% 0.0% 6.7% 6.3% 6.9% 6.9%
% incr Service charges - electricity revenue 25.9% 21.4% 19.4% 14.3% 0.0% -1.0% 5.6% 9.0% 8.5%
% incr Service charges - water revenue 11.7% 6.9% 3.2% 24.7% 0.0% 24.7% 7.7% 8.0% 6.7%
% incr Service charges - sanitation revenue 4.0% 720.8% -27.6% 6.5% 0.0% 6.5% 8.9% 9.1% 8.6%
% incr Service charges - refuse 129.1% 9.1% 69.8% 7.8% 0.0% 7.8% 8.4% 5.2% 6.7%
% incr in Service charges - other 0.0% 35.0% 10.0% 27.2% 0.0% 27.2% -12.3% 6.1% 6.4%
-100.0%
0.0%
100.0%
200.0%
300.0%
400.0%
500.0%
600.0%
700.0%
800.0%
Rm
Service charges - Revenue % change - Chart A22
172

09/10 AUD 10/11 AUD 11/12 AUD CY 12/13 BUD CY 12/13 ADJ CY 12/13 FCST Budget Year
13/14 Budget Year +1
14/15 Budget Year +2
15/16
Cash Flow - Op. Activities 2,553,965 3,646,105 4,505,075 4,940,053 4,648,381 5,023,164 5,546,506 5,362,240 6,133,239
Cash Flow - Investing (used) (6,411,993) (3,692,192) (3,452,933) (5,320,148) (5,297,809) (5,318,428) (4,925,758) (5,222,506) (5,831,925)
Cash Flow - Financing 2,609,419 1,592,956 699,315 704,476 (45,524) 56,628 (101,872) 36,725 (17,400)
(8,000,000)
(6,000,000)
(4,000,000)
(2,000,000)
2,000,000
4,000,000
6,000,000
8,000,000
Rm
Cash Flow Trend - Chart A23
173

�
�
�
�
�
�
�
�������������� �
�
�
�
�
�
�
�

Description 2009/10 2010/11 2011/12
R thousandsAudited
Outcome
Audited
Outcome
Audited
Outcome
Original
Budget
Adjusted
Budget
Full Year
Forecast
Budget Year
2013/14
Budget Year
+1 2014/15
Budget Year
+2 2015/16
Financial Performance
Property rates 4,243,653 4,170,191 4,483,982 4,844,103 4,844,103 4,757,306 5,136,991 5,481,787 5,849,070
Service charges 7,863,974 9,917,898 11,428,037 13,513,490 13,514,185 13,087,424 14,216,001 15,454,433 16,707,877
Investment revenue 187,933 125,809 221,079 234,754 238,754 323,390 366,870 462,054 532,563
Transfers recognised - operational 1,483,128 1,631,911 1,858,822 2,126,964 2,266,351 2,140,176 2,359,637 2,447,577 2,542,976
Other own revenue 2,832,231 2,229,905 2,688,497 2,633,176 2,709,887 2,661,999 2,793,376 2,929,820 3,054,418
Total Revenue (excluding capital transfers
and contributions)
16,610,919 18,075,714 20,680,417 23,352,487 23,573,280 22,970,295 24,872,874 26,775,672 28,686,904
Employee costs 4,540,518 4,812,870 6,475,740 5,997,367 6,034,114 5,725,464 6,572,363 7,136,896 7,547,400
Remuneration of councillors 73,969 77,919 84,751 83,766 83,821 72,007 104,516 110,792 117,282
Depreciation & asset impairment 1,079,106 1,398,136 1,523,348 1,777,563 1,777,674 1,747,390 1,799,485 1,864,363 1,941,203
Finance charges 480,942 687,219 855,068 1,239,138 1,223,638 1,065,304 1,159,456 1,181,434 1,149,540
Materials and bulk purchases 4,594,662 5,537,591 6,710,935 7,858,874 7,858,874 7,704,085 8,051,963 8,740,816 9,494,365
Transfers and grants 149,977 142,621 141,694 184,819 183,945 174,266 203,713 202,213 209,443
Other expenditure 5,966,640 4,425,212 4,698,492 6,222,849 6,412,001 6,259,501 6,725,912 7,212,671 7,664,943
Total Expenditure 16,885,815 17,081,567 20,490,028 23,364,375 23,574,066 22,748,019 24,617,408 26,449,185 28,124,176
Surplus/(Deficit) (274,895) 994,146 190,390 (11,888) (786) 222,277 255,466 326,486 562,728
Transfers recognised - capital 2,271,869 981,135 1,550,919 2,831,077 2,886,944 2,809,306 3,183,431 3,581,313 4,084,292
Contributions recognised - capital & contributed assets – – – – – – – – –
Surplus/(Deficit) after capital transfers &
contributions
1,996,974 1,975,282 1,741,309 2,819,188 2,886,158 3,031,583 3,438,898 3,907,799 4,647,020
Share of surplus/ (deficit) of associate – 3,521 9,755 – – – – – –
Surplus/(Deficit) for the year 1,996,974 1,978,803 1,751,064 2,819,188 2,886,158 3,031,583 3,438,898 3,907,799 4,647,020
Capital expenditure & funds sources
Capital expenditure 6,493,670 3,774,138 3,484,739 5,285,263 5,285,263 5,285,263 5,432,146 5,767,074 6,441,880
Transfers recognised - capital 2,271,869 981,135 1,550,919 2,831,077 2,886,944 2,809,307 3,183,432 3,581,313 4,084,292
Public contributions & donations – – – 55,000 55,000 55,000 – – –
Borrowing 1,000,000 2,000,000 1,000,000 1,500,000 750,000 750,000 1,000,000 1,000,000 1,000,000
Internally generated funds 3,221,801 793,002 933,820 899,186 1,593,319 1,670,956 1,248,714 1,185,761 1,357,588
Total sources of capital funds 6,493,670 3,774,138 3,484,739 5,285,263 5,285,263 5,285,263 5,432,146 5,767,074 6,441,880
Financial position
Total current assets 7,737,583 9,141,914 11,296,241 9,928,113 10,025,932 11,734,006 12,446,396 12,913,873 13,526,027
Total non current assets 30,223,809 32,775,747 34,688,200 38,671,967 38,042,054 38,367,244 42,114,560 46,103,597 50,695,574
Total current liabilities 7,195,765 7,467,927 8,207,007 7,152,015 7,580,409 8,513,208 8,652,796 8,861,039 9,185,069
Total non current liabilities 10,048,230 11,282,789 12,859,425 12,690,466 12,049,180 12,269,210 12,354,132 12,371,827 12,317,070
Community wealth/Equity 20,717,397 23,166,945 24,918,009 28,757,599 28,438,397 29,318,832 33,554,028 37,784,604 42,719,462
Cash flows
Net cash from (used) operating 2,524,973 3,511,586 4,547,307 4,966,210 4,702,003 5,050,377 5,559,008 5,407,007 6,175,345
Net cash from (used) investing (6,342,191) (3,607,585) (3,422,339) (5,296,696) (5,266,591) (5,271,210) (4,891,137) (5,194,506) (5,803,925)
Net cash from (used) financing 2,604,365 1,435,770 568,550 705,481 (44,519) 57,633 (100,893) 37,702 (16,362)
Cash/cash equivalents at the year end 1,767,907 3,107,678 4,801,196 4,072,407 3,088,305 4,637,996 5,204,974 5,455,177 5,810,235
Cash backing/surplus reconciliation
Cash and investments available 1,767,907 3,107,678 4,801,196 3,488,307 3,488,307 5,137,996 5,704,974 5,955,175 6,307,087
Application of cash and investments 2,168,469 1,846,695 2,741,700 2,076,969 1,811,545 2,808,155 3,255,647 3,555,389 4,044,903
Balance - surplus (shortfall) (400,562) 1,260,983 2,059,496 1,411,338 1,676,762 2,329,841 2,449,327 2,399,786 2,262,184
Asset management
Asset register summary (WDV) 29,085,454 31,686,381 32,786,820 37,609,146 37,609,146 37,903,203 43,394,687 49,191,138 55,663,683
Depreciation & asset impairment 1,079,106 1,398,136 1,523,348 1,777,563 1,777,674 1,747,390 1,799,485 1,864,363 1,941,203
Renewal of Existing Assets 1,384,468 3,370,040 1,133,879 1,846,784 1,846,784 1,846,784 1,794,952 1,936,510 2,033,572
Repairs and Maintenance 2,193,111 1,793,026 1,804,896 2,489,703 2,092,971 2,602,380 2,840,845 3,009,160 3,124,453
Free services
Cost of Free Basic Services provided 1,128,804 1,339,310 1,260,645 940,808 1,130,808 1,066,069 1,113,275 1,182,782 1,256,689
Revenue cost of free services provided 2,115,160 2,408,283 2,642,169 2,185,430 2,387,430 2,381,430 2,774,656 2,958,783 3,156,524
Households below minimum service level
Water: 82 60 74 73 74 87 80 75 70
Sanitation/sewerage: 221 210 235 219 283 212 202 214 224
Energy: 340 334 345 358 358 358 363 368 373
Refuse: – – – – – – – – –
ETH eThekwini - Budget Summary
Current Year 2012/132013/14 Medium Term Revenue &
Expenditure Framework
174

ETH eThekwini -Budgeted Financial Performance (revenue and expenditure)
Description 2009/10 2010/11 2011/12
R thousandAudited
Outcome
Audited
Outcome
Audited
Outcome
Original
Budget
Adjusted
Budget
Full Year
Forecast
Budget Year
2013/14
Budget Year
+1 2014/15
Budget Year
+2 2015/16
Revenue By Source
Property rates 4,093,443 4,088,337 4,372,115 4,711,969 4,711,969 4,625,172 5,007,906 5,352,702 5,719,985
Property rates - penalties & collection charges 150,210 81,854 111,867 132,134 132,134 132,134 129,085 129,085 129,085
Service charges - electricity revenue 5,619,105 7,022,871 8,352,757 9,581,538 9,581,538 9,479,766 10,012,505 10,921,640 11,858,171
Service charges - water revenue 1,719,533 1,833,505 1,893,865 2,622,062 2,622,062 2,339,396 2,824,247 3,049,451 3,254,767
Service charges - sanitation revenue 68,133 559,237 404,734 671,356 671,356 665,583 731,182 797,816 866,353
Service charges - refuse revenue 342,925 374,399 635,915 425,382 425,382 428,034 461,142 487,262 517,671
Service charges - other 114,278 127,886 140,766 213,153 213,848 174,646 186,924 198,264 210,915
Rental of facilities and equipment 343,295 353,483 406,218 349,152 349,173 397,550 393,693 413,397 423,816
Interest earned - external investments 187,933 125,809 221,079 234,754 238,754 323,390 366,870 462,054 532,563
Interest earned - outstanding debtors 101,914 85,955 92,526 94,145 95,655 101,171 103,859 108,403 113,176
Dividends received –
Fines 80,143 129,284 129,165 104,400 104,400 103,295 108,163 114,352 120,968
Licences and permits 17,732 20,263 28,369 21,361 21,361 23,311 24,406 25,288 26,214
Agency services 10,377 9,377 11,718 8,385 8,385 11,409 12,058 12,744 13,470
Transfers recognised - operational 1,483,128 1,631,911 1,858,822 2,126,964 2,266,351 2,140,176 2,359,637 2,447,577 2,542,976
Other revenue 2,199,826 1,583,420 1,955,245 2,023,711 2,098,891 1,982,462 2,116,966 2,221,353 2,322,492
Gains on disposal of PPE 78,944 48,123 65,256 32,021 32,021 42,801 34,231 34,281 34,282
Total Revenue (excluding capital transfers
and contributions)
16,610,919 18,075,714 20,680,417 23,352,487 23,573,280 22,970,295 24,872,874 26,775,672 28,686,904
Expenditure By Type
Employee related costs 4,540,518 4,812,870 6,475,740 5,997,367 6,034,114 5,725,464 6,572,363 7,136,896 7,547,400
Remuneration of councillors 73,969 77,919 84,751 83,766 83,821 72,007 104,516 110,792 117,282
Debt impairment 572,984 628,149 393,592 550,000 614,000 500,941 536,625 578,446 593,203
Depreciation & asset impairment 1,079,106 1,398,136 1,523,348 1,777,563 1,777,674 1,747,390 1,799,485 1,864,363 1,941,203
Finance charges 480,942 687,219 855,068 1,239,138 1,223,638 1,065,304 1,159,456 1,181,434 1,149,540
Bulk purchases 4,531,944 5,495,517 6,666,970 7,839,667 7,839,667 7,696,470 8,045,483 8,738,481 9,491,963
Other materials 62,718 42,074 43,965 19,207 19,207 7,615 6,480 2,335 2,401
Contracted services 817,435 2,077,960 2,842,544 3,063,653 3,072,316 3,114,809 3,395,453 3,564,294 3,721,464
Transfers and grants 149,977 142,621 141,694 184,819 183,945 174,266 203,713 202,213 209,443
Other expenditure 4,520,220 1,718,774 1,456,100 2,608,096 2,724,487 2,641,045 2,792,411 3,067,653 3,348,118
Loss on disposal of PPE 56,000 329 6,256 1,100 1,198 2,706 1,423 2,278 2,159
Total Expenditure 16,885,815 17,081,567 20,490,028 23,364,375 23,574,066 22,748,019 24,617,408 26,449,185 28,124,176
Surplus/(Deficit) (274,895) 994,146 190,390 (11,888) (786) 222,277 255,466 326,486 562,728
Transfers recognised - capital 2,271,869 981,135 1,550,919 2,831,077 2,886,944 2,809,306 3,183,431 3,581,313 4,084,292
Contributions recognised - capital – – – – – – – – –
Contributed assets
Surplus/(Deficit) after capital transfers &
contributions
1,996,974 1,975,282 1,741,309 2,819,188 2,886,158 3,031,583 3,438,898 3,907,799 4,647,020
Taxation
Surplus/(Deficit) after taxation 1,996,974 1,975,282 1,741,309 2,819,188 2,886,158 3,031,583 3,438,898 3,907,799 4,647,020
Attributable to minorities
Surplus/(Deficit) attributable to municipality
1,996,974 1,975,282 1,741,309 2,819,188 2,886,158 3,031,583 3,438,898 3,907,799 4,647,020
Share of surplus/ (deficit) of associate 3,521 9,755
Surplus/(Deficit) for the year 1,996,974 1,978,803 1,751,064 2,819,188 2,886,158 3,031,583 3,438,898 3,907,799 4,647,020
Current Year 2012/132013/14 Medium Term Revenue &
Expenditure Framework
175

ETH eThekwini - Budgeted Financial Position
Description 2009/10 2010/11 2011/12
R thousandAudited
Outcome
Audited
Outcome
Audited
Outcome
Original
Budget
Adjusted
Budget
Full Year
Forecast
Budget Year
2013/14
Budget Year
+1 2014/15
Budget Year
+2 2015/16
ASSETS
Current assets
Cash 475,706 610,042 703,598 437,376 437,376 738,778 775,717 814,503 855,228
Call investment deposits 1,672,044 3,040,000 4,730,000 3,700,000 3,700,000 5,000,000 5,500,000 5,700,000 6,000,000
Consumer debtors 2,219,123 2,590,485 2,753,087 2,572,408 2,670,227 2,802,114 2,891,624 3,031,920 3,212,419
Other debtors 3,119,311 2,645,000 2,860,938 2,995,920 2,995,920 2,932,461 3,005,773 3,080,917 3,157,940
Current portion of long-term receivables 27,254 44,981 13,207 5,718 5,718 13,471 13,741 14,015 14,296
Inventory 224,145 211,406 235,411 216,691 216,691 247,182 259,541 272,518 286,144
Total current assets 7,737,583 9,141,914 11,296,241 9,928,113 10,025,932 11,734,006 12,446,396 12,913,873 13,526,027
Non current assets
Long-term receivables 276,767 283,474 286,277 270,885 270,885 292,003 297,843 303,799 309,875
Investments – –
Investment property 267,141 263,081 260,100 257,284 257,284 254,898 249,800 244,804 239,908
Investment in Associate 724,499 679,570 644,013 679,570 679,570 713,549 749,226 786,687 826,022
Property, plant and equipment 28,489,665 30,844,618 32,786,820 36,954,617 36,324,704 36,324,704 39,957,393 43,860,132 48,360,837
Agricultural
Biological
Intangible 328,648 634,394 630,625 397,245 397,245 693,688 763,056 801,209 841,270
Other non-current assets 137,089 70,610 80,365 112,366 112,366 88,402 97,242 106,966 117,662
Total non current assets 30,223,809 32,775,747 34,688,200 38,671,967 38,042,054 38,367,244 42,114,560 46,103,597 50,695,574
TOTAL ASSETS 37,961,392 41,917,661 45,984,441 48,600,080 48,067,986 50,101,250 54,560,956 59,017,470 64,221,601
LIABILITIES
Current liabilities
Bank overdraft 379,843 542,364 632,402 649,069 649,069 600,782 570,743 559,328 548,141
Borrowing 524,300 692,416 772,327 941,638 1,156,000 1,156,000 1,021,000 1,078,000 1,160,700
Consumer deposits 789,263 936,733 1,064,895 1,023,726 1,023,726 1,118,140 1,174,047 1,232,749 1,294,387
Trade and other payables 5,329,957 5,126,040 5,443,283 4,366,220 4,580,252 5,350,068 5,604,552 5,714,157 5,910,573
Provisions 172,402 170,374 294,100 171,362 171,362 288,218 282,454 276,805 271,268
Total current liabilities 7,195,765 7,467,927 8,207,007 7,152,015 7,580,409 8,513,208 8,652,796 8,861,039 9,185,069
Non current liabilities
Borrowing 8,150,386 9,418,040 9,906,679 10,127,511 9,486,225 9,486,225 9,464,425 9,386,425 9,225,725
Provisions 1,897,844 1,864,749 2,952,746 2,562,955 2,562,955 2,782,985 2,889,707 2,985,402 3,091,345
Total non current liabilities 10,048,230 11,282,789 12,859,425 12,690,466 12,049,180 12,269,210 12,354,132 12,371,827 12,317,070
TOTAL LIABILITIES 17,243,995 18,750,716 21,066,432 19,842,481 19,629,589 20,782,418 21,006,928 21,232,866 21,502,139
NET ASSETS 20,717,397 23,166,945 24,918,009 28,757,599 28,438,397 29,318,832 33,554,028 37,784,604 42,719,462
COMMUNITY WEALTH/EQUITY
Accumulated Surplus/(Deficit) 9,946,354 11,342,972 12,499,278 15,257,307 15,324,277 16,024,374 19,972,699 24,348,306 29,526,085
Reserves 10,771,043 11,823,973 12,418,731 13,500,292 13,114,120 13,294,458 13,581,329 13,436,298 13,193,377
Minorities' interests
TOTAL COMMUNITY WEALTH/EQUITY 20,717,397 23,166,945 24,918,009 28,757,599 28,438,397 29,318,832 33,554,028 37,784,604 42,719,462
Current Year 2012/132013/14 Medium Term Revenue &
Expenditure Framework
176
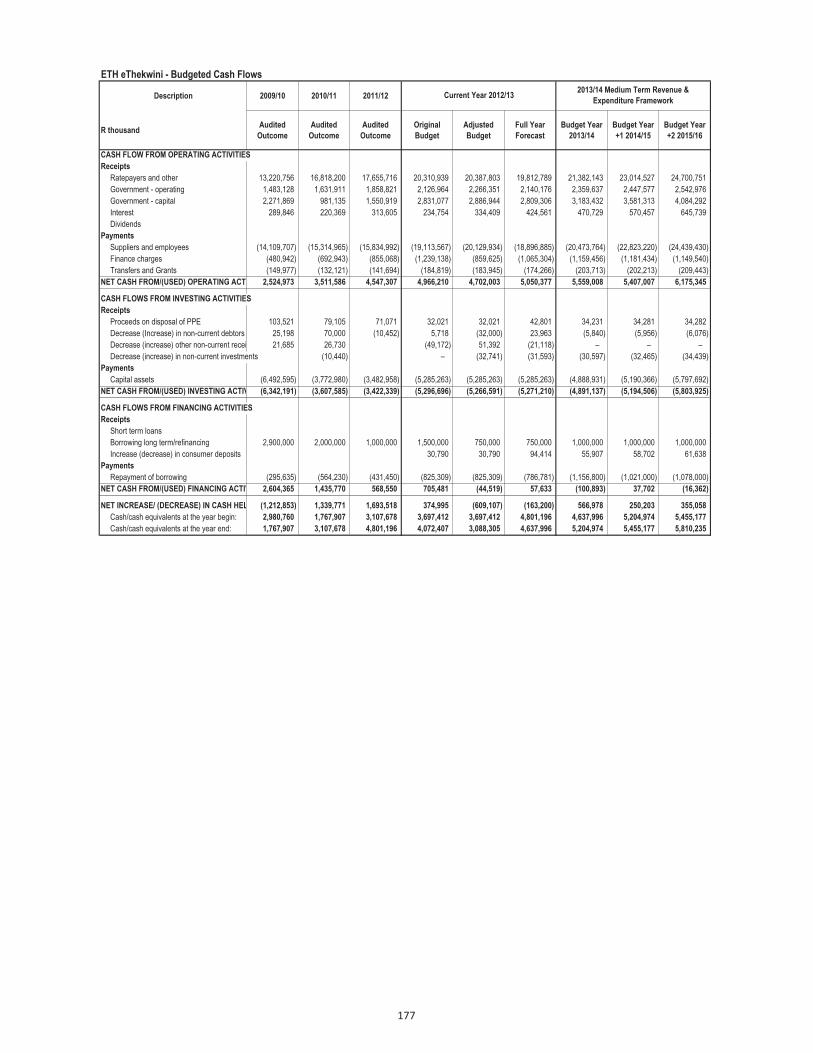
ETH eThekwini - Budgeted Cash Flows
Description 2009/10 2010/11 2011/12
R thousandAudited
Outcome
Audited
Outcome
Audited
Outcome
Original
Budget
Adjusted
Budget
Full Year
Forecast
Budget Year
2013/14
Budget Year
+1 2014/15
Budget Year
+2 2015/16
CASH FLOW FROM OPERATING ACTIVITIES
Receipts
Ratepayers and other 13,220,756 16,818,200 17,655,716 20,310,939 20,387,803 19,812,789 21,382,143 23,014,527 24,700,751
Government - operating 1,483,128 1,631,911 1,858,821 2,126,964 2,266,351 2,140,176 2,359,637 2,447,577 2,542,976
Government - capital 2,271,869 981,135 1,550,919 2,831,077 2,886,944 2,809,306 3,183,432 3,581,313 4,084,292
Interest 289,846 220,369 313,605 234,754 334,409 424,561 470,729 570,457 645,739
Dividends
Payments
Suppliers and employees (14,109,707) (15,314,965) (15,834,992) (19,113,567) (20,129,934) (18,896,885) (20,473,764) (22,823,220) (24,439,430)
Finance charges (480,942) (692,943) (855,068) (1,239,138) (859,625) (1,065,304) (1,159,456) (1,181,434) (1,149,540)
Transfers and Grants (149,977) (132,121) (141,694) (184,819) (183,945) (174,266) (203,713) (202,213) (209,443)
NET CASH FROM/(USED) OPERATING ACTIVITIES2,524,973 3,511,586 4,547,307 4,966,210 4,702,003 5,050,377 5,559,008 5,407,007 6,175,345
CASH FLOWS FROM INVESTING ACTIVITIES
Receipts
Proceeds on disposal of PPE 103,521 79,105 71,071 32,021 32,021 42,801 34,231 34,281 34,282
Decrease (Increase) in non-current debtors 25,198 70,000 (10,452) 5,718 (32,000) 23,963 (5,840) (5,956) (6,076)
Decrease (increase) other non-current receivables 21,685 26,730 (49,172) 51,392 (21,118) – – –
Decrease (increase) in non-current investments (10,440) – (32,741) (31,593) (30,597) (32,465) (34,439)
Payments
Capital assets (6,492,595) (3,772,980) (3,482,958) (5,285,263) (5,285,263) (5,285,263) (4,888,931) (5,190,366) (5,797,692)
NET CASH FROM/(USED) INVESTING ACTIVITIES(6,342,191) (3,607,585) (3,422,339) (5,296,696) (5,266,591) (5,271,210) (4,891,137) (5,194,506) (5,803,925)
CASH FLOWS FROM FINANCING ACTIVITIES
Receipts
Short term loans
Borrowing long term/refinancing 2,900,000 2,000,000 1,000,000 1,500,000 750,000 750,000 1,000,000 1,000,000 1,000,000
Increase (decrease) in consumer deposits 30,790 30,790 94,414 55,907 58,702 61,638
Payments
Repayment of borrowing (295,635) (564,230) (431,450) (825,309) (825,309) (786,781) (1,156,800) (1,021,000) (1,078,000)
NET CASH FROM/(USED) FINANCING ACTIVITIES2,604,365 1,435,770 568,550 705,481 (44,519) 57,633 (100,893) 37,702 (16,362)
NET INCREASE/ (DECREASE) IN CASH HELD (1,212,853) 1,339,771 1,693,518 374,995 (609,107) (163,200) 566,978 250,203 355,058
Cash/cash equivalents at the year begin: 2,980,760 1,767,907 3,107,678 3,697,412 3,697,412 4,801,196 4,637,996 5,204,974 5,455,177
Cash/cash equivalents at the year end: 1,767,907 3,107,678 4,801,196 4,072,407 3,088,305 4,637,996 5,204,974 5,455,177 5,810,235
Current Year 2012/132013/14 Medium Term Revenue &
Expenditure Framework
177

�
�
�
�
�
�����������������
������ �������������������
�
�
�
�
�
�
�
�

CAPITAL BUDGET BY CLUSTER 2013 - 2016
Description Project No. Vote No. Ward No. BUDGET 2013/14 BUDGET 2014/15 BUDGET 2015/16
Rm Rm Rm
CAPITAL BUDGETS 5,432.146 5,767.074 6,441.880
HUMAN SETTLEMENTS AND INFRASTRUCTURE 4,753.608 4,865.577 5,504.139
HOUSING 789.306 707.587 1,327.400
NEW HOUSING-DOH (INCL Slums Clearance) 589.306 527.587 846.500
Amaoti - Angola H4001 1.70908.25200 53 8.000 0.000 14.400
Amaoti - Buffer Strip H4001 1.70908.25200 57 2.500 8.587 14.200
Amaoti - Geze'hlekisa H4001 1.70908.25200 53 3.000 10.000 15.000
Amaoti - Geneva H4001 1.70908.25200 57 10.000 12.000 8.600
Amaoti - Geze'hlekisa (Zimbabwe) H4001 1.70908.25200 53,57 10.000 0.000 0.000
Amaoti - Mozambique H4001 1.70908.25200 56,57 10.000 10.000 15.400
Amaoti - Palestine H4001 1.70908.25200 53.59 0.500 6.000 12.600
Amaoti - Tanzania H4001 1.70908.25200 53,57 10.000 10.000 14.400
Amaoti - Zambia H4001 1.70908.25200 57 10.000 10.000 4.600
Amatikwe Ph 2 & 3 H4001 1.70908.25200 56 3.000 10.000 14.600
Belvedere Extension H4001 1.70908.25200 61 15.000 10.000 4.500
Buffelsdraai H4001 1.70908.25200 59 5.000 10.000 12.800
Bux Farm H4001 1.70908.25200 103 1.000 10.000 10.900
Cato Crest Interface H4001 1.70908.25200 29,30,101 3.000 10.000 14.800
Cato Crest Insitu Upgrade H4001 1.70908.25200 30,101 15.000 10.000 10.900
Cato Crest Insitu Upgrade H4001 1.70908.25200 30,101 0.000 0.000 16.800
Chesterville H4001 1.70908.25200 24 10.000 10.000 14.600
Clermont Infill H4001 1.70908.25200 92 3.000 10.000 0.000
Cliffdale P1 H4001 1.70908.25200 103 10.000 10.000 8.400
Congo Ph 2 H4001 1.70908.25200 55,56 3.000 0.000 0.000
Cornubia Ph 1 H4001 1.70908.25200 102 15.000 0.000 0.000
Cornubia Ph 2 H4001 1.70908.25200 102 44.000 80.000 0.000
Cornubia Ph 3 H4001 1.70908.25200 102 0.000 0.000 35.800
Cornubia Ph 4 H4001 1.70908.25200 102 0.000 0.000 40.100
Cottonlands H4001 1.70908.25200 60 3.000 30.000 0.000
Ekwandeni H4001 1.70908.25200 7,91 3.000 0.000 0.000
Emapheleni H4001 1.70908.25200 22 2.900 0.000 0.000
Emaplazini H4001 1.70908.25200 43,44 2.000 0.000 20.000
Etafuleni Ph 1 H4001 1.70908.25200 53,56 15.000 0.000 0.000
Etafuleni Ph2 H4001 1.70908.25200 56 20.000 10.000 20.400
Folweni H4001 1.70908.25200 95,96 3.000 5.000 10.000
Greylands Ph 2 H4001 1.70908.25200 62 3.000 0.000 10.000
Gwalas Farm H4001 1.70908.25200 61 3.000 5.000 5.000
Hammarsdale Ext. H4001 1.70908.25200 4,6,7 3.000 5.000 18.500
Harmony Heights H4001 1.70908.25200 21 3.000 5.000 12.600
Inanda Africa H4001 1.70908.25200 44,55 3.000 10.000 15.000
Inanda Mission Reserve H4001 1.70908.25200 2,3,44,56 10.000 10.000 2.500
Jamaica H4001 1.70908.25200 34 2.500 0.000 0.000
Kenville H4001 1.70908.25200 34 3.000 10.000 10.000
Klaarwater Station H4001 1.70908.25200 16,63 4.500 0.000 0.000
KwaMashu J & K H4001 1.70908.25200 41,45 1.000 5.000 12.600
KwaManzi H4001 1.70908.25200 99 10.000 10.000 12.600
Lindokuhle H4001 1.70908.25200 62 3.000 0.000 0.000
Lovu 1 & 2 H4001 1.70908.25200 98 2.500 0.000 0.000
Lovu 259 H4001 1.70908.25200 98 3.000 0.000 0.000
Lower Langerfontein P2 H4001 1.70908.25200 9 5.000 0.000 0.000
Lower Thornwood Ph 1 H4001 1.70908.25200 13 3.000 0.000 0.000
Lower Thornwood Ph 2 H4001 1.70908.25200 13 10.000 0.000 0.000
Malundi Township H4001 1.70908.25200 99 2.000 10.000 10.000
Matamfana H4001 1.70908.25200 45 1.000 0.000 0.000
Molweni Upper H4001 1.70908.25200 9 3.500 0.000 0.000
Mophela Ph 1 H4001 1.70908.25200 5 2.500 0.000 0.000
Motala Farm H4001 1.70908.25200 61 3.000 0.000 0.000
Mona Sunhills H4001 1.70908.25200 61,62 3.000 20.000 15.000
Mpola Ph 3 H4001 1.70908.25200 15 3.000 0.000 0.000
Namibia Stop 8 H4001 1.70908.25200 44,55,56 3.000 0.000 0.000
Njobokazi H4001 1.70908.25200 7 3.000 0.000 0.000
Ntshongweni Ph 2 H4001 1.70908.25200 7 5.000 0.000 0.000
Ntuzuma C Ph 2 H4001 1.70908.25200 38,45 2.500 0.000 10.000
Redcliffe H4001 1.70908.25200 59,60 3.000 5.000 15.800
Redcliffe Ph 2 H4001 1.70908.25200 60 3.000 10.000 20.600
Richmond Farm A & B H4001 1.70908.25200 38,45 3.000 10.000 10.000
Rietvallei P1B H4001 1.70908.25200 1,4 3.000 0.000 0.000
Sandton Ph 2 H4001 1.70908.25200 12,14 3.000 0.000 0.000
Sandton Ph 4 H4001 1.70908.25200 12 3.000 0.000 0.000
178

CAPITAL BUDGET BY CLUSTER 2013 - 2016
Description Project No. Vote No. Ward No. BUDGET 2013/14 BUDGET 2014/15 BUDGET 2015/16
Rm Rm Rm
Sankontsha H4001 1.70908.25200 5 3.000 5.000 10.000
Sim Place H4001 1.70908.25200 34 3.000 10.000 15.600
Stockville H4001 1.70908.25200 10 3.000 0.000 0.000
Sunnyside Park (KwaManci Ward 96) H4001 1.70908.25200 67,96 2.500 30.000 35.200
Thambo Plaza H4001 1.70908.25200 55,57 15.000 5.000 0.000
Tshelimnyama Ph 4 H4001 1.70908.25200 15 3.000 0.000 0.000
Umbhayi H4001 1.70908.25200 61 3.000 15.000 0.000
Umlazi B10 H4001 1.70908.25200 77,79,82,83 10.000 20.000 0.000
Umlazi B8 H4001 1.70908.25200 80,81,82 13.000 5.000 10.000
Umlazi B8 H4001 1.70908.25200 80,81,82 0.000 0.000 12.500
Umlazi F11 H4001 1.70908.25200 79 3.000 6.000 10.600
Umlazi Infill H4001 1.70908.25200 80,82,83,85,87 5.000 5.000 40.800
Umlazi Infill Ph 2 H4001 1.70908.25200 83,87 3.500 5.000 20.000
Umlazi Infill Ph 3 H4001 1.70908.25200 78,80,85,86,88 0.000 5.000 15.600
Umlazi Infill Ph 4 H4001 1.70908.25200 77 2.500 5.000 12.600
Umlazi Infill Ph 5 H4001 1.70908.25200 80,81,87 2.000 5.000 13.600
Umlazi Infill Ph 5 P5249A 1.70908.25200 80,81,87 0.000 0.000 13.600
Umlazi Infill Ph 3 H4001 1.70908.25200 78,80,85,86,88 3.600 0.000 0.000
Umnini H4001 1.70908.25200 98,99 2.000 0.000 0.000
Woody Glen Ph 1 H4001 1.70908.25200 91 15.000 10.000 14.200
Woody Glen Rural Ph 1 H4001 1.70908.25200 91 2.500 0.000 12.800
Zamani P1B H4001 1.70908.25200 91 2.500 0.000 0.000
Lovu 259 (Platforms & Slabs) + Top Structures P5110 1.70908.25201 98 3.000 0.000 0.000
Welbedaght West (Construction of 56 houses) P5034 1.70908.25202 72 13.000 0.000 0.000
Ntuzuma D Ph 2 & 3 P5168 1.70908.25203 38,43 48.306 0.000 0.000
Etafuleni Phase 1 P5105 1.70908.25204 53,56 60.000 0.000 0.000
Umhlabunzima Ridge P5155 1.70908.25205 22 3.000 0.000 0.000
Tshelimnyama Phase 4 P5077 1.70908.25206 15 3.000 0.000 0.000
Land Acquisitions (Various) H4001 1.70908.25200 Various 0.000 0.000 95.400
HOSTELS Various Various Various 50.000 50.000 95.000
INFRASTRUCTURE Various Various Various 150.000 130.000 385.900
ENGINEERING 686.605 706.185 721.641
ARCHITECTURAL 24.300 30.600 27.900
Office Rationalisation C1347 1.70830.47610 Internal 18.000 24.300 0.000
Access for the Disabled P7362 1.70830.47610 Internal 5.400 5.400 0.000
Computerised project maint. sys. C0610 1.73505.47130 Internal 0.900 0.900 0.000
Inner City Regeneration 0.000 0.000 13.500
Priority Zones strategic development 0.000 0.000 9.000
Development of Old Fort campus 0.000 0.000 4.500
Old fort complex C2219 0.000 0.000 0.900
PROJECT MANAGEMENT UNIT 7.200 4.742 9.000
Integrated Infrastructure Asset P7193 1.72510.49600 Various 7.200 0.000 7.200
East Zone Hub P7371 1.73749.49213 Various 0.000 0.900 0.450
North Hub P7372 1.73749.45213 Various 0.000 1.350 0.450
Central Zone Hub P7373 1.73749.45213 Various 0.000 0.900 0.450
South Zone Hub P7374 1.73749.45213 Various 0.000 1.592 0.450
ROADS 561.688 634.843 644.439
Bellair Road Upgrade - Phase 2 P4149
1.72510.494
00 29,65,101 30.000 40.000 40.000
Northern Areas Road Upgrades P4150
1.72510.493
00 Various 112.500 130.500 81.000
Road Rehabilitation P3965
1.72510.493
00 Various 321.193 370.562 383.381
Phoenix Highway PT Priority P7276
1.72510.494
00 48,49,50,52 0.000 1.800 0.000
Larkspur Road Widening P6152
1.72510.493
00 25 0.239 0.000 0.000
Matheran Road Extension P4951 1.72510.49300 34 0.270 0.000 5.400
Phepheni Road Gravel P4669 1.72510.49300 38 0.000 1.800 0.000
Ekwandeni School Road P4671 1.72510.49300 7 0.000 2.070 0.000
Wandsbeck Road upgrade P7279 1.72510.49400 23,25 0.000 2.700 2.700
Fording bridge upgrade P4673 1.72510.49300 48 0.000 0.180 0.000
Swanvale Pic Road ext P4674 1.72510.49300 49 0.000 0.180 0.000
Deanmore Pic Access P4668 1.72510.49300 50 0.000 0.270 0.000
Shawham Place Turning T P4680 1.72510.49300 52 0.000 0.180 0.000
idube Road P4670 1.72510.49300 55 0.000 0.450 0.000
Honeysuckle Road Ext P4676 1.72510.49300 60 0.000 0.450 0.000
179

CAPITAL BUDGET BY CLUSTER 2013 - 2016
Description Project No. Vote No. Ward No. BUDGET 2013/14 BUDGET 2014/15 BUDGET 2015/16
Rm Rm Rm
Nqabeni Road P4683 1.72510.49300 93 0.000 0.360 0.000
Luganda - Upgrade Gravel roads P4677 1.72510.49300 13 0.000 0.450 0.000
Upgrade TRK 75192 - Sithundu P4679 1.72510.49300 14 0.000 1.080 0.000
Upgrade TRK 75101 P4682 1.72510.49300 14 0.000 0.450 0.000
Upgrade Dubazane Road P4672 1.72510.49300 17 0.000 0.540 0.000
Upgrade Road 47806 P4675 1.72510.49300 17 0.000 0.450 0.000
Upgrade Dua Road and Bheka Pl P4681 1.72510.49300 17 0.000 1.800 0.000
Ext. of Wood Road / Acle Road P4678 1.72510.49300 63 0.000 0.540 0.000
Upgrade Road 47823 P4686 1.72510.49300 17 0.000 0.450 0.000
Ext. Tividale Place Cowies Hill P4667 1.72510.49300 18 0.000 0.450 0.000
D403 Link to Verulam P4867 1.72510.49300 59 0.000 3.600 7.200
D403 Link Road Phase 3 P3518
1.72510.493
00 59 5.400 0.000 0.000
Hendon Road Upgrade P6878
1.72510.493
00 34 0.270 0.000 4.500
Wembley Road Upgrade P6879
1.72510.493
00 34 0.270 0.000 2.700
Vialis Place Widening / Sidewalk P6880
1.72510.493
00 25 0.360 0.000 0.000
Access to Lots 1031-1034 - KwaMashu P6881
1.72510.493
00 45 0.225 0.000 0.000
Widening of Cartmel Road P6882
1.72510.493
00 23 0.270 0.000 0.000
Constantine Road P6883
1.72510.493
00 25 0.900 0.000 0.000
Foreman Road P6884
1.72510.493
00 25 1.350 0.000 0.000
Ext. Dove Place P7296
1.72510.493
00 16 0.000 0.450 0.000
Luxmi Road P6886
1.72510.493
00 58 0.495 0.000 0.000
Kwa Dabeka Bus Routes P4966
1.72510.494
00 19 0.000 5.850 0.000
Glen Eagle Drive P6888
1.72510.493
00 36 0.405 0.000 0.000
Road access Lots 3012-3027 P7297
1.72510.493
00 23 0.000 0.450 0.000
Access Road 83887 P7298
1.72510.493
00 67 0.000 3.600 0.000
Access Road A907 P7299
1.72510.493
00 67 0.000 2.970 0.000
Pelican Terrace P6892
1.72510.493
00 60 0.225 0.000 0.000
Nkonka Road P6893
1.72510.493
00 45 0.900 0.000 0.000
Newlands Express (access to Linela) P6895
1.72510.493
00 37,38 1.620 0.000 0.000
Fisani Road P6896 1.72510.49300 42 0.540 0.000 0.000
Empusheni Road Phase 3 P4962 1.72510.49400 100 9.000 0.000 0.000
KwaDabeka Bus Route Phase 2 P4966 1.72510.49400 19 10.000 0.000 0.000
Access Road 29006- Lower Illovo P4878 1.72510.49400 98 0.000 0.900 0.000
Juniper Road - Umkomaas P4877 1.72510.49400 99 0.000 3.150 0.000
Dzana Road - Magabheni P4698 1.72510.49300 99 0.000 2.250 0.000
Blue Bonnet Crescent P4872 1.72510.49400 71 0.000 1.013 0.000
Minor Road Rd 108726 from Rd 108725 P4699 1.72510.49300 57 0.900 0.000 0.000
Road 910 Widening P4694 1.72510.49300 72 0.000 1.125 0.000
Road 707 Widening P4873 1.72510.49400 73 0.000 2.475 0.000
Access Road Road 1107 P4874 1.72510.49400 78 0.000 1.350 0.000
Nonoti Road P7307 1.72510.49400 1 0.000 3.150 0.000
Masomini Road P7308 1.72510.49400 8 0.000 3.600 0.000
Dryhoek Road P7309 1.72510.49400 3 0.000 3.780 0.000
Bhasobha Road P7310 1.72510.49400 4 0.000 3.420 0.000
Nozisha Access Road P4875 1.72510.49400 84 0.000 1.013 0.000
Upgrade Road 107949 P4160 1.72510.49400 2 0.000 0.900 0.000
Road Upgrade Ward 5 P4167 1.72510.49300 5 0.000 5.625 0.000
Mabuya Road Taxi Route P4697 1.72510.49300 55 2.970 3.600 0.000
Gumtree Avenue Trevenen Rd to Tower Rd (Veru) - new roadP4399 1.72510.49300 58 0.000 1.260 0.000
Route 3.1 Road Upgrade Phase 2 : Congo to D 403P4172 1.72510.49300 57 1.350 7.650 4.500
Upgrading gravel road - TRK 75221 - DassenhoekP6897 1.72510.49400 14 1.800 0.000 0.000
Upgrading gravel road - TRK 75116 - DassenhoekP6898 1.72510.49400 14 2.250 0.000 0.000
Upgrading gravel road - TRK 47057 - Demat P6903 1.72510.49400 17 3.150 0.000 0.000
Funda Rd - St Wendolins Township P6907 1.72510.49400 16,17 0.720 0.000 0.000
180

CAPITAL BUDGET BY CLUSTER 2013 - 2016
Description Project No. Vote No. Ward No. BUDGET 2013/14 BUDGET 2014/15 BUDGET 2015/16
Rm Rm Rm
Motala Rd- Motala Heights P6912 1.72510.49400 15 1.800 0.000 0.000
Access Road : Mphafa Road (Mnyenzane to Josiah Dlamini)P6926 1.72510.49400 78 1.908 0.000 0.000
Access Road : G1334, Inkongozelo, Mhlabunzima, F779P6927 1.72510.49400 79 1.193 0.000 0.000
Access Road B180 P6933 1.72510.49400 80 1.440 0.000 0.000
Access Road : M1297 P6941 1.72510.49400 83 0.855 0.000 0.000
Road 103717 "R" P6946 1.72510.49400 85 1.620 0.000 0.000
Ezimangweni Road P6951 1.72510.49400 93 3.600 0.000 0.000
Access Road to Sewula Pr Sch. Frm M37 P6954 1.72510.49400 67,93 3.420 0.000 0.000
Access Road to Mthombeni Pr Sch. 83803 TRK & 83881 TRKP6955 1.72510.49400 67 3.150 0.000 0.000
Danganya Msebeni Road (83270/83282TRK) P6956 1.72510.49400 99 5.130 0.000 0.000
Dlamini Road Georgedale P6961 1.72510.49300 5 3.150 0.000 0.000
Malangeni Access Road P6962 1.72510.49300 6 3.150 0.000 0.000
Ntshongweni Road P7314 1.72510.49300 7 2.700 0.000 0.000
Access Roads TRK 86011 P3793 1.72510.49300 8 3.150 0.000 0.000
Balito Road P6963 1.72510.49300 9 3.150 0.000 0.000
Stockville Road Upgrade P4042 1.72510.49300 10 1.800 0.000 1.800
Gravel to blacktop P6965 1.72510.49300 38 0.900 0.000 0.000
Gravel to blacktop P6966 1.72510.49300 42 0.900 0.000 0.000Ward 13 - Sukuma low-level crossing
over Umlaas River P7056 1.72510.49300 13 2.700 0.000 0.000
Footpath Ubangalala Ave - Umbondwe P6036 1.72510.49300 45 0.095 0.000 0.000
Shangase Road Sidewalk P6050 1.72510.49300 6 0.000 0.180 0.000
Kenville Road, Ward 34 P6026 1.72510.49400 34 0.090 0.000 0.000
Ubangalala Avenue, Ward 45 P6036 1.72510.49300 45 0.095 0.000 0.000
Colchester Rd Sidewalk P4865 1.72510.49300 51 0.090 0.000 0.000
Everest Rd Sidewalk P4854 1.72510.49300 36 0.090 0.000 0.000
Sidewalks P4850 1.72510.49300 45 0.090 0.000 0.000
Embo Road Sidewalk P4226 1.72510.49300 8 0.000 0.180 0.000
Newlands West Dr. Sidewalk from Westridge to Castlehill Dr., Ward 37P4246 1.72510.49300 37 0.090 0.000 0.000
King Bhekuzulu Rd Sidewalk - Mzomusha Primary SchoolP4249 1.72510.49300 44 0.090 0.000 0.000
D403 Sidewalk P4255 1.72510.49300 53,57,59 0.090 0.000 0.000
Westridge - Taxi Route 108201 Sidewalk P4267 1.72510.49300 37 0.090 0.000 0.000
Ward 53 Sidewalks Phase 1 P4273 1.72510.49300 53 0.180 0.000 0.000
Sidewalks in Ward 44 P4229 1.72510.49300 44 0.000 0.180 0.000
Sidewalks in Ward 53 P4230 1.72510.49300 53 0.000 0.180 0.000
Sidewalks in Ward 54 P4231 1.72510.49300 54 0.000 0.180 0.000
Sidewalks in Ward 55 P4232 1.72510.49300 55 0.000 0.180 0.000
Sidewalks in Ward 56 P4233 1.72510.49300 56 0.000 0.180 0.000
Sidewalks in Ward 57 P4234 1.72510.49300 57 0.000 0.180 0.000
Rydavale Drive Parthenon P4261 1.72510.49300 49 0.000 0.135 0.000
Queenspark Crescent P4809 1.72510.49300 51 0.000 0.135 0.000
Hexham Rd Sidewalk P4810 1.72510.49300 52 0.000 0.180 0.000
Muziwabantu Primary P4811 1.72510.49300 42 0.000 0.135 0.000
Dalmanet and Ingudulu P4812 1.72510.49300 42 0.000 0.180 0.000
Cassia Road Sidewalk P4262 1.72510.49300 23/58/63 0.000 0.180 0.000
Olivine Road P4813 1.72510.49300 60 0.000 0.180 0.000
Desai/Rajendra Street P4814 1.72510.49300 61 0.000 0.180 0.000
Hillhead Drive P4815 1.72510.49300 102 0.000 0.180 0.000
Weaver Crescent - Umhlanga P4816 1.72510.49300 35 0.000 0.225 0.000
Buxton Road - Claredon P4817 1.72510.49300 36 0.000 0.135 0.000
Bungane Road P4818 1.72510.49300 43 0.000 0.180 0.000
Nquthu Road P4819 1.72510.49300 8 0.000 0.180 0.000
Church Road P4820 1.72510.49300 10 0.000 0.090 0.000
Effingham Road P4821 1.72510.49300 34 0.000 0.045 0.000
Hlobane Road P4822 1.72510.49300 46 0.000 0.108 0.000
Camelia Avenue P4824 1.72510.49300 60 0.000 0.162 0.000
Ngidi School Road P4825 1.72510.49300 40 0.000 0.180 0.000
Tafelkop Access Road P4826 1.72510.49300 41 0.000 0.180 0.000
School Access Roads P4827 1.72510.49300 3 0.000 0.180 0.000
Panekeni Access Road P4828 1.72510.49300 4 0.000 0.180 0.000
Sofasonke Road P4829 1.72510.49300 7 0.000 0.180 0.000
Ntuzuma Access Rd from Mr93 to Court house SidewalkP4831 1.72510.49300 54 0.180 0.000 0.000
Oak Avenue P4834 1.72510.49300 97 0.000 0.540 0.000
Garuppa Crescent Sidewalk P4836 1.72510.49300 11 0.180 0.000 0.000
Siyaya Road Sidewalk P4832 1.72510.49300 44,55 0.180 0.000 0.000
Madiba Road Sidewalk P4220 1.72510.49300 54 0.000 0.180 0.000
Kloof Falls Road P4218 1.72510.49300 1 0.000 0.315 0.000
Road 76750STR P4219 1.72510.49300 3 0.000 0.180 0.000
Benares Road Sidewalk P4770 1.72510.49400 103 0.000 0.180 0.000
Thabo Morena Road - Umlazi P4773 1.72510.49400 74,76,80 0.000 0.450 0.000
Marine Road P4774 1.72510.49400 75 0.000 0.450 0.000
Wanda Celke Road P4775 1.72510.49400 93 0.000 0.450 0.000
181

CAPITAL BUDGET BY CLUSTER 2013 - 2016
Description Project No. Vote No. Ward No. BUDGET 2013/14 BUDGET 2014/15 BUDGET 2015/16
Rm Rm Rm
Illovo Beach Road P4780 1.72510.49400 97 0.000 0.180 0.000
Lanes P4784 1.72510.49400 12 0.000 0.270 0.000
Lanes and Footpaths P4776 1.72510.49400 77 0.000 0.270 0.000
Sidewalks Pascali Road P4781 1.72510.49400 14 0.000 0.180 0.000
Sidewalks Emmaus Road P4782 1.72510.49400 15 0.000 0.180 0.000
Lanes and Footpaths P4771 1.72510.49400 15 0.000 0.270 0.000
Lanes and Footpaths P4772 1.72510.49400 17 0.000 0.270 0.000
Lanes and Footpaths P4777 1.72510.49400 17 0.000 0.270 0.000
Sidewalks Ward 21 P4778 1.72510.49400 21 0.000 0.225 0.000
Sidewalks Ward 22 P4779 1.72510.49400 22 0.000 0.180 0.000
Sidewalks Rockdale P4783 1.72510.49400 24 0.000 0.180 0.000
Footpath Silverglen Drive P7354 1.72510.49300 69,70 0.000 0.203 0.000
Sidewalks Mallard Road P7355 1.72510.49300 73 0.000 0.338 0.000
Sidewalks Nyathi P7356 1.72510.49300 19 0.000 0.169 0.000
Passage gx 10 P7357 1.72510.49300 79 0.000 0.102 0.000
Sidewalks Themba Thabethe P7358 1.72510.49300 80 0.000 0.225 0.000
Passage Mlonazane Drive P7359 1.72510.49300 82 0.000 0.225 0.000
Sidewalks Dayimane Road P7360 1.72510.49300 83 0.000 0.225 0.000
Sidewalks and Passages - Luganda P7361 1.72510.49300 13 0.000 0.450 0.000
Kwa Ximba Access Road P7018 1.72510.49300 1 0.153 0.000 0.000
Vukani Road Sidewalk P7019 1.72510.49300 2 0.153 0.000 0.000
Amatata Road Sidewalk P7020 1.72510.49300 3 0.153 0.000 0.000
O R Thambo, Riet Valley P7021 1.72510.49300 4 0.153 0.000 0.000
Georgedale Main Road, Sidewalk P7022 1.72510.49300 5 0.153 0.180 0.000
Sidewalks in Mpumalanga P7023 1.72510.49300 6 0.153 0.000 0.000
Ekawandeni Road Sidewalk P7024 1.72510.49300 7 0.153 0.000 0.000
Embo Access Road Sidewalk P7025 1.72510.49300 8 0.153 0.000 0.000
Molweni Access Road Sidewalk P7026 1.72510.49300 9 0.153 0.000 0.000
Shongweni Road Sidewalk P7027 1.72510.49300 7 0.153 0.000 0.000
Valley View Area Sidewalk P7028 1.72510.49300 91 0.153 0.000 0.000
Sidewalks P7029 1.72510.49300 27 0.113 0.000 0.000
Sidewalks P7030 1.72510.49300 56 0.180 0.000 0.000
Antelope Place (Crescent to Harbottle) P7038 1.72510.49300 25 0.068 0.000 0.000
Dore Street P7042 1.72510.49300 60 0.113 0.000 0.000
Todd Street P7044 1.72510.49300 58 0.090 0.000 0.000
Rajendra Street P7046 1.72510.49300 61 0.135 0.000 0.000
Amman Circle P7049 1.72510.49300 60 0.135 0.000 0.000
Mzwillili Road P7050 1.72510.49300 38 0.072 0.180 0.000
Sidewalks P7051 1.72510.49300 42 0.158 0.000 0.000
Pinecottage Place P7052 1.72510.49300 48 0.090 0.000 0.000
Tynecroft Circle P7053 1.72510.49300 49 0.135 0.000 0.000
Swallowhaven Road P7054 1.72510.49300 50 0.180 0.135 0.000
Autumnpark Avenue P7055 1.72510.49300 51 0.135 0.000 0.000
Crestbrook Avenue P6960 1.72510.49300 51 0.135 0.000 0.000
Creche Road 1 0.000 0.000 2.700
Imbozamo Link Road 2 0.000 0.000 2.700
New River School Road 3 0.000 0.000 3.600
Kwacele Road 4 0.000 0.000 3.600
Mbojane Road 5 0.000 0.000 3.600
Malangeni Access Road 6 0.000 0.000 3.600
Salem Access Road 7 0.000 0.000 3.600
Hlengwa Access Road 8 0.000 0.000 3.600
Ntanankulu Road 9 0.000 0.000 2.700
Noel Road 10 0.000 0.000 0.900
Dhalia Road 0.000 0.000 0.900
Ward 91 Access Road Upgrade 91 0.000 0.000 2.700
Various gravel roads in Inanda 55 0.000 0.000 1.800
Route 5.4, Ward 56 56 0.000 0.000 1.800
Unsurfaced to surfaced Roads - North Various 0.000 0.000 5.400
Upgrade of Biko Rd - Kwandangezi Township 12 0.000 0.000 0.360
Upgrade of Str 200010 & Str 200040 - Sithundu Hills 13 0.000 0.000 0.360
Upgrade of Syringa Place - Nagina Township 13 0.000 0.000 0.450
Upgrading gravel road - TRK 75176 - Dassenhoek 14 0.000 0.000 2.250
Sixth St, Thornwood, Ward 15 15 0.000 0.000 0.540
Upgrade of Makhunga Pl - St Wendolins Township 16 0.000 0.000 0.315
Upgrading of gravel road -TRK47057 - Demat 17 0.000 0.000 3.600
Upgrade-STR47823-Savannah Park 17 0.000 0.000 0.450
Upgrade of Dahlia Rd-Wye bank 19 0.000 0.000 3.150
Upgrade of Lentaka Pl - Kwadabeka Township 20 0.000 0.000 0.270
Phephile Walk- Kwadabeka 20 0.000 0.000 0.315
Road Access :Lots 244-247-Kwadabeka 92 0.000 0.000 0.540
Sunset Grove P6914 70 0.000 0.000 1.350
182

CAPITAL BUDGET BY CLUSTER 2013 - 2016
Description Project No. Vote No. Ward No. BUDGET 2013/14 BUDGET 2014/15 BUDGET 2015/16
Rm Rm Rm
Road Widening : Greenvale Avenue P6915 70 0.000 0.000 1.080
Herman Drive : Road Widening P6916 71 0.000 0.000 0.810
Road Widening : Road 742 P6917 72 0.000 0.000 1.440
Road 708 Widening P6918 73 0.000 0.000 0.990
Access way : J863/ 862 P6923 77 0.000 0.000 0.108
Access Road : J181-188 P6924 77 0.000 0.000 0.135
G1449 Access Way (Str 107286) P6929 79 0.000 0.000 0.270
Nongoloza Road P6930 80 0.000 0.000 1.350
Access Road : N1484 P6936 82 0.000 0.000 0.675
Nkosi Avenue P6935 82 0.000 0.000 0.675
Access Road : Ematshini P6940 83 0.000 0.000 0.900
P6944 84 0.000 0.000 0.810
Access Road : AA460 (Bhekuzulu Road) P6947 85 0.000 0.000 0.540
Access Road A665 from Wanda Cele Rd
to Sports Field 93 0.000 0.000 4.230
Shozi Road 96 0.000 0.000 4.680
Bhoqwana Road & Uzemu Rd - Magabheni 99 0.000 0.000 3.510
Sidewalks - North Various 0.000 0.000 5.400
Sidewalks - West Various 0.000 0.000 5.400
Lanes and Footpaths 13 0.000 0.000 0.360
Sidewalks : Young Rd - Pinetown 15 0.000 0.000 0.270
Lanes and Footpaths - Tshelimnyama 15 0.000 0.000 0.180
Sidewalks : Spencer Rd - Shallcross 17 0.000 0.000 0.180
Sidewalks 18 0.000 0.000 0.270
Sidewalks 21 0.000 0.000 0.180
Sidewalks 22 0.000 0.000 0.180
Sidewalks : Homestead Rd - Westville 24 0.000 0.000 0.180
Sidewalks: Jacaranda Crescent 90 0.000 0.000 0.630
Sidewalks: Mayville Terrace 97 0.000 0.000 0.315
Sidewalks: Krantzdraai Crescent 97 0.000 0.000 0.270
Sidewalks: Gracedale 97 0.000 0.000 0.135
Sidewalks: Eagle Road - Umkomaas 99 0.000 0.000 0.405
Sidewalks: Golden Poppy Crescent P6984 71 0.000 0.000 0.360
Sidewalks: Ras Dashan Street P6985 71 0.000 0.000 0.360
Sidewalks: Rose Heights Road P6990 73 0.000 0.000 0.135
Sidewalk : Woodcrest Avenue P6991 73 0.000 0.000 0.180
Passage : J874 / 852 P6992 77 0.000 0.000 0.135
Passage : J808 / 815 P6993 77 0.000 0.000 0.135
Passage : J854 / 855 P6994 77 0.000 0.000 0.090
Sidewalks: Ngwenya Road P6996 79 0.000 0.000 0.135
Sidewalk: Sibusiso Mdakane Road - School P6997 80 0.000 0.000 0.135
Sidewalks: Sukuma Rd P6998 83 0.000 0.000 0.135
Umlaas River GX 11 Ped Bridge P6156 79 0.000 0.000 9.000
Ped bridges 2015/16 Various 0.000 0.000 5.400
HOUSING - Project Appraisals & Subsidy Applications 0.050 0.050 0.050
HOUSING - Transit Camp Eradication 0.050 0.050 0.050
HOUSING - Infrastructure Handover - As Builts & Remedial Works 0.050 0.050 0.050
HOUSING - Densification Top - Ups 0.050 0.050 0.050
BASIC COMMUNITY SERVICES - Interim Services to Informal Settlements 0.050 0.050 0.050
INCUBATION FUND - Long Term Spatial Infrastructure Plan 0.050 0.050 0.050
INCUBATION FUND - Spatial Plan to Coordinate Infrastructure Budgeting & Spend 0.050 0.050 0.050
INCUBATION FUND - Detailed Planning of Interim Services Clusters 0.050 0.050 0.050
INCUBATION FUND - Land Searches Around Eleven Key Train Stations 0.050 0.050 0.050INCUBATION FUND - Feasibility Studies
on Intended Acquisitions of Land around
Eleven Key Stations 0.050 0.050 0.050
INCUBATION FUND - Land Searches in Key Investment Locations 0.050 0.050 0.050
INCUBATION FUND - Feasibility Studies
on Intended Acquisitions of Land Found
in Key Investment Locations 0.050 0.050 0.050
INCUBATION FUND - eThekwini Informal Enterprise and Micro - Enterprise Initiative 0.050 0.050 0.050
INCUBATION FUND - Industrial Land Research and Strategy Development 0.050 0.050 0.050
INCUBATION FUND - River Reserve Detereminations 0.050 0.050 0.050
INCUBATION FUND - Retrofitting Suburbia Welbedacht East - Social Survey 0.050 0.050 0.050
INCUBATION FUND - Retrofitting Suburbia Welbedacht East - Planning 0.050 0.050 0.050
INCUBATION FUND - South Public Transport Corridor Phase 1 0.050 0.050 0.050
INCUBATION FUND - Functional Area Plan for Duffs Road Station 0.050 0.050 0.050
INCUBATION FUND - Preparation of Social Projects 0.050 0.050 0.050
INCUBATION FUND - Upgrade eHSP 0.050 0.050 0.050
INCUBATION FUND - Social Sector Plan 0.050 0.050 0.050
INCUBATION FUND - Blocksum 0.050 0.050 0.050
183
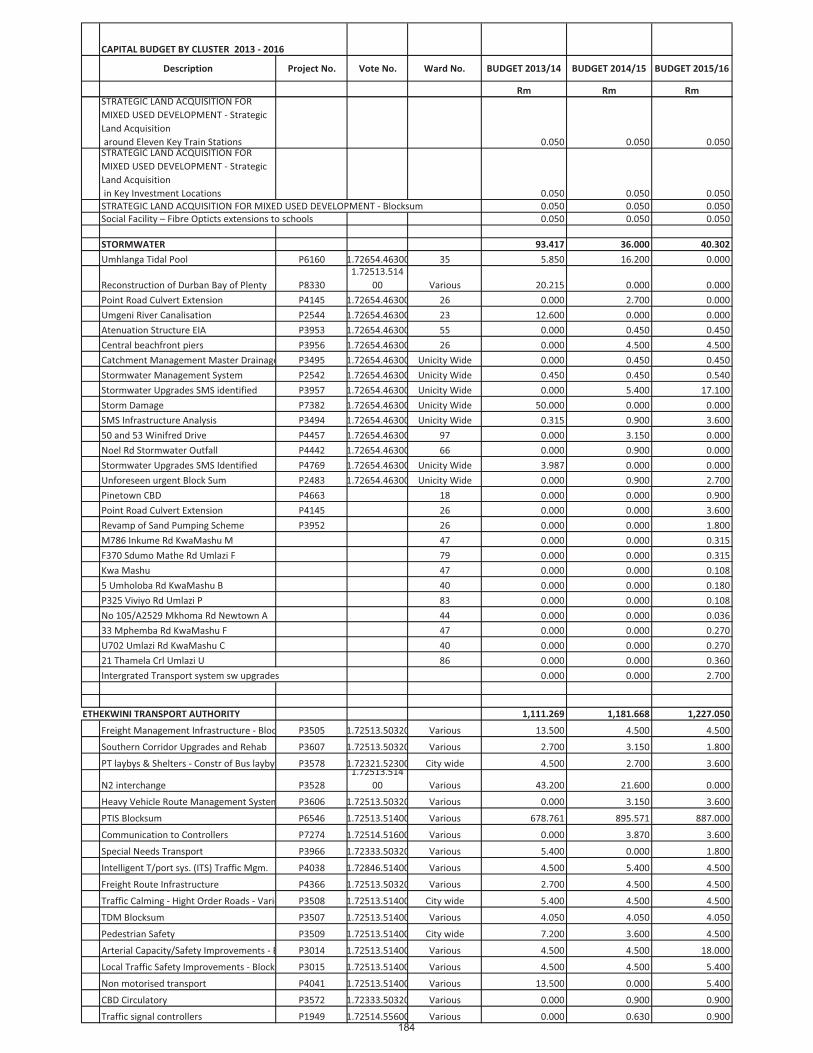
CAPITAL BUDGET BY CLUSTER 2013 - 2016
Description Project No. Vote No. Ward No. BUDGET 2013/14 BUDGET 2014/15 BUDGET 2015/16
Rm Rm RmSTRATEGIC LAND ACQUISITION FOR
MIXED USED DEVELOPMENT - Strategic
Land Acquisition
around Eleven Key Train Stations 0.050 0.050 0.050STRATEGIC LAND ACQUISITION FOR
MIXED USED DEVELOPMENT - Strategic
Land Acquisition
in Key Investment Locations 0.050 0.050 0.050
STRATEGIC LAND ACQUISITION FOR MIXED USED DEVELOPMENT - Blocksum 0.050 0.050 0.050
Social Facility – Fibre Opticts extensions to schools 0.050 0.050 0.050
STORMWATER 93.417 36.000 40.302
Umhlanga Tidal Pool P6160 1.72654.46300 35 5.850 16.200 0.000
Reconstruction of Durban Bay of Plenty P8330
1.72513.514
00 Various 20.215 0.000 0.000
Point Road Culvert Extension P4145 1.72654.46300 26 0.000 2.700 0.000
Umgeni River Canalisation P2544 1.72654.46300 23 12.600 0.000 0.000
Atenuation Structure EIA P3953 1.72654.46300 55 0.000 0.450 0.450
Central beachfront piers P3956 1.72654.46300 26 0.000 4.500 4.500
Catchment Management Master Drainage PlansP3495 1.72654.46300 Unicity Wide 0.000 0.450 0.450
Stormwater Management System P2542 1.72654.46300 Unicity Wide 0.450 0.450 0.540
Stormwater Upgrades SMS identified P3957 1.72654.46300 Unicity Wide 0.000 5.400 17.100
Storm Damage P7382 1.72654.46300 Unicity Wide 50.000 0.000 0.000
SMS Infrastructure Analysis P3494 1.72654.46300 Unicity Wide 0.315 0.900 3.600
50 and 53 Winifred Drive P4457 1.72654.46300 97 0.000 3.150 0.000
Noel Rd Stormwater Outfall P4442 1.72654.46300 66 0.000 0.900 0.000
Stormwater Upgrades SMS Identified P4769 1.72654.46300 Unicity Wide 3.987 0.000 0.000
Unforeseen urgent Block Sum P2483 1.72654.46300 Unicity Wide 0.000 0.900 2.700
Pinetown CBD P4663 18 0.000 0.000 0.900
Point Road Culvert Extension P4145 26 0.000 0.000 3.600
Revamp of Sand Pumping Scheme P3952 26 0.000 0.000 1.800
M786 Inkume Rd KwaMashu M 47 0.000 0.000 0.315
F370 Sdumo Mathe Rd Umlazi F 79 0.000 0.000 0.315H - Section No valid Road Name Npgwaja
Kwa Mashu 47 0.000 0.000 0.108
5 Umholoba Rd KwaMashu B 40 0.000 0.000 0.180
P325 Viviyo Rd Umlazi P 83 0.000 0.000 0.108
No 105/A2529 Mkhoma Rd Newtown A 44 0.000 0.000 0.036
33 Mphemba Rd KwaMashu F 47 0.000 0.000 0.270
U702 Umlazi Rd KwaMashu C 40 0.000 0.000 0.270
21 Thamela Crl Umlazi U 86 0.000 0.000 0.360
Intergrated Transport system sw upgrades 0.000 0.000 2.700
ETHEKWINI TRANSPORT AUTHORITY 1,111.269 1,181.668 1,227.050
Freight Management Infrastructure - BlocksumP3505 1.72513.50320 Various 13.500 4.500 4.500
Southern Corridor Upgrades and Rehab P3607 1.72513.50320 Various 2.700 3.150 1.800
PT laybys & Shelters - Constr of Bus laybys - CitywideP3578 1.72321.52300 City wide 4.500 2.700 3.600
N2 interchange P3528
1.72513.514
00 Various 43.200 21.600 0.000
Heavy Vehicle Route Management System P3606 1.72513.50320 Various 0.000 3.150 3.600
PTIS Blocksum P6546 1.72513.51400 Various 678.761 895.571 887.000
Communication to Controllers P7274 1.72514.51600 Various 0.000 3.870 3.600
Special Needs Transport P3966 1.72333.50320 Various 5.400 0.000 1.800
Intelligent T/port sys. (ITS) Traffic Mgm. P4038 1.72846.51400 Various 4.500 5.400 4.500
Freight Route Infrastructure P4366 1.72513.50320 Various 2.700 4.500 4.500
Traffic Calming - Hight Order Roads - Various P3508 1.72513.51400 City wide 5.400 4.500 4.500
TDM Blocksum P3507 1.72513.51400 Various 4.050 4.050 4.050
Pedestrian Safety P3509 1.72513.51400 City wide 7.200 3.600 4.500
Arterial Capacity/Safety Improvements - BlocksumP3014 1.72513.51400 Various 4.500 4.500 18.000
Local Traffic Safety Improvements - Blocksum P3015 1.72513.51400 Various 4.500 4.500 5.400
Non motorised transport P4041 1.72513.51400 Various 13.500 0.000 5.400
CBD Circulatory P3572 1.72333.50320 Various 0.000 0.900 0.900
Traffic signal controllers P1949 1.72514.55600 Various 0.000 0.630 0.900184

CAPITAL BUDGET BY CLUSTER 2013 - 2016
Description Project No. Vote No. Ward No. BUDGET 2013/14 BUDGET 2014/15 BUDGET 2015/16
Rm Rm Rm
Traffic Signals P3511 1.72514.51600 Various 3.600 0.000 9.000
Area Traffic Control P0825 1.72846.51400 Various 4.500 4.500 4.500
PT Ranks Holding areas P3967 1.72333.52300 Various 13.500 9.000 27.000
Bayhead - Edwin Swales Link P3529 1.72513.50320 Various 255.358 183.047 153.000
PT Fundamental Restructing (Existing) P3571 1.72333.50320 City wide 30.000 18.000 30.000
Bus Depot Upgrades Various 0.000 0.000 22.500
Kings Park Precinct P4352 1.72510.49400 27 9.900 0.000 4.500
M10 - Wakesleigh to Sarnia 65 0.000 0.000 9.000
M5 upgrade Various 0.000 0.000 4.500
Randles Road - RD Naidoo to Western Freeway 31 0.000 0.000 4.500
SOLID WASTE 82.800 85.635 90.773
Fleet - Solid Waste 66.74131.79700 Internal 43.200 37.800 53.100
Buffelsdraai Container Gantry & Hardstand Ext. AreaWBU12 WBU12.74188.88 59 13.500 0.000 0.000
Marianhill Cell Phase 3 WMA18 WMA18.74188.88 15 5.400 5.400 3.600
Lovu Landfill Cell phases and Infrastructure worksWLO03 WLO03.74188.88 98 0.000 9.000 14.850
Buffelsdraai - Cell Phase 2 WBU11 WBU11.74188.88 59 4.500 4.500 3.600
Landfill Gas to Electricity Project GCDM01 GCDM01.74188.8815,25,58 5.400 3.600 3.600
Buffelsdraai Gas to Electricity WGCDMB01 WGCDMB01.74188.8859 0.000 13.500 1.800
Kingsburgh Depot Refurb of Change rooms WKIN01 WKIN01.74188.88 97 0.450 0.000 0.000
Flower Road T/S Fence repair WAFL01 WAFL01.74188.88 32 0.180 0.000 0.000
Pipdale Female change rooms & roof repairs WAPI01 WAPI01.74188.88 34 0.900 0.000 0.000
Office Accommodation/New Germany WNGO01 WNGO01.74188.88 18 2.700 0.000 0.000
Isipingo Depot Change Rooms WAIS01 WAIS01.74188.88 97 2.700 2.700 0.000
Umkomaas Depot Change Rooms WUMK01 WUMK01.74188.88 99 1.170 1.800 0.000
Conversion - Bisassar offices WBI01 WBI01.74188.88 25 0.000 4.500 0.000
Plant & Equipment 66.73810.79252 Internal 2.700 2.835 3.150
Replacement of Compaction Units WAFL01 Internal 0.000 0.000 1.673
Western Landfill, Land purchase, Infrastructure & CellWSH01 7 0.000 0.000 5.400
SANITATION 770.400 700.750 677.400
Point Pump Station Upgrade Y6821 Y6821.74188.88 26 14.400 0.000 0.000
New Airport - Infrastructure Y6225 Y6225.74188.88 58 27.000 60.000 61.500
Emona Sunhills Outfalls Y6712 Y6712.74188.88 61 2.800 2.000 0.000
Redcliffe Outfalls Y6717 Y6717.74188.88 60 2.500 2.000 0.000
Belvedere Outfalls Y6714 Y6714.74188.88 61 3.000 0.000 0.000
Lindokuhle Outfalls Y6715 Y6715.74188.88 62 0.700 2.000 0.000
Victoria Embankment Trunk Sewer RehablitationY6461 Y6461.74188.88 28,32 0.000 0.000 0.000
Hammarsdale WTW Expansion Y6651 Y6651.74188.88 4 4.000 50.000 80.000
Wirtz/Dilkoosh Rds Area Sewer Reticulation Y6521 Y6521.74188.88 63 4.950 0.000 0.000
Amanzimtoti Old Main Rd Sewer Reticulation Y6111 Y6111.74188.88 93 1.350 0.000 0.000
Merrivale Rd Area Sewer Reticulation Y6520 Y6520.74188.88 18,24 4.950 0.000 0.000
Umkomaas/Widenham Sewer Reticulation Y6522 Y6522.74188.88 99 0.000 0.000 0.000
Maydon Rd P/S New Pumps Y6653 Y6653.74188.88 32 0.450 0.000 0.000
Landsdowne Rs P/S New Pumps Y6652 Y6652.74188.88 75 0.900 0.000 0.000
Canelands 3 Rising Main River Crossing RehabilitationY6524 Y6524.74188.88 60,61 8.000 2.000 0.000
Pump station and rising main to close Umkomaas WTWY6627 Y6627.74188.88 99 0.000 0.000 0.000
Kennedy Road Pump Station Y6291 Y6291.74188.88 25 0.450 0.900 0.900
Inanda Glebe Sewer Reticulation Y6459 Y6459.74188.88 44 0.900 1.800 0.000
Upgrade Hillcrest WTW Y6633 Y6633.74188.88 10 15.300 0.900 0.000
Water Reuse Y6630 Y6630.74188.88 Various 43.100 10.000 0.000
South Coast Road: Relocation of an Existing 600mm Diameter Steel Trunk SewerY7363 Y65530.74188.88 Ward 32 5.900 0.000 0.000
Upgrade Umbilo WTW Y6476 Y6476.74188.88 18 16.000 1.000 0.000
Umlaas Trunk Sewer Augmentation Y6460 Y6460.74188.88 84 0.000 0.000 0.000
Reservoir Hills Trunk Y5711 Y5711.74188.88 23 1.800 0.000 0.000
Westville Edgebaston Sewer Reticulation Y6473 Y6473.74188.88 18 2.700 0.000 0.000
Fynnlands Pump Station Y6458 Y6458.74188.88 66 0.900 0.000 0.000
Block Sum Pump Stations Y6238 Y6238.74188.88 Various 6.300 6.300 7.200
WTW Generators Y6639 Y6639.74188.88 Various 4.500 0.000 0.000
Expansion of Phoenix WTW Y6468 Y6468.74188.88 102 80.000 75.000 40.000
Block Sum Y6237 Y6237.74188.88 Various 8.100 8.100 9.000
Amanzimtoti River Trunk Sewer Y5602 Y5602.74188.88 67 3.000 68.500 40.000
Umkomaas SDP Wastewater Treatment Works Y6470 Y6470.74188.88 99 0.000 9.000 18.000
Block Sum WTW Y6239 Y6239.74188.88 Various 4.500 4.500 6.300
Pump Station Generators Y6640 Y6640.74188.88 Various 9.000 0.000 0.000
Ablution Blocks - In Situ Upgrade Y6525 Y6525.74188.88 Various 233.000 240.000 230.000185
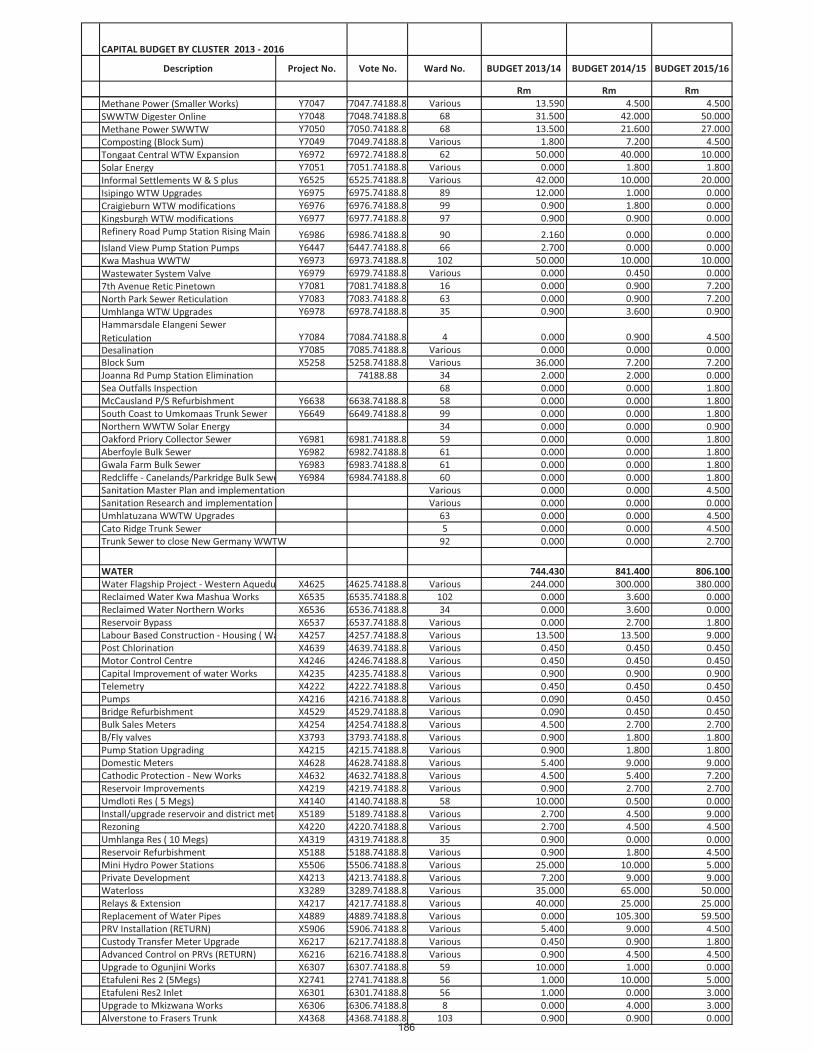
CAPITAL BUDGET BY CLUSTER 2013 - 2016
Description Project No. Vote No. Ward No. BUDGET 2013/14 BUDGET 2014/15 BUDGET 2015/16
Rm Rm Rm
Methane Power (Smaller Works) Y7047 Y7047.74188.88 Various 13.590 4.500 4.500
SWWTW Digester Online Y7048 Y7048.74188.88 68 31.500 42.000 50.000
Methane Power SWWTW Y7050 Y7050.74188.88 68 13.500 21.600 27.000
Composting (Block Sum) Y7049 Y7049.74188.88 Various 1.800 7.200 4.500
Tongaat Central WTW Expansion Y6972 Y6972.74188.88 62 50.000 40.000 10.000
Solar Energy Y7051 Y7051.74188.88 Various 0.000 1.800 1.800
Informal Settlements W & S plus Y6525 Y6525.74188.88 Various 42.000 10.000 20.000
Isipingo WTW Upgrades Y6975 Y6975.74188.88 89 12.000 1.000 0.000
Craigieburn WTW modifications Y6976 Y6976.74188.88 99 0.900 1.800 0.000
Kingsburgh WTW modifications Y6977 Y6977.74188.88 97 0.900 0.900 0.000
Refinery Road Pump Station Rising Main Y6986 Y6986.74188.88 90 2.160 0.000 0.000
Island View Pump Station Pumps Y6447 Y6447.74188.88 66 2.700 0.000 0.000
Kwa Mashua WWTW Y6973 Y6973.74188.88 102 50.000 10.000 10.000
Wastewater System Valve Y6979 Y6979.74188.88 Various 0.000 0.450 0.000
7th Avenue Retic Pinetown Y7081 Y7081.74188.88 16 0.000 0.900 7.200
North Park Sewer Reticulation Y7083 Y7083.74188.88 63 0.000 0.900 7.200
Umhlanga WTW Upgrades Y6978 Y6978.74188.88 35 0.900 3.600 0.900
Hammarsdale Elangeni Sewer
Reticulation Y7084 Y7084.74188.88 4 0.000 0.900 4.500
Desalination Y7085 Y7085.74188.88 Various 0.000 0.000 0.000
Block Sum X5258 X5258.74188.88 Various 36.000 7.200 7.200
Joanna Rd Pump Station Elimination 74188.88 34 2.000 2.000 0.000
Sea Outfalls Inspection 68 0.000 0.000 1.800
McCausland P/S Refurbishment Y6638 Y6638.74188.88 58 0.000 0.000 1.800
South Coast to Umkomaas Trunk Sewer Y6649 Y6649.74188.88 99 0.000 0.000 1.800
Northern WWTW Solar Energy 34 0.000 0.000 0.900
Oakford Priory Collector Sewer Y6981 Y6981.74188.88 59 0.000 0.000 1.800
Aberfoyle Bulk Sewer Y6982 Y6982.74188.88 61 0.000 0.000 1.800
Gwala Farm Bulk Sewer Y6983 Y6983.74188.88 61 0.000 0.000 1.800
Redcliffe - Canelands/Parkridge Bulk Sewer Y6984 Y6984.74188.88 60 0.000 0.000 1.800
Sanitation Master Plan and implementation Various 0.000 0.000 4.500
Sanitation Research and implementation Various 0.000 0.000 0.000
Umhlatuzana WWTW Upgrades 63 0.000 0.000 4.500
Cato Ridge Trunk Sewer 5 0.000 0.000 4.500
Trunk Sewer to close New Germany WWTW 92 0.000 0.000 2.700
WATER 744.430 841.400 806.100
Water Flagship Project - Western Aqueduct X4625 X4625.74188.88 Various 244.000 300.000 380.000
Reclaimed Water Kwa Mashua Works X6535 X6535.74188.88 102 0.000 3.600 0.000
Reclaimed Water Northern Works X6536 X6536.74188.88 34 0.000 3.600 0.000
Reservoir Bypass X6537 X6537.74188.88 Various 0.000 2.700 1.800
Labour Based Construction - Housing ( Water) X4257 X4257.74188.88 Various 13.500 13.500 9.000
Post Chlorination X4639 X4639.74188.88 Various 0.450 0.450 0.450
Motor Control Centre X4246 X4246.74188.88 Various 0.450 0.450 0.450
Capital Improvement of water Works X4235 X4235.74188.88 Various 0.900 0.900 0.900
Telemetry X4222 X4222.74188.88 Various 0.450 0.450 0.450
Pumps X4216 X4216.74188.88 Various 0.090 0.450 0.450
Bridge Refurbishment X4529 X4529.74188.88 Various 0.090 0.450 0.450
Bulk Sales Meters X4254 X4254.74188.88 Various 4.500 2.700 2.700
B/Fly valves X3793 X3793.74188.88 Various 0.900 1.800 1.800
Pump Station Upgrading X4215 X4215.74188.88 Various 0.900 1.800 1.800
Domestic Meters X4628 X4628.74188.88 Various 5.400 9.000 9.000
Cathodic Protection - New Works X4632 X4632.74188.88 Various 4.500 5.400 7.200
Reservoir Improvements X4219 X4219.74188.88 Various 0.900 2.700 2.700
Umdloti Res ( 5 Megs) X4140 X4140.74188.88 58 10.000 0.500 0.000
Install/upgrade reservoir and district meters X5189 X5189.74188.88 Various 2.700 4.500 9.000
Rezoning X4220 X4220.74188.88 Various 2.700 4.500 4.500
Umhlanga Res ( 10 Megs) X4319 X4319.74188.88 35 0.900 0.000 0.000
Reservoir Refurbishment X5188 X5188.74188.88 Various 0.900 1.800 4.500
Mini Hydro Power Stations X5506 X5506.74188.88 Various 25.000 10.000 5.000
Private Development X4213 X4213.74188.88 Various 7.200 9.000 9.000
Waterloss X3289 X3289.74188.88 Various 35.000 65.000 50.000
Relays & Extension X4217 X4217.74188.88 Various 40.000 25.000 25.000
Replacement of Water Pipes X4889 X4889.74188.88 Various 0.000 105.300 59.500
PRV Installation (RETURN) X5906 X5906.74188.88 Various 5.400 9.000 4.500
Custody Transfer Meter Upgrade X6217 X6217.74188.88 Various 0.450 0.900 1.800
Advanced Control on PRVs (RETURN) X6216 X6216.74188.88 Various 0.900 4.500 4.500
Upgrade to Ogunjini Works X6307 X6307.74188.88 59 10.000 1.000 0.000
Etafuleni Res 2 (5Megs) X2741 X2741.74188.88 56 1.000 10.000 5.000
Etafuleni Res2 Inlet X6301 X6301.74188.88 56 1.000 0.000 3.000
Upgrade to Mkizwana Works X6306 X6306.74188.88 8 0.000 4.000 3.000
Alverstone to Frasers Trunk X4368 X4368.74188.88 103 0.900 0.900 0.000186

CAPITAL BUDGET BY CLUSTER 2013 - 2016
Description Project No. Vote No. Ward No. BUDGET 2013/14 BUDGET 2014/15 BUDGET 2015/16
Rm Rm Rm
Trenance Park Res X5044 X5044.74188.88 Various 6.000 0.000 0.000
Congo Res Inlet X2324 X2324.74188.88 56 0.000 0.000 0.000
Clifton pipline and pump station X6137 X6137.74188.88 7 0.000 0.000 0.000
Magabheni Res X4877 X4877.74188.88 99 6.000 0.500 0.000
Almond Rd Res Inlet X5158 X5158.74188.88 97 0.000 0.000 0.000
Zwelibomvu Res X6309 X6309.74188.88 7 8.000 0.000 0.000
Solor Power at Pump Stations X6305 X6305.74188.88 Various 1.000 2.000 2.000
Flow Limiter Upgrades RETURN) X6302 X6302.74188.88 Various 9.000 31.500 24.300
Route Markers X6304 X6304.74188.88 Various 2.700 0.900 0.900
Craigieburn Res X6300 X6300.74188.88 99 0.500 0.000 0.000
Adams Res X6299 X6299.74188.88 67 0.500 0.000 0.000
Folweni 1 Res (6 Meg) X5334 X5334.74188.88 96 5.000 3.000 0.000
Folweni 2 Res (6 Meg) X5335 X5335.74188.88 95 5.000 3.000 0.000
M1B Res (3 Meg) X6303 X6303.74188.88 15 5.400 0.000 0.000
Emoyeni Res (30 Meg) X5254 X5254.74188.88 8 1.000 10.000 0.000
Unicity Water Dispensers installation (Blocksum)X4247 X4247.74188.88 Various 0.450 0.450 0.450
Borehole Improvements X3218 X3218.74188.88 Various 0.900 0.000 0.000
Hammersdale H/L ET X5185 X5185.74188.88 4 0.900 0.000 0.000
Frasers Reservoir X2263 X2263.74188.88 62 0.000 2.000 5.000
Clansthal Res X4876 X4876.74188.88 99 0.900 2.000 5.000
Burbreeze Res X4969 X4969.74188.88 62 9.000 1.000 0.000
Blackburn Res (15 Megs) X2679 X2679.74188.88 102 1.800 13.500 0.000
Northern Aquaduct X4764 X4764.74188.88 Various 190.000 100.000 90.000
Blocksum X5259 X5259.74188.88 Various 18.000 13.500 13.500
Offtakes S C A X4527 X4527.74188.88 Various 1.800 0.000 0.000
Trunkmain Upgrade X6533 X6533.74188.88 Various 4.500 4.500 4.500
Fleet - Water 64.74131.60610 Internal 17.100 18.000 18.000
Water - Plant and Equipment 64.73810.60110 Internal 27.900 22.500 27.000
La Mercy Airport Reservoir (SM) 74188.88 58 0.000 7.200 8.000
ELECTRICTY 568.798 642.352 653.774
Prepayment Connection Costs -All Areas EFA001 80091 Various 40.000 40.000 45.000
Informal Settlements - Central Region EFA002 81049 Various 3.000 4.000 5.000
Informal Settlements - Northern Region 81012 Various 3.000 4.000 5.000
Informal Settlements - Southern Region 81042 27 3.000 4.000 5.000
MV/LV -EFA New Reticulation Central RegionNER00002 81052 64 5.000 6.000 7.000
MV/LV -EFA New Reticulation Northern RegionNER00007 81039 53,56,57,59 3.000 4.000 5.000
MV/LV -EFA New Reticulation Southern RegionNER00013 81038 18 3.000 4.000 5.000
MV/LV -EFA Reticulation Reinforcement SD000403 81036 32,33 2.800 3.000 3.000
MV/LV Service Connections-Conventional CA0001 80051 95 15.000 16.000 17.000
MV/LV Service Connections-Dispenser Cost CA0002 80056 100 0.900 0.900 0.450
MV/LV Reinforcement-New Substations DISTSS01 81011 56 0.900 0.900 0.900
MV/LV New Supply-Central Region SD000025 81009 44 30.000 35.000 40.000
MV/LV New Supply-Northern Region 81025 36 20.000 25.000 25.000
MV/LV New Supply-Southern Region 81026 75 20.000 25.000 25.000
MV/LV Reinforcement-Central Region SD000023 81007 32 5.000 5.000 10.000
MV/LV Reinforcement-Northern Region 81002 18 5.000 5.000 8.000
MV/LV Reinforcement-Southern Region 81008 60 5.000 5.000 8.000
MV/LV Capital Replacement Central Region SD000204 81028 28 15.000 16.000 17.000
MV/LV Capital Replacement Nothern Region 81023 24 10.000 11.000 12.000
MV/LV Capital Replacement Southern Region 81022 Various 10.000 11.000 12.000
MV/LV Maintenance Replacement ReticulationSD000207 81037 Various 4.500 4.500 4.500
MV/LV Distribution Automation Project 80136 Various 13.500 13.500 15.000
Lighting -Major Route Improvements PL0001MR 80405 Various 2.700 2.700 2.700
Lighting -New Major Routes PL0001NR 80406 Various 0.900 0.900 1.000
Lighting- Parks PL0001PL 80407 Various 0.045 0.045 0.090
Lighting- Sundry SD0011SS 80412 Various 1.800 1.800 1.800
Southern Depot Buildings 80303 Various 0.090 0.090 0.090
North Western Depot Buildings 80311 Various 0.090 0.090 0.090
South Western Depot Buildings 80319 Various 0.090 0.090 0.090
Plant & Equipment- Faults 80243 Various 0.100 0.100 0.100
Plant & Equipment- Western Depot 80242 Various 0.200 0.200 0.200
Plant & Equipment-Northern depot 80247 Various 0.200 0.200 0.200
Plant & Equipment-North Western depot 80248 26,28 0.200 0.200 0.200
Plant & Equipment-Central Depot 80249 96 0.200 0.200 0.200
Plant & Equipment-Southern Depot 80250 90 0.200 0.200 0.200
Plant & Equipment-South western Depot 80260 26,28 0.200 0.200 0.200
Plant & Equipment- Lighting Division 80284 27 0.009 0.009 0.027
Office Furniture & Equip.-Northern Depot 80351 Various 0.050 0.050 0.050
Office Furniture & Equip.-Central Depot 80352 Various 0.050 0.050 0.050
Office Furniture & Equip.-Southern Depot 80353 Various 0.050 0.050 0.050
187

CAPITAL BUDGET BY CLUSTER 2013 - 2016
Description Project No. Vote No. Ward No. BUDGET 2013/14 BUDGET 2014/15 BUDGET 2015/16
Rm Rm Rm
Office Furniture & Equip.-Faults Division 80358 Various 0.050 0.050 0.050
Office Furniture & Equip.-Lighting 80365 Various 0.009 0.009 0.009
Office Furniture & Equip.-North Western Depot 80366 Various 0.050 0.050 0.050
Office Furniture & Equip.-Western Depot 80367 Various 0.050 0.050 0.050
Office Furniture & Equip.-South Western Depot 80370 Various 0.050 0.050 0.050
Airconditioning-Depot Buildings 80254 Various 0.090 0.090 0.130
PDA Mobile Device project 80283 Various 1.800 1.350 0.000
Land Acquisitions 80001 Various 0.500 0.500 0.500
Servitudes-Intangible 80002 Various 4.000 4.000 4.000
Umbogintwini Upgrade TM0006 80604 93 0.180 0.000 0.000
Pineside S/Stn TM0027 80625 Various 0.000 0.000 4.500
Klaarwater-substation transformers TM0024 80622 Various 42.000 22.000 0.000
La Mercy 132/11kv s/stn Transformers TM0049 80647 27 0.000 0.200 10.000
Springfield 33kv Board TM0026 80648 Various 3.600 0.000 0.000
Umgeni /Klaarwater OHTL TM0116 80850 Various 32.000 7.000 0.000
Fibre Optic Links TM0030 80628 Various 3.330 4.050 1.800
Lotus Park 275/132 Kv Stn TM0035 80634 Various 0.000 0.000 2.000
Bellair 275/132kv S/Stn TM0104 80636 Various 0.200 3.000 8.300
Kloof 132/11kv S/Stn TM0043 80843 26,27 0.491 1.000 18.620
Verulam 132/11KV S/Stn TM0047 80654 28 0.000 0.000 1.050
Himalayas/Austerville Link TM0059 80666 48 0.000 0.000 2.000
Transnet 132/11kv S/Stn (Harbour ) TM0052 80651 Various 0.180 22.500 14.760
K E Masinga S/Stn (Ordnance Rd ) TM0053 80652 Various 5.000 15.000 20.000
NCP Springpark S/Stn TM0094 80827 Various 0.000 2.000 12.000
Bridge City 132/11kv Substation TM0096 80661 Various 0.000 0.000 2.700
Durban South S/Stn (Transformers) TM0058 80793 70 25.000 0.000 0.000
Reunion Substation TM0061 80669 Various 0.000 2.500 22.500
Ottawa 275/132 S/Stn (Transformers) TM0105 80612 Various 0.000 0.500 27.000
Austerville 132/11kv Stn TM0068 80676 Various 0.000 3.270 25.070
Mahogany Ridge S/Stn TM0072 80680 Various 0.000 15.000 7.194
Underwood 132/11kv Stn TM0121 80681 Various 0.000 17.825 20.433
Jameson Park 132/11Kv Stn TM0075 80683 Various 20.000 37.000 0.000
Stockville 132Kv Switching Stn TM0077 80685 Various 0.000 0.000 11.070
Bulwer 132/11kv s/stn TM0078 80686 Various 0.000 0.200 2.180
Daly Road 132/11kv S/Stn TM0079 80687 27 0.000 0.000 3.600
Umlazi 132/11kv S/stn TM0087 80694 27 4.770 0.000 0.000
Sapref 132/33Kv S/Stn TM0089 80696 Various 33.800 11.000 0.000
Congella S/Stn(33 kv board/Bus Section) TM0130 80791 Various 5.004 1.284 0.000
Verulam 132kv switching station TM0047 80645 Various 0.000 1.050 10.000
Alice Street transformers & 11KV BOARD 80753 Various 9.000 0.000 0.000
HV Substation Walls & Security SD0010SW 80145 Various 4.500 4.500 0.900
HV Substation Construction SD0010SC 80168 26 5.000 5.000 4.000
Westville Control buildings 80323 18,24 10.000 1.000 1.000
Network Management System 80212 Various 3.600 1.800 0.900
HV Office Furniture & Equipment 80244 Various 0.027 0.027 0.036
HV Sundry Plant & Equipment 80251 Various 0.090 0.090 0.207
HV Alarms & Security Systems 80256 Various 1.800 1.800 0.900
Office furniture & equip -Westville Control 80359 Various 0.500 0.100 0.050
HV Test & Instrumentation 80701 Various 0.450 0.450 1.260
Springfield Complex 80305 Various 2.700 2.700 2.700
Control Centre Buildings 80310 Various 40.000 62.400 20.000
Headquarters Buildings/ Rotunda 80317 6,91 0.900 0.900 0.537
Mobile Plant 80201 Various 2.700 2.700 0.450
Vehicle Tracking System 80203 24,29,30 0.090 0.090 0.180
Cars & Vans 80205 Various 0.900 0.900 2.700
Trucks & Specialised Vehicles 80206 15 4.500 4.500 13.500
Fuel Management System 80209 26 0.090 0.090 0.090
Stores Sundry Equipment 80265 25,27 0.027 0.027 0.045
Airconditioning Equipment 80255 16,18 0.225 0.225 0.225
Plant & Equipment -Finance 80283 Various 0.045 0.045 0.090
Furniture & Equipment 80357 Various 0.540 0.540 0.500
Risk Management Plant & Equipment 80253 75 0.090 0.090 0.050
Mims-Ellipse Software 80211 Various 2.250 0.900 0.450
Computer Aided Design Software 80213 Various 0.045 0.045 0.045
Prepayment System 80217 Various 0.720 0.225 0.090
Outage Management System 80218 60 4.500 4.500 4.500
Lan Infrastructure 80219 11,37 1.800 1.800 0.450
Desktop Hardware 80220 61,62 1.000 1.800 0.900
Server Hardware 80221 Various 4.500 4.050 0.450
Computer Printers 80222 25 0.045 0.045 0.090
Software Systems Development 80223 Various 0.630 0.630 0.090
Computer Aided Design Hardware 80224 32 0.045 0.045 0.090
188

CAPITAL BUDGET BY CLUSTER 2013 - 2016
Description Project No. Vote No. Ward No. BUDGET 2013/14 BUDGET 2014/15 BUDGET 2015/16
Rm Rm Rm
IT-BPM Project 80348 Various 4.500 0.630 0.450
Technical Equipment- Call Centre 80228 Various 0.045 0.045 0.090
Plant & Equipment Revenue Control 80229 Various 0.100 0.100 0.100
Marketing Equipment -Commercial Eng 80257 Various 0.009 0.009 0.027
Workshop Equipment-Customer Services 80288 26,28 0.090 0.090 0.180
Revenue Protection Enhancement Project RP0001 80135 90 1.800 1.800 1.000
Plant & equipment-metering section 80246 Various 0.180 0.180 0.180
Bulk Metering Project 80132 35 1.800 1.000 0.500
Smart Metering-Demand Management 80133 54 28.000 84.000 50.000
Meter Test Benches 80131 65 0.900 0.900 0.900
Energy Control Building-Kings Road 80322 90 5.000 1.000 0.500
Office Furniture & equip-Kings Rd 80360 15 0.500 0.100 0.050
Communication Networks CN0001 80190 Various 10.800 18.000 20.000
Communication Network Links TSCN0002. 80191 Various 1.940 5.000 5.000
Substation Plant - Protection & Test 80176 27 0.900 0.900 0.900
GIS System- Drawing Office 80214 34 0.090 0.090 0.135
Office Furniture & Equipment-Tech Se 80245 27 0.090 0.090 0.135
Plant & Equipment-Tech Services 80252 47 0.045 0.045 0.045
Survey Equipment -Drawing Office 80258 16 0.180 0.180 0.315
Test & Instrumentation-Protect & Test 80259 32 0.450 0.450 0.450
Safety Training Equipment-Safety Division 80263 93 0.063 0.045 0.045
First Aid Equipment-Safety Division 80262 Various 0.018 0.018 0.054
Safety Equipment-Safety Division 80261 Various 0.090 0.090 0.090
Plant & Equipment- Mech Division 80281 68 0.135 0.237 0.135
Plant & Equipment- Protect&Test Division 80285 89 0.045 0.045 0.045
Plant & Equipment-Elect W/Shop 80286 All 0.090 0.090 0.090
Test & Instrumentation-Mech W/Shop 80290 33 0.027 0.027 0.045
Test & Instrumentation-Safety Division 80291 Various 0.090 0.090 0.180
Test & Instrumentation-Elect W/Shop 80292 Various 0.045 0.045 0.180
Test & Instrumentation-Comm. Network 80296 Various 0.450 0.450 0.450
Office Furniture & Equip-Mech W/Shop 80293 90 0.045 0.045 0.180
Office Furniture & Equip-Elect W/Shop 80294 63 0.045 0.045 0.045
HEALTH AND SOCIAL SERVICES 135.410 273.189 270.900
Development of an Integrated Social
Facilities Provision Plan and Packing of
Approved Projects (PRC) N1710 1.70252.18001 0.450 0.000 0.000
CEMETERIES 0.450 3.457 3.630
Lovu B N1459 1.70252.17566 98 0.000 0.532 0.000
Investigation - Purchase of land
(Regional Cemetery North) N1460 1.70600.17501 Various 0.000 0.900 0.900Investigation - Purchase of land
(Regional Cemetery South) N1460 1.70600.17501 Various 0.000 0.450 0.480
Umlazi and Kwa Mashua Crematoria N1698 1.70252.17501 84,41 0.000 0.450 0.450
Mobeni Heights N1011 1.70409.17701 69 0.000 0.225 0.000
Tongaat Crematorium N1254 1.70409.17917 61 0.000 0.000 0.000
New Cemetery - Hammarsdale N1097 1.70600.17552 4 0.000 0.900 0.000
Umkomaas Drift N1533 1.70357.17874 99 0.000 0.000 0.450
Cornubia Cemetery Development - InvestigationN1626 1.70252.17501 102 0.000 0.000 0.450
Worst Condition Assets (CDI 0-40%) Condition IndexN1627 1.70252.17501 Various 0.450 0.000 0.900
COMMUNITY HALLS 2.163 2.332 2.471
Amanzimtoti Hall N1351 1.71006.17049 97 1.350 1.350 0.000
Umlazi Halls (G & H) Stage Provision N1628 1.70252.17022 79 0.180 0.000 0.000
Umlazi D Upgrade multi use N1629 1.70252.17021 87 0.093 0.000 1.350Investigation - D & E Halls viability in
terms of change of usage and / or
upgrade to ABC grade Halls N1630 1.70252.17002 Various 0.180 0.000 0.000Education of backlogs (8 halls, grade A B
or C) Investigatoon and packaging of
projects N1631 1.70252.17002 Various 0.000 0.540 0.000
Provision of Halls x 8 (2 per annum @R6m) N1632 1.70252.17002 Various 0.000 0.000 0.000
Worst Condition Assets (CDI 0-40%) Condition IndexN1633 1.70252.17002 Various 0.360 0.442 0.000
189

CAPITAL BUDGET BY CLUSTER 2013 - 2016
Description Project No. Vote No. Ward No. BUDGET 2013/14 BUDGET 2014/15 BUDGET 2015/16
Rm Rm Rm
Worst Condition Assets (CDI 40%-60%) Condition IndexN1634 1.70252.17002 Various 0.000 0.000 1.121
LIBRARIES 59.589 179.640 185.900
Purchase of Library Books 1.73082.15033 Various 10.009 13.770 14.400
Purchase of Library Books (Carnegie) 1.73085.15035 Various 3.600 3.600 0.000
Computer Network (ICT) 1.73550.15035 Various 0.000 0.000 0.000
New Central Library (Library subsidy ringfenced)N1225 1.99990 26 34.000 112.200 122.000
New Central Library (Province Grant) N1225 1.70252.15050 26 10.000 7.500 0.000
New Central Library (Council Funded)) N1225 1.70252.15050 26 0.000 6.570 22.500
Whetstone Library N1225 1.70252.15050 26 1.530 0.000 0.000
KwaNdengezi Regional Library N1218 1.71241.15427 12 0.000 3.780 13.500
Ntshonweni Community Library N1577 1.70252.15468 7 0.000 0.450 0.000
E M L Infrastructure Upgrade N1578 1.70830.15055 32 0.450 13.320 0.000
Tshelimnyama Community Library N1352 1.72095.15429 15 0.000 13.500 0.000
Libraries - Block Sum N1578 1.70252.15032 32 0.000 0.000 0.000
Umlazi Library N1635 1.70252.15069 82 0.000 0.900 3.600
Fencing : Libraries N1636 1.71148.15032 Various 0.000 2.700 0.900
Kwa Ximba Library N1637 1.70252.15473 1 0.000 0.450 0.900
Umbumbulu Library N1638 1.70252.15468 100 0.000 0.450 0.900
Umzinyathi Library N1639 1.70252.15471 45 0.000 0.450 0.900
Air Conditioning: Libraries 0.000 0.000 6.300
MUSEUMS 13.650 3.497 6.300
Museums - Block Sum N1563 1.70252.15501 Various 0.000 0.000 0.000
Heritage Mapping N1609 1.70252.15501 Various 0.000 0.000 0.000
Collections Storage Facility N1610 1.70252.15501 Various 0.450 0.000 4.118
KwaMuhle Museum N1355 1.70880.15560 28 0.000 0.000 0.000
Umlazi Community Art Centre N1699 1.70252.15501 76 0.000 0.797 2.182
Liberation Route Nodes N1640 1.70252.15501 Various 0.000 0.900 0.000
Port Natal Maritime Museum staff & visitors facilitiesN1253 1.70252.15540 28 0.000 0.900 0.000
Cato Manor Museum (Lotto) N1341 1.71935.15580 29 13.200 0.900 0.000
Cato Manor Museum (Council) N1340 1.71935.15580 29 0.000 0.000 0.000
Natural Science Museum : Development N1354 1.70252.15521 28 0.000 0.000 0.000
Conversion of Umlazi D Hall to Art Centre N1641 1.70252.15501 87 0.000 0.000 0.000
PARKS 4.235 13.437 9.900
How Long Park N1573 1.70252.18152 86 0.450 0.720 0.000
Japanese Gardens (Durban North) N1480 1.70020.18101 36 0.000 0.720 0.000
Bulwer Park N1581 1.70020.18101 33 0.725 0.720 0.000
Replacement of fences Natural Resources N1485 1.71148.18101 Various 0.180 0.000 0.000Randles Nursery (Upgrade Infrastructure
and Centralisation of Nurseries) N1557 1.70252.18010 25 0.000 0.450 0.000
Japanese Gardens (PTN) N1480 1.70020.18101 16 0.180 0.450 0.000
Umgeni River Bird Park N1240 1.70020.18301 36 0.270 0.432 0.000
Park Fences N1243 1.72182.16171 27 0.000 0.450 0.000
Mitchell Park Zoo N1155 1.70095.18101 27 0.270 0.720 0.000
Upgrade Local Parks - Wards 48-59 N1236 1.70020.18351 Various 0.000 2.700 0.000
Natural Resources blocksum (include Silverglen)N1558 1.72052.18080 Various 0.000 0.720 0.900Upgrade of Staff Facilities (investigate,
package and provide) N1642 1.70252.18001 Various 0.000 0.000 6.300
Upgrade of existing parks N1243 1.70252.18001 Various 1.800 0.450 2.700
Worst condition assets (CDI 0-40%) Condition IndexN1643 1.70252.18001 Various 0.360 0.405 0.000
Worst condition assets (CDI 40%-60%) Condition IndexN1644 1.70252.18001 Various 0.000 0.000 0.000
Specialised Parks Equipment 1.73711.18001 Various 0.000 4.500 0.000
POOLS AND BEACHES 14.592 33.832 35.861
RF Pool 0.000 0.000 1.350
Buffesdale Pool 0.000 0.000 2.700
Nagina Pool 0.000 0.000 1.350
Chesterville Pool 0.000 0.000 1.350190
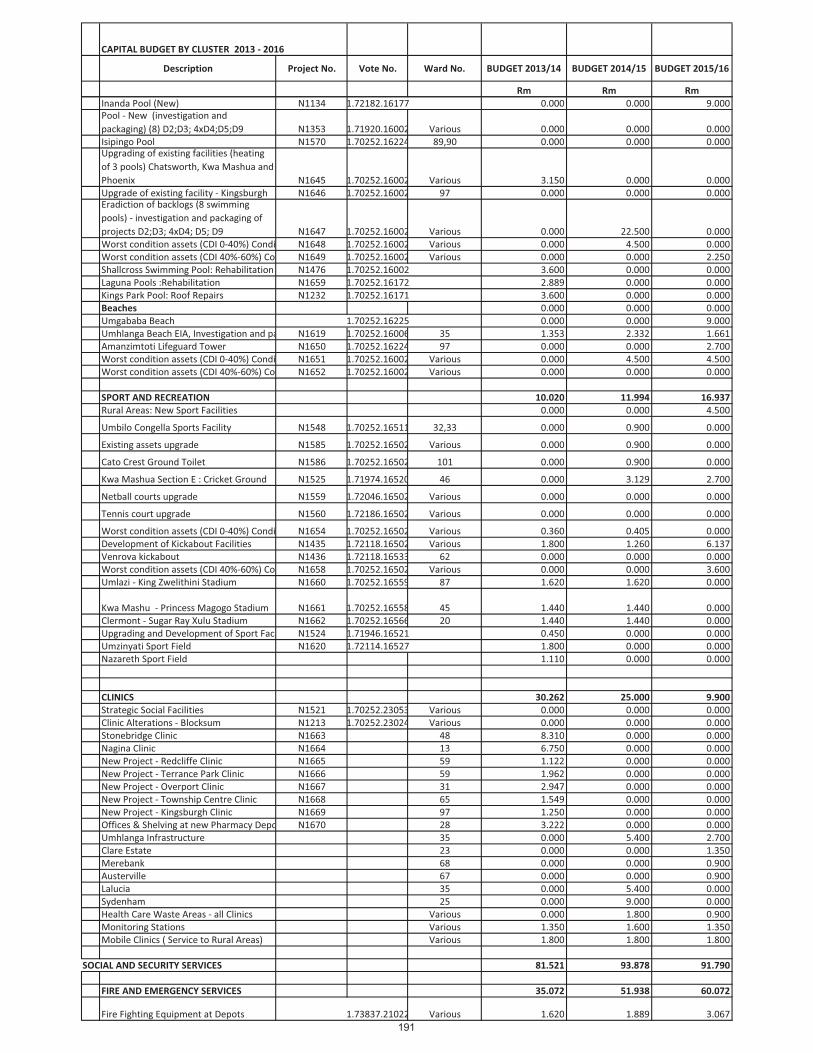
CAPITAL BUDGET BY CLUSTER 2013 - 2016
Description Project No. Vote No. Ward No. BUDGET 2013/14 BUDGET 2014/15 BUDGET 2015/16
Rm Rm Rm
Inanda Pool (New) N1134 1.72182.16177 0.000 0.000 9.000
Pool - New (investigation and
packaging) (8) D2;D3; 4xD4;D5;D9 N1353 1.71920.16002 Various 0.000 0.000 0.000
Isipingo Pool N1570 1.70252.16224 89,90 0.000 0.000 0.000Upgrading of existing facilities (heating
of 3 pools) Chatsworth, Kwa Mashua and
Phoenix N1645 1.70252.16002 Various 3.150 0.000 0.000
Upgrade of existing facility - Kingsburgh N1646 1.70252.16002 97 0.000 0.000 0.000Eradiction of backlogs (8 swimming
pools) - investigation and packaging of
projects D2;D3; 4xD4; D5; D9 N1647 1.70252.16002 Various 0.000 22.500 0.000
Worst condition assets (CDI 0-40%) Condition IndexN1648 1.70252.16002 Various 0.000 4.500 0.000
Worst condition assets (CDI 40%-60%) Condition IndexN1649 1.70252.16002 Various 0.000 0.000 2.250
Shallcross Swimming Pool: Rehabilitation N1476 1.70252.16002 3.600 0.000 0.000
Laguna Pools :Rehabilitation N1659 1.70252.16172 2.889 0.000 0.000
Kings Park Pool: Roof Repairs N1232 1.70252.16171 3.600 0.000 0.000
Beaches 0.000 0.000 0.000
Umgababa Beach 1.70252.16225 0.000 0.000 9.000
Umhlanga Beach EIA, Investigation and packagingN1619 1.70252.16006 35 1.353 2.332 1.661
Amanzimtoti Lifeguard Tower N1650 1.70252.16224 97 0.000 0.000 2.700
Worst condition assets (CDI 0-40%) Condition IndexN1651 1.70252.16002 Various 0.000 4.500 4.500
Worst condition assets (CDI 40%-60%) Condition IndexN1652 1.70252.16002 Various 0.000 0.000 0.000
SPORT AND RECREATION 10.020 11.994 16.937
Rural Areas: New Sport Facilities 0.000 0.000 4.500
Umbilo Congella Sports Facility N1548 1.70252.16511 32,33 0.000 0.900 0.000
Existing assets upgrade N1585 1.70252.16502 Various 0.000 0.900 0.000
Cato Crest Ground Toilet N1586 1.70252.16502 101 0.000 0.900 0.000
Kwa Mashua Section E : Cricket Ground N1525 1.71974.16520 46 0.000 3.129 2.700
Netball courts upgrade N1559 1.72046.16502 Various 0.000 0.000 0.000
Tennis court upgrade N1560 1.72186.16502 Various 0.000 0.000 0.000
Worst condition assets (CDI 0-40%) Condition IndexN1654 1.70252.16502 Various 0.360 0.405 0.000
Development of Kickabout Facilities N1435 1.72118.16502 Various 1.800 1.260 6.137
Venrova kickabout N1436 1.72118.16533 62 0.000 0.000 0.000
Worst condition assets (CDI 40%-60%) Condition IndexN1658 1.70252.16502 Various 0.000 0.000 3.600
Umlazi - King Zwelithini Stadium N1660 1.70252.16559 87 1.620 1.620 0.000
Kwa Mashu - Princess Magogo Stadium N1661 1.70252.16558 45 1.440 1.440 0.000
Clermont - Sugar Ray Xulu Stadium N1662 1.70252.16566 20 1.440 1.440 0.000
Upgrading and Development of Sport Facilities N1524 1.71946.16521 0.450 0.000 0.000
Umzinyati Sport Field N1620 1.72114.16527 1.800 0.000 0.000
Nazareth Sport Field 1.110 0.000 0.000
CLINICS 30.262 25.000 9.900
Strategic Social Facilities N1521 1.70252.23053 Various 0.000 0.000 0.000
Clinic Alterations - Blocksum N1213 1.70252.23024 Various 0.000 0.000 0.000
Stonebridge Clinic N1663 48 8.310 0.000 0.000
Nagina Clinic N1664 13 6.750 0.000 0.000
New Project - Redcliffe Clinic N1665 59 1.122 0.000 0.000
New Project - Terrance Park Clinic N1666 59 1.962 0.000 0.000
New Project - Overport Clinic N1667 31 2.947 0.000 0.000
New Project - Township Centre Clinic N1668 65 1.549 0.000 0.000
New Project - Kingsburgh Clinic N1669 97 1.250 0.000 0.000
Offices & Shelving at new Pharmacy Depot N1670 28 3.222 0.000 0.000
Umhlanga Infrastructure 35 0.000 5.400 2.700
Clare Estate 23 0.000 0.000 1.350
Merebank 68 0.000 0.000 0.900
Austerville 67 0.000 0.000 0.900
Lalucia 35 0.000 5.400 0.000
Sydenham 25 0.000 9.000 0.000
Health Care Waste Areas - all Clinics Various 0.000 1.800 0.900
Monitoring Stations Various 1.350 1.600 1.350
Mobile Clinics ( Service to Rural Areas) Various 1.800 1.800 1.800
SOCIAL AND SECURITY SERVICES 81.521 93.878 91.790
FIRE AND EMERGENCY SERVICES 35.072 51.938 60.072
Fire Fighting Equipment at Depots 1.73837.21022 Various 1.620 1.889 3.067
191

CAPITAL BUDGET BY CLUSTER 2013 - 2016
Description Project No. Vote No. Ward No. BUDGET 2013/14 BUDGET 2014/15 BUDGET 2015/16
Rm Rm Rm
Fire and Emergency - Training Facility N1520 C1787 98 6.975 4.073 1.890
Verulam Fire Station (Permanent Facility) N1505 1.71153.21022 58 12.000 10.000 17.056
Verulam Fire Station ( Temporary Facility) 1.70407.21462 58 0.900 0.000 0.000
Umkomaas Fire Station (Temporary Facility) N1506 1.70407.21462 99 0.900 0.000 0.000
Umkomaas Fire Station (Permanent Facility) N1506 1.71153.21022 99 0.000 9.000 10.850
Umhlanga Fire Station (Temporary Fire Station) 1.70407.21403 35 0.441 0.000 0.000
Cato Ridge Fire Station (Permanent Fire Station)N1163 1.71153.21022 1 0.000 17.897 0.000
Fire HQ (Temporary Facility) 1.71153.21022 28 0.441 0.000 0.000
Specialist Support Vehicles - Fire 1.73966.21022 Various 2.700 5.724 23.004
Data Mining ESS 1.74153.21022 Various 0.900 0.000 1.800
Renovations and alterations (Prospecton) 1.70830.21622 90 1.800 0.000 1.800
Renovations and alterations (HQ) 1.70830.21022 28 3.830 0.000 0.000
Renovations and alterations (Congella) 1.70830.21032 32 0.270 0.000 0.000
Renovations and alterations (Phoenix) 1.70830.21442 49 0.180 0.000 0.000
Renovations and alterations (Umlazi) 1.70830.21612 79 0.180 0.000 0.000
Renovations and alterations (Pinetown) 1.70830.21203 18 0.900 0.000 0.000
Renovations and alterations (Hammarsdale) 1.70830.21232 4 0.180 0.000 0.000
Renovations and alterations (Brigades) 1.70830.21022 Various 0.855 2.724 0.605
Renovations and alterations (Durban North) 1.70830.21432 36 0.000 0.180 0.000
Renovations and alterations (Gillits) 1.70830.21242 10 0.000 0.450 0.000
EMERGENCY CONTROL AND DISASTER MANAGEMENT 34.200 34.857 23.850
Pinetown CCTV Control Centre N1535 1.71052.21810 18 0.450 0.450 0.450
Replacement of CCTV equipment 1.71052.21810 Various 2.700 2.700 2.250
CCTV N1534 1.71052.21810 Various 4.050 3.807 0.000
CCTV Spares 1.71052.21810 Various 0.900 0.900 0.900
Disaster Management CCTV system 1.71052.24410 Various 4.500 4.500 2.700Expansion of CCTV network in
accordance with crime trends and
statistics
1.71052.218
10 Various 4.500 4.500 3.150
Wireless communication 1.71052.21810 Various 1.350 1.800 2.250
Reinstatement of the fire optic cable infrastructure 1.71052.21810 Various 4.500 4.500 3.150
Installation of long range night vision
and thermal imaging cameras 1.71052.21810 Various 1.350 1.800 1.800
INK initiative CCTV system 1.71052.21810 Various 9.000 9.000 6.300
Emergency Services System (ESS) N1549 1.74153.21700 Various 0.900 0.900 0.900
METRO POLICE 2.277 7.083 7.868
Access Ramps Metro HQ 1.70830.20051 28 0.000 1.800 0.000
Refurbishment - Mpumalanga 1.70830.20051 6,91 0.000 0.900 0.000
Refurbishment - Umlazi 1.70830.20051 76 0.000 0.900 0.000
Refurbishment - Queensburgh 1.70830.20051 63 0.000 1.800 0.000
Refurbishment of Verulam Metro Police Station 1.70252.20051 60 0.450 0.000 0.000
Refurbishment of Boscombe Terrace Metro Police Station 1.70252.20051 26 1.350 0.900 0.000
Refurbishment of Albert Park Metro Police hawker unit facilities1.70830.20051 32 0.000 0.000 0.000
Refurbisment of Lahee Park training facility N1568 1.70252.20051 18 0.477 0.000 0.000
Kwa Mashua - Walkin safe 1.70830.20051 46 0.000 0.783 0.000
Umlazi Police Station (Permanemt facility) 1.71471.20051 0.000 0.000 7.868
SECURITY MANAGEMENT 9.972 0.000 0.000
Security management - New facilities N1608 1.70252.24420 27 9.972 0.000 0.000
SUSTAINABLE DEVELOPMENT AND CITY ENTERPRISES 160.157 204.740 247.100
ECONOMIC DEVELOPMENT 105.188 154.300 181.000
NEIGHBOURHOOD DEVELOPMENT 3.555 70.000 75.000
KwaMashu Town Centre S1038 1.71939.12010 41,45 3.555 0.467 0.000
Clermont & KwaDabeka S1047 1.71939.12010 19,20,22 0.000 19.998 12.400
INK S1060 1.71939.12010 Various 0.000 22.178 17.600
Umlazi S1048 1.71939.1201074,76,80,81,82,88,90 0.000 10.000 21.000
Neighbourhood Development Blocksum S1103 1.71939.12010 Various 0.000 17.357 24.000
TOWN CENTRE RENEWAL 73.894 55.800 69.000
Town Centre Renewal - Isipingo S1019 1.71939.12010 89 12.800 6.400 4.000
Town Centre Renewal - Tongaat S1024 1.71939.12010 61 2.100 1.600 0.000
Town Centre Renewal - Hammarsdale S1061 1.71939.12010 4 10.400 8.000 4.000
Town Centre Renewal - Umlazi S1062 1.71939.1201074,76,80,81,82,88,90 8.500 6.000 40.000
Town Centre Renewal - Umlazi (Ezimbuzini) S1028 1.71939.1201074,76,80,81,82,88,90 5.000 6.000 0.000
192

CAPITAL BUDGET BY CLUSTER 2013 - 2016
Description Project No. Vote No. Ward No. BUDGET 2013/14 BUDGET 2014/15 BUDGET 2015/16
Rm Rm Rm
Town Centre Renewal - Pinetown S1023 1.71939.12010 18 7.394 10.000 5.000
Town Centre Renewal - Clermont S1030 1.71939.12010 19,21 1.900 1.800 0.000
Town Centre Renewal - Umkomanzi S1029 1.71939.12010 99 5.500 3.000 0.000
Town Centre Renewal - Chatsworth S1101 1.71939.12010 70 7.000 0.000 0.000
Town Centre Renewal - Illovo S1031 1.71939.12010 98 2.000 5.000 10.000
Town Centre Renewal - Kwandengezi S1095 1.71939.12010 12 1.300 0.000 0.000
Cornubia Blackburn Link S1097 1.71939.12010 102 9.500 0.000 0.000
Town Centre Renewal - Unhlanga S1025 1.71939.12010 35 0.500 0.000 0.000
Town Centre Renewal - Blocksum S1094 1.71939.12010 Various 0.000 0.500 2.000
Industrial Development Blocksum S1066 1.71939.12010 Various 0.000 7.500 4.000
TOURISM NODES 24.739 14.500 15.000
Kingsway Tourism Corridor S1036 1.72957.12010 97,98 1.500 0.000 0.000
Tourism Nodes & Corridors - Umgababa S1012 1.72957.12010 98 4.200 3.500 10.000
Warwick Tourism S1091 1.72957.12010 28 1.000 0.000 0.000
Tourism Blocksum S1049 1.72957.12010 Various 0.000 11.000 5.000
Umhlanga Beach S1013 1.72957.12010 35 2.800 0.000 0.000
Inanda Heritage Route S1037 1.72957.1201042,44,54,55,56,57 5.700 0.000 0.000
Integrated City Development Grant 9.539 0.000 0.000
OTHER 3.000 14.000 22.000
Sector Support S1072 1.72957.12010 Various 0.000 0.000 11.000
Furniture Incubator S1071 1.72957.12010 46 3.000 14.000 11.000
BUSINESS SUPPORT 1.152 1.170 4.200
Desai Informal Traders Kiosk S3045 1.71157.23681 13 0.000 0.270 0.000
eZimbuzini Mechanics Structure S3041B 1.71159.26381 76 0.000 0.000 0.000
Toti Storage and ablution Facilities S3042 1.71206.26381 97 0.000 0.900 0.000
Provision of Street Traders Shelters Various 0.000 0.000 1.500
Verulam/Tongaat Traders Kiosk S3044 1.71157.26381 59,61 1.152 0.000 0.000
Tongaat Storage and Ablution Facilities 61 0.000 0.000 1.400
Verulam Storage and Ablution Facilities 59 0.000 0.000 1.300
D'MOSS S7001 1.73020.26230 Various 3.587 3.150 3.600
MARKETS 4.230 3.420 19.800
Bulk Markets 3.060 2.880 17.550
Development of Cold Room Facilities S8013 50.71262.90141 66 0.000 0.000 0.000
Development of Sales Hall S8012 50.71262.90151 66 2.250 2.430 0.000
Markets - Plant & Equipment Various Internal 0.810 0.450 1.350
Development of Distribution Centre 66 0.000 0.000 16.200
Retail Markets 1.170 0.540 2.250
Early Morning Market S4014 1.71157.26608 28 0.000 0.540 0.000
Phoenix Millenium S4020 1.71157.26628 49 0.450 0.000 0.000
Bangladesh Market S4021 1.71157.26617 70 0.360 0.000 0.000
English Market S4022 1.71157.26610 28 0.360 0.000 0.000
Herbsellers Market 28 0.000 0.000 1.170
Tongaat Market 61,62 0.000 0.000 1.080
Strategic Projects 45.999 42.700 38.500
Public Realm O2004 1.72985.12820 Various 0.000 0.000 0.000
Kings Park MM Stadium Precinct O2005 1.72985.12820 26,27 5.400 4.500 4.500
Community Development Project O2015 1.72985.12820 26,27 11.999 21.400 15.000
Victoria Embankment O2006 1.72985.12820 32 3.600 5.000 4.500
Moses Mabhida Stadium O2010 1.72985.12820 27 10.000 10.000 10.000
Support Infrastructure O2016 1.72985.12820 Various 0.000 0.000 4.500
Point O2500 1.72985.12820 26 11.700 0.000 0.000
Centrum O2031 1.72985.12820 28 2.850 1.350 0.000
Land Packaging O2029 1.72985.12820 Various 0.225 0.225 0.000
Natal Command O2033 1.72985.12820 27 0.225 0.225 0.000
193

CAPITAL BUDGET BY CLUSTER 2013 - 2016
Description Project No. Vote No. Ward No. BUDGET 2013/14 BUDGET 2014/15 BUDGET 2015/16
Rm Rm Rm
TREASURY 110.580 144.750 115.932
Outer West Satelite Workshop Facility 1.70880.77260 Internal 4.500 4.500 1.800
Vehicle Washing Facility - Central 1.70880.77110 Internal 1.800 0.000 0.000
Panel Shop - Spraybooth Replacement 1.70880.77130 Internal 1.800 0.000 0.000
Specialised Workshop Equipment 1.73837.77120 Internal 1.800 1.800 1.800
Fleet Replacement & Maintenance - R & G 1.74131.77350 Internal 29.000 41.000 46.700
Ottawa Workshop 1.70880.78100 Internal 0.000 9.000 4.500
Vehicle Tracking sytem 0.000 0.000 18.000
Fleet Management 1.73510.77170 Internal 1.800 1.800 0.450
Springfield Complex - Plant & Vehicle Hub 1.70880.77280 Internal 9.000 18.000 22.500
Plant and Equipment 1.70909.10810 Internal 4.500 4.500 4.500
Building Refurbishment/Upgrade 1.70880.11985 Internal 2.250 2.250 2.250
Real Estate V1194 1.70600.11999 Various 5.130 4.500 4.500
Revenue Blocksum 1.70800.11068 Internal 5.400 5.400 5.400
Supply Chain Management Plant & Equipment 1.73250.41500 Internal 0.000 0.000 0.450
Plant and Equipment 1.73250.11062 Internal 0.000 0.000 0.675
Building Refurbishment/Upgrade to 10th floor FMB Internal 0.000 0.000 1.800
Airconditioning Replacement at Rennie's House Internal 0.000 0.000 0.045
Upgrade CCTV Cameras At Rennies House Internal 0.000 0.000 0.540
Plant and Equipment - Insurance Internal 0.000 0.000 0.022
RMS 1.74152.11062 40.000 52.000 0.000
Refurbishment of Windere Street - 4th Floor T7122.7480 Internal 3.600 0.000 0.000
GOVERNANCE 13.500 23.680 14.310
City Hall
New Exterior Lighting 1.70880.11781 Internal 0.000 1.350 0.000
Wheelchair ramps at all 3 entrances G1002 1.70880.11781 Internal 1.170 0.000 1.350
Upgrade Interior Entrance G1002 1.70880.11781 Internal 0.000 0.000 0.000
Upgrading of Airconditioning G1001 1.70880.11781 Internal 7.200 9.000 6.480
City Hall Roof Replacement G1001 1.70880.11781 28 0.000 1.350 1.350
Council Chamber Allied Facilities 1.70880.11781 Internal 0.000 0.900 0.000
CPAS Blocksum 1.73250.12722 1.800 0.000 0.000
Records Management System Software G1004 1.70880.11781 Internal 2.250 1.080 1.350
Archive Storage Warehouse 0.000 0.000 0.000
Upgrade / Replacement of Pipes 0.000 0.000 2.700
Rationalise Circulation 2 new lifts in west foyer 1.70880.11781 Internal 1.080 0.000 1.080
Regional Centres 0.000 10.000 0.000
CORPORATE HUMAN RESOURCES 10.170 2.250 0.810
HUMAN RESOURCES 9.090 2.250 0.450
Old Canteen Building 1.70884.12772 Internal 5.310 0.000 0.000
Roll out of E-Recruitment (Kiosks) 1.70884.12772 Internal 1.350 2.250 0.000
Building Refurbishment / Upgrade - 7
Meller Road, C&SW HR Department
1.70884.615
05 Internal 2.340 0.000 0.000Building Refurbishment / Upgrade -
Room 301 & Room 323, City Engineer's
Bldg, HR Department
1.70884.127
52 Internal 0.090 0.000 0.000
Building Refurbishment / Upgrade
1.70884.127
52 Internal 0.000 0.000 0.360
Relocation of offices
1.70884.127
55 Internal 0.000 0.000 0.090
OCCUPATIONAL HEALTH AND SAFETY 1.080 0.000 0.360
Construction of new Clinic at Illovo/South Region 1.71300.12660 98 0.810 0.000 0.000
Refurbishment of existing 6 Clinics 1.71300.12660 internal 0.270 0.000 0.360
OFFICE OF THE CITY MANAGER 167.200 159.010 196.900
INFORMATION TECHNOLOGY 97.200 89.010 99.900
Radio Comm. Infrast. - Highsite Accom. Enhan - MarlightO3013 1.70880.12261 Various 3.600 2.700 2.700
Customer Relationship Management O1002 1.73301.12103 Internal 0.000 0.450 0.450
Collaboration Tools O1003 1.73301.12103 Internal 0.000 0.000 0.000
Street Name Signs R1003 1.72505.12747 Various 0.513 0.000 0.000
Infrastructure Management Tools O1010 1.73301.12103 Internal 0.720 0.450 0.900
Infrastructure -Telecom O1046 1.73550.12205 Internal 0.990 0.450 4.500
Knowledge Management Systems R1005 Internal 0.000 0.450 0.000
194

CAPITAL BUDGET BY CLUSTER 2013 - 2016
Description Project No. Vote No. Ward No. BUDGET 2013/14 BUDGET 2014/15 BUDGET 2015/16
Rm Rm Rm
Fixed Assets Integration O1034 1.73301.12103 Internal 0.900 0.450 0.900
E- Procurement O1004 1.73301.12103 Internal 1.530 0.900 2.700
Implement COBIT/ITIL O1059 1.73301.12103 Internal 0.000 0.450 0.450
Treasury - Networking of Telecommunication SystemO1029 1.73753.12205 Internal 0.225 0.180 0.450
Enterprise Architecture O1056 1.73301.12103 Internal 0.450 0.270 0.450
BEE Faciliatation and Tender Process ImprovementO1086 1.73301.12103 Internal 0.000 0.225 0.450
Integrated Procurement and Man. And Monioring Sys.O1087 1.73301.12103 Internal 0.000 0.225 0.450
Video Conferencing O1058 1.73301.12103 Internal 0.450 0.450 0.450
Payroll &HR Scheduling System -Metro Police LinkI0003 1.73511.12755 Internal 0.513 0.090 0.450
Performance Management Solution O1020 1.73512.12103 Internal 1.755 0.180 1.800
Desktop Infra: Desktop tools O1062 1.73301.12103 Internal 0.900 1.080 1.350
Telephony O1071 1.73753.12205 Internal 1.125 1.125 1.800
Datacente Infra: Enviromentals O1067 1.73301.12103 Internal 1.530 1.350 1.800
eLearning O1055 1.73301.12103 Internal 0.900 1.080 0.900
Data Warehousing, Business Intelligence & App IntegrationO1009 1.73301.12103 Internal 2.574 3.600 4.500
Antivirus/Patch Management O1072 1.73301.12103 Internal 0.810 0.900 1.350
Datacente Infra: Backup Robot O1065 1.73301.12103 Internal 2.061 1.800 2.250
Document Management System O1021 1.73454.12103 Internal 0.720 0.900 1.800
Datacente Infra: Management Tools O1066 1.73301.12103 Internal 0.900 1.080 1.350
IT Tools & Firewalls O1069 1.73301.12103 Internal 1.350 1.350 3.600
Datacente Infra: SAN Storage O1064 1.73301.12103 Internal 3.600 3.600 4.500
Desktop Infra: Upgrades/Equip for new staff O1061 1.73301.12103 Internal 2.610 2.700 3.150
Infrastructure- City Wide O1045 1.73550.12205 Internal 1.350 1.800 1.350
Internet/Intranet Development O1017 1.73475.12205 Internal 2.061 2.700 2.700
Datacente Infra: Servers O1063 1.73301.12103 Internal 3.060 3.150 3.600
Datacente Infra: Consolidation & ModernisationO1068 1.73301.12103 Internal 3.096 3.150 3.600
E-Government Web Based Applications O1005 1.73301.12103 Internal 3.600 3.600 4.500
Switches and Routes for Expansion of network O1070 1.73550.12205 Internal 0.270 0.450 1.800
Business Process Management O1007 1.73301.12103 Internal 4.122 4.500 5.400
Payroll & HR MIS I0001 1.73511.12755 Internal 1.350 1.800 1.800
MS Enterprise Groupwise replacement with MS ExchangeO1057 1.73301.12103 Internal 2.574 2.250 2.250
Software Licences 1.74153.12103 Internal 2.682 2.700 3.150
Fibre, Wireless, Monitoring & Wide Area NetworkO1031 1.73550.12205 Internal 5.130 4.500 4.500
Payroll & HR Time and Attendance I0002 1.73511.12755 Internal 2.520 4.500 4.500
Fibre and Wide Area Network O1018 1.73550.12205 Internal 7.713 6.300 9.000
Major System Enhancement O1082 1.73301.12103 Internal 22.050 14.625 0.000
Information Technology Computers 1.70909.10810 Internal 4.896 4.500 6.300
OCM - STRATEGIC PROJECTS 70.000 70.000 97.000
Economic Development Projects - Other 0.000 0.000 27.000
Zonal Plans - Blocksum 70.000 70.000 70.000
195

�
�
�
�
�
�������������
�
��� � ������ � ��
�
�
�
�
�
�
�
�
�
�
�
�
�
���������� ���
�������������������
�
�
�
�
�
�
�

Ushaka Marine World - Table D1 Budget Summary
Description 2009/10 2010/11 2011/12 Current Year 2012/13Medium Term Revenue and Expenditure
Framework
R thousandsAudited
Outcome
Audited
Outcome
Audited
Outcome
Original
Budget
Adjusted
Budget
Full Year
Forecast
Budget Year
2013/14
Budget Year
+1 2014/15
Budget Year
+2 2015/16
Financial Performance
Property rates – – – – – – – – –
Service charges – – – – – – – – –
Investment revenue – – 1,948 953 953 953 1,367 1,434 1,507
Transfers recognised - operational – – – – – – – – –
Other own revenue 129,158 150,093 150,937 176,195 166,678 166,678 180,509 194,119 208,923
Total Revenue (excluding capital transfers and
contributions)
129,158 150,093 152,885 177,148 167,631 167,631 181,876 195,553 210,430
Employee costs 46,194 52,434 57,970 61,889 61,953 61,953 66,216 70,189 74,400
Remuneration of Board Members 313 324 462 253 253 253 310 326 342
Depreciation and debt impairment 35,368 – – – – – – – –
Finance charges 7,375 7,885 8,506 8,438 9,111 9,111 9,060 8,992 8,981
Materials and bulk purchases 16,234 18,216 18,600 24,537 23,343 23,343 23,794 24,984 26,233
Transfers and grants – – – – – – – – –
Other expenditure 61,835 104,580 108,078 117,013 108,646 108,646 116,650 127,924 135,084
Total Expenditure 167,319 183,439 193,616 212,130 203,306 203,306 216,030 232,415 245,040
Surplus/(Deficit) (38,161) (33,346) (40,731) (34,982) (35,675) (35,675) (34,154) (36,862) (34,610)
Transfers recognised - capital – – – – – – – – –
Contributions recognised - capital & contributed assets – – – – – – – – –
Surplus/(Deficit) after capital transfers &
contributions(38,161) (33,346) (40,731) (34,982) (35,675) (35,675) (34,154) (36,862) (34,610)
Taxation – – – – – – – – –
Surplus/ (Deficit) for the year (38,161) (33,346) (40,731) (34,982) (35,675) (35,675) (34,154) (36,862) (34,610)
Capital expenditure & funds sources
Capital expenditure 37,252 11,531 8,404 16,218 16,218 16,218 14,621 8,000 8,000
Transfers recognised - capital 33,326 7,765 3,498 7,766 7,766 7,766 3,900 – –
Public contributions & donations – – – – – – – – –
Borrowing – – – – – – – – –
Internally generated funds 3,926 3,766 4,906 8,452 8,452 8,452 10,721 8,000 8,000
Total sources of capital funds 37,252 11,531 8,404 16,218 16,218 16,218 14,621 8,000 8,000
Financial position
Total current assets 33,604 42,844 37,448 29,335 29,431 29,431 35,001 34,922 37,297
Total non current assets 534,087 509,155 488,919 463,991 463,991 463,991 441,195 413,194 385,194
Total current liabilities 20,649 20,974 19,816 16,311 16,398 16,398 18,499 18,006 17,714
Total non current liabilities 87,501 94,390 101,857 2,895 2,895 2,895 2,164 1,339 442
Community wealth/Equity 459,542 436,636 404,694 474,120 474,129 474,129 455,533 428,771 404,335
Cash flows
Net cash from (used) operating 7,694 12,537 3,480 8,411 10,472 10,472 20,575 8,986 11,511
Net cash from (used) investing (37,023) (11,402) (8,323) (16,218) (16,218) (16,218) (14,621) (8,000) (8,000)
Net cash from (used) financing 17,831 9,530 (712) (1,005) (1,005) (1,005) (979) (977) (1,038)
Cash/cash equivalents at the year end 26,752 37,416 31,861 23,049 25,110 25,110 30,085 30,094 32,567
196

Ushaka Marine World - Table D2 Budgeted Financial Performance (revenue and expenditure)
Description Ref 2009/10 2010/11 2011/12 Current Year 2012/13Medium Term Revenue and Expenditure
Framework
R thousandsAudited
Outcome
Audited
Outcome
Audited
Outcome
Original
Budget
Adjusted
Budget
Full Year
Forecast
Budget Year
2013/14
Budget Year
+1 2014/15
Budget Year
+2 2015/16
Revenue by Source 1
Property rates
Property rates - penalties & collection charges
Service charges - electricity revenue
Service charges - water revenue
Service charges - sanitation revenue
Service charges - refuse revenue
Service charges - other
Rental of facilities and equipment
Interest earned - external investments 1,948 953 953 953 1,367 1,434 1,507
Interest earned - outstanding debtors
Dividends received
Fines
Licences and permits
Agency services
Transfers recognised - operational
Other revenue 129,158 150,093 150,937 176,195 166,678 166,678 180,509 194,119 208,923
Gains on disposal of PPE
Total Revenue (excluding capital transfers and contributions) 129,158 150,093 152,885 177,148 167,631 167,631 181,876 195,553 210,430
Expenditure By Type
Employee related costs 46,194 52,434 57,970 61,889 61,953 61,953 66,216 70,189 74,400
Remuneration of Directors 313 324 462 253 253 253 310 326 342
Debt impairment 4
Collection costs
Depreciation & asset impairment 35,368 38,098 34,989 36,000 36,000 36,000 36,000 36,000 36,000
Finance charges 7,375 7,885 8,506 8,438 9,111 9,111 9,060 8,992 8,981
Bulk purchases 2 16,234 18,216 18,600 24,537 23,343 23,343 23,794 24,984 26,233
Other materials 5
Contracted services
Transfers and grants
Other expenditure 3 61,835 66,482 73,089 81,013 72,646 72,646 80,650 91,924 99,084
Loss on disposal of PPE
Total Expenditure 167,319 183,439 193,616 212,130 203,306 203,306 216,030 232,415 245,040
Surplus/(Deficit) (38,161) (33,346) (40,731) (34,982) (35,675) (35,675) (34,154) (36,862) (34,610)
Transfers recognised - capital
Contributions recognised - capital
Contributions of PPE
Surplus/(Deficit) after capital transfers & contributions
(38,161) (33,346) (40,731) (34,982) (35,675) (35,675) (34,154) (36,862) (34,610)
Taxation
Surplus/ (Deficit) for the year (38,161) (33,346) (40,731) (34,982) (35,675) (35,675) (34,154) (36,862) (34,610)
References
1. Revenue includes sales of: (insert description)
2. Bulk purchases - electricity
2. Bulk purchases - water
3. Expenditure includes repairs & maintenance of:
197
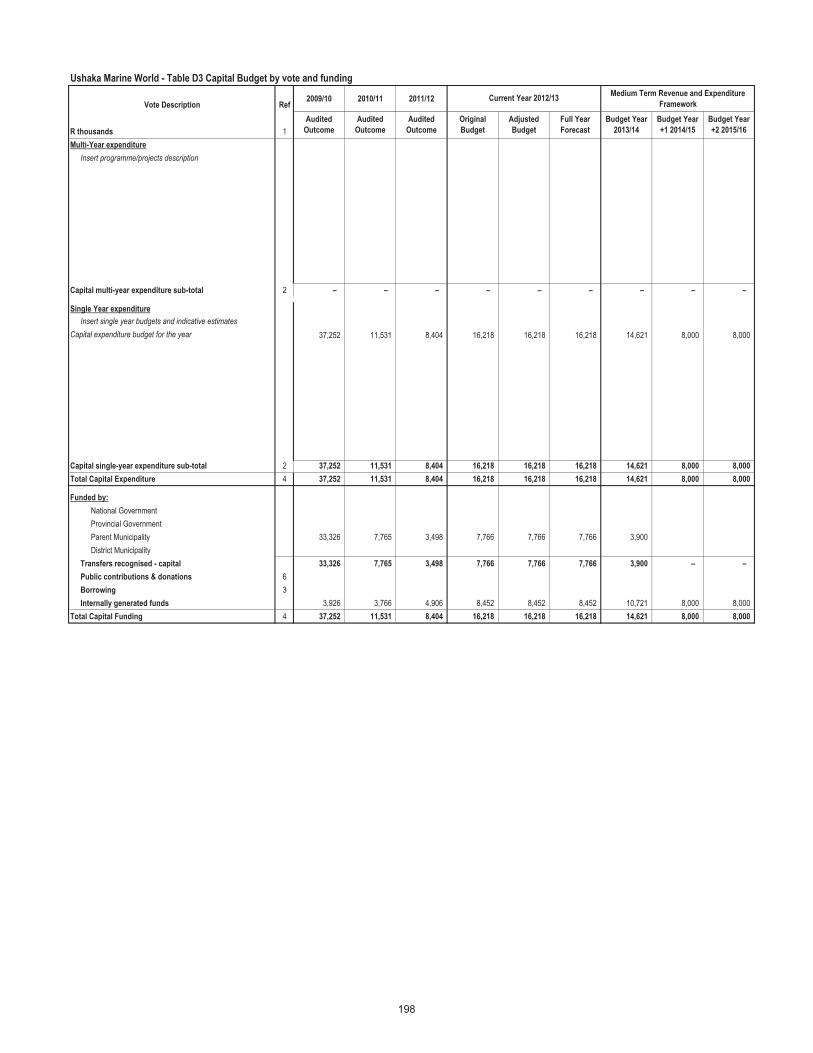
Ushaka Marine World - Table D3 Capital Budget by vote and funding
2009/10 2010/11 2011/12Medium Term Revenue and Expenditure
Framework
R thousands 1
Multi-Year expenditure
Insert programme/projects description
Capital multi-year expenditure sub-total 2 – – – – – – – – –
Single Year expenditure
Insert single year budgets and indicative estimates
Capital expenditure budget for the year 37,252 11,531 8,404 16,218 16,218 16,218 14,621 8,000 8,000
Capital single-year expenditure sub-total 2 37,252 11,531 8,404 16,218 16,218 16,218 14,621 8,000 8,000
Total Capital Expenditure 4 37,252 11,531 8,404 16,218 16,218 16,218 14,621 8,000 8,000
Funded by:
National Government
Provincial Government
Parent Municipality 33,326 7,765 3,498 7,766 7,766 7,766 3,900
District Municipality
Transfers recognised - capital 33,326 7,765 3,498 7,766 7,766 7,766 3,900 – –
Public contributions & donations 6
Borrowing 3
Internally generated funds 3,926 3,766 4,906 8,452 8,452 8,452 10,721 8,000 8,000
Total Capital Funding 4 37,252 11,531 8,404 16,218 16,218 16,218 14,621 8,000 8,000
Vote Description Ref
Audited
Outcome
Audited
Outcome
Current Year 2012/13
Budget Year
2013/14
Budget Year
+1 2014/15
Audited
Outcome
Original
Budget
Adjusted
Budget
Budget Year
+2 2015/16
Full Year
Forecast
198

Ushaka Marine World - Table D4 Budgeted Financial Position
Description Ref 2009/10 2010/11 2011/12Medium Term Revenue and Expenditure
Framework
R thousandsAudited
Outcome
Audited
Outcome
Audited
Outcome
Original
Budget
Adjusted
Budget
Full Year
Forecast
Budget Year
2013/14
Budget Year
+1 2014/15
Budget Year
+2 2015/16
ASSETS
Current assets
Cash 26,752 37,417 31,862 23,049 25,110 25,110 30,085 30,094 32,567
Call investment deposits
Consumer debtors 2,278 1,680 1,470 2,315 350 350 925 817 719
Other debtors 747 –
Current portion of long-term receivables
Inventory 3,828 3,748 4,116 3,971 3,971 3,971 3,991 4,011 4,011
Total current assets 33,604 42,844 37,448 29,335 29,431 29,431 35,001 34,922 37,297
Non current assets
Long-term receivables 3 5,204 7,515 5,977 7,515 7,515 7,515 2,977 2,977 2,977
Investments
Investment property 78,831 76,309 73,778 – – –
Property, plant and equipment 1 448,969 424,660 409,164 456,476 456,476 456,476 438,218 410,217 382,217
Agricultural assets
Biological assets
Intangible assets 1,083 671
Total non current assets 534,087 509,155 488,919 463,991 463,991 463,991 441,195 413,194 385,194
TOTAL ASSETS 567,691 551,999 526,367 493,326 493,422 493,422 476,196 448,116 422,491
LIABILITIES
Current liabilities
Bank overdraft
Borrowing 674 642 698 –
Consumer deposits 1,368 1,486 1,416 1,524 1,524 1,524 1,234 1,234 1,234
Trade and other payables 18,607 18,846 15,892 14,787 14,874 14,874 17,265 16,772 16,480
Provisions 3 1,810
Total current liabilities 20,649 20,974 19,816 16,311 16,398 16,398 18,499 18,006 17,714
Non current liabilities
Borrowing 87,501 94,390 101,857 2,895 2,895 2,895 2,164 1,339 442
Provisions 3
Total non current liabilities 87,501 94,390 101,857 2,895 2,895 2,895 2,164 1,339 442
TOTAL LIABILITIES 108,149 115,364 121,673 19,206 19,293 19,293 20,663 19,345 18,156
NET ASSETS 2 459,542 436,636 404,694 474,120 474,129 474,129 455,533 428,771 404,335
COMMUNITY WEALTH/EQUITY
Accumulated Surplus/(Deficit) (407,477) (440,823) (472,765) (510,404) (511,062) (511,062) (538,506) (575,367) (609,976)
Reserves 6,024 4,464 4,464 111,529 112,196 112,196 121,044 131,143 141,316
Share capital 860,995 872,995 872,995 872,995 872,995 872,995 872,995 872,995 872,995
TOTAL COMMUNITY WEALTH/EQUITY 2 459,542 436,636 404,694 474,120 474,129 474,129 455,533 428,771 404,335
Current Year 2012/13
199

Ushaka Marine World - Table D5 Budgeted Cash Flow
Description Ref 2009/10 2010/11 2011/12Medium Term Revenue and Expenditure
Framework
R thousandsAudited
Outcome
Audited
Outcome
Audited
Outcome
Original
Budget
Adjusted
Budget
Full Year
Forecast
Budget Year
2013/14
Budget Year
+1 2014/15
Budget Year
+2 2015/16
CASH FLOW FROM OPERATING ACTIVITIES
Receipts
Ratepayers and other 128,584 146,343 151,146 178,707 167,798 167,798 183,749 194,227 209,021
Government - operating
Government - capital
Interest 1,948 1,366 1,435 1,507
Dividends
Payments 2
Suppliers and employees (113,515) (125,921) (149,274) (161,858) (148,888) (148,888) (155,481) (197,102) (209,505)
Finance charges (7,375) (7,885) (340) (8,438) (8,438) (8,438) (9,059) 10,426 10,488
Dividends paid
Transfers and Grants
NET CASH FROM/(USED) OPERATING ACTIVITIES 7,694 12,537 3,480 8,411 10,472 10,472 20,575 8,986 11,511
CASH FLOWS FROM INVESTING ACTIVITIES
Receipts
Proceeds on disposal of PPE 9 128 81
Decrease (Increase) in non-current debtors
Decrease (increase) other non-current receivables
Decrease (increase) in non-current investments – –
Payments
Capital assets (37,032) (11,531) (8,404) (16,218) (16,218) (16,218) (14,621) (8,000) (8,000)
NET CASH FROM/(USED) INVESTING ACTIVITIES (37,023) (11,402) (8,323) (16,218) (16,218) (16,218) (14,621) (8,000) (8,000)
CASH FLOWS FROM FINANCING ACTIVITIES
Receipts
Short term loans 20,000 12,000 –
Borrowing long term/refinancing (1,447) (635) (642)
Increase (decrease) in consumer deposits (23) 118 (70)
Payments
Repayment of borrowing (700) (1,953) (1,005) (1,005) (1,005) (979) (977) (1,038)
NET CASH FROM/(USED) FINANCING ACTIVITIES 17,831 9,530 (712) (1,005) (1,005) (1,005) (979) (977) (1,038)
NET INCREASE/ (DECREASE) IN CASH HELD 1 (11,498) 10,664 (5,555) (8,812) (6,751) (6,751) 4,975 9 2,473
Cash/cash equivalents at the year begin: 2 38,250 26,752 37,416 31,861 31,861 31,861 25,110 30,085 30,094
Cash/cash equivalents at the year end: 2 26,752 37,416 31,861 23,049 25,110 25,110 30,085 30,094 32,567
Current Year 2012/13
200

Ushaka Marine World - Supporting Table SD1 Measurable performance targets
2009/10 2010/11 2011/12
Footfalls Feet 790 847 819 916 856 856 842 880 920
Adjusted
Budget
Full Year
Forecast
Current Year 2012/13Medium Term Revenue and Expenditure
Framework
Budget Year
2013/14
Budget Year
+1 2014/15
Budget Year
+2 2015/16
Original
Budget
Audited
Outcome
Audited
Outcome
Performance target description Unit of measurementAudited
Outcome
201

Ushaka Marine World - Supporting Table SD2 Financial and non-financial indicators
2009/10 2010/11 2011/12Medium Term Revenue and Expenditure
Framework
Borrowing Management
Borrowing to Asset Ratio Total Long-term Borrowing/ Total Assets 15.4% 17.1% 19.4% 0.6% 0.6% 0.6% 0.5% 0.3% 0.1%
Capital Charges to Operating Expenditure Finance charges & Depreciation / Operating
Expenditure
4% 4% 4% 4% 4% 4% 4% 4% 4%
Borrowed funding of capital expenditure Borrowing/Capital expenditure excl. transfers
and grants and contributions
-36.8% -16.9% -13.1% 0.0% 0.0% 0.0% 0.0% 0.0% 0.0%
Safety of Capital
Debt to Equity Loans, Accounts Payable, Overdraft & Tax
Provision / Funds & Reserves
23.2% 26.1% 29.3% 3.7% 3.7% 3.7% 4.3% 4.2% 4.2%
Gearing Long Term Borrowing / Funds & Reserves 19% 22% 25% 1% 1% 1% 0% 0% 0%
Liquidity
Current Ratio Current assets / current liabilities 1.63 2.04 1.89 1.80 1.79 1.79 1.89 1.94 2.11
Current Ratio adjusted for debtors Current assets/current liabilities less debtors >
90 days
1.63 2.04 1.89 1.80 1.79 1.79 1.89 1.94 2.11
Liquidity Ratio Monetary Assets / Current Liabilities 1.30 1.78 1.61 1.41 1.53 1.53 1.63 1.67 1.84
Revenue Management
Annual Debtors Collection Rate (Payment
Level %)
Last 12 Mths Receipts / Last 12 Mths Billing 100% 98% 100% 101% 101% 101% 102% 100%
Outstanding Debtors to Revenue Total Outstanding Debtors to Annual Revenue 6% 6% 5% 6% 5% 5% 2% 2% 2%
Funding of Provisions
Percentage Of Provisions Not Funded Unfunded Provisions/Total Provisions
Other Indicators
Employee costs Employee costs/Total Revenue - capital
revenue
35.8% 34.9% 37.9% 35% 37% 37% 36% 36% 35%
Repairs & Maintenance R&M/Total Revenue - capital revenue 0.0% 0.0% 0.0% 0% 0% 0% 0% 0% 0%
Interest & Depreciation I&D/Total Revenue - capital revenue 5.7% 5.3% 5.6% 5% 5% 5% 5% 5% 4%
Financial viability indicators
i. Debt coverage (Total Operating Revenue - Operating
Grants)/Debt service payments due within
financial year)
13.1 441.5 16.2 18.8 17.8 16.7 -19.2 -20.7 -
ii. O/S Service Debtors to Revenue Total outstanding service debtors/annual
revenue received for services
0% 0.0% 0.0% 0% 0% 0% 0% 0% 0%
iii. Cost coverage (Available cash + Investments)/monthly fixed
operational expenditure
34% 0.4 0.3 0.2 0.3 0.3 0.3 0.3 0.3
Budget Year
+2 2015/16
Ref
Audited
Outcome
Original
Budget
Adjusted
Budget
Full Year
Forecast
Current Year 2012/13
Budget Year
+1 2014/15
Description of indicator Basis of calculation
Audited
Outcome
Audited
Outcome
Budget Year
2013/14
202

Ushaka Marine World - Supporting Table SD3 Budgeted Investment Portfolio
Budget Year 2013/14
Period of investment Market value Interest
R thousandsMonths Begin End Fully accrued
Yield
%
Standard bank Immediate access Bank account - Current Current 25,110 30,085 1,367
1 25,110 30,085 1,367
Expiry date of investmentType of investment
Investments by maturity
Name of institution & investment IDRef
203

Ushaka Marine World - Supporting Table SD4 Board member allowances and staff benefits
2009/10 2010/11 2011/12 Current Year 2012/13Medium Term Revenue and Expenditure
Framework
R thousands A B C D E F G H I
Remuneration
Board Members of Entities
Basic Salaries
Pension Contributions
Medical Aid Contributions
Motor vehicle allowance
Cell phone allowance
Housing allowance
Other benefits and allowances
In-kind benefits 1
Board Fees 313 324 462 253 253 253 310 326 342
Sub Total - Board Members of Entities 313 324 462 253 253 253 310 326 342
% increase 0 0 (0) (0) (0) 0 0 5.0%
Senior Managers of Entities
Basic Salaries 4 433 3 384 4 266 5 129 5 129 5 129 5 457 5 784 6 131
Pension Contributions 495 439 494 759 759 759 807 855 907
Medical Aid Contributions 50 35 40 64 64 64 68 72 76
Motor vehicle allowance 36 36 60 74 74 74 79 84 89
Cell phone allowance
Housing allowance
Performance Bonus
Other benefits or allowances
In-kind benefits 1
Sub Total - Senior Managers of Entities 5,014 3,894 4,860 6,026 6,026 6,026 6,411 6,796 7,203
% increase (0) 0 0 0 0 0 0 6.0%
Other Staff of Entities
Basic Salaries 33 457 39 780 44 944 45 817 45 881 45 881 50 344 52 998 56 264
Pension Contributions 5 234 6 092 4 715 8 165 8 165 8 165 7 743 8 573 9 002
Medical Aid Contributions
Motor vehicle allowance
Cell phone allowance
Housing allowance
Overtime 2,489 2,668 3,451 1,881 1,881 1,881 1,718 1,822 1,931
Performance Bonus
Other benefits or allowances
In-kind benefits 1
Sub Total - Other Staff of Entities 41,180 48,540 53,110 55,863 55,927 55,927 59,805 63,393 67,197
% increase 0 0 0 0 0 0 0 6.0%
Total Municipal Entities remuneration 46,507 52,758 58,432 62,142 62,206 62,206 66,526 70,515 74,742
Budget Year
+2 2015/16
Audited
Outcome
Original
Budget
Adjusted
Budget
Full Year
Forecast
Budget Year
+1 2014/15
Audited
Outcome
Audited
Outcome
Summary of Employee and Board Member remuneration RefBudget Year
2013/14
204

Ushaka Marine World - Supporting Table SD5 Summary of personnel numbers
Summary of Personnel Numbers
Number PositionsPermanent
employees
Contract
employeesPositions
Permanent
employees
Contract
employeesPositions
Permanent
employees
Contract
employees
Municipal Council and Boards of Municipal Entities
Councillors (Political Office Bearers plus Other Councillors)
Board Members of municipal entities 9 9 9 9 9 9
Municipal entity employees
CEO and Senior Managers 6 6 6 6 6 6
Other Managers 12 12 12 12 12 12
Professionals – – – – – – – – –
Finance
Spatial/town planning
Information Technology
Roads
Electricity
Water
Sanitation
Refuse
Other
Technicians – – – – – – – – –
Finance
Spatial/town planning
Information Technology
Roads
Electricity
Water
Sanitation
Refuse
Other
Clerks (Clerical and administrative) 495 486 9 539 527 12 524 512 12
Service and sales workers
Skilled agricultural and fishery workers
Craft and related trades
Plant and Machine Operators
Elementary Occupations
Total Personnel Numbers 522 513 9 566 554 12 551 539 12
% increase (1.7%) (98.2%) 6,188.9% 6,055.6% 33.3% 4,491.7% (2.2%) (97.8%)
Total entity employees headcount
Finance personnel headcount 68 68 68 68
Human Resources personnel headcount 6 6 6 6
2011/12 Current Year 2012/13 Budget Year 2013/14
205

Ushaka Marine World - Supporting Table SD6 Budgeted monthly cash and revenue/expenditure
Budget Year 2013/14Medium Term Revenue and Expenditure
Framework
July August Sept. October November December January February March April May June
R thousands
Revenue By Source
Service charges – – – –
Rental of facilities and equipment – – – –
Other revenue 13,152 10,165 11,719 15,185 11,073 35,317 22,199 12,053 14,186 19,500 8,197 9,130 181,876 195,553 210,430
Gains on disposal of PPE – – – –
Total Revenue 13,152 10,165 11,719 15,185 11,073 35,317 22,199 12,053 14,186 19,500 8,197 9,130 181,876 195,553 210,430
Expenditure By Type
Employee related costs 5,208 5,208 5,208 5,208 5,208 8,929 5,208 5,208 5,208 5,208 5,208 5,208 66,216 70,189 74,400
Remuneration of Board Members 54 14 14 14 54 – 14 54 14 14 54 13 310 326 342
Debt impairment – – – –
Collection costs – – – –
Depreciation & asset impairment 3,000 3,000 3,000 3,000 3,000 3,000 3,000 3,000 3,000 3,000 3,000 3,000 36,000 36,000 36,000
Finance charges 742 742 805 742 742 797 742 742 796 742 742 726 9,060 8,992 8,981
Bulk purchases 1,487 1,125 1,206 1,759 1,113 4,513 2,230 1,293 1,813 2,220 821 4,214 23,794 24,984 26,233
Other materials – – – –
Contracted services – – – –
Transfers and grants – – – –
Other expenditure 8,084 6,222 6,407 7,429 5,971 9,327 8,099 6,036 6,765 7,398 5,416 3,496 80,650 91,924 99,084
Loss on disposal of PPE – – – –
Total Expenditure 18,575 16,311 16,640 18,152 16,088 26,566 19,293 16,333 17,596 18,582 15,241 16,656 216,030 232,415 245,040
Capital expenditure
Capital assets – – – – – – 14,621 – – – – 14,621 8,000 8,000
Total capital expenditure – – – – – – 14,621 – – – – – 14,621 8,000 8,000
Cash flow
Ratepayers and other 183,749 183,749 194,227 209,021
Grants – – – –
Interest 1,366 1,366 1,435 1,507
Suppliers, employees and other (155,481) (155,481) (197,102) (209,505)
Finance charges (9,059) (9,059) 10,426 10,488
Dividends paid – – – –
NET CASH FROM/(USED) OPERATING ACTIVITIES – – – – – – – – – – – 20,575 20,575 8,986 11,511
Decrease (increase) other non-current receivables – – – –
Decrease (increase) in non-current investments – – – –
Proceeds on disposal of PPE – – – –
Capital assets (14,621) (14,621) (8,000) (8,000)
NET CASH FROM/(USED) INVESTING ACTIVITIES – – – – – – – – – – – (14,621) (14,621) (8,000) (8,000)
Borrowing long term/refinancing/short term – – – –
Repayment of borrowing (979) (979) (977) (1,038)
Increase in consumer deposits – – – –
NET CASH FROM/(USED) FINANCING ACTIVITIES – – – – – – – – – – – (979) (979) (977) (1,038)
NET INCREASE/ (DECREASE) IN CASH HELD – – – – – – – – – – – 4,975 4,975 9 2,473
Description
Budget Year
2013/14
Budget Year
+1 2014/15
Budget Year
+2 2015/16
206

Ushaka Marine World - Supporting Table SD7a Capital expenditure on new assets by asset class
2009/10 2010/11 2011/12 Current Year 2012/13Medium Term Revenue and Expenditure
Framework
R thousands
Capital expenditure on new assets by asset category
Infrastructure – – – – – – – – –
Infrastructure - Road transport – – – – – – – – –
Roads, Pavements & Bridges
Storm water
Infrastructure - Electricity – – – – – – – – –
Generation
Transmission & Reticulation
Street Lighting
Infrastructure - Water – – – – – – – – –
Dams & Reservoirs
Water purification
Reticulation
Infrastructure - Sanitation – – – – – – – – –
Reticulation
Sewerage purification
Infrastructure - Other – – – – – – – – –
Waste Management
Transportation
Gas
Other
Community – – – – – – – – –
Parks & gardens
Sportsfields & stadia
Swimming pools
Community halls
Libraries
Recreational facilities
Fire, safety & emergency
Security and policing
Buses
Clinics
Museums & Art Galleries
Cemeteries
Social rental housing
Other
Heritage assets – – – – – – – – –
Buildings
Other
Investment properties – – – – – – – – –
Housing development
Other
Other assets 37,252 11,531 8,404 16,218 16,218 16,218 14,621 8,000 8,000
General vehicles 76 541
Specialised vehicles
Plant & equipment – 64 714 12,198 12,198 12,198 12,391 8,000 8,000
Computers - hardware/equipment 1,127 476 354 1,845 1,845 1,845 1,750
Furniture and other office equipment 10,343 4,695 6,744 2,175 2,175 2,175 480
Abattoirs
Markets
Civic Land and Buildings
Other Buildings
Other Land 19,650 5,720 592
Surplus Assets - (Investment or Inventory)
Other 6,056 35
Agricultural assets – – – – – – – – –
List sub-class
Biological assets – – – – – – – – –
List sub-class
Intangibles – – – – – – – – –
Computers - software & programming
Other (list sub-class)
Total capital expenditure on new assets 37,252 11,531 8,404 16,218 16,218 16,218 14,621 8,000 8,000
Specialised vehicles – – – – – – – – –
Refuse
Fire
Conservancy
Ambulances
Budget Year
+2 2015/16
Audited
Outcome
Original
Budget
Adjusted
Budget
Full Year
Forecast
Budget Year
+1 2014/15
Description
Audited
Outcome
Audited
Outcome
Budget Year
2013/14
207

�
�
�
�
�
�
����������� �����
�
�
�
�
�
�
�
�

ICC Durban (Pty) Ltd - Table D1 Budget Summary
Description 2009/10 2010/11 2011/12 Current Year 2012/13Medium Term Revenue and Expenditure
Framework
R thousandsAudited
Outcome
Audited
Outcome
Audited
Outcome
Original
Budget
Adjusted
Budget
Full Year
Forecast
Budget Year
2013/14
Budget Year
+1 2014/15
Budget Year
+2 2015/16
Financial Performance
Property rates – – – – – – – – –
Service charges – – – – – – – – –
Investment revenue 6,842 5,203 6,296 5,000 5,000 6,186 6,000 6,000 6,000
Transfers recognised - operational – – – – – – – – –
Other own revenue 105,646 129,727 237,080 127,581 127,581 132,000 137,000 146,316 156,265
Total Revenue (excluding capital transfers and
contributions)
112,488 134,930 243,376 132,581 132,581 138,186 143,000 152,316 162,265
Employee costs 46,156 48,898 42,326 44,659 44,659 40,256 42,962 45,480 48,147
Remuneration of Board Members – – – – – – – – –
Depreciation and debt impairment 33,833 528 691 – – – – – –
Finance charges – – – – – – – – –
Materials and bulk purchases – – – – – – – – –
Transfers and grants – – – – – – – – –
Other expenditure 77,842 82,094 131,352 140,614 140,614 96,901 99,674 106,625 113,991
Total Expenditure 157,831 131,520 174,369 185,273 185,273 137,157 142,636 152,105 162,138
Surplus/(Deficit) (45,342) 3,410 69,007 (52,692) (52,692) 1,029 364 211 127
Transfers recognised - capital – – – – – – – – –
Contributions recognised - capital & contributed assets – – – – – – – – –
Surplus/(Deficit) after capital transfers &
contributions(45,342) 3,410 69,007 (52,692) (52,692) 1,029 364 211 127
Taxation – 1,136 15,186 – – 298 106 61 37
Surplus/ (Deficit) for the year (45,342) 2,274 53,821 (52,692) (52,692) 731 258 150 90
Capital expenditure & funds sources
Capital expenditure 6,099 2,213 23,805 15,000 15,000 31,000 20,000 20,000 20,000
Transfers recognised - capital – – – – – – – – –
Public contributions & donations – – – – – – – – –
Borrowing – – – – – – – – –
Internally generated funds 6,099 2,213 23,805 15,000 15,000 31,000 20,000 20,000 20,000
Total sources of capital funds 6,099 2,213 23,805 15,000 15,000 31,000 20,000 20,000 20,000
Financial position
Total current assets 102,680 114,808 155,059 101,463 101,463 143,872 130,796 117,895 105,254
Total non current assets 714,915 170,713 178,081 656,448 656,448 204,439 217,879 230,991 243,759
Total current liabilities 29,653 39,275 33,072 47,215 47,215 47,215 47,215 47,215 47,215
Total non current liabilities 226,590 226,590 226,590 226,590 226,590 226,590 226,590 226,590 226,590
Community wealth/Equity 561,353 19,656 73,478 484,106 484,106 74,507 74,871 75,082 75,209
Cash flows
Net cash from (used) operating (31,740) 2,800 21,245 (64,094) (64,094) (37,685) (33,076) (32,901) (32,641)
Net cash from (used) investing 6,099 2,213 23,805 15,000 15,000 31,000 20,000 20,000 20,000
Net cash from (used) financing – – – – – – – – –
Cash/cash equivalents at the year end 95,894 100,908 145,957 96,863 96,863 139,272 126,196 113,295 100,654
208

ICC Durban (Pty) Ltd - Table D2 Budgeted Financial Performance (revenue and expenditure)
Description 2009/10 2010/11 2011/12 Current Year 2012/13Medium Term Revenue and Expenditure
Framework
R thousandsAudited
Outcome
Audited
Outcome
Audited
Outcome
Original
Budget
Adjusted
Budget
Full Year
Forecast
Budget Year
2013/14
Budget Year
+1 2014/15
Budget Year
+2 2015/16
Revenue by Source
Property rates
Property rates - penalties & collection charges
Service charges - electricity revenue
Service charges - water revenue
Service charges - sanitation revenue
Service charges - refuse revenue
Service charges - other
Rental of facilities and equipment
Interest earned - external investments 6,842 5,203 6,296 5,000 5,000 6,186 6,000 6,000 6,000
Interest earned - outstanding debtors
Dividends received
Fines
Licences and permits
Agency services
Transfers recognised - operational
Other revenue 105,646 129,727 237,080 127,581 127,581 132,000 137,000 146,316 156,265
Gains on disposal of PPE
Total Revenue (excluding capital transfers
and contributions) 112,488 134,930 243,376 132,581 132,581 138,186 143,000 152,316 162,265
Expenditure By Type
Employee related costs 46,156 48,898 42,326 44,659 44,659 40,256 42,962 45,480 48,147
Remuneration of Directors
Debt impairment – 528 691 – – –
Collection costs
Depreciation & asset impairment 33,833 1,179 1,250 35,618 35,618 6,247 6,560 6,888 7,232
Finance charges
Bulk purchases
Other materials
Contracted services 11,018 12,827 12,419 13,105 13,105 13,500 14,475 15,529 16,668
Transfers and grants
Other expenditure 66,823 68,088 117,683 91,891 91,891 77,154 78,639 84,208 90,091
Loss on disposal of PPE
Total Expenditure 157,831 131,520 174,369 185,273 185,273 137,157 142,636 152,105 162,138
Surplus/(Deficit) (45,342) 3,410 69,007 (52,692) (52,692) 1,029 364 211 127
Transfers recognised - capital
Contributions recognised - capital
Contributions of PPE
Surplus/(Deficit) after capital transfers &
contributions
(45,342) 3,410 69,007 (52,692) (52,692) 1,029 364 211 127
Taxation 1,136 15,186 298 106 61 37
Surplus/ (Deficit) for the year (45,342) 2,274 53,821 (52,692) (52,692) 731 258 150 90
209

ICC Durban (Pty) Ltd - Table D3 Capital Budget by vote and funding
2009/10 2010/11 2011/12Medium Term Revenue and Expenditure
Framework
R thousands
Multi-Year expenditure
Insert programme/projects description
Capital multi-year expenditure sub-total – – – – – – – – –
Single Year expenditure
Capital Expenditure for ICC operations 6,099 2,213 23,805 15,000 15,000 31,000 20,000 20,000 20,000
Capital single-year expenditure sub-total 6,099 2,213 23,805 15,000 15,000 31,000 20,000 20,000 20,000
Total Capital Expenditure 6,099 2,213 23,805 15,000 15,000 31,000 20,000 20,000 20,000
Funded by:
National Government
Provincial Government
Parent Municipality
District Municipality
Transfers recognised - capital – – – – – – – – –
Public contributions & donations
Borrowing
Internally generated funds 6,099 2,213 23,805 15,000 15,000 31,000 20,000 20,000 20,000
Total Capital Funding 6,099 2,213 23,805 15,000 15,000 31,000 20,000 20,000 20,000
Budget Year
2013/14
Budget Year
+1 2014/15
Budget Year
+2 2015/16
Vote DescriptionCurrent Year 2012/13
Audited
Outcome
Audited
Outcome
Audited
Outcome
Original
Budget
Adjusted
Budget
Full Year
Forecast
210

ICC Durban (Pty) Ltd - Table D4 Budgeted Financial Position
Description 2009/10 2010/11 2011/12Medium Term Revenue and Expenditure
Framework
R thousandsAudited
Outcome
Audited
Outcome
Audited
Outcome
Original
Budget
Adjusted
Budget
Full Year
Forecast
Budget Year
2013/14
Budget Year
+1 2014/15
Budget Year
+2 2015/16
ASSETS
Current assets
Cash 95,894 100,908 145,957 96,863 96,863 139,272 126,196 113,295 100,654
Call investment deposits
Consumer debtors
Other debtors 5,595 12,462 7,884 3,400 3,400 3,400 3,400 3,400 3,400
Current portion of long-term receivables
Inventory 1,191 1,438 1,217 1,200 1,200 1,200 1,200 1,200 1,200
Total current assets 102,680 114,808 155,059 101,463 101,463 143,872 130,796 117,895 105,254
Non current assets
Long-term receivables
Investments
Investment property
Property, plant and equipment 714,346 170,320 177,803 654,565 654,565 202,556 215,996 229,108 241,876
Agricultural assets
Biological assets
Intangible assets 569 393 277 1,883 1,883 1,883 1,883 1,883 1,883
Total non current assets 714,915 170,713 178,081 656,448 656,448 204,439 217,879 230,991 243,759
TOTAL ASSETS 817,595 285,521 333,140 757,911 757,911 348,312 348,676 348,887 349,014
LIABILITIES
Current liabilities
Bank overdraft
Borrowing
Consumer deposits
Trade and other payables 29,653 39,275 33,072 47,215 47,215 47,215 47,215 47,215 47,215
Provisions
Total current liabilities 29,653 39,275 33,072 47,215 47,215 47,215 47,215 47,215 47,215
Non current liabilities
Borrowing 226,590 226,590 226,590 226,590 226,590 226,590 226,590 226,590 226,590
Provisions
Total non current liabilities 226,590 226,590 226,590 226,590 226,590 226,590 226,590 226,590 226,590
TOTAL LIABILITIES 256,242 265,864 259,662 273,805 273,805 273,805 273,805 273,805 273,805
NET ASSETS 561,353 19,656 73,478 484,106 484,106 74,507 74,871 75,082 75,209
COMMUNITY WEALTH/EQUITY
Accumulated Surplus/(Deficit) 561,353 19,656 73,478 484,106 484,106 74,507 74,871 75,082 75,209
Reserves
Share capital
TOTAL COMMUNITY WEALTH/EQUITY 561,353 19,656 73,478 484,106 484,106 74,507 74,871 75,082 75,209
Current Year 2012/13
211

ICC Durban (Pty) Ltd - Table D5 Budgeted Cash Flow
Description 2009/10 2010/11 2011/12Medium Term Revenue and Expenditure
Framework
R thousandsAudited
Outcome
Audited
Outcome
Audited
Outcome
Original
Budget
Adjusted
Budget
Full Year
Forecast
Budget Year
2013/14
Budget Year
+1 2014/15
Budget Year
+2 2015/16
CASH FLOW FROM OPERATING ACTIVITIES
Receipts
Ratepayers and other 105,646 129,727 237,080 127,581 127,581 132,000 137,000 146,316 156,265
Government - operating
Government - capital
Interest 6,842 5,203 6,296 5,000 5,000 6,186 6,000 6,000 6,000
Dividends
Payments
Suppliers and employees (144,228) (132,130) (222,131) (196,675) (196,675) (175,871) (176,076) (185,217) (194,906)
Finance charges
Dividends paid
Transfers and Grants
NET CASH FROM/(USED) OPERATING ACTIVITIES (31,740) 2,800 21,245 (64,094) (64,094) (37,685) (33,076) (32,901) (32,641)
CASH FLOWS FROM INVESTING ACTIVITIES
Receipts
Proceeds on disposal of PPE
Decrease (Increase) in non-current debtors
Decrease (increase) other non-current receivables
Decrease (increase) in non-current investments
Payments
Capital assets 6,099 2,213 23,805 15,000 15,000 31,000 20,000 20,000 20,000
NET CASH FROM/(USED) INVESTING ACTIVITIES 6,099 2,213 23,805 15,000 15,000 31,000 20,000 20,000 20,000
CASH FLOWS FROM FINANCING ACTIVITIES
Receipts
Short term loans
Borrowing long term/refinancing
Increase (decrease) in consumer deposits
Payments
Repayment of borrowing
NET CASH FROM/(USED) FINANCING ACTIVITIES – – – – – – – – –
NET INCREASE/ (DECREASE) IN CASH HELD (25,641) 5,013 45,050 (49,094) (49,094) (6,685) (13,076) (12,901) (12,641)
Cash/cash equivalents at the year begin: 121,535 95,894 100,908 145,957 145,957 145,957 139,272 126,196 113,295
Cash/cash equivalents at the year end: 95,894 100,908 145,957 96,863 96,863 139,272 126,196 113,295 100,654
Current Year 2012/13
212

ICC Durban (Pty) Ltd - Supporting Table SD2 Financial and non-financial indicators
2009/10 2010/11 2011/12Medium Term Revenue and Expenditure
Framework
Borrowing Management
Borrowing to Asset Ratio Total Long-term Borrowing/ Total Assets 27.7% 79.4% 68.0% 29.9% 29.9% 65.1% 65.0% 64.9% 64.9%
Capital Charges to
Operating Expenditure
Finance charges & Depreciation /
Operating Expenditure
0% 0% 0% 0% 0% 0% 0% 0% 0%
Borrowed funding of
capital expenditure
Borrowing/Capital expenditure excl.
transfers and grants and contributions
0.0% 0.0% 0.0% 0.0% 0.0% 0.0% 0.0% 0.0% 0.0%
Safety of Capital
Debt to Equity Loans, Accounts Payable, Overdraft &
Tax Provision / Funds & Reserves
45.6% 1352.6% 353.4% 56.6% 56.6% 367.5% 365.7% 364.7% 364.1%
Gearing Long Term Borrowing / Funds &
Reserves
40% 1153% 308% 47% 47% 304% 303% 302% 301%
Liquidity
Current Ratio Current assets / current liabilities 3.46 2.92 4.69 2.15 2.15 3.05 2.77 2.50 2.23
Current Ratio adjusted
for debtors
Current assets/current liabilities less
debtors > 90 days
3.46 2.92 4.69 2.15 2.15 3.05 2.77 2.50 2.23
Liquidity Ratio Monetary Assets / Current Liabilities 3.23 2.57 4.41 2.05 2.05 2.95 2.67 2.40 2.13
Revenue Management
Annual Debtors
Collection Rate
(Payment Level %)
Last 12 Mths Receipts / Last 12 Mths
Billing
100% 100% 100% 100% 100% 100% 100% 100%
Outstanding Debtors to
Revenue
Total Outstanding Debtors to Annual
Revenue
5% 9% 3% 3% 3% 2% 2% 2% 2%
Longstanding Debtors
Reduction Due To
Recovery
Debtors > 12 Mths Recovered / Total
Debtors > 12 Months Old
Creditors Management
Creditors System
Efficiency
% of Creditors Paid Within Terms (within
MFMA s 65(e))
Funding of Provisions
Percentage Of
Provisions Not Funded
Unfunded Provisions/Total Provisions
Other Indicators
Electricity Distribution
Losses
% Volume (Total units purchased +
generated less total units sold)/Total
units purchased + generated
Water Distribution
Losses
% Volume (Total units purchased + own
source less total units sold)/Total units
purchased + own source
Employee costs Employee costs/Total Revenue - capital
revenue
41.0% 36.2% 17.4% 34% 34% 29% 30% 30% 30%
Repairs & Maintenance R&M/Total Revenue - capital revenue 0.0% 0.0% 0.0% 0% 0% 0% 0% 0% 0%
Interest & Depreciation I&D/Total Revenue - capital revenue 0.0% 0.4% 0.3% 0% 0% 0% 0% 0% 0%
indicators
i. Debt coverage (Total Operating Revenue - Operating
Grants)/Debt service payments due
within financial year)
- - - - - - - - -
ii. O/S Service Debtors to
Revenue
Total outstanding service debtors/annual
revenue received for services
0% 0.0% 0.0% 0% 0% 0% 0% 0% 0%
iii. Cost coverage (Available cash + Investments)/monthly
fixed operational expenditure
129% 1.3 1.4 1.1 1.1 1.8 1.5 1.3 1.1
Budget Year
2013/14
Budget Year
+1 2014/15
Budget Year
+2 2015/16
Description of indicator Basis of calculationCurrent Year 2012/13
Audited
Outcome
Audited
Outcome
Audited
Outcome
Original
Budget
Adjusted
Budget
Full Year
Forecast
213

ICC Durban (Pty) Ltd - Supporting Table SD4 Board member allowances and staff benefits
2009/10 2010/11 2011/12 Current Year 2012/13Medium Term Revenue and Expenditure
Framework
R thousands A B C D E F G H I
Remuneration
Board Members of Entities
Basic Salaries
Pension Contributions
Medical Aid Contributions
Motor vehicle allowance
Cell phone allowance
Housing allowance
Other benefits and allowances
In-kind benefits
Board Fees 46 159 186 37 37 159 159 159 159
Sub Total - Board Members of Entities 46 159 186 37 37 159 159 159 159
% increase 0 0 (0) (0) (0) 0% 0% 0%
Senior Managers of Entities
Basic Salaries 4,378 4,845 4,887 6,744 6,303 5,621 6,213 6,586 6,981
Pension Contributions 497 356 273 631 590 298 387 410 435
Medical Aid Contributions 86 61 66 66 70 74
Motor vehicle allowance 242 – 76 71 – – – –
Cell phone allowance
Housing allowance
Performance Bonus 221 – 258 1,264 1,182 572 572 612 655
Other benefits or allowances
In-kind benefits
Sub Total - Senior Managers of Entities 5,338 5,287 5,479 8,715 8,145 6,558 7,238 7,678 8,145
% increase (0) 0 0 0 0 10% 6% 6.1%
Other Staff of Entities
Basic Salaries 36,609 43,359 37,495 24,308 22,709 22,705 24,211 25,745 27,375
Pension Contributions 1,333 1,970 1,743 856 800 1,955 2,092 2,238 2,395
Medical Aid Contributions 1,034 1,007 885 290 271 1,257 1,345 1,439 1,539
Motor vehicle allowance
Cell phone allowance
Housing allowance
Overtime 76 123 117 132 132 136 150 161 172
Performance Bonus 97 619 873 1,690 1,580 2,149 2,162 2,169 2,172
Other benefits or allowances 1,826 1,886 1,679
In-kind benefits
Sub Total - Other Staff of Entities 40,975 48,963 42,793 27,276 25,492 28,201 29,959 31,752 33,653
% increase 0 (0) -36% -40% -34% 6% 6% 6%
Total Municipal Entities remuneration 46,359 54,409 48,458 36,028 33,674 34,918 37,356 39,589 41,957
Adjusted
Budget
Full Year
Forecast
Budget Year
2013/14
Budget Year
+1 2014/15
Budget Year
+2 2015/16
Summary of Employee and Board Member
remuneration Audited
Outcome
Audited
Outcome
Audited
Outcome
Original
Budget
214

ICC Durban (Pty) Ltd - Supporting Table SD5 Summary of personnel numbers
Summary of Personnel Numbers
Number PositionsPermanent
employees
Contract
employeesPositions
Permanent
employees
Contract
employeesPositions
Permanent
employees
Contract
employees
Municipal Council and Boards of Municipal Entities
Councillors (Political Office Bearers plus Other Councillors)
Board Members of municipal entities 6 6 – 6 6 – 6 6 –
Municipal entity employees
CEO and Senior Managers 6 5 1 6 5 1 6 6 –
Other Managers 16 16 – 16 16 – 18 18 –
Professionals – – – – – – – – –
Finance
Spatial/town planning
Information Technology
Roads
Electricity
Water
Sanitation
Refuse
Other 96 56 40 96 56 40 82 82 –
Technicians – – – – – – – – –
Finance
Spatial/town planning
Information Technology
Roads
Electricity
Water
Sanitation
Refuse
Other
Clerks (Clerical and administrative)
Service and sales workers
Skilled agricultural and fishery workers
Craft and related trades
Plant and Machine Operators
Elementary Occupations
Total Personnel Numbers 124 83 41 124 83 41 112 112 –
% increase (33.1%) (50.6%) 202.4% 102.4% – 173.2% – (100.0%)
Total entity employees headcount
Finance personnel headcount
Human Resources personnel headcount
2011/12 Current Year 2012/13 Budget Year 2013/14
215

ICC Durban (Pty) Ltd - Supporting Table SD6 Budgeted monthly cash and revenue/expenditure
Budget Year 2013/14Medium Term Revenue and Expenditure
Framework
July August Sept. October November December January February March April May June
R thousands
Revenue By Source
Service charges – – – –
Rental of facilities and equipment – – – –
Other revenue 11,917 11,917 11,917 11,917 11,917 11,917 11,917 11,917 11,917 11,917 11,917 11,917 143,000 152,316 162,265
Gains on disposal of PPE – – – –
Total Revenue 11,917 11,917 11,917 11,917 11,917 11,917 11,917 11,917 11,917 11,917 11,917 11,917 143,000 152,316 162,265
Expenditure By Type
Employee related costs 3,580 3,580 3,580 3,580 3,580 3,580 3,580 3,580 3,580 3,580 3,580 3,580 42,962 45,480 48,147
Remuneration of Board Members – – – – – – – – – – – – – – –
Debt impairment – – – – – – – – – – – – – – –
Collection costs – – – – – – – – – – – – – – –
Depreciation & asset impairment 547 547 547 547 547 547 547 547 547 547 547 547 6,560 6,888 7,232
Finance charges – – – – – – – – – – – – – – –
Bulk purchases – – – – – – – – – – – – – – –
Other materials – – – – – – – – – – – – – – –
Contracted services 1,206 1,206 1,206 1,206 1,206 1,206 1,206 1,206 1,206 1,206 1,206 1,206 14,475 15,529 16,668
Transfers and grants – – – – – – – – – – – – – – –
Other expenditure 6,553 6,553 6,553 6,553 6,553 6,553 6,553 6,553 6,553 6,553 6,553 6,553 78,639 84,208 90,091
Loss on disposal of PPE – – – – – – – – – – – – – – –
Total Expenditure 11,886 11,886 11,886 11,886 11,886 11,886 11,886 11,886 11,886 11,886 11,886 11,886 142,636 152,105 162,138
Capital expenditure
Capital assets 833 833 833 833 833 833 833 833 833 833 833 10,833 20,000 20,000 20,000
Total capital expenditure 833 833 833 833 833 833 833 833 833 833 833 10,833 20,000 20,000 20,000
Cash flow
Ratepayers and other 12,287 12,287 12,287 12,287 12,287 12,287 12,287 12,287 12,287 12,287 12,287 1,839 137,000 146,316 156,265
Grants – – – – – – – – – – – – – – –
Interest 600 600 600 600 600 600 600 600 600 600 600 (600) 6,000 6,000 6,000
Suppliers, employees and other (15,632) (15,632) (15,632) (15,632) (15,632) (15,632) (15,632) (15,632) (15,632) (15,632) (15,632) (4,123) (176,076) (185,217) (194,906)
Finance charges – – – – – – – – – – – – – – –
Dividends paid – – – – – – – – – – – – – – –
NET CASH FROM/(USED) OPERATING ACTIVITIES (2,745) (2,745) (2,745) (2,745) (2,745) (2,745) (2,745) (2,745) (2,745) (2,745) (2,745) (2,884) (33,076) (32,901) (32,641)
Decrease (increase) other non-current receivables – – – – – – – – – – – – – – –
Decrease (increase) in non-current investments – – – – – – – – – – – – – – –
Proceeds on disposal of PPE – – – – – – – – – – – – – – –
Capital assets 1,667 1,667 1,667 1,667 1,667 1,667 1,667 1,667 1,667 1,667 1,667 1,667 20,000 20,000 20,000
NET CASH FROM/(USED) INVESTING ACTIVITIES 1,667 1,667 1,667 1,667 1,667 1,667 1,667 1,667 1,667 1,667 1,667 1,667 20,000 20,000 20,000
Borrowing long term/refinancing/short term – – – – – – – – – – – – – – –
Repayment of borrowing – – – – – – – – – – – – – – –
Increase in consumer deposits – – – – – – – – – – – – – – –
NET CASH FROM/(USED) FINANCING ACTIVITIES – – – – – – – – – – – – – – –
NET INCREASE/ (DECREASE) IN CASH HELD (1,078) (1,078) (1,078) (1,078) (1,078) (1,078) (1,078) (1,078) (1,078) (1,078) (1,078) (1,217) (13,076) (12,901) (12,641)
Description
Budget Year
2013/14
Budget Year
+1 2014/15
Budget Year
+2 2015/16
216

ICC Durban (Pty) Ltd - Supporting Table SD7a Capital expenditure on new assets by asset class
2009/10 2010/11 2011/12 Current Year 2012/13Medium Term Revenue and Expenditure
Framework
R thousands
Capital expenditure on new assets by asset category
Infrastructure – – – – – – – – –
Infrastructure - Road transport – – – – – – – – –
Roads, Pavements & Bridges
Storm water
Infrastructure - Electricity – – – – – – – – –
Generation
Transmission & Reticulation
Street Lighting
Infrastructure - Water – – – – – – – – –
Dams & Reservoirs
Water purification
Reticulation
Infrastructure - Sanitation – – – – – – – – –
Reticulation
Sewerage purification
Infrastructure - Other – – – – – – – – –
Waste Management
Transportation
Gas
Community – – – – – – – – –
Parks & gardens
Sportsfields & stadia
Swimming pools
Community halls
Libraries
Recreational facilities
Fire, safety & emergency
Security and policing
Buses
Clinics
Museums & Art Galleries
Cemeteries
Social rental housing
Heritage assets – – – – – – – – –
Buildings
Investment properties – – – – – – – – –
Housing development
Other assets 6,099 2,213 23,805 15,000 15,000 31,000 20,000 20,000 20,000
General vehicles
Specialised vehicles
Plant & equipment
Computers - hardware/equipment
Furniture and other office equipment
Abattoirs
Markets
Civic Land and Buildings
Other Buildings
Other Land
Surplus Assets - (Investment or Inventory)
Other 6,099 2,213 23,805 15,000 15,000 31,000 20,000 20,000 20,000
Agricultural assets – – – – – – – – –
List sub-class
Biological assets – – – – – – – – –
List sub-class
Intangibles – – – – – – – – –
Computers - software & programming
Total capital expenditure on new assets 6,099 2,213 23,805 15,000 15,000 31,000 20,000 20,000 20,000
Specialised vehicles – – – – – – – – –
Refuse
Fire
Conservancy
Ambulances
Adjusted
Budget
Full Year
Forecast
Budget Year
2013/14
Budget Year
+1 2014/15
Budget Year
+2 2015/16
Description
Audited
Outcome
Audited
Outcome
Audited
Outcome
Original
Budget
217

ICC Durban (Pty) Ltd - Supporting Table SD8 Future financial implications of the capital expenditure budget
Medium Term Revenue and Expenditure
Framework
R thousands
Capital expenditure
Ongoing maintaince of the ICC complex 1 15,000 15,000 15,000 15,000 15,000 15,000 15,000
Total capital expenditure 15,000 15,000 15,000 15,000 15,000 15,000 15,000
Future operational costs by vote
Summarise future operational costs by program 2
Total future operational costs – – – – – – –
Future revenue by source
Summarise future revenue implications by revenue source 3
Total future revenue – – – – – – –
Net Financial Implications 15,000 15,000 15,000 15,000 15,000 15,000 15,000
Vote Description RefForecasts
Budget Year
2013/14
Budget Year
+1 2014/15
Budget Year
+2 2015/16
Forecast
2016/17
Forecast
2017/18
Forecast
2018/19Present value
218

�
�
�
�
�
���������
������ ���������
��������������
�
