medium term revenue and expenditure framework
TRANSCRIPT

1
MTREF 2020/2021 – 2022/2023
Medium Term Revenue and
Expenditure Framework
Adjustments Budget 2020/2021 to 2022/2023

2
MTREF 2020/2021 – 2022/2023
Table of Contents Glossary ................................................................................... 3
PART 1 – ADJUSTMENTS BUDGET ................................................. 5
Section 1 – Mayor’s Report ............................................................. 5
Section 2 – Resolutions ................................................................. 6
Section 3 – Executive Summary ....................................................... 7
PART 2 – SUPPORTING DOCUMENTATION ..................................... 10
Section 5 – Adjustments to budget assumptions .................................. 10
Section 6 – Adjustments to budget funding ......................................... 10
Section 7 – Adjustments to expenditure on allocations and grant programmes11
Section 8 – Adjustments to allocations or grants made by the municipality ... 11
Section 9 – Adjustments to councillors and board members allowances and employee benefits ...................................................................... 11
Section 10 – Adjustments to service delivery and budget implementation plan 11
Section 11 Municipal Manager’s quality certification .............................. 12

3
MTREF 2020/2021 – 2022/2023
Glossary
Adjustments Budget – Prescribed in section 28 of the MFMA. The formal means by which a municipality may revise its annual budget during the year.
Allocations – Money received from Provincial or National Government or other municipalities.
AFS – Annual Financial Statements.
Budget – The financial plan of the Municipality.
Budget Related Policy – Policy of a municipality affecting or affected by the budget, examples include tariff policy, rates policy and credit control and debt collection policy.
Capital Expenditure - Spending on assets such as land, buildings and machinery. Any capital expenditure must be reflected as an asset on the Municipality’s Statement of Financial Performance.
Cash Flow Statement – A statement showing when actual cash will be received and spent by the Municipality. Cash payments do not always coincide with budgeted expenditure timings. For example, when an invoice is received by the Municipality it is shown as expenditure in the month it is received, even though it may not be paid in the same period.
CFO – Chief Financial Officer
DORA – Division of Revenue Act. Annual legislation that shows the total allocations made by national to provincial and local government.
Equitable Share – A general grant paid to municipalities. It is predominantly targeted to help with free basic services.
Fruitless and wasteful expenditure – Expenditure that was made in vain and would have been avoided had reasonable care been exercised.
GFS – Government Finance Statistics. An internationally recognised classification system that facilitates like for like comparison between municipalities.
GRAP – Generally Recognised Accounting Practice. The new standard for municipal accounting and basis upon which AFS are prepared.
IDP – Integrated Development Plan. The main strategic planning document of the Municipality
KPI’s – Key Performance Indicators. Measures of service output and/or outcome.
MFMA – The Municipal Finance Management Act – No. 53 of 2003. The principle piece of legislation relating to municipal financial management.
MTREF – Medium Term Revenue and Expenditure Framework. A medium term financial plan, usually 3 years, based on a fixed first year and indicative further two years budget allocations. Also includes details of the previous three years and current years’ financial position.
NT – National Treasury
Net Assets – Net assets are the residual interest in the assets of the entity after deducting all its liabilities. This means the net assets of the municipality equates to the "net wealth" of the municipality, after all assets were sold/recovered and all liabilities paid. Transactions which do not meet the definition of Revenue or Expenses, such as increases in values of Property, Plant and Equipment where there is no inflow or outflow of resources are accounted for in Net Assets.
Operating Expenditure – Spending on the day to day expenses of the Municipality such as salaries and wages.
Rates – Local Government tax based on the assessed value of a property. To determine the rates payable, the assessed rateable value is multiplied by the rate in the rand.
R&M – Repairs and maintenance on property, plant and equipment.

4
MTREF 2020/2021 – 2022/2023
SCM – Supply Chain Management.
SDBIP – Service Delivery and Budget Implementation Plan. A detailed plan comprising quarterly performance targets and monthly budget estimates.
Strategic Objectives – The main priorities of the Municipality as set out in the IDP. Budgeted spending must contribute towards the achievement of the strategic objectives.
Unauthorised expenditure – Generally, expenditure without, or in excess of, an approved budget.
Virement – A transfer of budget.
Virement Policy – The policy that sets out the rules for budget transfers.
Vote – One of the main segments into which a budget is divided. In Witzenberg Municipality the following votes and responsible senior manager was approved:
• Budget & Treasury Office – Director: Financial services
• Civil Services - Director: Technical services
• Community & Social Services – Director: Community services
• Corporate Services – Director: Corporate services
• Electro Technical Services - Director: Technical services
• Executive & Council – Municipal Manager
• Housing– Director: Community services
• Planning - Director: Technical services
• Public Safety– Director: Community services
• Sport & Recreation– Director: Community services


6
MTREF 2020/2021 – 2022/2023
Section 2 – Resolutions
ADJUSTMENTS MTREF 2020/2021 The resolutions tabled at Council for consideration with approval of the adjustments budget will be: RECOMMENDATION: a) That the adjustment budget of Witzenberg Municipality for the financial year 2020/2021 as set out in the
budget documents for be approved:
i. Table B1 - Budget summary; ii. Table B2 - Adjustments Budget Financial Performance (by standard classification); iii. Table B3 - Budgeted Financial performance (Revenue and Expenditure) by Vote; iv. Table B4 - Adjustments Budget Financial Performance (revenue by source); and v. Table B5 - Budgeted Capital Expenditure by Vote, standard classification and funding.
(b) That the monthly and quarterly financial targets of the service delivery and budget implementation plan be
adjusted to correspond with the approved adjustments budget figures.

7
MTREF 2020/2021 – 2022/2023
Section 3 – Executive Summary 3.1 Introduction Adjustments to both the operating and capital budget are required to make provision for adjustments in expected expenditure and certain capital projects for the financial year Operational budget The operational budget has been adjusted to include the recognition and/or de-recognition of any capital grants in respect of projects. The most notable adjustment relates to the inclusion of the Regional Bulk Infrastructure Grant (RBIG) for the construction of the Tulbagh Dam. In summary the operating budget has been adjusted as follow: Revenue Adjustments In terms of revenue adjustments the most notable can be summarised as follow:
Department Description Funding Amount
Fire Protection Services Transfers Recognized FIRE -R721 739
Solid Waste (Removal) Transfers Recognized Belgium -R501 456
Water Distribution Transfers Recognized District -R500 000
LED Transfers Recognized DEDAT -R1 445 346
Treasury Administration Transfers Recognized Covid-19- District --R1 519 619
Treasury Administration Transfers Recognized Covid-19-District
Community Safety -R669 620
Treasury Administration Transfers Recognized Covid -19 – Local Govt. -R800 000
Town Planning Transfers Recognized RSEP -R454 851
Roads Transfers Recognized RSEP -R3 478 000
Total Operational Revenue Budget Adjustment -R10 090 630
Expenditure Adjustments In terms of expenditure adjustments and the most notable can be summarised as follow:
Department Description Funding Amount
Town Planning Infrastructure and Planning:Architectural
RSEP R454 851
Cemeteries Contracted Services Property Rates: Levies R160 000
Electricity: Administration Contracted Services Electricity R2 000 000
Treasury Administration Disaster Management Covid19-District Community Safety
R669 620
Treasury Administration Disaster Management Covid 19 - Local Govt. R800 000
Treasury Administration Disaster Management Covid 19 - District R1 167 128
Treasury Administration Disaster Management Covid 19i - District R250 000
Total Operational Expenditure Budget Adjustment R5 501 599
The total adjustments are summarised in supporting table B4-Financial Performance

8
MTREF 2020/2021 – 2022/2023
Capital budget In terms of capital expenditure adjustments and the most notable can be summarised as follow:
Department Description Funding Amount
Community Facilities 3X3 M CONTAINER CRR R410 416
Fire Protection Services Capex Firefighting Response Vehicle FIRE R721 739
Fire Protection Services Capex Firefighting Equipment CRR R64 003
L E D Capex Skoonvlei Economic Hub CRR R32 413
L E D Capex Skoonvlei Economic Hub DEDAT R1 445 346
Electricity: Administration Capex Electrical Network Housing Project CRR R434 781
Council Cost Capex Fencing CRR R850 000
Solid Waste (Removal) CapexTransfer stations & related infrastructure Belgium R501 456
Solid Waste Capex New Material Recovery Facility/Drop Off CRR R655 587
Roads Capex Upgrade pavement Vosstr from Retief CRR R945 715
Roads Capex Pavement Upgrading District R500 000
Administration CAPEX: Upgrade Council chambers CRR R 1430 000
Treasury Administration CAPEX Quad Bike û Covid-19 Response Covid19 - District R70 000
Treasury Administration CAPEX: It Equipment Covid19 - District R190
Treasury Administration CAPEX Sanitizing Equipment Covid19 - District R32 300
Mechanical Workshop Capex Tools & Equipment CRR R20 000
Roads Capex Pedestrian Route along R46/Nduli RSEP R870 000
Roads Capex Upgrade pavement Vosstr from Retief to edge
RSEP R2 608 000
Total Capital Budget Adjustment R11 591 946
3.2 Provision of basic services The provision of basic services will be improved by the approval of the adjustment budget. 3.3 Effect of the adjustments budget 3.3.1 Service delivery and budget implementation plan Except for the adjustment of the monthly revenue and expenditure targets the impact to the SDBIP is minimal. No non-financial performance targets have been adjusted. 3.3.2 Service delivery agreements Tenders already approved in the previous financial year will be able to be completed by the approval of the adjustments budget. 3.3.3 Medium term revenue and expenditure framework Except for the depreciation charges of the additional capital expenditure the impact to the outer years is minimal. 3.3.4 Long term financial sustainability The approval of the adjustment budget will have no effect on the long term financial sustainability of the municipality.

9
MTREF 2020/2021 – 2022/2023
3.4 Adjustment highlights The adjustments budget seeks to comply with section 28 of the MFMA. Therefore all adjustments are discussed according to the sub-sections of Section 28(2) of the MFMA. 3.4.1 Correction of expenditure. No material correction 3.4.2 Appropriation of additional revenues Additional appropriations are only in terms of the roll-over funding already received 3.4.3 Authorisation of unforeseen and unavoidable expenditure No material items. 3.4.4 Utilisation of project savings between votes No material items. 3.4.5 Correction of errors in annual budget No material items 3.4.6 Roll-over of unspent funds The approval of the unspent roll-overs will have a direct impact on the cash balance of the municipality, however it also reduce any unspent liability that may become due and payable to the relevant transferring department. Approval of the unspent funds will accelerate service delivery to the community,

10
MTREF 2020/2021 – 2022/2023
PART 2 – SUPPORTING DOCUMENTATION
Section 5 – Adjustments to budget assumptions Revenue There are no changes to the budget assumptions for operating revenue. Expenditure There are no changes to the budget assumptions for operating expenditure.
Section 6 – Adjustments to budget funding 6.1 Summary of the impact of the adjustments budget 6.1.1 Funding of operating and capital expenditure The grant funded projects will finance themselves. The impact on own funds is estimated at R 7 million which will be funded from accumulated surplus. 6.1.2 Financial plans No amendments. 6.1.2 Reserves The only reserve that is cash backed at this stage is the capital replacement reserve. 6.1.3 Financial sustainability of the municipality The financial sustainability of the municipality remains positive as the municipality is enjoying a positive bank balance whilst the cost coverage ratio and liquidity ratios remains within acceptable norms
6.2 Expenditure funded in accordance with MFMA section 18 No additional new loans included in the budget. 6.3 Adjustments to collection levels estimated None 6.4 Adjustments to the monetary investments No major adjustments. 6.5 Adjustments to contributions and donations in cash or in-kind None 6.6 Adjustments related to proceeds from the sale of assets None

11
MTREF 2020/2021 – 2022/2023
6.7 Adjustments related to proceeds from the lease of assets, where the period of the lease is three years or more;
None 6.8 Adjustments related to the planned use of previous years' cash backed accumulated surplus None 6.9 Adjustments related to new proposed loans to be raised in the budget year None
Section 7 – Adjustments to expenditure on allocations and grant programmes Disclosure on expenditure on allocations and grant programmes is included in supporting table SB7. Operating Gants will be adjusted by R3, 4 million whilst Capital Grants will be adjusted by R30, 5 million
Section 8 – Adjustments to allocations or grants made by the municipality None The revenue foregone over the MTREF is included in Table B10.
Section 9 – Adjustments to councillors and board members allowances and employee benefits None.
Section 10 – Adjustments to service delivery and budget implementation plan 10.1 Quarterly service delivery targets and performance indicators in the SDBIP No adjustments were made to any non-financial indicators. 10.2 Key financial indicators No adjustments were made to the key financial indicators. 10.3 Monthly targets for revenue, expenditure and cash flow No major adjustments to monthly revenue and expenditure. Cash flows are expected to decrease in accordance with the recommended adjustments.


WC022 Witzenberg - Table B1 Adjustments Budget Summary - 25 Augustus
Budget Year
+1 2021/22
Budget Year
+2 2022/23
Original
Budget
Prior
Adjusted
Accum.
Funds
Multi-year
capital
Unfore.
Unavoid.
Nat. or Prov.
Govt
Other
Adjusts.Total Adjusts.
Adjusted
Budget
Adjusted
Budget
Adjusted
Budget
1 2 3 4 5 6 7 8
R thousands A A1 B C D E F G H
Financial Performance
Property rates 76 388 76 388 – – – – – – 76 388 81 736 85 822
Service charges 341 732 341 732 – – – – – – 341 732 363 745 396 708
Investment revenue 9 129 9 129 – – – – – – 9 129 9 586 9 089
Transfers recognised - operational 116 989 116 989 – – – – 3 354 3 354 120 343 125 089 166 900
Other own revenue 46 486 46 486 – – – – – – 46 486 56 503 56 520
Total Revenue (excluding capital transfers and
contributions)
590 725 590 725 – – – – 3 354 3 354 594 079 636 657 715 040
Employee costs 226 182 226 182 – – – – – – 226 182 242 401 262 678
Remuneration of councillors 12 032 12 032 – – – – – – 12 032 12 633 13 265
Depreciation & asset impairment 40 688 40 688 – – – – – – 40 688 42 918 42 918
Finance charges 9 181 9 181 – – – – – – 9 181 9 635 10 108
Materials and bulk purchases 252 289 251 674 – – – – 1 183 1 183 252 857 273 296 300 554
Transfers and grants 2 179 2 179 – – – – – – 2 179 1 859 32 976
Other expenditure 139 944 140 559 – – – – 4 331 4 331 144 890 146 713 153 439
Total Expenditure 682 493 682 493 – – – – 5 514 5 514 688 008 729 455 815 938
Surplus/(Deficit) (91 768) (91 768) – – – – (2 160) (2 160) (93 928) (92 798) (100 898)
Transfers recognised - capital 78 716 78 716 – – – – 6 248 6 248 84 964 120 459 28 167
Contributions recognised - capital & contributed assets – – – – – – 501 501 501 – –
Surplus/(Deficit) after capital transfers &
contributions
(13 052) (13 052) – – – – 4 589 4 589 (8 463) 27 661 (72 732)
Share of surplus/ (deficit) of associate – – – – – – – – – – –
Surplus/ (Deficit) for the year (13 052) (13 052) – – – – 4 589 4 589 (8 463) 27 661 (72 732)
Capital expenditure & funds sources
Capital expenditure 88 764 88 764 – – – – 11 592 11 592 100 356 134 196 38 340
Transfers recognised - capital 78 716 78 716 – – – – 6 749 6 749 85 465 120 459 28 167
Public contributions & donations – – – – – – – – – – –
Borrowing – – – – – – – – – – –
Internally generated funds 10 048 10 048 – – – – 4 843 4 843 14 891 13 737 10 173
Total sources of capital funds 88 764 88 764 – – – – 11 592 11 592 100 356 134 196 38 340
Financial position
Total current assets 108 824 192 559 – – – – (7 003) (7 003) 185 556 156 225 122 358
Total non current assets 1 049 210 1 044 563 – – – – 8 114 8 114 1 052 677 1 143 955 1 139 376
Total current liabilities 130 550 205 180 – – – – – – 205 180 231 991 258 802
Total non current liabilities 185 378 170 101 – – – – – – 170 101 177 576 185 050
Community wealth /Equity 842 106 861 842 – – – – 1 111 1 111 862 953 890 613 817 882
Cash flows
Net cash from (used) operating 62 440 74 129 – – – – 1 111 1 111 75 240 115 485 15 832
Net cash from (used) investing (88 764) (88 764) – – – – (8 114) (8 114) (96 878) (134 196) (38 340)
Net cash from (used) financing (1 500) – – – – – – – – – –
Cash/cash equivalents at the year end 38 463 114 319 – – – – (7 003) (7 003) 107 316 88 606 66 098
Cash backing/surplus reconciliation
Cash and investments available 38 462 114 319 – – – – (7 003) (7 003) 107 316 88 606 66 098
Application of cash and investments 859 288 962 980 – – – – 1 111 1 111 964 091 1 001 829 939 545
Balance - surplus (shortfall) (820 826) (848 661) – – – – (8 114) (8 114) (856 775) (913 223) (873 447)
Asset Management
Asset register summary (WDV) 1 048 835 1 048 835 – – – – 15 070 15 070 1 063 904 1 134 954 1 039 098
Depreciation & asset impairment 40 688 40 688 – – – – – – 40 688 42 918 42 918
Renewal of Existing Assets 4 900 4 900 – – – – 1 430 1 430 6 330 – 5 000
Repairs and Maintenance 18 282 18 582 – – – – – – 18 582 19 454 20 350
Free services
Cost of Free Basic Services provided 6 451 6 451 – – – – – – 6 451 6 513 6 579
Revenue cost of free services provided 44 994 44 994 – – – – – – 44 994 47 918 50 672
Households below minimum service level
Water: – – – – – – – – – – –
Sanitation/sewerage: – – – – – – – – – – –
Energy: – – – – – – – – – – –
Refuse: – – – – – – – – – – –
Budget Year 2020/21
Description
Prepared by : SAMRASm
Date : 2020/08/20 11:54 AM
13

WC022 Witzenberg - Table B2 Adjustments Budget Financial Performance (functional classification) - 25 Augustus
Budget Year
+1 2021/22
Budget Year
+2 2022/23
Original
BudgetPrior Adjusted Accum. Funds
Multi-year
capital
Unfore.
Unavoid.
Nat. or Prov.
GovtOther Adjusts. Total Adjusts.
Adjusted
Budget
Adjusted
Budget
Adjusted
Budget
5 6 7 8 9 10 11 12
R thousands 1, 4 A A1 B C D E F G H
Revenue - Functional
Governance and administration 101 030 101 030 – – – – 3 002 3 002 104 031 107 085 108 722
Executive and council – – – – – – – – – – –
Finance and administration 101 030 101 030 – – – – 3 002 3 002 104 031 107 085 108 722
Internal audit – – – – – – – – – – –
Community and public safety 142 111 142 111 – – – – 722 722 142 833 158 967 207 957
Community and social services 114 880 114 880 – – – – – – 114 880 124 046 139 475
Sport and recreation 1 805 1 805 – – – – – – 1 805 8 218 8 629
Public safety 24 912 24 912 – – – – 722 722 25 634 26 158 28 251
Housing 514 514 – – – – – – 514 545 31 603
Health – – – – – – – – – – –
Economic and environmental services 20 173 20 173 – – – – 1 945 1 945 22 118 48 799 13 382
Planning and development 2 512 2 512 – – – – 1 445 1 445 3 958 2 627 2 745
Road transport 17 647 17 647 – – – – 500 500 18 147 46 159 10 626
Environmental protection 13 13 – – – – – – 13 14 10
Trading services 406 013 406 013 – – – – 501 501 406 514 447 627 419 007
Energy sources 265 685 265 685 – – – – – – 265 685 292 773 321 385
Water management 64 856 64 856 – – – – – – 64 856 80 584 50 959
Waste water management 43 424 43 424 – – – – – – 43 424 43 164 21 550
Waste management 32 047 32 047 – – – – 501 501 32 549 31 105 25 113
Other 115 115 – – – – – – 115 120 126
Total Revenue - Functional 2 669 441 669 441 – – – – 6 170 6 170 675 612 762 599 749 194
Expenditure - Functional
Governance and administration 150 869 150 869 – – – – 2 899 2 899 153 768 159 136 169 632
Executive and council 30 612 30 612 – – – – – – 30 612 32 525 34 529
Finance and administration 117 451 117 451 – – – – 2 899 2 899 120 351 123 618 131 904
Internal audit 2 805 2 805 – – – – – – 2 805 2 993 3 199
Community and public safety 107 225 107 207 – – – – 160 160 107 367 112 367 150 506
Community and social services 28 760 28 742 – – – – 160 160 28 902 28 492 30 073
Sport and recreation 30 457 30 457 – – – – – – 30 457 32 703 34 934
Public safety 42 200 42 200 – – – – – – 42 200 44 954 47 809
Housing 5 807 5 807 – – – – – – 5 807 6 218 37 690
Health – – – – – – – – – – –
Economic and environmental services 38 426 38 444 – – – – – – 38 444 39 446 41 801
Planning and development 12 992 13 010 – – – – – – 13 010 12 392 13 362
Road transport 23 425 23 425 – – – – – – 23 425 24 883 26 096
Environmental protection 2 009 2 009 – – – – – – 2 009 2 171 2 343
Trading services 385 015 385 015 – – – – 2 000 2 000 387 015 417 504 452 945
Energy sources 268 463 268 463 – – – – 2 000 2 000 270 463 293 366 322 093
Water management 35 733 35 733 – – – – – – 35 733 37 962 39 776
Waste water management 34 766 34 766 – – – – – – 34 766 37 044 38 992
Waste management 46 053 46 053 – – – – – – 46 053 49 131 52 084
Other 959 959 – – – – – – 959 1 003 1 053
Total Expenditure - Functional 3 682 493 682 493 – – – – 5 059 5 059 687 553 729 455 815 938
Surplus/ (Deficit) for the year (13 052) (13 052) – – – – 1 111 1 111 (11 941) 33 143 (66 744)
Budget Year 2020/21
Standard Description Ref
Prepared by : SAMRASm
Date : 2020/08/20 11:54 AM
14

WC022 Witzenberg - Table B2 Adjustments Budget Financial Performance (functional classification) - B - 25 Augustus
Standard Classification Description RefBudget Year
+1 2021/22
Budget Year
+2 2022/23
Original
BudgetPrior Adjusted Accum. Funds
Multi-year
capital
Unfore.
Unavoid.
Nat. or Prov.
GovtOther Adjusts. Total Adjusts.
Adjusted
Budget
Adjusted
Budget
Adjusted
Budget
5 6 7 8 9 10 11 12
R thousand 1 A A1 B C D E F G H
Revenue - Functional
Municipal governance and administration 101 030 101 030 – – – – 3 002 3 002 104 031 107 085 108 722
Executive and council – – – – – – – – – – –
Mayor and Council – – – – – – – – – – –
Municipal Manager, Town Secretary and Chief Executive – – – – – – – – – – –
Finance and administration 101 030 101 030 – – – – 3 002 3 002 104 031 107 085 108 722
Administrative and Corporate Support 9 9 – – – – – – 9 9 10
Asset Management – – – – – – – – – – –
Finance 100 446 100 446 – – – – 3 002 3 002 103 448 106 472 108 078
Fleet Management – – – – – – – – – – –
Human Resources 552 552 – – – – – – 552 580 609
Information Technology – – – – – – – – – – –
Legal Services – – – – – – – – – – –
Marketing, Customer Relations, Publicity and Media Co-
ordination4 4 – – – – – – 4 5 5
Property Services – – – – – – – – – – –
Risk Management – – – – – – – – – – –
Security Services – – – – – – – – – – –
Supply Chain Management 18 18 – – – – – – 18 19 20
Valuation Service – – – – – – – – – – –
Internal audit – – – – – – – – – – –
Governance Function – – – – – – – – – – –
Community and public safety 142 111 142 111 – – – – 722 722 142 833 158 967 207 957
Community and social services 114 880 114 880 – – – – – – 114 880 124 046 139 475
Aged Care 104 406 104 406 – – – – – – 104 406 112 187 122 520
Agricultural – – – – – – – – – – –
Animal Care and Diseases – – – – – – – – – – –
Cemeteries, Funeral Parlours and Crematoriums 233 233 – – – – – – 233 383 5 076
Child Care Facilities – – – – – – – – – – –
Community Halls and Facilities 405 405 – – – – – – 405 1 102 939
Consumer Protection – – – – – – – – – – –
Cultural Matters – – – – – – – – – – –
Disaster Management – – – – – – – – – – –
Education – – – – – – – – – – –
Indigenous and Customary Law – – – – – – – – – – –
Industrial Promotion – – – – – – – – – – –
Language Policy – – – – – – – – – – –
Libraries and Archives 9 836 9 836 – – – – – – 9 836 10 375 10 940
Literacy Programmes – – – – – – – – – – –
Media Services – – – – – – – – – – –
Museums and Art Galleries – – – – – – – – – – –
Population Development – – – – – – – – – – –
Provincial Cultural Matters – – – – – – – – – – –
Theatres – – – – – – – – – – –
Zoo's – – – – – – – – – – –
Budget Year 2020/21
Prepared by : SAMRASm
Date : 2020/08/20 11:54 AM
15

Standard Classification Description RefBudget Year
+1 2021/22
Budget Year
+2 2022/23
Original
BudgetPrior Adjusted Accum. Funds
Multi-year
capital
Unfore.
Unavoid.
Nat. or Prov.
GovtOther Adjusts. Total Adjusts.
Adjusted
Budget
Adjusted
Budget
Adjusted
Budget
5 6 7 8 9 10 11 12
R thousand 1 A A1 B C D E F G H
Budget Year 2020/21
Sport and recreation 1 805 1 805 – – – – – – 1 805 8 218 8 629
Beaches and Jetties – – – – – – – – – – –
Casinos, Racing, Gambling, Wagering – – – – – – – – – – –
Community Parks (including Nurseries) – – – – – – – – – – –
Recreational Facilities 773 773 – – – – – – 773 8 048 8 450
Sports Grounds and Stadiums 1 032 1 032 – – – – – – 1 032 170 179
Public safety 24 912 24 912 – – – – 722 722 25 634 26 158 28 251
Civil Defence – – – – – – – – – – –
Cleansing – – – – – – – – – – –
Control of Public Nuisances – – – – – – – – – – –
Fencing and Fences – – – – – – – – – – –
Fire Fighting and Protection 6 6 – – – – 722 722 728 6 807
Licensing and Control of Animals – – – – – – – – – – –
Police Forces, Traffic and Street Parking Control 24 906 24 906 – – – – – – 24 906 26 152 27 444
Pounds – – – – – – – – – – –
Housing 514 514 – – – – – – 514 545 31 603
Housing 514 514 – – – – – – 514 545 31 603
Informal Settlements – – – – – – – – – – –
Health – – – – – – – – – – –
Ambulance – – – – – – – – – – –
Health Services – – – – – – – – – – –
Laboratory Services – – – – – – – – – – –
Food Control – – – – – – – – – – –
Health Surveillance and Prevention of Communicable
Diseases including immunizations– – – – – – – – – – –
Vector Control – – – – – – – – – – –
Chemical Safety – – – – – – – – – – –
Economic and environmental services 20 173 20 173 – – – – 1 945 1 945 22 118 48 799 13 382
Planning and development 2 512 2 512 – – – – 1 445 1 445 3 958 2 627 2 745
Billboards – – – – – – – – – – –
Corporate Wide Strategic Planning (IDPs, LEDs) – – – – – – – – – – –
Central City Improvement District – – – – – – – – – – –
Development Facilitation – – – – – – – – – – –
Economic Development/Planning – – – – – – 1 445 1 445 1 445 – –
Regional Planning and Development – – – – – – – – – – –
Town Planning, Building Regulations and Enforcement,
and City Engineer1 882 1 882 – – – – – – 1 882 1 977 2 075
Project Management Unit 630 630 – – – – – – 630 650 670
Provincial Planning – – – – – – – – – – –
Support to Local Municipalities – – – – – – – – – – –
Road transport 17 647 17 647 – – – – 500 500 18 147 46 159 10 626
Public Transport – – – – – – – – – – –
Road and Traffic Regulation – – – – – – – – – – –
Roads 17 647 17 647 – – – – 500 500 18 147 46 159 10 626
Taxi Ranks – – – – – – – – –
Prepared by : SAMRASm
Date : 2020/08/20 11:54 AM
16

Standard Classification Description RefBudget Year
+1 2021/22
Budget Year
+2 2022/23
Original
BudgetPrior Adjusted Accum. Funds
Multi-year
capital
Unfore.
Unavoid.
Nat. or Prov.
GovtOther Adjusts. Total Adjusts.
Adjusted
Budget
Adjusted
Budget
Adjusted
Budget
5 6 7 8 9 10 11 12
R thousand 1 A A1 B C D E F G H
Budget Year 2020/21
Environmental protection 13 13 – – – – – – 13 14 10
Biodiversity and Landscape 13 13 – – – – – – 13 14 10
Coastal Protection – – – – – – – – – – –
Indigenous Forests – – – – – – – – – – –
Nature Conservation – – – – – – – – – – –
Pollution Control – – – – – – – – – – –
Soil Conservation – – – – – – – – – – –
Trading services 406 013 406 013 – – – – 501 501 406 514 447 627 419 007
Energy sources 265 685 265 685 – – – – – – 265 685 292 773 321 385
Electricity 265 685 265 685 – – – – – – 265 685 291 208 321 385
Street Lighting and Signal Systems – – – – – – – – – 1 565 –
Nonelectric Energy – – – – – – – – – – –
Water management 64 856 64 856 – – – – – – 64 856 80 584 50 959
Water Treatment – – – – – – – – – – –
Water Distribution 64 856 64 856 – – – – – – 64 856 69 305 50 959
Water Storage – – – – – – – – – 11 279 –
Waste water management 43 424 43 424 – – – – – – 43 424 43 164 21 550
Public Toilets – – – – – – – – – – –
Sewerage 29 605 29 605 – – – – – – 29 605 31 844 21 550
Storm Water Management 13 819 13 819 – – – – – – 13 819 11 320 –
Waste Water Treatment – – – – – – – – – – –
Waste management 32 047 32 047 – – – – 501 501 32 549 31 105 25 113
Recycling – – – – – – – – – – –
Solid Waste Disposal (Landfill Sites) – – – – – – – – – – –
Solid Waste Removal 32 047 32 047 – – – – 501 501 32 549 31 105 25 113
Street Cleaning – – – – – – – – – – –
Other 115 115 – – – – – – 115 120 126
Abattoirs – – – – – – – – – – –
Air Transport – – – – – – – – – – –
Forestry – – – – – – – – – – –
Licensing and Regulation 115 115 – – – – – – 115 120 126
Markets – – – – – – – – – – –
Tourism – – – – – – – – – – –
Total Revenue - Functional 2 669 441 669 441 – – – – 6 170 6 170 675 612 762 599 749 194
Prepared by : SAMRASm
Date : 2020/08/20 11:54 AM
17

Standard Classification Description RefBudget Year
+1 2021/22
Budget Year
+2 2022/23
Original
BudgetPrior Adjusted Accum. Funds
Multi-year
capital
Unfore.
Unavoid.
Nat. or Prov.
GovtOther Adjusts. Total Adjusts.
Adjusted
Budget
Adjusted
Budget
Adjusted
Budget
5 6 7 8 9 10 11 12
R thousand 1 A A1 B C D E F G H
Budget Year 2020/21
Expenditure - Functional
Municipal governance and administration 150 869 150 869 – – – – 2 899 2 899 153 768 159 136 169 632
Executive and council 30 612 30 612 – – – – – – 30 612 32 525 34 529
Mayor and Council 19 731 19 731 – – – – – – 19 731 20 774 21 836
Municipal Manager, Town Secretary and Chief Executive 10 881 10 881 – – – – – – 10 881 11 750 12 693
Finance and administration 117 451 117 451 – – – – 2 899 2 899 120 351 123 618 131 904
Administrative and Corporate Support 12 535 12 535 – – – – – – 12 535 13 533 14 519
Asset Management 4 772 4 772 – – – – – – 4 772 5 184 5 632
Finance 38 188 38 288 – – – – 2 899 2 899 41 187 38 974 41 331
Fleet Management 2 845 2 845 – – – – – – 2 845 3 073 3 317
Human Resources 37 508 37 508 – – – – – – 37 508 39 761 42 483
Information Technology 4 002 4 002 – – – – – – 4 002 4 208 4 380
Legal Services 3 490 3 490 – – – – – – 3 490 3 680 3 882
Marketing, Customer Relations, Publicity and Media Co-
ordination3 968 3 968 – – – – – – 3 968 4 285 4 625
Property Services 1 239 1 239 – – – – – – 1 239 1 316 1 371
Risk Management 457 457 – – – – – – 457 497 540
Security Services – – – – – – – – – – –
Supply Chain Management 6 963 6 863 – – – – – – 6 863 7 504 8 091
Valuation Service 1 483 1 483 – – – – – – 1 483 1 603 1 733
Internal audit 2 805 2 805 – – – – – – 2 805 2 993 3 199
Governance Function 2 805 2 805 – – – – – – 2 805 2 993 3 199
Community and public safety 107 225 107 207 – – – – 160 160 107 367 112 367 150 506
Community and social services 28 760 28 742 – – – – 160 160 28 902 28 492 30 073
Aged Care 4 771 4 753 – – – – – – 4 753 2 527 2 661
Agricultural – – – – – – – – – – –
Animal Care and Diseases – – – – – – – – – – –
Cemeteries, Funeral Parlours and Crematoriums 3 585 3 585 – – – – 160 160 3 745 3 874 4 185
Child Care Facilities 896 896 – – – – – – 896 973 1 057
Community Halls and Facilities 6 671 6 671 – – – – – – 6 671 7 242 7 612
Consumer Protection – – – – – – – – – – –
Cultural Matters – – – – – – – – – – –
Disaster Management 77 77 – – – – – – 77 80 84
Education 766 766 – – – – – – 766 832 904
Indigenous and Customary Law – – – – – – – – – – –
Industrial Promotion – – – – – – – – – – –
Language Policy – – – – – – – – – – –
Libraries and Archives 11 994 11 994 – – – – – – 11 994 12 964 13 571
Literacy Programmes – – – – – – – – – – –
Media Services – – – – – – – – – – –
Museums and Art Galleries – – – – – – – – – – –
Population Development – – – – – – – – – – –
Provincial Cultural Matters – – – – – – – – – – –
Theatres – – – – – – – – – – –
Zoo's – – – – – – – – – – –
Prepared by : SAMRASm
Date : 2020/08/20 11:54 AM
18

Standard Classification Description RefBudget Year
+1 2021/22
Budget Year
+2 2022/23
Original
BudgetPrior Adjusted Accum. Funds
Multi-year
capital
Unfore.
Unavoid.
Nat. or Prov.
GovtOther Adjusts. Total Adjusts.
Adjusted
Budget
Adjusted
Budget
Adjusted
Budget
5 6 7 8 9 10 11 12
R thousand 1 A A1 B C D E F G H
Budget Year 2020/21
Sport and recreation 30 457 30 457 – – – – – – 30 457 32 703 34 934
Beaches and Jetties – – – – – – – – – – –
Casinos, Racing, Gambling, Wagering – – – – – – – – – – –
Community Parks (including Nurseries) 7 262 7 262 – – – – – – 7 262 7 793 8 301
Recreational Facilities 17 843 17 843 – – – – – – 17 843 19 143 20 462
Sports Grounds and Stadiums 5 352 5 352 – – – – – – 5 352 5 767 6 171
Public safety 42 200 42 200 – – – – – – 42 200 44 954 47 809
Civil Defence – – – – – – – – – – –
Cleansing – – – – – – – – – – –
Control of Public Nuisances – – – – – – – – – – –
Fencing and Fences – – – – – – – – – – –
Fire Fighting and Protection 9 867 9 867 – – – – – – 9 867 10 555 11 260
Licensing and Control of Animals – – – – – – – – – – –
Police Forces, Traffic and Street Parking Control 32 333 32 333 – – – – – – 32 333 34 399 36 549
Pounds – – – – – – – – – – –
Housing 5 807 5 807 – – – – – – 5 807 6 218 37 690
Housing 3 948 3 948 – – – – – – 3 948 4 202 35 505
Informal Settlements 1 859 1 859 – – – – – – 1 859 2 016 2 185
Health – – – – – – – – – – –
Ambulance – – – – – – – – – – –
Health Services – – – – – – – – – – –
Laboratory Services – – – – – – – – – – –
Food Control – – – – – – – – – – –
Health Surveillance and Prevention of Communicable
Diseases including immunizations– – – – – – – – – – –
Vector Control – – – – – – – – – – –
Chemical Safety – – – – – – – – – – –
Economic and environmental services 38 426 38 444 – – – – – – 38 444 39 446 41 801
Planning and development 12 992 13 010 – – – – – – 13 010 12 392 13 362
Billboards – – – – – – – – – – –
Corporate Wide Strategic Planning (IDPs, LEDs) 2 290 2 290 – – – – – – 2 290 2 456 2 636
Central City Improvement District – – – – – – – – – – –
Development Facilitation – – – – – – – – – – –
Economic Development/Planning 2 215 2 233 – – – – – – 2 233 2 380 2 554
Regional Planning and Development – – – – – – – – – – –
Town Planning, Building Regulations and Enforcement,
and City Engineer 5 740 5 740 – – – – – – 5 740 4 585 4 959
Project Management Unit 2 746 2 746 – – – – – – 2 746 2 971 3 213
Provincial Planning – – – – – – – – – – –
Support to Local Municipalities – – – – – – – – – – –
Road transport 23 425 23 425 – – – – – – 23 425 24 883 26 096
Public Transport – – – – – – – – – – –
Road and Traffic Regulation – – – – – – – – – – –
Roads 23 425 23 425 – – – – – – 23 425 24 883 26 096
Taxi Ranks – – – – – – – – – – –
Prepared by : SAMRASm
Date : 2020/08/20 11:54 AM
19

Standard Classification Description RefBudget Year
+1 2021/22
Budget Year
+2 2022/23
Original
BudgetPrior Adjusted Accum. Funds
Multi-year
capital
Unfore.
Unavoid.
Nat. or Prov.
GovtOther Adjusts. Total Adjusts.
Adjusted
Budget
Adjusted
Budget
Adjusted
Budget
5 6 7 8 9 10 11 12
R thousand 1 A A1 B C D E F G H
Budget Year 2020/21
Environmental protection 2 009 2 009 – – – – – – 2 009 2 171 2 343
Biodiversity and Landscape 2 009 2 009 – – – – – – 2 009 2 171 2 343
Coastal Protection – – – – – – – – – – –
Indigenous Forests – – – – – – – – – – –
Nature Conservation – – – – – – – – – – –
Pollution Control – – – – – – – – – – –
Soil Conservation – – – – – – – – – – –
Trading services 385 015 385 015 – – – – 2 000 2 000 387 015 417 504 452 945
Energy sources 268 463 268 463 – – – – 2 000 2 000 270 463 293 366 322 093
Electricity 265 128 265 428 – – – – 2 000 2 000 267 428 289 839 318 378
Street Lighting and Signal Systems 3 335 3 035 – – – – – – 3 035 3 527 3 716
Nonelectric Energy – – – – – – – – – – –
Water management 35 733 35 733 – – – – – – 35 733 37 962 39 776
Water Treatment 1 692 1 692 – – – – – – 1 692 1 838 1 997
Water Distribution 29 481 29 481 – – – – – – 29 481 31 328 32 843
Water Storage 4 560 4 560 – – – – – – 4 560 4 796 4 936
Waste water management 34 766 34 766 – – – – – – 34 766 37 044 38 992
Public Toilets 1 875 1 875 – – – – – – 1 875 2 029 2 197
Sewerage 23 500 23 500 – – – – – – 23 500 24 968 26 126
Storm Water Management 6 691 6 691 – – – – – – 6 691 7 115 7 483
Waste Water Treatment 2 699 2 699 – – – – – – 2 699 2 932 3 185
Waste management 46 053 46 053 – – – – – – 46 053 49 131 52 084
Recycling – – – – – – – – – – –
Solid Waste Disposal (Landfill Sites) 16 613 16 613 – – – – – – 16 613 17 536 18 369
Solid Waste Removal 28 001 28 001 – – – – – – 28 001 30 031 32 016
Street Cleaning 1 440 1 440 – – – – – – 1 440 1 564 1 700
Other 959 959 – – – – – – 959 1 003 1 053
Abattoirs – – – – – – – – – – –
Air Transport – – – – – – – – – – –
Forestry – – – – – – – – – – –
Licensing and Regulation 62 62 – – – – – – 62 65 69
Markets – – – – – – – – – – –
Tourism 897 897 – – – – – – 897 938 985
Total Expenditure - Functional 3 682 493 682 493 – – – – 5 059 5 059 687 553 729 455 815 938
Surplus/ (Deficit) for the year (13 052) (13 052) – – – – 1 111 1 111 (11 941) 33 143 (66 744)
Prepared by : SAMRASm
Date : 2020/08/20 11:54 AM
20

WC022 Witzenberg - Table B3 Adjustments Budget Financial Performance (revenue and expenditure by municipal vote) - 25 Augustus
Budget Year
+1 2021/22
Budget Year
+2 2022/23
Original
BudgetPrior Adjusted Accum. Funds
Multi-year
capital
Unfore.
Unavoid.
Nat. or Prov.
GovtOther Adjusts. Total Adjusts.
Adjusted
Budget
Adjusted
Budget
Adjusted
Budget
[Insert departmental structure etc] 3 4 5 6 7 8 9 10
R thousands A A1 B C D E F G H
Revenue by Vote 1
Vote 1 - Financial Services 97 078 97 078 – – – – 3 002 3 002 100 080 102 909 104 299
Vote 2 - Community Services 11 944 11 944 – – – – 722 722 12 666 19 965 57 508
Vote 3 - Community Services 126 015 126 015 – – – – – – 126 015 135 218 146 622
Vote 4 - Community Services 4 905 4 905 – – – – 1 445 1 445 6 350 4 571 4 643
Vote 5 - Corporate Services 566 566 – – – – – – 566 594 624
Vote 6 - Technical Services 330 552 330 552 – – – – 4 433 4 433 334 985 386 112 357 822
Vote 7 - Technical Services 96 840 96 840 – – – – 501 501 97 341 111 623 76 002
Vote 8 - Muncipal Manager 1 542 1 542 – – – – – – 1 542 1 607 1 675
Total Revenue by Vote 2 669 441 669 441 – – – – 10 103 10 103 679 544 762 599 749 194
Expenditure by Vote 1
Vote 1 - Financial Services 52 907 52 907 – – – – 2 899 2 899 55 806 54 892 58 552
Vote 2 - Community Services 42 428 42 428 – – – – 160 160 42 588 45 601 48 530
Vote 3 - Community Services 51 839 51 821 – – – – – – 51 821 52 793 56 181
Vote 4 - Community Services 19 452 19 470 – – – – – – 19 470 20 985 53 362
Vote 5 - Corporate Services 81 238 81 238 – – – – – – 81 238 86 290 91 802
Vote 6 - Technical Services 334 930 334 930 – – – – 2 455 2 455 337 384 362 615 395 085
Vote 7 - Technical Services 84 015 84 015 – – – – – – 84 015 89 511 94 488
Vote 8 - Muncipal Manager 15 685 15 685 – – – – – – 15 685 16 769 17 939
Total Expenditure by Vote 2 682 493 682 493 – – – – 5 514 5 514 688 008 729 455 815 938
Surplus/ (Deficit) for the year 2 (13 052) (13 052) – – – – 4 589 4 589 (8 463) 33 143 (66 744)
Vote Description
Ref
Budget Year 2020/21
Prepared by : SAMRASm
Date : 2020/08/20 11:54 AM
21

WC022 Witzenberg - Table B3 Adjustments Budget Financial Performance (revenue and expenditure by municipal vote) - B - 25 Augustus
Budget Year +1
2021/22
Budget Year +2
2022/23
Original Budget Prior Adjusted Accum. FundsMulti-year
capitalUnfore. Unavoid.
Nat. or Prov.
GovtOther Adjusts. Total Adjusts. Adjusted Budget Adjusted Budget Adjusted Budget
[Insert departmental structure etc] 3 4 5 6 7 8 9 10
R thousands A A1 B C D E F G H
Revenue by Vote 1
Vote 1 - Financial Services 97 078 97 078 – – – – 3 002 3 002 100 080 102 909 104 299
1.1 - Assessment Rates 81 350 81 350 – – – – – – 81 350 87 042 91 394
1.2 - Treasury: Administration 20 240 20 240 – – – – 3 002 3 002 23 242 20 701 17 996
1.3 - Treasury: Debtors (4 764) (4 764) – – – – – – (4 764) (5 098) (5 368)
1.4 - Treasury: Credit controle 234 234 – – – – – – 234 245 258
1.5 - Supply Chain Management 18 18 – – – – – – 18 19 20
1.6 - Director: Finance – – – – – – – – – – –
– – – – – – – – – – –
– – – – – – – – – – –
– – – – – – – – – – –
– – – – – – – – – – –
Vote 2 - Community Services 11 944 11 944 – – – – 722 722 12 666 19 965 57 508
2.1 - Cemetries 233 233 – – – – – – 233 383 5 076
2.2 - Controle Centre – – – – – – – – – – –
2.3 - Housing: Administration 1 098 1 098 – – – – – – 1 098 1 155 32 237
2.4 - Library Services 9 836 9 836 – – – – – – 9 836 10 375 10 940
2.5 - Fire Protection Sevices 6 6 – – – – 722 722 728 6 807
2.6 - Pine Forest : Administration 771 771 – – – – – – 771 8 046 8 448
2.7 - Pine Forest : Security Service – – – – – – – – – – –
2.8 - Pine Forest:Semi Permanent Uni – – – – – – – – – – –
2.9 - Pine Forest : Cleaning Service – – – – – – – – – – –
2.10 - Pine Forest : Swimming Pool – – – – – – – – – – –
Vote 3 - Community Services 126 015 126 015 – – – – – – 126 015 135 218 146 622
3.1 - Community Halls And Facilities 310 310 – – – – – – 310 667 700
3.2 - Klipriver Park: Administration – – – – – – – – – – –
3.3 - Kliprivirpark:Cleaning Service – – – – – – – – – – –
3.4 - Klipriver Park: Swimming Pool – – – – – – – – – – –
3.5 - Licensing & Regulation 115 115 – – – – – – 115 120 126
3.6 - Enviromental Protection 13 13 – – – – – – 13 14 10
3.7 - Parks 119 119 – – – – – – 119 125 70
3.8 - Traffic 21 053 21 053 – – – – – – 21 053 22 105 23 196
3.9 - Disaster Management – – – – – – – – – – –
3.10 - Social & Welfare Services 104 406 104 406 – – – – – – 104 406 112 187 122 520
Vote 4 - Community Services 4 905 4 905 – – – – 1 445 1 445 6 350 4 571 4 643
4.1 - Housing Construction – – – – – – – – – – –
4.2 - Director: Community Services – – – – – – – – – – –
4.3 - Recreational Land 1 032 1 032 – – – – – – 1 032 170 179
4.4 - Swimming Pools 19 19 – – – – – – 19 205 215
4.5 - Vehicle Licensing & Testing 3 854 3 854 – – – – – – 3 854 4 046 4 249
4.6 - Property Maintenance – – – – – – – – – – –
4.7 - L E D – – – – – – 1 445 1 445 1 445 – –
4.8 - Housing : Maintenance – – – – – – – – – – –
4.9 - Thusong Centre – – – – – – – – – 150 –
– – – – – – – – – – –
Vote Description
Ref
Budget Year 2020/21
Prepared by : SAMRASm
Date : 2020/08/20 11:54 AM
22

Budget Year +1
2021/22
Budget Year +2
2022/23
Original Budget Prior Adjusted Accum. FundsMulti-year
capitalUnfore. Unavoid.
Nat. or Prov.
GovtOther Adjusts. Total Adjusts. Adjusted Budget Adjusted Budget Adjusted Budget
[Insert departmental structure etc] 3 4 5 6 7 8 9 10
R thousands A A1 B C D E F G H
Vote Description
Ref
Budget Year 2020/21
Vote 5 - Corporate Services 566 566 – – – – – – 566 594 624
5.1 - Property Administration – – – – – – – – – – –
5.2 - Information Tecnology – – – – – – – – – – –
5.3 - Human Resources 552 552 – – – – – – 552 580 609
5.4 - Council Cost – – – – – – – – – – –
5.5 - Town Secretary – – – – – – – – – – –
5.6 - Tourism – – – – – – – – – – –
5.7 - Director Corporate Services – – – – – – – – – – –
5.8 - Marketing & Communications 4 4 – – – – – – 4 5 5
5.9 - Administration 9 9 – – – – – – 9 9 10
– – – – – – – – – – –
Vote 6 - Technical Services 330 552 330 552 – – – – 4 433 4 433 334 985 386 112 357 822
6.1 - Building Regulations & Enforce 944 944 – – – – – – 944 991 1 040
6.2 - Electricity: Administration 267 434 267 434 – – – – – – 267 434 293 072 323 386
6.3 - Electricity: Street Lights – – – – – – – – – 1 565 –
6.4 - Electricity: Distribution – – – – – – – – – – –
6.5 - Mechanical Workshop – – – – – – – – – – –
6.6 - Public Toilets – – – – – – – – – – –
6.7 - Sewerage 29 914 29 914 – – – – – – 29 914 32 172 21 894
6.8 - Town Planning 794 794 – – – – 455 455 1 249 834 875
6.9 - Stormwater Management 13 819 13 819 – – – – – – 13 819 11 320 –
6.10 - Roads 17 647 17 647 – – – – 3 978 3 978 21 625 46 159 10 626
Vote 7 - Technical Services 96 840 96 840 – – – – 501 501 97 341 111 623 76 002
7.1 - Solid Waste (Dumping Site) 10 024 10 024 – – – – – – 10 024 7 775 743
7.2 - Solid Waste (Garden) 5 5 – – – – – – 5 5 5
7.3 - Solid Waste (Removal) 21 955 21 955 – – – – 501 501 22 456 23 259 24 294
7.4 - Water Storage – – – – – – – – – 11 279 –
7.5 - Water Distribution 64 856 64 856 – – – – – – 64 856 69 305 50 959
7.6 - Director: Technical Services – – – – – – – – – – –
7.7 - Electricity: Client Services – – – – – – – – – – –
7.8 - Electricity: Generation – – – – – – – – – – –
– – – – – – – – – – –
– – – – – – – – – – –
Vote 8 - Muncipal Manager 1 542 1 542 – – – – – – 1 542 1 607 1 675
8.1 - Municipal Manager – – – – – – – – – – –
8.2 - Property & Legal Services 912 912 – – – – – – 912 957 1 005
8.3 - IDP – – – – – – – – – – –
8.4 - Project Management 630 630 – – – – – – 630 650 670
8.5 - Performance Management – – – – – – – – – – –
8.6 - Internal Audit – – – – – – – – – – –
– – – – – – – – – – –
– – – – – – – – – – –
– – – – – – – – – – –
– – – – – – – – – – –
Total Revenue by Vote 2 669 441 669 441 – – – – 10 103 10 103 679 544 762 599 749 194
Prepared by : SAMRASm
Date : 2020/08/20 11:54 AM
23

Budget Year +1
2021/22
Budget Year +2
2022/23
Original Budget Prior Adjusted Accum. FundsMulti-year
capitalUnfore. Unavoid.
Nat. or Prov.
GovtOther Adjusts. Total Adjusts. Adjusted Budget Adjusted Budget Adjusted Budget
[Insert departmental structure etc] 3 4 5 6 7 8 9 10
R thousands A A1 B C D E F G H
Vote Description
Ref
Budget Year 2020/21
Expenditure by Vote 1
Vote 1 - Financial Services 52 907 52 907 – – – – 2 899 2 899 55 806 54 892 58 552
1.1 - Assessment Rates 3 819 3 819 – – – – – – 3 819 4 217 4 455
1.2 - Treasury: Administration 25 318 25 418 – – – – 2 899 2 899 28 318 25 128 26 627
1.3 - Treasury: Debtors 6 410 6 410 – – – – – – 6 410 6 879 7 375
1.4 - Treasury: Credit controle 8 487 8 487 – – – – – – 8 487 9 093 9 756
1.5 - Supply Chain Management 6 963 6 863 – – – – – – 6 863 7 504 8 091
1.6 - Director: Finance 1 909 1 909 – – – – – – 1 909 2 070 2 247
– – – – – – – – – – –
– – – – – – – – – – –
– – – – – – – – – – –
– – – – – – – – – – –
Vote 2 - Community Services 42 428 42 428 – – – – 160 160 42 588 45 601 48 530
2.1 - Cemetries 3 585 3 585 – – – – 160 160 3 745 3 874 4 185
2.2 - Controle Centre – – – – – – – – – – –
2.3 - Housing: Administration 5 807 5 807 – – – – – – 5 807 6 218 6 660
2.4 - Library Services 11 714 11 714 – – – – – – 11 714 12 659 13 240
2.5 - Fire Protection Sevices 9 867 9 867 – – – – – – 9 867 10 555 11 260
2.6 - Pine Forest : Administration 11 454 11 454 – – – – – – 11 454 12 295 13 184
2.7 - Pine Forest : Security Service – – – – – – – – – – –
2.8 - Pine Forest:Semi Permanent Uni – – – – – – – – – – –
2.9 - Pine Forest : Cleaning Service – – – – – – – – – – –
2.10 - Pine Forest : Swimming Pool – – – – – – – – – – –
Vote 3 - Community Services 51 839 51 821 – – – – – – 51 821 52 793 56 181
3.1 - Community Halls And Facilities 6 250 6 250 – – – – – – 6 250 6 746 7 238
3.2 - Klipriver Park: Administration 1 457 1 457 – – – – – – 1 457 1 580 1 709
3.3 - Kliprivirpark:Cleaning Service – – – – – – – – – – –
3.4 - Klipriver Park: Swimming Pool – – – – – – – – – – –
3.5 - Licensing & Regulation 62 62 – – – – – – 62 65 69
3.6 - Enviromental Protection 2 009 2 009 – – – – – – 2 009 2 171 2 343
3.7 - Parks 7 529 7 529 – – – – – – 7 529 8 084 8 617
3.8 - Traffic 28 022 28 022 – – – – – – 28 022 29 733 31 499
3.9 - Disaster Management 77 77 – – – – – – 77 80 84
3.10 - Social & Welfare Services 6 433 6 415 – – – – – – 6 415 4 333 4 622
Vote 4 - Community Services 19 452 19 470 – – – – – – 19 470 20 985 53 362
4.1 - Housing Construction – – – – – – – – – – 31 030
4.2 - Director: Community Services 1 749 1 749 – – – – – – 1 749 1 899 2 062
4.3 - Recreational Land 5 352 5 352 – – – – – – 5 352 5 767 6 171
4.4 - Swimming Pools 4 932 4 932 – – – – – – 4 932 5 267 5 568
4.5 - Vehicle Licensing & Testing 4 312 4 312 – – – – – – 4 312 4 666 5 050
4.6 - Property Maintenance 453 453 – – – – – – 453 490 531
4.7 - L E D 2 215 2 233 – – – – – – 2 233 2 380 2 554
4.8 - Housing : Maintenance – – – – – – – – – – –
4.9 - Thusong Centre 441 441 – – – – – – 441 516 396
– – – – – – – – – – –
Prepared by : SAMRASm
Date : 2020/08/20 11:54 AM
24

Budget Year +1
2021/22
Budget Year +2
2022/23
Original Budget Prior Adjusted Accum. FundsMulti-year
capitalUnfore. Unavoid.
Nat. or Prov.
GovtOther Adjusts. Total Adjusts. Adjusted Budget Adjusted Budget Adjusted Budget
[Insert departmental structure etc] 3 4 5 6 7 8 9 10
R thousands A A1 B C D E F G H
Vote Description
Ref
Budget Year 2020/21
Vote 5 - Corporate Services 81 238 81 238 – – – – – – 81 238 86 290 91 802
5.1 - Property Administration – – – – – – – – – – –
5.2 - Information Tecnology 4 001 4 001 – – – – – – 4 001 4 207 4 379
5.3 - Human Resources 37 508 37 508 – – – – – – 37 508 39 761 42 483
5.4 - Council Cost 19 731 19 731 – – – – – – 19 731 20 774 21 836
5.5 - Town Secretary 1 505 1 505 – – – – – – 1 505 1 635 1 776
5.6 - Tourism 897 897 – – – – – – 897 938 985
5.7 - Director Corporate Services 1 999 1 999 – – – – – – 1 999 2 165 2 346
5.8 - Marketing & Communications 3 969 3 969 – – – – – – 3 969 4 286 4 626
5.9 - Administration 11 628 11 628 – – – – – – 11 628 12 523 13 372
– – – – – – – – – – –
Vote 6 - Technical Services 334 930 334 930 – – – – 2 455 2 455 337 384 362 615 395 085
6.1 - Building Regulations & Enforce 2 884 2 884 – – – – – – 2 884 3 115 3 365
6.2 - Electricity: Administration 265 464 265 464 – – – – 2 000 2 000 267 464 290 108 318 497
6.3 - Electricity: Street Lights – – – – – – – – – – –
6.4 - Electricity: Distribution – – – – – – – – – – –
6.5 - Mechanical Workshop 2 845 2 845 – – – – – – 2 845 3 073 3 317
6.6 - Public Toilets 1 875 1 875 – – – – – – 1 875 2 029 2 197
6.7 - Sewerage 28 888 28 888 – – – – – – 28 888 30 821 32 536
6.8 - Town Planning 2 857 2 857 – – – – 455 455 3 311 1 471 1 594
6.9 - Stormwater Management 6 691 6 691 – – – – – – 6 691 7 115 7 483
6.10 - Roads 23 425 23 425 – – – – – – 23 425 24 883 26 096
Vote 7 - Technical Services 84 015 84 015 – – – – – – 84 015 89 511 94 488
7.1 - Solid Waste (Dumping Site) 16 613 16 613 – – – – – – 16 613 17 536 18 369
7.2 - Solid Waste (Garden) 12 000 12 000 – – – – – – 12 000 12 902 13 811
7.3 - Solid Waste (Removal) 17 441 17 441 – – – – – – 17 441 18 694 19 905
7.4 - Water Storage 4 576 4 576 – – – – – – 4 576 4 814 4 955
7.5 - Water Distribution 31 430 31 430 – – – – – – 31 430 33 446 35 150
7.6 - Director: Technical Services 1 956 1 956 – – – – – – 1 956 2 120 2 299
7.7 - Electricity: Client Services – – – – – – – – – – –
7.8 - Electricity: Generation – – – – – – – – – – –
– – – – – – – – – – –
– – – – – – – – – – –
Vote 8 - Muncipal Manager 15 685 15 685 – – – – – – 15 685 16 769 17 939
8.1 - Municipal Manager 3 683 3 683 – – – – – – 3 683 3 945 4 229
8.2 - Property & Legal Services 3 703 3 703 – – – – – – 3 703 3 906 4 122
8.3 - IDP 2 290 2 290 – – – – – – 2 290 2 456 2 636
8.4 - Project Management 1 310 1 310 – – – – – – 1 310 1 420 1 538
8.5 - Performance Management 1 437 1 437 – – – – – – 1 437 1 551 1 675
8.6 - Internal Audit 3 263 3 263 – – – – – – 3 263 3 490 3 739
– – – – – – – – – – –
– – – – – – – – – – –
– – – – – – – – – – –
– – – – – – – – – – –
Total Expenditure by Vote 2 682 493 682 493 – – – – 5 514 5 514 688 008 729 455 815 938
Surplus/ (Deficit) for the year 2 (13 052) (13 052) – – – – 4 589 4 589 (8 463) 33 143 (66 744)
Prepared by : SAMRASm
Date : 2020/08/20 11:54 AM
25

WC022 Witzenberg - Table B4 Adjustments Budget Financial Performance (revenue and expenditure) - 25 Augustus
Budget Year
+1 2021/22
Budget Year
+2 2022/23
Original
BudgetPrior Adjusted Accum. Funds
Multi-year
capital
Unfore.
Unavoid.
Nat. or Prov.
GovtOther Adjusts. Total Adjusts.
Adjusted
Budget
Adjusted
Budget
Adjusted
Budget
3 4 5 6 7 8 9 10
R thousands 1 A A1 B C D E F G H
Revenue By Source
Property rates 2 76 388 76 388 – – – – – – 76 388 81 736 85 822
Service charges - electricity revenue 2 266 973 266 973 – – – – – – 266 973 284 115 312 915
Service charges - water revenue 2 35 137 35 137 – – – – – – 35 137 37 630 39 821
Service charges - sanitation revenue 2 18 352 18 352 – – – – – – 18 352 19 453 20 425
Service charges - refuse revenue 2 21 271 21 271 – – – – – – 21 271 22 547 23 547
Service charges - other – – – – – – – – – – –
Rental of facilities and equipment 2 663 2 663 – – – – – – 2 663 8 342 8 759
Interest earned - external investments 9 129 9 129 – – – – – – 9 129 9 586 9 089
Interest earned - outstanding debtors 8 264 8 264 – – – – – – 8 264 8 677 9 111
Dividends received – – – – – – – – – – –
Fines, penalties and forfeits 20 456 20 456 – – – – – – 20 456 21 479 22 553
Licences and permits 2 010 2 010 – – – – – – 2 010 2 111 2 216
Agency services 3 854 3 854 – – – – – – 3 854 4 046 4 249
Transfers and subsidies 116 989 116 989 – – – – 3 354 3 354 120 343 125 089 166 900
Other revenue 2 9 240 9 240 – – – – – – 9 240 11 847 9 632
Gains on disposal of PPE (0) (0) – – – – – – (0) (0) –
Total Revenue (excluding capital transfers and contributions) 590 725 590 725 – – – – 3 354 3 354 594 079 636 657 715 040
Expenditure By Type
Employee related costs 226 182 226 182 – – – – – – 226 182 242 401 262 678
Remuneration of councillors 12 032 12 032 – – – – – – 12 032 12 633 13 265
Debt impairment 44 688 44 688 – – – – – – 44 688 47 670 50 416
Depreciation & asset impairment 40 688 40 688 – – – – – – 40 688 42 918 42 918
Finance charges 9 181 9 181 – – – – – – 9 181 9 635 10 108
Bulk purchases 232 760 232 760 – – – – – – 232 760 252 871 279 144
Other materials 19 528 18 913 – – – – 1 183 1 183 20 096 20 425 21 410
Contracted services 48 486 49 101 – – – – 4 081 4 081 53 182 52 008 54 155
Transfers and subsidies 2 179 2 179 – – – – – – 2 179 1 859 32 976
Other expenditure 46 770 46 770 – – – – 250 250 47 020 47 035 48 867
Loss on disposal of PPE 0 0 – – – – – – 0 0 –
Total Expenditure 682 493 682 493 – – – – 5 514 5 514 688 008 729 455 815 938
Surplus/(Deficit) (91 768) (91 768) – – – – (2 160) (2 160) (93 928) (92 798) (100 898)
Transfers and subsidies - capital (monetary allocations)
(National / Provincial and District)78 716 78 716 – – – – 6 248 6 248 84 964 120 459 28 167
Transfers and subsidies - capital (monetary allocations)
(National / Provincial Departmental Agencies, Households, Non-
profit Institutions, Private Enterprises, Public Corporatons,
Higher Educational Institutions)
– – – – – – 501 501 501 – –
Transfers and subsidies - capital (in-kind - all) – – – – – – – – – – –
Surplus/(Deficit) before taxation (13 052) (13 052) – – – – 4 589 4 589 (8 463) 27 661 (72 732)
Taxation – – – – – – – – – – –
Surplus/(Deficit) after taxation (13 052) (13 052) – – – – 4 589 4 589 (8 463) 27 661 (72 732)
Attributable to minorities – – – – – – – – – – –
Surplus/(Deficit) attributable to municipality (13 052) (13 052) – – – – 4 589 4 589 (8 463) 27 661 (72 732)
Share of surplus/ (deficit) of associate – – – – – – – – – – –
Surplus/ (Deficit) for the year (13 052) (13 052) – – – – 4 589 4 589 (8 463) 27 661 (72 732)
Budget Year 2020/21
RefDescription
Prepared by : SAMRASm
Date : 2020/08/20 11:54 AM
26

WC022 Witzenberg - Table B5 Adjustments Capital Expenditure Budget by vote and funding - 25 Augustus
Budget Year
+1 2021/22
Budget Year
+2 2022/23
Original
BudgetPrior Adjusted Accum. Funds
Multi-year
capital
Unfore.
Unavoid.
Nat. or Prov.
GovtOther Adjusts. Total Adjusts.
Adjusted
Budget
Adjusted
Budget
Adjusted
Budget
5 6 7 8 9 10 11 12
R thousands A A1 B C D E F G H
Capital expenditure - Vote
Multi-year expenditure to be adjusted 2
Vote 1 - Financial Services – – – – – – – – – – –
Vote 2 - Community Services – – – – – – 64 64 64 – –
Vote 3 - Community Services – – – – – – – – – – –
Vote 4 - Community Services 870 870 – – – – – – 870 – –
Vote 5 - Corporate Services – – – – – – – – – – –
Vote 6 - Technical Services 30 667 29 417 – – – – – – 29 417 36 025 7 565
Vote 7 - Technical Services 26 288 26 288 – – – – 656 656 26 943 41 096 –
Vote 8 - Muncipal Manager – – – – – – – – – – –
Capital multi-year expenditure sub-total 3 57 824 56 574 – – – – 720 720 57 293 77 121 7 565
Single-year expenditure to be adjusted 2
Vote 1 - Financial Services – – – – – – 102 102 102 – –
Vote 2 - Community Services – – – – – – 722 722 722 137 5 619
Vote 3 - Community Services 620 620 – – – – 410 410 1 030 – 80
Vote 4 - Community Services 30 30 – – – – 1 478 1 478 1 508 – 30
Vote 5 - Corporate Services 1 050 1 948 – – – – 2 280 2 280 4 228 – 600
Vote 6 - Technical Services 18 775 19 128 – – – – 5 378 5 378 24 506 45 658 14 919
Vote 7 - Technical Services 10 465 10 465 – – – – 501 501 10 966 11 279 9 526
Vote 8 - Muncipal Manager – – – – – – – – – – –
Capital single-year expenditure sub-total 30 940 32 190 – – – – 10 872 10 872 43 063 57 075 30 774
Total Capital Expenditure - Vote 88 764 88 764 – – – – 11 592 11 592 100 356 134 196 38 340
Description Ref
Budget Year 2020/21
Prepared by : SAMRASm
Date : 2020/08/20 11:54 AM
27

Budget Year
+1 2021/22
Budget Year
+2 2022/23
Original
BudgetPrior Adjusted Accum. Funds
Multi-year
capital
Unfore.
Unavoid.
Nat. or Prov.
GovtOther Adjusts. Total Adjusts.
Adjusted
Budget
Adjusted
Budget
Adjusted
Budget
5 6 7 8 9 10 11 12
R thousands A A1 B C D E F G H
Description Ref
Budget Year 2020/21
Capital Expenditure - Functional
Governance and administration 1 400 1 400 – – – – 2 402 2 402 3 802 – 600
Executive and council 600 600 – – – – 850 850 1 450 – –
Finance and administration 800 800 – – – – 1 552 1 552 2 352 – 600
Internal audit – – – – – – – – – – –
Community and public safety 1 520 1 520 – – – – 1 196 1 196 2 716 137 5 729
Community and social services 580 580 – – – – 410 410 990 137 4 859
Sport and recreation 940 940 – – – – – – 940 – 70
Public safety – – – – – – 786 786 786 – 800
Housing – – – – – – – – – – –
Health – – – – – – – – – – –
Economic and environmental services 20 245 19 347 – – – – 6 401 6 401 25 748 53 978 12 984
Planning and development – – – – – – 1 478 1 478 1 478 – –
Road transport 20 245 19 347 – – – – 4 924 4 924 24 271 53 978 12 984
Environmental protection – – – – – – – – – – –
Trading services 65 600 66 497 – – – – 1 592 1 592 68 089 80 080 19 026
Energy sources 2 500 2 500 – – – – 435 435 2 935 5 065 8 000
Water management 27 396 28 294 – – – – – – 28 294 39 990 9 526
Waste water management 26 347 26 347 – – – – – – 26 347 22 640 1 500
Waste management 9 356 9 356 – – – – 1 157 1 157 10 513 12 384 –
Other – – – – – – – – – – –
Total Capital Expenditure - Functional 3 88 764 88 764 – – – – 11 592 11 592 100 356 134 196 38 340
Funded by:
National Government 35 763 35 763 – – – – – – 35 763 40 614 25 237
Provincial Government 42 954 42 954 – – – – 5 645 5 645 48 599 79 845 2 930
District Municipality – – – – – – 602 602 602 – –
Other transfers and grants – – – – – – 501 501 501 – –
Transfers recognised - capital 4 78 716 78 716 – – – – 6 749 6 749 85 465 120 459 28 167
Public contributions & donations – – – – – – – – – – –
Borrowing – – – – – – – – – – –
Internally generated funds 10 048 10 048 – – – – 4 843 4 843 14 891 13 737 10 173
Total Capital Funding 88 764 88 764 – – – – 11 592 11 592 100 356 134 196 38 340
Prepared by : SAMRASm
Date : 2020/08/20 11:54 AM
28

WC022 Witzenberg - Table B5 Adjustments Capital Expenditure Budget by vote and funding - B - 25 Augustus
Budget Year +1
2021/22
Budget Year +2
2022/23
Original Budget Prior Adjusted Accum. FundsMulti-year
capitalUnfore. Unavoid.
Nat. or Prov.
GovtOther Adjusts. Total Adjusts. Adjusted Budget Adjusted Budget Adjusted Budget
[Insert departmental structure etc] 3 4 5 6 7 8 9 10
R thousands A A1 B C D E F G H
Capital expenditure - Municipal Vote
Multi-year expenditure appropriation 2
Vote 1 - Financial Services – – – – – – – – – – –
1.1 - Assessment Rates – – – – – – – – – – –
1.2 - Treasury: Administration – – – – – – – – – – –
1.3 - Treasury: Debtors – – – – – – – – – – –
1.4 - Treasury: Credit controle – – – – – – – – – – –
1.5 - Supply Chain Management – – – – – – – – – – –
1.6 - Director: Finance – – – – – – – – – – –
– – – – – – – – – – –
– – – – – – – – – – –
– – – – – – – – – – –
– – – – – – – – – – –
Vote 2 - Community Services – – – – – – 64 64 64 – –
2.1 - Cemetries – – – – – – – – – – –
2.2 - Controle Centre – – – – – – – – – – –
2.3 - Housing: Administration – – – – – – – – – – –
2.4 - Library Services – – – – – – – – – – –
2.5 - Fire Protection Sevices – – – – – – 64 64 64 – –
2.6 - Pine Forest : Administration – – – – – – – – – – –
2.7 - Pine Forest : Security Service – – – – – – – – – – –
2.8 - Pine Forest:Semi Permanent Uni – – – – – – – – – – –
2.9 - Pine Forest : Cleaning Service – – – – – – – – – – –
2.10 - Pine Forest : Swimming Pool – – – – – – – – – – –
Vote 3 - Community Services – – – – – – – – – – –
3.1 - Community Halls And Facilities – – – – – – – – – – –
3.2 - Klipriver Park: Administration – – – – – – – – – – –
3.3 - Kliprivirpark:Cleaning Service – – – – – – – – – – –
3.4 - Klipriver Park: Swimming Pool – – – – – – – – – – –
3.5 - Licensing & Regulation – – – – – – – – – – –
3.6 - Enviromental Protection – – – – – – – – – – –
3.7 - Parks – – – – – – – – – – –
3.8 - Traffic – – – – – – – – – – –
3.9 - Disaster Management – – – – – – – – – – –
3.10 - Social & Welfare Services – – – – – – – – – – –
Vote Description
Ref
Budget Year 2020/21
Prepared by : SAMRASm
Date : 2020/08/20 11:54 AM
29

Budget Year +1
2021/22
Budget Year +2
2022/23
Original Budget Prior Adjusted Accum. FundsMulti-year
capitalUnfore. Unavoid.
Nat. or Prov.
GovtOther Adjusts. Total Adjusts. Adjusted Budget Adjusted Budget Adjusted Budget
[Insert departmental structure etc] 3 4 5 6 7 8 9 10
R thousands A A1 B C D E F G H
Vote Description
Ref
Budget Year 2020/21
Vote 4 - Community Services 870 870 – – – – – – 870 – –
4.1 - Housing Construction – – – – – – – – – – –
4.2 - Director: Community Services – – – – – – – – – – –
4.3 - Recreational Land 870 870 – – – – – – 870 – –
4.4 - Swimming Pools – – – – – – – – – – –
4.5 - Vehicle Licensing & Testing – – – – – – – – – – –
4.6 - Property Maintenance – – – – – – – – – – –
4.7 - L E D – – – – – – – – – – –
4.8 - Housing : Maintenance – – – – – – – – – – –
4.9 - Thusong Centre – – – – – – – – – – –
– – – – – – – – – – –
Vote 5 - Corporate Services – – – – – – – – – – –
5.1 - Property Administration – – – – – – – – – – –
5.2 - Information Tecnology – – – – – – – – – – –
5.3 - Human Resources – – – – – – – – – – –
5.4 - Council Cost – – – – – – – – – – –
5.5 - Town Secretary – – – – – – – – – – –
5.6 - Tourism – – – – – – – – – – –
5.7 - Director Corporate Services – – – – – – – – – – –
5.8 - Marketing & Communications – – – – – – – – – – –
5.9 - Administration – – – – – – – – – – –
– – – – – – – – – – –
Vote 6 - Technical Services 30 667 29 417 – – – – – – 29 417 36 025 7 565
6.1 - Building Regulations & Enforce – – – – – – – – – – –
6.2 - Electricity: Administration 2 500 1 250 – – – – – – 1 250 500 4 000
6.3 - Electricity: Street Lights – – – – – – – – – 1 565 –
6.4 - Electricity: Distribution – – – – – – – – – – –
6.5 - Mechanical Workshop – – – – – – – – – – –
6.6 - Public Toilets – – – – – – – – – – –
6.7 - Sewerage – – – – – – – – – 11 320 –
6.8 - Town Planning – – – – – – – – – – –
6.9 - Stormwater Management 13 819 13 819 – – – – – – 13 819 11 320 –
6.10 - Roads 14 347 14 347 – – – – – – 14 347 11 320 3 565
Prepared by : SAMRASm
Date : 2020/08/20 11:54 AM
30

Budget Year +1
2021/22
Budget Year +2
2022/23
Original Budget Prior Adjusted Accum. FundsMulti-year
capitalUnfore. Unavoid.
Nat. or Prov.
GovtOther Adjusts. Total Adjusts. Adjusted Budget Adjusted Budget Adjusted Budget
[Insert departmental structure etc] 3 4 5 6 7 8 9 10
R thousands A A1 B C D E F G H
Vote Description
Ref
Budget Year 2020/21
Vote 7 - Technical Services 26 288 26 288 – – – – 656 656 26 943 41 096 –
7.1 - Solid Waste (Dumping Site) 9 356 9 356 – – – – 656 656 10 012 12 384 –
7.2 - Solid Waste (Garden) – – – – – – – – – – –
7.3 - Solid Waste (Removal) – – – – – – – – – – –
7.4 - Water Storage – – – – – – – – – – –
7.5 - Water Distribution 16 931 16 931 – – – – – – 16 931 28 711 –
7.6 - Director: Technical Services – – – – – – – – – – –
7.7 - Electricity: Client Services – – – – – – – – – – –
7.8 - Electricity: Generation – – – – – – – – – – –
– – – – – – – – – – –
– – – – – – – – – – –
Vote 8 - Muncipal Manager – – – – – – – – – – –
8.1 - Municipal Manager – – – – – – – – – – –
8.2 - Property & Legal Services – – – – – – – – – – –
8.3 - IDP – – – – – – – – – – –
8.4 - Project Management – – – – – – – – – – –
8.5 - Performance Management – – – – – – – – – – –
8.6 - Internal Audit – – – – – – – – – – –
– – – – – – – – – – –
– – – – – – – – – – –
– – – – – – – – – – –
– – – – – – – – – – –
Capital multi-year expenditure sub-total 57 824 56 574 – – – – 720 720 57 293 77 121 7 565
Prepared by : SAMRASm
Date : 2020/08/20 11:54 AM
31

Budget Year +1
2021/22
Budget Year +2
2022/23
Original Budget Prior Adjusted Accum. FundsMulti-year
capitalUnfore. Unavoid.
Nat. or Prov.
GovtOther Adjusts. Total Adjusts. Adjusted Budget Adjusted Budget Adjusted Budget
[Insert departmental structure etc] 3 4 5 6 7 8 9 10
R thousands A A1 B C D E F G H
Vote Description
Ref
Budget Year 2020/21
Capital expenditure - Municipal Vote 2
Single-year expenditure appropriation
Vote 1 - Financial Services – – – – – – 102 102 102 – –
1.1 - Assessment Rates – – – – – – – – – – –
1.2 - Treasury: Administration – – – – – – 102 102 102 – –
1.3 - Treasury: Debtors – – – – – – – – – – –
1.4 - Treasury: Credit controle – – – – – – – – – – –
1.5 - Supply Chain Management – – – – – – – – – – –
1.6 - Director: Finance – – – – – – – – – – –
– – – – – – – – – – –
– – – – – – – – – – –
– – – – – – – – – – –
– – – – – – – – – – –
Vote 2 - Community Services – – – – – – 722 722 722 137 5 619
2.1 - Cemetries – – – – – – – – – 137 4 819
2.2 - Controle Centre – – – – – – – – – – –
2.3 - Housing: Administration – – – – – – – – – – –
2.4 - Library Services – – – – – – – – – – –
2.5 - Fire Protection Sevices – – – – – – 722 722 722 – 800
2.6 - Pine Forest : Administration – – – – – – – – – – –
2.7 - Pine Forest : Security Service – – – – – – – – – – –
2.8 - Pine Forest:Semi Permanent Uni – – – – – – – – – – –
2.9 - Pine Forest : Cleaning Service – – – – – – – – – – –
2.10 - Pine Forest : Swimming Pool – – – – – – – – – – –
Vote 3 - Community Services 620 620 – – – – 410 410 1 030 – 80
3.1 - Community Halls And Facilities 580 580 – – – – 410 410 990 – 40
3.2 - Klipriver Park: Administration – – – – – – – – – – –
3.3 - Kliprivirpark:Cleaning Service – – – – – – – – – – –
3.4 - Klipriver Park: Swimming Pool – – – – – – – – – – –
3.5 - Licensing & Regulation – – – – – – – – – – –
3.6 - Enviromental Protection – – – – – – – – – – –
3.7 - Parks 40 40 – – – – – – 40 – 40
3.8 - Traffic – – – – – – – – – – –
3.9 - Disaster Management – – – – – – – – – – –
3.10 - Social & Welfare Services – – – – – – – – – – –
Prepared by : SAMRASm
Date : 2020/08/20 11:54 AM
32

Budget Year +1
2021/22
Budget Year +2
2022/23
Original Budget Prior Adjusted Accum. FundsMulti-year
capitalUnfore. Unavoid.
Nat. or Prov.
GovtOther Adjusts. Total Adjusts. Adjusted Budget Adjusted Budget Adjusted Budget
[Insert departmental structure etc] 3 4 5 6 7 8 9 10
R thousands A A1 B C D E F G H
Vote Description
Ref
Budget Year 2020/21
Vote 4 - Community Services 30 30 – – – – 1 478 1 478 1 508 – 30
4.1 - Housing Construction – – – – – – – – – – –
4.2 - Director: Community Services – – – – – – – – – – –
4.3 - Recreational Land 30 30 – – – – – – 30 – 30
4.4 - Swimming Pools – – – – – – – – – – –
4.5 - Vehicle Licensing & Testing – – – – – – – – – – –
4.6 - Property Maintenance – – – – – – – – – – –
4.7 - L E D – – – – – – 1 478 1 478 1 478 – –
4.8 - Housing : Maintenance – – – – – – – – – – –
4.9 - Thusong Centre – – – – – – – – – – –
– – – – – – – – – – –
Vote 5 - Corporate Services 1 050 1 948 – – – – 2 280 2 280 4 228 – 600
5.1 - Property Administration – – – – – – – – – – –
5.2 - Information Tecnology 450 450 – – – – – – 450 – 600
5.3 - Human Resources – – – – – – – – – – –
5.4 - Council Cost 600 1 498 – – – – 850 850 2 348 – –
5.5 - Town Secretary – – – – – – – – – – –
5.6 - Tourism – – – – – – – – – – –
5.7 - Director Corporate Services – – – – – – – – – – –
5.8 - Marketing & Communications – – – – – – – – – – –
5.9 - Administration – – – – – – 1 430 1 430 1 430 – –
– – – – – – – – – – –
Vote 6 - Technical Services 18 775 19 128 – – – – 5 378 5 378 24 506 45 658 14 919
6.1 - Building Regulations & Enforce – – – – – – – – – – –
6.2 - Electricity: Administration – 1 250 – – – – 435 435 1 685 3 000 4 000
6.3 - Electricity: Street Lights – – – – – – – – – – –
6.4 - Electricity: Distribution – – – – – – – – – – –
6.5 - Mechanical Workshop 350 350 – – – – 20 20 370 – –
6.6 - Public Toilets – – – – – – – – – – –
6.7 - Sewerage 12 528 12 528 – – – – – – 12 528 – 1 500
6.8 - Town Planning – – – – – – – – – – –
6.9 - Stormwater Management – – – – – – – – – – –
6.10 - Roads 5 897 5 000 – – – – 4 924 4 924 9 923 42 658 9 419
Prepared by : SAMRASm
Date : 2020/08/20 11:54 AM
33

Budget Year +1
2021/22
Budget Year +2
2022/23
Original Budget Prior Adjusted Accum. FundsMulti-year
capitalUnfore. Unavoid.
Nat. or Prov.
GovtOther Adjusts. Total Adjusts. Adjusted Budget Adjusted Budget Adjusted Budget
[Insert departmental structure etc] 3 4 5 6 7 8 9 10
R thousands A A1 B C D E F G H
Vote Description
Ref
Budget Year 2020/21
Vote 7 - Technical Services 10 465 10 465 – – – – 501 501 10 966 11 279 9 526
7.1 - Solid Waste (Dumping Site) – – – – – – – – – – –
7.2 - Solid Waste (Garden) – – – – – – – – – – –
7.3 - Solid Waste (Removal) – – – – – – 501 501 501 – –
7.4 - Water Storage – – – – – – – – – 11 279 –
7.5 - Water Distribution 10 465 10 465 – – – – – – 10 465 – 9 526
7.6 - Director: Technical Services – – – – – – – – – – –
7.7 - Electricity: Client Services – – – – – – – – – – –
7.8 - Electricity: Generation – – – – – – – – – – –
– – – – – – – – – – –
– – – – – – – – – – –
Capital single-year expenditure sub-total 30 940 32 190 – – – – 10 872 10 872 43 063 57 075 30 774
Total Capital Expenditure 88 764 88 764 – – – – 11 592 11 592 100 356 134 196 38 340
Prepared by : SAMRASm
Date : 2020/08/20 11:54 AM
34

WC022 Witzenberg - Table B6 Adjustments Budget Financial Position - 25 Augustus
Budget Year +1
2021/22
Budget Year +2
2022/23
Original Budget Prior Adjusted Accum. Funds Multi-year capital Unfore. Unavoid. Nat. or Prov. Govt Other Adjusts. Total Adjusts. Adjusted Budget Adjusted Budget Adjusted Budget
3 4 5 6 7 8 9 10
R thousands A A1 B C D E F G H
ASSETS
Current assets
Cash 38 462 114 319 – – – – (7 003) (7 003) 107 316 88 606 66 098
Call investment deposits 1 – – – – – – – – – – –
Consumer debtors 1 38 038 63 257 – – – – 0 0 63 257 51 741 38 692
Other debtors 20 630 3 520 – – – – – – 3 520 4 415 6 104
Current portion of long-term receivables – – – – – – – – – – –
Inventory 11 693 11 464 – – – – – – 11 464 11 464 11 464
Total current assets 108 824 192 559 – – – – (7 003) (7 003) 185 556 156 225 122 358
Non current assets
Long-term receivables – – – – –
Investments – – – – –
Investment property 44 492 44 325 – – – – – – 44 325 44 325 44 325
Investment in Associate – – – – –
Property, plant and equipment 1 1 002 139 997 083 – – – – 8 114 8 114 1 005 197 1 096 474 1 091 896
Agricultural – – – – –
Biological – – – – –
Intangible 2 029 2 606 – – – – – – 2 606 2 606 2 606
Other non-current assets 550 550 – – – – – – 550 550 550
Total non current assets 1 049 210 1 044 563 – – – – 8 114 8 114 1 052 677 1 143 955 1 139 376
TOTAL ASSETS 1 158 034 1 237 123 – – – – 1 111 1 111 1 238 234 1 300 180 1 261 734
LIABILITIES
Current liabilities
Bank overdraft – – – – –
Borrowing – – – – – – – – – – –
Consumer deposits 7 150 7 544 – – – – – – 7 544 7 544 7 544
Trade and other payables 47 310 141 209 – – – – – – 141 209 141 209 141 209
Provisions 76 091 56 427 – – – – – – 56 427 83 238 110 049
Total current liabilities 130 550 205 180 – – – – – – 205 180 231 991 258 802
Non current liabilities
Borrowing 1 4 722 4 588 – – – – – – 4 588 4 588 4 588
Provisions 1 180 655 165 513 – – – – – – 165 513 172 988 180 463
Total non current liabilities 185 378 170 101 – – – – – – 170 101 177 576 185 050
TOTAL LIABILITIES 315 928 375 281 – – – – – – 375 281 409 566 443 852
NET ASSETS 2 842 106 861 842 – – – – 1 111 1 111 862 953 890 614 817 882
COMMUNITY WEALTH/EQUITY
Accumulated Surplus/(Deficit) 831 751 851 487 – – – – 1 111 1 111 852 598 880 259 807 527
Reserves 10 355 10 355 – – – – – – 10 355 10 355 10 355
Minorities' interests – – – – – – – – – – –
TOTAL COMMUNITY WEALTH/EQUITY 842 106 861 842 – – – – 1 111 1 111 862 953 890 613 817 882
Budget Year 2020/21
Description Ref
Prepared by : SAMRASm
Date : 2020/08/20 11:54 AM
35

WC022 Witzenberg - Table B7 Adjustments Budget Cash Flows - 25 Augustus
Budget Year
+1 2021/22
Budget Year
+2 2022/23
Original
BudgetPrior Adjusted Accum. Funds
Multi-year
capital
Unfore.
Unavoid.
Nat. or Prov.
GovtOther Adjusts. Total Adjusts.
Adjusted
Budget
Adjusted
Budget
Adjusted
Budget
3 4 5 6 7 8 9 10
R thousands A A1 B C D E F G H
CASH FLOW FROM OPERATING ACTIVITIES
Receipts
Property rates 72 569 72 569 – – – – – – 72 569 77 649 81 531
Service charges 315 962 335 325 – – – – – – 335 325 356 922 389 389
Other revenue 21 754 21 754 – – – – (0) (0) 21 753 27 760 26 341
Government - operating 1 116 989 116 989 – – – – 2 899 2 899 119 888 125 089 166 900
Government - capital 1 78 716 78 716 – – – – 3 271 3 271 81 987 120 459 28 167
Interest 17 393 11 608 – – – – – – 11 608 12 189 11 822
Dividends – – – – – – – – – – –
Payments
Suppliers and employees (557 432) (558 947) – – – – (5 059) (5 059) (564 006) (600 562) (652 709)
Finance charges (1 332) (1 706) – – – – – – (1 706) (2 160) (2 633)
Transfers and Grants 1 (2 179) (2 179) – – – – – – (2 179) (1 859) (32 976)
NET CASH FROM/(USED) OPERATING ACTIVITIES 62 440 74 129 – – – – 1 111 1 111 75 240 115 485 15 832
CASH FLOWS FROM INVESTING ACTIVITIES
Receipts
Proceeds on disposal of PPE – – – – – – – – – – –
Decrease (Increase) in non-current debtors – – – – – – – – – – –
Decrease (increase) other non-current receivables – – – – – – – – – – –
Decrease (increase) in non-current investments – – – – – – – – – – –
Payments
Capital assets (88 764) (88 764) – – – – (8 114) (8 114) (96 878) (134 196) (38 340)
NET CASH FROM/(USED) INVESTING ACTIVITIES (88 764) (88 764) – – – – (8 114) (8 114) (96 878) (134 196) (38 340)
CASH FLOWS FROM FINANCING ACTIVITIES
Receipts
Short term loans – – – – – – – – – – –
Borrowing long term/refinancing – – – – – – – – – – –
Increase (decrease) in consumer deposits – – – – – – – – – – –
Payments
Repayment of borrowing (1 500) – – – – – – – – – –
NET CASH FROM/(USED) FINANCING ACTIVITIES (1 500) – – – – – – – – – –
NET INCREASE/ (DECREASE) IN CASH HELD (27 824) (14 635) – – – – (7 003) (7 003) (21 638) (18 710) (22 508)
Cash/cash equivalents at the year begin: 2 66 287 128 954 – – – – – – 128 954 107 316 88 606
Cash/cash equivalents at the year end: 2 38 463 114 319 – – – – (7 003) (7 003) 107 316 88 606 66 098
Description Ref
Budget Year 2020/21
Prepared by : SAMRASm
Date : 2020/08/20 11:54 AM
36

WC022 Witzenberg - Table B8 Cash backed reserves/accumulated surplus reconciliation - 25 Augustus
Budget Year
+1 2021/22
Budget Year
+2 2022/23
Original
BudgetPrior Adjusted Accum. Funds
Multi-year
capital
Unfore.
Unavoid.
Nat. or Prov.
GovtOther Adjusts. Total Adjusts.
Adjusted
Budget
Adjusted
Budget
Adjusted
Budget
3 4 5 6 7 8 9 10
R thousands A A1 B C D E F G H
Cash and investments available
Cash/cash equivalents at the year end 1 38 463 114 319 – – – – (7 003) (7 003) 107 316 88 606 66 098
Other current investments > 90 days (0) – – – – – – – – – –
Non current assets - Investments 1 – – – – – – – – – – –
Cash and investments available: 38 462 114 319 – – – – (7 003) (7 003) 107 316 88 606 66 098
Applications of cash and investments
Unspent conditional transfers – – – – – – – – – – –
Unspent borrowing 957 957 – – – – – – 957 1 001 1 051
Statutory requirements – – – – – – – – – – –
Other working capital requirements 2 (4 499) 79 457 (0) (0) 79 457 89 489 99 886
Other provisions 15 15 – – – – – – 15 15 16
Long term investments committed – – – – – – –
Reserves to be backed by cash/investments 862 815 882 551 1 111 1 111 883 662 911 323 838 591
Total Application of cash and investments: 859 288 962 980 – – – – 1 111 1 111 964 091 1 001 829 939 545
Surplus(shortfall) (820 826) (848 661) – – – – (8 114) (8 114) (856 775) (913 223) (873 447)
References
1. Must reconcile with the Adjustments Budget Cash Flow and Adjustements Budget Financial Position
2. Council approval for policy required - include sufficient working capital (e.g. allowing for a % of current debtors > 90 days as uncollectable)
7. Adjustments to transfers from National or Provincial Government
9. G = B + C + D + E + F
Other working capital requirements
Debtors 51 809 61 752 61 752 51 720 41 323
Creditors due 47 310 141 209 141 209 141 209 141 209
Total 4 499 (79 457) (79 457) (89 489) (99 886)
Debtors collection assumptions:
Balance outstanding - debtors 58 669 66 777 66 777 56 156 44 796
Estimate of debtors collection rate 88% 92% 92% 92% 92%
10. Adjusted Budget H = (A or A1/2 etc) + G
6. Adjustments approved in accordance with MFMA section 29
5. Increases of funds approved under MFMA section 31
RefDescription
4. Additional cash-backed accumulated funds/unspent funds (MFMA section 18(1)(b) and section 28(2)(e)) identified after the Original Budget approved and after annual financial statements audited (note: only where underspending could not reasonably
have been foreseen)
Budget Year 2020/21
3. Only complete if a previous adjusted budget has been approved in the same financial year. Reflect most recent adjusted budget.
8. Adjusts. = 'Other' Adjustments proposed to be approved; including revenue under-collection (MFMA section 28(2)(a)); additional revenue appropriation on existing programmes (section 28(2))(b); projected savings (section 28(2)(d)); error correction
(section 28(2)(f))
Prepared by : SAMRASm
Date : 2020/08/20 11:54 AM
37

Budget Year
+1 2021/22
Budget Year
+2 2022/23
Original
BudgetPrior Adjusted Accum. Funds
Multi-year
capital
Unfore.
Unavoid.
Nat. or Prov.
GovtOther Adjusts. Total Adjusts.
Adjusted
Budget
Adjusted
Budget
Adjusted
Budget
3 4 5 6 7 8 9 10
R thousands A A1 B C D E F G H
RefDescription
Budget Year 2020/21
Long term investments committed
Balance (Insert description; eg sinking fund)
Bankers Acceptance Certificate – – – – – – – – – – –
Deposit Taking Institutions – – – – – – – – – – –
Bank Repurchase Agreements – – – – – – – – – – –
Derivative Financial Assets – – – – – – – – – – –
Guaranteed Endowment Policies (Sinking) – – – – – – – – – – –
Listed/Unlisted Bonds and Stocks – – – – – – – – – – –
Municipal Bonds – – – – – – – – – – –
National Government Securities – – – – – – – – – – –
Negotiable Certificate of Deposits: Banks – – – – – – – – – – –
Unamortised Debt Expense – – – – – – – – – – –
Unamortised Preference Share Expense – – – – – – – – – – –
Interest Rate Swaps – – – – – – – – – – –
– – – – – – – – – – –
Reserves to be backed by cash/investments
Housing Development Fund
Capital replacement 10 355 10 355 10 355 10 355 10 355
Self-insurance
Other reserves (list)
Compensation for Occupational Injuries and Diseases
Employee Benefit Reserve 10 355 10 355 10 355 10 355 10 355
Non-current Provisions Reserve 842 106 861 842 1 111 1 111 862 953 890 613 817 882
Valuation Reserve
Investment in associate account
Capitalisation Reserve
Revaluation
862 815 882 551 – – – – 1 111 1 111 883 662 911 323 838 591
Prepared by : SAMRASm
Date : 2020/08/20 11:54 AM
38

WC022 Witzenberg - Table B9 Asset Management - 25 Augustus
Budget Year
+1 2021/22
Budget Year
+2 2022/23
Original
BudgetPrior Adjusted Accum. Funds
Multi-year
capital
Unfore.
Unavoid.
Nat. or Prov.
GovtOther Adjusts. Total Adjusts.
Adjusted
Budget
Adjusted
Budget
Adjusted
Budget
7 8 9 10 11 12 13 14
R thousands A A1 B C D E F G H
CAPITAL EXPENDITURE
Total New Assets to be adjusted 1 74 627 76 774 – – – – 5 238 5 238 82 013 46 866 26 747
Roads Infrastructure 13 417 13 417 – – – – – – 13 417 935 1 565
Storm water Infrastructure 13 819 13 819 – – – – – – 13 819 – –
Electrical Infrastructure – 1 250 – – – – 435 435 1 685 4 565 4 000
Water Supply Infrastructure 26 896 26 896 – – – – – – 26 896 28 670 8 026
Sanitation Infrastructure 10 228 10 228 – – – – – – 10 228 – –
Solid Waste Infrastructure 9 356 9 356 – – – – 1 157 1 157 10 513 12 384 –
Rail Infrastructure – – – – – – – – – – –
Coastal Infrastructure – – – – – – – – – – –
Information and Communication Infrastructure – – – – – – – – – – –
Infrastructure 73 717 74 967 – – – – 1 592 1 592 76 558 46 555 13 591
Community Facilities – – – – – – 1 478 1 478 1 478 311 11 645
Sport and Recreation Facilities 30 30 – – – – – – 30 – 30
Community Assets 30 30 – – – – 1 478 1 478 1 508 311 11 675
Heritage Assets – – – – – – – – – – –
Revenue Generating – – – – – – – – – – –
Non-revenue Generating – – – – – – – – – – –
Investment properties – – – – – – – – – – –
Operational Buildings – – – – – – – – – – –
Housing – – – – – – – – – – –
Other Assets 6 – – – – – – – – – – –
Biological or Cultivated Assets – – – – – – – – – – –
Servitudes – – – – – – – – – – –
Licences and Rights – – – – – – – – – – –
Intangible Assets – – – – – – – – – – –
Computer Equipment 450 450 – – – – 0 0 450 – 600
Furniture and Office Equipment – – – – – – – – – – –
Machinery and Equipment 430 1 328 – – – – 1 447 1 447 2 775 – 80
Transport Assets – – – – – – 722 722 722 – 800
Libraries – – – – – – – – – – –
Zoo's, Marine and Non-biological Animals – – – – – – – – – – –
Budget Year 2020/21
Description Ref
Prepared by : SAMRASm
Date : 2020/08/20 11:54 AM
39

Budget Year
+1 2021/22
Budget Year
+2 2022/23
Original
BudgetPrior Adjusted Accum. Funds
Multi-year
capital
Unfore.
Unavoid.
Nat. or Prov.
GovtOther Adjusts. Total Adjusts.
Adjusted
Budget
Adjusted
Budget
Adjusted
Budget
7 8 9 10 11 12 13 14
R thousands A A1 B C D E F G H
Budget Year 2020/21
Description Ref
Total Renewal of Existing Assets to be adjusted 2 4 900 4 900 – – – – 1 430 1 430 6 330 – 5 000
Roads Infrastructure 1 800 1 800 – – – – – – 1 800 – 2 000
Storm water Infrastructure – – – – – – – – – – –
Electrical Infrastructure – – – – – – – – – – –
Water Supply Infrastructure 500 500 – – – – – – 500 – 1 500
Sanitation Infrastructure 2 000 2 000 – – – – – – 2 000 – 1 500
Solid Waste Infrastructure – – – – – – – – – – –
Rail Infrastructure – – – – – – – – – – –
Coastal Infrastructure – – – – – – – – – – –
Information and Communication Infrastructure – – – – – – – – – – –
Infrastructure 4 300 4 300 – – – – – – 4 300 – 5 000
Community Facilities – – – – – – – – – – –
Sport and Recreation Facilities – – – – – – – – – – –
Community Assets – – – – – – – – – – –
Heritage Assets – – – – – – – – – – –
Revenue Generating – – – – – – – – – – –
Non-revenue Generating – – – – – – – – – – –
Investment properties – – – – – – – – – – –
Operational Buildings 600 600 – – – – 1 430 1 430 2 030 – –
Housing – – – – – – – – – – –
Other Assets 6 600 600 – – – – 1 430 1 430 2 030 – –
Biological or Cultivated Assets – – – – – – – – – – –
Servitudes – – – – – – – – – – –
Licences and Rights – – – – – – – – – – –
Intangible Assets – – – – – – – – – – –
Computer Equipment – – – – – – – – – – –
Furniture and Office Equipment – – – – – – – – – – –
Machinery and Equipment – – – – – – – – – – –
Transport Assets – – – – – – – – – – –
Libraries – – – – – – – – – – –
Zoo's, Marine and Non-biological Animals – – – – – – – – – – –
Prepared by : SAMRASm
Date : 2020/08/20 11:54 AM
40

Budget Year
+1 2021/22
Budget Year
+2 2022/23
Original
BudgetPrior Adjusted Accum. Funds
Multi-year
capital
Unfore.
Unavoid.
Nat. or Prov.
GovtOther Adjusts. Total Adjusts.
Adjusted
Budget
Adjusted
Budget
Adjusted
Budget
7 8 9 10 11 12 13 14
R thousands A A1 B C D E F G H
Budget Year 2020/21
Description Ref
Total Upgrading of Existing Assets to be adjusted 2a 9 237 7 090 – – – – 4 924 4 924 12 013 87 330 6 593
Roads Infrastructure 5 028 4 130 – – – – 4 924 4 924 9 054 52 870 2 593
Storm water Infrastructure – – – – – – – – – 11 320 –
Electrical Infrastructure 2 500 1 250 – – – – – – 1 250 500 4 000
Water Supply Infrastructure – – – – – – – – – 11 320 –
Sanitation Infrastructure 840 840 – – – – – – 840 11 320 –
Solid Waste Infrastructure – – – – – – – – – – –
Rail Infrastructure – – – – – – – – – – –
Coastal Infrastructure – – – – – – – – – – –
Information and Communication Infrastructure – – – – – – – – – – –
Infrastructure 8 368 6 220 – – – – 4 924 4 924 11 144 87 330 6 593
Community Facilities – – – – – – – – – – –
Sport and Recreation Facilities 870 870 – – – – – – 870 – –
Community Assets 870 870 – – – – – – 870 – –
Heritage Assets – – – – – – – – – – –
Revenue Generating – – – – – – – – – – –
Non-revenue Generating – – – – – – – – – – –
Investment properties – – – – – – – – – – –
Operational Buildings – – – – – – – – – – –
Housing – – – – – – – – – – –
Other Assets 6 – – – – – – – – – – –
Biological or Cultivated Assets – – – – – – – – – – –
Servitudes – – – – – – – – – – –
Licences and Rights – – – – – – – – – – –
Intangible Assets – – – – – – – – – – –
Computer Equipment – – – – – – – – – – –
Furniture and Office Equipment – – – – – – – – – – –
Machinery and Equipment – – – – – – – – – – –
Transport Assets – – – – – – – – – – –
Libraries – – – – – – – – – – –
Zoo's, Marine and Non-biological Animals – – – – – – – – – – –
Prepared by : SAMRASm
Date : 2020/08/20 11:54 AM
41

Budget Year
+1 2021/22
Budget Year
+2 2022/23
Original
BudgetPrior Adjusted Accum. Funds
Multi-year
capital
Unfore.
Unavoid.
Nat. or Prov.
GovtOther Adjusts. Total Adjusts.
Adjusted
Budget
Adjusted
Budget
Adjusted
Budget
7 8 9 10 11 12 13 14
R thousands A A1 B C D E F G H
Budget Year 2020/21
Description Ref
Total Capital Expenditure to be adjusted 4
Roads Infrastructure 20 245 19 347 – – – – 4 924 4 924 24 271 53 804 6 158
Storm water Infrastructure 13 819 13 819 – – – – – – 13 819 11 320 –
Electrical Infrastructure 2 500 2 500 – – – – 435 435 2 935 5 065 8 000
Water Supply Infrastructure 27 396 27 396 – – – – – – 27 396 39 990 9 526
Sanitation Infrastructure 13 068 13 068 – – – – – – 13 068 11 320 1 500
Solid Waste Infrastructure 9 356 9 356 – – – – 1 157 1 157 10 513 12 384 –
Rail Infrastructure – – – – – – – – – – –
Coastal Infrastructure – – – – – – – – – – –
Information and Communication Infrastructure – – – – – – – – – – –
Infrastructure 86 384 85 487 – – – – 6 516 6 516 92 002 133 884 25 184
Community Facilities – – – – – – 1 478 1 478 1 478 311 11 645
Sport and Recreation Facilities 900 900 – – – – – – 900 – 30
Community Assets 900 900 – – – – 1 478 1 478 2 377 311 11 675
Heritage Assets – – – – – – – – – – –
Revenue Generating – – – – – – – – – – –
Non-revenue Generating – – – – – – – – – – –
Investment properties – – – – – – – – – – –
Operational Buildings 600 600 – – – – 1 430 1 430 2 030 – –
Housing – – – – – – – – – – –
Other Assets 600 600 – – – – 1 430 1 430 2 030 – –
Biological or Cultivated Assets – – – – – – – – – – –
Servitudes – – – – – – – – – – –
Licences and Rights – – – – – – – – – – –
Intangible Assets – – – – – – – – – – –
Computer Equipment 450 450 – – – – 0 0 450 – 600
Furniture and Office Equipment – – – – – – – – – – –
Machinery and Equipment 430 1 328 – – – – 1 447 1 447 2 775 – 80
Transport Assets – – – – – – 722 722 722 – 800
Libraries – – – – – – – – – – –
Zoo's, Marine and Non-biological Animals – – – – – – – – – – –
TOTAL CAPITAL EXPENDITURE to be adjusted 4 88 764 88 764 – – – – 11 592 11 592 100 356 134 196 38 340
Prepared by : SAMRASm
Date : 2020/08/20 11:54 AM
42

Budget Year
+1 2021/22
Budget Year
+2 2022/23
Original
BudgetPrior Adjusted Accum. Funds
Multi-year
capital
Unfore.
Unavoid.
Nat. or Prov.
GovtOther Adjusts. Total Adjusts.
Adjusted
Budget
Adjusted
Budget
Adjusted
Budget
7 8 9 10 11 12 13 14
R thousands A A1 B C D E F G H
Budget Year 2020/21
Description Ref
ASSET REGISTER SUMMARY - PPE (WDV) 5
Roads Infrastructure 157 605 157 605 – – – – 8 402 8 402 166 007 196 302 155 308
Storm water Infrastructure 99 612 99 612 – – – – – – 99 612 99 095 87 775
Electrical Infrastructure 61 221 61 221 – – – – 435 435 61 656 67 994 69 929
Water Supply Infrastructure 172 067 172 067 – – – – – – 172 067 190 129 177 056
Sanitation Infrastructure 156 448 156 448 – – – – – – 156 448 161 361 151 541
Solid Waste Infrastructure 28 535 28 535 – – – – 1 157 1 157 29 692 33 217 20 833
Rail Infrastructure – – – – – – – – – – –
Coastal Infrastructure – – – – – – – – – – –
Information and Communication Infrastructure 2 023 2 023 – – – – – – 2 023 2 023 2 023
Infrastructure 677 511 677 511 – – – – 9 994 9 994 687 505 750 122 664 466
Community Assets 62 538 62 538 – – – – 1 478 1 478 64 016 65 632 70 343
Heritage Assets 550 550 – – – – – – 550 550 550
Investment properties 43 789 43 789 – – – – – – 43 789 44 492 44 492
Other Assets 180 777 180 777 – – – – 1 430 1 430 182 207 187 640 170 249
Biological or Cultivated Assets – – – – – – – – – – –
Intangible Assets 1 652 1 652 – – – – – – 1 652 2 029 2 029
Computer Equipment 69 69 – – – – – – 69 2 055 2 655
Furniture and Office Equipment 1 700 1 700 – – – – – – 1 700 1 688 1 688
Machinery and Equipment 6 518 6 518 – – – – 1 447 1 447 7 964 7 014 8 094
Transport Assets (2 175) (2 175) – – – – 722 722 (1 453) (2 175) (1 375)
Libraries 75 906 75 906 – – – – – – 75 906 75 906 75 906
Zoo's, Marine and Non-biological Animals – – – – – – – – – – –
TOTAL ASSET REGISTER SUMMARY - PPE (WDV) 5 1 048 835 1 048 835 – – – – 15 070 15 070 1 063 904 1 134 954 1 039 098
Prepared by : SAMRASm
Date : 2020/08/20 11:54 AM
43

Budget Year
+1 2021/22
Budget Year
+2 2022/23
Original
BudgetPrior Adjusted Accum. Funds
Multi-year
capital
Unfore.
Unavoid.
Nat. or Prov.
GovtOther Adjusts. Total Adjusts.
Adjusted
Budget
Adjusted
Budget
Adjusted
Budget
7 8 9 10 11 12 13 14
R thousands A A1 B C D E F G H
Budget Year 2020/21
Description Ref
EXPENDITURE OTHER ITEMS
Depreciation & asset impairment 40 688 40 688 – – – – – – 40 688 42 918 42 918
Repairs and Maintenance by asset class 3 18 282 18 582 – – – – – – 18 582 19 454 20 350
Roads Infrastructure 6 864 6 864 – – – – – – 6 864 7 182 7 542
Storm water Infrastructure 2 044 2 044 – – – – – – 2 044 2 130 2 224
Electrical Infrastructure 1 931 2 231 – – – – – – 2 231 2 059 2 129
Water Supply Infrastructure 1 270 1 270 – – – – – – 1 270 1 329 1 395
Sanitation Infrastructure 2 151 2 151 – – – – – – 2 151 2 255 2 367
Solid Waste Infrastructure – – – – – – – – – – –
Rail Infrastructure – – – – – – – – – – –
Coastal Infrastructure – – – – – – – – – – –
Information and Communication Infrastructure – – – – – – – – – – –
Infrastructure 14 259 14 559 – – – – – – 14 559 14 955 15 658
Community Facilities 581 581 – – – – – – 581 607 637
Sport and Recreation Facilities 400 400 – – – – – – 400 419 440
Community Assets 981 981 – – – – – – 981 1 026 1 077
Heritage Assets – – – – – – – – – – –
Revenue Generating – – – – – – – – – – –
Non-revenue Generating – – – – – – – – – – –
Investment properties – – – – – – – – – – –
Operational Buildings 338 338 – – – – – – 338 361 386
Housing 157 157 – – – – – – 157 165 173
Other Assets 495 495 – – – – – – 495 526 559
Biological or Cultivated Assets – – – – – – – – – – –
Servitudes – – – – – – – – – – –
Licences and Rights – – – – – – – – – – –
Intangible Assets – – – – – – – – – – –
Computer Equipment 328 328 – – – – – – 328 345 362
Furniture and Office Equipment 37 37 – – – – – – 37 39 41
Machinery and Equipment 271 271 – – – – – – 271 283 297
Transport Assets 1 912 1 912 – – – – – – 1 912 2 282 2 357
Libraries – – – – – – – – – – –
Zoo's, Marine and Non-biological Animals 6 – – – – – – – – – – –
TOTAL EXPENDITURE OTHER ITEMS to be adjusted 58 970 59 270 – – – – – – 59 270 62 373 63 268
Renewal and upgrading of Existing Assets as % of total capex 15.9% 13.5% 18.3% 65.1% 30.2%
Renewal and upgrading of Existing Assets as % of deprecn" 34.7% 29.5% 45.1% 203.5% 27.0%
R&M as a % of PPE 1.7% 1.8% 1.7% 1.7% 2.0%
Renewal and upgrading and R&M as a % of PPE 3.1% 2.9% 3.5% 9.4% 3.1%
Prepared by : SAMRASm
Date : 2020/08/20 11:54 AM
44

WC022 Witzenberg - Table B10 Basic service delivery measurement - 25 Augustus
Budget Year
+1 2021/22
Budget Year
+2 2022/23
Original
BudgetPrior Adjusted Accum. Funds
Multi-year
capital
Unfore.
Unavoid.
Nat. or Prov.
GovtOther Adjusts. Total Adjusts.
Adjusted
Budget
Adjusted
Budget
Adjusted
Budget
7 8 9 10 11 12 13 14
A A1 B C D E F G H
Household service targets 1
Water:
Piped water inside dwelling 10845 10845 – 11 10845 10845
Piped water inside yard (but not in dwelling) 1691 1691 – 2 1691 1691
Using public tap (at least min.service level) 2 – –
Other water supply (at least min.service level) – –
Minimum Service Level and Above sub-total 13 13 – – – – – – 13 13 13
Using public tap (< min.service level) 3 – –
Other water supply (< min.service level) 3,4 – –
No water supply – –
Below Minimum Servic Level sub-total – – – – – – – – – – –
Total number of households 5 13 13 – – – – – – 13 13 13
Sanitation/sewerage:
Flush toilet (connected to sewerage) 10300 10300 – 10 300 10300 10300
Flush toilet (with septic tank) 730 730 – 730 730 730
Chemical toilet – –
Pit toilet (ventilated) – –
Other toilet provisions (> min.service level) – –
Minimum Service Level and Above sub-total 11 030 11 030 – – – – – – 11 030 11 030 11 030
Bucket toilet – –
Other toilet provisions (< min.service level) – –
No toilet provisions – –
Below Minimum Servic Level sub-total – – – – – – – – – – –
Total number of households 5 11 030 11 030 – – – – – – 11 030 11 030 11 030
Energy:
Electricity (at least min. service level) 1769 1769 – 1 769 1769 1769
Electricity - prepaid (> min.service level) 11264 11264 – 11 264 11264 11264
Minimum Service Level and Above sub-total 13 033 13 033 – – – – – – 13 033 13 033 13 033
Electricity (< min.service level) – –
Electricity - prepaid (< min. service level) – –
Other energy sources – –
Below Minimum Servic Level sub-total – – – – – – – – – – –
Total number of households 5 13 033 13 033 – – – – – – 13 033 13 033 13 033
Refuse:
Removed at least once a week (min.service) 11067 11067 – 11 067 11067 11067
Minimum Service Level and Above sub-total 11 067 11 067 – – – – – – 11 067 11 067 11 067
Removed less frequently than once a week – –
Using communal refuse dump – –
Using own refuse dump – –
Other rubbish disposal – –
No rubbish disposal – –
Below Minimum Servic Level sub-total – – – – – – – – – – –
Total number of households 5 11 067 11 067 – – – – – – 11 067 11 067 11 067
Description Ref
Budget Year 2020/21
Prepared by : SAMRASm
Date : 2020/08/20 11:54 AM
45

Households receiving Free Basic Service 15
Water (6 kilolitres per household per month) – –
Sanitation (free minimum level service) – –
Electricity/other energy (50kwh per household per month) – –
Refuse (removed at least once a week) – –
Cost of Free Basic Services provided (R'000) 16
Water (6 kilolitres per household per month) 6 451 6 451 – – – – – – 6 451 6 513 6 579
Sanitation (free sanitation service) – – – – – – – – – – –
Electricity/other energy (50kwh per household per month) – – – – – – – – – – –
Refuse (removed once a week) – – – – – – – – – – –
Total cost of FBS provided (minimum social package) 6 451 6 451 – – – – – – 6 451 6 513 6 579
Highest level of free service provided
Property rates (R'000 value threshold) 100000 100000 – 100 000 100000 100000
Water (kilolitres per household per month) 6 6 – 6 6 6
Sanitation (kilolitres per household per month) – –
Sanitation (Rand per household per month) – –
Electricity (kw per household per month) 50 50 – 50 50 50
Refuse (average litres per week) 20 20 – 20 20 20
Revenue cost of free services provided (R'000) 17
Property rates (tariff adjustment) ( impermissable values per section 17 of MPRA) – – – – – – – – – – –
Property rates exemptions, reductions and rebates and impermissable values
in excess of section 17 of MPRA)12 689 12 689 – – – – – – 12 689 13 577 14 256
Water (in excess of 6 kilolitres per indigent household per month) – – – – – – – – – – –
Sanitation (in excess of free sanitation service to indigent households) 15 161 15 161 – – – – – – 15 161 16 071 16 874
Electricity/other energy (in excess of 50 kwh per indigent household per month) 5 080 5 080 – – – – – – 5 080 5 483 5 988
Refuse (in excess of one removal a week for indigent households) 12 040 12 040 – – – – – – 12 040 12 762 13 528
Municipal Housing - rental rebates 24 24 – – – – – – 24 25 27
Housing - top structure subsidies 6 – – – – – – – – – – –
Other – – – – – – – – – – –
Total revenue cost of subsidised services provided 44 994 44 994 – – – – – – 44 994 47 918 50 672
Prepared by : SAMRASm
Date : 2020/08/20 11:54 AM
46

WC022 Witzenberg - Supporting Table SB1 Supporting detail to 'Budgeted Financial Performance' - 25 Augustus
Budget Year
+1 2021/22
Budget Year
+2 2022/23
Original
BudgetPrior Adjusted Accum. Funds
Multi-year
capital
Unfore.
Unavoid.
Nat. or Prov.
GovtOther Adjusts. Total Adjusts.
Adjusted
Budget
Adjusted
Budget
Adjusted
Budget
6 7 8 9 10 11 12 13
R thousands A A1 B C D E F G H
REVENUE ITEMS:
Property rates
Total Property Rates 89 077 89 077 – – – – – – 89 077 95 313 100 078
less Revenue Foregone (exemptions, reductions and rebates and
impermissable values in excess of section 17 of MPRA) 12 689 12 689 – – – – – – 12 689 13 577 14 256
Net Property Rates 76 388 76 388 – – – – – – 76 388 81 736 85 822
Service charges - electricity revenue
Total Service charges - electricity revenue 272 053 272 053 – – – – – – 272 053 289 598 318 903
less Revenue Foregone (in excess of 50 kwh per indigent household per
month)5 080 5 080 – – – – – – 5 080 5 483 5 988
less Cost of Free Basic Services (50 kwh per indigent household per
month)– – – – – – – – – – –
Net Service charges - electricity revenue 266 973 266 973 – – – – – – 266 973 284 115 312 915
Service charges - water revenue
Total Service charges - water revenue 41 588 41 588 – – – – – – 41 588 44 143 46 400
less Revenue Foregone (in excess of 6 kilolitres per indigent household per
month)– – – – – – – – – – –
less Cost of Free Basic Services (6 kilolitres per indigent household per
month)6 451 6 451 – – – – – – 6 451 6 513 6 579
Net Service charges - water revenue 35 137 35 137 – – – – – – 35 137 37 630 39 821
Service charges - sanitation revenue
Total Service charges - sanitation revenue 33 513 33 513 – – – – – – 33 513 35 523 37 300
less Revenue Foregone (in excess of free sanitation service to indigent
households)15 161 15 161 – – – – – – 15 161 16 071 16 874
less Cost of Free Basic Services (free sanitation service to indigent
households)– – – – – – – – – – –
Net Service charges - sanitation revenue 18 352 18 352 – – – – – – 18 352 19 453 20 425
.
Service charges - refuse revenue
Total refuse removal revenue 32 639 32 639 – – – – – – 32 639 34 598 36 328
Total landfill revenue 671 671 – – – – – – 671 712 747
less Revenue Foregone (in excess of one removal a week to indigent
households)12 040 12 040 – – – – – – 12 040 12 762 13 528
less Cost of Free Basic Services (removed once a week to indigent
households)– – – – – – – – – – –
Net Service charges - refuse revenue 21 271 21 271 – – – – – – 21 271 22 547 23 547
Description Ref
Budget Year 2020/21
Prepared by : SAMRASm
Date : 2020/08/20 11:54 AM
47

Budget Year
+1 2021/22
Budget Year
+2 2022/23
Original
BudgetPrior Adjusted Accum. Funds
Multi-year
capital
Unfore.
Unavoid.
Nat. or Prov.
GovtOther Adjusts. Total Adjusts.
Adjusted
Budget
Adjusted
Budget
Adjusted
Budget
6 7 8 9 10 11 12 13
R thousands A A1 B C D E F G H
Description Ref
Budget Year 2020/21
Other Revenue By Source
Fuel Levy – – – – – – – – – – –
Other Revenue – – – – – – – – – – –
Discontinued Operations – – – – – – – – – – –
Rent on Land 22 22 – – – – – – 22 23 25
Operational Revenue 1 167 1 167 – – – – – – 1 167 1 258 1 201
Intercompany/Parent-subsidiary Transactions – – – – – – – – – – –
Surcharges and Taxes 5 495 5 495 – – – – – – 5 495 5 707 3 305
Sales of Goods and Rendering of Services 2 555 2 555 – – – – – – 2 555 4 858 5 101
Gains and Losses : Gains – – – – – – – – – – –
Total 'Other' Revenue 1 9 240 9 240 – – – – – – 9 240 11 847 9 632
EXPENDITURE ITEMS
Employee related costs
Basic Salaries and Wages 133 540 133 540 – – – – – – 133 540 142 609 154 784
Pension and UIF Contributions 19 911 19 911 – – – – – – 19 911 21 601 23 469
Medical Aid Contributions 8 613 8 613 – – – – – – 8 613 9 359 10 169
Overtime 22 22 – – – – – – 22 24 26
Performance Bonus 9 862 9 862 – – – – – – 9 862 10 716 11 674
Motor Vehicle Allowance 6 029 6 029 – – – – – – 6 029 6 551 7 118
Cellphone Allowance 517 517 – – – – – – 517 562 611
Housing Allowances 1 959 1 959 – – – – – – 1 959 2 128 2 312
Other benefits and allowances 15 882 15 882 – – – – – – 15 882 17 245 18 725
Payments in lieu of leave 966 966 – – – – – – 966 1 050 1 140
Long service awards 1 000 1 000 – – – – – – 1 000 1 087 1 181
Post-retirement benefit obligations 4 27 880 27 880 – – – – – – 27 880 29 470 31 469
sub-total 226 182 226 182 – – – – – – 226 182 242 401 262 678
Less: Employees costs capitalised to PPE – – – – – – – – – – –
Total Employee related costs 1 226 182 226 182 – – – – – – 226 182 242 401 262 678
Contributions recognised - capital
List contributions by contract – – – – – – – – – – –
– – – – – – – – – – –
– – – – – – – – – – –
– – – – – – – – – – –
– – – – – – – – – – –
– – – – – – – – – – –
Total Contributions recognised - capital – – – – – – – – – – –
Prepared by : SAMRASm
Date : 2020/08/20 11:54 AM
48

Budget Year
+1 2021/22
Budget Year
+2 2022/23
Original
BudgetPrior Adjusted Accum. Funds
Multi-year
capital
Unfore.
Unavoid.
Nat. or Prov.
GovtOther Adjusts. Total Adjusts.
Adjusted
Budget
Adjusted
Budget
Adjusted
Budget
6 7 8 9 10 11 12 13
R thousands A A1 B C D E F G H
Description Ref
Budget Year 2020/21
Depreciation & asset impairment
Depreciation of Property, Plant & Equipment 40 310 40 310 – – – – – – 40 310 42 520 42 520
Lease amortisation 377 377 – – – – – – 377 398 398
Capital asset impairment – – – – – – – – – – –
Depreciation resulting from revaluation of PPE – – – – – – – – – – –
Total Depreciation & asset impairment 1 40 688 40 688 – – – – – – 40 688 42 918 42 918
Bulk purchases
Electricity Bulk Purchases 232 760 232 760 – – – – – – 232 760 252 871 279 144
Water Bulk Purchases – – – – – – – – – – –
Total bulk purchases 1 232 760 232 760 – – – – – – 232 760 252 871 279 144
Transfers and grants
Cash transfers and grants 2 179 2 179 – – – – – – 2 179 1 859 32 976
Non-cash transfers and grants – – – – – – – – – – –
Total transfers and grants 2 179 2 179 – – – – – – 2 179 1 859 32 976
Contracted services
Outsourced Services 21 656 22 271 – – – – 670 670 22 941 24 819 26 013
Consultants and Professional Services 20 758 20 758 – – – – 2 615 2 615 23 373 20 441 21 253
Contractors 6 071 6 071 – – – – 796 796 6 867 6 748 6 890
sub-total 1 48 486 49 101 – – – – 4 081 4 081 53 182 52 008 54 155
Allocations to organs of state:
Electricity – – – – – – – – – – –
Water – – – – – – – – – – –
Sanitation – – – – – – – – – – –
Other – – – – – – – – – – –
Total contracted services?? 48 486 49 101 – – – – 4 081 4 081 53 182 52 008 54 155
Other Expenditure By Type
Collection costs 1 995 1 995 – – – – – – 1 995 2 087 2 191
Contributions to 'other' provisions 15 15 – – – – – – 15 15 16
Consultant fees – – – – – – – – – – –
Audit fees 3 626 3 626 – – – – – – 3 626 3 792 3 967
General expenses 3,5 – – – – – – – – – – –
Operating Leases 849 849 – – – – – – 849 888 929
Operational Cost 40 286 40 286 – – – – 250 250 40 536 40 252 41 765
Statutory Payments other than Income Taxes – – – – – – – – – – –
Discontinued Operations – – – – – – – – – – –
Gains and Losses : Discontinued Operations and Disposals of Non-current Assets – – – – – – – – – – –
Gains and Losses : Fair Value Adjustment – – – – – – – – – – –
Gains and Losses : Foreign Exchange – – – – – – – – – – –
Gains and Losses : Inventory – – – – – – – – – – –
Gains and Losses : Water Losses – – – – – – – – – – –
Total Other Expenditure 1 46 770 46 770 – – – – 250 250 47 020 47 035 48 867
Repairs and Maintenance by Expenditure Item 14
Employee related costs – – – – – – – – – – –
Other materials – – – – – – – – – – –
Contracted Services – – – – – – – – – – –
Other Expenditure – – – – – – – – – – –
Total Repairs and Maintenance Expenditure 15 – – – – – – – – – – –
Prepared by : SAMRASm
Date : 2020/08/20 11:54 AM
49

WC022 Witzenberg - Supporting Table SB2 Supporting detail to 'Financial Position Budget' - 25 Augustus
Budget Year
+1 2021/22
Budget Year
+2 2022/23
Original
BudgetPrior Adjusted Accum. Funds
Multi-year
capital
Unfore.
Unavoid.
Nat. or Prov.
GovtOther Adjusts. Total Adjusts.
Adjusted
Budget
Adjusted
Budget
Adjusted
Budget
4 5 6 7 8 9 10 11
R thousands A A1 B C D E F G H
ASSETS
Call investment deposits
Call deposits – – – – – – – – – – –
Other current investments – – – – – – – – – – –
Total Call investment deposits 1 – – – – – – – – – – –
Consumer debtors
Consumer debtors 38 038 63 257 – – – – 0 0 63 257 51 741 38 692
Less: provision for debt impairment – – – – – – – – – – –
Total Consumer debtors 1 38 038 63 257 – – – – 0 0 63 257 51 741 38 692
Debt impairment provision
Balance at the beginning of the year – – – – – – – – – –
Contributions to the provision – – – – – – – – – –
Bad debts written off – – – – – – – – – –
Balance at end of year – – – – – – – – – – –
Property, plant & equipment
PPE at cost/valuation (excl. finance leases) 1 002 139 997 083 – – – – 8 114 8 114 1 005 197 1 096 474 1 091 896
Leases recognised as PPE 2 – – – – – – – – – –
Less: Accumulated depreciation – – – – – – – – – –
Total Property, plant & equipment 1 1 002 139 997 083 – – – – 8 114 8 114 1 005 197 1 096 474 1 091 896
LIABILITIES
Current liabilities - Borrowing
Short term loans (other than bank overdraft) – – – – – – – – – – –
Current portion of long-term liabilities – – – – – – – – – – –
Total Current liabilities - Borrowing – – – – – – – – – – –
Trade and other payables
Trade Payables 47 310 141 209 – – – – – – 141 209 141 209 141 209
Other creditors – –
Unspent conditional grants and receipts – –
VAT – –
Total Trade and other payables 1 47 310 141 209 – – – – – – 141 209 141 209 141 209
Non current liabilities - Borrowing
Borrowing 3 4 722 4 588 – – – – – – 4 588 4 588 4 588
Finance leases (including PPP asset element) – – – – – – – – – –
Total Non current liabilities - Borrowing 4 722 4 588 – – – – – – 4 588 4 588 4 588
Provisions - non current
Retirement benefits 180 655 165 513 – – – – – – 165 513 172 988 180 463
List other major items – –
Refuse landfill site rehabilitation – – – – – – – – – –
Other – – – – – – – – – –
Total Provisions - non current 180 655 165 513 – – – – – – 165 513 172 988 180 463
RefDescription
Budget Year 2020/21
Prepared by : SAMRASm
Date : 2020/08/20 11:54 AM
50

Budget Year
+1 2021/22
Budget Year
+2 2022/23
Original
BudgetPrior Adjusted Accum. Funds
Multi-year
capital
Unfore.
Unavoid.
Nat. or Prov.
GovtOther Adjusts. Total Adjusts.
Adjusted
Budget
Adjusted
Budget
Adjusted
Budget
4 5 6 7 8 9 10 11
R thousands A A1 B C D E F G H
RefDescription
Budget Year 2020/21
CHANGES IN NET ASSETS
Accumulated surplus/(Deficit)
Accumulated surplus/(Deficit) - opening balance 844 803 851 487 – – – – 1 111 1 111 852 598 880 259 807 527
Appropriations to Reserves (13 052) – – – – – –
Transfers from Reserves – – – – – – – – – – –
Depreciation offsets – – – – – – – – – – –
Other adjustments – – – – – – – – – – –
Accumulated Surplus/(Deficit) 1 831 751 851 487 – – – – 1 111 1 111 852 598 880 259 807 527
Reserves
Housing Development Fund – – – – – – – – – – –
Capital replacement 10 355 10 355 – – – – – – 10 355 10 355 10 355
Self-insurance – – – – – – – – – – –
Other reserves (list) – – – – – – – – – – –
Compensation for Occupational Injuries and Diseases – – – – – – – – – – –
Employee Benefit Reserve – – – – – – – – – – –
Non-current Provisions Reserve – – – – – – – – – – –
Valuation Reserve – – – – – – – – – – –
Investment in associate account – – – – – – – – – – –
Capitalisation Reserve – – – – – – – – – – –
Revaluation – – – – – – – – – – –
Total Reserves 2 10 355 10 355 – – – – – – 10 355 10 355 10 355
TOTAL COMMUNITY WEALTH/EQUITY 2 842 106 861 842 – – – – 1 111 1 111 862 953 890 613 817 882
Total capital expenditure includes expenditure on nationally significant priorities:
Provision of basic services – – – – – – – – – – –
2010 World Cup – – – – – – – – – – –
– – – – – – – – – – –
Prepared by : SAMRASm
Date : 2020/08/20 11:54 AM
51

WC022 Witzenberg - Supporting Table SB3 Adjustments to the SDBIP - performance objectives - 25 Augustus
Budget Year
+1 2021/22
Budget Year
+2 2022/23
Original
BudgetPrior Adjusted Accum. Funds
Multi-year
capital
Unfore.
Unavoid.
Nat. or Prov.
GovtOther Adjusts. Total Adjusts.
Adjusted
Budget
Adjusted
Budget
Adjusted
Budget
A A1 B C D E F G H
Vote 1 - vote name
Function 1 - (name)
Sub-function 1 - (name)
Insert measure/s description – – – –
Sub-function 2 - (name)
Insert measure/s description – – – –
Sub-function 3 - (name)
Insert measure/s description
– – – –
Function 2 - (name)
Sub-function 1 - (name)
Insert measure/s description
– – – –
Sub-function 2 - (name)
Insert measure/s description – – – –
Sub-function 3 - (name) – – – –
Insert measure/s description
– – – –
Vote 2 - vote name
Function 1 - (name)
Sub-function 1 - (name)
Insert measure/s description – – – –
Sub-function 2 - (name) – – – –
Insert measure/s description
– – – –
Sub-function 3 - (name)
Insert measure/s description – – – –
Function 2 - (name)
Sub-function 1 - (name) – – – –
Insert measure/s description
– – – –
Sub-function 2 - (name)
Insert measure/s description – – – –
Sub-function 3 - (name)
Insert measure/s description
– – – –
Vote 3 - vote name
Function 1 - (name) – – – –
Sub-function 1 - (name)
Insert measure/s description
– – – –
Sub-function 2 - (name)
Insert measure/s description – – – –
Sub-function 3 - (name) – – – –
Insert measure/s description
Description Unit of measurement
Budget Year 2020/21
Prepared by : SAMRASm
Date : 2020/08/20 11:54 AM
52

Budget Year
+1 2021/22
Budget Year
+2 2022/23
Original
BudgetPrior Adjusted Accum. Funds
Multi-year
capital
Unfore.
Unavoid.
Nat. or Prov.
GovtOther Adjusts. Total Adjusts.
Adjusted
Budget
Adjusted
Budget
Adjusted
Budget
A A1 B C D E F G H
Description Unit of measurement
Budget Year 2020/21
Function 2 - (name) – – – –
Sub-function 1 - (name)
Insert measure/s description – – – –
Sub-function 2 - (name) – – – –
Insert measure/s description
– – – –
Sub-function 3 - (name)
Insert measure/s description – – – –
And so on for the rest of the Votes – – – –
References
2. Include the estimated effect on the target of each component of an adjustment budget (B to G)
3. Include all Basic Services performance targets from Table A10 to ensure Table SA7 represents all strategic responsibilities
4. Total target adjustments G = B + C + D + E + F
6. NOTE - include adjustsment by 'exception' (only where amended)
1. Include a measurable performance objective for each revenue source (within a relevant function) and each vote (MFMA s17(3)(b))
5. Total Adjusted Budget targets H = (A or A1/2 etc) + G
Prepared by : SAMRASm
Date : 2020/08/20 11:54 AM
53
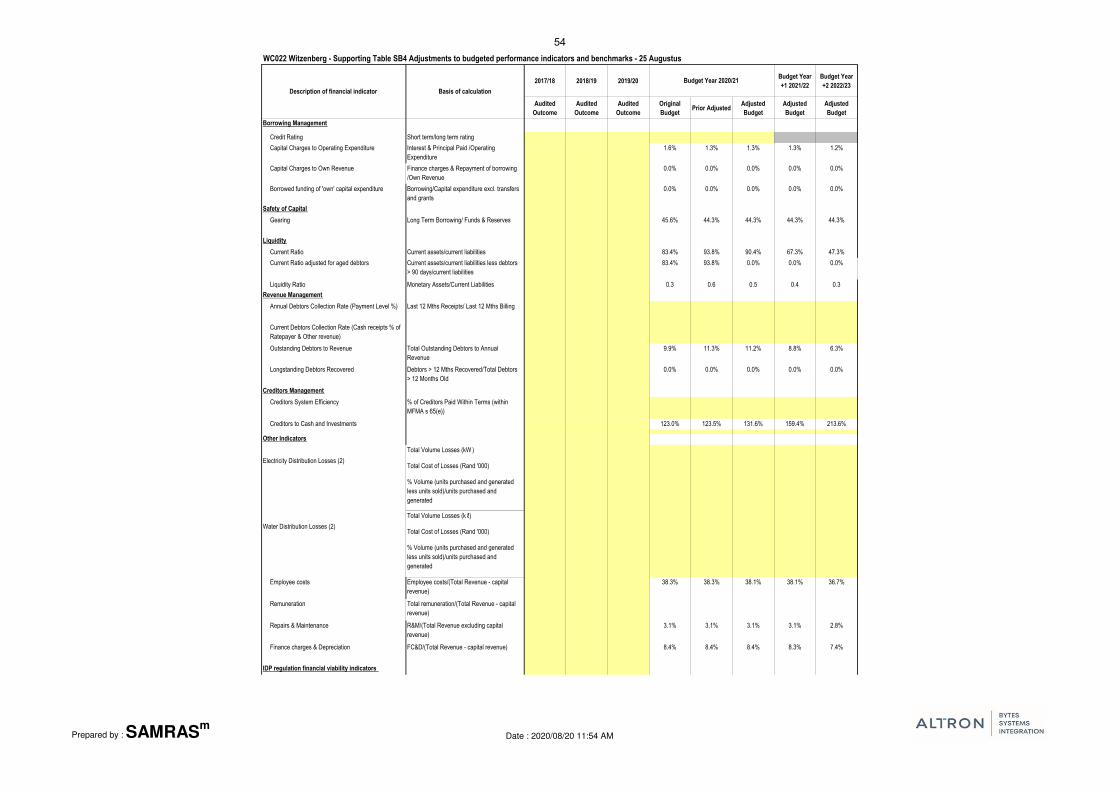
WC022 Witzenberg - Supporting Table SB4 Adjustments to budgeted performance indicators and benchmarks - 25 Augustus
2017/18 2018/19 2019/20Budget Year
+1 2021/22
Budget Year
+2 2022/23
Audited
Outcome
Audited
Outcome
Audited
Outcome
Original
BudgetPrior Adjusted
Adjusted
Budget
Adjusted
Budget
Adjusted
Budget
Borrowing Management
Credit Rating Short term/long term rating
Capital Charges to Operating Expenditure Interest & Principal Paid /Operating
Expenditure
1.6% 1.3% 1.3% 1.3% 1.2%
Capital Charges to Own Revenue Finance charges & Repayment of borrowing
/Own Revenue
0.0% 0.0% 0.0% 0.0% 0.0%
Borrowed funding of 'own' capital expenditure Borrowing/Capital expenditure excl. transfers
and grants
0.0% 0.0% 0.0% 0.0% 0.0%
Safety of Capital
Gearing Long Term Borrowing/ Funds & Reserves 45.6% 44.3% 44.3% 44.3% 44.3%
Liquidity
Current Ratio Current assets/current liabilities 83.4% 93.8% 90.4% 67.3% 47.3%
Current Ratio adjusted for aged debtors Current assets/current liabilities less debtors
> 90 days/current liabilities
83.4% 93.8% 0.0% 0.0% 0.0%
Liquidity Ratio Monetary Assets/Current Liabilities 0.3 0.6 0.5 0.4 0.3
Revenue Management
Annual Debtors Collection Rate (Payment Level %) Last 12 Mths Receipts/ Last 12 Mths Billing
Current Debtors Collection Rate (Cash receipts % of
Ratepayer & Other revenue)
Outstanding Debtors to Revenue Total Outstanding Debtors to Annual
Revenue
9.9% 11.3% 11.2% 8.8% 6.3%
Longstanding Debtors Recovered Debtors > 12 Mths Recovered/Total Debtors
> 12 Months Old
0.0% 0.0% 0.0% 0.0% 0.0%
Creditors Management
Creditors System Efficiency % of Creditors Paid Within Terms (within
MFMA s 65(e))
Creditors to Cash and Investments 123.0% 123.5% 131.6% 159.4% 213.6%
Other Indicators
Total Volume Losses (kW )
Total Cost of Losses (Rand '000)
% Volume (units purchased and generated
less units sold)/units purchased and
generated
Total Volume Losses (k ℓ)
Total Cost of Losses (Rand '000)
% Volume (units purchased and generated
less units sold)/units purchased and
generated
Employee costs Employee costs/(Total Revenue - capital
revenue)
38.3% 38.3% 38.1% 38.1% 36.7%
Remuneration Total remuneration/(Total Revenue - capital
revenue)
Repairs & Maintenance R&M/(Total Revenue excluding capital
revenue)
3.1% 3.1% 3.1% 3.1% 2.8%
Finance charges & Depreciation FC&D/(Total Revenue - capital revenue) 8.4% 8.4% 8.4% 8.3% 7.4%
IDP regulation financial viability indicators
Description of financial indicator Basis of calculation
Budget Year 2020/21
Water Distribution Losses (2)
Electricity Distribution Losses (2)
Prepared by : SAMRASm
Date : 2020/08/20 11:54 AM
54

i. Debt coverage (Total Operating Revenue - Operating
Grants)/Debt service payments due within
financial year)
4916.9% 4916.9% 4916.9% 5061.0% 5422.8%
ii. O/S Service Debtors to Revenue Total outstanding service debtors/annual
revenue received for services
6.4% 10.7% 10.6% 8.1% 5.4%
iii. Cost coverage (Available cash + Investments)/monthly fixed
operational expenditure
0.0 0.0 0.0 0.0 0.0
References
1. Consumer debtors > 12 months old are excluded from current assets
Prepared by : SAMRASm
Date : 2020/08/20 11:54 AM
55

WC022 Witzenberg - Supporting Table SB5 Adjustments Budget - social, economic and demographic statistics and assumptions - 25 Augustus
2017/18 2018/19 2019/20Budget Year
2020/21
Budget Year
2020/21
Outcome Outcome OutcomeOriginal
BudgetActual
Demographics
Population – – – 116 116 116 116 116
Females aged 5 - 14 – – – – – – – –
Males aged 5 - 14 – – – – – – – –
Females aged 15 - 34 – – – 21 21 21 21 21
Males aged 15 - 34 – – – 24 24 24 24 24
Unemployment – – – 3 3 3 3 3
Monthly household income (no. of households) 1, 12
No income – – – 1 757 1 757 1 757 1 757 1 757
R1 - R1 600 – – – 6 703 6 703 6 703 6 703 6 703
R1 601 - R3 200 – – – 7 079 7 079 7 079 7 079 7 079
R3 201 - R6 400 – – – 5 723 5 723 5 723 5 723 5 723
R6 401 - R12 800 – – – 2 863 2 863 2 863 2 863 2 863
R12 801 - R25 600 – – – 1 851 1 851 1 851 1 851 1 851
R25 601 - R51 200 – – – 1 064 1 064 1 064 1 064 1 064
R52 201 - R102 400 – – – 253 253 253 253 253
R102 401 - R204 800 – – – 77 77 77 77 77
R204 801 - R409 600 – – – 49 49 49 49 49
R409 601 - R819 200 – – – – – – – –
> R819 200 – – – – – – – –
Poverty profiles (no. of households)
< R2 060 per household per month 13 – – – 8 460 8 460 8 460 8 460 8 460
2 – – – 15 539 15 539 15 539 15 539 15 539
Household/demographics (000)
Number of people in municipal area – – – 116 116 116 116 116
Number of poor people in municipal area – – – 90 90 90 90 90
Number of households in municipal area – – – 27 27 27 27 27
Number of poor households in municipal area – – – 21 21 21 21 21
Definition of poor household (R per month) – – – >R6400 >R6400 >R6400 >R6400 >R6400
Housing statistics 3
Formal – – – 23 642 23 642 23 642 23 642 23 642
Informal – – – 3 778 3 778 3 778 3 778 3 778
Total number of households - - - 27 420 27 420 27 420 27 420 27 420
Dwellings provided by municipality 4 – – – - - - - -
Dwellings provided by province/s – – – - - - - -
Dwellings provided by private sector 5 – – – - - - - -
Total new housing dwellings - - - - - - - -
Economic 6
Inflation/inflation outlook (CPIX) 5.0% 5.0% 5.0% 5.0% 5.0%
Interest rate - borrowing 9.5% 9.5% 9.5% 9.5% 9.5%
Interest rate - investment 5.0% 5.0% 5.0% 5.0% 5.0%
Remuneration increases 6.0% 6.0% 6.0% 6.0% 6.0%
Consumption growth (electricity) 2.5% 2.5% 2.5% 2.5% 2.5%
Consumption growth (water) 2.5% 2.5% 2.5% 2.5% 2.5%
Collection rates 7
Property tax/service charges 98.2% 98.2% 98.2% 98.2% 98.2%
Rental of facilities & equipment 100.0% 100.0% 100.0% 100.0% 100.0%
Interest - external investments 100.0% 100.0% 100.0% 100.0% 100.0%
Interest - debtors 98.2% 98.2% 98.2% 98.2% 98.2%
Revenue from agency services 100.0% 100.0% 100.0% 100.0% 100.0%
Description of economic indicator Ref. Basis of calculation 2001 Census 2007 Survey 2011 Census
Prepared by : SAMRASm
Date : 2020/08/20 11:54 AM
56

Detail on the provision of municipal services for A10
2017/18 2018/19 2019/20
Outcome Outcome OutcomeOriginal
Budget
Adjusted
Budget
Full Year
Forecast
Budget Year
2020/21
Budget Year +1
2021/22
Budget Year
+2 2022/23
Household service targets (000)
Water:
Piped water inside dwelling 10 845 10 845 10 845 10 845 10 845 10 845 10 845 10 845 10 845
Piped water inside yard (but not in dwelling) 1 691 1 691 1 691 1 691 1 691 1 691 1 691 1 691 1 691
8 Using public tap (at least min.service level) – – – – – – – – –
10 Other water supply (at least min.service level) – – – – – – – – –
Minimum Service Level and Above sub-total 12 536 12 536 12 536 12 536 12 536 12 536 12 536 12 536 12 536
9 Using public tap (< min.service level) – – – – – – – – –
10 Other water supply (< min.service level) – – – – – – – – –
No water supply – – – – – – – – –
Below Minimum Service Level sub-total – – – – – – – – –
Total number of households 12 536 12 536 12 536 12 536 12 536 12 536 12 536 12 536 12 536
Sanitation/sewerage:
Flush toilet (connected to sewerage) 10 300 10 300 10 300 10 300 10 300 10 300 10 300 10 300 10 300
Flush toilet (with septic tank) 730 730 730 730 730 730 730 730 730
Chemical toilet – – – – – – – – –
Pit toilet (ventilated) – – – – – – – – –
Other toilet provisions (> min.service level) – – – – – – – – –
Minimum Service Level and Above sub-total 11 030 11 030 11 030 11 030 11 030 11 030 11 030 11 030 11 030
Bucket toilet – – – – – – – – –
Other toilet provisions (< min.service level) – – – – – – – – –
No toilet provisions – – – – – – – – –
Below Minimum Service Level sub-total – – – – – – – – –
Total number of households 11 030 11 030 11 030 11 030 11 030 11 030 11 030 11 030 11 030
Energy:
Electricity (at least min.service level) 1 769 1 769 1 769 1 769 1 769 1 769 1 769 1 769 1 769
Electricity - prepaid (min.service level) 11 264 11 264 11 264 11 264 11 264 11 264 11 264 11 264 11 264
Minimum Service Level and Above sub-total 13 033 13 033 13 033 13 033 13 033 13 033 13 033 13 033 13 033
Electricity (< min.service level) – – – – – – – – –
Electricity - prepaid (< min. service level) – – – – – – – – –
Other energy sources – – – – – – – – –
Below Minimum Service Level sub-total – – – – – – – – –
Total number of households 13 033 13 033 13 033 13 033 13 033 13 033 13 033 13 033 13 033
Refuse:
Removed at least once a week 11 067 11 067 11 067 11 067 11 067 11 067 11 067 11 067 11 067
Minimum Service Level and Above sub-total 11 067 11 067 11 067 11 067 11 067 11 067 11 067 11 067 11 067
Removed less frequently than once a week – – – – – – – – –
Using communal refuse dump – – – – – – – – –
Using own refuse dump – – – – – – – – –
Other rubbish disposal – – – – – – – – –
No rubbish disposal – – – – – – – – –
Below Minimum Service Level sub-total – – – – – – – – –
Total number of households 11 067 11 067 11 067 11 067 11 067 11 067 11 067 11 067 11 067
Total municipal services Ref.
Budget Year 2020/212020/21 Medium Term Revenue & Expenditure
Framework
Prepared by : SAMRASm
Date : 2020/08/20 11:54 AM
57

2017/18 2018/19 2019/20
Outcome Outcome OutcomeOriginal
Budget
Adjusted
Budget
Full Year
Forecast
Budget Year
2020/21
Budget Year +1
2021/22
Budget Year
+2 2022/23
Household service targets (000)
Water:
Piped water inside dwelling 10 845 10 845 10 845 10 845 10 845 10 845 10 845 10 845 10 845
Piped water inside yard (but not in dwelling) 1 691 1 691 1 691 1 691 1 691 1 691 1 691 1 691 1 691
8 Using public tap (at least min.service level) – – – – – – – – –
10 Other water supply (at least min.service level) – – – – – – – – –
Minimum Service Level and Above sub-total 12 536 12 536 12 536 12 536 12 536 12 536 12 536 12 536 12 536
9 Using public tap (< min.service level) – – – – – – – – –
10 Other water supply (< min.service level) – – – – – – – – –
No water supply – – – – – – – – –
Below Minimum Service Level sub-total – – – – – – – – –
Total number of households 12 536 12 536 12 536 12 536 12 536 12 536 12 536 12 536 12 536
Sanitation/sewerage:
Flush toilet (connected to sewerage) 10 300 10 300 10 300 10 300 10 300 10 300 10 300 10 300 10 300
Flush toilet (with septic tank) 730 730 730 730 730 730 730 730 730
Chemical toilet – – – – – – – – –
Pit toilet (ventilated) – – – – – – – – –
Other toilet provisions (> min.service level) – – – – – – – – –
Minimum Service Level and Above sub-total 11 030 11 030 11 030 11 030 11 030 11 030 11 030 11 030 11 030
Bucket toilet – – – – – – – – –
Other toilet provisions (< min.service level) – – – – – – – – –
No toilet provisions – – – – – – – – –
Below Minimum Service Level sub-total – – – – – – – – –
Total number of households 11 030 11 030 11 030 11 030 11 030 11 030 11 030 11 030 11 030
Energy:
Electricity (at least min.service level) 1 769 1 769 1 769 1 769 1 769 1 769 1 769 1 769 1 769
Electricity - prepaid (min.service level) 11 264 11 264 11 264 11 264 11 264 11 264 11 264 11 264 11 264
Minimum Service Level and Above sub-total 13 033 13 033 13 033 13 033 13 033 13 033 13 033 13 033 13 033
Electricity (< min.service level) – – – – – – – – –
Electricity - prepaid (< min. service level) – – – – – – – – –
Other energy sources – – – – – – – – –
Below Minimum Service Level sub-total – – – – – – – – –
Total number of households 13 033 13 033 13 033 13 033 13 033 13 033 13 033 13 033 13 033
Refuse:
Removed at least once a week 11 067 11 067 11 067 11 067 11 067 11 067 11 067 11 067 11 067
Minimum Service Level and Above sub-total 11 067 11 067 11 067 11 067 11 067 11 067 11 067 11 067 11 067
Removed less frequently than once a week – – – – – – – – –
Using communal refuse dump – – – – – – – – –
Using own refuse dump – – – – – – – – –
Other rubbish disposal – – – – – – – – –
No rubbish disposal – – – – – – – – –
Below Minimum Service Level sub-total – – – – – – – – –
Total number of households 11 067 11 067 11 067 11 067 11 067 11 067 11 067 11 067 11 067
Municipal in-house services Ref.
Budget Year 2020/212020/21 Medium Term Revenue & Expenditure
Framework
Prepared by : SAMRASm
Date : 2020/08/20 11:54 AM
58

Budget Year
+1 2021/22
Budget Year
+2 2022/23
Original
BudgetPrior Adjusted Accum. Funds
Multi-year
capital
Unfore.
Unavoid.
Nat. or Prov.
GovtOther Adjusts. Total Adjusts.
Adjusted
Budget
Adjusted
Budget
Adjusted
Budget
Electricity Ref. Location of households for each type of FBS
List type of FBS serviceFormal settlements - (50 kwh per indigent household
per month Rands)– – – – – – – – – – –
E1 Number of HH receiving this type of FBS – – – – – – – – – – –
E2 Informal settlements (Rands) – – – – – – – – – – –
E3 Number of HH receiving this type of FBS – – – – – – – – – – –
E4 Informal settlements targeted for upgrading (Rands) – – – – – – – – – – –
E5 Number of HH receiving this type of FBS – – – – – – – – – – –
E6 Living in informal backyard rental agreement (Rands) – – – – – – – – – – –
E7 Number of HH receiving this type of FBS – – – – – – – – – – –
E8 Other (Rands) – – – – – – – – – – –
E9 Number of HH receiving this type of FBS – – – – – – – – – – –
Total cost of FBS - Electricity for informal settlements – – – – – – – – – – –
Water Ref. Location of households for each type of FBS
List type of FBS serviceFormal settlements - (6 kilolitre per indigent household
per month Rands)6 450 775 6 450 775 – – – – – – 6 451 6 513 488 6 579 336
W1 Number of HH receiving this type of FBS – – – – – – – – – – –
W2 Informal settlements (Rands) – – – – – – – – – – –
W3 Number of HH receiving this type of FBS – – – – – – – – – – –
W4 Informal settlements targeted for upgrading (Rands) – – – – – – – – – – –
W5 Number of HH receiving this type of FBS – – – – – – – – – – –
W6 Living in informal backyard rental agreement (Rands) – – – – – – – – – – –
W7 Number of HH receiving this type of FBS – – – – – – – – – – –
W8 Other (Rands) – – – – – – – – – – –
W9 Number of HH receiving this type of FBS – – – – – – – – – – –
Total cost of FBS - Water for informal settlements – – – – – – – – – – –
Sanitation Ref. Location of households for each type of FBS
List type of FBS serviceFormal settlements - (free sanitation service to indigent
households)– – – – – – – – – – –
S1 Number of HH receiving this type of FBS – – – – – – – – – – –
S2 Informal settlements (Rands) – – – – – – – – – – –
S3 Number of HH receiving this type of FBS – – – – – – – – – – –
S4 Informal settlements targeted for upgrading (Rands) – – – – – – – – – – –
S5 Number of HH receiving this type of FBS – – – – – – – – – – –
S6 Living in informal backyard rental agreement (Rands) – – – – – – – – – – –
S7 Number of HH receiving this type of FBS – – – – – – – – – – –
S8 Other (Rands) – – – – – – – – – – –
S9 Number of HH receiving this type of FBS – – – – – – – – – – –
Total cost of FBS - Sanitation for informal settlements – – – – – – – – – – –
Refuse Removal Ref. Location of households for each type of FBS
List type of FBS serviceFormal settlements - (removed once a week to indigent
households)– – – – – – – – – – –
R1 Number of HH receiving this type of FBS – – – – – – – – – – –
R2 Informal settlements (Rands) – – – – – – – – – – –
R3 Number of HH receiving this type of FBS – – – – – – – – – – –
R4 Informal settlements targeted for upgrading (Rands) – – – – – – – – – – –
R5 Number of HH receiving this type of FBS – – – – – – – – – – –
R6 Living in informal backyard rental agreement (Rands) – – – – – – – – – – –
R7 Number of HH receiving this type of FBS – – – – – – – – – – –
R8 Other (Rands) – – – – – – – – – – –
R9 Number of HH receiving this type of FBS – – – – – – – – – – –
Total cost of FBS - Refuse Removal for informal settlements – – – – – – – – – – –
Detail of Free Basic Services (FBS) provided
Budget Year 2020/21
Prepared by : SAMRASm
Date : 2020/08/20 11:54 AM
59

WC022 Witzenberg - Supporting Table SB6 Adjustments Budget - funding measurement - 25 Augustus
Description 2017/18 2018/19 2019/20 Medium Term Revenue and Expenditure Framework
R thousands
Audited
Outcome
Audited
Outcome
Audited
Outcome
Original
BudgetPrior Adjusted
Adjusted
Budget
Budget Year
+1 2021/22
Budget Year
+2 2022/23
Funding measures
Cash/cash equivalents at the year end - R'000 1 18(1)b – – – 38 463 114 319 107 316 88 606 66 098
Cash + investments at the yr end less applications - R'000 2 18(1)b – – – (820 826) (848 661) (856 775) (913 223) (873 447)
Cash year end/monthly employee/supplier payments 3 18(1)b – – – – – – – –
Surplus/(Deficit) excluding depreciation offsets: R'000 4 18(1) – – – (13 052) (13 052) (8 463) 27 661 (72 732)
Service charge rev % change - macro CPIX target exclusive 5 18(1)a,(2) 0.0% 0.0% 0.0% 0.5% 2.3%
Cash receipts % of Ratepayer & Other revenue 6 18(1)a,(2) 0.0% 0.0% 0.0% 88.3% 92.5% 92.5% 92.1% 92.2%
Debt impairment expense as a % of total billable revenue 7 18(1)a,(2) 10.6% 10.6% 10.6% 10.5% 10.3%
Capital payments % of capital expenditure 8 18(1)c;19 100.0% 100.0% 0.0% 0.0% 0.0%
Borrowing receipts % of capital expenditure (excl. transfers) 9 18(1)c 0.0% 0.0% 0.0% 0.0% 0.0%
Grants % of Govt. legislated/gazetted allocations 10 18(1)a 0.0% 100.0% 0.0% 0.0% 0.0%
Current consumer debtors % change - incr(decr) 11 18(1)a -15.9% -20.2%
Long term receivables % change - incr(decr) 12 18(1)a 0.0% 0.0%
R&M % of Property Plant & Equipment 13 20(1)(vi) 1.7% 1.8% 1.7% 1.7% 2.0%
Asset renewal % of capital budget 14 20(1)(vi) 5.5% 5.5% 6.3% 0.0% 13.0%
Ref MFMA section
Prepared by : SAMRASm
Date : 2020/08/20 11:54 AM
60

WC022 Witzenberg - Supporting Table SB7 Adjustments Budget - transfers and grant receipts - 25 Augustus
Budget Year
+1 2021/22
Budget Year
+2 2022/23
Original
BudgetPrior Adjusted
Multi-year
capital
Nat. or Prov.
GovtOther Adjusts. Total Adjusts.
Adjusted
Budget
Adjusted
Budget
Adjusted
Budget
7 8 9 10 11 12
R thousands A A1 B C D E F
RECEIPTS: 1, 2
Operating Transfers and Grants
National Government: 106 455 106 455 – – – – 106 455 114 256 124 609
Operational Revenue:General Revenue:Equitable Share 101 915 101 915 – – – – 101 915 112 056 122 389
Operational:Revenue:General Revenue:Fuel Levy 3 – – – – – – – – –
2014 African Nations Championship Host City Operating Grant [Schedule 5B] – – – – – – – – –
Agriculture Research and Technology – – – – – – – – –
Agriculture, Conservation and Environmental – – – – – – – – –
Arts and Culture Sustainable Resource Management – – – – – – – – –
Community Library – – – – – – – – –
Department of Environmental Affairs – – – – – – – – –
Department of Tourism – – – – – – – – –
Department of Water Affairs and Sanitation Masibambane – – – – – – – – –
Emergency Medical Service – – – – – – – – –
Energy Efficiency and Demand-side [Schedule 5B] – – – – – – – – –
Expanded Public Works Programme Integrated Grant for Municipalities [Schedule 5B] 2 360 2 360 – – – – 2 360 – –
HIV and Aids – – – – – – – – –
Housing Accreditation – – – – – – – – –
Housing Top structure – – – – – – – – –
Infrastructure Skills Development Grant [Schedule 5B] – – – – – – – – –
Integrated City Development Grant – – – – – – – – –
Khayelitsha Urban Renewal – – – – – – – – –
Local Government Financial Management Grant [Schedule 5B] 1 550 1 550 – – – – 1 550 1 550 1 550
Mitchell's Plain Urban Renewal – – – – – – – – –
Municipal Demarcation and Transition Grant [Schedule 5B] – – – – – – – – –
Municipal Disaster Grant [Schedule 5B] – – – – – – – – –
Municipal Human Settlement Capacity Grant [Schedule 5B] – – – – – – – – –
Municipal Systems Improvement Grant – – – – – – – – –
Natural Resource Management Project – – – – – – – – –
Neighbourhood Development Partnership Grant – – – – – – – – –
Operation Clean Audit – – – – – – – – –
Municipal Disaster Recovery Grant – – – – – – – – –
Public Service Improvement Facility – – – – – – – – –
Public Transport Network Operations Grant [Schedule 5B] – – – – – – – – –
Restructuring - Seed Funding – – – – – – – – –
Revenue Enhancement Grant Debtors Book – – – – – – – – –
Rural Road Asset Management Systems Grant – – – – – – – – –
Sport and Recreation – – – – – – – – –
Terrestrial Invasive Alien Plants – – – – – – – – –
Water Services Operating Subsidy Grant [Schedule 5B] – – – – – – – – –
Health Hygiene in Informal Settlements – – – – – – – – –
Municipal Infrastructure Grant [Schedule 5B] 630 630 – – – – 630 650 670
Water Services Infrastructure Grant – – – – – – – – –
Public Transport Network Grant [Schedule 5B] – – – – – – – – –
Smart Connect Grant – – – – – – – – –
Urban Settlement Development Grant – – – – – – – – –
WiFi Grant [Department of Telecommunications and Postal Services – – – – – – – – –
Street Lighting – – – – – – – – –
Traditional Leaders - Imbizion – – – – – – – – –
Department of Water and Sanitation Smart Living Handbook – – – – – – – – –
Description Ref
Budget Year 2020/21
Prepared by : SAMRASm
Date : 2020/08/20 11:54 AM
61

Budget Year
+1 2021/22
Budget Year
+2 2022/23
Original
BudgetPrior Adjusted
Multi-year
capital
Nat. or Prov.
GovtOther Adjusts. Total Adjusts.
Adjusted
Budget
Adjusted
Budget
Adjusted
Budget
7 8 9 10 11 12
R thousands A A1 B C D E F
Description Ref
Budget Year 2020/21
Integrated National Electrification Programme Grant – – – – – – – – –
Municipal Restructuring Grant – – – – – – – – –
Regional Bulk Infrastructure Grant – – – – – – – – –
Municipal Emergency Housing Grant – – – – – – – – –
Metro Informal Settlements Partnership Grant – – – – – – – – –
Prepared by : SAMRASm
Date : 2020/08/20 11:54 AM
62

Budget Year
+1 2021/22
Budget Year
+2 2022/23
Original
BudgetPrior Adjusted
Multi-year
capital
Nat. or Prov.
GovtOther Adjusts. Total Adjusts.
Adjusted
Budget
Adjusted
Budget
Adjusted
Budget
7 8 9 10 11 12
R thousands A A1 B C D E F
Description Ref
Budget Year 2020/21
Provincial Government: 10 534 10 534 – – 1 267 1 267 11 801 10 833 42 291
Capacity Building – – – – – – – – –
Capacity Building and Other 10 534 10 534 – – 1 267 1 267 11 801 10 833 11 261
Disaster and Emergency Services – – – – – – – – –
Health – – – – – – – – –
Housing – – – – – – – – –
Infrastructure – – – – – – – – 31 030
Libraries, Archives and Museums – – – – – – – – –
Other – – – – – – – – –
Public Transport – – – – – – – – –
Road Infrastructure - Maintenance 4 – – – – – – – – –
Sports and Recreation – – – – – – – – –
Waste Water Infrastructure - Maintenance – – – – – – – – –
Water Supply Infrastructure - Maintenance 5 – – – – – – – – –
District Municipality: – – – – – – – – –
All Grants – –
Other grant providers: – – – – – – – – –
Departmental Agencies and Accounts – – – – – – – – –
Foreign Government and International Organisations – – – – – – – – –
Households – – – – – – – – –
Non-profit Institutions – – – – – – – – –
Private Enterprises – – – – – – – – –
Public Corporations – – – – – – – – –
Higher Educational Institutions – – – – – – – – –
Parent Municipality / Entity – – – – – – – – –
Total Operating Transfers and Grants 6 116 989 116 989 – – 1 267 1 267 118 256 125 089 166 900
Prepared by : SAMRASm
Date : 2020/08/20 11:54 AM
63

Budget Year
+1 2021/22
Budget Year
+2 2022/23
Original
BudgetPrior Adjusted
Multi-year
capital
Nat. or Prov.
GovtOther Adjusts. Total Adjusts.
Adjusted
Budget
Adjusted
Budget
Adjusted
Budget
7 8 9 10 11 12
R thousands A A1 B C D E F
Description Ref
Budget Year 2020/21
Capital Transfers and Grants
National Government: 41 127 41 127 – – – – 41 127 46 256 28 422
Integrated National Electrification Programme (Municipal Grant) [Schedule 5B] – – – – – – – 3 000 4 000
Municipal Infrastructure Grant [Schedule 5B] 21 656 21 656 – – – – 21 656 23 256 24 422
Municipal Water Infrastructure Grant [Schedule 5B] – – – – – – – – –
Neighbourhood Development Partnership Grant [Schedule 5B] – – – – – – – – –
Public Transport Infrastructure Grant [Schedule 5B] – – – – – – – – –
Rural Household Infrastructure Grant [Schedule 5B] – – – – – – – – –
Rural Road Asset Management Systems Grant [Schedule 5B] – – – – – – – – –
Urban Settlement Development Grant [Schedule 4B] – – – – – – – – –
Municipal Human Settlement – – – – – – – – –
Community Library – – – – – – – – –
Integrated City Development Grant [Schedule 4B] – – – – – – – – –
Municipal Disaster Recovery Grant [Schedule 4B] – – – – – – – – –
Energy Efficiency and Demand Side Management Grant – – – – – – – – –
Khayelitsha Urban Renewal – – – – – – – – –
Local Government Financial Management Grant [Schedule 5B] – – – – – – – – –
Municipal Systems Improvement Grant [Schedule 5B] – – – – – – – – –
Public Transport Network Grant [Schedule 5B] – – – – – – – – –
Public Transport Network Operations Grant [Schedule 5B] – – – – – – – – –
Regional Bulk Infrastructure Grant (Schedule 5B) 19 471 19 471 – – – – 19 471 20 000 –
Water Services Infrastructure Grant [Schedule 5B] – – – – – – – – –
WIFI Connectivity – – – – – – – – –
Expanded Public Works Programme Integrated Grant for Municipalities [Schedule 5B] – – – – – – – – –
Aquaponic Project – – – – – – – – –
Restition Settlement – – – – – – – – –
Infrastructure Skills Development Grant [Schedule 5B] – – – – – – – – –
Restructuring Seed Funding – – – – – – – – –
Municipal Disaster Relief Grant – – – – – – – – –
Municipal Emergency Housing Grant – – – – – – – – –
Metro Informal Settlements Partnership Grant – – – – – – – – –
Prepared by : SAMRASm
Date : 2020/08/20 11:54 AM
64

Budget Year
+1 2021/22
Budget Year
+2 2022/23
Original
BudgetPrior Adjusted
Multi-year
capital
Nat. or Prov.
GovtOther Adjusts. Total Adjusts.
Adjusted
Budget
Adjusted
Budget
Adjusted
Budget
7 8 9 10 11 12
R thousands A A1 B C D E F
Description Ref
Budget Year 2020/21
Provincial Government: 43 084 43 084 – – 5 753 5 753 48 837 79 910 2 930
Capacity Building – – – – – – – – –
Capacity Building and Other – – – – 4 308 4 308 4 308 – 800
Disaster and Emergency Services – – – – – – – – –
Health – – – – – – – – –
Housing – – – – – – – – –
Infrastructure 43 084 43 084 – – 1 445 1 445 44 529 79 910 2 130
Libraries, Archives and Museums – – – – – – – – –
Other – – – – – – – – –
Public Transport – – – – – – – – –
Road Infrastructure – – – – – – – – –
Sports and Recreation – – – – – – – – –
Waste Water Infrastructure – – – – – – – – –
Water Supply Infrastructure – – – – – – – – –
District Municipality: – – – – 602 602 602 – –
All Grants – – – – 602 602 602 – –
Other grant providers: – – – – 501 501 501 – –
Departmental Agencies and Accounts – – – – – – – – –
Foreign Government and International Organisations – – – – 501 501 501 – –
Households – – – – – – – – –
Non-Profit Institutions – – – – – – – – –
Private Enterprises – – – – – – – – –
Public Corporations – – – – – – – – –
Higher Educational Institutions – – – – – – – – –
Parent Municipality / Entity – – – – – – – – –
Transfer from Operational Revenue – – – – – – – – –
Total Capital Transfers and Grants 6 84 211 84 211 – – 6 857 6 857 91 068 126 166 31 352
TOTAL RECEIPTS OF TRANSFERS & GRANTS 201 200 201 200 – – 8 125 8 125 209 325 251 255 198 252
Prepared by : SAMRASm
Date : 2020/08/20 11:54 AM
65

WC022 Witzenberg - Supporting Table SB8 Adjustments Budget - expenditure on transfers and grant programme - 25 Augustus
Budget Year
+1 2021/22
Budget Year
+2 2022/23
Original
BudgetPrior Adjusted
Multi-year
capital
Nat. or Prov.
GovtOther Adjusts. Total Adjusts.
Adjusted
Budget
Adjusted
Budget
Adjusted
Budget
2 3 4 5 6 7
R thousands A A1 B C D E F
EXPENDITURE ON TRANSFERS AND GRANT PROGRAM: 1
Operating expenditure of Transfers and Grants
National Government: 63 364 63 364 – – – – 63 364 65 370 70 154
Operational Revenue:General Revenue:Equitable Share 58 824 58 824 – – – – 58 824 63 170 67 934
Operational:Revenue:General Revenue:Fuel Levy 3 – – – – – – – – –
2014 African Nations Championship Host City Operating Grant [Schedule 5B] – – – – – – – – –
Agriculture Research and Technology – – – – – – – – –
Agriculture, Conservation and Environmental – – – – – – – – –
Arts and Culture Sustainable Resource Management – – – – – – – – –
Community Library – – – – – – – – –
Department of Environmental Affairs – – – – – – – – –
Department of Tourism – – – – – – – – –
Department of Water Affairs and Sanitation Masibambane – – – – – – – – –
Emergency Medical Service – – – – – – – – –
Energy Efficiency and Demand-side [Schedule 5B] – – – – – – – – –
Expanded Public Works Programme Integrated Grant for Municipalities [Schedule 5B] 2 360 2 360 – – – – 2 360 – –
HIV and Aids – – – – – – – – –
Housing Accreditation – – – – – – – – –
Housing Top structure – – – – – – – – –
Infrastructure Skills Development Grant [Schedule 5B] – – – – – – – – –
Integrated City Development Grant – – – – – – – – –
Khayelitsha Urban Renewal – – – – – – – – –
Local Government Financial Management Grant [Schedule 5B] 1 550 1 550 – – – – 1 550 1 550 1 550
Mitchell's Plain Urban Renewal – – – – – – – – –
Municipal Demarcation and Transition Grant [Schedule 5B] – – – – – – – – –
Municipal Disaster Grant [Schedule 5B] – – – – – – – – –
Municipal Human Settlement Capacity Grant [Schedule 5B] – – – – – – – – –
Municipal Systems Improvement Grant – – – – – – – – –
Natural Resource Management Project – – – – – – – – –
Neighbourhood Development Partnership Grant – – – – – – – – –
Operation Clean Audit – – – – – – – – –
Municipal Disaster Recovery Grant – – – – – – – – –
Public Service Improvement Facility – – – – – – – – –
Public Transport Network Operations Grant [Schedule 5B] – – – – – – – – –
Restructuring - Seed Funding – – – – – – – – –
Revenue Enhancement Grant Debtors Book – – – – – – – – –
Rural Road Asset Management Systems Grant – – – – – – – – –
Sport and Recreation – – – – – – – – –
Terrestrial Invasive Alien Plants – – – – – – – – –
Water Services Operating Subsidy Grant [Schedule 5B] – – – – – – – – –
Health Hygiene in Informal Settlements – – – – – – – – –
Municipal Infrastructure Grant [Schedule 5B] 630 630 – – – – 630 650 670
Water Services Infrastructure Grant – – – – – – – – –
Public Transport Network Grant [Schedule 5B] – – – – – – – – –
Smart Connect Grant – – – – – – – – –
Urban Settlement Development Grant – – – – – – – – –
WiFi Grant [Department of Telecommunications and Postal Services – – – – – – – – –
Street Lighting – – – – – – – – –
Traditional Leaders - Imbizion – – – – – – – – –
Department of Water and Sanitation Smart Living Handbook – – – – – – – – –
Integrated National Electrification Programme Grant – – – – – – – – –
Description Ref
Budget Year 2020/21
Prepared by : SAMRASm
Date : 2020/08/20 11:54 AM
66

Budget Year
+1 2021/22
Budget Year
+2 2022/23
Original
BudgetPrior Adjusted
Multi-year
capital
Nat. or Prov.
GovtOther Adjusts. Total Adjusts.
Adjusted
Budget
Adjusted
Budget
Adjusted
Budget
2 3 4 5 6 7
R thousands A A1 B C D E F
Description Ref
Budget Year 2020/21
Municipal Restructuring Grant – – – – – – – – –
Regional Bulk Infrastructure Grant – – – – – – – – –
Municipal Emergency Housing Grant – – – – – – – – –
Metro Informal Settlements Partnership Grant – – – – – – – – –
Prepared by : SAMRASm
Date : 2020/08/20 11:54 AM
67

Budget Year
+1 2021/22
Budget Year
+2 2022/23
Original
BudgetPrior Adjusted
Multi-year
capital
Nat. or Prov.
GovtOther Adjusts. Total Adjusts.
Adjusted
Budget
Adjusted
Budget
Adjusted
Budget
2 3 4 5 6 7
R thousands A A1 B C D E F
Description Ref
Budget Year 2020/21
Provincial Government: 10 534 10 534 – – 813 813 11 347 10 830 42 288
Capacity Building – – – – – – – – –
Capacity Building and Other 10 534 10 534 – – 813 813 11 347 10 830 11 258
Disaster and Emergency Services – – – – – – – – –
Health – – – – – – – – –
Housing – – – – – – – – –
Infrastructure – – – – – – – – 31 030
Libraries, Archives and Museums – – – – – – – – –
Other – – – – – – – – –
Public Transport – – – – – – – – –
Road Infrastructure - Maintenance 4 – – – – – – – – –
Sports and Recreation – – – – – – – – –
Waste Water Infrastructure - Maintenance – – – – – – – – –
Water Supply Infrastructure - Maintenance 5 – – – – – – – – –
District Municipality: – – – – – – – – –
All Grants – –
Other grant providers: 566 566 – – – – 566 622 677
Departmental Agencies and Accounts – – – – – – – – –
Foreign Government and International Organisations 566 566 – – – – 566 622 677
Households – – – – – – – – –
Non-profit Institutions – – – – – – – – –
Private Enterprises – – – – – – – – –
Public Corporations – – – – – – – – –
Higher Educational Institutions – – – – – – – – –
Parent Municipality / Entity – – – – – – – – –
Total Operating Transfers and Grants 6 74 464 74 464 – – 813 813 75 277 76 821 113 119
Prepared by : SAMRASm
Date : 2020/08/20 11:54 AM
68

Budget Year
+1 2021/22
Budget Year
+2 2022/23
Original
BudgetPrior Adjusted
Multi-year
capital
Nat. or Prov.
GovtOther Adjusts. Total Adjusts.
Adjusted
Budget
Adjusted
Budget
Adjusted
Budget
2 3 4 5 6 7
R thousands A A1 B C D E F
Description Ref
Budget Year 2020/21
Capital Transfers and Grants
National Government: 35 763 35 763 – – – – 35 763 40 614 25 237
Integrated National Electrification Programme (Municipal Grant) [Schedule 5B] – – – – – – – 3 000 4 000
Municipal Infrastructure Grant [Schedule 5B] 18 831 18 831 – – – – 18 831 20 223 21 237
Municipal Water Infrastructure Grant [Schedule 5B] – – – – – – – – –
Neighbourhood Development Partnership Grant [Schedule 5B] – – – – – – – – –
Public Transport Infrastructure Grant [Schedule 5B] – – – – – – – – –
Rural Household Infrastructure Grant [Schedule 5B] – – – – – – – – –
Rural Road Asset Management Systems Grant [Schedule 5B] – – – – – – – – –
Urban Settlement Development Grant [Schedule 4B] – – – – – – – – –
Municipal Human Settlement – – – – – – – – –
Community Library – – – – – – – – –
Integrated City Development Grant [Schedule 4B] – – – – – – – – –
Municipal Disaster Recovery Grant [Schedule 4B] – – – – – – – – –
Energy Efficiency and Demand Side Management Grant – – – – – – – – –
Khayelitsha Urban Renewal – – – – – – – – –
Local Government Financial Management Grant [Schedule 5B] – – – – – – – – –
Municipal Systems Improvement Grant [Schedule 5B] – – – – – – – – –
Public Transport Network Grant [Schedule 5B] – – – – – – – – –
Public Transport Network Operations Grant [Schedule 5B] – – – – – – – – –
Regional Bulk Infrastructure Grant (Schedule 5B) 16 931 16 931 – – – – 16 931 17 391 –
Water Services Infrastructure Grant [Schedule 5B] – – – – – – – – –
WIFI Connectivity – – – – – – – – –
Expanded Public Works Programme Integrated Grant for Municipalities [Schedule 5B] – – – – – – – – –
Aquaponic Project – – – – – – – – –
Restition Settlement – – – – – – – – –
Infrastructure Skills Development Grant [Schedule 5B] – – – – – – – – –
Restructuring Seed Funding – – – – – – – – –
Municipal Disaster Relief Grant – – – – – – – – –
Municipal Emergency Housing Grant – – – – – – – – –
Metro Informal Settlements Partnership Grant – – – – – – – – –
Prepared by : SAMRASm
Date : 2020/08/20 11:54 AM
69

Budget Year
+1 2021/22
Budget Year
+2 2022/23
Original
BudgetPrior Adjusted
Multi-year
capital
Nat. or Prov.
GovtOther Adjusts. Total Adjusts.
Adjusted
Budget
Adjusted
Budget
Adjusted
Budget
2 3 4 5 6 7
R thousands A A1 B C D E F
Description Ref
Budget Year 2020/21
Provincial Government: 42 954 42 954 – – 2 167 2 167 45 121 79 845 2 930
Capacity Building – – – – – – – – –
Capacity Building and Other – – – – 722 722 722 – 800
Disaster and Emergency Services – – – – – – – – –
Health – – – – – – – – –
Housing – – – – – – – – –
Infrastructure 42 954 42 954 – – 1 445 1 445 44 399 79 845 2 130
Libraries, Archives and Museums – – – – – – – – –
Other – – – – – – – – –
Public Transport – – – – – – – – –
Road Infrastructure – – – – – – – – –
Sports and Recreation – – – – – – – – –
Waste Water Infrastructure – – – – – – – – –
Water Supply Infrastructure – – – – – – – – –
District Municipality: – – – – 602 602 602 – –
All Grants – – – – 602 602 602 – –
Other grant providers: 10 048 10 048 – – 5 344 5 344 15 392 13 737 10 173
Departmental Agencies and Accounts – – – – – – – – –
Foreign Government and International Organisations – – – – 501 501 501 – –
Households – – – – – – – – –
Non-Profit Institutions – – – – – – – – –
Private Enterprises – – – – – – – – –
Public Corporations – – – – – – – – –
Higher Educational Institutions – – – – – – – – –
Parent Municipality / Entity – – – – – – – – –
Transfer from Operational Revenue 10 048 10 048 – – 4 843 4 843 14 891 13 737 10 173
Total Capital Transfers and Grants 6 88 764 88 764 – – 8 114 8 114 96 878 134 196 38 340
TOTAL EXPENDITURE OF TRANSFERS & GRANTS 163 228 163 228 – – 8 926 8 926 172 155 211 017 151 459
Prepared by : SAMRASm
Date : 2020/08/20 11:54 AM
70

WC022 Witzenberg - Supporting Table SB9 Adjustments Budget - reconciliation of transfers, grant receipts, and unspent funds - 25 Augustus
Budget Year +1
2021/22
Budget Year
+2 2022/23
Original
BudgetPrior Adjusted
Multi-year
capital
Nat. or Prov.
GovtOther Adjusts. Total Adjusts.
Adjusted
Budget
Adjusted
Budget
Adjusted
Budget
2 3 4 5 6 7
R thousands A A1 B C D E F
Operating transfers and grants:
National Government:
Balance unspent at beginning of the year – – – – (6 804) (6 804) (6 804) (6 804) (6 804)
Current year receipts (2 180) (2 180) – – – – (2 180) (2 200) (2 220)
Conditions met - transferred to revenue (2 180) (2 180) – – (6 804) (6 804) (8 984) (9 004) (9 024)
Conditions still to be met - transferred to liabilities – – – – – – – – –
Provincial Government:
Balance unspent at beginning of the year – – – – 8 037 8 037 8 037 8 037 8 037
Current year receipts (12 894) (12 894) – – – – (12 894) (10 830) (42 288)
Conditions met - transferred to revenue (12 894) (12 894) – – 8 037 8 037 (4 857) (2 793) (34 251)
Conditions still to be met - transferred to liabilities – – – – – – – – –
District Municipality:
Balance unspent at beginning of the year – – – – – – – – –
Current year receipts – – – – – – – – –
Conditions met - transferred to revenue – – – – – – – – –
Conditions still to be met - transferred to liabilities – – – – – – – – –
Other grant providers:
Balance unspent at beginning of the year – – – – (2 219) (2 219) (2 219) (2 219) (2 219)
Current year receipts – – – – – – – – –
Conditions met - transferred to revenue – – – – (2 219) (2 219) (2 219) (2 219) (2 219)
Conditions still to be met - transferred to liabilities – – – – – – – – –
Total operating transfers and grants revenue (15 074) (15 074) – – (986) (986) (16 060) (14 016) (45 494)
Total operating transfers and grants - CTBM 2 – – – – – – – – –
Budget Year 2020/21
Description Ref
Prepared by : SAMRASm
Date : 2020/08/20 11:54 AM
71

Budget Year +1
2021/22
Budget Year
+2 2022/23
Original
BudgetPrior Adjusted
Multi-year
capital
Nat. or Prov.
GovtOther Adjusts. Total Adjusts.
Adjusted
Budget
Adjusted
Budget
Adjusted
Budget
2 3 4 5 6 7
R thousands A A1 B C D E F
Budget Year 2020/21
Description Ref
Capital transfers and grants:
National Government:
Balance unspent at beginning of the year – – – – 275 275 275 275 275
Current year receipts (41 127) (41 127) – – – – (41 127) (46 256) (28 422)
Conditions met - transferred to revenue (41 127) (41 127) – – 275 275 (40 852) (45 981) (28 147)
Conditions still to be met - transferred to liabilities – – – – – – – – –
Provincial Government:
Balance unspent at beginning of the year – – – – (7 132) (7 132) (7 132) (7 132) (7 132)
Current year receipts (43 084) (43 084) – – – – (43 084) (79 910) (3 050)
Conditions met - transferred to revenue (43 084) (43 084) – – (7 132) (7 132) (50 216) (87 042) (10 182)
Conditions still to be met - transferred to liabilities – – – – – – – – –
District Municipality:
Balance unspent at beginning of the year – – – – – – – – –
Current year receipts – – – – – – – – –
Conditions met - transferred to revenue – – – – – – – – –
Conditions still to be met - transferred to liabilities – – – – – – – – –
Other grant providers:
Balance unspent at beginning of the year – – – – – – – – –
Current year receipts – – – – – – – – –
Conditions met - transferred to revenue – – – – – – – – –
Conditions still to be met - transferred to liabilities – – – – – – – – –
Total capital transfers and grants revenue (84 211) (84 211) – – (6 858) (6 858) (91 069) (133 024) (38 330)
Total capital transfers and grants - CTBM – – – – – – – – –
TOTAL TRANSFERS AND GRANTS REVENUE (99 285) (99 285) – – (7 844) (7 844) (107 129) (147 040) (83 824)
TOTAL TRANSFERS AND GRANTS - CTBM – – – – – – – – –
Prepared by : SAMRASm
Date : 2020/08/20 11:54 AM
72

WC022 Witzenberg - Supporting Table SB10 Adjustments Budget - transfers and grants made by the municipality - 25 Augustus
Budget Year
+1 2021/22
Budget Year
+2 2022/23
Original
BudgetPrior Adjusted Accum. Funds
Multi-year
capital
Unfore.
Unavoid.
Nat. or Prov.
GovtOther Adjusts. Total Adjusts.
Adjusted
Budget
Adjusted
Budget
Adjusted
Budget
6 7 8 9 10 11 12 13
R thousands A A1 B C D E F G H
Cash transfers to other municipalities
Operational 1 – – – – – – – – – – –
Capital – – – – – – – – – – –
– –
Total Cash Transfers To Municipalities: – – – – – – – – – – –
Cash transfers to Entities/Other External Mechanisms
Operational 2 – – – – – – – – – – –
Capital – – – – – – – – – – –
– –
Total Cash Transfers To Entities/Ems' – – – – – – – – – – –
Cash transfers to other Organs of State
Operational 3 – – – – – – – – – – –
Capital – – – – – – – – – – –
– –
Total Cash Transfers To Other Organs Of State: – – – – – – – – – – –
Cash transfers to other Organisations
Operational 4 1 396 1 396 – – – – – – 1 396 1 460 1 528
Capital – – – – – – – – – – –
– –
Total Cash Transfers To Organisations 1 396 1 396 – – – – – – 1 396 1 460 1 528
Cash Transfers to Groups of Individuals
Operational 4 782 782 – – – – – – 782 399 31 449
Capital – – – – – – – – – – –
– –
Total Cash Transfers To Groups Of Individuals: 782 782 – – – – – – 782 399 31 449
TOTAL CASH TRANSFERS AND GRANTS 5 2 179 2 179 – – – – – – 2 179 1 859 32 976
Description Ref
Budget Year 2020/21
Prepared by : SAMRASm
Date : 2020/08/20 11:54 AM
73

Budget Year
+1 2021/22
Budget Year
+2 2022/23
Original
BudgetPrior Adjusted Accum. Funds
Multi-year
capital
Unfore.
Unavoid.
Nat. or Prov.
GovtOther Adjusts. Total Adjusts.
Adjusted
Budget
Adjusted
Budget
Adjusted
Budget
6 7 8 9 10 11 12 13
R thousands A A1 B C D E F G H
Description Ref
Budget Year 2020/21
Non-cash transfers to other municipalities
Operational 1 – – – – – – – – – – –
Capital – – – – – – – – – – –
– –
Total Non-Cash Transfers To Municipalities: – – – – – – – – – – –
Non-cash transfers to Entities/Other External Mechanisms
Operational 2 – – – – – – – – – – –
Capital – – – – – – – – – – –
– –
Total Non-Cash Transfers To Entities/Ems' – – – – – – – – – – –
Non-cash transfers to other Organs of State
Operational 3 – – – – – – – – – – –
Capital – – – – – – – – – – –
– –
Total Non-Cash Transfers To Other Organs Of State: – – – – – – – – – – –
Non-cash transfers to other Organisations
Operational 4 – – – – – – – – – – –
Capital – – – – – – – – – – –
– –
TOTAL NON-CASH TRANSFERS TO OTHER ORGANISATIONS: – – – – – – – – – – –
Non-cash transfers to Groups of Individuals
Operational 4 – – – – – – – – – – –
Capital – – – – – – – – – – –
– –
Total Non-Cash Grants To Groups Of Individuals: – – – – – – – – – – –
TOTAL NON-CASH TRANSFERS AND GRANTS 5 – – – – – – – – – – –
TOTAL TRANSFERS AND GRANTS 2 179 2 179 – – – – – – 2 179 1 859 32 976
Prepared by : SAMRASm
Date : 2020/08/20 11:54 AM
74

WC022 Witzenberg - Supporting Table SB11 Adjustments Budget - councillor and staff benefits - 25 Augustus
Original
BudgetPrior Adjusted Accum. Funds
Multi-year
capital
Unfore.
Unavoid.
Nat. or Prov.
GovtOther Adjusts. Total Adjusts.
Adjusted
Budget
%
change
5 6 7 8 9 10 11 12
R thousands A A1 B C D E F G H
Councillors (Political Office Bearers plus Other)
Basic Salaries and Wages 8 104 8 104 – – – – 8 104 0.0%
Pension and UIF Contributions 1 194 1 194 – – – – 1 194 0.0%
Medical Aid Contributions 239 239 – – – – 239 0.0%
Motor Vehicle Allowance 778 778 – – – – 778 0.0%
Cellphone Allowance 1 149 1 149 – – – – 1 149 0.0%
Housing Allowances 511 511 – – – – 511 0.0%
Other benefits and allowances 56 56 – – – – 56 0.0%
Sub Total - Councillors 12 032 12 032 – – – – 12 032
% increase 0.0% 0.0%
Senior Managers of the Municipality
Basic Salaries and Wages 4 139 4 139 – – – – 4 139 0.0%
Pension and UIF Contributions 851 851 – – – – 851 0.0%
Medical Aid Contributions 147 147 – – – – 147 0.0%
Overtime – – – – – – – 0.0%
Performance Bonus 968 968 – – – – 968 0.0%
Motor Vehicle Allowance 1 143 1 143 – – – – 1 143 0.0%
Cellphone Allowance 77 77 – – – – 77 0.0%
Housing Allowances 167 167 – – – – 167 0.0%
Other benefits and allowances 125 125 – – – – 125 0.0%
Payments in lieu of leave – – – – – – – 0.0%
Long service awards – – – – – – – 0.0%
Post-retirement benefit obligations 5 – – – – – – – 0.0%
Sub Total - Senior Managers of Municipality 7 617 7 617 – – – – 7 617
% increase 0.0% 0.0%
Other Municipal Staff
Basic Salaries and Wages 126 695 126 695 – – – – 126 695 0.0%
Pension and UIF Contributions 19 060 19 060 – – – – 19 060 0.0%
Medical Aid Contributions 8 467 8 467 – – – – 8 467 0.0%
Overtime 13 794 13 794 – – – – 13 794 0.0%
Performance Bonus 8 895 8 895 – – – – 8 895 0.0%
Motor Vehicle Allowance 4 886 4 886 – – – – 4 886 0.0%
Cellphone Allowance 440 440 – – – – 440 0.0%
Housing Allowances 1 792 1 792 – – – – 1 792 0.0%
Other benefits and allowances 4 691 4 691 – – – – 4 691 0.0%
Payments in lieu of leave 966 966 – – – – 966 0.0%
Long service awards – – – – – – – 0.0%
Post-retirement benefit obligations 5 28 880 28 880 – – – – 28 880 0.0%
Sub Total - Other Municipal Staff 218 565 218 565 – – – – 218 565
% increase 0.0% 0.0%
Total Parent Municipality 238 214 238 214 – – – – 238 214 0.0%
TOTAL SALARY, ALLOWANCES & BENEFITS238 214 238 214 – – – – 238 214
% increase 0.0% 0.0%
TOTAL MANAGERS AND STAFF 226 182 226 182 – – – – 226 182 0.0%
Summary of remuneration Ref
Budget Year 2020/21
Prepared by : SAMRASm
Date : 2020/08/20 11:54 AM
75

WC022 Witzenberg - Supporting Table SB12 Adjustments Budget - monthly revenue and expenditure (municipal vote) - 25 Augustus
Medium Term Revenue and Expenditure
Framework
July August Sept. October November December January February March April May JuneBudget Year
2020/21
Budget Year
+1 2021/22
Budget Year
+2 2022/23
R thousands
Outcome Outcome Outcome Outcome Outcome Outcome Adjusted
Budget
Adjusted
Budget
Adjusted
Budget
Adjusted
Budget
Adjusted
Budget
Adjusted
Budget
Adjusted
Budget
Adjusted
Budget
Adjusted
Budget
Revenue by Vote
Vote 1 - Financial Services 36 944 7 219 7 351 9 103 6 596 8 716 5 448 7 743 12 885 7 855 8 052 (17 831) 100 080 102 909 104 299
Vote 2 - Community Services 85 914 930 1 152 835 1 103 690 980 1 631 994 1 019 2 334 12 666 19 965 57 508
Vote 3 - Community Services 46 336 9 089 9 257 11 462 8 305 10 974 6 860 9 749 16 225 9 890 10 138 (22 270) 126 015 135 218 146 622
Vote 4 - Community Services – 458 466 578 419 553 346 491 818 498 511 1 213 6 350 4 571 4 643
Vote 5 - Corporate Services 3 41 42 51 37 49 31 44 73 44 46 105 566 594 624
Vote 6 - Technical Services 26 112 28 095 24 606 30 470 22 077 29 173 18 236 25 916 43 130 26 291 26 950 33 929 334 985 386 112 357 822
Vote 7 - Technical Services 5 422 7 021 7 150 8 854 6 415 8 477 5 299 7 531 12 533 7 640 7 831 13 168 97 341 111 623 76 002
Vote 8 - Muncipal Manager 40 111 113 140 102 134 84 119 199 121 124 255 1 542 1 607 1 675
Total Revenue by Vote 114 941 52 948 49 916 61 810 44 786 59 180 36 994 52 573 87 492 53 333 54 670 10 902 679 544 762 599 749 194
Expenditure by Vote
Vote 1 - Financial Services 5 911 4 951 4 975 4 339 5 062 4 500 3 544 4 323 4 550 4 765 4 804 4 081 55 806 54 892 58 552
Vote 2 - Community Services 2 189 3 778 3 796 3 311 3 863 3 434 2 705 3 299 3 473 3 637 3 666 5 436 42 588 45 601 48 530
Vote 3 - Community Services 2 240 4 597 4 619 4 029 4 700 4 179 3 291 4 015 4 226 4 425 4 461 7 038 51 821 52 793 56 181
Vote 4 - Community Services 980 1 727 1 736 1 514 1 766 1 570 1 236 1 508 1 588 1 663 1 676 2 506 19 470 20 985 53 362
Vote 5 - Corporate Services 3 851 7 207 7 242 6 317 7 369 6 551 5 159 6 294 6 624 6 937 6 994 10 694 81 238 86 290 91 802
Vote 6 - Technical Services 5 352 29 931 30 075 26 233 30 602 27 208 21 426 26 138 27 511 28 811 29 045 55 054 337 384 362 615 395 085
Vote 7 - Technical Services 5 158 7 908 7 489 6 533 7 621 6 775 5 335 6 509 6 851 7 174 7 233 9 429 84 015 89 511 94 488
Vote 8 - Muncipal Manager 882 1 391 1 398 1 220 1 423 1 265 996 1 215 1 279 1 339 1 350 1 927 15 685 16 769 17 939
Total Expenditure by Vote 26 563 61 491 61 329 53 496 62 405 55 483 43 692 53 301 56 101 58 752 59 230 96 165 688 008 729 455 815 938
Surplus/ (Deficit) 88 378 (8 543) (11 413) 8 314 (17 619) 3 697 (6 698) (728) 31 391 (5 419) (4 560) (85 263) (8 463) 33 143 (66 744)
Description
Budget Year 2020/21
Ref
Prepared by : SAMRASm
Date : 2020/08/20 11:54 AM
76

WC022 Witzenberg - Supporting Table SB13 Adjustments Budget - monthly revenue and expenditure (functional classification) - 25 Augustus
Medium Term Revenue and Expenditure
Framework
July August Sept. October November December January February March April May JuneBudget Year
2020/21
Budget Year
+1 2021/22
Budget Year
+2 2022/23
R thousands
Outcome Outcome Outcome Outcome Outcome Outcome Adjusted
Budget
Adjusted
Budget
Adjusted
Budget
Adjusted
Budget
Adjusted
Budget
Adjusted
Budget
Adjusted
Budget
Adjusted
Budget
Adjusted
Budget
Revenue - Functional
Governance and administration 37 012 7 504 7 642 9 463 6 856 9 060 5 663 8 048 13 394 8 165 8 369 (17 145) 104 031 107 085 108 722
Executive and council 3 – – – – – – – – – – (3) – – –
Finance and administration 37 009 7 504 7 642 9 463 6 856 9 060 5 663 8 048 13 394 8 165 8 369 (17 142) 104 031 107 085 108 722
Internal audit – – – – – – – – – – – – – – –
Community and public safety 46 400 10 302 10 492 12 992 9 414 12 439 7 776 11 050 18 390 11 210 11 491 (19 122) 142 833 158 967 207 957
Community and social services 45 935 8 286 8 439 10 449 7 571 10 005 6 254 8 888 14 791 9 016 9 242 (23 995) 114 880 124 046 139 475
Sport and recreation 34 130 133 164 119 157 98 140 232 142 145 310 1 805 8 218 8 629
Public safety 431 1 849 1 883 2 332 1 689 2 232 1 396 1 983 3 300 2 012 2 062 4 464 25 634 26 158 28 251
Housing – 37 38 47 34 45 28 40 66 40 41 98 514 545 31 603
Health – – – – – – – – – – – – – – –
Economic and environmental services 123 5 528 1 625 2 012 1 458 1 926 1 204 1 711 2 848 1 736 1 779 168 22 118 48 799 13 382
Planning and development 123 740 291 360 261 345 215 306 510 311 318 178 3 958 2 627 2 745
Road transport – 4 787 1 333 1 651 1 196 1 580 988 1 404 2 336 1 424 1 460 (12) 18 147 46 159 10 626
Environmental protection – 1 1 1 1 1 1 1 2 1 1 3 13 14 10
Trading services 31 404 29 322 29 861 36 976 26 792 35 402 22 130 31 450 52 339 31 904 32 704 46 230 406 514 447 627 419 007
Energy sources 23 941 19 164 19 516 24 166 17 510 23 138 14 464 20 555 34 207 20 852 21 375 26 799 265 685 292 773 321 385
Water management 3 179 4 678 4 764 5 899 4 274 5 648 3 531 5 018 8 350 5 090 5 218 9 207 64 856 80 584 50 959
Waste water management 2 040 3 132 3 190 3 950 2 862 3 782 2 364 3 359 5 591 3 408 3 494 6 253 43 424 43 164 21 550
Waste management 2 245 2 348 2 391 2 961 2 145 2 835 1 772 2 518 4 191 2 555 2 619 3 971 32 549 31 105 25 113
Other 2 8 8 10 8 10 6 9 15 9 9 20 115 120 126
Total Revenue - Functional 114 941 52 664 49 627 61 453 44 527 58 837 36 780 52 268 86 985 53 024 54 353 10 151 675 612 762 599 749 194
Description - Standard classification Ref
Budget Year 2020/21
Prepared by : SAMRASm
Date : 2020/08/20 11:54 AM
77

Medium Term Revenue and Expenditure
Framework
July August Sept. October November December January February March April May JuneBudget Year
2020/21
Budget Year
+1 2021/22
Budget Year
+2 2022/23
R thousands
Outcome Outcome Outcome Outcome Outcome Outcome Adjusted
Budget
Adjusted
Budget
Adjusted
Budget
Adjusted
Budget
Adjusted
Budget
Adjusted
Budget
Adjusted
Budget
Adjusted
Budget
Adjusted
Budget
Description - Standard classification Ref
Budget Year 2020/21
Expenditure - Functional
Governance and administration 10 781 13 641 13 707 11 956 13 947 12 400 9 765 11 913 12 538 13 131 13 238 16 750 153 768 159 136 169 632
Executive and council 1 785 2 716 2 729 2 380 2 777 2 469 1 944 2 372 2 496 2 614 2 635 3 696 30 612 32 525 34 529
Finance and administration 8 750 10 677 10 728 9 358 10 916 9 705 7 643 9 324 9 813 10 277 10 361 12 798 120 351 123 618 131 904
Internal audit 246 249 250 218 254 226 178 217 229 240 242 256 2 805 2 993 3 199
Community and public safety 5 222 9 525 9 571 8 348 9 739 8 658 6 818 8 318 8 755 9 168 9 243 14 001 107 367 112 367 150 506
Community and social services 1 559 2 564 2 576 2 247 2 622 2 331 1 835 2 239 2 357 2 468 2 488 3 616 28 902 28 492 30 073
Sport and recreation 1 424 2 702 2 715 2 368 2 763 2 456 1 934 2 360 2 483 2 601 2 622 4 029 30 457 32 703 34 934
Public safety 1 925 3 744 3 762 3 281 3 828 3 403 2 680 3 269 3 441 3 604 3 633 5 631 42 200 44 954 47 809
Housing 314 515 518 452 527 468 369 450 474 496 500 725 5 807 6 218 37 690
Health – – – – – – – – – – – – – – –
Economic and environmental services 1 560 3 411 3 427 2 989 3 487 3 100 2 441 2 978 3 135 3 283 3 310 5 323 38 444 39 446 41 801
Planning and development 754 1 154 1 160 1 012 1 180 1 049 826 1 008 1 061 1 111 1 120 1 576 13 010 12 392 13 362
Road transport 790 2 078 2 088 1 821 2 125 1 889 1 488 1 815 1 910 2 000 2 017 3 404 23 425 24 883 26 096
Environmental protection 17 178 179 156 182 162 128 156 164 172 173 343 2 009 2 171 2 343
Trading services 8 999 34 334 34 499 30 092 35 104 31 210 24 577 29 982 31 558 33 049 33 318 60 293 387 015 417 504 452 945
Energy sources 1 967 23 994 24 109 21 030 24 532 21 811 17 176 20 953 22 054 23 096 23 284 46 457 270 463 293 366 322 093
Water management 2 434 3 170 3 185 2 778 3 241 2 882 2 269 2 768 2 914 3 051 3 076 3 963 35 733 37 962 39 776
Waste water management 2 161 3 084 3 099 2 703 3 153 2 804 2 208 2 693 2 835 2 969 2 993 4 063 34 766 37 044 38 992
Waste management 2 436 4 086 4 105 3 581 4 177 3 714 2 925 3 568 3 755 3 933 3 965 5 809 46 053 49 131 52 084
Other – 85 86 75 87 77 61 74 78 82 83 172 959 1 003 1 053
Total Expenditure - Functional 26 563 60 996 61 289 53 460 62 364 55 446 43 663 53 265 56 064 58 713 59 191 96 538 687 553 729 455 815 938
Surplus/ (Deficit) 1. 88 378 (8 332) (11 661) 7 992 (17 837) 3 391 (6 883) (997) 30 922 (5 689) (4 838) (86 387) (11 941) 33 143 (66 744)
Prepared by : SAMRASm
Date : 2020/08/20 11:54 AM
78

WC022 Witzenberg - Supporting Table SB14 Adjustments Budget - monthly revenue and expenditure - 25 Augustus
Medium Term Revenue and Expenditure
Framework
July August Sept. October November December January February March April May JuneBudget Year
2020/21
Budget Year
+1 2021/22
Budget Year
+2 2022/23
R thousands
Outcome Outcome Outcome Outcome Outcome Outcome Adjusted
Budget
Adjusted
Budget
Adjusted
Budget
Adjusted
Budget
Adjusted
Budget
Adjusted
Budget
Adjusted
Budget
Adjusted
Budget
Adjusted
Budget
Revenue By Source
Property rates 36 554 9 228 7 585 21 898 4 528 3 542 4 798 4 567 3 942 3 978 4 146 (28 377) 76 388 81 736 85 822
Service charges - electricity revenue 23 941 20 835 20 711 20 818 18 914 13 919 16 440 23 836 25 997 28 920 29 240 23 401 266 973 284 115 312 915
Service charges - water revenue 3 179 3 245 1 899 3 468 2 176 2 382 2 787 4 133 2 781 3 226 3 169 2 691 35 137 37 630 39 821
Service charges - sanitation revenue 2 107 1 549 1 559 1 412 1 223 849 1 616 1 641 1 418 1 232 1 329 2 416 18 352 19 453 20 425
Service charges - refuse 2 240 1 857 1 532 2 232 1 665 1 592 1 810 2 058 1 617 1 759 1 732 1 175 21 271 22 547 23 547
Service charges - other – – – – –
Rental of facilities and equipment 91 140 238 270 227 34 389 325 349 82 266 252 2 663 8 342 8 759
Interest earned - external investments 235 580 759 455 701 529 1 494 1 029 592 620 873 1 261 9 129 9 586 9 089
Interest earned - outstanding debtors 0 – – – – – – – 8 264 – – (0) 8 264 8 677 9 111
Dividends received – – – – –
Fines, penalties and forfeits – 985 2 233 567 2 302 579 921 2 360 977 878 3 438 5 217 20 456 21 479 22 553
Licences and permits 430 58 191 207 436 108 199 37 96 15 380 (148) 2 010 2 111 2 216
Agency services – – – – – – – – – 3 854 – – 3 854 4 046 4 249
Transfers and subsidies 45 920 2 786 4 114 2 326 2 375 32 994 – 4 916 28 865 140 0 (4 091) 120 343 125 089 166 900
Other revenue 245 410 692 2 126 773 242 1 165 420 241 2 173 384 368 9 240 11 847 9 632
Gains on disposal of PPE – (0) (0) (0) –
Total Revenue 114 941 41 673 41 512 55 779 35 321 56 770 31 620 45 323 75 138 46 878 44 959 4 166 594 079 636 657 715 040
Expenditure By Type
Employee related costs 15 455 18 288 17 076 17 330 27 381 17 478 17 513 21 077 17 644 18 075 20 496 18 369 226 182 242 401 262 678
Remuneration of councillors 825 977 969 934 948 971 1 196 1 003 1 013 1 014 1 012 1 169 12 032 12 633 13 265
Debt impairment 1 3 500 3 500 3 500 3 500 3 500 3 500 3 500 3 500 3 500 3 500 9 687 44 688 47 670 50 416
Depreciation & asset impairment 2 3 390 3 390 3 390 3 390 3 390 3 390 3 390 3 390 3 390 3 390 6 786 40 688 42 918 42 918
Finance charges – – – – – 4 582 – – 427 – – 4 172 9 181 9 635 10 108
Bulk purchases 184 26 551 25 625 14 859 14 671 14 293 13 008 17 408 17 778 22 001 20 552 45 832 232 760 252 871 279 144
Other materials 501 403 623 2 535 1 627 1 953 1 289 3 352 1 381 1 855 2 565 2 013 20 096 20 425 21 410
Contracted services 602 2 668 4 632 4 439 5 138 4 876 2 284 2 116 6 211 4 249 6 346 9 621 53 182 52 008 54 155
Grants and subsidies 66 64 50 84 – 1 150 22 1 541 46 89 66 2 179 1 859 32 976
Other expenditure 8 929 5 196 5 464 6 423 5 751 4 441 1 361 1 434 3 216 4 622 1 281 (1 097) 47 020 47 035 48 867
Loss on disposal of PPE – 0 0 0 –
Total Expenditure 26 563 61 036 61 329 53 496 62 405 55 483 43 692 53 301 56 101 58 752 59 230 96 620 688 008 729 455 815 938
Surplus/(Deficit) 88 378 (19 363) (19 817) 2 283 (27 084) 1 287 (12 072) (7 978) 19 037 (11 874) (14 271) (92 454) (93 928) (92 798) (100 898)
Transfers and subsidies - capital (monetary allocations)
(National / Provincial and District)7 306 8 367 5 986 9 432 2 366 5 346 7 211 12 290 6 415 9 670 10 574 84 964 120 459 28 167
Transfers and subsidies - capital (monetary allocations)
(National / Provincial Departmental Agencies, Households, Non-
profit Institutions, Private Enterprises, Public Corporatons,
Higher Educational Institutions)
501 – 501 – –
Transfers and subsidies - capital (in-kind - all) – – – –
Surplus/(Deficit) after capital transfers & contributions 88 378 (12 057) (10 948) 8 269 (17 652) 3 653 (6 725) (767) 31 327 (5 458) (4 601) (81 881) (8 463) 27 661 (72 732)
Description Ref
Budget Year 2020/21
Prepared by : SAMRASm
Date : 2020/08/20 11:54 AM
79

WC022 Witzenberg - Supporting Table SB15 Adjustments Budget - monthly cash flow - 25 Augustus
July August Sept. October November December January February March April May JuneBudget Year
2020/21
Budget Year
+1 2021/22
Budget Year
+2 2022/23
R thousands
Outcome Outcome Outcome Outcome Outcome Outcome Adjusted
Budget
Adjusted
Budget
Adjusted
Budget
Adjusted
Budget
Adjusted
Budget
Adjusted
Budget
Adjusted
Budget
Adjusted
Budget
Adjusted
Budget
Cash Receipts By Source 1
Property rates 4 112 8 766 7 206 20 803 4 301 3 365 4 558 4 339 3 745 3 779 3 939 3 656 72 569 77 649 81 531
Service charges - electricity revenue 21 484 20 627 20 504 20 610 18 725 13 780 16 276 23 598 25 737 28 631 28 948 25 384 264 303 281 274 309 786
Service charges - water revenue 2 338 3 083 1 804 3 294 2 068 2 263 2 648 3 926 2 642 3 065 3 011 3 239 33 380 35 748 37 830
Service charges - sanitation revenue 1 302 1 471 1 481 1 341 1 162 806 1 535 1 559 1 347 1 170 1 263 2 995 17 434 18 480 19 404
Service charges - refuse 1 545 1 765 1 455 2 120 1 582 1 513 1 720 1 955 1 536 1 671 1 646 1 699 20 207 21 420 22 370
Service charges - other – – – – – – – – – – – – – –
Rental of facilities and equipment 3 70 119 135 114 17 194 162 174 41 133 169 1 331 4 171 4 380
Interest earned - external investments 235 580 759 455 701 529 1 494 1 029 592 620 873 1 261 9 129 9 586 9 089
Interest earned - outstanding debtors – – – – – – – – 2 479 – – – 2 479 2 603 2 733
Dividends received – – – – – – – – – – – – – – –
Fines, penalties and forfeits 3 256 581 147 598 150 240 613 254 228 894 1 353 5 319 5 585 5 864
Licences and permits 813 58 191 207 436 108 199 37 96 15 380 (531) 2 010 2 111 2 216
Agency services – – – – – – – – – 3 854 – – 3 854 4 046 4 249
Transfer receipts - operational 45 862 2 323 4 098 2 317 2 366 32 869 – 4 897 28 755 139 0 (3 738) 119 888 125 089 166 900
Other revenue 83 410 692 2 126 773 242 1 165 420 241 2 173 384 531 9 239 11 847 9 632
Cash Receipts by Source 77 779 39 409 38 889 53 557 32 826 55 642 30 029 42 537 67 599 45 387 41 471 36 018 561 144 599 608 675 983
Other Cash Flows by Source
Transfers receipts - capital 3 721 – – 4 435 6 843 9 588 – 8 871 20 232 7 295 3 178 17 823 81 987 120 459 28 167
Contributions & Contributed assets – –
Proceeds on disposal of PPE – –
Short term loans – –
Borrowing long term/refinancing – –
Increase (decrease) in consumer deposits (35) 35
Decrease (Increase) in non-current debtors – –
Decrease (increase) other non-current receivables – –
Decrease (increase) in non-current investments – –
Total Cash Receipts by Source 81 465 39 409 38 889 57 993 39 670 65 230 30 029 51 408 87 831 52 683 44 649 53 876 643 131 720 067 704 150
Monthly cash flows
Medium Term Revenue and Expenditure
Framework
Ref
Budget Year 2020/21
Prepared by : SAMRASm
Date : 2020/08/20 11:54 AM
80

July August Sept. October November December January February March April May JuneBudget Year
2020/21
Budget Year
+1 2021/22
Budget Year
+2 2022/23
R thousands
Outcome Outcome Outcome Outcome Outcome Outcome Adjusted
Budget
Adjusted
Budget
Adjusted
Budget
Adjusted
Budget
Adjusted
Budget
Adjusted
Budget
Adjusted
Budget
Adjusted
Budget
Adjusted
Budget
Monthly cash flows
Medium Term Revenue and Expenditure
Framework
Ref
Budget Year 2020/21
Cash Payments by Type
Employee related costs 13 585 16 120 15 052 15 276 24 135 15 406 15 437 18 578 15 552 15 932 18 066 16 230 199 371 215 590 235 867
Remuneration of councillors 940 977 969 934 948 971 1 196 1 003 1 013 1 014 1 012 1 054 12 032 12 633 13 265
Finance charges – – – – – 851 – – 79 – – 775 1 706 2 160 2 633
Bulk purchases - Electricity 29 263 26 551 25 625 14 859 14 671 14 293 13 008 17 408 17 778 22 001 20 552 16 753 232 760 252 871 279 144
Bulk purchases - Water & Sewer – – – – – – – – – – – – – – –
Other materials 1 462 403 623 2 535 1 627 1 953 1 289 3 352 1 381 1 855 2 565 1 053 20 096 20 425 21 410
Contracted services 1 859 2 645 4 593 4 401 5 094 4 834 2 265 2 098 6 158 4 213 6 292 8 276 52 727 52 008 54 155
Transfers and grants - other municipalities – – – – – – – – – – – – – – –
Transfers and grants - other 672 64 50 84 – 1 150 22 1 541 46 89 (540) 2 179 1 859 32 976
Other expenditure 10 173 5 196 5 464 6 423 5 751 4 441 1 361 1 434 3 216 4 622 1 281 (2 341) 47 020 47 035 48 867
Cash Payments by Type 57 953 51 956 52 376 44 514 52 225 42 749 34 707 43 894 46 719 49 683 49 856 41 260 567 891 604 582 688 318
Other Cash Flows/Payments by Type
Capital assets 1 025 4 364 9 541 6 825 10 755 2 698 6 096 8 222 14 013 7 315 11 027 14 997 96 878 134 196 38 340
Repayment of borrowing – –
Other Cash Flows/Payments 864 (864)
Total Cash Payments by Type 59 842 56 320 61 916 51 339 62 980 45 448 40 803 52 116 60 731 56 998 60 883 55 393 664 769 738 777 726 658
NET INCREASE/(DECREASE) IN CASH HELD 21 623 (16 911) (23 027) 6 654 (23 310) 19 783 (10 774) (708) 27 099 (4 315) (16 234) (1 518) (21 638) (18 710) (22 508)
Cash/cash equivalents at the month/year beginning: 128 954 150 577 133 666 110 639 117 293 93 983 113 765 102 991 102 283 129 383 125 068 108 834 128 954 107 316 88 606
Cash/cash equivalents at the month/year end: 150 577 133 666 110 639 117 293 93 983 113 765 102 991 102 283 129 383 125 068 108 834 107 316 107 316 88 606 66 098
Prepared by : SAMRASm
Date : 2020/08/20 11:54 AM
81
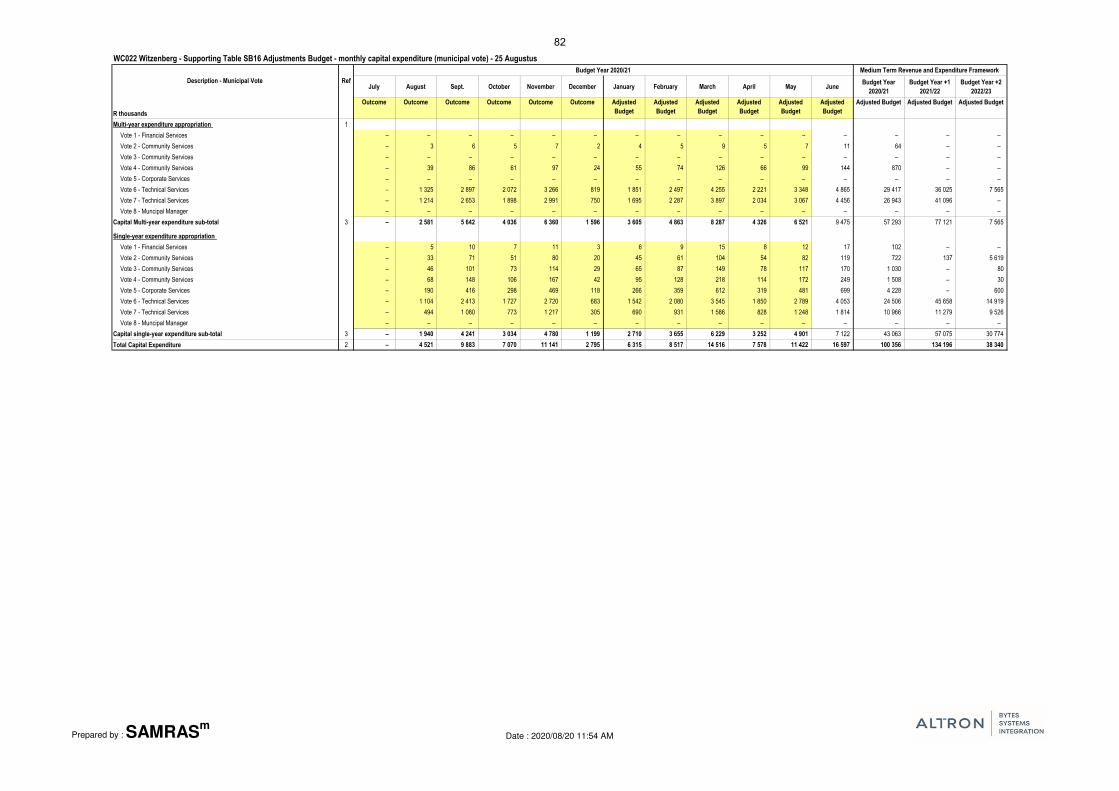
WC022 Witzenberg - Supporting Table SB16 Adjustments Budget - monthly capital expenditure (municipal vote) - 25 Augustus
Budget Year 2020/21 Medium Term Revenue and Expenditure Framework
July August Sept. October November December January February March April May JuneBudget Year
2020/21
Budget Year +1
2021/22
Budget Year +2
2022/23
R thousands
Outcome Outcome Outcome Outcome Outcome Outcome Adjusted
Budget
Adjusted
Budget
Adjusted
Budget
Adjusted
Budget
Adjusted
Budget
Adjusted
Budget
Adjusted Budget Adjusted Budget Adjusted Budget
Multi-year expenditure appropriation 1
Vote 1 - Financial Services – – – – – – – – – – – – – – –
Vote 2 - Community Services – 3 6 5 7 2 4 5 9 5 7 11 64 – –
Vote 3 - Community Services – – – – – – – – – – – – – – –
Vote 4 - Community Services – 39 86 61 97 24 55 74 126 66 99 144 870 – –
Vote 5 - Corporate Services – – – – – – – – – – – – – – –
Vote 6 - Technical Services – 1 325 2 897 2 072 3 266 819 1 851 2 497 4 255 2 221 3 348 4 865 29 417 36 025 7 565
Vote 7 - Technical Services – 1 214 2 653 1 898 2 991 750 1 695 2 287 3 897 2 034 3 067 4 456 26 943 41 096 –
Vote 8 - Muncipal Manager – – – – – – – – – – – – – – –
Capital Multi-year expenditure sub-total 3 – 2 581 5 642 4 036 6 360 1 596 3 605 4 863 8 287 4 326 6 521 9 475 57 293 77 121 7 565
Single-year expenditure appropriation
Vote 1 - Financial Services – 5 10 7 11 3 6 9 15 8 12 17 102 – –
Vote 2 - Community Services – 33 71 51 80 20 45 61 104 54 82 119 722 137 5 619
Vote 3 - Community Services – 46 101 73 114 29 65 87 149 78 117 170 1 030 – 80
Vote 4 - Community Services – 68 148 106 167 42 95 128 218 114 172 249 1 508 – 30
Vote 5 - Corporate Services – 190 416 298 469 118 266 359 612 319 481 699 4 228 – 600
Vote 6 - Technical Services – 1 104 2 413 1 727 2 720 683 1 542 2 080 3 545 1 850 2 789 4 053 24 506 45 658 14 919
Vote 7 - Technical Services – 494 1 080 773 1 217 305 690 931 1 586 828 1 248 1 814 10 966 11 279 9 526
Vote 8 - Muncipal Manager – – – – – – – – – – – – – – –
Capital single-year expenditure sub-total 3 – 1 940 4 241 3 034 4 780 1 199 2 710 3 655 6 229 3 252 4 901 7 122 43 063 57 075 30 774
Total Capital Expenditure 2 – 4 521 9 883 7 070 11 141 2 795 6 315 8 517 14 516 7 578 11 422 16 597 100 356 134 196 38 340
Description - Municipal Vote Ref
Prepared by : SAMRASm
Date : 2020/08/20 11:54 AM
82

WC022 Witzenberg - Supporting Table SB17 Adjustments Budget - monthly capital expenditure (functional classification) - 25 Augustus
Medium Term Revenue and Expenditure
Framework
July August Sept. October November December January February March April May JuneBudget Year
2020/21
Budget Year
+1 2021/22
Budget Year
+2 2022/23
R thousands
Outcome Outcome Outcome Outcome Outcome Outcome Adjusted
Budget
Adjusted
Budget
Adjusted
Budget
Adjusted
Budget
Adjusted
Budget
Adjusted
Budget
Adjusted
Budget
Adjusted
Budget
Adjusted
Budget
Capital Expenditure - Functional
Governance and administration – 171 374 268 422 106 239 323 550 287 433 629 3 802 – 600
Executive and council - 65 143 102 161 40 91 123 210 109 165 240 1 450 – –
Finance and administration – 106 232 166 261 66 148 200 340 178 268 389 2 352 – 600
Internal audit – – – – –
Community and public safety – 122 267 191 301 76 171 230 393 205 309 449 2 716 137 5 729
Community and social services – 45 98 70 110 28 62 84 143 75 113 164 990 137 4 859
Sport and recreation – 42 93 66 104 26 59 80 136 71 107 155 940 – 70
Public safety – 35 77 55 87 22 49 67 114 59 89 130 786 – 800
Housing – – – – –
Health – – – – –
Economic and environmental services – 1 160 2 536 1 814 2 858 717 1 620 2 185 3 724 1 944 2 931 4 258 25 748 53 978 12 984
Planning and development – 67 146 104 164 41 93 125 214 112 168 244 1 478 – –
Road transport – 1 093 2 390 1 710 2 694 676 1 527 2 060 3 511 1 833 2 762 4 014 24 271 53 978 12 984
Environmental protection – – – – –
Trading services – 3 067 6 705 4 797 7 559 1 896 4 285 5 779 9 849 5 141 7 750 11 261 68 089 80 080 19 026
Energy sources – 132 289 207 326 82 185 249 425 222 334 485 2 935 5 065 8 000
Water management – 1 275 2 786 1 993 3 141 788 1 780 2 401 4 093 2 136 3 220 4 679 28 294 39 990 9 526
Waste water management – 1 187 2 595 1 856 2 925 734 1 658 2 236 3 811 1 989 2 999 4 357 26 347 22 640 1 500
Waste management – 474 1 035 741 1 167 293 662 892 1 521 794 1 197 1 739 10 513 12 384 –
Other – – – – –
Total Capital Expenditure - Functional – 4 521 9 883 7 070 11 141 2 795 6 315 8 517 14 516 7 578 11 422 16 597 100 356 134 196 38 340
Description Ref
Budget Year 2020/21
Prepared by : SAMRASm
Date : 2020/08/20 11:54 AM
83

WC022 Witzenberg - Supporting Table SB18a Adjustments Budget - capital expenditure on new assets by asset class - 25 Augustus
Budget Year +1
2021/22
Budget Year +2
2022/23
Original
BudgetPrior Adjusted Accum. Funds
Multi-year
capital
Unfore.
Unavoid.
Nat. or Prov.
GovtOther Adjusts. Total Adjusts.
Adjusted
Budget
Adjusted
Budget
Adjusted
Budget
7 8 9 10 11 12 13 14
R thousands A A1 B C D E F G H
Capital expenditure on new assets by Asset Class/Sub-class
Infrastructure 73 717 74 967 – – – – 1 592 1 592 76 558 46 555 13 591
Roads Infrastructure 13 417 13 417 – – – – – – 13 417 935 1 565
Roads 12 547 12 547 – – – – – – 12 547 – 1 565
Road Structures 870 870 – – – – – – 870 935 –
Road Furniture – – – – – – – – – – –
Capital Spares – – – – – – – – – – –
Storm water Infrastructure 13 819 13 819 – – – – – – 13 819 – –
Drainage Collection – – – – – – – – – – –
Storm water Conveyance 13 819 13 819 – – – – – – 13 819 – –
Attenuation – – – – – – – – – – –
Electrical Infrastructure – 1 250 – – – – 435 435 1 685 4 565 4 000
Power Plants – – – – – – – – – – –
HV Substations – – – – – – – – – – –
HV Switching Station – – – – – – – – – – –
HV Transmission Conductors – – – – – – – – – – –
MV Substations – – – – – – – – – – –
MV Switching Stations – – – – – – – – – – –
MV Networks – 1 250 – – – – 435 435 1 685 3 000 4 000
LV Networks – – – – – – – – – 1 565 –
Capital Spares – – – – – – – – – – –
Water Supply Infrastructure 26 896 26 896 – – – – – – 26 896 28 670 8 026
Dams and Weirs 16 931 16 931 – – – – – – 16 931 17 391 –
Boreholes – – – – – – – – – – –
Reservoirs – – – – – – – – – 11 279 –
Pump Stations – – – – – – – – – – –
Water Treatment Works – – – – – – – – – – –
Bulk Mains 476 476 – – – – – – 476 – 8 026
Distribution 9 489 9 489 – – – – – – 9 489 – –
Distribution Points – – – – – – – – – – –
PRV Stations – – – – – – – – – – –
Capital Spares – – – – – – – – – – –
Sanitation Infrastructure 10 228 10 228 – – – – – – 10 228 – –
Pump Station – – – – – – – – – – –
Reticulation 10 228 10 228 – – – – – – 10 228 – –
Waste Water Treatment Works – – – – – – – – – – –
Outfall Sewers – – – – – – – – – – –
Toilet Facilities – – – – – – – – – – –
Capital Spares – – – – – – – – – – –
Description
Budget Year 2020/21
Ref
Prepared by : SAMRASm
Date : 2020/08/20 11:54 AM
84

Budget Year +1
2021/22
Budget Year +2
2022/23
Original
BudgetPrior Adjusted Accum. Funds
Multi-year
capital
Unfore.
Unavoid.
Nat. or Prov.
GovtOther Adjusts. Total Adjusts.
Adjusted
Budget
Adjusted
Budget
Adjusted
Budget
7 8 9 10 11 12 13 14
R thousands A A1 B C D E F G H
Description
Budget Year 2020/21
Ref
Solid Waste Infrastructure 9 356 9 356 – – – – 1 157 1 157 10 513 12 384 –
Landfill Sites – – – – – – – – – – –
Waste Transfer Stations – – – – – – 501 501 501 – –
Waste Processing Facilities – – – – – – – – – – –
Waste Drop-off Points – – – – – – – – – – –
Waste Separation Facilities 9 356 9 356 – – – – 656 656 10 012 12 384 –
Electricity Generation Facilities – – – – – – – – – – –
Capital Spares – – – – – – – – – – –
Rail Infrastructure – – – – – – – – – – –
Rail Lines – – – – – – – – – – –
Rail Structures – – – – – – – – – – –
Rail Furniture – – – – – – – – – – –
Drainage Collection – – – – – – – – – – –
Storm water Conveyance – – – – – – – – – – –
Attenuation – – – – – – – – – – –
MV Substations – – – – – – – – – – –
LV Networks – – – – – – – – – – –
Capital Spares – – – – – – – – – – –
Coastal Infrastructure – – – – – – – – – – –
Sand Pumps – – – – – – – – – – –
Piers – – – – – – – – – – –
Revetments – – – – – – – – – – –
Promenades – – – – – – – – – – –
Capital Spares – – – – – – – – – – –
Information and Communication Infrastructure – – – – – – – – – – –
Data Centres – – – – – – – – – – –
Core Layers – – – – – – – – – – –
Distribution Layers – – – – – – – – – – –
Capital Spares – – – – – – – – – – –
Prepared by : SAMRASm
Date : 2020/08/20 11:54 AM
85

Budget Year +1
2021/22
Budget Year +2
2022/23
Original
BudgetPrior Adjusted Accum. Funds
Multi-year
capital
Unfore.
Unavoid.
Nat. or Prov.
GovtOther Adjusts. Total Adjusts.
Adjusted
Budget
Adjusted
Budget
Adjusted
Budget
7 8 9 10 11 12 13 14
R thousands A A1 B C D E F G H
Description
Budget Year 2020/21
Ref
Community Assets 30 30 – – – – 1 478 1 478 1 508 311 11 675
Community Facilities – – – – – – 1 478 1 478 1 478 311 11 645
Halls – – – – – – – – – – –
Centres – – – – – – – – – 174 6 826
Crèches – – – – – – – – – – –
Clinics/Care Centres – – – – – – – – – – –
Fire/Ambulance Stations – – – – – – – – – – –
Testing Stations – – – – – – – – – – –
Museums – – – – – – – – – – –
Galleries – – – – – – – – – – –
Theatres – – – – – – – – – – –
Libraries – – – – – – – – – – –
Cemeteries/Crematoria – – – – – – – – – 137 4 819
Police – – – – – – – – – – –
Parks – – – – – – – – – – –
Public Open Space – – – – – – – – – – –
Nature Reserves – – – – – – – – – – –
Public Ablution Facilities – – – – – – – – – – –
Markets – – – – – – 1 478 1 478 1 478 – –
Stalls – – – – – – – – – – –
Abattoirs – – – – – – – – – – –
Airports – – – – – – – – – – –
Taxi Ranks/Bus Terminals – – – – – – – – – – –
Capital Spares – – – – – – – – – – –
Sport and Recreation Facilities 30 30 – – – – – – 30 – 30
Indoor Facilities – – – – – – – – – – –
Outdoor Facilities 30 30 – – – – – – 30 – 30
Capital Spares – – – – – – – – – – –
Heritage assets – – – – – – – – – – –
Monuments – – – – – – – – – – –
Historic Buildings – – – – – – – – – – –
Works of Art – – – – – – – – – – –
Conservation Areas – – – – – – – – – – –
Other Heritage – – – – – – – – – – –
Investment properties – – – – – – – – – – –
Revenue Generating – – – – – – – – – – –
Improved Property – – – – – – – – – – –
Unimproved Property – – – – – – – – – – –
Non-revenue Generating – – – – – – – – – – –
Improved Property – – – – – – – – – – –
Unimproved Property – – – – – – – – – – –
Prepared by : SAMRASm
Date : 2020/08/20 11:54 AM
86

Budget Year +1
2021/22
Budget Year +2
2022/23
Original
BudgetPrior Adjusted Accum. Funds
Multi-year
capital
Unfore.
Unavoid.
Nat. or Prov.
GovtOther Adjusts. Total Adjusts.
Adjusted
Budget
Adjusted
Budget
Adjusted
Budget
7 8 9 10 11 12 13 14
R thousands A A1 B C D E F G H
Description
Budget Year 2020/21
Ref
Other assets – – – – – – – – – – –
Operational Buildings – – – – – – – – – – –
Municipal Offices – – – – – – – – – – –
Pay/Enquiry Points – – – – – – – – – – –
Building Plan Offices – – – – – – – – – – –
Workshops – – – – – – – – – – –
Yards – – – – – – – – – – –
Stores – – – – – – – – – – –
Laboratories – – – – – – – – – – –
Training Centres – – – – – – – – – – –
Manufacturing Plant – – – – – – – – – – –
Depots – – – – – – – – – – –
Capital Spares – – – – – – – – – – –
Housing – – – – – – – – – – –
Staff Housing – – – – – – – – – – –
Social Housing – – – – – – – – – – –
Capital Spares – – – – – – – – – – –
Biological or Cultivated Assets – – – – – – – – – – –
Biological or Cultivated Assets – – – – – – – – – – –
Intangible Assets – – – – – – – – – – –
Servitudes – – – – – – – – – – –
Licences and Rights – – – – – – – – – – –
Water Rights – – – – – – – – – – –
Effluent Licenses – – – – – – – – – – –
Solid Waste Licenses – – – – – – – – – – –
Computer Software and Applications – – – – – – – – – – –
Load Settlement Software Applications – – – – – – – – – – –
Unspecified – – – – – – – – – – –
Computer Equipment 450 450 – – – – 0 0 450 – 600
Computer Equipment 450 450 – – – – 0 0 450 – 600
Furniture and Office Equipment – – – – – – – – – – –
Furniture and Office Equipment – – – – – – – – – – –
Machinery and Equipment 430 1 328 – – – – 1 447 1 447 2 775 – 80
Machinery and Equipment 430 1 328 – – – – 1 447 1 447 2 775 – 80
Transport Assets – – – – – – 722 722 722 – 800
Transport Assets – – – – – – 722 722 722 – 800
Land – – – – – – – – – – –
Land – – – – – – – – – – –
Zoo's, Marine and Non-biological Animals – – – – – – – – – – –
Zoo's, Marine and Non-biological Animals – – – – – – – – – – –
Total Capital Expenditure on new assets to be adjusted 1 74 627 76 774 – – – – 5 238 5 238 82 013 46 866 26 747
Prepared by : SAMRASm
Date : 2020/08/20 11:54 AM
87

WC022 Witzenberg - Supporting Table SB18b Adjustments Budget - capital expenditure on renewal of existing assets by asset class - 25 Augustus
Budget Year +1
2021/22
Budget Year +2
2022/23
Original
BudgetPrior Adjusted Accum. Funds
Multi-year
capital
Unfore.
Unavoid.
Nat. or Prov.
GovtOther Adjusts. Total Adjusts.
Adjusted
Budget
Adjusted
Budget
Adjusted
Budget
7 8 9 10 11 12 13 14
R thousands A A1 B C D E F G H
Capital expenditure on renewal of existing assets by Asset Class/Sub-class
Infrastructure 4 300 4 300 – – – – – – 4 300 – 5 000
Roads Infrastructure 1 800 1 800 – – – – – – 1 800 – 2 000
Roads 1 800 1 800 – – – – – – 1 800 – 2 000
Road Structures – – – – – – – – – – –
Road Furniture – – – – – – – – – – –
Capital Spares – – – – – – – – – – –
Storm water Infrastructure – – – – – – – – – – –
Drainage Collection – – – – – – – – – – –
Storm water Conveyance – – – – – – – – – – –
Attenuation – – – – – – – – – – –
Electrical Infrastructure – – – – – – – – – – –
Power Plants – – – – – – – – – – –
HV Substations – – – – – – – – – – –
HV Switching Station – – – – – – – – – – –
HV Transmission Conductors – – – – – – – – – – –
MV Substations – – – – – – – – – – –
MV Switching Stations – – – – – – – – – – –
MV Networks – – – – – – – – – – –
LV Networks – – – – – – – – – – –
Capital Spares – – – – – – – – – – –
Water Supply Infrastructure 500 500 – – – – – – 500 – 1 500
Dams and Weirs – – – – – – – – – – –
Boreholes – – – – – – – – – – –
Reservoirs – – – – – – – – – – –
Pump Stations – – – – – – – – – – –
Water Treatment Works – – – – – – – – – – –
Bulk Mains – – – – – – – – – – –
Distribution 500 500 – – – – – – 500 – 1 500
Distribution Points – – – – – – – – – – –
PRV Stations – – – – – – – – – – –
Capital Spares – – – – – – – – – – –
Sanitation Infrastructure 2 000 2 000 – – – – – – 2 000 – 1 500
Pump Station – – – – – – – – – – –
Reticulation 500 500 – – – – – – 500 – 1 500
Waste Water Treatment Works 1 500 1 500 – – – – – – 1 500 – –
Outfall Sewers – – – – – – – – – – –
Toilet Facilities – – – – – – – – – – –
Capital Spares – – – – – – – – – – –
Description Ref
Budget Year 2020/21
Prepared by : SAMRASm
Date : 2020/08/20 11:54 AM
88

Budget Year +1
2021/22
Budget Year +2
2022/23
Original
BudgetPrior Adjusted Accum. Funds
Multi-year
capital
Unfore.
Unavoid.
Nat. or Prov.
GovtOther Adjusts. Total Adjusts.
Adjusted
Budget
Adjusted
Budget
Adjusted
Budget
7 8 9 10 11 12 13 14
R thousands A A1 B C D E F G H
Description Ref
Budget Year 2020/21
Solid Waste Infrastructure – – – – – – – – – – –
Landfill Sites – – – – – – – – – – –
Waste Transfer Stations – – – – – – – – – – –
Waste Processing Facilities – – – – – – – – – – –
Waste Drop-off Points – – – – – – – – – – –
Waste Separation Facilities – – – – – – – – – – –
Electricity Generation Facilities – – – – – – – – – – –
Capital Spares – – – – – – – – – – –
Rail Infrastructure – – – – – – – – – – –
Rail Lines – – – – – – – – – – –
Rail Structures – – – – – – – – – – –
Rail Furniture – – – – – – – – – – –
Drainage Collection – – – – – – – – – – –
Storm water Conveyance – – – – – – – – – – –
Attenuation – – – – – – – – – – –
MV Substations – – – – – – – – – – –
LV Networks – – – – – – – – – – –
Capital Spares – – – – – – – – – – –
Coastal Infrastructure – – – – – – – – – – –
Sand Pumps – – – – – – – – – – –
Piers – – – – – – – – – – –
Revetments – – – – – – – – – – –
Promenades – – – – – – – – – – –
Capital Spares – – – – – – – – – – –
Information and Communication Infrastructure – – – – – – – – – – –
Data Centres – – – – – – – – – – –
Core Layers – – – – – – – – – – –
Distribution Layers – – – – – – – – – – –
Capital Spares – – – – – – – – – – –
Prepared by : SAMRASm
Date : 2020/08/20 11:54 AM
89

Budget Year +1
2021/22
Budget Year +2
2022/23
Original
BudgetPrior Adjusted Accum. Funds
Multi-year
capital
Unfore.
Unavoid.
Nat. or Prov.
GovtOther Adjusts. Total Adjusts.
Adjusted
Budget
Adjusted
Budget
Adjusted
Budget
7 8 9 10 11 12 13 14
R thousands A A1 B C D E F G H
Description Ref
Budget Year 2020/21
Community Assets – – – – – – – – – – –
Community Facilities – – – – – – – – – – –
Halls – – – – – – – – – – –
Centres – – – – – – – – – – –
Crèches – – – – – – – – – – –
Clinics/Care Centres – – – – – – – – – – –
Fire/Ambulance Stations – – – – – – – – – – –
Testing Stations – – – – – – – – – – –
Museums – – – – – – – – – – –
Galleries – – – – – – – – – – –
Theatres – – – – – – – – – – –
Libraries – – – – – – – – – – –
Cemeteries/Crematoria – – – – – – – – – – –
Police – – – – – – – – – – –
Parks – – – – – – – – – – –
Public Open Space – – – – – – – – – – –
Nature Reserves – – – – – – – – – – –
Public Ablution Facilities – – – – – – – – – – –
Markets – – – – – – – – – – –
Stalls – – – – – – – – – – –
Abattoirs – – – – – – – – – – –
Airports – – – – – – – – – – –
Taxi Ranks/Bus Terminals – – – – – – – – – – –
Capital Spares – – – – – – – – – – –
Sport and Recreation Facilities – – – – – – – – – – –
Indoor Facilities – – – – – – – – – – –
Outdoor Facilities – – – – – – – – – – –
Capital Spares – – – – – – – – – – –
Heritage assets – – – – – – – – – – –
Monuments – – – – – – – – – – –
Historic Buildings – – – – – – – – – – –
Works of Art – – – – – – – – – – –
Conservation Areas – – – – – – – – – – –
Other Heritage – – – – – – – – – – –
Investment properties – – – – – – – – – – –
Revenue Generating – – – – – – – – – – –
Improved Property – – – – – – – – – – –
Unimproved Property – – – – – – – – – – –
Non-revenue Generating – – – – – – – – – – –
Improved Property – – – – – – – – – – –
Unimproved Property – – – – – – – – – – –
Prepared by : SAMRASm
Date : 2020/08/20 11:54 AM
90

Budget Year +1
2021/22
Budget Year +2
2022/23
Original
BudgetPrior Adjusted Accum. Funds
Multi-year
capital
Unfore.
Unavoid.
Nat. or Prov.
GovtOther Adjusts. Total Adjusts.
Adjusted
Budget
Adjusted
Budget
Adjusted
Budget
7 8 9 10 11 12 13 14
R thousands A A1 B C D E F G H
Description Ref
Budget Year 2020/21
Other assets 600 600 – – – – 1 430 1 430 2 030 – –
Operational Buildings 600 600 – – – – 1 430 1 430 2 030 – –
Municipal Offices 600 600 – – – – 1 430 1 430 2 030 – –
Pay/Enquiry Points – – – – – – – – – – –
Building Plan Offices – – – – – – – – – – –
Workshops – – – – – – – – – – –
Yards – – – – – – – – – – –
Stores – – – – – – – – – – –
Laboratories – – – – – – – – – – –
Training Centres – – – – – – – – – – –
Manufacturing Plant – – – – – – – – – – –
Depots – – – – – – – – – – –
Capital Spares – – – – – – – – – – –
Housing – – – – – – – – – – –
Staff Housing – – – – – – – – – – –
Social Housing – – – – – – – – – – –
Capital Spares – – – – – – – – – – –
Biological or Cultivated Assets – – – – – – – – – – –
Biological or Cultivated Assets – – – – – – – – – – –
Intangible Assets – – – – – – – – – – –
Servitudes – – – – – – – – – – –
Licences and Rights – – – – – – – – – – –
Water Rights – – – – – – – – – – –
Effluent Licenses – – – – – – – – – – –
Solid Waste Licenses – – – – – – – – – – –
Computer Software and Applications – – – – – – – – – – –
Load Settlement Software Applications – – – – – – – – – – –
Unspecified – – – – – – – – – – –
Computer Equipment – – – – – – – – – – –
Computer Equipment – – – – – – – – – – –
Furniture and Office Equipment – – – – – – – – – – –
Furniture and Office Equipment – – – – – – – – – – –
Machinery and Equipment – – – – – – – – – – –
Machinery and Equipment – – – – – – – – – – –
Transport Assets – – – – – – – – – – –
Transport Assets – – – – – – – – – – –
Land – – – – – – – – – – –
Land – – – – – – – – – – –
Zoo's, Marine and Non-biological Animals – – – – – – – – – – –
Zoo's, Marine and Non-biological Animals – – – – – – – – – – –
Total Capital Expenditure on renewal of existing assets to be adjusted 1 4 900 4 900 – – – – 1 430 1 430 6 330 – 5 000
Prepared by : SAMRASm
Date : 2020/08/20 11:54 AM
91

WC022 Witzenberg - Supporting Table SB18c Adjustments Budget - expenditure on repairs and maintenance by asset class - 25 Augustus
Budget Year +1
2021/22
Budget Year +2
2022/23
Original
BudgetPrior Adjusted Accum. Funds
Multi-year
capital
Unfore.
Unavoid.
Nat. or Prov.
GovtOther Adjusts. Total Adjusts.
Adjusted
Budget
Adjusted
Budget
Adjusted
Budget
7 8 9 10 11 12 13 14
R thousands A A1 B C D E F G H
Repairs and maintenance expenditure by Asset Class/Sub-class
Infrastructure 14 259 14 559 – – – – – – 14 559 14 955 15 658
Roads Infrastructure 6 864 6 864 – – – – – – 6 864 7 182 7 542
Roads 5 994 5 994 – – – – – – 5 994 6 272 6 586
Road Structures – – – – – – – – – – –
Road Furniture 870 870 – – – – – – 870 911 956
Capital Spares – – – – – – – – – – –
Storm water Infrastructure 2 044 2 044 – – – – – – 2 044 2 130 2 224
Drainage Collection – – – – – – – – – – –
Storm water Conveyance 2 044 2 044 – – – – – – 2 044 2 130 2 224
Attenuation – – – – – – – – – – –
Electrical Infrastructure 1 931 2 231 – – – – – – 2 231 2 059 2 129
Power Plants – – – – – – – – – – –
HV Substations 80 80 – – – – – – 80 84 88
HV Switching Station – – – – – – – – – – –
HV Transmission Conductors – – – – – – – – – – –
MV Substations 754 754 – – – – – – 754 791 831
MV Switching Stations 53 53 – – – – – – 53 56 59
MV Networks 758 1 058 – – – – – – 1 058 829 838
LV Networks 285 285 – – – – – – 285 299 314
Capital Spares – – – – – – – – – – –
Water Supply Infrastructure 1 270 1 270 – – – – – – 1 270 1 329 1 395
Dams and Weirs 205 205 – – – – – – 205 214 225
Boreholes 147 147 – – – – – – 147 154 162
Reservoirs – – – – – – – – – – –
Pump Stations 49 49 – – – – – – 49 51 54
Water Treatment Works 98 98 – – – – – – 98 103 108
Bulk Mains 400 400 – – – – – – 400 419 440
Distribution 303 303 – – – – – – 303 317 333
Distribution Points 49 49 – – – – – – 49 51 54
PRV Stations 18 18 – – – – – – 18 19 20
Capital Spares – – – – – – – – – – –
Sanitation Infrastructure 2 151 2 151 – – – – – – 2 151 2 255 2 367
Pump Station – – – – – – – – – – –
Reticulation 648 648 – – – – – – 648 679 713
Waste Water Treatment Works 1 413 1 413 – – – – – – 1 413 1 480 1 554
Outfall Sewers – – – – – – – – – – –
Toilet Facilities 90 90 – – – – – – 90 95 100
Capital Spares – – – – – – – – – – –
Description Ref
Budget Year 2020/21
Prepared by : SAMRASm
Date : 2020/08/20 11:54 AM
92

Budget Year +1
2021/22
Budget Year +2
2022/23
Original
BudgetPrior Adjusted Accum. Funds
Multi-year
capital
Unfore.
Unavoid.
Nat. or Prov.
GovtOther Adjusts. Total Adjusts.
Adjusted
Budget
Adjusted
Budget
Adjusted
Budget
7 8 9 10 11 12 13 14
R thousands A A1 B C D E F G H
Description Ref
Budget Year 2020/21
Solid Waste Infrastructure – – – – – – – – – – –
Landfill Sites – – – – – – – – – – –
Waste Transfer Stations – – – – – – – – – – –
Waste Processing Facilities – – – – – – – – – – –
Waste Drop-off Points – – – – – – – – – – –
Waste Separation Facilities – – – – – – – – – – –
Electricity Generation Facilities – – – – – – – – – – –
Capital Spares – – – – – – – – – – –
Rail Infrastructure – – – – – – – – – – –
Rail Lines – – – – – – – – – – –
Rail Structures – – – – – – – – – – –
Rail Furniture – – – – – – – – – – –
Drainage Collection – – – – – – – – – – –
Storm water Conveyance – – – – – – – – – – –
Attenuation – – – – – – – – – – –
MV Substations – – – – – – – – – – –
LV Networks – – – – – – – – – – –
Capital Spares – – – – – – – – – – –
Coastal Infrastructure – – – – – – – – – – –
Sand Pumps – – – – – – – – – – –
Piers – – – – – – – – – – –
Revetments – – – – – – – – – – –
Promenades – – – – – – – – – – –
Capital Spares – – – – – – – – – – –
Information and Communication Infrastructure – – – – – – – – – – –
Data Centres – – – – – – – – – – –
Core Layers – – – – – – – – – – –
Distribution Layers – – – – – – – – – – –
Capital Spares – – – – – – – – – – –
Prepared by : SAMRASm
Date : 2020/08/20 11:54 AM
93

Budget Year +1
2021/22
Budget Year +2
2022/23
Original
BudgetPrior Adjusted Accum. Funds
Multi-year
capital
Unfore.
Unavoid.
Nat. or Prov.
GovtOther Adjusts. Total Adjusts.
Adjusted
Budget
Adjusted
Budget
Adjusted
Budget
7 8 9 10 11 12 13 14
R thousands A A1 B C D E F G H
Description Ref
Budget Year 2020/21
Community Assets 981 981 – – – – – – 981 1 026 1 077
Community Facilities 581 581 – – – – – – 581 607 637
Halls 149 149 – – – – – – 149 156 163
Centres – – – – – – – – – – –
Crèches 38 38 – – – – – – 38 38 40
Clinics/Care Centres – – – – – – – – – – –
Fire/Ambulance Stations – – – – – – – – – – –
Testing Stations – – – – – – – – – – –
Museums – – – – – – – – – – –
Galleries – – – – – – – – – – –
Theatres – – – – – – – – – – –
Libraries (3) (3) – – – – – – (3) (3) (3)
Cemeteries/Crematoria 125 125 – – – – – – 125 131 137
Police – – – – – – – – – – –
Parks – – – – – – – – – – –
Public Open Space – – – – – – – – – – –
Nature Reserves – – – – – – – – – – –
Public Ablution Facilities 205 205 – – – – – – 205 216 226
Markets 67 67 – – – – – – 67 70 74
Stalls – – – – – – – – – – –
Abattoirs – – – – – – – – – – –
Airports – – – – – – – – – – –
Taxi Ranks/Bus Terminals – – – – – – – – – – –
Capital Spares – – – – – – – – – – –
Sport and Recreation Facilities 400 400 – – – – – – 400 419 440
Indoor Facilities 295 295 – – – – – – 295 309 325
Outdoor Facilities 105 105 – – – – – – 105 110 115
Capital Spares – – – – – – – – – – –
Heritage assets – – – – – – – – – – –
Monuments – – – – – – – – – – –
Historic Buildings – – – – – – – – – – –
Works of Art – – – – – – – – – – –
Conservation Areas – – – – – – – – – – –
Other Heritage – – – – – – – – – – –
Investment properties – – – – – – – – – – –
Revenue Generating – – – – – – – – – – –
Improved Property – – – – – – – – – – –
Unimproved Property – – – – – – – – – – –
Non-revenue Generating – – – – – – – – – – –
Improved Property – – – – – – – – – – –
Unimproved Property – – – – – – – – – – –
Prepared by : SAMRASm
Date : 2020/08/20 11:54 AM
94

Budget Year +1
2021/22
Budget Year +2
2022/23
Original
BudgetPrior Adjusted Accum. Funds
Multi-year
capital
Unfore.
Unavoid.
Nat. or Prov.
GovtOther Adjusts. Total Adjusts.
Adjusted
Budget
Adjusted
Budget
Adjusted
Budget
7 8 9 10 11 12 13 14
R thousands A A1 B C D E F G H
Description Ref
Budget Year 2020/21
Other assets 495 495 – – – – – – 495 526 559
Operational Buildings 338 338 – – – – – – 338 361 386
Municipal Offices 338 338 – – – – – – 338 361 386
Pay/Enquiry Points – – – – – – – – – – –
Building Plan Offices – – – – – – – – – – –
Workshops – – – – – – – – – – –
Yards – – – – – – – – – – –
Stores – – – – – – – – – – –
Laboratories – – – – – – – – – – –
Training Centres – – – – – – – – – – –
Manufacturing Plant – – – – – – – – – – –
Depots – – – – – – – – – – –
Capital Spares – – – – – – – – – – –
Housing 157 157 – – – – – – 157 165 173
Staff Housing – – – – – – – – – – –
Social Housing 157 157 – – – – – – 157 165 173
Capital Spares – – – – – – – – – – –
Biological or Cultivated Assets – – – – – – – – – – –
Biological or Cultivated Assets – – – – – – – – – – –
Intangible Assets – – – – – – – – – – –
Servitudes – – – – – – – – – – –
Licences and Rights – – – – – – – – – – –
Water Rights – – – – – – – – – – –
Effluent Licenses – – – – – – – – – – –
Solid Waste Licenses – – – – – – – – – – –
Computer Software and Applications – – – – – – – – – – –
Load Settlement Software Applications – – – – – – – – – – –
Unspecified – – – – – – – – – – –
Computer Equipment 328 328 – – – – – – 328 345 362
Computer Equipment 328 328 – – – – – – 328 345 362
Furniture and Office Equipment 37 37 – – – – – – 37 39 41
Furniture and Office Equipment 37 37 – – – – – – 37 39 41
Machinery and Equipment 271 271 – – – – – – 271 283 297
Machinery and Equipment 271 271 – – – – – – 271 283 297
Transport Assets 1 912 1 912 – – – – – – 1 912 2 282 2 357
Transport Assets 1 912 1 912 – – – – – – 1 912 2 282 2 357
Land – – – – – – – – – – –
Land – – – – – – – – – – –
Zoo's, Marine and Non-biological Animals – – – – – – – – – – –
Zoo's, Marine and Non-biological Animals – – – – – – – – – – –
Total Repairs and Maintenance Expenditure to be adjusted 1 18 282 18 582 – – – – – – 18 582 19 454 20 350
Prepared by : SAMRASm
Date : 2020/08/20 11:54 AM
95

WC022 Witzenberg - Supporting Table SB18d Adjustments Budget - depreciation by asset class - 25 Augustus
Budget Year +1
2021/22
Budget Year +2
2022/23
Original
BudgetPrior Adjusted Accum. Funds
Multi-year
capital
Unfore.
Unavoid.
Nat. or Prov.
GovtOther Adjusts. Total Adjusts.
Adjusted
Budget
Adjusted
Budget
Adjusted
Budget
7 8 9 10 11 12 13 14
R thousands A A1 B C D E F G H
Depreciation by Asset Class/Sub-class
Infrastructure 24 358 24 358 – – – – – – 24 358 25 675 25 675
Roads Infrastructure 4 964 4 964 – – – – – – 4 964 5 231 5 231
Roads 534 534 – – – – – – 534 558 558
Road Structures 2 215 2 215 – – – – – – 2 215 2 337 2 337
Road Furniture 2 215 2 215 – – – – – – 2 215 2 337 2 337
Capital Spares – – – – – – – – – – –
Storm water Infrastructure 1 982 1 982 – – – – – – 1 982 2 091 2 091
Drainage Collection 480 480 – – – – – – 480 507 507
Storm water Conveyance 1 021 1 021 – – – – – – 1 021 1 077 1 077
Attenuation 480 480 – – – – – – 480 507 507
Electrical Infrastructure 3 708 3 708 – – – – – – 3 708 3 912 3 912
Power Plants – – – – – – – – – – –
HV Substations 450 450 – – – – – – 450 474 474
HV Switching Station 450 450 – – – – – – 450 474 474
HV Transmission Conductors 450 450 – – – – – – 450 474 474
MV Substations 450 450 – – – – – – 450 474 474
MV Switching Stations 450 450 – – – – – – 450 474 474
MV Networks 561 561 – – – – – – 561 591 591
LV Networks 450 450 – – – – – – 450 474 474
Capital Spares 450 450 – – – – – – 450 474 474
Water Supply Infrastructure 5 928 5 928 – – – – – – 5 928 6 249 6 249
Dams and Weirs 386 386 – – – – – – 386 407 407
Boreholes 386 386 – – – – – – 386 407 407
Reservoirs 386 386 – – – – – – 386 407 407
Pump Stations 386 386 – – – – – – 386 407 407
Water Treatment Works 386 386 – – – – – – 386 407 407
Bulk Mains 100 100 – – – – – – 100 100 100
Distribution 1 300 1 300 – – – – – – 1 300 1 371 1 371
Distribution Points 1 300 1 300 – – – – – – 1 300 1 371 1 371
PRV Stations 1 300 1 300 – – – – – – 1 300 1 371 1 371
Capital Spares – – – – – – – – – – –
Sanitation Infrastructure 6 122 6 122 – – – – – – 6 122 6 453 6 453
Pump Station 100 100 – – – – – – 100 100 100
Reticulation 1 349 1 349 – – – – – – 1 349 1 424 1 424
Waste Water Treatment Works 1 349 1 349 – – – – – – 1 349 1 424 1 424
Outfall Sewers 1 349 1 349 – – – – – – 1 349 1 424 1 424
Toilet Facilities 1 974 1 974 – – – – – – 1 974 2 082 2 082
Capital Spares – – – – – – – – – – –
Description Ref
Budget Year 2020/21
Prepared by : SAMRASm
Date : 2020/08/20 11:54 AM
96

Budget Year +1
2021/22
Budget Year +2
2022/23
Original
BudgetPrior Adjusted Accum. Funds
Multi-year
capital
Unfore.
Unavoid.
Nat. or Prov.
GovtOther Adjusts. Total Adjusts.
Adjusted
Budget
Adjusted
Budget
Adjusted
Budget
7 8 9 10 11 12 13 14
R thousands A A1 B C D E F G H
Description Ref
Budget Year 2020/21
Solid Waste Infrastructure 1 654 1 654 – – – – – – 1 654 1 740 1 740
Landfill Sites 100 100 – – – – – – 100 100 100
Waste Transfer Stations 311 311 – – – – – – 311 328 328
Waste Processing Facilities 311 311 – – – – – – 311 328 328
Waste Drop-off Points 311 311 – – – – – – 311 328 328
Waste Separation Facilities 311 311 – – – – – – 311 328 328
Electricity Generation Facilities 311 311 – – – – – – 311 328 328
Capital Spares – – – – – – – – – – –
Rail Infrastructure – – – – – – – – – – –
Rail Lines – – – – – – – – – – –
Rail Structures – – – – – – – – – – –
Rail Furniture – – – – – – – – – – –
Drainage Collection – – – – – – – – – – –
Storm water Conveyance – – – – – – – – – – –
Attenuation – – – – – – – – – – –
MV Substations – – – – – – – – – – –
LV Networks – – – – – – – – – – –
Capital Spares – – – – – – – – – – –
Coastal Infrastructure – – – – – – – – – – –
Sand Pumps – – – – – – – – – – –
Piers – – – – – – – – – – –
Revetments – – – – – – – – – – –
Promenades – – – – – – – – – – –
Capital Spares – – – – – – – – – – –
Information and Communication Infrastructure – – – – – – – – – – –
Data Centres – – – – – – – – – – –
Core Layers – – – – – – – – – – –
Distribution Layers – – – – – – – – – – –
Capital Spares – – – – – – – – – – –
Prepared by : SAMRASm
Date : 2020/08/20 11:54 AM
97

Budget Year +1
2021/22
Budget Year +2
2022/23
Original
BudgetPrior Adjusted Accum. Funds
Multi-year
capital
Unfore.
Unavoid.
Nat. or Prov.
GovtOther Adjusts. Total Adjusts.
Adjusted
Budget
Adjusted
Budget
Adjusted
Budget
7 8 9 10 11 12 13 14
R thousands A A1 B C D E F G H
Description Ref
Budget Year 2020/21
Community Assets 3 856 3 856 – – – – – – 3 856 4 068 4 068
Community Facilities 1 971 1 971 – – – – – – 1 971 2 079 2 079
Halls 1 348 1 348 – – – – – – 1 348 1 422 1 422
Centres – – – – – – – – – – –
Crèches – – – – – – – – – – –
Clinics/Care Centres – – – – – – – – – – –
Fire/Ambulance Stations – – – – – – – – – – –
Testing Stations – – – – – – – – – – –
Museums – – – – – – – – – – –
Galleries – – – – – – – – – – –
Theatres – – – – – – – – – – –
Libraries 365 365 – – – – – – 365 385 385
Cemeteries/Crematoria 12 12 – – – – – – 12 13 13
Police – – – – – – – – – – –
Parks – – – – – – – – – – –
Public Open Space 246 246 – – – – – – 246 260 260
Nature Reserves – – – – – – – – – – –
Public Ablution Facilities – – – – – – – – – – –
Markets – – – – – – – – – – –
Stalls – – – – – – – – – – –
Abattoirs – – – – – – – – – – –
Airports – – – – – – – – – – –
Taxi Ranks/Bus Terminals – – – – – – – – – – –
Capital Spares – – – – – – – – – – –
Sport and Recreation Facilities 1 885 1 885 – – – – – – 1 885 1 989 1 989
Indoor Facilities – – – – – – – – – – –
Outdoor Facilities 1 885 1 885 – – – – – – 1 885 1 989 1 989
Capital Spares – – – – – – – – – – –
Heritage assets – – – – – – – – – – –
Monuments – – – – – – – – – – –
Historic Buildings – – – – – – – – – – –
Works of Art – – – – – – – – – – –
Conservation Areas – – – – – – – – – – –
Other Heritage – – – – – – – – – – –
Investment properties 703 703 – – – – – – 703 742 742
Revenue Generating 352 352 – – – – – – 352 371 371
Improved Property 176 176 – – – – – – 176 185 185
Unimproved Property 176 176 – – – – – – 176 185 185
Non-revenue Generating 352 352 – – – – – – 352 371 371
Improved Property 176 176 – – – – – – 176 185 185
Unimproved Property 176 176 – – – – – – 176 185 185
Prepared by : SAMRASm
Date : 2020/08/20 11:54 AM
98

Budget Year +1
2021/22
Budget Year +2
2022/23
Original
BudgetPrior Adjusted Accum. Funds
Multi-year
capital
Unfore.
Unavoid.
Nat. or Prov.
GovtOther Adjusts. Total Adjusts.
Adjusted
Budget
Adjusted
Budget
Adjusted
Budget
7 8 9 10 11 12 13 14
R thousands A A1 B C D E F G H
Description Ref
Budget Year 2020/21
Other assets – – – – – – – – – – –
Operational Buildings – – – – – – – – – – –
Municipal Offices – – – – – – – – – – –
Pay/Enquiry Points – – – – – – – – – – –
Building Plan Offices – – – – – – – – – – –
Workshops – – – – – – – – – – –
Yards – – – – – – – – – – –
Stores – – – – – – – – – – –
Laboratories – – – – – – – – – – –
Training Centres – – – – – – – – – – –
Manufacturing Plant – – – – – – – – – – –
Depots – – – – – – – – – – –
Capital Spares – – – – – – – – – – –
Housing – – – – – – – – – – –
Staff Housing – – – – – – – – – – –
Social Housing – – – – – – – – – – –
Capital Spares – – – – – – – – – – –
Biological or Cultivated Assets – – – – – – – – – – –
Biological or Cultivated Assets – – – – – – – – – – –
Intangible Assets 377 377 – – – – – – 377 398 398
Servitudes – – – – – – – – – – –
Licences and Rights 377 377 – – – – – – 377 398 398
Water Rights 16 16 – – – – – – 16 17 17
Effluent Licenses – – – – – – – – – – –
Solid Waste Licenses – – – – – – – – – – –
Computer Software and Applications 361 361 – – – – – – 361 381 381
Load Settlement Software Applications – – – – – – – – – – –
Unspecified – – – – – – – – – – –
Computer Equipment 2 436 2 436 – – – – – – 2 436 2 581 2 581
Computer Equipment 2 436 2 436 – – – – – – 2 436 2 581 2 581
Furniture and Office Equipment 588 588 – – – – – – 588 630 630
Furniture and Office Equipment 588 588 – – – – – – 588 630 630
Machinery and Equipment 1 427 1 427 – – – – – – 1 427 1 505 1 505
Machinery and Equipment 1 427 1 427 – – – – – – 1 427 1 505 1 505
Transport Assets 6 943 6 943 – – – – – – 6 943 7 320 7 320
Transport Assets 6 943 6 943 – – – – – – 6 943 7 320 7 320
Land – – – – – – – – – – –
Land – – – – – – – – – – –
Zoo's, Marine and Non-biological Animals – – – – – – – – – – –
Zoo's, Marine and Non-biological Animals – – – – – – – – – – –
Total Depreciation to be adjusted 1 40 688 40 688 – – – – – – 40 688 42 918 42 918
Prepared by : SAMRASm
Date : 2020/08/20 11:54 AM
99

WC022 Witzenberg - Adjustments Budget - capital expenditure on upgrading of existing assets by asset class - 25 Augustus
Budget Year +1
2021/22
Budget Year +2
2022/23
Original
BudgetPrior Adjusted Accum. Funds
Multi-year
capital
Unfore.
Unavoid.
Nat. or Prov.
GovtOther Adjusts. Total Adjusts.
Adjusted
Budget
Adjusted
Budget
Adjusted
Budget
7 8 9 10 11 12 13 14
R thousands A A1 B C D E F G H
Capital expenditure on upgrading of existing assets by Asset Class/Sub-class
Infrastructure 8 368 6 220 – – – – 4 924 4 924 11 144 87 330 6 593
Roads Infrastructure 5 028 4 130 – – – – 4 924 4 924 9 054 52 870 2 593
Roads – – – – – – – – – 11 320 –
Road Structures 5 028 4 130 – – – – 4 924 4 924 9 054 41 550 2 593
Road Furniture – – – – – – – – – – –
Capital Spares – – – – – – – – – – –
Storm water Infrastructure – – – – – – – – – 11 320 –
Drainage Collection – – – – – – – – – – –
Storm water Conveyance – – – – – – – – – 11 320 –
Attenuation – – – – – – – – – – –
Electrical Infrastructure 2 500 1 250 – – – – – – 1 250 500 4 000
Power Plants – – – – – – – – – – –
HV Substations – – – – – – – – – – –
HV Switching Station – – – – – – – – – – –
HV Transmission Conductors – – – – – – – – – – –
MV Substations 1 000 500 – – – – – – 500 500 1 000
MV Switching Stations – – – – – – – – – – –
MV Networks 1 000 500 – – – – – – 500 – 2 000
LV Networks 500 250 – – – – – – 250 – 1 000
Capital Spares – – – – – – – – – – –
Water Supply Infrastructure – – – – – – – – – 11 320 –
Dams and Weirs – – – – – – – – – – –
Boreholes – – – – – – – – – – –
Reservoirs – – – – – – – – – – –
Pump Stations – – – – – – – – – – –
Water Treatment Works – – – – – – – – – – –
Bulk Mains – – – – – – – – – – –
Distribution – – – – – – – – – 11 320 –
Distribution Points – – – – – – – – – – –
PRV Stations – – – – – – – – – – –
Capital Spares – – – – – – – – – – –
Sanitation Infrastructure 840 840 – – – – – – 840 11 320 –
Pump Station – – – – – – – – – – –
Reticulation – – – – – – – – – 11 320 –
Waste Water Treatment Works 840 840 – – – – – – 840 – –
Outfall Sewers – – – – – – – – – – –
Toilet Facilities – – – – – – – – – – –
Capital Spares – – – – – – – – – – –
Description Ref
Budget Year 2020/21
Prepared by : SAMRASm
Date : 2020/08/20 11:54 AM
100

Budget Year +1
2021/22
Budget Year +2
2022/23
Original
BudgetPrior Adjusted Accum. Funds
Multi-year
capital
Unfore.
Unavoid.
Nat. or Prov.
GovtOther Adjusts. Total Adjusts.
Adjusted
Budget
Adjusted
Budget
Adjusted
Budget
7 8 9 10 11 12 13 14
R thousands A A1 B C D E F G H
Description Ref
Budget Year 2020/21
Solid Waste Infrastructure – – – – – – – – – – –
Landfill Sites – – – – – – – – – – –
Waste Transfer Stations – – – – – – – – – – –
Waste Processing Facilities – – – – – – – – – – –
Waste Drop-off Points – – – – – – – – – – –
Waste Separation Facilities – – – – – – – – – – –
Electricity Generation Facilities – – – – – – – – – – –
Capital Spares – – – – – – – – – – –
Rail Infrastructure – – – – – – – – – – –
Rail Lines – – – – – – – – – – –
Rail Structures – – – – – – – – – – –
Rail Furniture – – – – – – – – – – –
Drainage Collection – – – – – – – – – – –
Storm water Conveyance – – – – – – – – – – –
Attenuation – – – – – – – – – – –
MV Substations – – – – – – – – – – –
LV Networks – – – – – – – – – – –
Capital Spares – – – – – – – – – – –
Coastal Infrastructure – – – – – – – – – – –
Sand Pumps – – – – – – – – – – –
Piers – – – – – – – – – – –
Revetments – – – – – – – – – – –
Promenades – – – – – – – – – – –
Capital Spares – – – – – – – – – – –
Information and Communication Infrastructure – – – – – – – – – – –
Data Centres – – – – – – – – – – –
Core Layers – – – – – – – – – – –
Distribution Layers – – – – – – – – – – –
Capital Spares – – – – – – – – – – –
Prepared by : SAMRASm
Date : 2020/08/20 11:54 AM
101

Budget Year +1
2021/22
Budget Year +2
2022/23
Original
BudgetPrior Adjusted Accum. Funds
Multi-year
capital
Unfore.
Unavoid.
Nat. or Prov.
GovtOther Adjusts. Total Adjusts.
Adjusted
Budget
Adjusted
Budget
Adjusted
Budget
7 8 9 10 11 12 13 14
R thousands A A1 B C D E F G H
Description Ref
Budget Year 2020/21
Community Assets 870 870 – – – – – – 870 – –
Community Facilities – – – – – – – – – – –
Halls – – – – – – – – – – –
Centres – – – – – – – – – – –
Crèches – – – – – – – – – – –
Clinics/Care Centres – – – – – – – – – – –
Fire/Ambulance Stations – – – – – – – – – – –
Testing Stations – – – – – – – – – – –
Museums – – – – – – – – – – –
Galleries – – – – – – – – – – –
Theatres – – – – – – – – – – –
Libraries – – – – – – – – – – –
Cemeteries/Crematoria – – – – – – – – – – –
Police – – – – – – – – – – –
Parks – – – – – – – – – – –
Public Open Space – – – – – – – – – – –
Nature Reserves – – – – – – – – – – –
Public Ablution Facilities – – – – – – – – – – –
Markets – – – – – – – – – – –
Stalls – – – – – – – – – – –
Abattoirs – – – – – – – – – – –
Airports – – – – – – – – – – –
Taxi Ranks/Bus Terminals – – – – – – – – – – –
Capital Spares – – – – – – – – – – –
Sport and Recreation Facilities 870 870 – – – – – – 870 – –
Indoor Facilities – – – – – – – – – – –
Outdoor Facilities 870 870 – – – – – – 870 – –
Capital Spares – – – – – – – – – – –
Heritage assets – – – – – – – – – – –
Monuments – – – – – – – – – – –
Historic Buildings – – – – – – – – – – –
Works of Art – – – – – – – – – – –
Conservation Areas – – – – – – – – – – –
Other Heritage – – – – – – – – – – –
Investment properties – – – – – – – – – – –
Revenue Generating – – – – – – – – – – –
Improved Property – – – – – – – – – – –
Unimproved Property – – – – – – – – – – –
Non-revenue Generating – – – – – – – – – – –
Improved Property – – – – – – – – – – –
Unimproved Property – – – – – – – – – – –
Prepared by : SAMRASm
Date : 2020/08/20 11:54 AM
102

Budget Year +1
2021/22
Budget Year +2
2022/23
Original
BudgetPrior Adjusted Accum. Funds
Multi-year
capital
Unfore.
Unavoid.
Nat. or Prov.
GovtOther Adjusts. Total Adjusts.
Adjusted
Budget
Adjusted
Budget
Adjusted
Budget
7 8 9 10 11 12 13 14
R thousands A A1 B C D E F G H
Description Ref
Budget Year 2020/21
Other assets – – – – – – – – – – –
Operational Buildings – – – – – – – – – – –
Municipal Offices – – – – – – – – – – –
Pay/Enquiry Points – – – – – – – – – – –
Building Plan Offices – – – – – – – – – – –
Workshops – – – – – – – – – – –
Yards – – – – – – – – – – –
Stores – – – – – – – – – – –
Laboratories – – – – – – – – – – –
Training Centres – – – – – – – – – – –
Manufacturing Plant – – – – – – – – – – –
Depots – – – – – – – – – – –
Capital Spares – – – – – – – – – – –
Housing – – – – – – – – – – –
Staff Housing – – – – – – – – – – –
Social Housing – – – – – – – – – – –
Capital Spares – – – – – – – – – – –
Biological or Cultivated Assets – – – – – – – – – – –
Biological or Cultivated Assets – – – – – – – – – – –
Intangible Assets – – – – – – – – – – –
Servitudes – – – – – – – – – – –
Licences and Rights – – – – – – – – – – –
Water Rights – – – – – – – – – – –
Effluent Licenses – – – – – – – – – – –
Solid Waste Licenses – – – – – – – – – – –
Computer Software and Applications – – – – – – – – – – –
Load Settlement Software Applications – – – – – – – – – – –
Unspecified – – – – – – – – – – –
Computer Equipment – – – – – – – – – – –
Computer Equipment – – – – – – – – – – –
Furniture and Office Equipment – – – – – – – – – – –
Furniture and Office Equipment – – – – – – – – – – –
Machinery and Equipment – – – – – – – – – – –
Machinery and Equipment – – – – – – – – – – –
Transport Assets – – – – – – – – – – –
Transport Assets – – – – – – – – – – –
Land – – – – – – – – – – –
Land – – – – – – – – – – –
Zoo's, Marine and Non-biological Animals – – – – – – – – – – –
Zoo's, Marine and Non-biological Animals – – – – – – – – – – –
Total Capital Expenditure on upgrading of existing assets to be adjusted 1 9 237 7 090 – – – – 4 924 4 924 12 013 87 330 6 593
Prepared by : SAMRASm
Date : 2020/08/20 11:54 AM
103

WC022 Witzenberg - Supporting Table SB19 List of capital programmes and projects affected by Adjustments Budget - 25 Augustus
IDP
Goal
Code
Individually Approved
Yes/NoAsset Class
R thousand 3 6 4Original
Budget
Adjusted
Budget
Original
Budget
Adjusted
Budget
Original
Budget
Adjusted
Budget
Parent municipality:
List all capital programs/projects grouped by Municipal Vote
Community Halls And Facilities Capex 3X3 M CONTAINER 20 170 609 046 632 Yes Community – 410 – – – –
Fire Protection Sevices Capex Firefighting Response Vehicle 20 190 703 063 966 Yes Other Assets – 722 – – – –
Fire Protection Sevices Capex Fire Fighting Equipment 20 180 707 023 996 Yes Other Assets – 64 – – – –
L E D Capex Skoonvlei Economic Hub 20 170 609 046 482 Yes Community – 32 – – – –
L E D Capex Skoonvlei Economic Hub 20 200 304 065 118 Yes Community – 1 445 – – – –
Electricity: Administration Capex Electrical Network Housing Project 20 200 304 065 112 Yes Infrastructure - Electricity – 435 – – – –
Council Cost Capex Fencing 20 200 304 065 115 Yes Other Assets – 850 – – – –
Solid Waste (Removal) Capex Transfer stations and related infrastructure 20 190 902 984 113 Yes Infrastructure - Other – 501 – – – –
Solid Waste (Dumping Site) Capex New Material Recovery Facility/Drop Off 20 180 707 023 993 Yes Infrastructure - Other – 656 – – – –
Mechanical Workshop Capex Tools & Equipment 20 190 703 063 996 Yes Other Assets – 20 – – – –
Roads Capex Upgrade pavement Vosstr from Retief to edge 20 180 707 024 014 Yes Infrastructure - Road transport – 946 – – – –
Roads Capex Pavement Upgrading 20 190 703 064 020 Yes Infrastructure - Road transport – 500 – – – –
Administration CAPEX: Upgrade Council chambers 20 170 609 046 569 Yes Other Assets – 1 430 – – – –
Treasury: Administration CAPEX Quad Bike û Covid-19 Response 20 200 604 061 019 Yes Other Assets – 70 – – – –
Treasury: Administration CAPEX: It Equipment 20 200 624 051 133 Yes Other Assets – 0 – – – –
Treasury: Administration CAPEX Sanitizing Equipment û Covid-19 Response 20 200 604 061 022 Yes Other Assets – 32 – – – –
Roads Capex Pedestrian Route along R46/Nduli 20 190 703 064 008 Yes Infrastructure - Road transport – 870 – – – –
Roads Capex Upgrade pavement Vosstr from Retief to edge 20 190 703 064 011 Yes Infrastructure - Road transport – 2 608 – – – –
Medium Term Revenue and Expenditure Framework
Budget Year 2020/21 Budget Year +1 2021/22 Budget Year +2 2022/23
Municipal Vote/Capital project
Program/Project description Project number
Prepared by : SAMRASm
Date : 2020/08/20 11:54 AM
104

Budget Year
+1 2021/22
Budget Year
+2 2022/23
Original
Budget
Prior
Adjusted
Accum.
Funds
Multi-year
capital
Unfore.
Unavoid.
Nat. or Prov.
Govt
Other
Adjusts.Total Adjusts.
Adjusted
Budget
Adjusted
Budget
Adjusted
Budget
3 4 5 6 8 9 10 11
R thousands A A1 B C D E F G H
Revenue By Municipal Entity
Entity 1 total revenue – –
Entity 2 total revenue – –
Entity 3 (etc) total revenue – –
– –
– –
– –
– –
– –
– –
– –
Total Operating Revenue 1 – – – – – – – – – – –
Expenditure By Municipal Entity
Entity 1 total operating expenditure – –
Entity 2 total operating expenditure – –
Entity 3 etc. total operating expenditure – –
– –
– –
– –
– –
– –
– –
– –
Total Operating Expenditure 2 – – – – – – – – – – –
Capital Expenditure By Municipal Entity
Entity 1 total capital expenditure – –
Entity 2 total capital expenditure – –
Entity 3 etc. total capital expenditure – –
– –
– –
– –
– –
– –
– –
– –
Total Capital Expenditure 2 – – – – – – – – – – –
WC022 Witzenberg - Supporting Table SB20 Not required - 25 Augustus
Description Ref
Budget Year 2020/21
Prepared by : SAMRASm
Date : 2020/08/20 11:54 AM
105