medium truck duty cycle data from real-world driving...
TRANSCRIPT

ORNL/TM-2010/255
Medium Truck Duty Cycle Data from Real-World Driving Environments: Project Interim Report
5 January 2011
Prepared by Oscar Franzese, Mary Beth Lascurain, Gary Capps R&D Staff

DOCUMENT AVAILABILITY
Reports produced after January 1, 1996, are generally available free via the U.S. Department of Energy (DOE) Information Bridge. Web site http://www.osti.gov/bridge Reports produced before January 1, 1996, may be purchased by members of the public from the following source. National Technical Information Service 5285 Port Royal Road Springfield, VA 22161 Telephone 703-605-6000 (1-800-553-6847) TDD 703-487-4639 Fax 703-605-6900 E-mail [email protected] Web site http://www.ntis.gov/support/ordernowabout.htm Reports are available to DOE employees, DOE contractors, Energy Technology Data Exchange (ETDE) representatives, and International Nuclear Information System (INIS) representatives from the following source. Office of Scientific and Technical Information P.O. Box 62 Oak Ridge, TN 37831 Telephone 865-576-8401 Fax 865-576-5728 E-mail [email protected] Web site http://www.osti.gov/contact.html
This report was prepared as an account of work sponsored by an agency of the United States Government. Neither the United States Government nor any agency thereof, nor any of their employees, makes any warranty, express or implied, or assumes any legal liability or responsibility for the accuracy, completeness, or usefulness of any information, apparatus, product, or process disclosed, or represents that its use would not infringe privately owned rights. Reference herein to any specific commercial product, process, or service by trade name, trademark, manufacturer, or otherwise, does not necessarily constitute or imply its endorsement, recommendation, or favoring by the United States Government or any agency thereof. The views and opinions of authors expressed herein do not necessarily state or reflect those of the United States Government or any agency thereof.

ORNL/TM-2010/255
Vehicle Systems Program
MEDIUM TRUCK DUTY CYCLE DATA FROM REAL-WORLD DRIVING
ENVIRONMENTS: PROJECT INTERIM REPORT
Oscar Franzese
Mary Beth Lascurain
Gary Capps
Date Published: January 2011
Prepared by
OAK RIDGE NATIONAL LABORATORY
Oak Ridge, Tennessee 37831-6283
managed by
UT-BATTELLE, LLC
for the
U.S. DEPARTMENT OF ENERGY
under contract DE-AC05-00OR22725


v
CONTENTS
Page
LIST OF FIGURES ............................................................................................................................. vii LIST OF TABLES ................................................................................................................................. ix ACRONYMS AND ABBREVIATIONS ............................................................................................... x ACKNOWLEDGEMENTS ................................................................................................................... xi EXECUTIVE SUMMARY ................................................................................................................. xii 1. PROJECT OVERVIEW ................................................................................................................... 1
1.1 PRIOR DUTY CYCLE EFFORTS ........................................................................................ 1 1.2 OVERALL PROJECT DESCRIPTION ................................................................................. 3 1.3 PARTNERSHIPS ................................................................................................................... 3
1.3.1 H.T. Hackney ............................................................................................................. 3 1.3.2 K-Trans Management ................................................................................................ 4 1.3.3 Federal Motor Carrier Safety Administration ............................................................ 4
2. PART 1 FIELD OPERATIONAL TEST ......................................................................................... 5 2.1 VOCATIONAL ASSESSMENT............................................................................................ 5
2.1.1 Initial Down-Selection ............................................................................................... 5 2.1.2 Recommended Vocations .......................................................................................... 6 2.1.3 Selected Vocations .................................................................................................... 7
2.2 DATA ACQUISITION SYSTEM AND SENSORS .............................................................. 7 2.3 TEST VEHICLES ................................................................................................................ 10 2.3 COLLECTED SIGNALS ..................................................................................................... 12 2.4 INSTALLATION AND SHAKEDOWN TESTING ........................................................... 15
2.4.1 Physical Installation ................................................................................................. 15 2.4.2 Sensor/DAS Verification ......................................................................................... 16
2.5 CONDUCT OF THE FOT.................................................................................................... 16 2.5.1 Launch of the FOT and MOA Signing .................................................................... 16 2.5.2 Data Retrieval Software ........................................................................................... 17
2.6 DE-INSTRUMENTATION ................................................................................................. 17 3. ANALYSIS OF The PART 1 FOT DATA .................................................................................... 18
3.1 DATA AND ORGANIZATION .......................................................................................... 19 3.1.1 Spatial Information .................................................................................................... 20 3.1.2 Vehicle Weight Information ...................................................................................... 21 3.1.3 Additional Information .............................................................................................. 21 3.1.4 Information Indexing ................................................................................................. 21
3.2 ADDITIONAL DEVELOPED MODELS AND DATA CALIBRATION .......................... 24 3.2.1 Vehicle Weight Model ................................................................................................. 24 3.2.2 Calibration of Data Bus Fuel Readings ................................................................... 28
3.3 GENERAL STATISTICS .................................................................................................... 29 3.3.1 General Statistics ....................................................................................................... 30 3.3.2 Class-7 Vehicle Fuel Efficiency ............................................................................... 35
3.5 WEIGHT ESTIMATION ..................................................................................................... 36 3.5.1 Weight Estimation Model ........................................................................................ 36 3.5.2 Effect of Vehicle Weight on Fuel Efficiency .......................................................... 40
3.6 CLASSIFICATION OF DUTY CYCLES ........................................................................... 43 3.6.1 Transit Bus Highway Duty Cycles .......................................................................... 43 3.6.2 Transit Bus Surface-Street Duty Cycles .................................................................. 48
3.7 SAFETY SENSOR DATA ................................................................................................... 51

vi
3.7.1 Findings from Safety Sensors .................................................................................. 51 3.7.2 Implications for Research ........................................................................................ 57
4. LESSONS LEARNED ................................................................................................................... 59 4.1 IMPROVEMENTS FROM HTDC ....................................................................................... 59
4.1.1 Modifications to Data Acquisition System .............................................................. 59 4.1.2 Coordination with Fleet Partners ............................................................................. 59
4.2 PLANNING FOR PART 2 OF THE MTDC EFFORT ........................................................ 60 4.3 ADDITIONAL LESSONS LEARNED ............................................................................... 60
5. SUMMARY OF RESULTS/CONCLUSIONS .............................................................................. 62 6. REMAINING MTDC TASKS ....................................................................................................... 65
6.1 DATA ACQUISITION SYSTEM MODIFICATIONS ....................................................... 65 6.2 PART 2 MTDC FOT AND DATA ANALYSIS ................................................................. 65 6.3 DUTY CYCLE GENERATION TOOL ............................................................................... 65 6.4 FINAL REPORT .................................................................................................................. 65

vii
LIST OF FIGURES
Page
Figure 1. MTDC DAS ............................................................................................................................ 7 Figure 2. VBOX II Lite GPS Unit ......................................................................................................... 8 Figure 3. Air-Weigh LoadMaxx Kit ...................................................................................................... 8 Figure 4. EDAQ-lite Data Acquisition Unit .......................................................................................... 9 Figure 5. Raven X EVDO Cellular Modem ........................................................................................... 9 Figure 6. MGM E-Stroke Control Unit .................................................................................................. 9 Figure 7. Tire SafeGuard Display and Transducers ............................................................................. 10 Figure 8. H.T. Hackney 2007 International 8600 ................................................................................ 11 Figure 9. KAT Transit Bus .................................................................................................................. 12 Figure 10. MOA Signing Ceremony (July 7, 2009) ............................................................................ 16 Figure 11. Routes of Participating H.T. Hackney Trucks (East Tennessee Area) ............................... 18 Figure 12. Routes of Participating KAT Buses (Knoxville, Tennessee Area) ..................................... 18 Figure 13. Vehicle Class and Vocation Selection Menu...................................................................... 22 Figure 14. Criteria Selection – Class-7 Combination Trucks .............................................................. 23 Figure 15. Criteria Selection – Class-7 Transit Buses ......................................................................... 23 Figure 16. Tractor Weight vs. Acceleration – Loaded Truck .............................................................. 25 Figure 17. Tractor Weight vs. Acceleration – Empty Truck ................................................................ 25 Figure 18. Linear Model for Tractor Weight vs. Acceleration - Loaded Truck .................................. 26 Figure 19. Linear Model for Tractor Weight vs. Acceleration – Empty Truck ................................... 26 Figure 20. Gallons of Fuel Used – Manual Log Values vs. EOBR-reported Values ........................... 29 Figure 21. Gallons of Fuel Used – EOBR-Reported Values vs. DAS-recorded Values ...................... 29 Figure 22. Combination Truck 1 (Vehicle 1) Coverage Area .............................................................. 30 Figure 23. Combination Truck 2 (Vehicle 2) Coverage Area .............................................................. 31 Figure 24. Combination Truck 3 (Vehicle 3) Coverage Area .............................................................. 31 Figure 25. Transit Bus 1 (Vehicle 4) Coverage Area........................................................................... 32 Figure 26. Transit Bus 2 (Vehicle 5) Coverage Area........................................................................... 32 Figure 27. Transit Bus 3 (Vehicle 6) Coverage Area........................................................................... 33 Figure 28. Combination Truck 1 (Vehicle 1) Frequency Distributions of Measured Steer/Drive
Axle Weights and Modeled Gross Vehicle Weight ................................................................. 36 Figure 29. Combination Truck 2 (Vehicle 2) Frequency Distributions of Measured Steer/Drive
Axle Weights and Modeled Gross Vehicle Weight ................................................................. 37 Figure 30. Combination Truck 3 (Vehicle 3) Frequency Distributions of Measured Steer/Drive
Axle Weights and Modeled Gross Vehicle Weight ................................................................. 37 Figure 31. Transit Bus 1 (Vehicle 4) Frequency Distribution of Gross Vehicle Weight ..................... 38 Figure 32. Transit Bus 2 (Vehicle 5) Frequency Distribution of Gross Vehicle Weight ..................... 39 Figure 33. Transit Bus 3 (Vehicle 6) Frequency Distribution of Gross Vehicle Weight ..................... 39 Figure 34. Fuel Efficiency Frequency Distributions as a Function of Load Level – Combination
Trucks ...................................................................................................................................... 42 Figure 35. Fuel Efficiency Frequency Distributions as a Function of Load Level – Transit Buses .... 43 Figure 36. Transit Bus Highway Duty Cycle Route ............................................................................ 44 Figure 37. Transit Bus Highway Duty Cycle (DC) Time-of-Day Frequency Distribution ................. 44 Figure 38. Transit Bus Highway Duty Cycle (DC) Duration Frequency Distribution ........................ 45 Figure 39. Transit Bus Highway Duty Cycle (DC) Minimum Speed Frequency Distribution ............ 46 Figure 40. Top Five Maximum Average Speed Transit Bus Highway Duty Cycles ........................... 47 Figure 41. Bottom Five Maximum Average Speed Transit Bus Highway Duty Cycles ..................... 47 Figure 42. Transit Bus Surface Street Duty Cycle Route .................................................................... 48 Figure 43. Transit Bus Surface Street Duty Cycle (DC) Duration Frequency Distribution ................ 49

viii
Figure 44. Top Five Maximum Average Speed Transit Bus Surface Street Duty Cycles ................... 50 Figure 45. Bottom Five Maximum Average Speed Transit Bus Surface Street Duty Cycles ............. 50 Figure 46. Distribution of Brake Stroke Status Codes ......................................................................... 51 Figure 47. Proportion of Braking Events in MTDC Combination Vehicle Duty Cycles .................... 52 Figure 48. Distribution of Brake Application Pressure for MTDC Combination Vehicles ................. 52 Figure 50. Sample Time History of Speed and Brake Application Pressure ....................................... 53 Figure 51. Tire Pressure Distribution ................................................................................................... 54 Figure 52. Distribution of Tire Pressure Threshold Detection Codes .................................................. 55 Figure 53. Tire Temperature Distribution ............................................................................................ 55 Figure 54. Distribution of Steer Axle Weights .................................................................................... 56 Figure 55. Distribution of Drive Axle Weights ................................................................................... 57 Figure 56. Selected Braking Event ...................................................................................................... 58
ix
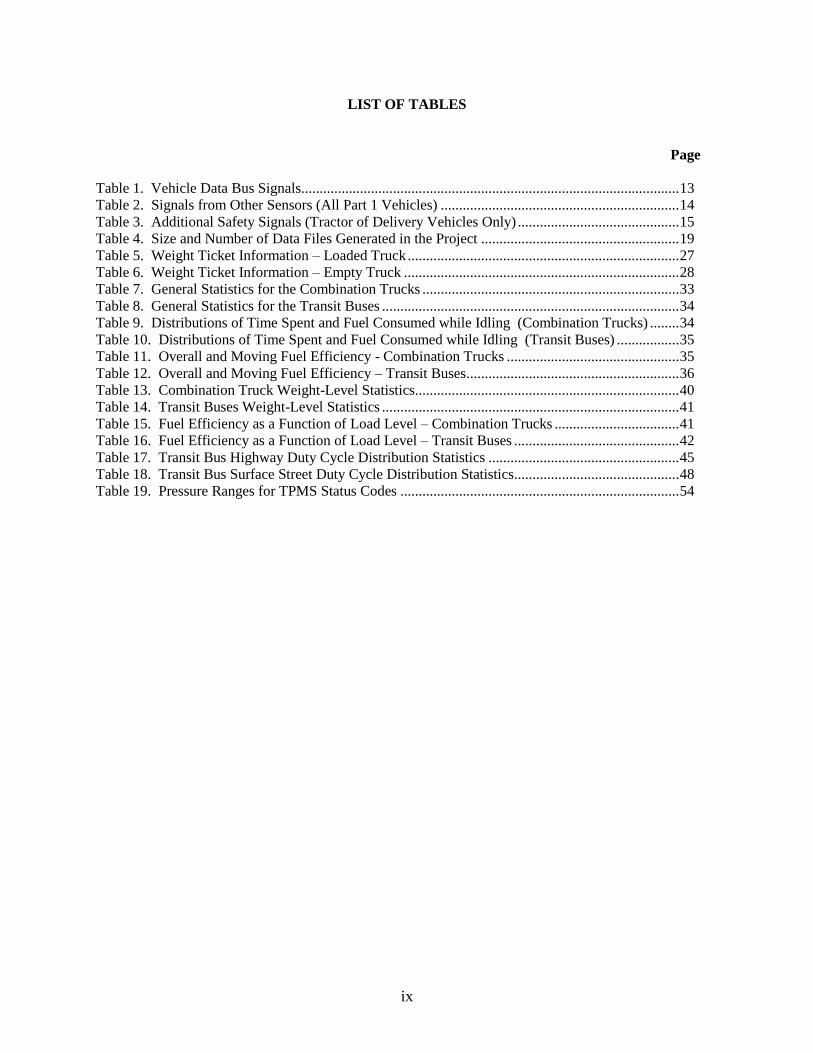
LIST OF TABLES
Page
Table 1. Vehicle Data Bus Signals....................................................................................................... 13 Table 2. Signals from Other Sensors (All Part 1 Vehicles) ................................................................. 14 Table 3. Additional Safety Signals (Tractor of Delivery Vehicles Only) ............................................ 15 Table 4. Size and Number of Data Files Generated in the Project ...................................................... 19 Table 5. Weight Ticket Information – Loaded Truck .......................................................................... 27 Table 6. Weight Ticket Information – Empty Truck ........................................................................... 28 Table 7. General Statistics for the Combination Trucks ...................................................................... 33 Table 8. General Statistics for the Transit Buses ................................................................................. 34 Table 9. Distributions of Time Spent and Fuel Consumed while Idling (Combination Trucks) ........ 34 Table 10. Distributions of Time Spent and Fuel Consumed while Idling (Transit Buses) ................. 35 Table 11. Overall and Moving Fuel Efficiency - Combination Trucks ............................................... 35 Table 12. Overall and Moving Fuel Efficiency – Transit Buses .......................................................... 36 Table 13. Combination Truck Weight-Level Statistics ........................................................................ 40 Table 14. Transit Buses Weight-Level Statistics ................................................................................. 41 Table 15. Fuel Efficiency as a Function of Load Level – Combination Trucks .................................. 41 Table 16. Fuel Efficiency as a Function of Load Level – Transit Buses ............................................. 42 Table 17. Transit Bus Highway Duty Cycle Distribution Statistics .................................................... 45 Table 18. Transit Bus Surface Street Duty Cycle Distribution Statistics............................................. 48 Table 19. Pressure Ranges for TPMS Status Codes ............................................................................ 54

x
ACRONYMS AND ABBREVIATIONS
Term Definition
ASCII American Standard Code for Information Interchange
CTA Center for Transportation Analysis
Dana Dana Corp.
DAS Data Acquisition System
DASIB Data Acquisition System Interface Box
DOE US Department of Energy
DOT US Department of Transportation
DCGenT Duty Cycle Generation Tool
EOBR Electronic On-Board Recorder
EPA Environmental Protection Agency
FE Fuel Efficiency
FOT Field Operational Test
FMCSA Federal Motor Carrier Safety Administration
GPS Global Positioning System
HTDC Heavy Truck Duty Cycle
KAT Knoxville Area Transit
MARC Michelin Americas Research and Development Corp.
MOA Memorandum of Agreement
MTDC Medium Truck Duty Cycle
NGWBST New-Generation Wide-Based Single Tires
NTRC National Transportation Research Center
ORNL Oak Ridge National Laboratory
PTO Power Takeoff
SDMS Safety Data Message Set
SIE File Extension Descriptor Assigned by HBM/SoMat
SIF SoMat Information File
TPMS Tire Pressure Monitoring System
Vehicle Test Vehicle Including Tractor and/or Trailer Unit(s)
VIUS Vehicle Inventory and Use Survey
WRI Wireless Roadside Inspection
21CTP 21st Century Truck Partnership

xi
ACKNOWLEDGEMENTS
The Oak Ridge National Laboratory would like to thank the H.T. Hackney Company and K-Trans
Management for making available their trucks to serve as test vehicles for this project. They provided the
necessary access to vehicles for the smooth conduct of the Field Operational Test in addition to assisting
in equipment installation, troubleshooting, and de-instrumentation. Without the support of H.T.
Hackney’s and K-Trans Management’s owners, drivers, and technicians, this project would not have been
possible.
We would also like to thank Mr. Brian McDivitt (Pensacola Christian College) for his contributions to the
project in its early stages through an internship with the US Department of Energy (DOE) Office of
Science and the Oak Ridge Institute for Science and Education.
We would also like to thank the Federal Motor Carrier Safety Administration for making possible the
collection of additional safety-related signals through their funding for the associated sensors; MGM
Brakes for the installation cost of the e-Stroke units; and the Tennessee Highway Patrol of the Tennessee
Department of Safety for providing manpower to assist in the calibration of the on-board self-weighing
units.
Finally, the project team would like to thank Mr. Lee Slezak (DOE Office of Vehicle Technologies) for
his continued support of this important project. Mr. Slezak’s encouragement, guidance and enthusiasm,
for this work; along with the financial support for its conduct were the foundation which allowed this
project to be conducted. We are indebted to Mr. Slezak for his support.

xii
EXECUTIVE SUMMARY
Since the early part of the 20th century, the US trucking industry has provided a safe and economical
means of moving commodities across the country. At the present time, nearly 80% of the US domestic
freight movement involves the use of trucks. The US Department of Energy (DOE) is spearheading a
number of research efforts to improve heavy vehicle fuel efficiencies. This includes research in engine
technologies (including hybrid and fuel cell technologies), lightweight materials, advanced fuels, and
parasitic loss reductions. In addition, DOE is developing advanced tools and models to support heavy
vehicle truck research, and is leading the 21st Century Truck Partnership whose stretch goals involve a
reduction by 50% of the fuel consumption of heavy vehicles on a ton-mile basis.
This Medium Truck Duty Cycle (MTDC) Project is a critical element in DOE’s vision for improved
heavy vehicle energy efficiency and is unique in that there is no other existing national database of
characteristic duty cycles for medium trucks. It involves the collection of real-world data on medium
trucks for various situational characteristics (rural/urban, freeway/arterial, congested/free-flowing,
good/bad weather, etc.) and looks at the unique nature of medium trucks’ drive cycles (stop-and-go
delivery, power takeoff, idle time, short-radius trips), to provide a rich source of data that can contribute
to the development of new tools for fuel efficiency and modeling, provide DOE a sound basis upon which
to make technology investment decisions, and provide a national archive of real-world-based medium-
truck operational data to support heavy vehicle energy efficiency research. The MTDC project involves
a two-part field operational test (FOT). For the Part-1 FOT, three vehicles, each from two vocations
(urban transit and dry-box delivery) were instrumented for one year of data collection. The Part-2 FOT
will involve the towing/recovery and utility vocations.
The vehicles participating in the MTDC project are doing so through gratis partnerships in return for early
access to the results of this study. Partnerships such as these are critical to FOTs in which real-world data
is being collected. In Part 1 of the project, Oak Ridge National Laboratory (ORNL) established
partnerships with the H.T. Hackney Company, one of the largest wholesale distributors in the country,
distributing products to 21 states; and with the Knoxville Area Transit (KAT), the City of Knoxville’s
transit system, operating services across the city of Knoxville and parts of Knox County. These
partnerships and agreements provided ORNL access to three Class-7 2005/2007 International day-cab
tractors, model 8600, which regularly haul 28-ft pup trailers (H.T. Hackney Co) and three Class-7 2005
Optima LF-34 buses (KAT), for collection of duty cycle data. In addition, ORNL has collaborated with
the Federal Motor Carrier Safety Administration (FMCSA) to determine if there were possible synergies
between this duty cycle data collection effort and FMCSA’s need to learn more about the operation and
duty cycles of the second-largest fuel consuming commercial vehicle category in the US. FMCSA’s
primary interest was in collecting safety data relative to the driver, carrier, and vehicle.
In order to collect the duty cycle and safety-related data, ORNL developed a data acquisition and wireless
communication system that was placed on each test vehicle. Each signal recorded in this FOT was
collected by means of one of the instruments incorporated into each data acquisition system (DAS).
Native signals were obtained directly from the vehicle’s J1939 and J1708 data buses. A VBOX II Lite
collected information available from a Global Positioning System (GPS) including speed, acceleration,
and spatial location information at a rate of 5 Hz, and communicated this data via the CAN (J1939)
protocol. The Air-Weigh LoadMaxx, a self-weighing system which determines the vehicle’s gross
weight by means of pressure transducers and posts the weight to the vehicle’s J1939 data bus, was used to
collect vehicle payload information. A cellular modem, the Raven X EVDO V4221, facilitated the
communication between the eDAQ-lite (the data collection engine of the system) and the user, via the
internet. The modem functioned as a wireless gateway, allowing data retrievals and system checks to be
performed remotely. Also, and in partnership with FMCSA, two additional safety sensors were installed

xiii
on the combination vehicles: the MGM e-Stroke brake monitoring system and the Tire SafeGuard tire
pressure monitoring system. Both of these systems posted data to the J1939 data bus, enabling these
signals to be read without any additional DAS interface hardware.
Seventy-three signals from the different deployed sensors and available vehicle systems were collected.
Because of the differences in vehicle data buses (i.e., J1939 and J1708 data buses), not all desired signals
were available for both types of vehicles. The safety-related sensors (i.e., the e-stroke device by MGM
Brake and the Tire SafeGuard tire pressure monitoring system) post the signals to the J1939 data bus and
were read as vehicle-native sensors similar to those provided by the vehicle on-board computer. The
additional sensors, including the GPS-based VBOX II Lite, the self-weighing Air-Weigh unit, and a wiper
switch used to collect basic rain data, were incorporated directly into the DAS.
Upon installation of the DAS, the sensors were individually monitored through a computer with a wired
connection to the eDAQ-lite. When the proper operation of the installed sensors was confirmed, the
cellular modem was connected and the ability to communicate with the system remotely via the internet
was checked. When all systems appeared to be functioning as intended, the vehicle was released to
resume normal operations. In addition, ORNL developed a data-retrieval and archiving system that
accessed the vehicles automatically over the air and downloaded the information collected and residing on
the on-board DAS. Each day the system e-mailed to the ORNL researchers a summary of the data
downloaded from each vehicle, highlighting any sensors that showed a percentage of errors above a pre-
defined threshold.
Data collection began in May 2009 with the official signing of the Memoranda of Agreement taking place
at a ceremony held at the National Transportation Research Center in Knoxville, Tennessee on July 7,
2009. During the one-year data collection period, the six participating vehicles logged over 95,000 miles
(45,400 for the combination trucks and 49,400 for the transit buses) and consumed over 17,000 gallons of
fuel (6,000 for the combination trucks and 11,300 for the transit buses), while conducting business in the
East Tennessee area.
For the combination trucks, the largest proportion of idling time (61%) and fuel consumed (50%) while
idling correspond to idling intervals that lasted between 0 and 5 minutes, that is, traffic congestion and
delays at traffic signals. This is followed by intervals of 5 to 10 minutes of idling time (25% of total
idling time and 25% of total fuel consumed), and by the 15 to 60 minute time interval. The transit buses
also spent most of their idling time (31%) in congestion, and bus dwelling stops (0 to 5 minute idling
interval) which also consumes the largest proportion of fuel spent while idling. However, as opposed to
the combination trucks, the transit buses spent 26% (0% for the combination trucks) of their idling time in
intervals that are larger than 4 hours consuming also about 26% of the fuel spent while idling. These
large idling times were observed mostly at the KAT parking lot while the vehicles were waiting to start a
trip.
For the transit buses, the percentage difference between the overall fuel efficiencies (i.e., fuel efficiencies
computed taking into consideration idling times) and the moving fuel efficiencies (i.e., fuel consumed
only when the vehicle was moving) was much higher (between 10 and 20 times higher) than that of the
combination trucks. Some of this difference can be attributed to differences between vehicle types, but
most is due to idling. While the total miles traveled by the two sets of vehicles during the year-long
project was almost the same, the transit buses consumed almost 20 times more fuel than the combination
trucks while idling due to the greater idling times.
One very important variable affecting the fuel efficiency of any vehicle is its payload level. ORNL
developed a model that predicted the trailer weight based on the tractor weight provided by the Air-Weigh
device (trailers were not instrumented with this device, so no direct measurements of trailer payload were

xiv
made). On the other hand, the deployed Air-Weigh devices provided weight information for the entire
vehicle in the case of the transit buses.
On average, the combination trucks weighted between 27,700 lbs to 29,000 lbs and the buses between
23,000 lbs and 23,800 lbs. To generate the distribution of fuel efficiency under the payload levels
described above, 10-mile segments were considered for which the fuel efficiency was computed and
counted as one observation. Overall, and as expected, the fuel efficiency decreases as the payload
increases for the combination trucks. However, because the payload categories are very narrow and low
(those combination trucks never made any trips with gross vehicle weights that were above 42,000 lbs, far
below the legal weight limit for Class-7 trucks), the variation of the fuel efficiency is not significant. In
the case of the transit buses, the relationship between fuel efficiency and vehicle weight is not as it would
be predicted (i.e., decreasing fuel efficiency with increasing payload). This phenomenon is due to several
factors. First, when the vehicle is empty (lowest payload) it spends a considerable amount of time idling.
This results in very low fuel efficiencies for this load-level category. At the other end of the spectrum,
the highway routes (express routes) are the ones that carry the largest number of passengers. The buses
on these routes spent very little dwelling time (there are fewer bus stops) and also encounter the least
number of traffic lights. This results in fuel efficiencies that are higher than regular surface street routes
(light fare) with many more stops (bus stops and traffic signals).
The data collected in this project was also used to investigate the variability that may exist in duty cycles
that are generated by the same vocation and that follow the same route. In order to do so, two sets of duty
cycles collected from the data gathered by the transit buses were identified. The first set focused on
freeway duty cycles. A 19 km segment of Westbound I-40 in Knoxville, Tennessee was selected and the
corresponding duty cycles extracted from the database. The length of the 74 highway duty cycles ranged
from 10.5 minutes to 27.6 minutes with an average length of 12.6 minutes and a standard deviation of
2.71 minutes. The variability of the duty cycles was measured by the ratio of the standard deviation of
the distribution of duty cycle lengths over the mean of that distribution. For these 74 freeway duty cycles,
this ratio was 0.214 (i.e., 2.71 minutes/12.7 minutes).
A 4.9 km loop in downtown Knoxville, Tennessee was selected and the corresponding duty cycles
extracted from the database. Thirty-eight surface street duty cycles with the characteristics described
above were selected. The length of the duty cycles ranged from 10.9 minutes to 22.8 minutes with an
average length of 18.4 minutes and a standard deviation of 3.29 minutes. Computing the duty cycle
variability in the same way as for the freeway duty cycles, the 38 surface street duty cycles had a ratio
equal to 0.179 (i.e., 3.29 minutes/18.4 minutes). Under this variability measure, the highway duty cycles
presented a higher variability than the surface street duty cycles. This higher variability in highway duty
cycles is due to the effect of the variability in traffic conditions (i.e., highway congestion level). On
surface-street routes, the main factors contributing to the duty cycle length are the number of bus stops
and dwelling times (none of these factors are present on the highway duty cycles) with traffic congestion
playing a relatively less preponderant role.

1
1. PROJECT OVERVIEW
Since the early part of the 20th century, the US trucking industry has provided a safe and economical
means of moving commodities across the country. Now, in the early part of the 21st century, nearly 80%
of the US domestic freight movement involves the use of trucks. The 2002 Vehicle Inventory and Use
Survey (VIUS, Department of Commerce, 2005) estimates that there are over 3 million medium trucks
[Class-3 through Class-7 trucks, between 10,001 and 33,000 lbs gross vehicle weight rating] registered in
the US. It is estimated that Class-6 and Class-7 commercial vehicles together consume in excess of 4
billion gallons of fuel each year, second only to Class-8 tractor-trailers in the commercial truck sector.1
With the increasing cost of fuel, increased efforts need to be placed on advanced technologies and new
research and development efforts that will significantly contribute to enhanced fuel efficiencies.
The US Department of Energy (DOE) is spearheading a number of research efforts to improve heavy
vehicle fuel efficiencies. This includes research in engine technologies (including hybrid and fuel cell
technologies), lightweight materials, advanced fuels, and parasitic loss reductions. In addition, DOE is
developing advanced tools and models to support heavy vehicle truck research, and is leading the 21st
Century Truck Partnership (21CTP)2 whose stretch goals involve a reduction by 50% of the fuel
consumption of heavy vehicles on a ton-mile basis.
This Medium Truck Duty Cycle (MTDC) Project is a critical element in DOE’s vision for improved
heavy vehicle energy efficiency. It involves the collection of real-world data for various situational
characteristics (rural/urban, freeway/arterial, congested/free-flowing, good/bad weather, etc.) and looks at
the unique nature of medium trucks’ drive cycles (stop-and-go delivery, power takeoff, idle time, short-
radius trips), to provide a rich source of data that can contribute to the development of new tools, provide
DOE a sound basis upon which to make technology investment decisions, and provide a national archive
of real-world-based medium-truck operational data to support heavy vehicle energy efficiency research.
A quantitative profile of the driving behavior of medium trucks does not currently exist. A thorough
understanding of the operation of medium trucks within duty cycles that reflect real-world conditions is
an asset that would have great benefit to DOE, other federal agencies (e.g., the US Department of
Transportation (DOT), and their interest in truck safety; the Environmental Protection Agency (EPA), and
their interest in real-time emissions data), and the overall trucking industry (e.g., to better understand how
improvement in energy efficiencies can contribute toward improved profit margins).
1.1 PRIOR DUTY CYCLE EFFORTS
The Oak Ridge National Laboratory’s (ORNL’s) Center for Transportation Research (CTA) recently
conducted the Heavy Truck Duty Cycle (HTDC) project which focused on the collection of duty cycle
data relative to Class-8 vehicles.3 The HTDC effort was conducted in three Phases.
Phase 1 of the HTDC project was conducted from January 2005 through March, 2006, and involved pilot
testing of one instrumented Class-8 tractor-trailer, operating cross-country (East-to-West and North-to-
South) while fully loaded. The purpose of the pilot testing was to design an appropriate data collection
suite and to field harden associated sensors, instrumentation and a data acquisition system (DAS). The
effort involved outfitting a truck with sensors and instrumentation to collect 104 channels of data over a
1 Based on estimates from the 2002 VIUS.
2 http://www1.eere.energy.gov/vehiclesandfuels/about/partnerships/21centurytruck/
3 Capps G., O. Franzese, B. Knee, M. B. Lascurain, and P. Otaduy, Class-8 Heavy Truck Duty Cycle Project Final
Report (ORNL/TM-2008/122), 2008.

2
three-month time frame. The truck completed two east-west runs and two north-south runs. In order to
leverage the resources required for pilot testing, partnering was engaged in with Dana Corp. (Dana) of
Kalamazoo, Michigan, and Michelin Americas Research and Development Corp. (MARC) of Greenville,
South Carolina. Both Dana and MARC were interested in collecting data for their own research from the
pilot testing and provided in-kind resources (e.g., gratis usage of a Dana tractor and trailer and specialized
test equipment). MARC’s interest involved the field testing of their New-Generation Wide-Based Single
Tires (NGWBSTs) and standard dual tires to assess any fuel efficiency impacts. The pilot test involved
alternating between standard dual tires and the NGWBSTs for the various runs. Over 50 gigabytes of
data were collected during the pilot test.
Phase 2 of the HTDC project involved the design of a streamlined DAS and sensor suite that could
withstand the rigors of being mounted on a commercial vehicle during its normal vocation, and would
require no human interaction for initialization on vehicle startup at the beginning of each day or at the
beginning of each route. Additionally, the number of major system components was reduced to four
(DAS; vehicle self-weighing system; weather station; vehicle position and motion system). The resulting
DAS was capable of collecting 60 channels of data and storing it internally in its dynamic memory. Each
Phase 2 DAS went through a ―burn-in‖ cycle for 30 days prior to being installed onto the test vehicles. A
working fleet (Schrader Trucking of Jefferson City, Tennessee) was down-selected for partnership in the
project, and six tractors and ten trailers were instrumented in the fall of 2006 using the HTDC DASs. The
first vehicle to be instrumented was closely monitored in the field for 30 days for issues with the
equipment, installation, driver distraction, and software. A Memorandum of Understanding between
DOE, Schrader Trucking and ORNL was signed in late-October 2006, and all test vehicles were deployed
in the field operational test (FOT) by mid-November 2006.
Phase 3 of the HTDC project involved conducting FOT, collecting and storing the data, developing the
HTDC Duty Cycle Generation Tool (DCGenT), support of Powertrain Systems Analysis Toolkit module
development, and data analysis. The FOT was completed in November 2007. The six instrumented
heavy trucks and ten instrumented trailers cumulatively hauled freight for more than 690,000 miles in an
area approximately 1,000 miles in diameter, centered near Jefferson City, Tennessee. During the FOT, 60
channels of data were collected on each test truck for a twelve-month period, resulting in the collection of
290 GB of raw data. The Phase 3 FOT is believed to be the most comprehensive real-world data for
Class-8 long-haul performance known to exist. The data collected during the FOT included speed, fuel
consumption, road grade, location, and weather conditions; and it is expected to be of value in truck fuel
economy studies as called for in the Energy Independence and Security Act of 2007, and to EPA in their
efforts to define a standardized duty cycle for Class-8 trucks. The data analysis of the FOT data permitted
the computation of fuel efficiencies for Class-8 trucks as a function of the type of tires mounted on the
tractor and trailer. These calculations, which were made using fuel consumption information obtained
from the vehicles’ data bus, showed an overall fuel efficiency above 6.0 mpg. This level of fuel
efficiency is on the upper limits of today’s large-truck fleets and is mostly a result of the participating
trucking company partner being a very technologically-minded organization, providing excellent
programs in driver training, and their extensive vehicle maintenance program (including, for example,
maintaining constant tire pressures). The results of the data analysis showed that there is always a
statistically significant improvement in fuel efficiency with respect to the base case (i.e., dual tires on
both the tractor and trailer; duals-duals) when NGWBSTs are used on the tractor and/or trailer.
Moreover, the fuel efficiency improvement increases as the number of NGWBSTs on the truck increases,
with observed improvements of around 6% when either the tractor or the trailer was equipped with
NGWBSTs, and more than 9% when both were mounted with these types of tires. When the data was
parsed by tractor-trailer tire configuration and load level, the results of the analysis show that there was
again an improvement in fuel efficiency with respect to the base case (i.e., duals-duals) when NGWBSTs
are used. In fact, for the particular case in which all tires are NGWBSTs, there was considerable
improvement in fuel efficiency with respect to the base case (i.e., improvements that were above 10%),
3
and those improvements were more pronounced as the load level increased. They were also statistically
significant at the 99% level of confidence.
1.2 OVERALL PROJECT DESCRIPTION
This project involves efforts to collect, analyze and archive data related to medium-truck operations in
real-world driving environments. Such data and information will be useful to support technology
evaluation efforts and to provide a means of accounting for real-world driving performance within
medium-class truck analyses. The project is being led by ORNL’s CTA and involves private industry
partners from various truck vocations.
The MTDC project is unique in that there currently does not exist a national database of characteristic
duty cycles for medium trucks. This project involves the collection of data from multiple vocations (four
vocations) and multiple vehicles within these vocations (three vehicles per vocation) while the vehicles
conduct their normal operations. The collection of this data is does not perturb the vehicle’s normal duty
cycle. For the MTDC Part 1 FOT, three vehicles, each from two vocations (urban transit and dry-box
delivery) were instrumented for one year of data collection. The MTDC Part 2 FOT will involve the
towing/recovery and utility vocations.
This program involves a number of tasks to collect and analyze real-world duty cycle data from medium
trucks data in order to accomplish the following objectives:
Provide a source of real-world medium-truck performance data that can be utilized by DOE for
making decisions related to future technology investments.
Provide a baseline of data that can be utilized to gauge 21CTP technology advancements.
Provide a national source of real-world data for the medium-truck research community.
Potentially provide data germane to EPA’s goal of collecting emissions data from medium trucks
in quantifiable driving environments.
Potentially provide data germane to the Federal Motor Carrier Safety Administration’s
(FMCSA’s) goal of collecting vehicle, driver and carrier data in real-time during normal
vocational operation.
1.3 PARTNERSHIPS
The vehicles participating in the MTDC project are doing so through gratis partnerships in return for
access to the results of this study. Partnerships such as these are critical to FOTs in which real-world data
are being collected. A partnership with FMCSA allowed the collection of additional safety-related
signals beyond the normal set of duty cycle data collected in previous efforts.
1.3.1 H.T. Hackney
The H.T. Hackney Company4 is one of the largest wholesale distributors in the country, distributing
products to 21 states. ORNL worked with personnel at their Roane County facility to collect real-world
duty cycle data on three of their Class-7 units whose duty cycles involved delivery to local convenience
stores. This fleet’s safety consciousness and progressive attitude toward fuel efficiency also made them
an excellent venue for the installation of additional safety sensors to supplement the standard duty cycle
data.
4 http://www.hthackney.com/

4
1.3.2 K-Trans Management
K-Trans Management operates the Knoxville Area Transit (KAT)5, the City of Knoxville’s transit system,
operating services across the city. They partnered with ORNL to provide access to three of their Class-7
buses for collection of duty cycle data.
1.3.3 Federal Motor Carrier Safety Administration
Additionally, ORNL has collaborated with FMCSA to determine if there were possible synergies between
the MTDC duty cycle data collection effort and FMCSA’s need to learn more about the operation and
duty cycles of the second-largest fuel consuming commercial vehicle category in the US. FMCSA’s
primary interest was in collecting safety data relative to the driver, carrier, and vehicle. Further, FMCSA
is in the process of developing and testing requirements for wireless transfer of data from a commercial
vehicle to the roadside.
Beyond the standard duty cycle data collection system used in previous DOE duty-cycle research,
additional sensors were installed on three test vehicles (Class-7 single-axle, tractor-trailers) to collect
several safety-related signals of interest to FMCSA. These additional sensors were provided through a
partnership with FMCSA who provided for the additional cost of incorporating these sensors into the
DAS. The real-time brake stroke, tire pressure, and weight information obtained from these sensors
makes possible a number of safety-related analyses such as determining the frequency and severity of
braking events and tracking tire pressure changes over time.
5 http://www.katbus.com/

5
2. PART 1 FIELD OPERATIONAL TEST
For the MTDC Part 1 FOT, three vehicles each from two vocations (urban transit and dry-box delivery)
were instrumented for one year of data collection (2009-2010). The Part 2 MTDC FOT will involve the
towing/recovery and utility vocations, and data will be collected in the 2010-2011 timeframe.
2.1 VOCATIONAL ASSESSMENT
Within the medium weight category of trucks, there is such a variety of applications that it is virtually
impossible to identify a single typical duty cycle for the weight class. Therefore, the decision was made
to select a few major medium-truck vocations for the MTDC FOT. A vocational assessment6 was
conducted to identify several recommended vocations for participation in the FOT for the MTDC project.
2.1.1 Initial Down-Selection
The following vocations were originally under consideration for participation in the FOT based on
available VIUS data:
Dry-box delivery
Beverage delivery
Refrigerated/frozen delivery
Package delivery
Utility (where power takeoff [PTO] is used)
Public transit
School bus
Towing and recovery
Farming
Because of the limited number of DASs available and the desire to collect seasonal data, not all of these
vocations could participate in the FOT. The list of vocations was down-selected to six vocations. The
selections were made to give a typical representation of medium trucks based on vehicle miles traveled,
hours of operation per day, typical payload, area of operation, PTO operation, auxiliary cargo heating and
cooling, and daily idle time.
Farming vehicles were removed from the list because most medium trucks used in farming operations are
not over-the-road vehicles in regular use. An additional vocation which was considered but not chosen
for participation in the FOT was package delivery. This vocation was not selected because although it
may be distinct from other vocations, the data collected would be inapplicable to all but the very few
companies in this industry. It was therefore omitted from the final list due to the limited application of
this duty cycle data; there are very few entities that would find this duty cycle characteristic of their
operations.
The rental truck vocation was also considered because it represents a significant number of medium
trucks—particularly Class-6 trucks. However, in addition to the ―niche market‖ reason for excluding
package delivery, equipment security was also an issue. Unlike other vocations where the drivers are
employed by the company, the drivers of these vehicles could not be known and therefore presented a
potential data security risk and risk of damage to or theft of the data collection equipment.
6 Internal ORNL report

6
Another vocation under consideration was beverage delivery. However, when the potential partner
proved unable to participate, it was decided that the duty cycle of this vocation may be very similar to that
of refrigerated/frozen delivery and dry-box delivery. Thus, a replacement for this fleet was not pursued.
2.1.2 Recommended Vocations
Following the formal down-selection, the following vocations were recommended for the FOT.
2.1.2.1 Dry Box Delivery
The dry box delivery trucks are expected to be in operation the entire business day and travel routes
within a certain distance from the distribution center. The payload of these vehicles is expected to range
from near-capacity to empty throughout the day as deliveries are made.
2.1.2.2 Refrigerated/Frozen Delivery
This vocation is expected to have a lower fuel efficiency than dry-box delivery due to the energy
requirements of the refrigeration system. The trucks involved in this type of delivery will likely go out
fully loaded on a regular basis. Of particular interest is the seasonal variation in the energy demands of
the refrigeration system.
2.1.2.3 Utility
The duty cycles of utility trucks are unique in that the typical utility truck spends very little time traveling
(and thus has a much lower annual mileage than other medium trucks). These trucks typically spend most
of their operating time in PTO operation, up to eight hours in a ten-hour operational day. It is expected
that data collected from the utility trucks will reveal negligible change in weight. These vehicles travel in
both rural and urban areas.
2.1.2.4 Urban Transit
Urban transit buses experience stop-and-go operations throughout the day, often driving in congested
areas. Although these vehicles are expected to drive predictable routes, the collection of data for an entire
twelve-month period will permit seasonal data to be collected.
2.1.2.5 Rural Pupil Transportation
The inclusion of a rural school bus will permit the collection of an exclusively rural duty cycle. Unlike
other vocations selected, there will be times during the year when these vehicles are not in operation.
This duty cycle is unique because although it is based on a regular schedule, it does not typically include
hours of operation during the entire business day.
2.1.2.6 Towing and Recovery
Unlike the other vocations selected, vehicles employed in towing and recovery do not have regular,
predictable duty cycles. Furthermore, the payload will likely be either fully loaded or unloaded. Like the
utility trucks, these vehicles are expected to travel in both urban and rural areas.

7
2.1.3 Selected Vocations
Based on further correspondence with the project sponsor, the list of vocations to be tested was reduced to
the following four vocations.
Local delivery
Urban transit
Towing and recovery
Utility
The selected test methodology allows a full year of duty cycle data to be collected from three vehicles
from each vocation. The first two vocations were involved in the Part 1 FOT; the Part 2 FOT will involve
the final two vocations with an emphasis on PTO operation.
2.2 DATA ACQUISITION SYSTEM AND SENSORS
A DAS was placed on each test vehicle to collect relevant duty cycle data for wireless upload and
subsequent analysis. Native signals were obtained directly from the vehicle’s J1939 and J1708 data
buses. The DAS enclosure is shown in Figure 1.
Figure 1. MTDC DAS
The VBOX II Lite (Figure 2) collected Global Positioning System (GPS)-related information including
speed, acceleration, and GPS at a rate of 5 Hz. This data was communicated via the CAN (J1939)
protocol.

8
Figure 2. VBOX II Lite GPS Unit
The Air-Weigh LoadMaxx (Figure 3) is a self-weighing system which determines the vehicle’s gross
weight by means of pressure transducers and posts the weight to the vehicle’s J1939 data bus.
Figure 3. Air-Weigh LoadMaxx Kit
The eDAQ-lite data acquisition unit (Figure 4) collected and stored data from the vehicle’s J1939 and
J1708 data bus and connected J1939 sensors (i.e., the VBOX and Air-Weigh units). For the purposes of
the FOT, it was configured to record all data at a rate of 5 Hz. The eDAQ-lite was the central data
collection unit with internal data storage for use between periodic uploads.

9
Figure 4. EDAQ-lite Data Acquisition Unit
The Raven X EVDO V4221 (Figure 5) is the cellular modem which facilitated the communication
between the eDAQ-lite and the user via the internet. The modem functioned as a wireless gateway,
allowing data retrievals and system checks to be performed remotely.
Figure 5. Raven X EVDO Cellular Modem
In partnership with FMCSA, two additional safety sensors were installed on the combination vehicles: the
MGM e-Stroke brake monitoring system (Figure 6) and the Tire SafeGuard tire pressure monitoring
system (Figure 7). Both of these systems posted data to the J1939 data bus, enabling these signals to be
read without any additional DAS interface hardware.
Figure 6. MGM E-Stroke Control Unit

10
Figure 7. Tire SafeGuard Display and Transducers
2.3 TEST VEHICLES
For Part 1 of the MTDC FOT, three vehicles each from two vocations, Class-7 combination tractor-trailer
(tractor-trailer) and urban transit bus, were instrumented with the previously-constructed HTDC DASs to
collect 12 months of real-world data. Vehicles from the remaining vocations (utility and towing/recovery)
will be instrumented with the DASs in Part 2 of the MTDC FOT.
Medium tractor-trailers were represented by the local delivery vocation. The H.T. Hackney Company
made available three 2005/2007 International day-cab tractors, model 8600, which regularly haul 28-ft
pup trailers. These vehicles have routes within a 60-80 mile radius of H.T. Hackney’s Roane County
facility. The trailers have three compartments: insulated, refrigerated, and frozen. Because the cooling
for the trailer is powered separately (i.e., a separate diesel engine run from a separate fuel tank located on
the trailer), there will be no additional parasitic losses (which would influence fuel efficiency) due to the
refrigerated units. These vehicles’ regular daily operation involves delivery of 16,000 to 20,000 lbs of
cargo, while generally covering 125 miles on a given day. A typical H.T. Hackney vehicle is pictured in
Figure 8. In addition to the standard data acquisition equipment, the tractors were up-fitted with
additional safety technologies provided by FMCSA.

11
Figure 8. H.T. Hackney 2007 International 8600
The transit buses were made available for the Part 1 MTDC FOT by K-Trans Management which
operates KAT. These vehicles are 2005 Optima LF-34 buses. While additional safety technologies were
not installed on these vehicles, the standard DAS and Air-Weigh self-weighing units were used. These
vehicles’ regular operation involves short trips throughout the Knoxville area; although the majority of
the routes traveled by these buses consist of surface streets, highway data was also collected. A typical
test vehicle is shown in Figure 9.

12
Figure 9. KAT Transit Bus
2.3 COLLECTED SIGNALS
Because of the differences in vehicle data buses, not all desired signals were available for both vehicles.
Table 1 shows the list of signals and their availability on the tractors’ and urban transit buses’ J1939 and
J1708 data buses. The signals available for each vocation are similar, but may not be identical where
different data buses are used. For example, the J1939 data bus signals are often updated more frequently
than their J1708 counterparts. Typically, SI units are used for J1939 data, whereas the J1708 signals are
occasionally reported in US Customary Units.
For a vehicle with a J1939 data bus, the torque values reported by the data bus are in terms of percent of a
reference value. This ―Engine Reference Torque‖ is a static value which is valid as long as the engine is
not re-programmed with a different engine map (which is rarely done). This value can therefore be read
from the data bus once for use in interpreting duty cycle data. During the test vehicle assessment, this
value was found to be 2,118 Nm for the delivery vehicle tested and 1,024 Nm for the transit bus.

13
Table 1. Vehicle Data Bus Signals
No. Description Delivery Urban Transit
1 Total Vehicle Distance J1939 J1939
2 Road Speed Limit Status J1939 J1939
3 Wheel-Based Vehicle Speed/Road Speed J1939 J1939
4 Front Axle Speed J1939 J1939
5 Engine Speed J1939 J1939
6 Current Gear J1939 - - -
7 Selected Gear J1939 J1939
8 Actual Gear Ratio J1939 - - -
9 Output Shaft Speed J1939 J1939
10 Transmission Selected Range J1939 J1708
11 Transmission Current Range J1939 J1708
12 Engine Oil Temperature J1939 - - -
13 Intake Manifold Temperature J1939 J1939
14 Engine Coolant Temperature J1939 J1939
15 Boost Pressure J1708 J1708
16 Fuel Rate J1939 J1939
17 Instantaneous Fuel Economy J1939 J1939
18 Actual Engine - Percent Torque J1939 J1939
19 Percent Accelerator Pedal Position J1939 J1939
20 Percent Load at Current Speed J1939 J1939
21 Driver's Demand Engine - Percent Torque J1939 J1939
22 Nominal Friction Percent Torque J1939 J1939
23 Brake Switch J1939 J1939
24 Clutch Switch J1939 - - -
25 Cruise Control Accelerate Switch J1939 J1939
26 Cruise Control Active J1939 J1939
27 Cruise Control Coast Switch J1939 J1939
28 Cruise Control Enable Switch J1939 J1939
29 Cruise Control Resume Switch J1939 J1939
30 Cruise Control Set Switch J1939 J1939
31 Cruise Control Set Speed J1939 J1939
32 Power Takeoff Governor/Status Flags J1939 J1939
33 Power Takeoff Set Speed J1939 J1939
34 Total Power Takeoff Hours J1939 J1939
35 Battery Voltage J1939 J1939
6 Fan Drive State J1939 J1939
37 AC High Pressure Fans Switch J1939 J1939
38 Barometric Pressure J1939 J1939
For the actual data collection, certain on/off status flags were incorporated into a single channel for more
efficient use of data acquisition resources. For example, signals 23-24 were combined into a
Brake/Clutch Switch channel, and signals 25-30 were combined into a Cruise Control Status channel.
The individual indicators may be easily recovered via post-processing of the data.

14
Table 2 lists additional signals available from sensors incorporated into the DAS. These additional
sensors include the GPS-based VBOX II Lite and the self-weighing Air-Weigh unit. In order to collect
basic rain data, a channel was used to monitor the wiper switch as well.
Table 2. Signals from Other Sensors (All Part 1 Vehicles)
No. Description Sensor
39 Latitude VBOX II Lite
40 Longitude VBOX II Lite
41 Altitude VBOX II Lite
42 Vertical Velocity VBOX II Lite
43 Velocity over Ground VBOX II Lite
44 Longitudinal Acceleration VBOX II Lite
45 Lateral Acceleration VBOX II Lite
46 Heading VBOX II Lite
47 Satellites VBOX II Lite
48 Time UTC VBOX II Lite
49 Distance VBOX II Lite
50 Steer Axle Weight Air-Weigh
51 Drive Axle Weight Air-Weigh
52 Wiper Switch Status Wiper Switch
In addition to the tentative signals already listed, additional safety-related sensors were provided via
partnership with FMCSA. Two areas of interest to FMCSA are brake system operation and dynamic
weight changes to vehicle components and tires during operation. The e-stroke device by MGM Brake
and the Tire SafeGuard tire pressure monitoring system post the signals described in Table 3 to the J1939
data bus; these signals provided some of the data of interest to FMCSA related to brake operation and tire
pressure.

15
Table 3. Additional Safety Signals (Tractor of Delivery Vehicles Only)
No. Description Sensor
53 Brake Actuator Status - Left Front E-Stroke
54 Brake Actuator Status - Right Front E-Stroke
55 Brake Actuator Status - Left Rear E-Stroke
56 Brake Actuator Status - Right Rear E-Stroke
57 Lining Status - Left Front E-Stroke
58 Lining Status - Right Front E-Stroke
59 Lining Status - Left Rear E-Stroke
60 Lining Status - Right Rear E-Stroke
61 Brake Application Pressure E-Stroke
62 Tire Pressure - Left Front Tire SafeGuard
63 Tire Pressure - Right Front Tire SafeGuard
64 Tire Pressure - Left Rear Outside Tire SafeGuard
65 Tire Pressure - Left Rear Inside Tire SafeGuard
66 Tire Pressure - Right Rear Inside Tire SafeGuard
67 Tire Pressure - Right Rear Outside Tire SafeGuard
68 Tire Temperature - Left Front Tire SafeGuard
69 Tire Temperature - Right Front Tire SafeGuard
70 Tire Temperature - Left Rear Outside Tire SafeGuard
71 Tire Temperature - Left Rear Inside Tire SafeGuard
72 Tire Temperature - Right Rear Inside Tire SafeGuard
73 Tire Temperature - Right Rear Outside Tire SafeGuard
2.4 INSTALLATION AND SHAKEDOWN TESTING
2.4.1 Physical Installation
Instrumentation of the test vehicles involved making connections to the vehicle’s internal wiring to tap
into the data bus, to obtain power for the DAS, and to monitor the ignition switch. Cable runs to and
from sensors were routed in a manner to allow for sustained testing and occupant safety. Consideration
was also given to shielding these cables from engine/exhaust heat and damage from objects thrown from
the roadway.
Prior to installation, ORNL staff discussed the location, orientation, and connections for the DAS with
managers and technicians at the partner facilities to ensure that the equipment would be installed in such a
way as to be ―transparent‖ to the vehicle operator and not require driver interaction, while still permitting
safe access by test engineers when necessary. This partner input also ensured that the installation would
not damage the structure of the test vehicles, affect their appearance once the equipment is removed, or
decrease the value of the vehicle beyond normal depreciation. ORNL provided the materials and
accompanying instructions for installation of cabling and GPS antennas and installed the actual DASs on
the partners’ prepared vehicles. All equipment was securely fastened in place to prevent driver distraction
and to avoid damage to the test equipment.
Installation and calibration of the self-weighing system was performed by Air-Weigh personnel. The
calibrations of the Air-Weigh units were performed at the partners’ respective bases of operations.
Portable scales for the calibration were provided by the Tennessee Department of Safety via partnership
with FMCSA.

16
2.4.2 Sensor/DAS Verification
Upon installation of the DAS, the sensors were individually monitored through a computer with a wired
connection to the eDAQ-lite. When the proper operation of the installed sensors was confirmed, the
cellular modem was connected and the ability to communicate with the system remotely via the internet
was checked. When all systems appeared to be functioning as intended, the vehicle was released to
resume normal operations.
Prior to the start of the FOT, in order to diagnose any sensor and data problems which were not
recognized during the equipment configuration stage, one test vehicle was instrumented for
approximately one month of shakedown testing. During this time, minor adjustments and corrections
were made to equipment settings, and frequent data uploads were performed. Procedures to be used
throughout the FOT were finalized, and data analysis was performed on a small scale in order to identify
problems in the analysis software so that they could be corrected before the full FOT. One goal of this
preliminary testing was to verify that the use of a cellular modem to interface with the eDAQ-lite through
the internet provided an efficient and robust data collection solution. At the successful conclusion of the
shakedown testing, the remaining test vehicles were instrumented and deployed.
2.5 CONDUCT OF THE FOT
2.5.1 Launch of the FOT and MOA Signing
Data collection began in May 2009 with the official signing of the Memoranda of Agreement (MOA)
taking place at a ceremony on July 7, 2009, at the National Transportation Research Center (NTRC,
http://www.ntrc.gov/), located in Knoxville, Tennessee (Figure 10). Representatives from DOE, DOT,
H.T. Hackney, and K-Trans Management participated in this event, which was well-attended by the
media.
Figure 10. MOA Signing Ceremony (July 7, 2009)

17
2.5.2 Data Retrieval Software
In order to efficiently collect data from test vehicles based in two different locations, cellular modems
were integrated into each DAS. This methodology permitted test data to be uploaded via the internet,
making regular site visits unnecessary for properly-functioning systems.
With the twelve-month FOT of six test vehicles, the uncompressed data files reached approximately 190
GB of raw data. Because of the large volume of data to be collected, regular data uploading, preliminary
checking, and data archiving was performed throughout the FOT. This also permitted the recognition of
sensor problems soon after development to minimize data loss due to equipment malfunctions.
The data retrieval process generated two copies of the data, stored on separate external hard drives on the
project computer. An additional copy of these drives was kept on an ORNL server maintained for this
purpose at the ORNL campus (located approximately 12 miles from the NTRC), backed up on a daily
basis to protect against data loss. The retrieval and archiving process was fully automated and did not
require human intervention. Each day, the system e-mailed to the ORNL researchers a summary of the
data downloaded from each vehicle, highlighting any sensors that showed a percentage of errors above a
pre-defined threshold. Any identified problem was quickly corrected either by accessing the data
collection system over the air, or by physically accessing the system and making the necessary
adjustments or replacements.
2.6 DE-INSTRUMENTATION
The DAS and sensor suites were removed from each of the test vehicles at the conclusion of the FOT.
The majority of this de-instrumentation was performed by technicians at the partners’ facilities. Because
it was not cost-effective to remove the safety sensors (provided by FMCSA) from the combination test
vehicles and re-install them for future projects, these sensors remained installed on those test vehicles for
potential future research and use by H.T. Hackney in their normal operations. Additional cables for
discrete sensor or systems were left in place at the partners’ discretion. This decision saved DOE/ORNL
the cost of removing the cabling from the test vehicle (Note: this type of cabling has no remaining value
to DOE/ORNL once removed). The DAS and sensors were returned to ORNL for use in the Part 2
MTDC effort. The fleet vehicle was ―restored‖ as needed after the equipment was removed (e.g., cable
feed-through holes were plugged, dash cut-outs were covered, and electrical connections were
terminated).

18
3. ANALYSIS OF THE PART 1 FOT DATA
The main goal of the MTDC project was to collect real-world performance and spatial data related to the
operations of Class-6 and -7 vehicles from fleets engaged in normal commerce, and to provide a means
for managing and using the collected data to generate real-world-based duty cycle data and information.
In the Part 1 of this project, three Class-7 tractors from the H.T. Hackney fleet and three transit buses
from KAT were instrumented and over 70 channels of data were collected for over a one-year period of
time at a rate of 5 Hz. The H.T. Hackney local fleet, which is headquartered in Roane County,
Tennessee, operates within an East Tennessee region covering an area that extends from Cookeville,
Tennessee to the border with North Carolina in the east-west direction, and from the Tennessee-Georgia
border to the Tennessee-Kentucky border in the north-south direction (see Figure 11 for spatial coverage
of the three trucks that participated in this project). The KAT operates in Knoxville, Tennessee, and
surrounding areas; the routes of the buses participating in this project are shown in Figure 12.
Figure 11. Routes of Participating H.T. Hackney Trucks (East Tennessee Area)
Figure 12. Routes of Participating KAT Buses (Knoxville, Tennessee Area)

19
The data gathered in this project included information such as instantaneous fuel rate, engine speed, gear
ratio, vehicle speed, and other information read from the vehicle’s data bus; spatial information (latitude,
longitude, altitude) acquired from a GPS device; and instantaneous tractor (for the combination trucks)
and bus weight were obtained from devices mounted on the six participating vehicles. Some of the
vehicles were also mounted with safety sensors providing brake and tire information. Over the duration
of the Part 1 MTDC FOT (just over a year), the three combination trucks traveled nearly 45,500 miles,
while the three buses logged 49,500 miles.
This section presents the first results of a data analysis of the information collected in the Part 1 MTDC
FOT. Before the results are presented, the next section describes, in some detail, the data cleansing
process and the organization of the extensive information collected in this project. Subsequently, a
discussion is provided regarding additional models (such as a vehicle weight model) that were developed
to complement the collected information. Those models were developed using the data gathered in the
project and were used to ―fill-in-the-gaps‖ for those unusual cases in which a particular channel of
information was not collected.
The results of the analysis are subsequently presented; starting with some general statistics and followed
by comparisons of the average fuel efficiencies observed from vehicles operating with different payload
levels. A preliminary assessment of duty cycle variability is also presented for both the combination
trucks and the transit buses.
3.1 DATA AND ORGANIZATION
The organization and accessibility of the information, as well as its accuracy, play a key role in the quality
of any data analysis. Moreover, organization and accessibility of the data collected are particularly
important when the size of the information database is significantly large. The field tests conducted as
part of this project (more than 70 channels of data collected at 5 Hz for six vehicles) produced a database
with a size of 190 GB of uncompressed information (see Table 4).
Table 4. Size and Number of Data Files Generated in the Project
MTDC Vehicle: Combination Trucks MTDC Vehicle: Transit Buses
Grand Total 1 2 3
Total for
Vehicles 1-3
4 5 6
Total for
Vehicles 4-6
Number of SoMat Information Files (SIF)
179 123 149 451 227 140 211 578 1,029
SIF Files Total Size [GB] 3.79 3.39 3.57 10.75 12.99 6.23 12.30 31.51 42.26
Number of American Standard Code for
Information Interchange (ASCII) Files
179 121 149 449 227 137 214 578 1027
ASCII Files Total Size [GB] 16.27 13.83 15.46 45.56 59.83 27.37 57.95 145.16 190.72
Because of the size and complexity of the information collected, a significant effort was required to
prepare the raw data for the analysis. As explained elsewhere in this report, the information was collected
using a DAS that saved the information in its proprietary format (i.e., SIF files [SoMat Information Files];
SoMat was the manufacturer of the equipment used in the data collection task). These binary files were
saved using a data structure format that optimizes the size and accessibility of the information. The
information stored in this proprietary format was exported by means of software developed by ORNL to a

20
flat text (i.e., ASCII, [American Standard Code for Information Interchange]) format that is readable by
any user.
For the Part 1 MTDC FOT, ORNL developed additional software that allowed the retrieval of the
information collected ―over the air.‖ The protocol that was used to save the information collected by the
instrumented vehicles was as follows. Every night (8:00 PM to 12:00 AM for the combination trucks,
and 1:00 AM to 5:00 AM for the transit buses) the ORNL data retrieval software contacted each vehicle
and retrieved the SIF file with the information collected during that particular day. The day-long SIF file
was then translated into an easily readable format as explained above, and the information was parsed into
the 70+ channels that were collected and saved to files that stored one-day’s worth of data collection data.
These files were named with the calendar date in which the data was collected (e.g., 20091113, for
information collected on November 13, 2009), plus a one-digit identifier that identified the truck (1 to 6)
that gathered the information.
Simultaneous with the formatting of the information from binary to ASCII, the software developed by
ORNL also checked the validity of the data provided by the 70+ channels. There were instances in which
the on-board sensors did not provide information due to, for example, a malfunction of the sensor
(―sensor invalid data‖), and other cases where the DAS had problems storing the data (―eDAQ invalid
data‖). Each channel had a numeric code that identified these types of problems, and those codes were
stored in the file for that particular channel and record. The data cleansing software read this information
and generated statistics that were automatically e-mailed every morning by the software to the ORNL
researchers in charge of the data collection effort. This information allowed the researchers to determine
when a certain sensor was systematically failing or when the failures were just ―glitches‖ that occurred
sporadically. In the first case, troubleshooting, repair/replacement of the particular sensor was
accomplished as soon as it was feasible.
Other errors such as out-of-range errors and errors attributed to the GPS were also identified and
indications of their occurrence were added to the summary reports. Any record that had any kind of error
for any channel was marked with a code that allowed for the identification of those errors, and this
information was added to the corresponding calendar date file as a new field.
3.1.1 Spatial Information
The spatial location provided by the on-board GPS (i.e., latitude, longitude, and altitude collected every
0.2 seconds), permitted the ORNL-developed software to determine the road classification (e.g., freeway)
and identification (e.g., I-40) on which the vehicle was traveling, if it was traveling inside or outside an
urban area, as well as the state in which the truck was located.
The determination of the road on which the truck was traveling was not an easy task, especially since
databases with this type of information are not readily available. In a normal geo-coding procedure, a
given spatial feature (e.g., a segment of roadway) is represented by a series of points defined by latitude,
longitude, and sometimes altitude; and the attributes of that spatial feature (e.g., the name of the roadway,
its classification, number of lanes, etc.) that are associated to these points. This information, kept in
proprietary databases, is used by Geographic Information System (GIS) software to draw these features
on a map such that when a coordinate is entered (e.g., the location of a truck as determined by the latitude
and longitude provided by the on-board GPS device), it could be displayed by placing a symbol of some
sort on its actual location (e.g., the off-ramp from eastbound I-75 at Exit 374 in Knoxville, Tennessee). A
reverse geo-coding procedure is the process of finding the attributes of a certain feature given the latitude
and longitude information of a given point within that feature. That is, and for this project, it was
necessary to find the classification and name of a given roadway once a point on, or very close to that
roadway was known. These points were obtained from the on-board GPS devices as the vehicles traveled

21
and therefore were known. Software was written to determine the name and classification of a given
spatial feature (roadways in this case) when a latitude-longitude point was provided.
The information collected in this way was added to the database of channels, data errors, and spatial
information (city and state) described above. At this point, the collected information database was
archived and three copies were made which were stored on different ORNL data servers and at different
locations to minimize the risk of data loss.
3.1.2 Vehicle Weight Information
In any study involving the fuel efficiency of a vehicle, weight plays a key role. It was therefore
paramount that this type of information be collected in this study. To do so, a device (Air-Weigh) which
is described elsewhere in this report, was mounted on the three participating tractors and the three transit
buses, and provided instantaneous weight measurements at the steer and drive axels7, which were saved
as two of the 70+ data channels of the DAS. The Air-Weigh device was not mounted on any of the H.T.
Hackney trailers. Based on vehicle weight data collected at commercial scales (i.e., Inspection Stations
in Knox County, Tennessee), ORNL developed a model that predicted the trailer weight based on the
tractor weight provided by the Air-Weigh device. This model, which is described in detail later in this
report, was used to assign trailer weight to each one of the records in the database of data collected in this
project. For the transit buses, the deployed Air-Weigh devices provided weight information for the entire
vehicle, and therefore it was not necessary to develop a payload estimation model in this case.
3.1.3 Additional Information
Additional information relevant to the data analysis task was also generated and added to the database of
data collected in this project. This included roadway slope (in percent), which was computed using the
altitude data gathered with the help of the GPS device, and filtered to smooth out local fluctuations due to
GPS errors; and filtered vehicle speed which was later used to determine acceleration, deceleration and
constant speed intervals8. The filter used was a sliding exponential smoothing filter that considered the
median of eleven observations before, and eleven observations after the current point.
3.1.4 Information Indexing
In order to efficiently find and retrieve specific information from the large database of information
collected in this project (i.e., 190 GB) it was necessary to index the information and to create a database
of pointers that would allow for the quick retrieval of data records that comply with possibly multiple
search criteria specified by the analyst.
Several aspects of the collected information were expected to play a relevant role in the data analysis; for
example, the following situations were explored.
a vehicle moving on a freeway vs. a vehicle moving on a surface street
a vehicle moving in an urban area vs. a vehicle moving in a rural area
a vehicle moving under rainy conditions vs. a vehicle moving under clear weather
a vehicle moving during the morning peak hour vs. a vehicle moving during mid-morning off-
peak hours
a vehicle moving vs. a vehicle in a stationary position; and many others
7 The Air-Weigh device uses inputs from the vehicle air-suspension system. For the tractor, only the drive axle weight is measured; the steer axle
weight is computed by the Air-Weigh device. 8Filtering was needed because of the inherent fluctuations in the data, which if not filtered would have introduced errors into the data analyses.

22
For these situations, the ORNL-developed software identified, within the daily data files previously
generated, the records in which each attribute is valid, and where it is not valid. This indexing allowed
for a very efficient management of the information and was used in the data analysis task to allow for the
selection of files that contained only the specific information of interest; for example, a vehicle traveling
in urban areas, during the morning peak-hour, during rainy weather.
A search engine, that uses the index pointers was developed and included with the DCGenT Prototype to
help with the identification and retrieval of information that satisfies one or more user-selected criteria
simultaneously. This newly collected information was added to the already existing HTDC database
made available to the user through a menu choice that allows selecting information about Class-8 trucks,
mid-size combination trucks, or transit buses (see Figure 13). Figure 14 and Figure 15 show screen
captures of the data selection criteria that are part of the DCGenT Prototype for the combination trucks
and transit buses, respectively. Those criteria include the following:
1) time of day (peak and off-peak periods),
2) precipitation (indicated by wiper status) ,
3) roadway type (freeways or surface streets),
4) spatial location (urban or rural areas),
5) congestion level based on vehicle speed and road type,
6) topography (different type of terrains from upslope to flat to down slope),
7) specific vehicle (one or more of the three instrumented tractors, or one or more of the three
instrumented buses),
8) vehicle dynamic condition (e.g., truck stationary, truck accelerating, etc.), and
9) vehicle weight (in four levels: empty, light load, medium load, and heavy load).
Figure 13. Vehicle Class and Vocation Selection Menu

23
Figure 14. Criteria Selection – Class-7 Combination Trucks
Figure 15. Criteria Selection – Class-7 Transit Buses

24
After the user has selected all of the searching criteria of interest and the Search Database button is
pressed, the software finds the list of pointers for the chosen criteria and retrieves from the database all of
the records that satisfy these criteria simultaneously.
3.2 ADDITIONAL DEVELOPED MODELS AND DATA CALIBRATION
3.2.1 Vehicle Weight Model
As discussed briefly in the last section, none of the participating trailers were instrumented with Air-
Weigh devices, and therefore the truck’s total weigh information could not be directly assessed. A truck
total-weight-prediction model was developed that used the tractor weight, which was always available,
total vehicle weight information obtained at certified commercial vehicle scales, and the physics related to
inertia. That is, as a truck accelerates, the weight of the trailer would resist the change in speed by
inducing a force proportional to that weight. This force would impede the movement of the tractor and
would appear as a loss of weight as registered by the Air-Weigh device on the tractor, which determines
axle weight by sampling the pressure of the air suspension system. Therefore, by observing the behavior
(i.e., the weight readings provided by the Air-Weigh device) of the instrumented tractor under different
acceleration levels and for known vehicle weights (as obtained from commercial vehicle scales), it would
be possible, in theory, to characterize the tractor and trailer’s response for a particular payload. A
parametric study of payload weights would theoretically provide a truck response map that can be used to
estimate the payload weight of tractors mated to un-instrumented trailers.
This theory was tested using vehicle dynamics and tractor weight information collected for the cases in
the database in which the vehicle total weight was known from external sources. The tractor weight was
sampled within pre-specified acceleration intervals, ranging from -1.4 to 1.4 m/s2, and linear regression
models9 were developed to fit the ―loss of weight‖ observed as a function of the vehicle acceleration.
Figure 16 and Figure 17 show a representation of the cabin weight as a function of vehicle acceleration
for a loaded truck (i.e., a truck leaving the warehouse at the beginning of the day) and an empty truck (a
truck returning to the warehouse after delivering the entire payload), respectively.
9 A linear fitting function was used since the force opposing the movement of the tractor is proportional to the acceleration (and trailer weight).

25
22,000
22,500
23,000
23,500
24,000
24,500
25,000
-1.40 -1.20 -1.00 -0.80 -0.60 -0.40 -0.20 0.00 0.20 0.40 0.60 0.80 1.00 1.20 1.40
Ste
er
+ D
rive
Acl
es
We
igh
t [l
bs]
Acceleration [m/s2]
Figure 16. Tractor Weight vs. Acceleration – Loaded Truck
18,500
19,000
19,500
20,000
20,500
21,000
21,500
22,000
-1.40 -1.20 -1.00 -0.80 -0.60 -0.40 -0.20 0.00 0.20 0.40 0.60 0.80 1.00 1.20 1.40
Ste
er
+ D
rive
Acl
es
We
igh
t [l
bs]
Acceleration [m/s2]
Figure 17. Tractor Weight vs. Acceleration – Empty Truck
Notice that in both cases the shape of the tractor weight vs. acceleration relationship follows the same
pattern, with three distinct regions. Region 1: a close-to-linear region for the vehicle decelerating
(braking) in which the Air-Weigh device registers less weight as the vehicle acceleration increases (i.e.,
the deceleration becomes smaller in absolute value). Region 2: an almost ―flat‖ region with acceleration
values ranging from -0.20 to 0.15 m/s2 (note: when the vehicle acceleration is very low in absolute value,
then there is no ―shifting‖ in weight among the vehicle axles and therefore the weight-acceleration
relationship is constant). Region 3: another close-to-linear region for the vehicle accelerating in which
the Air-Weigh device registers less weight as the vehicle acceleration increases.

26
In both cases (i.e., loaded and empty trucks) Regions 1 and 3 are very similar. Therefore, and in order to
be consistent with the HTDC weight prediction models , the acceleration region (Region 3) was used to
develop the total-truck weight prediction model (see Capps et al., 2008, ORNL/TM-2008/122). Figure 18
and Figure 19 show the linear regression lines as well as the parameters of these lines, and the R2 (or
―goodness of fit‖ parameter) for Region 3 of the two payload cases. The high R2 indicates that, as was
expected, the observed weight of the tractor decreases in a way that is very close to a linear function as
the vehicle acceleration increases. Notice also that, as expected, the intercept of the linear model (i.e.,
weight of tractor when the vehicle is stationary) is lower for the empty-truck case than for the loaded one.
y = -1224.4x + 23474R² = 0.9843
22,200
22,400
22,600
22,800
23,000
23,200
23,400
0.00 0.10 0.20 0.30 0.40 0.50 0.60 0.70 0.80 0.90 1.00 1.10 1.20
Ste
er
+ D
rive
Acl
es
We
igh
t [l
bs]
Acceleration [m/s2]
Figure 18. Linear Model for Tractor Weight vs. Acceleration - Loaded Truck
y = -1525.1x + 20842R² = 0.9679
18,800
19,000
19,200
19,400
19,600
19,800
20,000
20,200
20,400
20,600
20,800
0.00 0.10 0.20 0.30 0.40 0.50 0.60 0.70 0.80 0.90 1.00 1.10 1.20 1.30 1.40
Ste
er
+ D
rive
Acl
es
We
igh
t [l
bs]
Acceleration [m/s2]
Figure 19. Linear Model for Tractor Weight vs. Acceleration – Empty Truck

27
In order to develop a truck weight prediction model, the information (i.e., vehicle speed and tractor
weight obtained from the on-board Air-Weigh device) collected from trips in which the vehicle total
weight was obtained from commercial vehicle scales was used to generate the linear regression
parameters of the tractor weight tw (i.e., its slope m and intercept b) as a function of vehicle acceleration
va (call this linear regression model, M1). At the same time, the total truck weight ttw was noted; this
parameter was obtained from exogenous sources (commercial vehicle scales). All of these three
parameters (m, b, and ttw) were determined using information from several trips in which the drivers of
the vehicles stopped at an Inspection Station in Knox County, Tennessee at the beginning of their shift
(loaded truck) and at the end of the working day (empty truck). The vehicle speed and Air-Weigh
information collected from the on-board sensors while the truck traveled from the warehouse to the
Inspection Station and from there to their first stop (i.e., two trips in which the vehicle total weight was
constant, except for the fuel consumed) was used to determine parameters m and b for a loaded vehicle.
The other parameter, ttw, was obtained from the weight ticket issued by the Tennessee Highway Patrol at
the Inspection Station. Similarly, on certain days the drivers stopped at the Knox County Inspection
Station at the end of the working day. Information collected during the trips from the last delivery stop on
that day to the Inspection Station and from the latter to the warehouse was used to determine parameters
m and b for an empty vehicle. The other parameter, ttw, was obtained from the weight ticket issued at the
Inspection Station.
A second linear regression model (M2) was developed using the observed m’s and b’s, as independent
variables, and the ttw’s as the dependent variable. M2 models were developed for each one of the three
tractors. The external information collected at the Knox County Inspection Station to develop these M2
models (i.e., steer and drive axle weights, trailer axle weight, and total vehicle weight ttws) is presented in
Table 5 and Table 6 for the loaded and empty vehicle cases, respectively.
Table 5. Weight Ticket Information – Loaded Truck
Date Time Vehicle
ID
Axle Weight [lbs]
Steer Drive Trailer Total
9/28/2009 06:04 1 9,460 14,400 9,960 33,820
9/28/2009 06:01 3 9,360 13,080 9,820 32,260
9/30/2009 06:00 1 9,700 14,460 9,620 33,780
9/30/2009 05:52 2 9,560 14,720 10,200 34,480
9/30/2009 06:33 3 9,040 13,800 9,500 32,340
10/5/2009 06:02 1 9,460 15,740 11,860 37,060
10/5/2009 05:11 2 9,460 14,000 10,200 33,660
10/5/2009 06:40 3 9,340 13,440 8,820 31,600
3/15/2010 08:56 1 9,940 14,660 9,520 34,120
3/15/2010 05:12 2 9,080 14,400 11,960 35,440
3/15/2010 05:55 3 9,100 13,100 8,540 30,740
3/16/2010 07:47 1 9,860 15,020 13,240 38,120
3/16/2010 07:14 2 9,060 13,620 11,160 33,840
3/16/2010 04:28 3 9,280 13,720 11,260 34,260
3/18/2010 05:09 1 9,720 14,560 11,720 36,000
3/18/2010 04:06 2 9,260 14,600 10,540 34,400
3/18/2010 06:10 3 9,180 13,400 9,540 32,120

28
Table 6. Weight Ticket Information – Empty Truck
Date Time Vehicle
ID
Axle Weight [lbs]
Steer Drive Trailer Total
10/15/2009 16:18 1 9,620 11,820 7,480 28,920
10/15/2009 16:39 2 9,080 10,960 6,960 27,000
10/15/2009 14:11 3 9,020 10,920 6,740 26,680
10/16/2009 14:43 1 9,480 11,820 7,260 28,560
10/16/2009 12:42 2 9,020 11,200 7,380 27,600
10/16/2009 15:03 3 9,240 11,000 6,860 27,100
3/15/2010 13:15 2 8,860 11,140 6,920 26,920
3/15/2010 14:09 3 8,880 10,840 6,740 26,460
3/16/2010 16:27 1 9,480 11,740 7,400 28,620
3/16/2010 15:36 2 8,900 10,760 6,820 26,480
3/16/2010 13:29 3 9,520 11,000 6,960 27,480
3/18/2010 15:01 1 9,380 11,600 7,480 28,460
3/18/2010 14:02 2 9,000 11,020 6,860 26,880
3/18/2010 13:47 3 9,140 10,860 6,880 26,880
The methodology to determine truck total weight was as follows. Using the tractor Air-Weigh readings
parameters m, b, and tw (i.e., model M1 parameters) were generated for each time segment in those trips
in which the truck was moving, as explained above. Those parameters were then used as inputs in the
corresponding tractor M2 model to predict the truck total weight. The latter quantity was then assigned to
the corresponding records in the database of collected information.
3.2.2 Calibration of Data Bus Fuel Readings
Due to the focus of the MTDC project on the study of fuel efficiency, the available fuel-related vehicle
data bus signals were studied to understand the accuracy of these signals. Prior to initiation of the FOT, a
short-term fuel study was performed to understand the relationship between the actual fuel usage and
similar data available from the vehicle’s data bus. Drivers of four combination vehicles from the
partnering fleet kept a fuel log for the tractor units for one month.10
Records from the vehicles’ electronic
on-board recorders (EOBRs) provided similar information based on signals from the J1708 vehicle data
bus. Of the 20 segments for which manual and automatically-recorded (J1708-based) logs were available,
there was one outlier with a value of more than four standard deviations below the mean. The remaining
data is shown in Figure 20.
10 The refrigerated trailer units are fueled separately and the amount of this fuel is not included in the analysis.

29
Figure 20. Gallons of Fuel Used – Manual Log Values vs. EOBR-reported Values
This plot indicates that the reported gallons of fuel used from the vehicle’s J1708 data bus provides an
accurate representation of the actual fuel used. However, the DAS used in the FOT recorded this value
from the newer J1939 data bus rather than the older J1708 data bus. EOBR logs were obtained for one
month of recorded duty cycle data to compare these two data buses. As shown in Figure 21, the two data
sets were virtually identical, indicating that the J1939 provides a basis for accurate fuel usage
calculations.
Figure 21. Gallons of Fuel Used – EOBR-Reported Values vs. DAS-recorded Values
3.3 GENERAL STATISTICS
The main focus of the data analysis was on the fuel efficiency of Class-7 vehicles operating in different
vocations and under different payload conditions. The analysis presents some general statistics that
summarize the operations of the two vocations (i.e., combination trucks and transit buses) that

30
participated in the first phase of the MTDC project. An analysis of the fuel efficiency of these vehicles
follows, with the payload dimension added later in this chapter. To add this dimension, a vehicle total
weight was developed for the combination trucks as discussed above, and it was used to assign total
vehicle weight to each record in the database. An investigation of the variability of duty cycles (both on
freeways and on surface street) is also presented in this section.
3.3.1 General Statistics
During the one-year data collection period, the six participating vehicles logged over 95,000 miles
(45,400 for the combination trucks and 49,400 for the transit buses) and consumed over 17,000 gallons of
fuel (6,000 for the combination trucks and 11,300 for the transit buses), while conducting business in the
East Tennessee area. Figure 22 to Figure 24 show the area of operations of the three combination trucks
while Figure 25 to Figure 27 present the superimposed routes for the three transit buses during the one-
year data collection period.
Figure 22. Combination Truck 1 (Vehicle 1) Coverage Area

31
Figure 23. Combination Truck 2 (Vehicle 2) Coverage Area
Figure 24. Combination Truck 3 (Vehicle 3) Coverage Area

32
Figure 25. Transit Bus 1 (Vehicle 4) Coverage Area
Figure 26. Transit Bus 2 (Vehicle 5) Coverage Area

33
Figure 27. Transit Bus 3 (Vehicle 6) Coverage Area
Table 7 and Table 8 present a summary of these statistics for each one of the three participating
combination trucks and the three transit buses, respectively. The tables also include information
regarding fuel efficiencies for the entire data collection period, for each of the six vehicles, as well as their
overall fuel efficiency. These calculations were made using fuel consumption information obtained from
the vehicles’ data bus (last row in Table 7 and Table 8) and include both the fuel consumed while the
vehicle is moving as well as the fuel spent while idling.
Table 7. General Statistics for the Combination Trucks
MTDC Vehicle Grand Total 1 2 3
Distance Traveled [miles] 18,483 6,556 20,397 45,435
Total Travel Time [hrs] 565 190 556 1,311
Average Speed [mph] 32.7 34.5 36.7 34.7
Average Moving Speed [mph] 42.4 41.4 42.7 42.4
Total Fuel Consumed [gal] 2,568 841 2,597 6,006
Overall Fuel Efficiency* [mpg] 7.197 7.794 7.853 7.565
*Computed using vehicle data bus information on fuel consumption, and integration of vehicle speed over time

34
Table 8. General Statistics for the Transit Buses
MTDC Vehicle Grand Total 4 5 6
Distance Traveled [miles] 23,174 7,736 18,531 49,442
Total Travel Time [hrs] 2,481 847 1,878 5,205
Average Speed [mph] 9.3 9.1 9.9 9.5
Average Moving Speed [mph] 19.3 19.7 19.6 19.4
Total Fuel Consumed [gal] 5,432 1,764 4,176 11,372
Overall Fuel Efficiency* [mpg] 4.267 4.386 4.437 4.348
*Computed using vehicle data bus information on fuel consumption, and integration of vehicle speed over time
The information collected was used to generate distributions of idling time and idling fuel consumed as
percentage of total time and total fuel consumed, respectively. Seven intervals of time were considered,
ranging from 0-5 minutes (i.e., the vehicle was idling –vehicle static and engine running– for less than
five minutes) to more than 240 minutes (4 hours); with the short intervals corresponding to idling due to
traffic conditions (i.e., delays at traffic lights, congestion, and bus dwelling time at bus stops) and the
largest one to overnight parking and garage idling. The idling information is presented in Table 9 and
Table 10, for the combination trucks and the transit buses, respectively.
For the combination trucks (Table 9), the largest proportion of idling time (61%) and fuel consumed
(50%) while idling correspond to idling intervals that last between 0 and 5 minutes(i.e., traffic congestion
and delay at traffic signals). This is followed by intervals of 5 to 10 minutes of idling time (25% of idling
time and 25% of fuel consumption while idling), and by the 15 to 60 minute time interval. The latter is
mostly idling while stopping for a delivery. The 180 to 240 minute interval is proportionally low in terms
of idling time (1.5%) but ranks third (12%) in terms of fuel consumed while idling.
The transit buses also spent most of their idling time (31%) in congestion and bus dwelling stops (0 to 5
minute idling interval) which also consumes the largest proportion of fuel spent while idling (see Table
10). However, as opposed to the combination trucks, the transit buses spent 26% of their idling time in
intervals that are larger than 4 hours consuming also about 26% of the fuel spent while idling. These
large idling times were observed mostly at the parking lot while the vehicles were waiting to start a trip.
Table 9. Distributions of Time Spent and Fuel Consumed while Idling
(Combination Trucks)
Idling Interval [min]
Time Spent Fuel Consumed
[hrs]
Percent of Total Idling Time
Percent of Total
Time [gal]
Percent of Total Idling Fuel
Percent of Total
Fuel
0-5 142.1 61.4 10.8 63.1 50.1 1.1
5-10 59.1 25.5 4.5 32.3 25.6 0.5
15-60 15.0 6.5 1.1 10.6 8.4 0.2
60-120 2.2 0.9 0.2 1.4 1.1 0.0
120-180 9.6 4.2 0.7 3.0 2.4 0.1
180-240 3.4 1.5 0.3 15.5 12.3 0.3
240+ 0.0 0.0 0.0 0.0 0.0 0.0
TOTAL 231.4 100 125.9 100

35
Table 10. Distributions of Time Spent and Fuel Consumed while Idling
(Transit Buses)
Idling Interval [min]
Time Spent Fuel Consumed
[hrs]
Percent of Total Idling Time
Percent of Total
Time [gal]
Percent of Total Idling Fuel
Percent of Total
Fuel
0-5 808.4 30.7 1.6 782.9 30.6 6.9
5-10 314.8 11.9 0.6 304.7 11.9 2.7
15-60 285.3 10.8 0.6 281.1 11.0 2.5
60-120 277.2 10.5 0.6 251.7 9.8 2.2
120-180 150.9 5.7 0.3 154.5 6.0 1.4
180-240 116.8 4.4 0.2 111.2 4.3 1.0
240+ 682.2 25.9 1.4 670.8 26.2 5.9
TOTAL 2,635.6 100 2,556.9 100
3.3.2 Class-7 Vehicle Fuel Efficiency
Using the information collected in the project, it is possible to compute the fuel efficiencies of
combination trucks and transit buses. The overall fuel efficiencies, that is the fuel efficiencies (FEs)
computed taking into consideration idling times, as well as the moving FEs (i.e., fuel consumed only
when the vehicle was moving) are presented in Table 11 and Table 12 for the three combination trucks
and three transit buses, respectively. The tables also present the percentage difference between overall
and moving FEs for each vehicle. Notice that for the transit buses the percentage difference between
overall and moving FEs is much higher (between 10 and 20 times higher) than that of the combination
trucks. Some of this difference can be attributed to differences between different types of vehicles
(transmission type, age, etc.), but most is due to idling. While the total miles traveled by the two sets of
vehicles during the year-long project is almost the same, about 10% larger for the transit buses than for
the combination trucks, the former consumed almost 20 times more fuel than the latter while idling (see
Table 7 to Table 10). Using the moving FE information, it is possible to see that the FEs are very
different, being almost 40% higher for the combination trucks than for the transit buses.
Table 11. Overall and Moving Fuel Efficiency - Combination Trucks
MTDC Vehicle Overall FE
[mpg] Moving FE
[mpg] Percent
Difference
1 7.197 7.407 2.91
2 7.794 7.925 1.68
3 7.853 7.974 1.54
All Vehicles 7.565 7.727 2.14

36
Table 12. Overall and Moving Fuel Efficiency – Transit Buses
MTDC Vehicle Overall FE
[mpg] Moving FE
[mpg] Percent
Difference
4 4.267 5.488 28.64
5 4.386 5.773 31.63
6 4.437 5.698 28.41
All Vehicles 4.348 5.609 29.01
3.5 WEIGHT ESTIMATION
3.5.1 Weight Estimation Model
The weight prediction models described in section 3.2.1 were applied to all of the information collected
during the project by the combination trucks. Figure 28 to Figure 30 present the distributions of
measured steer and drive axle weights and modeled truck weight for vehicles 1 to 3, respectively. Those
distributions were built by counting trips (i.e., from a stop to the next stop, with stopping times larger than
10 minutes) that presented the same payload level, and using 1,000 lbs payloads bins. Notice that there
were a few trips where the weight of the tractor was about 14,000 lbs; those were trips within the
warehouse parking area in which the tractor did not have any trailer attached. Notice also that the three
combination trucks had different total vehicle weight distributions. This is mostly due the fact that each
of the three vehicles, in general, repeated the same delivery routes week after week, and also to the length
of the routes. For example, Combination Truck 3 carried, on average, heavier payloads (see Table 13)
since it traveled further from the warehouse than the other two vehicles (see Figure 22 to Figure 24),
visiting each delivery stop with less frequency.
0
200
400
600
800
1000
1200
10
,00
0
12
,00
0
14
,00
0
16
,00
0
18
,00
0
20
,00
0
22
,00
0
24
,00
0
26
,00
0
28
,00
0
30
,00
0
32
,00
0
34
,00
0
36
,00
0
38
,00
0
40
,00
0
42
,00
0
44
,00
0
46
,00
0
48
,00
0
50
,00
0
52
,00
0
54
,00
0
Fre
qu
en
cy
Vehicle Weight [lbs]
Modeled Gross Vehicle Weight
Measured Steer/Drive Axle Weights
Figure 28. Combination Truck 1 (Vehicle 1) Frequency Distributions of Measured Steer/Drive Axle
Weights and Modeled Gross Vehicle Weight

37
0
50
100
150
200
250
300
10
,00
0
12
,00
0
14
,00
0
16
,00
0
18
,00
0
20
,00
0
22
,00
0
24
,00
0
26
,00
0
28
,00
0
30
,00
0
32
,00
0
34
,00
0
36
,00
0
38
,00
0
40
,00
0
42
,00
0
44
,00
0
46
,00
0
48
,00
0
50
,00
0
52
,00
0
54
,00
0
Fre
qu
en
cy
Vehicle Weight [lbs]
Modeled Gross Vehicle Weight
Measured Steer/Drive Axle Weights
Figure 29. Combination Truck 2 (Vehicle 2) Frequency Distributions of Measured Steer/Drive Axle
Weights and Modeled Gross Vehicle Weight
0
50
100
150
200
250
300
10
,00
0
12
,00
0
14
,00
0
16
,00
0
18
,00
0
20
,00
0
22
,00
0
24
,00
0
26
,00
0
28
,00
0
30
,00
0
32
,00
0
34
,00
0
36
,00
0
38
,00
0
40
,00
0
42
,00
0
44
,00
0
46
,00
0
48
,00
0
50
,00
0
52
,00
0
54
,00
0
Fre
qu
en
cy
Vehicle Weight [lbs]
Modeled Gross Vehicle Weight
Measured Steer/Drive Axle Weights
Figure 30. Combination Truck 3 (Vehicle 3) Frequency Distributions of Measured Steer/Drive Axle
Weights and Modeled Gross Vehicle Weight

38
In the case of the transit buses, it was not necessary to develop a weight prediction model since the
vehicles were equipped with the Air-Weigh device which measured total vehicle weight all of the time.
Total vehicle weight distributions were built in a similar manner as those of the combination trucks
discussed above. These distributions are presented in Figure 31 to Figure 33. Transit Buses 1 and 2 had a
similar, and skewed, total vehicle weight distributions with a higher frequency of trips with heavier
payloads (i.e., more passengers) than the mode of the distribution (i.e., the value that occurs the most
frequently in the distribution). In contrast, Transit Bus 3 showed a more normally distributed (i.e., less-
skewed) total-vehicle weight with almost similar number of trips with lighter and heavier payloads. This
is the result of the different routes that these vehicles followed during the year-long data collection effort.
0
5,000
10,000
15,000
20,000
25,000
20
,00
0
20
,50
0
21
,00
0
21
,50
0
22
,00
0
22
,50
0
23
,00
0
23
,50
0
24
,00
0
24
,50
0
25
,00
0
25
,50
0
26
,00
0
26
,50
0
27
,00
0
27
,50
0
28
,00
0
28
,50
0
29
,00
0
29
,50
0
30
,00
0
30
,50
0
31
,00
0
31
,50
0
32
,00
0
32
,50
0
33
,00
0
Fre
qu
en
cy
Vehicle Weight [lbs]
Figure 31. Transit Bus 1 (Vehicle 4) Frequency Distribution of Gross Vehicle Weight

39
0
2,000
4,000
6,000
8,000
10,0002
0,0
00
20
,50
0
21
,00
0
21
,50
0
22
,00
0
22
,50
0
23
,00
0
23
,50
0
24
,00
0
24
,50
0
25
,00
0
25
,50
0
26
,00
0
26
,50
0
27
,00
0
27
,50
0
28
,00
0
28
,50
0
29
,00
0
29
,50
0
30
,00
0
30
,50
0
31
,00
0
31
,50
0
32
,00
0
32
,50
0
33
,00
0
Fre
qu
en
cy
Vehicle Weight [lbs]
Figure 32. Transit Bus 2 (Vehicle 5) Frequency Distribution of Gross Vehicle Weight
0
4,000
8,000
12,000
16,000
20,000
20
,00
0
20
,50
0
21
,00
0
21
,50
0
22
,00
0
22
,50
0
23
,00
0
23
,50
0
24
,00
0
24
,50
0
25
,00
0
25
,50
0
26
,00
0
26
,50
0
27
,00
0
27
,50
0
28
,00
0
28
,50
0
29
,00
0
29
,50
0
30
,00
0
30
,50
0
31
,00
0
31
,50
0
32
,00
0
32
,50
0
33
,00
0
Fre
qu
en
cy
Vehicle Weight [lbs]
Figure 33. Transit Bus 3 (Vehicle 6) Frequency Distribution of Gross Vehicle Weight

40
3.5.2 Effect of Vehicle Weight on Fuel Efficiency
One very important variable affecting the fuel efficiency of any vehicle is its weight or payload. The
previous sub-sections showed FE measurements that were obtained without controlling for any particular
variable since it could be assumed that any of the participating vehicles would experience the same
situations (terrain, weather, payload, etc.) over the course of the year-long experiment. In this sub-section
the weight of the vehicle is introduced as a controlling variable to study how the payload affects the FE of
combination trucks and transit buses.
In order to do this, the search engine of the DCGenT Prototype was used to parse the data by vehicle load
level. For the combination trucks, the vehicle weight was divided into four categories: 1) Tractor and
Empty Trailer (this category also includes tractor-only trips), 2) Light Load (total vehicle weight between
27,000 lbs and 31,999 lbs); 3) Medium Load (total vehicle weight between 32,000 lbs and 37,999 lbs);
and 4) Heavy Load (total vehicle weight above 38,000 lbs). In the case of the transit buses the vehicle
weight was divided into three categories: 1) Empty Bus (vehicle weight less than 22,500 lbs), 2) Light
Fare (total vehicle weight between 22,500 lbs and 25,499 lbs); and 3) Heavy Fare (total vehicle weight
above 25,500 lbs).
Table 13 and Table 14 present summary statistics of distribution of payloads grouped under the weight
levels described above for the combination trucks and transit buses, respectively. The tables show the
average weight in each load level category as well as the percentage of the time that the vehicle carried a
load that was within that category. On average, the combination trucks weighted between 27,700 lbs to
29,000 lbs and the buses weighed between 23,000 lbs and 23,800 lbs. Very few trips in the ―tractor and
empty trailer‖ category were observed (these were mostly trips within the warehouse area). Most of the
trips for vehicle 2 (98%) were at a light or medium load, while for vehicle 3, almost 70% of the trips were
at the medium and high level loads as explained above.
Table 13. Combination Truck Weight-Level Statistics
MTDC Vehicle
Load Level
Any Payload Tractor and
Empty Trailer Light Load Medium Load Heavy Load
Percent of
Time
Average Weight
[lbs]
Percent of Time
Average Weight
[lbs]
Percent of Time
Average Weight
[lbs]
Percent of Time
Average Weight
[lbs]
Percent of Time
Average Weight
[lbs]
1 100.0 28,166 0.0* 0 70.2 26,557 15.5 29,691 14.3 34,398
2 100.0 27,713 0.0* 0 58.7 26,838 40.6 28,894 0.7 32,460
3 100.0 29,038 0.4 22,785 32.4 26,313 48.0 29,132 19.2 33,528
*Negligible
Transit Buses 2 and 3 (vehicles 5 and 6) operated almost 90% of the time with a light fare as defined
above. Vehicle 6 also had the largest average weight, indicating that this was the vehicle that carried the
largest number of passengers (on average). Transit Bus 1 (vehicle 4), on the other hand spent almost 30%
of the time at an empty level. This was mostly due to idling at the parking garage. This vehicle had the
lowest overall FE out of the three buses (see Table 12).

41
Table 14. Transit Buses Weight-Level Statistics
MTDC Vehicle
Load Level
Any Fare Empty Light Fare Heavy Fare
Percent of Time
Average Weight
[lbs]
Percent of Time
Average Weight
[lbs]
Percent of Time
Average Weight
[lbs]
Percent of Time
Average Weight
[lbs]
4 100.0 22,958 28.1 22,198 69.9 23,176 2.0 26,027
5 100.0 23,230 7.6 22,257 89.7 23,222 2.7 26,296
6 100.0 23,854 3.2 22,274 88.7 23,734 8.1 25,775
To generate the distribution of fuel efficiency under the payload levels described above, 10-mile segments
were considered for which the fuel efficiency was computed and counted as one observation. Table 15
presents the results of this analysis for the combination trucks. Under each load level category, the
column labeled ―Average FE‖ contains the average of the fuel efficiencies across all the 10-mile
segments, with the column immediately to the right presenting the standard deviation of the distribution.
Overall, and as expected, the FE decreases as the payload increases. However, because the payload
categories are very narrow and low (those combination trucks never made any trips that were above
42,000 lbs, far below the legal weight limit for Class-7 trucks), the variation of the FE is not significant.
Table 15. Fuel Efficiency as a Function of Load Level – Combination Trucks
MTDC Vehicle
Load Level
Tractor with Empty Trailer
Light Load Medium Load Heavy Load
Average FE [mpg]
Standard Deviation
[mpg]
Average FE [mpg]
Standard Deviation
[mpg]
Average FE [mpg]
Standard Deviation
[mpg]
Average FE [mpg]
Standard Deviation
[mpg]
1 #N/A* #N/A* 7.520 1.020 7.191 1.021 7.091 1.065
2 #N/A* #N/A* 8.013 1.422 7.838 1.328 6.944 1.261
3 8.299 1.708 8.345 1.715 7.667 1.470 7.904 1.452
All Vehicles 8.299 1.708 7.997 1.493 7.574 1.345 7.532 1.351
*Negligible data collected.
The distributions of FEs for each load-level and all the three vehicles combined are presented in graphical
form in Figure 34. For the majority of the combination truck trips, the load level was light and medium
(i.e., between 27,000 lbs and 38,000 lbs).

42
0
20
40
60
80
100
120
140
160
180
0.0 1.0 2.0 3.0 4.0 5.0 6.0 7.0 8.0 9.0 10.0 11.0 12.0 13.0 14.0 15.0
Fre
qu
en
cy
FE [mpg]
Tractor Only
Light Load
Medium Load
Heavy Load
Figure 34. Fuel Efficiency Frequency Distributions as a Function of Load Level – Combination Trucks
In the case of the Transit Buses (see Table 16) the relationship between FE and vehicle weight is not as it
would be predicted (i.e., decreasing FE with increasing payload). This is due to several factors. First,
when the vehicle is empty (lowest payload) it spends a considerable amount time idling as discussed
previously. This results in very low FEs for this load-level category. At the other end of the spectrum, the
highway routes (express routes) are the ones that carry the largest number of passenger. The buses on
these routes spent very little dwelling time (there are fewer bus stops) and also encounter the least number
of traffic lights. This results in FEs that are higher than regular surface street routes (light fare) with
many more stops (bus stops and traffic signals). Notice that in Table 16, vehicle 4 has a very low
standard deviation for the Heavy Fare case. This was due to the fact that there were only two
observations for that case.
Table 16. Fuel Efficiency as a Function of Load Level – Transit Buses
MTDC Vehicle
Load Level
Empty Light Fare Heavy Fare
Average FE [mpg]
Standard Deviation
[mpg]
Average FE [mpg]
Standard Deviation
[mpg]
Average FE [mpg]
Standard Deviation
[mpg]
4 3.261 1.751 4.941 1.191 3.433 0.084
5 4.465 1.368 4.724 1.656 7.412 0.980
6 3.953 1.818 4.820 1.466 5.317 0.906
All Vehicles 3.397 1.748 4.866 1.373 5.685 1.450

43
The distributions of FEs for each load-level and all the three transit buses combined are presented in
graphical form in Figure 35. For the majority of the transit bus trips, the load level was light fare (i.e.,
between 22,500 lbs and 25,500 lbs).
0
50
100
150
200
250
0.0 1.0 2.0 3.0 4.0 5.0 6.0 7.0 8.0 9.0 10.0 11.0 12.0 13.0 14.0 15.0
Fre
qu
en
cy
FE [mpg]
Empty
Light Fare
Heavy Fare
Figure 35. Fuel Efficiency Frequency Distributions as a Function of Load Level – Transit Buses
3.6 CLASSIFICATION OF DUTY CYCLES
3.6.1 Transit Bus Highway Duty Cycles
The data collected in this project can also be used to investigate the variability that may exist in duty
cycles that are generated by the same vocation and that follow the same route. In order to do so, two sets
of duty cycles collected from the data gathered by the transit buses were identified. The first set focused
on freeway duty cycles. A 19 km segment of I-40 in Knoxville, Tennessee was selected (see Figure 36)
and the corresponding duty cycles extracted from the database. This is a segment of urban highway that
is used in several KAT bus routes in both the westbound and eastbound directions. For this study only
the westbound direction was used.

44
Figure 36. Transit Bus Highway Duty Cycle Route
Seventy-four highway duty cycles with the characteristics described above were selected. The majority
of these duty cycles corresponded to the morning peak hour, with considerably fewer occurring during the
afternoon peak hour (see Figure 37).
Figure 37. Transit Bus Highway Duty Cycle (DC) Time-of-Day Frequency Distribution

45
The duration of the duty cycles ranged from 10.5 minutes to 27.6 minutes with an average duration of
12.6 minutes and a standard deviation of 2.71 minutes. Table 17 presents this and other statistics that
define the distributions of these 74 highway duty cycles. One key statistic in the variability of the
highway duty cycles is the distribution of minimum speed, which is directly related to congestion. Table
17 shows that there were significant variations in the minimum speed of the duty cycles. The minimum
speed ranged from 0.0 mph to 56.5 mph with an average of 41.5 mph and a standard deviation of 16.2
mph. This statistic presented the highest ratio of standard deviation to mean, indicating a high variability.
Graphical representations of the distributions of the duty cycle durations and minimum speeds are shown
in Figure 38 and Figure 39, respectively.
Table 17. Transit Bus Highway Duty Cycle Distribution Statistics
Duty Cycle Parameter Distribution Statistics
Mean Standard Deviation
Minimum Maximum Number of
Observations
Duration [min] 12.67 2.71 10.51 27.64 74
Average Speed [mph] 55.81 7.61 25.04 64.85 74
Standard Deviation in Speed [mph] 5.04 5.90 1.39 26.21 74
Maximum Speed [mph] 63.80 3.40 56.54 69.03 74
Minimum Speed [mph] 41.52 16.16 0.00 56.50 74
Figure 38. Transit Bus Highway Duty Cycle (DC) Duration Frequency Distribution

46
Figure 39. Transit Bus Highway Duty Cycle (DC) Minimum Speed Frequency Distribution
The 74 duty cycles were ranked in descending order using the duty cycle average speed as the sorting
variable. Ten of these duty cycles, the top five and the bottom five were selected and graphed. The
results are presented in Figure 40 and Figure 41, respectively. The top 5 duty cycles show very little
variability in terms of cycle length and shape. The profile of these duty cycles follows the geometric
characteristics of the highway in terms of speed, which in this case is almost free-flow speed (highway
Level of Service A). In the case of the bottom five, there is a higher variability in terms of the duty cycle
length and also in the shape of the duty cycles. The latter directly reflects the traffic conditions on the
freeway.
Taking into account these considerations, and as a first approach for highway duty cycles, the variability
in the duty cycle length provides a measure of the duty cycle variability. The speed is a function of the
length of the highway segment and the duration of the duty cycle, so the variability of the speed will
directly affect the variability of the duty cycle length. The duty cycle variability could be measured by
the ratio of the standard deviation of the distribution of duty cycle lengths over the mean of that
distribution. For the 74 duty cycles, this ratio is 0.214 (i.e., 2.71 minutes/12.7 minutes; see Table 17).
For the five top and five bottom duty cycles shown in Figure 40 and Figure 41, the variability was
computed at 0.06 and 0.357, respectively. This indicates a skewed distribution of the duty-cycle
variability, in which duty cycles are more likely to have high rather than low variability. Because the
demand for public transit increases during peak hours, the bus frequency also increases during these
periods. Therefore, a higher proportion of duty cycles were collected under higher traffic-congestion
levels resulting in higher variability in the duty cycles.

47
0.00
10.00
20.00
30.00
40.00
50.00
60.00
70.00
80.00
0.00 200.00 400.00 600.00 800.00 1000.00 1200.00 1400.00 1600.00 1800.00
Spe
ed
[mp
h]
Time [sec]
4_20090715 6_20090519
4_20090708 4_20090723
4_20090717
Figure 40. Top Five Maximum Average Speed Transit Bus Highway Duty Cycles
0.00
10.00
20.00
30.00
40.00
50.00
60.00
70.00
80.00
0.00 200.00 400.00 600.00 800.00 1000.00 1200.00 1400.00 1600.00 1800.00
Spe
ed
[mp
h]
Time [sec]
4_20091106 4_20091211
5_20090424 4_20090714
5_20090501
Figure 41. Bottom Five Maximum Average Speed Transit Bus Highway Duty Cycles

48
3.6.2 Transit Bus Surface-Street Duty Cycles
The first set of duty cycles extracted from the MTDC database focused on surface street duty cycles. A
4.9 km loop in downtown Knoxville, Tennessee was selected and the corresponding duty cycles extracted
from the database. Figure 42 shows this transit bus route.
Figure 42. Transit Bus Surface Street Duty Cycle Route
Thirty-eight surface street duty cycles were selected. The duration length of the duty cycles ranged from
10.9 minutes to 22.8 minutes with an average duration of 18.4 minutes and a standard deviation of 3.29
minutes. Table 18 presents this and other statistics that define the distributions of these 38 highway duty
cycles. Notice that, as opposed to freeway duty cycles, in all of the surface street duty cycles the
minimum speed was 0.0 mph (i.e., vehicle stationary). A graphical representation of the distribution of
the duty cycle lengths is shown in Figure 43.
Table 18. Transit Bus Surface Street Duty Cycle Distribution Statistics
Duty Cycle Parameter Distribution Statistics
Mean Standard Deviation
Minimum Maximum Number of
Observations
Length [min] 18.41 3.29 10.86 22.82 38
Average Speed [mph] 9.23 1.89 2.50 13.90 38
Std Dev Speed [mph] 7.49 0.90 5.42 9.34 38
Max Speed [mph] 26.05 3.06 20.17 31.59 38
Min Speed [mph] 0.00 0.00 0.00 0.00 38

49
Figure 43. Transit Bus Surface Street Duty Cycle (DC) Duration Frequency Distribution
As was the case with the highway duty cycles, the 38 surface street duty cycles were arranged in
descending order using the duty cycle average speed as the sorting variable. Ten of these duty cycles, the
top five and the bottom five were selected and graphed. The results are presented in Figure 44 and Figure
45, respectively. Similarly to the highway duty cycles, the top five surface street duty cycles do not show
a large variability in terms of the duration of the cycle. In the case of the bottom five, there is a higher
variability in duty cycle duration and also in the shape of the duty cycles. Using again the ratio of the
standard deviation of the distribution of duty cycle duration over the mean of that distribution to estimate
the variability of the duty cycles, the 38 duty cycles had a ratio equal to 0.179 (i.e., 3.29 minutes/18.4
minutes; see Table 18). For the five top and five bottom duty cycles shown in Figure 44 and Figure 45,
the variability was computed at 0.134 and 0.262, respectively. Using this measure, the highway duty
cycles presented a higher variability than the surface street duty cycles (i.e., 0.214 vs. 0.179).

50
0
5
10
15
20
25
30
35
0.00 200.00 400.00 600.00 800.00 1000.00 1200.00 1400.00 1600.00
Spe
ed
[mp
h]
Time [sec]
4_20091116 4_201001215_20090502 4_200911244_20091102
Figure 44. Top Five Maximum Average Speed Transit Bus Surface Street Duty Cycles
0
5
10
15
20
25
30
35
0.00 200.00 400.00 600.00 800.00 1000.00 1200.00 1400.00 1600.00
Spe
ed
[mp
h]
Time [sec]
4_20091102 4_20091109
4_20091118 4_20091113
4_20091109
Figure 45. Bottom Five Maximum Average Speed Transit Bus Surface Street Duty Cycles

51
3.7 SAFETY SENSOR DATA
Beyond the standard duty cycle data collection system required for the MTDC project, additional sensors
were installed on three test vehicles (Class-7 combination delivery vehicles) to collect several safety-
related signals of interest to FMCSA. These additional sensors were provided through a partnership with
FMCSA. The real-time brake stroke, tire pressure, and weight information obtained from these sensors is
expected to make possible a number of safety-related analyses such as determining the frequency and
severity of braking events and tracking tire pressure changes over time. Because these signals are posted
to the vehicle’s data bus, they also have the potential to be read by on-board telematics solutions for
inclusion in other FMCSA efforts such as the Wireless Roadside Inspection (WRI) Safety Data Message
Set (SDMS). Due to the ―drop and hook‖ operation of the host carrier, instrumentation was not installed
on any of the carrier’s trailers. Although ORNL’s primary task was the collection of this data rather than
the performance of any analyses, a preliminary analysis of the safety sensor data was performed to
determine how the sensors had functioned during the data collection period and to explore the types of
information available from this expanded data set.
3.7.1 Findings from Safety Sensors
Each sensor provided useful information related to the duty cycle of the vehicle and/or the effectiveness
of the sensor. Unless otherwise specified, the following results are based on analysis of the data compiled
from all three test vehicles. This data represents approximately 45,000 miles of local delivery duty cycle
data.
3.7.1.1 Electronic Brake Stroke Monitoring System
Four brake stroke sensors were installed in each vehicle, one at each wheel-end of the tractor. The in-cab
unit provided the driver audible alerts of out-of-stroke conditions. In addition, a brake system pressure
transducer provided information about braking events in the duty cycle data. The brake stroke system
provided real-time status codes for each wheel position. A histogram of these codes is shown in Figure
46.
OK (Normal) Non-functioning Overstroke Dragging Sensor Error Not Available0
1000
2000
3000
4000
5000
Wheel-End Brake Stroke Code DistributionAll Combination Vehicles
Brake Stroke Code
Tim
e a
t S
pecifie
d B
rake C
ode (
hrs
)
Figure 46. Distribution of Brake Stroke Status Codes

52
From the time the systems were first installed, one sensor continually output a dragging brake code. The
manufacturer was not able to correct this error, and the team decided to proceed with the FOT with plans
to discard data from this sensor. This errant reading yielded to an overall error of 6% (for all three
vehicles).
The brake system pressure transducer provided information about the overall brake application pressure,
identifying braking events in the duty cycle data. The chart shown in Figure 47 illustrates the low
percentage of time the test vehicles were in engaged in braking events.
Not Braking89.8%
Braking10.2%
Proportion of Braking EventsAll MTDC Combination Vehicles
Figure 47. Proportion of Braking Events in MTDC Combination Vehicle Duty Cycles
Of interest to FMCSA is the frequency of hard braking events, characterized by higher brake application
pressures. The data collected in this FOT indicates that lower-pressure braking events were by far more
common than hard braking events. From the distribution of brake application pressure for this FOT
(Figure 48), it is evident that the brakes are nearly always applied at pressures below 30 psi.
0 20 40 60 80 1000
5
10
15
20
25
Brake System Pressure DistributionAll Combination Vehicles, MTDC FOT
Pressure (psi)
Tim
e a
t S
pecifie
d P
ressure
(hrs
)
Figure 48. Distribution of Brake Application Pressure for MTDC Combination Vehicles

53
The pressure signal provided by this sensor was reliable, with no detected problems. The time history of
this signal, taken in conjunction with the vehicle speed, can be used to examine specific braking events.
Figure 49 shows a 2,000-second section of duty cycle data from one of the test vehicles in which there
were several braking events. In this figure, it is apparent that significant decreases in vehicle speed (green
trace) are caused by braking events, indicated by increases in brake application pressure (blue trace).
0 500 1000 1500 20000
10
20
30
40
50
60
Example of Speed and Brake Application Pressure DataMTDC_2_20091202
Elapsed Time (sec)
Ve
hic
le S
pe
ed
(m
ph
)
0 500 1000 1500 20000
10
20
30
40
50
60
Bra
ke
Ap
plic
atio
n P
ressu
re (
psi)
Vehicle Speed
Brake Pressure
Figure 49. Sample Time History of Speed and Brake Application Pressure
3.7.1.2 Tire Pressure Monitoring System
The tire pressure monitoring system (TPMS) included a pressure/temperature sensor for each tractor tire
for a total of 6 sensors per vehicle. An in-cab display provided the driver with the temperature and
pressure for each tire and an audible alert for out-of-range values indicative of a problem (e.g., a tire with
low tire pressure). Because the partnering fleet checked the tire pressures weekly, no out-of-range values
were expected to be encountered except as a result of tire damage since the last air pressure check. The
distribution of tire pressure for one wheel-end of one of the test vehicles is shown in Figure 50. This
histogram indicates sensor values were in-range the majority of the time, although out-of-range values did
occur and several flags were set (Figure 51).

54
0 50 100 1500
50
100
150
200
250
300
350
Left Steer Tire Pressure DistributionCombination Vehicle #3, MTDC FOT
Pressure (psi)
Tim
e a
t S
pecifie
d P
ressure
(hrs
) Tire Set Pressure100 psi (cold)
Figure 50. Tire Pressure Distribution
When a tire pressure reading was outside the acceptable range as defined in Table 19, the TPMS
generated a corresponding error code for that tire (Figure 51). The driver investigated the error codes
generated but did not identify any problems during the course of the FOT. During this interval, the error
rate for the tire pressure monitoring systems’ alert codes represented more than 20% of the data collected.
Table 19. Pressure Ranges for TPMS Status Codes
Pressure Status Code Corresponding
Range
Extreme Over Pressure Over 145 psi
Over Pressure 125-145 psi
No Warning 75-125 psi
Under Pressure 50-75 psi
Extreme Under Pressure Below 50 psi

55
Extreme Under Under No Warning Over Extreme Over Error Not Available0
1000
2000
3000
4000
5000
6000
7000
Tire Pressure Code DistributionAll Combination Vehicles
Tire Pressure Code
Tim
e a
t S
pecifie
d P
ressure
(hrs
)
Figure 51. Distribution of Tire Pressure Threshold Detection Codes
Each tire pressure sensor also had temperature-reading capability. A histogram of this data is shown in
Figure 52.
0 50 100 150 200 2500
200
400
600
800
1000
1200
1400
Tire Temperature DistributionAll Combination Vehicles
Temperature (deg F)
Tim
e in T
em
p R
ange (
hrs
)
Figure 52. Tire Temperature Distribution
Researchers, drivers, and maintenance technicians reported a number of additional problems associated
with the TPMS throughout the FOT, such as nonfunctioning sensors, confusion of wheel-positions
reported, significant temperature differences between wheel positions at a given time, and discrepancies
between the in-cab display and the values which were reported on the data bus.

56
3.7.1.3 Vehicle Self-Weighing System
The self-weighing system reported drive and steer axle weights based on sensors in the vehicle’s air
suspension system. Although readings were taken continuously, the system was not designed for
accuracy while the vehicle was moving; ORNL has a preliminary algorithm to infer actual weights from
reported values on the instrumented axles (section 3.5). The reported weights are in the range expected for
class-7 vehicles (up to 12,000 and 20,000 lbs respectively) for the steer and drive axles (Figure 53 and
Figure 54), with very few out-of-range values reported. As expected, the drive axle weight readings were
fairly constant.
0 2000 4000 6000 8000 10000 12000 140000
200
400
600
800
1000
1200
Steer Axle Weight DistributionAll Combination Vehicles, MTDC FOT
Weight (lbs)
Tim
e a
t S
pecifie
d P
ressure
(hrs
)
Figure 53. Distribution of Steer Axle Weights
Although the fact that this system was not designed for accuracy while the vehicle was moving, unloaded
and loaded approximate weights can be identified in the drive axle group weight distribution shown in
Figure 54.

57
0 5000 10000 15000 20000 250000
100
200
300
400
500
600
Drive Axle Weight DistributionAll Combination Vehicles, MTDC FOT
Weight (lbs)
Tim
e a
t S
pecifie
d P
ressure
(hrs
)
Figure 54. Distribution of Drive Axle Weights
3.7.2 Implications for Research
3.7.2.1 Post-Processed vs. Real-Time Data
Due to the number of errors present in the brake stroke and tire pressure monitoring systems, this data
requires additional post-processing to filter out the errors before further analysis. This is not expected to
cause difficulty for non-real-time uses such as determining the number and severity of braking events in a
given duty cycle.
Although the vehicle self-weighing system was not designed to report accurate weights for a vehicle in
motion, streaming data from this system was sufficiently accurate to estimate loading (e.g., unladen,
medium load, fully laden). After completion of the weight prediction algorithm, post-processing could be
used to achieve more resolution from these signals.
Based on the errors in the tire pressure monitoring and brake stroke systems, post-processing based on an
interval of data is required before the data can be used. Real-time use of data from the self-weighing
system is suitable only for general estimates of the weight (e.g., as an indicator that the vehicle is lightly
laden). This limitation does not preclude the near-real-time uses involving on-board processing.
3.7.2.3 Specific Applications of Data
The positive results obtained from the brake application pressure sensors have led to follow-on research
in FY2011 for ORNL in FMCSA’s Real-Time Dynamic Brake Assessment project. This effort will build
on the sensor work done in the Part 1 MTDC FOT, using a modified brake application pressure sensor on
one of the instrumented vehicles to further study low-pressure braking events. This proof-of-concept
testing will examine the feasibility of an on-board brake assessment tool based on real-world driving data,
such the braking event shown in Figure 55.

58
0 10 20 30 40 50 600
10
20
30
40
Selected Braking EventMTDC_2_20091214
Elapsed Time (sec)
Ve
hic
le S
pe
ed
(m
ph
)
0 10 20 30 40 50 600
10
20
30
40
Bra
ke
Ap
plic
atio
n P
ressu
re (
psi)
Vehicle Speed
Brake Pressure
Figure 55. Selected Braking Event
Because all the safety sensors studied posted data to the vehicle’s data bus, and therefore have the
potential to be read by any on-board system, one potential use of the data involves inclusion in the SDMS
for FMCSA’s WRI program. While these sensors can provide valuable advisory information, it is
recommended that at this stage such safety sensors not be used to flag WRI test vehicles for further
inspection for several reasons:
―False alarms‖ and sensor errors were consistently present in one of the brake stroke monitoring
systems.
There were a number of errors and discrepancies between the in-cab and data bus reported
readings for the tire pressure monitoring system data.
The self-weighing system for static weights was designed for static weighing on level ground
with the brake released, not over-the-road, instantaneous weight measurements.

59
4. LESSONS LEARNED
The lessons learned in the Part 1 MTDC FOT data collection and analysis period were varied. Some
lessons learned involved successful improvements over the previous HTDC work. Other lessons learned
were immediately incorporated into the testing protocols being employed at the time, and allowed for
more productive and efficient research and data collection. An additional category of lessons learned
were of a nature that did not allow for more immediate or short-term adaption, but could be addressed in
the Part 2 MTDC FOT or other future research.
4.1 IMPROVEMENTS FROM HTDC
Several changes were made to the data collection methodology based on lessons learned from previous
duty cycle work such as the HTDC Project. Some improvements or lessons learned were not under the
direct control of the project team but were a result of the nature of medium-truck operations for the
vocations studied.
4.1.1 Modifications to Data Acquisition System
A key improvement to the DASs for the Part 1 MTDC FOT was the inclusion of a cellular modem to
facilitate remote data transfers. However, upon implementation of this methodology, a number of
additional benefits became apparent. Not only did this additional equipment make possible the automated
retrieval of data from the test vehicles (greatly reducing the need for research staff to be involved in the
day-to-day FOT operations), but it allowed the retrieval to be done more frequently. Because the data
retrieval software was integrated with an automated error-checking routine, this led to much quicker error
detection and response.
Because of the problems involved in the repurposing of weather stations for vehicle use as was done in
the HTDC work, no weather station was installed on the test vehicles. Instead, ORNL worked with
technicians at the partners’ respective shops to make a connection to the vehicle’s wipers. This allowed
basic weather information regarding precipitation to be collected without the installation of any additional
equipment. In addition, temperature measurements were read from the test vehicle’s data bus, where
available.
To streamline the installation, the DAS wiring was improved. Bulkhead connectors were installed in the
DAS’s case to make possible the separate installation of the cabling. The mating connectors were
incorporated into pre-made cabling which was given to the partners for installation by their technicians.
4.1.2 Coordination with Fleet Partners
One problem occasionally encountered in the HTDC FOT was the limited availability of the test vehicles
for data download and correction of minor sensor problems. Medium truck operations typically run on a
more predictable schedule, making visits to correct equipment more easily scheduled. In addition, ORNL
was able to interface with a main point of contact in each of the partners’ shops to check on equipment
and coordinate visits. This led to reduced down-time and loss of data due to easily-corrected sensor
problems. In addition, ORNL partnered with fleets in the local area rather than those more than an hour
away, as was the case in the HTDC efforts; this resulted greatly reduced travel times when such visits
were needed.
In the HTDC project, both tractors and trailers were instrumented with the Air-Weigh self-weighing unit.
Although the fleet management indicated they would attempt to see that instrumented tractors and trailers

60
were mated as often as possible, this proved impractical for their drop-and-hook operation.
Consequently, only a small percentage of the data collected involved an instrumented trailer. Because the
delivery fleet partner used a drop-and-hook operation, a decision was made not to direct resources toward
the instrumentation of any trailers due to the small amount of additional data that would be available in
their operation.
As a result of the lessons learned from the HTDC, ORNL was able to work better with the fleet partners,
not expecting any departure from their standard operating procedures. For example, ORNL discussed
standard procedures with fleets prior to instrumentation to prevent damage to the GPS antennas due to
pressure-washing. Certified weight information was obtained by coordinating planned trips to inspection
stations to obtain weigh tickets for the weight estimation model. In addition, rather than attempting a
long-term collection of fuel tickets for calibration of the fuel model (which proved unsuccessful in the
HTDC efforts), a short-term study was performed with driver incentives for participation during the one-
month period. This methodology proved successful, providing the necessary data with high accuracy.
4.2 PLANNING FOR PART 2 OF THE MTDC EFFORT
Although the method of making vehicle connections was a significant improvement over that used in
HTDC, the partner technicians frequently had to make several different connections to a few contact
points to accommodate the additional sensors installed. As a result, wires would occasionally become
disconnected and have to be replaced. To correct this problem, a single Data Acquisition System
Interface Box (DASIB) will be constructed for each vehicle. This will allow a single connection to be
made to each key point in the vehicle (data bus, power, etc.). Mating connectors will be made so that
additional sensors can interface to the DASIB, which can be configured as necessary to accommodate
different types of sensors.
Technical difficulties were encountered with the VBOX GPS unit, particularly with the combination
vehicles. Due to the inability of the systems to maintain satellite lock for long periods of time, the units
frequently had to be manually reset or ―cold started,‖ approximately once every few weeks. Because the
channels were checked each time the data was uploaded, this problem was identified and corrected soon
after the problem occurred, resulting in a minimal loss of data. Corrective actions included replacing the
GPS antenna, ensuring that the units were not subjected to frequent power cycles and ultimately sending
the units in for repair. When these failed to determine a cause of the frequent problem, the decision was
made to explore other 5 Hz GPS solutions compatible with the eDAQ-lite. HBM, the manufacturer of the
eDAQ-lite, now produces a layer with a built-in GPS of the needed resolution. This layer was tested with
the DASs and found to be comparable to the VBOX; this layer will be installed in all of the DASs for the
Part 2 MTDC FOT, and the VBOX units were removed from the DASs.
4.3 ADDITIONAL LESSONS LEARNED
During the Part 1 MTDC FOT, the majority of the equipment functioned as expected. Preliminary testing
of each DAS allowed most of the problems to be discovered and resolved before initiation of the FOT.
The problems which were not foreseen during the early stages of the testing involved the long-term nature
of the project which could not be practically simulated prior to the start of the FOT.
In order for the data to be retrieved remotely, the DAS had to be powered up; for this remote upload to
take place on a regular basis, the DAS had to be left on at all times. However, this resulted in frequent
problems with draining of the vehicle’s battery. To correct this problem, digital timers were installed to
―wake‖ the system at scheduled data upload times during the night and also to ensure the systems were on
at a scheduled time during the day in the event of the occasional problem with the automated process.

61
This solution proved successful in both eliminating the battery problems for the fleet partner and making
the vehicles available for remote access.
Toward the beginning of the Part 1 MTDC FOT, the combination vehicles were experiencing problems
due to an unavoidable drop in voltage when the engine started. Following the recommendation of the
fleet partner’s shop manager, a capacitor was installed to provide a more constant voltage during the brief
startup period. This solution proved successful, and although this problem had not yet been encountered
on all the vehicles, capacitors were also installed on the remainder of the test vehicles to avoid this
problem.
The time required to install the safety sensors was longer than expected, inconveniencing the partners and
impacting fleet operations. Although the partners were willing to accommodate by continuing to allow
the sensor technicians to use their shop and rearrange their delivery schedules, future installations should
be better understood to minimize the impact to the partners.
The particular tire pressure monitoring system selected for this program proved problematic in some
instances. Personnel from the partnering fleet reported false alarms and the occasional unresponsive
sensor. Additionally, the values reported on the data bus were found to not always agree with the in-cab
display.
The complexity of the DAS meant that equipment issues typically resulted in slightly long delays as these
problems were corrected in accordance with standard procedures characteristic of a national lab (working
through telecommunications and/or procurement departments). Although the budget for this project did
not support the purchase of a complete spare system in the event of failures, the construction of such a
spare may prove cost-effective for future projects where unanticipated delays of 1-6 weeks are
unacceptable.

62
5. SUMMARY OF RESULTS/CONCLUSIONS
In this part of the MTDC project, three Class-7 tractors from the H.T. Hackney fleet and three transit
buses from the KAT were instrumented and over 70 channels of data were collected for over a one-year
period of time at a rate of 5 Hz. The data gathered in this project included information such as
instantaneous fuel rate, engine speed, gear ratio, vehicle speed, and other information read from the
vehicle’s data bus; spatial information (latitude, longitude, altitude) acquired from a GPS device; and
instantaneous tractor (for the combination trucks) and bus weight obtained from devices mounted on the
six participating vehicles. Some of the vehicles were also mounted with safety sensors providing brake
and tire information in partnership with FMCSA, yielding valuable information to support related
research efforts. During the one-year data collection period, the six participating vehicles logged over
95,000 miles (45,400 for the combination trucks and 49,400 for the transit buses) and consumed over
17,000 gallons of fuel (6,000 for the combination trucks and 11,300 for the transit buses), while
conducting business in the East Tennessee area. Use of the test vehicles, and costs related to fuel, driver’s
time, insurance, and the use of fleet partner’s facilities for vehicle instrumentation and DAS maintenance
were provided gratis to this project. In addition, the data gathered from the FMCSA brake and tire
systems are available to ORNL and DOE at no additional cost. These partnerships represent a significant
cost savings to DOE, and made possible the collection of real-world-based operational data for medium
trucks.
For the combination trucks, the largest proportion of idling time (61%) and fuel consumed (50%) while
idling correspond to idling intervals that lasted between 0 and 5 minutes (i.e., traffic congestion and delay
at traffic signals). This is followed by intervals of 5 to 10 minutes of idling time (25% of idling time and
25% total fuel consumed while idling), and by the 15 to 60 minute time interval. The latter involves
mostly idling while stopping for a delivery. The 180 to 240 minute interval is proportionally low in terms
of idling time (1.5%) but ranks third (12%) in terms of fuel consumed while idling. The transit buses also
spent most of their idling time (31%) in congestion and bus dwelling stops (0 to 5 minute idling interval)
which also consumes the largest proportion of fuel spent while idling. However, as opposed to the
combination trucks, the transit buses spent 26% of their idling time in intervals that are longer than 4
hours, also consuming about 26% of the fuel spent while idling. These large idling times were observed
mostly at the parking lot while the vehicles were waiting to start a trip and are currently being addressed
by KAT to reduce fuel usage.
Prior to using the fuel data available from the data bus, a short-term study was performed to ensure that
the source of this information provided an accurate representation of fuel usage. After that study was
conducted with the results showing a high accuracy in the fuel information provided by the vehicle data
bus, the data collected in the project was used to compute the overall fuel efficiencies; that is, the fuel
efficiencies computed by taking into consideration idling times, as well as the moving fuel efficiencies
(i.e., fuel consumed only when the vehicle was moving) of combination trucks and transit buses were
computed. For the transit buses the percentage difference between overall and moving FEs is much
higher (between 10 and 20 times higher) than that of the combination trucks. Some of this difference can
be attributed to differences in duty cycles and drivetrains, but most is due to idling. While the total miles
traveled by the two sets of vehicles during the year-long project is almost the same, just less than 10%
larger for the transit buses than for the combination trucks, the former consumed almost 20 times more
fuel than the latter while idling. Using the moving FE information, it is possible to see the FE of the two
types of vehicles is very different, being almost 40% higher for the combination trucks than for the transit
buses.
One very important variable affecting the fuel efficiency of any vehicle is its payload level. Based on
vehicle weight data collected at commercial scales (i.e., Inspection Stations in Knox County, Tennessee),

63
ORNL developed a model that predicted the trailer weight based on the tractor weight provided by the
Air-Weigh device. This model was used to assign trailer weight to each one of the records in the database
of information collected in this project. For the transit buses, the deployed Air-Weigh devices provided
weight information for the entire vehicle, and therefore it was not necessary to develop a payload
estimation model in this case.
For the combination trucks, the vehicle weight was divided into four categories: 1) Tractor with Empty
Trailer, 2) Light Load (total vehicle weight between 27,000 lbs and 31,999 lbs); 3) Medium Load (total
vehicle weight between 32,000 lbs and 37,999 lbs); and 4) Heavy Load (total vehicle weight above
38,000 lbs). In the case of the transit buses, the vehicle weight was divided into three categories: 1)
Empty Bus (vehicle weight less than 22,500 lbs), 2) Light Fare (total vehicle weight between 22,500 lbs
and 25,499 lbs); and 3) Heavy Fare (total vehicle weight above 25,500 lbs).
On average, the combination trucks weighted between 27,700 lbs to 29,000 lbs and the buses between
23,000 lbs and 23,800 lbs. Very few trips with a tractor and empty trailer were observed. Most of the
trips for vehicle 2 (98%) were at a light or medium load, while for vehicle 3, almost 70% of the trips were
at the medium and high level loads. Transit Buses 2 and 3 (i.e., vehicles 5 and 6) operated almost 90% of
the time with a light fare. Transit Bus 3 also had the largest average weight, indicating that this was the
vehicle that carried the largest number of passengers (on average). Transit Bus 1 (i.e., vehicle 4), on the
other hand, spent almost 30% of the time at an empty level. This was mostly due to idling at the parking
garage. Transit Bus 1 had the lowest overall FE out of the three buses.
To generate the distribution of fuel efficiency under the payload levels described above, 10-mile segments
were considered for which the fuel efficiency was computed and counted as one observation. Overall,
and as expected, the FE decreases as the payload increases for the combination trucks. However, because
the payload categories are very narrow and low (those combination trucks never made any trips that were
above 42,000 lbs, far below the legal weight limit for Class-7 trucks), the variation of the FE is not
significant. In the case of the Transit Buses, the relationship between FE and vehicle weight is not as it
would be predicted (i.e., decreasing FE with increasing payload). This is due to several factors. First,
when the vehicle is empty (lowest payload) it spends a considerable amount time idling. This results in
very low FEs for this load-level category. At the other end of the spectrum, the highway routes (express
routes) are the ones that carry the largest number of passengers. The buses on these routes spent very
little dwelling time (there are fewer bus stops) and also encounter the least number of traffic lights. This
results in FEs that are higher than regular surface street routes (light fare) that have many more stops (bus
stops and traffic signals).
The data collected in this project was also used to investigate the variability that may exist in duty cycles
that are generated by the same vocation and that follow the same route. In order to do this, two sets of
duty cycles collected from the data gathered by the transit buses were identified. The first set focused on
freeway duty cycles. A 19 km segment of Westbound I-40 in Knoxville, Tennessee was selected and the
corresponding duty cycles extracted from the database. The duration of the 74 highway duty cycles
ranged from 10.5 minutes to 27.6 minutes with an average duration of 12.6 minutes and a standard
deviation of 2.71 minutes.
In order to analyze surface-street transit duty cycles, a 4.9 km loop in downtown Knoxville, Tennessee
was selected and the corresponding duty cycles extracted from the database. Thirty-eight surface street
duty cycles with the characteristics described above were selected. The duration of the duty cycles
ranged from 10.9 minutes to 22.8 minutes with an average duration of 18.4 minutes and a standard
deviation of 3.29 minutes.

64
This variability of the duty cycles within a given category (i.e., freeway or surface street duty cycles)
could be measured by the ratio of the standard deviation of the distribution of duty cycle duration over the
mean of that distribution. For the 74 duty cycles this ratio is 0.214 (i.e., 2.71 minutes/12.7 minutes). For
the five top and five bottom duty cycles –ranked using the average speed of the duty cycle– the variability
was computed at 0.06 and 0.357, respectively. When they were combined (i.e., in ten duty cycles) the
variability increased to 0.402. In the same way, the 38 surface street duty cycles had a ratio equal to
0.179 (i.e., 3.29 minutes/18.4 minutes). For the five top and five bottom duty cycles, the variability was
computed at 0.134 and 0.262, respectively. When they were combined (i.e., in ten duty cycles) the
variability increased to 0.308. Using this measure, the highway duty cycles presented a higher variability
than the surface street duty cycles.

65
6. REMAINING MTDC TASKS
Due to the number of vocations represented in medium trucks, the MTDC data collection effort is divided
into two parts. In addition to a second phase of data collection, a number of related tasks will be
completed in the Part 2 MTDC efforts.
6.1 DATA ACQUISITION SYSTEM MODIFICATIONS
In preparation for the Part 2 MTDC FOT, the DAS will be updated to include a different GPS sensor and
to incorporate a DASIB, in accordance with the lessons learned. In addition, the maker of the eDAQ-lite
and its associated software has transitioned to a new file format which provides additional flexibility in
data retrieval. The DASs and ORNL-developed data retrieval and processing software will be
transitioned to this new ―SIE‖ (file descriptor assigned by HBM/SoMat) format to take advantage of these
additional features beginning with the Part 2 MTDC effort.
6.2 PART 2 MTDC FOT AND DATA ANALYSIS
The Part 2 MTDC FOT will continue the medium truck data collection effort with a focus on the utility
and towing/recovery vocations. The 12 months of data collected during this second FOT will be analyzed
to examine the effect of PTO on energy efficiency; in addition, similar data analyses to the ones
conducted in this phase of the project will be performed. These will include studies on the effect of
vehicle payload, as well as the effects of grade and speed on fuel efficiency. A study on duty cycle
variability of the new two vocations and compared to the variability observed in transit bus and
combination truck duty cycles.
6.3 DUTY CYCLE GENERATION TOOL
The DCGenT is an ORNL/CTA-developed software tool which allows the user to generate a synthetic but
characteristic duty cycle from a set of real-world duty cycle segments. The synthetic duty cycle produced
will have similar speed, acceleration, and idling characteristics as the original segments but with the
overall duration determined by the user. The DCGenT will make use of a custom data selection tool to
allow the user to select the criteria for the segments of source data. This allows the user to generate and
analyze duty cycles for various combinations of driving conditions such as load, weather, grade, and
congestion.
The DCGenT tasks to be completed during Part 2 of the MTDC effort include improvements to the tool
as well as an expansion of the tool to include the ability to read additional data sets. The tool will be
migrated from the original LabView application to a more user-friendly MATLAB-based tool with an
improved user interface. The data collected during the MTDC FOT will be added to the existing
database, making possible analysis of local delivery and urban transit data in addition to the heavy-truck
long-haul data collected in the HTDC effort. These changes will be implemented in the March 2011
version of the software. Following the completion of the Part 2 MTDC FOT, data from utility and
towing/recovery vehicles will also be included in the tool. A user’s guide will also be created, providing
an explanation of parameters and options, along with several examples of typical uses of the DCGenT.
6.4 FINAL REPORT
A final report will be prepared which describes the full MTDC program (i.e., Parts 1 and 2) including
background information, partnerships, and data collection methodology. The test vehicles used in each
part of the FOT will be described, and analysis of the collected data will be performed to obtain general

66
statistics about each vocation with a focus on fuel efficiency. The report will also include key
information such as lessons learned and recommended future research.

MTDC Interim Report Revision Log
Revision
Number Document ID Description of Change
Change Effective
Date
0 0 Initial outline 3 Jun 2010
1 0.1 Added general/intro material 17 Aug 2010
2 0.2 Converted to .docx 20 Sep 2010
3 0.3 Additional sections of text 21 Sep 2010
4 0.4 Added data analysis 4 Oct 2010
5 1.0 Completed draft 6 Oct 2010
6 1.1 Comments from ags 20 Oct 2010
7 1.2 Comments from gjc 25 Oct 2010
8 1.3 Addressed comments, minor edits 2 Nov 2010
9 1.4 Comments from hek 10 Nov 2010
10 1.5 Addressed comments, minor edits 19 Nov 2010
11 2.0 Revision complete 19 Dec 2010
12 2.1 Second set of comments from hek 3 Jan 2010
12 2.2 Final draft 5 Jan 2010