meet at the interface 'beet quality' and 'sugar processing'€¦ · meet at the...
TRANSCRIPT
Tiense Suikerraffinaderij n.v. Belgium
MEET AT THE INTERFACE 'BEET QUALITY' AND 'SUGAR PROCESSING'
Basic beet quality: Sugar content and extractible sugar
M. L. Willems I. Dewaele
ASSBT - II RB Joint Meeting San Antonio, Texas USA
February 27,2003
159
ABSTRACT
The logical consequence of the increase of thick ju ice purity by more than 2.5 units over the past 12 years should be a proportional increase in productivity and a decrease of production costs. Reality, admittedly, is not quite so straightforward. Field observations related to the chemical quality of the beets suggest that, in order to avoid unbalanced operational decisions and to further reduce processing costs, the sugar content in beets and juices must be supported in the future by analy1ical measurements that give a more accurate measure of the real sucrose content than polarisation. In addition, evidence is found that the ionic balance, together with the alkalinity, is clearly connected with tlTe pH and buffer capacity of thick juice, characteristics that determine to a high extend its capability of crystallisation. Beet researchers should therefore consider more notions such as the 'Ionic balance' as a selection criterion for beet varieties in order to guarantee optimal processing conditions in the crystallisation.
Introduction
The production of sugar depends on the agronomical quality of the sugar beet. It is therefore extremely important that the raw material is of the best possible quality so as to (be able to) avoid later costs in the production process. Quality beets must have the highest possible sugar content with maximum extractability. The consequence is that the content of molassogenic elements (potassium, sodium, amino-nitrogen) must be as low as possible. However, too less notice is taken of maintaining a good equilibrium between those elements. The example out of the praxis explained in this paper shows that such equilibrium is of a major importance to reduce processing costs. The example discussed in this article illustrate the importance of the call for an integrated approach 1 to the sugar beet, from beet researcher to agronomist, process technologist and production managers. The most efficient progress is that which is based on a balanced appraisal of all the relevant factors. In the case of beets this involves the cost of cultivation and the losses in the field , plus the production cost for a given quantity of white sugar of the required quality, plus production losses.
Basic quality of the beet: beyond sugar content and extractable sugar
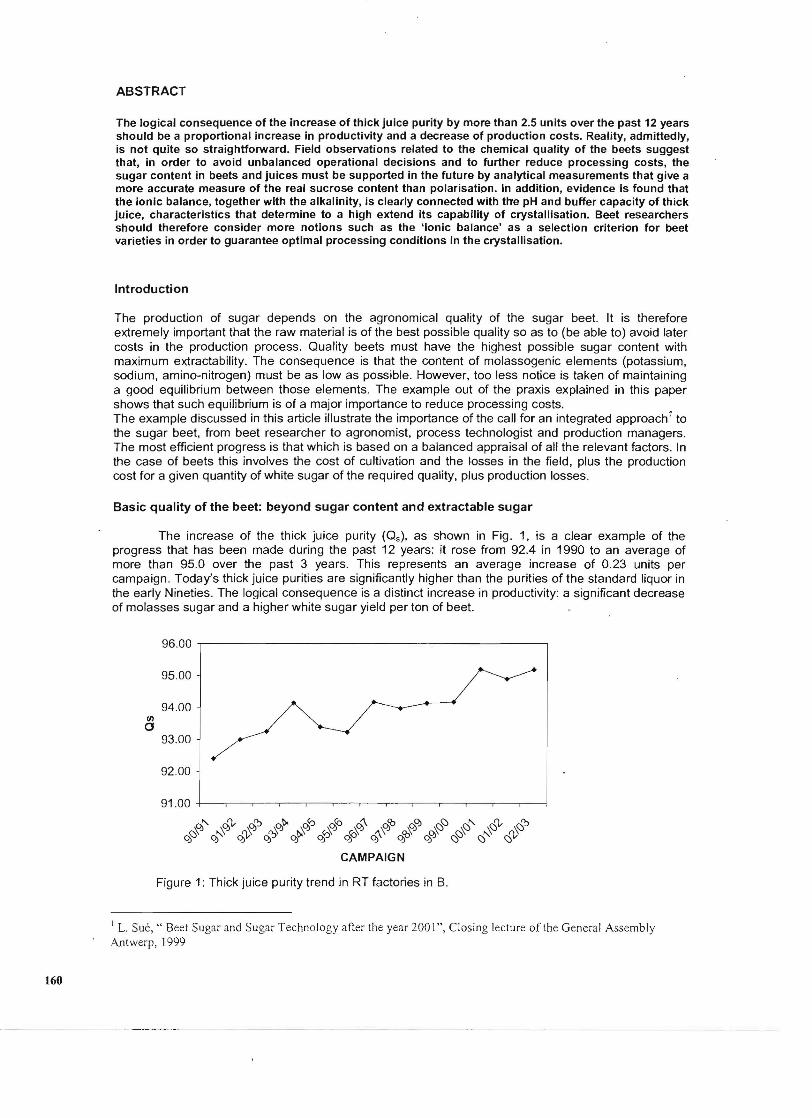
The increase of the thick juice purity (Qs ), as shown in Fig . 1, is a clear example of the progress that has been made during the past 12 years: it rose from 92.4 in 1990 to an average of more than 95.0 over the past 3 years. This represents an average increase of 0.23 units per campaign . Today's thick juice purities are significantly higher than the purities of the standard liquor in the early Nineties. The logical consequence is a distinct increase in productivity: a significant decrease of molasses sugar and a higher white sugar yield per ton of beet.
96 .00
95.00
94.00 II)
0 93 .00
92 .00
91.00
Figure 1: Thick juice purity trend in RT factories in B.
I L. Sue, " Bee t Sugar and Sugar Techno logy after the year 200 I", C los ing lecture of the General Assembly Antwerp , 1999
160
Multivariate analysis2 suggests that this increase in thick juice purity is to a large extent codetermined by the evolution of the conventional beet parameters such as polarization (pol), sodium (Na), potassium (K) and amino-nitrogen (aN). For more detailed information on multivariate analysis reference should be made to Appendix 1. In the case in Fig. 1, 76% of the variance can be explained by these parameters. The extent to which beet selection, climate, manuring or fertilization, etc influence these parameters is sufficiently well known. However, thorough analysis of operational field observations reveals a more differentiated picture, with the necessary ·-orange traffic lights that agronomists, process technologists or production operators must take into account in an integrated manner.
The sugar content. The sugar content is largely influenced by the cultivation technique (manure, fertilizer, etc.), crop and weather conditions. There are very good technical reasons for producing the richest possible beets. Higher sugar contents entail lower transport costs per ton of sugar and require less processing capacity or fewer factories to produce a given quantity of sugar for example. Table 1 illustrates the effect on the transport cost assuming a sugar yield of 90,6%.
'Yo sugar pol
'Yo extractable
tons of sugar beet for 500000 tons of
'Yo Transport cos
sugar sugar
15.50 14.05 3.559.511 1oo.oo'Yo
16.00 14.50 3.448.276 96.88'Yo
16 .50 14.95 3.343.783 93.94'Yo
17.00 15.41 3.245.436 91.18'Yo
17.50 15.86 3.152.709 88.57'Yo
18.00 16.31 3.065.134 86.11 'Yo
18.50 16.77 2.982.293 83.78'Yo
Table 1: Transport cost in relation to sugar content.
Reality, admittedly, is not quite so straightforward. Sucrose determination by polarization may be misleading, as there can exist important differences between the polarization value and the sucrose content obtained e.g. with HPLC. These differences are observed in the sugar content determination of the beet and in determination of the sugar content of the thick juice, intermediate syrups and molasses. They vary from year to year and from factory to factory. Table 2 shows the range for average differences recorded in different campaigns over different factories. They tend on average to increase from the beginning to the end of the campaign. .
Polarization - sucrose Sugar beets 0.09 - 0.45 Thick juice -0.2-1.8
B-syrup 0.2 - 0.85 Molasses 0.1 - 2.8
Table 2: Range for differences found between polanzatlon and sucrose determination using HPLC
The impact on the real purchase price of the beets and a variety of operational parameters that directly influence the white sugar yield is considerable. As an example: beets polarising between 17.0 and 17.50, an increase by 0.1 of the difference between the polarisation value and the real sucrose content would be equivalent to a 0.5% increase in transport cost (table 2); the cost price of the beets in Belgium would increase by 0.9% and a factory of 10000 ton of daily slicing capacity would require 2 extra days of production. The differences observed in thick juice and B syrups influence the apparent purities in crystallization, which for example may result in problems with over-saturation and final sugar
2 For more detailed information on multivariant analysis reference should be made to Appendix I.
.-161

quality. The authors also found indications that high differences noted in the beet may lead to significant overestimation of the output that might induce unbalanced strategic decisions.
The problem of this difference is not unknown: strictly speaking, polarization values are valid only for measurements in solutions in which sucrose is the only optically active component. This condition is not satisfied in practice. This raises the question as to whether 'polarimetry' is, in fact, the appropriate method not only for the sugar assessment in the beets, but also for process optimisation. If, for example, the polarization-to-sucrose ratio in research for better varieties increases, then the difference between the apparent value of the sugar beet and its real technological value, or its productivity value if you will, likewise increases (ceteris paribus). The continued use of polarization values is thus one of the aforementioned orange lights.
Technological evaluation of the quality of the beets must therefore be better supported in the future by analytical measurements that give an accurate measure of the real sucrose content. Chromatographic techniques such as HPLC and NIR may usefully be considered. The problem with NIR is that analytical calibration tests always refer to polarization values3 and not to the real sucrose content. Re-orientation of such activities would do the sector a great service, because they would then be able to make a contribution to a more correct business economics approach, for example in the balance that must be sought between, one, profit through less transport and better utilization of production capacity and, two, the purchase price of the sugar in the beet.
Potassium, sodium and amino-No Besides the thick juice purity emphasis must also be laid on the importance of the pH and the buffer capacity of the thick juice. Since the early Nineties, high pH values have been noted in different RT production factories for thick juice and standard liquor which , without sulphitation, can easily lead to pH values of more than 10 4. Initially, the reaction of the production operators was to stop the soda dosing in the juice purification and increase sulphitation in order to obtain acceptable pH values (pH ± 8.6 in A massecuite to pH = 8.0 in molasses) in the crystallization. Higher values lead to a substantial decrease of the crystallization outputs, which gradually become more apparent from the A massecuite to the molasses exhaustion. Regarding the molasses, reduced exhaustion could account for up to 1.5 purity points at that time. Anyone confronted with decreased crystallization output also has to contend with , e.g., increased energy costs as a result of the increase of recirculation flows. A number of side-effects were also noted. Increased sulphitation in the juice purification and in the thick juice results not only in a substantially higher cost for processing aids, a necessary additional cost that must reduce the loss of profit due to decreased outputs. The quality risk through the increase of S02 in sugar and molasses are not to be underestimated either. In fact, the permitted S02 content in sugar is limited today to a maximum of 10 ppm 5 because of the allergenic effect. Many client requirements are set lower. However, the fermentation industry, esp. the yeast industry, limits the S02 content in molasses to a maximum of 300 ppm. Today, the RT production plants still work under acidification. Besides sulphitation of the thin juice before evaporation, the thick juice, the standard liquor and even on occasion the B syrup undergo additional acidification with H2S04 . Similar phenomena have now been reported in the Netherlands.
The literature has little to say about the phenomenon as such. However, it is generally supposed that the pH changes during evaporation are the result of the molar ratio of total NH3 to total CO2 and the initial pH value of the thin juice. According to de Bruijn (1988)6, the release of protons and alkali is counterbalanced when this ratio amounts to 1.2 at pH2o=8.5 or 1.6 at pH2o=9.0. Alkali must be added if the ratio is lower; if the ratio is higher, pH will rise and acid dosing may be considered. Besides the process conditions, the amide content of the beet. more particularly glutamine and asparagine, largely determines the NH3 content of the thin juice. This naturally establishes a direct link to the quality of the beets. The final pH change depends on the buffer capacity of the juice. This in turn is determined by the composition of the ash content and the amino acids presene.
J Roggo, Y. ; Duponchel, L.; Noe, B.; Huvenne, 1.-P. : 1. Near Infrared Spectrosc. (2002), 10, 137- 150 4 Will ems, M.; Waegeneers, R. : CITS - Meeting of the Sc ientific Committee (Warsaw), 1994 5 EU Di rective on Mi scellaneous Additives 98/72 /EC 6 de Bru ij n, 1.M. (1988): Meeting of the Scientific Commi ttee of CITS, Malmo 7 Van dcr Poel , P. W.; Schi weck, H.; Schwartz, T. ( 1998): Sugar Technology. Dr. Albert Bartens, Berl in, 98 1
162
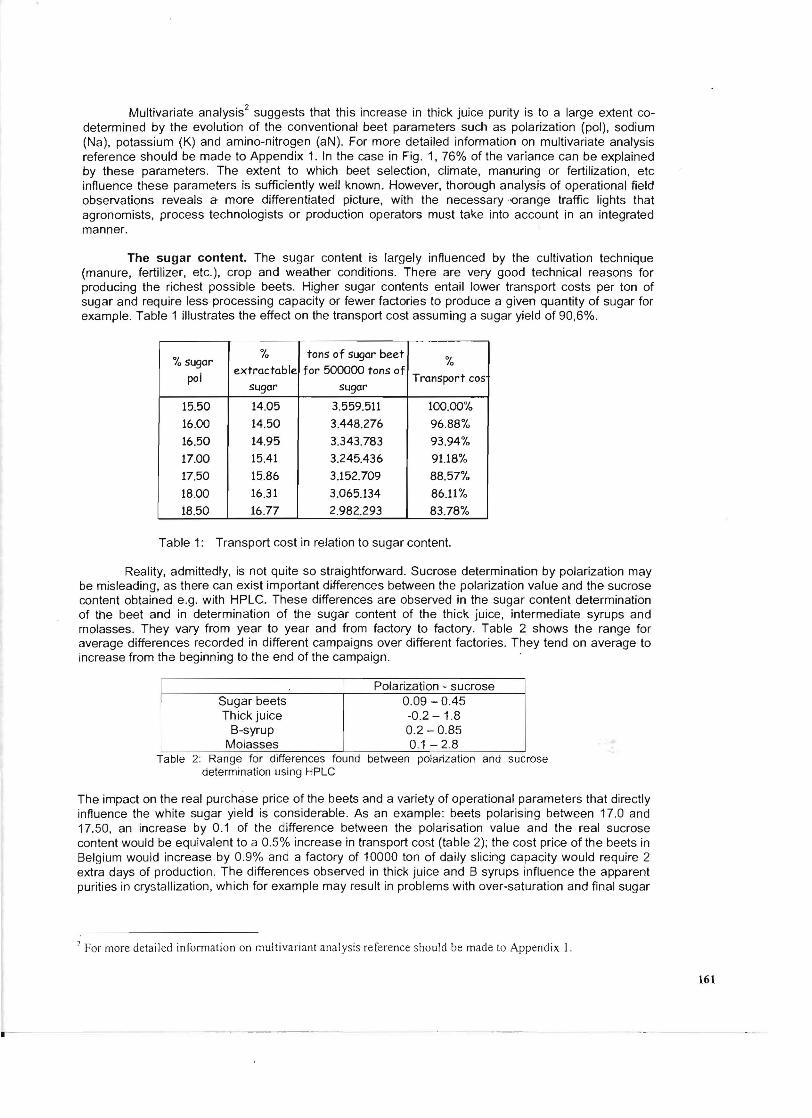
Industrially the importance of pH and buffer capacity for the crystallization output and thus also the kinetics is once again clearly illustrated by the evolution of the purity of the molasses according to the quantity of sulphuric acid dosed in the sugar refinery in Tienen. Fig. 2 clearly shows that the molasses is more readily exhausted as more sulphuric acid is dosed into the thick juice processed before crystallization. The question thus arises as to the relevance of the pH of the thick juice, the buffer capacity and the quality of the beets.
Besides the NH:y'C02 ratio, the 'ion balance' (W'IB)o introduced in 1993 by Burba and Schiweck8
as a basis of a new concept of quality assessment, suggests itself as~m interesting concept with regard to the problem of the pH of the thick juice: '
W'IB = 0.92 W '(K+Na)oB - (0.57 W'n-NoB + 1.9 W'lnoB +2.9) Eq.1
(W'(K+Na).B potassium + sodium content, W'n.N oB amino-nitrogen content, 1.9 W'ln .B invert sugar content in mmol/100 g beet).
In case the invert sugar analyses are not available, it can be substituted by its average content, such as, e.g ., 0.1w%w on beet in normal conditions. This simplifies equation 1 to a more practical form (Eq.2):
59,5~--------------------------------------~
59,0
>- 58,5..... ';:: g, 58,0 VI CI> VI
57,5 VI IU (5
57,0
:E 56,5
56,0 • 55,5
0 10000 20000 30000 40000 50000
H2S04 (kg at 37,5 w%w)
Figure 2: Effect of the acidification of thick juice on the purity of molasses (experiment campaign 2000)
W'IB =0.92 W'(K+Na)oB - (0.57 W 'n-NoB + 4.0) Eq.2
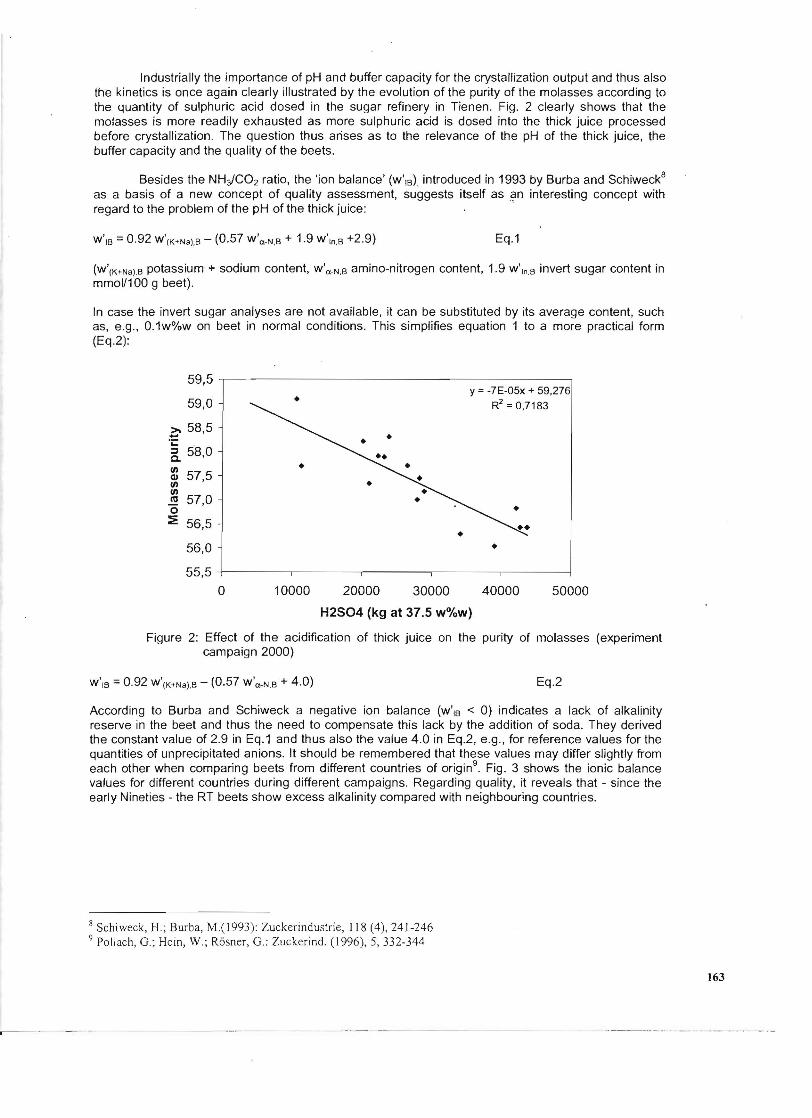
According to Burba and Schiweck a negative ion balance (W'IB < 0) indicates a lack of alkalinity reserve in the beet and thus the need to compensate this lack by the addition of soda. They derived the constant value of 2.9 in Eq.1 and thus also the value 4 .0 in Eq.2, e.g., for reference values for the quantities of unprecipitated anions. It should be remembered that these values may differ slightly from each other when comparing beets from different countries of origin9
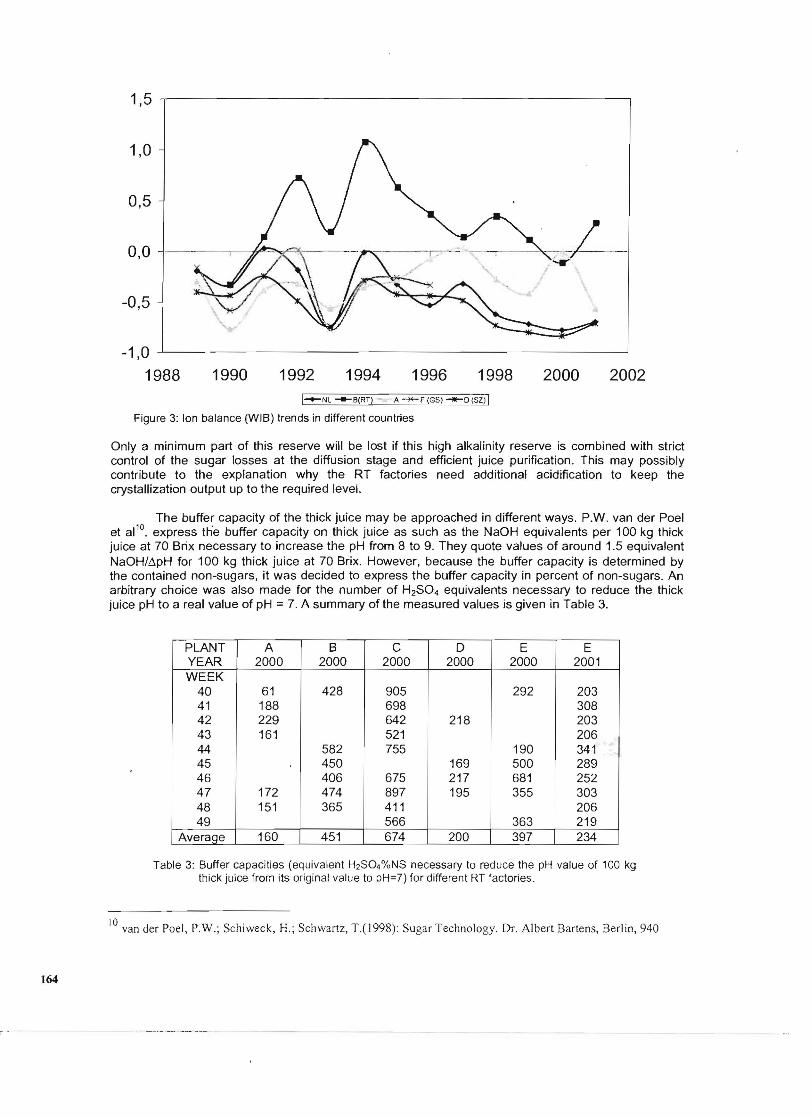
. Fig. 3 shows the ionic balance values for different countries during different campaigns. Regarding quality, it reveals that - since the early Nineties - the RT beets show excess alkalinity compared with neighbouring countries.
•
•
• •
•
y = -7E-05x + 59,276 R2 =0,7183
•
8 Schiweck, H. ; Burba, M. ( 1993): Zuckerindustrie, 11 8 (4), 241-246 9 Po ll ach, G.; Hein, \Y.; Rosner, G.: Zuckerind. (1996), 5, 332-344
"- - '
163
1,5 ~----------------------------------------------------------~
1,0
0,5
0,0 ------r~~
-0,5
-1,0
1988 1990 1992 1994 1996 1998 2000 2002 I----NL ........ B(RT) - A -*""F (GS) --D(Sl) I
Figure 3: Ion balance (WIB) trends in different countries
Only a minimum part of this reserve will be lost if this high alkalinity reserve is combined with strict control of the sugar losses at the diffusion stage and efficient juice purification. This may possibly contribute to the explanation why the RT factories need additional acidification to keep the crystallization output up to the required level.
The buffer capacity of the thick juice may be approached in different ways. P.W. van der Poel et aI 10
• express th'e buffer capacity on thick juice as such as the NaOH equivalents per 100 kg thick juice at 70 Brix necessary to increase the pH from 8 to 9. They quote values of around 1.5 equivalent NaOH/~pH for 100 kg thick juice at 70 Brix. However, because the buffer capacity is determined by the contained non-sugars, it was decided to express the buffer capacity in percent of non-sugars. An arbitrary choice was also made for the number of H2S04 equivalents necessary to reduce the thick juice pH to a real value of pH = 7. A summary of the measured values is given in Table 3.
PLANT A B C D E E YEAR 2000 2000 2000 2000 2000 2001 WEEK
40 61 428 905 292 203 41 188 698 308 42 229 642 218 203 43 161 521 206 44 582 755 190 341 45 450 169 500 289 46 406 675 217 681 252 47 172 474 897 195 355 303 48 151 365 411 206 49 566 363 219
Average 160 451 674 200 397 234
Table 3: Buffer capacities (equivalent H2S04%NS necessary to reduce the pH value of 100 kg thick juice from its original value to pH=?) for different RT factories.
10 van der Poel, P.W.; Schiweck, H.; Schwartz, T.( J998): Sugar Technology. Dr. Albert Bartens, Berlin, 940
164
There are clearly observable differences between the factories (plant A to E; year 2000). Significant variations were also observed for each factory throughout the campaign and between the different campaigns (plant E; year 2000 and 2001). For comparison with the expression of van. der Poel en al. the values of the RT factories noted during the 2000 campaign were also derived from the titration curves: they are situated between 0.7 equivalent NaOH/L'lpH and 1.6 equivalent NaOH/L'lpH, which in 3 of the 5 cases is considerably lower.
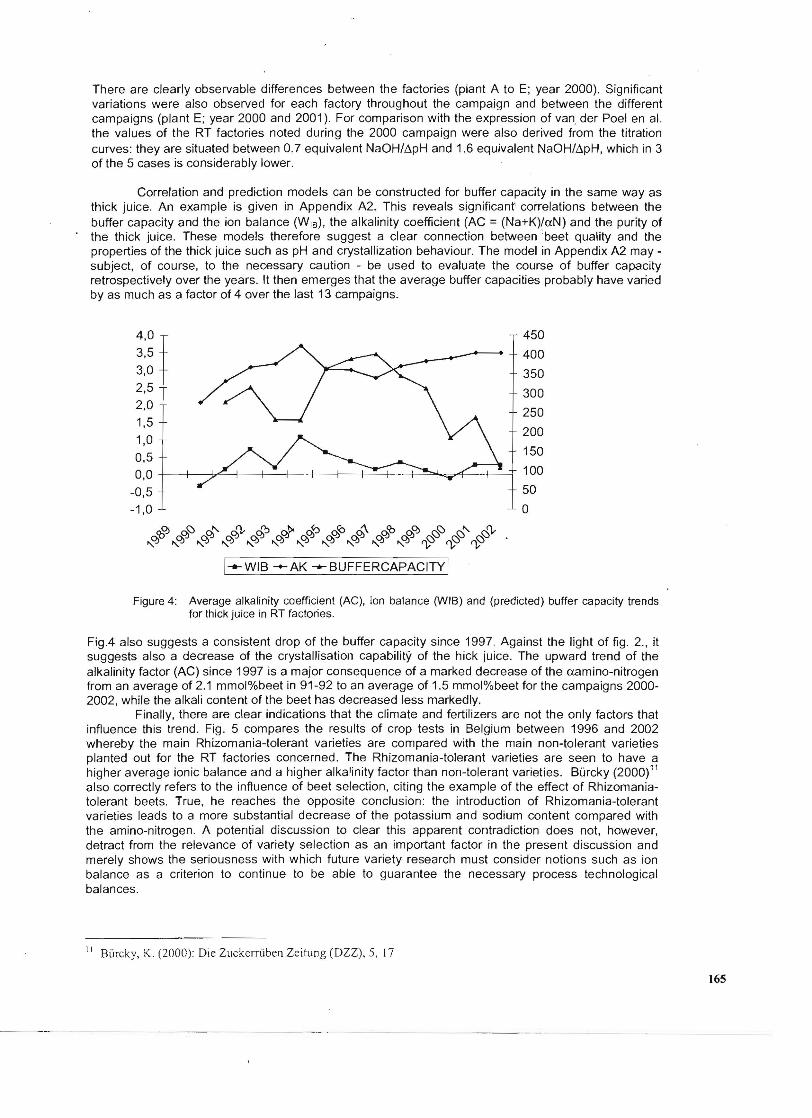
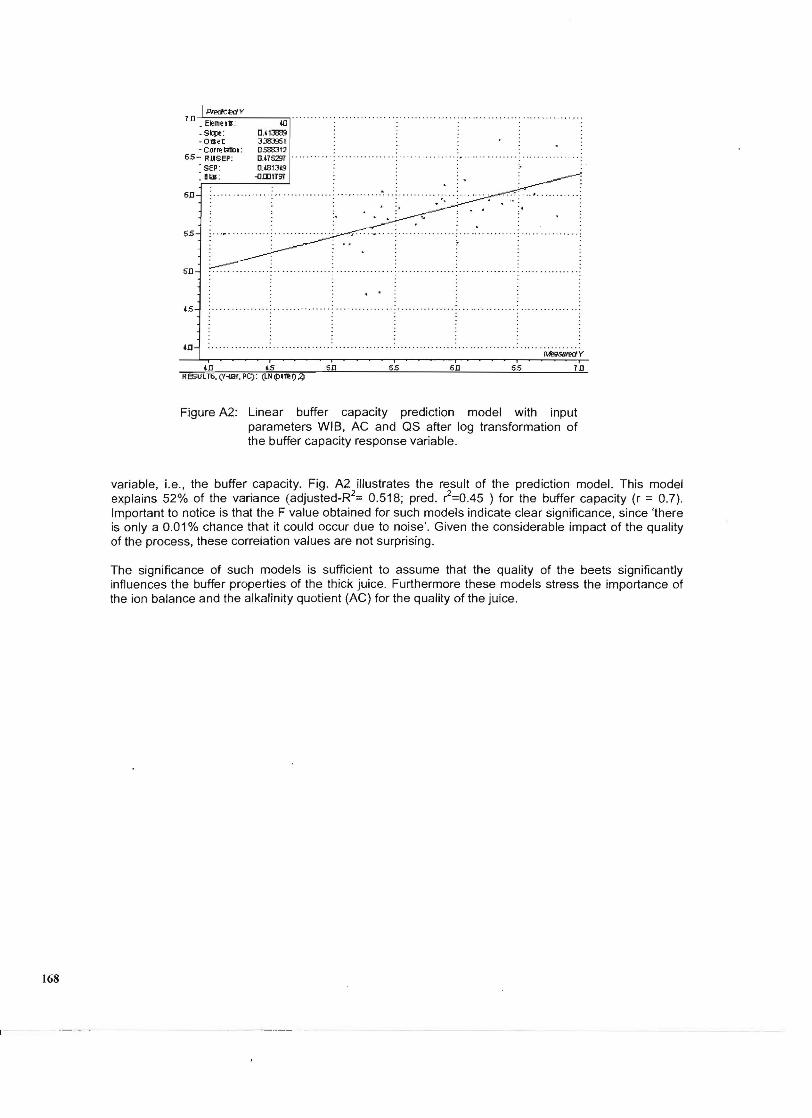
Correlation and prediction models can be constructed for buffer capacity in the same way as thick juice. An example is given in Appendix A2. This reveals significant' correlations between the buffer capacity and the ion balance (W 1B ), the alkalinity coefficient (AC =(Na+K)/uN) and the purity of the thick juice. These models therefore suggest a clear connection between 'beet quality and the properties of the thick juice such as pH and crystallization behaviour. The model in Appendix A2 may subject, of course, to the necessary caution - be used to evaluate the course of buffer capacity retrospectively over the years. It then emerges that the average buffer capacities probably have varied by as much as a factor of 4 over the last 13 campaigns.
4,0
3,5
3,0
2,5 2,0
1,5
1,0
0,5
0,0
-0,5
-1,0
~ RlCO RlOJ'(bOJ Rl\:) Rl" Rl'1- RJ~ * RJ<O RJCO R)\:) R)" R)'1"OJ "Q) "Q) "Q) "Q) "Q) "Q) "Q) "Q) "Q) "Q) '1-<::5 '1-<::5 '1-<::5
I....... WIB -+-AK ....... BUFFERCAPACITY I
450
400
350
300
250
200
150
100
50
0
Figure 4: Average alkalinity coefficient (AC), ion balance (WIB) and (predicted) buffer capacity trends for thick juice in RT factories.
Fig.4 also suggests a consistent drop of the buffer capacity since 1997. Against the light of fig. 2. , it suggests also a decrease of the crystallisation capability of the hick juice. The upward trend of the alkalinity factor (AC) since 1997 is a major consequence of a marked decrease of the aamino-nitrogen from an average of 2.1 mmol%beet in 91-92 to an average of 1.5 mmol%beet for the campaigns 20002002, while the alkali content of the beet has decreased less markedly.
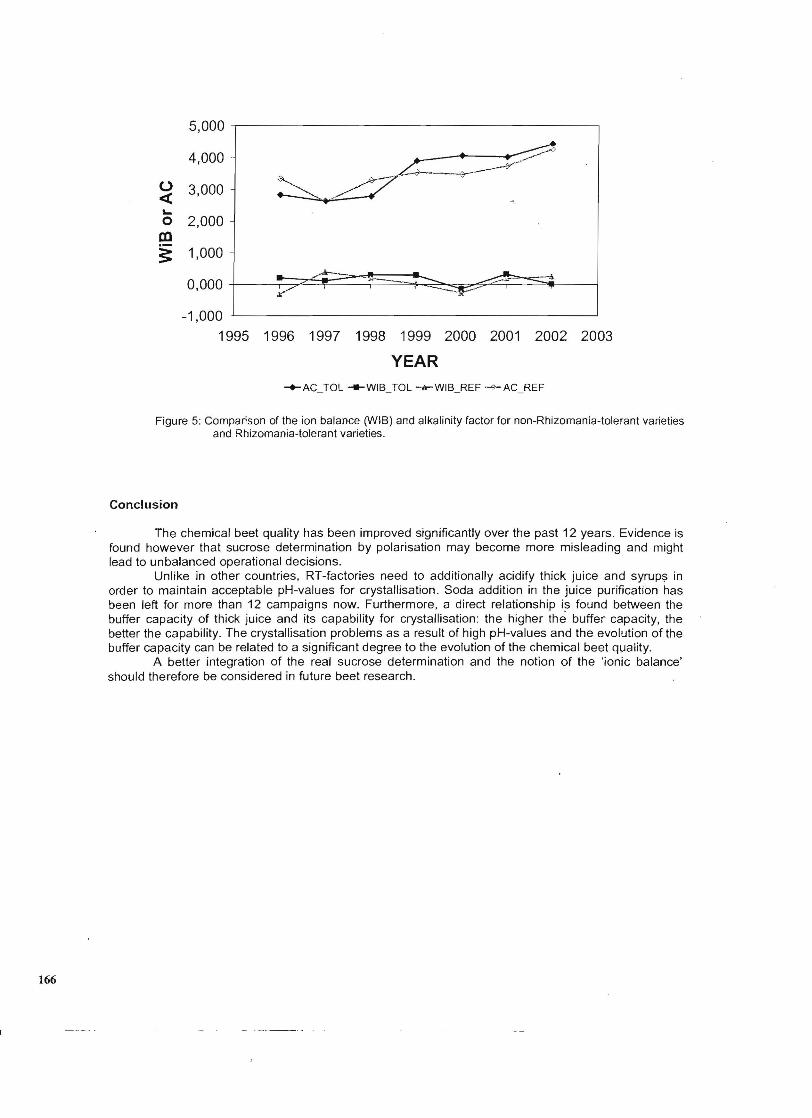
Finally, there are clear indications that the climate and fertilizers are not the only factors that influence this trend. Fig . 5 compares the results of crop tests in Belgium between 1996 and 2002 whereby the main Rhizomania-tolerant varieties are compared with the main non-tolerant varieties planted out for the RT factories concerned . The Rhizomania-tolerant varieties are seen to have a higher average ionic balance and a higher alkalinity factor than non-tolerant varieties. Burcky (2000) 11
also correctly refers to the influence of beet selection, citing the example of the effect of Rhizomaniatolerant beets. True, he reaches the opposite conclusion: the introduction of Rhizomania-tolerant varieties leads to a more substantial decrease of the potassium and sodium content compared with the amino-nitrogen. A potential discussion to clear this apparent contradiction does not, however, detract from the relevance of variety selection as an important factor in the present discussion and merely shows the seriousness with which future variety research must consider notions such as ion balance as a criterion to continue to be able to guarantee the necessary process technological balances.
I I Blircky, K. (2000) : Die Zuckerriiben Zeitung (DZZ), 5, J7
165
5,000 ,------------------------,
4,000
~ 3,000 ~
o 2,000 al § 1,000
0,000 +--~~~:::::::~~~~~~~~~~
-1,000 -'------------------------'
1995 1996 1997 1998 1999 2000 2001 2002 2003
YEAR
Figure 5: Comparison of the ion balance (WIB) and alkalinity factor for non-Rhizomania-tolerant varieties and Rhizomania-tolerant varieties.
Conclusion
The chemical beet quality has been improved significantly over the past 12 years. Evidence is found however that sucrose determination by polarisation may become more misleading and might lead to unbalanced operational decisions.
Unlike in other countries, RT-factories need to additionally acidify thick juice and syruP$ in order to maintain acceptable pH-values for crystallisation. Soda addition in the juice purification has been left for more than 12 campaigns now. Furthermore, a direct relationship is found between the buffer capacity of thick juice and its capability for crystallisation: the higher the buffer capacity, the better the capability. The crystallisation problems as a result of high pH-values and the evolution of the buffer capacity can be related to a significant degree to the evolution of the chemical beet quality.
A better integration of the real sucrose determination and the notion of the 'ionic balance' should therefore be considered in future beet research.
166

APPENDIX
A.1: Predicting thick juice purity (Os) from the classical chemical quality parameters of the beet.
It is important to realize that autocorrelations may exist between the beet quality parameters. The most reliable models are therefore based on a PLS regression. A PLS pre9iction model is shown in Fig. A 1. This is a relatively simple prediction model on the basis of 2 ' principal components calculated from a two-factor interaction (2FI) model for pol, K and aN. The basis .is formed by 369 values for the weekly average for the beet quality determined in the tare house. in the beet acceptances and their corresponding thick juice purities (Os) obtained in the production of five different RT production plants during 9 campaigns. This model explains 76% of the variance (adjusted-R2= 0.76; pred. ~=0.74 ) for Os (r = 0.853) through the beet quality parameters pol, K and aN. These may be regarded as relatively good models, taken into consideration that the remaining part of the Os variance - measuring error excepted - can certainly be explained by reference to production parameters such as the quality of extraction (e.g., sugar losses, degree of extraction) and juice purification (e .g. , degree of liming). It is mathematically possible to increase the significance further, by using the quadratic (adjusted r= 0.78; pred. r2=0.77) or cubic models (adjusted r2= 0.81; pred. ~=O.79), but the question arises as to the extent to which increasing the complexity of these models actually serves any useful purpose. It should be noted, however, that thick juice purity prediction appears to make no significant contribution for the Na content in the beet. This is perhaps rather surprising in the light of the other models that have been constructed in the past.
97
96
Predicted Y ElemenlS: 369 ... Slo pe : 0.7 28569 Offset: 25 .42318 Correla tion : 0.850640 RMSEP : 0.505668· SEP: 0.506 354 Bias: · 0.0003 91
95 ' . . ~
' ..: . I ', . . ... .. . . .
94
93
; . " , ' . ',.';
92
91 Me asured Y
91 92 93 94 95 96 97 RESLLT1. (Y-va, . PClQs.2)
Figure A 1: 2FI prediction (full-cross validation) for thick juice purity
A.2: Buffer capacity prediction models
When evaluating the correlations between the buffer capacity with the various beet parameters (Polarization , K, Na, aN), the alkalinity coefficient (AC = (Na+K)/aN), the ion balance and the purity of the thick juice (Os) obtained from these beets, the best correlations are found on the basis of linear models with the ion balance (WIB) and the alkalinity coefficient (AK= (Na+K)/aN) and the purity of the corresponding industrial thick juice (Os) as input parameters, after log transformation of the response
167
1n _E~me,. : 411 -S~: C.llJ!m -Ol'$et 3J8l951 - Correlotl:l, : 0=12
6.5- RUSEP: 0.115:;97 - SEP : 0.1813i9 : BIaJ : -{]D01?9T
6n
5.5
5n
1.5
In
.. .. ... . ....... ..... . ... .. .................... ..... ........ .. .. ... .
... . . .. . . .. . . . .......... ....... ..... .. , . . ........ ... . .... .. ........ .
....... .. . ...... . MI!'iIsIHea Y
In 1.5 SD 5.5 6D 6.5 TD RESULT6,(Hlilr, PC): (l.NIP'1I!1) ~
Figure A2: Linear buffer capacity prediction model with input parameters WIB, AC and OS after log transformation of the buffer capacity response variable.
variable, i.e. , the buffer capacity, Fig . A2 illustrates the result of the prediction model. This model explains 52% of the variance (adjusted-R2 = 0,518; pred, (=0.45 ) for the buffer capacity (r = 0.7). Important to notice is that the F value obtained for such models indicate clear significance, since 'there is only a 0.01 % chance that it could occur due to noise'. Given the considerable impact of the quality of the process, these correlation values are not surprising.
The significance of such models is sufficient to assume that the quality of the beets significantly influences the buffer properties of the thick juice. Furthermore these models stress the importance of the ion balance and the alkalinity quotient (AC) for the quality of the juice.
168