meeting today’s societal expectations: the use of … conference 2008/t... · meeting today’s...
TRANSCRIPT
1
Tim Overton
Chief Process Safety Engineer
The Dow Chemical Company
Meeting Today’s Societal Expectations: The Use of Process Safety Metrics to Drive Performance
Improvements
2
An Overview
• Dow’s Commitment to EH&S Excellence
– Drive to Zero
– 1995 - 2005 Goals
– 2006 - 2015 Goals
• Opportunity for Global Process Safety Metrics for Industry
– Overview of the CCPS Process Safety Metrics

3

4
Goals set in 1996 for 2005
Injuries and Illnesses: Reduce 90%
LOPCs: Reduce 90%
Transportation incidents: Reduce 90%
Process Safety incidents: Reduce 90%
Motor vehicle incidents: Reduce 50%
5
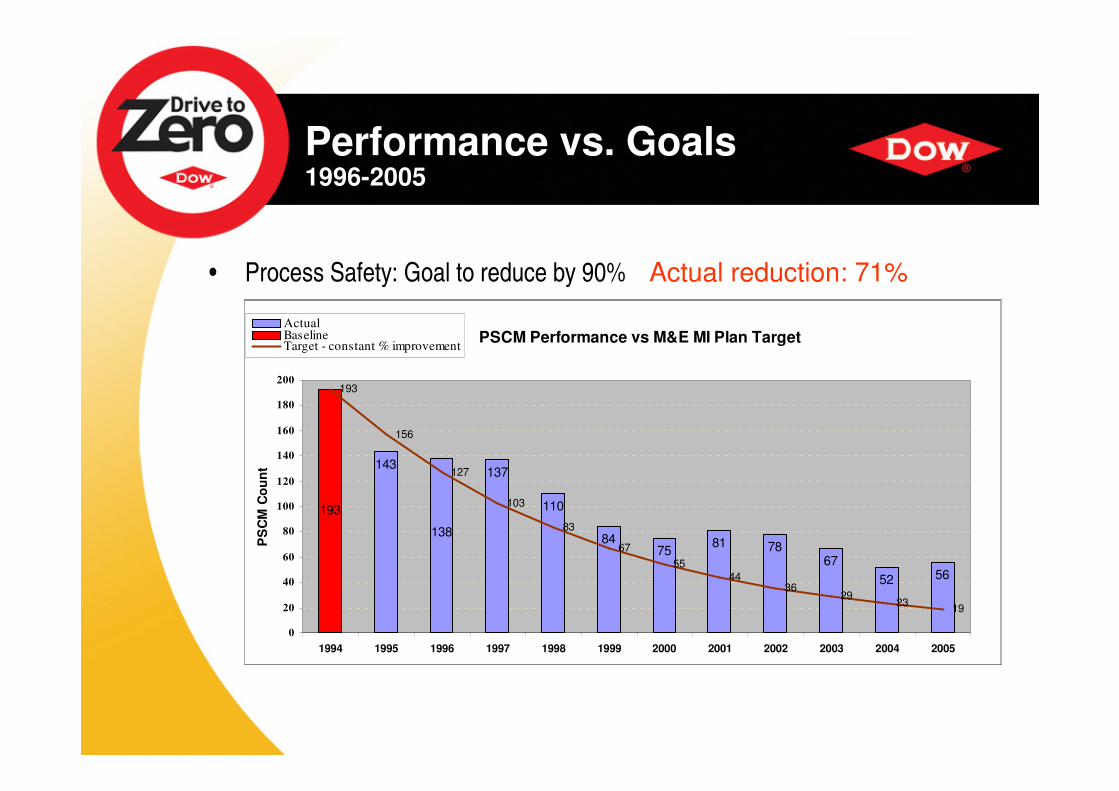
Performance vs. Goals1996-2005
• Process Safety: Goal to reduce by 90%
PSCM Performance vs M&E MI Plan Target
193
193
156
127
103
83
67
5544
3629
2319
0
20
40
60
80
100
120
140
160
180
200
1994 1995 1996 1997 1998 1999 2000 2001 2002 2003 2004 2005
PS
CM
Co
un
t
Baseline
Target - constant % improvement PSCM Performance vs M&E MI Plan Target
193
143137
110
8475
81 7867
52 56
138
193
156
127
103
83
67
5544
3629
2319
0
20
40
60
80
100
120
140
160
180
200
1994 1995 1996 1997 1998 1999 2000 2001 2002 2003 2004 2005
PS
CM
Co
un
t
ActualBaselineTarget - constant % improvement
Actual reduction: 71%
6
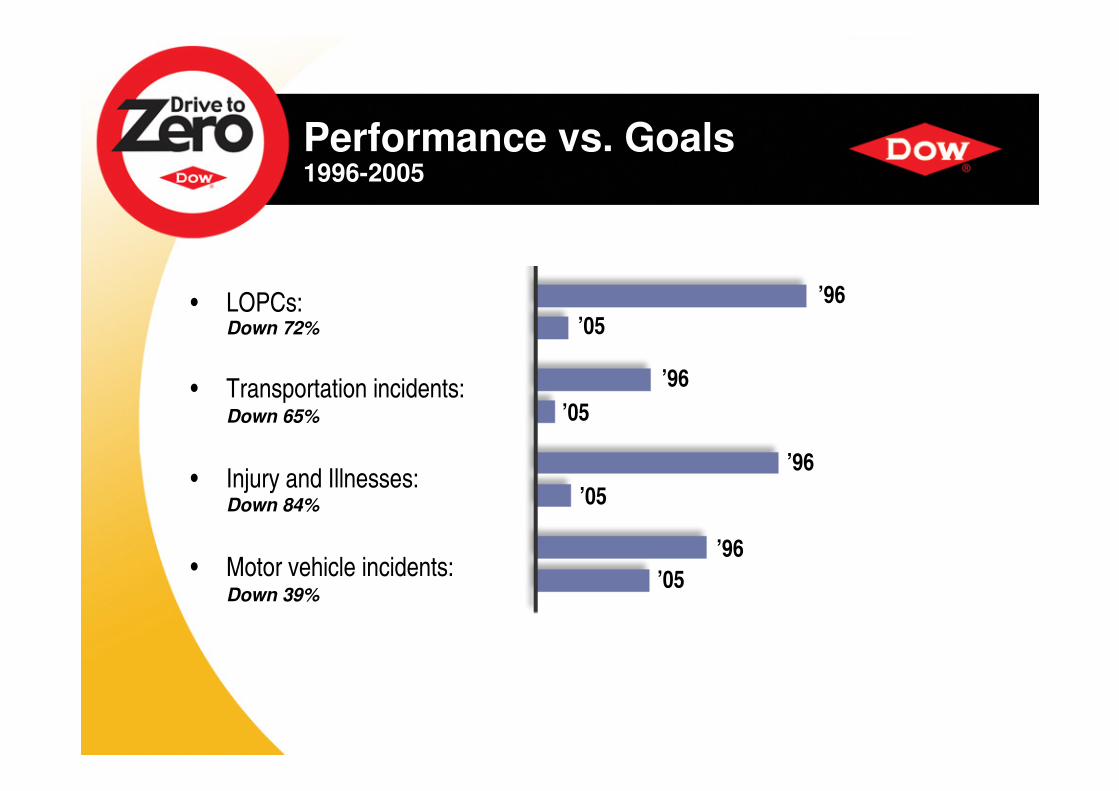
• LOPCs:Down 72%
• Transportation incidents:Down 65%
• Injury and Illnesses:Down 84%
• Motor vehicle incidents:Down 39%
’96
’05
’96
’05
’96
’05
’96
’05
Performance vs. Goals1996-2005

7
Putting it another way…
During the past 10 years…
• 13,000 employees did not suffer an injury or illness
• 10,500 LOPCs did not occur
• 150 motor vehicle accidents, with potential to cause injury or fatality did not occur
• 1,100 Process Safety incidents did not occur
8
2015 Sustainability Goals
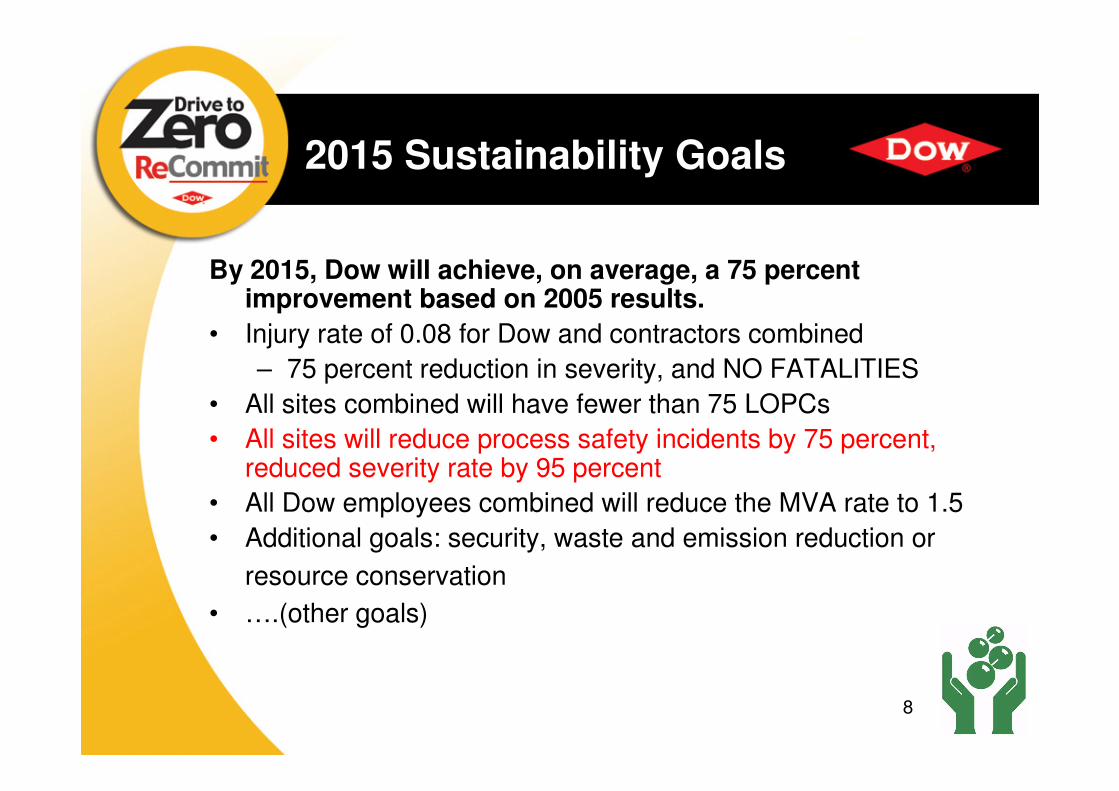
By 2015, Dow will achieve, on average, a 75 percent improvement based on 2005 results.
• Injury rate of 0.08 for Dow and contractors combined
– 75 percent reduction in severity, and NO FATALITIES
• All sites combined will have fewer than 75 LOPCs
• All sites will reduce process safety incidents by 75 percent, reduced severity rate by 95 percent
• All Dow employees combined will reduce the MVA rate to 1.5
• Additional goals: security, waste and emission reduction or
resource conservation
• ….(other goals)

Oct. 8, 2008 slide 9
Global Process Safety MetricsDriving Consistency and Improvement
New metrics proposed by Center for Chemical Process Safety
(CCPS)
� Deliverables in December 2007•Common Industry-Wide Lagging Metric
•Near-Miss or Other Lagging Metrics
•Leading Metrics
• http://www.aiche.org/ccps/metrics/index.aspx.
� Guideline Book - by 1Q 2009

Oct. 8, 2008 slide 10
Process Safety Metrics
� Several companies and some trade organizations have established process safety metrics programs, but their programs:
• Differ from organization to organization
• Are often based upon incident definitions that are not well aligned to the actual hazard of the event
Oct. 8, 2008 slide 11
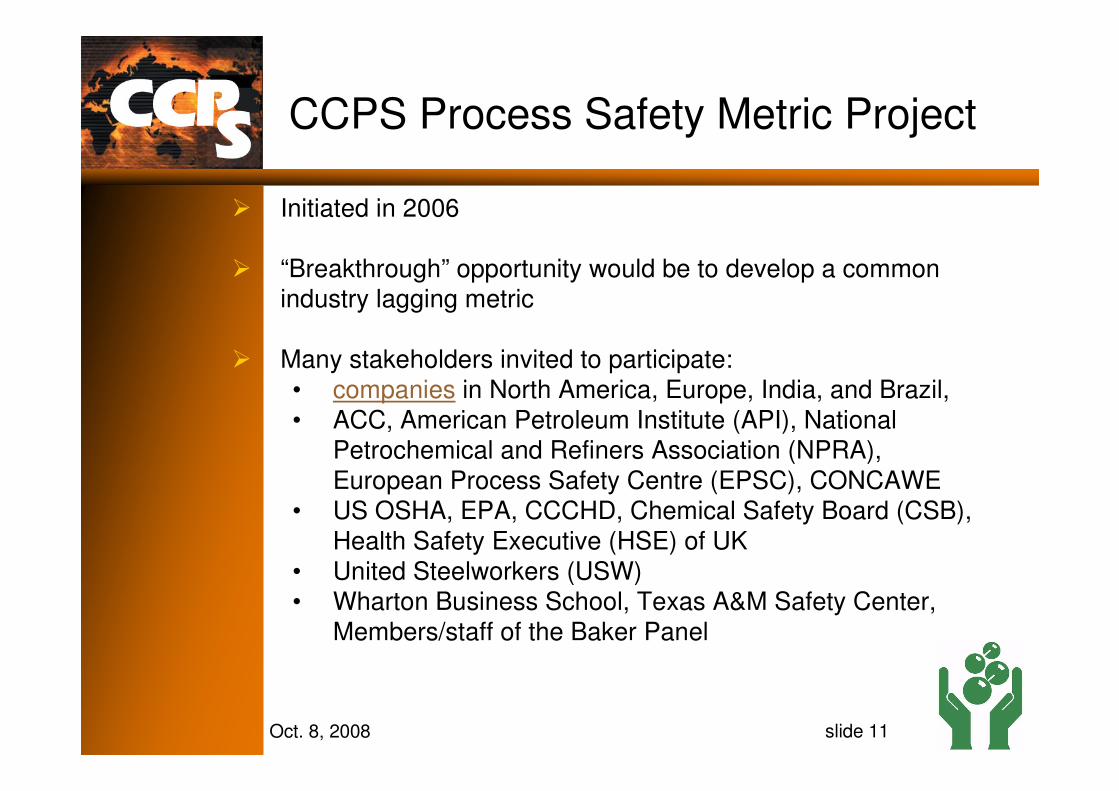
CCPS Process Safety Metric Project
� Initiated in 2006
� “Breakthrough” opportunity would be to develop a common industry lagging metric
� Many stakeholders invited to participate: • companies in North America, Europe, India, and Brazil,• ACC, American Petroleum Institute (API), National
Petrochemical and Refiners Association (NPRA), European Process Safety Centre (EPSC), CONCAWE
• US OSHA, EPA, CCCHD, Chemical Safety Board (CSB), Health Safety Executive (HSE) of UK
• United Steelworkers (USW) • Wharton Business School, Texas A&M Safety Center,
Members/staff of the Baker Panel

Oct. 8, 2008 slide 12
Criteria used by Team for selecting the Lagging Metric
Criteria Weighting
Likely acceptance broadly by industry:Simplicity to apply 4Leverages existing data (Comparable) 3
Accuracy / Relative Differentiation
Considers the relative toxicity or flammability of
chemicals released 5Differentiates events with little potential health
impact or process safety risk 5Less subject to variability in interpretation 4Considers the release conditions 3
Data useful by multiple stakeholders
Corporate Leadership 5Process Safety SMEs 3External (Regulators, NGOs, Labor) 3
Legal liabilities 1Which brings the greatest measure of safety 4Ability to compare (or index) results from small
and large companies 4Identifies enough events to differentiate statistics
shifts in performance 5
Oct. 8, 2008 slide 13
Simple…yet not proportional to process safety
risk
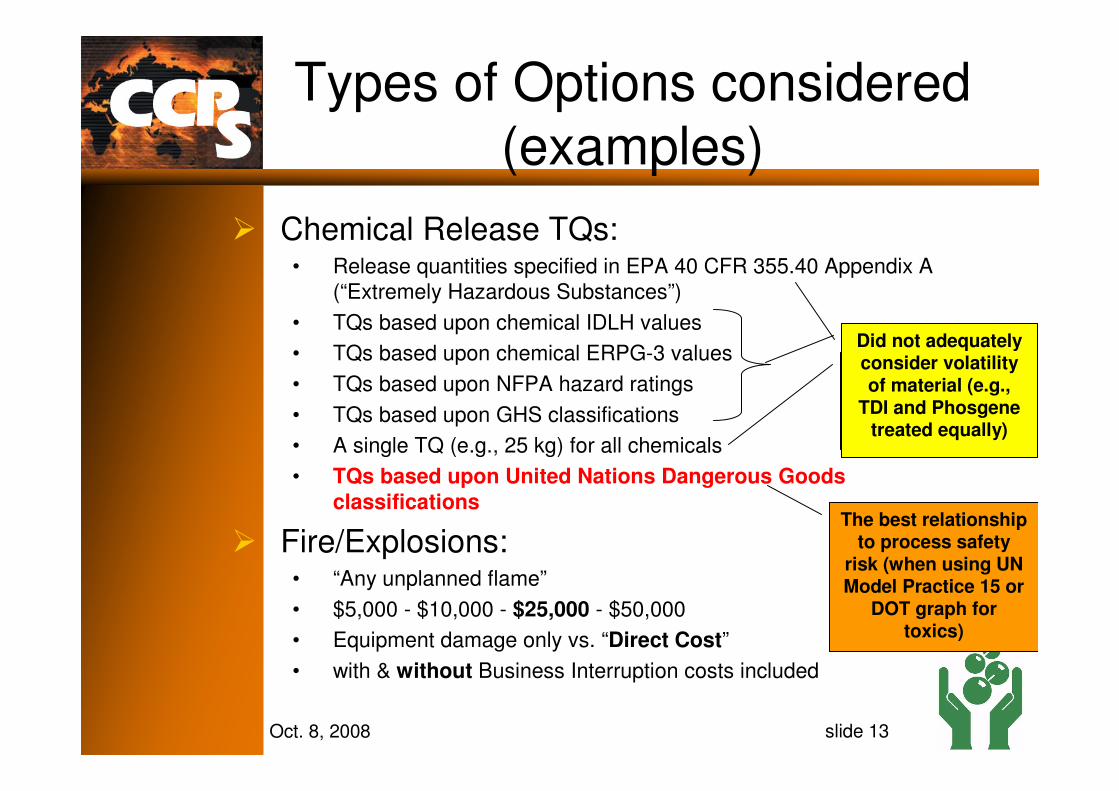
Types of Options considered (examples)
� Chemical Release TQs:• Release quantities specified in EPA 40 CFR 355.40 Appendix A
(“Extremely Hazardous Substances”)
• TQs based upon chemical IDLH values
• TQs based upon chemical ERPG-3 values
• TQs based upon NFPA hazard ratings
• TQs based upon GHS classifications
• A single TQ (e.g., 25 kg) for all chemicals
• TQs based upon United Nations Dangerous Goods classifications
� Fire/Explosions:• “Any unplanned flame”
• $5,000 - $10,000 - $25,000 - $50,000
• Equipment damage only vs. “Direct Cost”
• with & without Business Interruption costs included
TQs not proportional to
process safety risk(e.g., Chloroform 10 lb.
TQ, HCL 5000 lb. TQ
Did not adequately consider volatility of material (e.g.,
TDI and Phosgene treated equally)
The best relationship to process safety
risk (when using UN Model Practice 15 or
DOT graph for toxics)
Oct. 8, 2008 slide 14
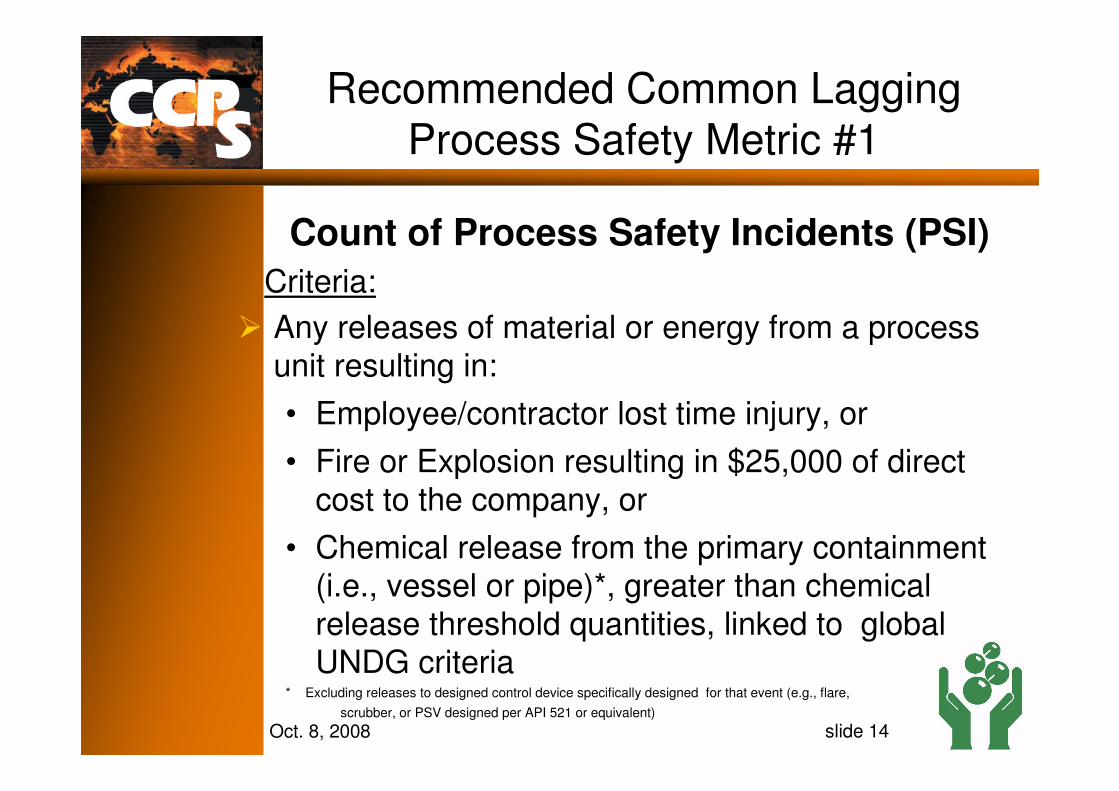
Recommended Common Lagging Process Safety Metric #1
Count of Process Safety Incidents (PSI)
Criteria:
� Any releases of material or energy from a process unit resulting in:
• Employee/contractor lost time injury, or
• Fire or Explosion resulting in $25,000 of direct cost to the company, or
• Chemical release from the primary containment (i.e., vessel or pipe)*, greater than chemical release threshold quantities, linked to global UNDG criteria
* Excluding releases to designed control device specifically designed for that event (e.g., flare,
scrubber, or PSV designed per API 521 or equivalent)

Oct. 8, 2008 slide 15
Thresholds
Material Hazard classification as defined by United Nations Dangerous Goods definitions:
"Process Safety incident TQ”All TIH Class A materials 5 kg (11 lbs.)All TIH Class B materials 25 kg (55 lbs.)All TIH Class C materials 100 kg (220 lbs.)All TIH Class D materials 200 kg (440 lbs.)"Packing Group I" materials & “Flammable Gas” 500 kg (1100 lbs.)"Packing Group II" materials & “Flammable Liquid” 1000 kg (2200 lbs.)"Packing Group III" materials &“Combustible Liquid” 2000 kg (4400 lbs.)
& Division 2.2 - Nonflammable, Nontoxic Gases
Note: Currently, the definitions allow flexibility to use either the NFPA-30, UN Dangerous Goods, or GHS definitions for “flammable gas”, “flammable liquid”, or “combustible liquid”. The expectation is that companies will migrate to the GHS or UNDG definitions over time.
Oct. 8, 2008 slide 16
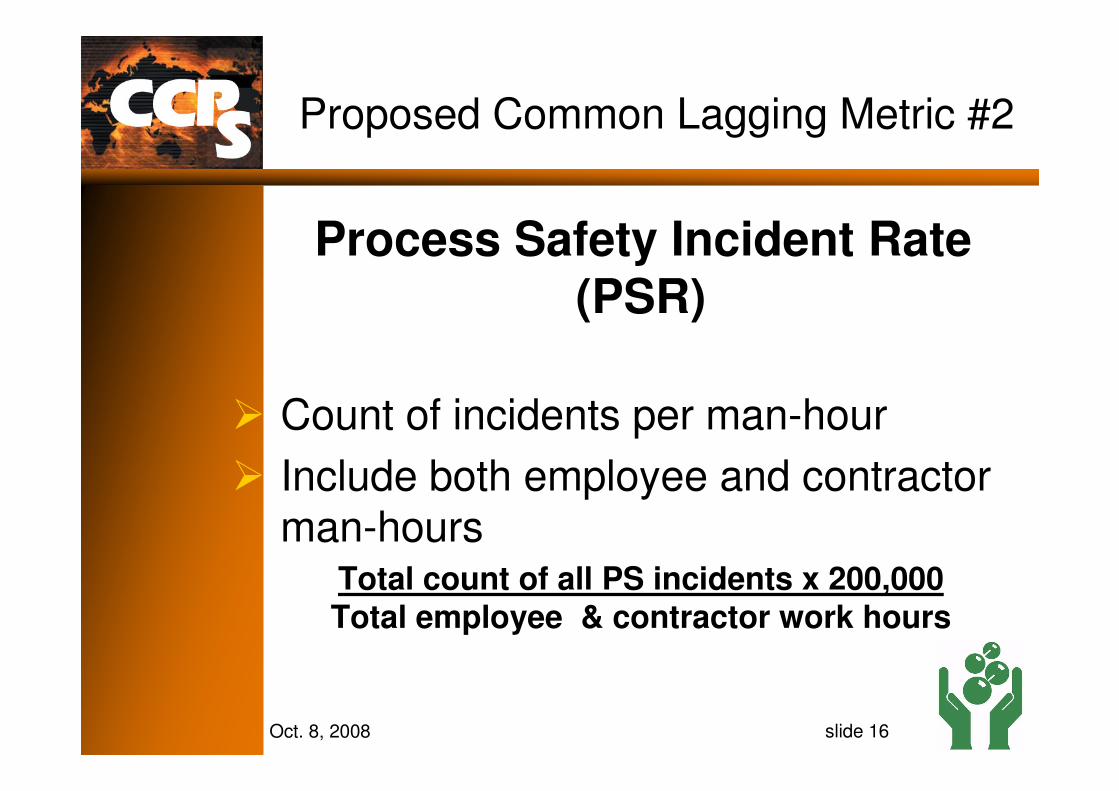
Proposed Common Lagging Metric #2
Process Safety Incident Rate (PSR)
� Count of incidents per man-hour
� Include both employee and contractor man-hours
Total count of all PS incidents x 200,000.Total employee & contractor work hours
Oct. 8, 2008 slide 17
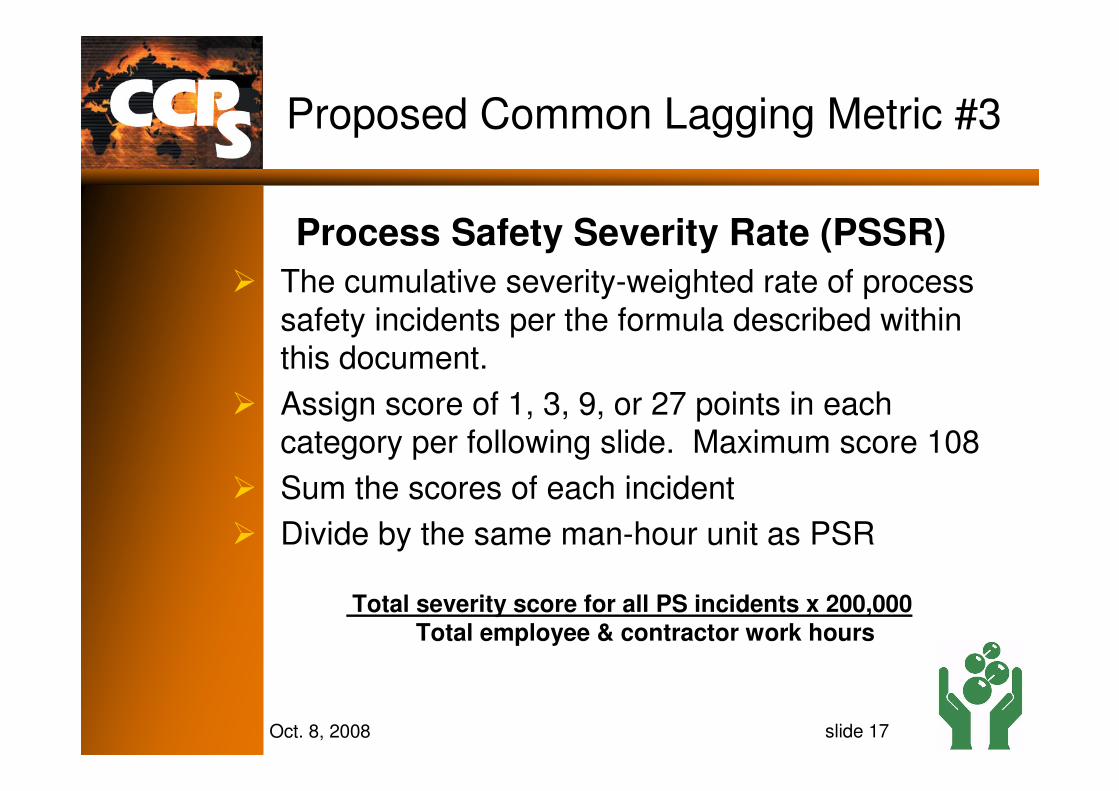
Proposed Common Lagging Metric #3
Process Safety Severity Rate (PSSR)
� The cumulative severity-weighted rate of process safety incidents per the formula described within this document.
� Assign score of 1, 3, 9, or 27 points in each category per following slide. Maximum score 108
� Sum the scores of each incident
� Divide by the same man-hour unit as PSR
Total severity score for all PS incidents x 200,000Total employee & contractor work hours

Oct. 8, 2008 slide 18
Table 2: Process Safety Incidents & Severity Categories
National media coverage over multiple days OR
Environmental remediation required and cost in excess of $2.5 MM. Federal government investigation and oversight of process.
OROther significant community impact
Chemical release with potential for significant on-site or off-site injuries or fatalities - see Note 2D
Resulting in direct cost >$10MM
Off-site fatality or multiple on-site fatalities associated with a process safety event.
1(27 points used in
severity rate calculations for each
of the attributes which apply to the incident)
Shelter-in-place or community evacuation OR
Environmental remediation required and cost in between $1MM - 2.5 MM. State government investigation and oversight of process.
ORRegional media coverage or brief national media coverage.
Chemical release with potential for injury off site or flammable release resulting in a vapor cloud entering a building or potential explosion site (congested/confined area) with potential for damage or casualties if ignited -see Note 2C
Resulting in $1MM to 10MM of direct cost.
On-site fatality - employee or contractors associated with a process safety event; multiple lost time injuries or one or more serious offsite injuries associated with a process safety event.
2(9 points used in
severity rate calculations for each
of the attributes which apply to the incident)
Minor off-site impact with precautionary shelter-in-place
OREnvironmental remediation required with cost less than $1MM. No other regulatory oversight required.
ORLocal media coverage
Chemical release outside of containment but retained on company property ORflammable release without potential for vapor cloud explosives - see Note 2B
Resulting in $100,000 to1MM of direct cost.
Lost time injury to employee or contractors associated with a process safety event
3(3 points used in
severity rate calculations for each
of the attributes which apply to the incident)
Short -term remediation to address acute environmental impact. No long term cost or company oversight. Examples would include spill cleanup, soil and vegetation removal.
Chemical released within secondary containment or contained within the unit -see Note 2A
Resulting in $25,000 to $100,000 of direct cost
Injury requiring treatment beyond first aid to employee or contractors associated with a process safety incident(In USA, incidents meeting the definitions of an OSHA recordable injury)
4(1 point used in
severity rate calculations for each
of the attributes which apply to the incident)
Does not meet or exceed Level 4 thresholdDoes not meet or exceed Level 4 threshold
Does not meet or exceed Level 4 threshold
Does not meet or exceed Level 4 threshold
NA
Community/environment impact(Note 5)
Potential chemical impact(Note 3)
Fire or Explosion (including
overpressure)
Safety/Human Health(Note 5)Severity Level
(Note 4)
Oct. 8, 2008 slide 19
Recommendations – Metrics
� CCPS recommends that all companies and trade associations collect and report the three lagging metrics
� Recommend that all companies implement the appropriate Leading metrics and Near Miss reporting as described in the CCPS metric document
Oct. 8, 2008 slide 20
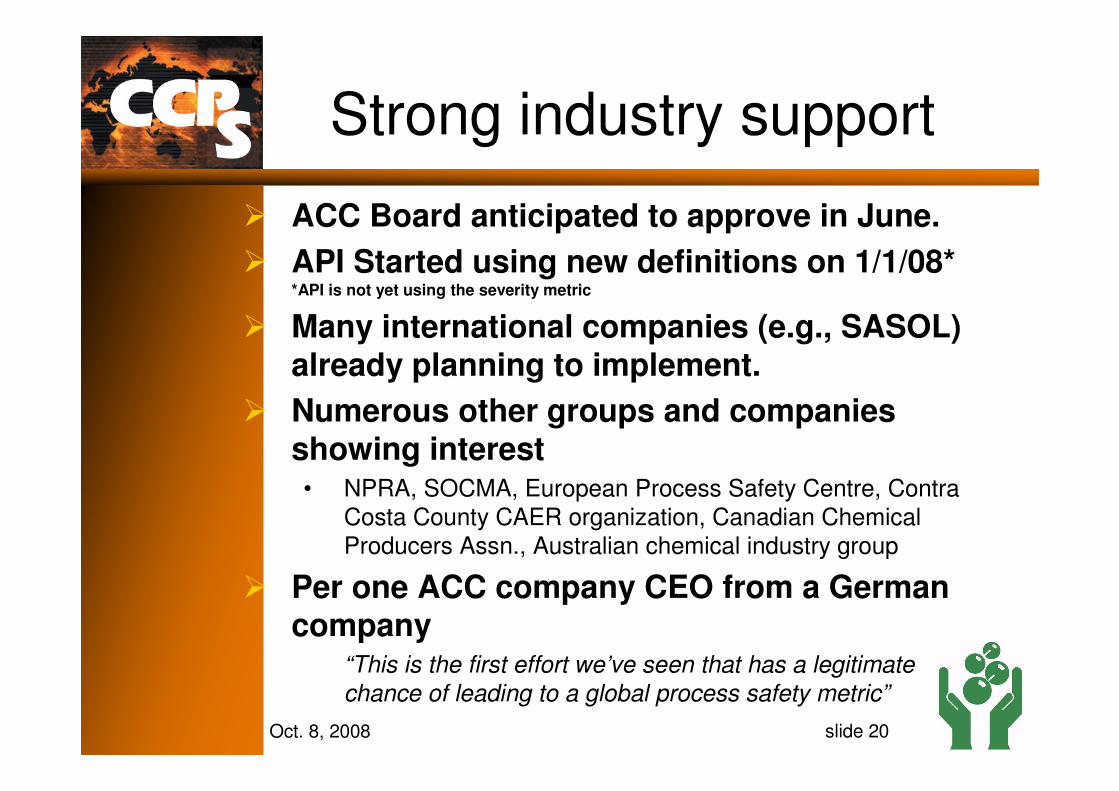
Strong industry support
� ACC Board anticipated to approve in June.
� API Started using new definitions on 1/1/08* *API is not yet using the severity metric
� Many international companies (e.g., SASOL) already planning to implement.
� Numerous other groups and companies showing interest• NPRA, SOCMA, European Process Safety Centre, Contra
Costa County CAER organization, Canadian Chemical Producers Assn., Australian chemical industry group
� Per one ACC company CEO from a German company
“This is the first effort we’ve seen that has a legitimate
chance of leading to a global process safety metric”

21
Dow’s position on CEFIC PS Metrics
• Dow is strong supporter of CEFIC implementing mandatory process safety metric reporting for CEFIC members & associations.
• Reporting metrics on a consistant basis will not only benefit peer-to-peer benchmarking and transparency, but will benefit industry as a whole by demonstrating to the public that our performance is improving
• Dow strongly supports the concept of a single global metric….rather than varying country-by-country (or association-by-association) metrics.
• We would prefer that everyone align behind the CCPS Process Safety Metrics. However, if CEFIC or other groups cannot support the existing CCPS metrics – we should work hand-in-hand with CCPS and other associations to made changes.

22
Thank You

Oct. 8, 2008 slide 23
Team Members
Organization
Husky OilINEOSJLM ConsultingNalcoLyondellMKOCPSCMonsantoNovaNPRAOGPOSHAReliancePPG IndustriesRohm & HaasShellSIS-TechSolutiaSuncor UK HSEUS Chemical Safety BoardUSWValeroWharton
Organization
3MABS Consulting ACCAcutechAir ProductsAlbemarleAPIBayer Material ScienceBP BraskemCCPSChevron Phillips Chem.CONCAWEContra Costa CHDDowDuPontEli Lilly EPAEPSCExxonMobilHenkelHoneywell Specialty Mat.
At the time when the metric definitions were developed in 2006 & 2007. Some changes to membership has occurred since.
Oct. 8, 2008 slide 24
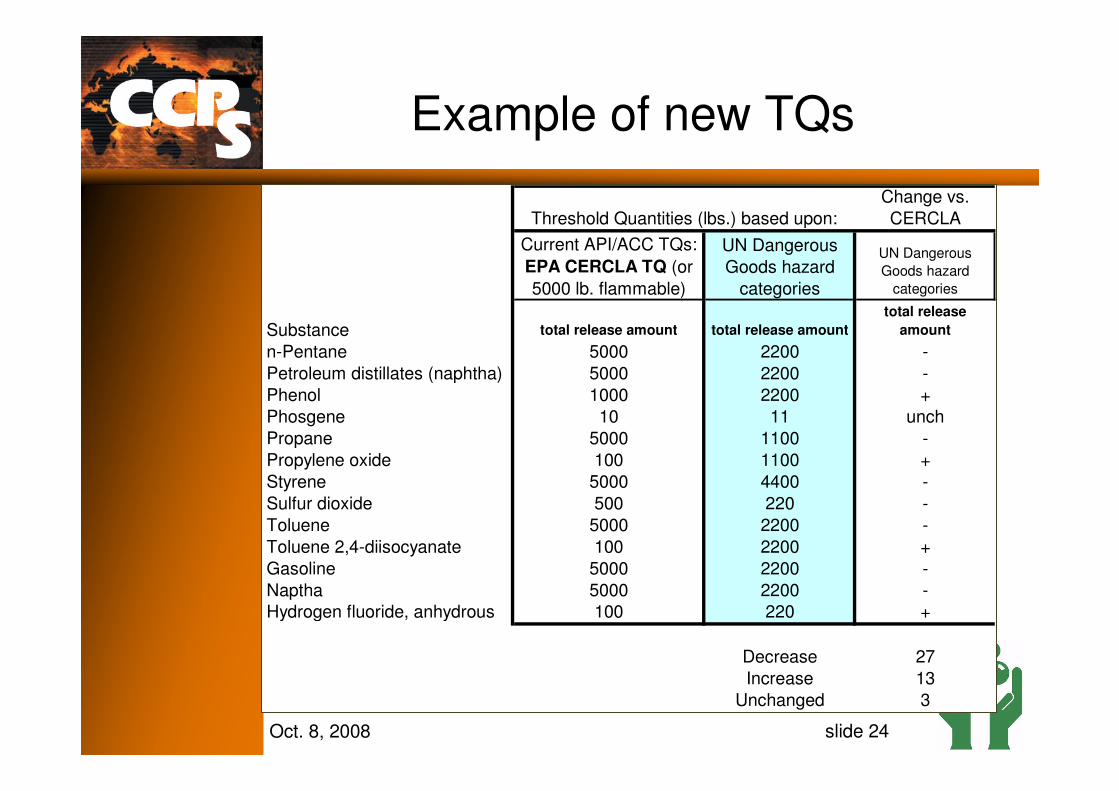
Example of new TQs
Current API/ACC TQs:
EPA CERCLA TQ (or
5000 lb. flammable)
UN Dangerous
Goods hazard
categories
UN Dangerous
Goods hazard
categories
Substance total release amount total release amount
total release
amount
Acetaldehyde 5000 1100 -
Acetone 5000 2200 -
Acrolein 1 11 +
Acrylonitrile 100 1100 +Ammonia 100 440 +
Arsine 100 11 -
1,3-Butadiene 5000 1100 -
Carbon monoxide 5000 440 -
Carbon tetrachloride Not Covered 2200 -Chlorine 10 55 +
Chloroform 10 4400 +
Chloropicrin Not Covered 55 -
Cyclohexane 5000 2200 -Cyclohexene 5000 2200 -
Epichlorohydrin 100 2200 +
Change vs.
CERCLAThreshold Quantities (lbs.) based upon:
Current API/ACC TQs:
EPA CERCLA TQ (or
5000 lb. flammable)
UN Dangerous Goods hazard
categories
UN Dangerous
Goods hazard
categories
Substance total release amount total release amount
total release
amount
Ethanolamine Not Covered 4400 -Ethyl alcohol 5000 2200 -
Ethylamine 5000 1100 -
Ethyl chloride 5000 1100 -
Ethylene oxide 10 440 +
Formaldehyde 100 4400 +
n-Hexane 5000 2200 -Hydrogen chloride 5000 220 -
Hydrogen sulfide 100 55 -
L.P.G. 5000 1100 -
Methyl alcohol 5000 2200 -
Methyl chloride 5000 1100 -
Methyl isocyanate 10 11 unchMethyl mercaptan 100 220 +
Nitrogen dioxide 10 11 unch
Change vs.
CERCLAThreshold Quantities (lbs.) based upon:
Current API/ACC TQs:
EPA CERCLA TQ (or
5000 lb. flammable)
UN Dangerous
Goods hazard
categories
UN Dangerous
Goods hazard
categories
Substance total release amount total release amount
total release
amount
n-Pentane 5000 2200 -
Petroleum distillates (naphtha) 5000 2200 -
Phenol 1000 2200 +Phosgene 10 11 unch
Propane 5000 1100 -
Propylene oxide 100 1100 +
Styrene 5000 4400 -
Sulfur dioxide 500 220 -
Toluene 5000 2200 -
Toluene 2,4-diisocyanate 100 2200 +
Gasoline 5000 2200 -
Naptha 5000 2200 -Hydrogen fluoride, anhydrous 100 220 +
Decrease 27
Increase 13
Unchanged 3
Change vs.
CERCLAThreshold Quantities (lbs.) based upon: