mega ppt
TRANSCRIPT

3Q / 2015 (v.1)
Investor/Analyst Briefing

2
THE FINANCIAL INFORMATION IN THIS PRESENTATION AS OF AND
FOR THE NINE MONTHS ENDED SEP 30, 2015 ARE UN-AUDITED
NUMBERS UNLESS SPECIFIED OTHERWISE. MEGA FHC WILL FILE ITS
AUDITED FINANCIAL STATEMENTS THROUGH TAIWAN STOCK
EXCHANGE MARKET OBSERVATION POST SYSTEM ON NOV 30, 2015.
DISCLAIMER
These materials are not an offer for sale of securities in the United States.
Securities may not be sold in the United States absent registration or an
exemption from registration under the U.S. Securities Act of 1933, as amended.

3
Agenda
Operation Highlights 1
2 Financial Performance
3 Appendix

4
94 98 97 98 97
284 289 292 294 295
29 29 29 30 30 28 30 26 28 31
540 554 558 574 585
736 737 732 726 757
3Q/14 4Q/14 1Q/15 2Q/15 3Q/15
1,737 1,711 1,734
* Mega Bank quarterly un-audited end balance, includes loan, factoring, A/R financing, L/C, credit card revolving and non-accrual loan but excludes guarantee.
** Includes Gov-linked Non-Profit Organization and etc.
Unit: NT$bn
Large corp. loan demand improved, up 4.3% QoQ
1,795
Large corp.
SME
Other corp.**
Gov.-linked
Mortgage
Other consumer
Large corp. 42%
SME 33%
Other corp. 2%
Gov.-linked 2%
Mortgage 16%
Other consumer
5%
Mega Bank quarterly loan balance* Mega Bank 3Q/15 loan breakdown by customer
1,750
YoY: 2.9%
QoQ: 4.3%
Growth Trend
Total YoY: 4.9%
QoQ: 2.6%
YoY: 8.3%
QoQ: 1.9%
YoY: 3.9%
QoQ: 0%

5
• * Mega Bank un-audited numbers, includes loan, factoring, A/R financing, L/C, credit card revolving and non-accrual loan but excludes guarantee.
• ** Main growth driver for “Other Industry”: hotel & restaurant industry
Growth were seen across the board, except
manufacturing
Manufacture 27%
Transport & Telecom
10%
Real estate 14%
Retail & wholesales
8%
Financial 8%
Service 3%
Gov. agency 1%
Consumer 22%
Others 8%
Mega Bank 3Q/15 loan breakdown by industry* Mega Bank loan balance trend by industry*
Unit: NT$BN
465
175
257
153
149
53
11
392
140
477
166
239
152
136
48
9
391
132
494
156
218
168
126
45
9
377
117
Manufacturing
Transport &Telecom
Real estate
Retail &wholesales
Financial
Service
Gov. agency
Consumer
Others**
3Q/15 2Q/15 3Q/14
YoY: -5.9%
QoQ: -2.5%
Growth Trend
YoY: 17.9%
QoQ: 7.5%
YoY: -8.9%
QoQ: 0%
YoY: 12.2%
QoQ: 5.4%
YoY: 18.3%
QoQ: 9.6%
YoY: 17.8%
QoQ: 10.4%
YoY: 19.7%
QoQ: 6.1%**
YoY: 4.0%
QoQ: 0%
YoY: 22.2%
QoQ: 22.2%

6
1,128 1,151 1,139 1,154 1,156
343 338 350 341 362
240 248 245 255 276
3Q/14 4Q/14 1Q/15 2Q/15 3Q/15
Unit: NT$bn
Overseas branches loan was up 8.2% QoQ
Domestic
OBU
Overseas
branches
Mega Bank 3Q/15 loan breakdown by regions *
* Mega Bank quarterly un-audited end balance, includes loan, factoring, A/R financing, L/C, credit card revolving and non-accrual loan but excludes guarantee.
** OBU stands for Off-shore Banking Unit
Domestic 65%
OBU (offshore banking
unit) 20%
Overseas branches
15%
Growth Trend
YoY: 15.0%
QoQ: 8.2%
Growth Trend
YoY: 5.5%
QoQ: 6.2%
Growth Trend
YoY: 2.5%
QoQ: 0.2%
35% off-shore
loan
7
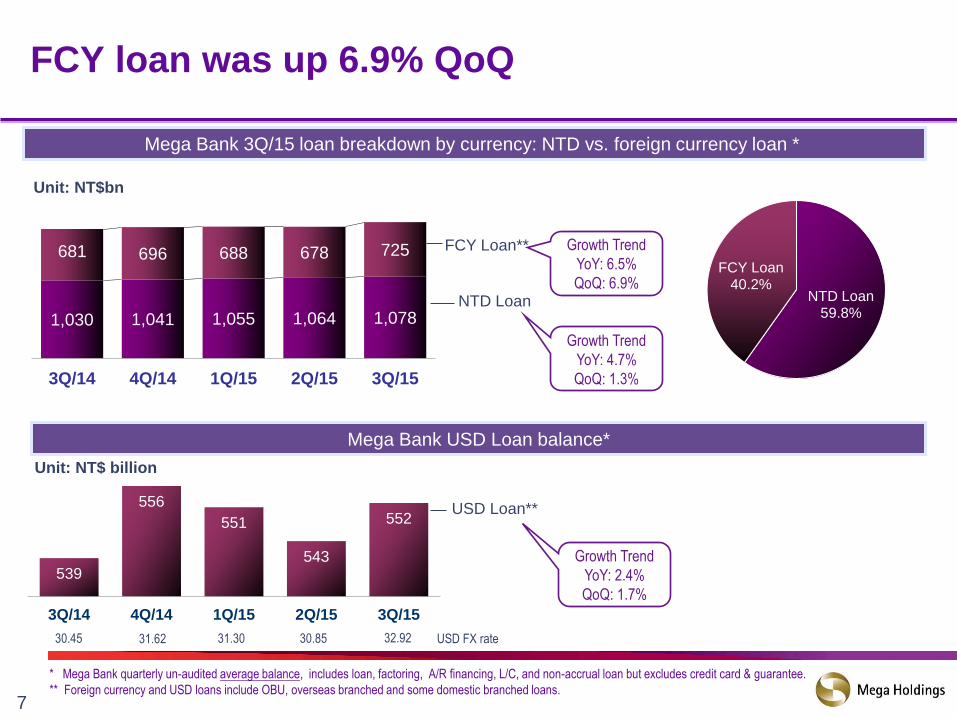
1,030 1,041 1,055 1,064 1,078
681 696 688 678 725
3Q/14 4Q/14 1Q/15 2Q/15 3Q/15
Unit: NT$bn
FCY loan was up 6.9% QoQ
NTD Loan
FCY Loan**
Mega Bank 3Q/15 loan breakdown by currency: NTD vs. foreign currency loan *
NTD Loan 59.8%
FCY Loan 40.2%
Growth Trend
YoY: 6.5%
QoQ: 6.9%
Growth Trend
YoY: 4.7%
QoQ: 1.3%
* Mega Bank quarterly un-audited average balance, includes loan, factoring, A/R financing, L/C, and non-accrual loan but excludes credit card & guarantee.
** Foreign currency and USD loans include OBU, overseas branched and some domestic branched loans.
539
556
551
543
552
3Q/14 4Q/14 1Q/15 2Q/15 3Q/15
Mega Bank USD Loan balance*
Unit: NT$ billion
Growth Trend
YoY: 2.4%
QoQ: 1.7%
32.92 30.45 30.85 31.30 31.62 USD FX rate
USD Loan**

8
Interbank
557 573 570 556 593
380 422 443 478 521
551 568 601 620
576
394 459
447 492 458
3Q/14 4Q/14 1Q/15 2Q/15 3Q/15
Mega Bank’s deposit balance *
Total: 1,883
Unit:NT$bn
Deposit growth decelerated; demand deposit
increased
FX time 21.3%
NTD time
26.8%
NTD demand 27.6%
FX demand 24.3%
2,146 2,061
2,148
FX time
deposit
NTD time
deposit
FX demand
deposit
NTD demand
deposit
Mega Bank’s 3Q/15 deposit breakdown
* Excludes interbank deposit, Central Bank deposit & Chunghwa Post re-deposit ; un-audited numbers.
** Includes retail and corporate deposit but excludes due from central banks and banks
.
2,023
Mega Bank’s RMB deposit**
Growth Trend
YoY: 14.1%
QoQ: 0% 126 116 117 113 112
127 126
27 28 27 31 16
22 26
1Q/14 2Q/14 3Q/14 4Q/14 1Q/15 2Q/15 3Q/15
Unit:NT$bn
4.80 4.94 4.91 5.17 4.98 5.05 5.10 RMB FX
rate
Retail/Corp.

9
84.50%85.61%
87.18%
91.76%
89.01%
96.11%
85.94%
88.00%
75%
85%
95%
4Q/13 1Q/14 2Q/14 3Q/14 4Q/14 1Q/15 2Q/15 3Q/15
83.52%
81.50%
86.60%85.81%
84.12%
89.81%
85.41% 85.81%
75%
85%
95%
4Q/13 1Q/14 2Q/14 3Q/14 4Q/14 1Q/15 2Q/15 3Q/15
Mega Bank’s total LDR*
* LDR calculation is based on loan/deposit end balance
LDR back to stabilized level
Mega Bank’s USD LDR*

10
Loan spread was up 7bps due to overseas loan
spread improvement
1.42% 1.44% 1.41% 1.42% 1.44% 1.51%
2.15% 2.13% 2.10% 2.13% 2.13% 2.15%
0.72% 0.69% 0.69% 0.71% 0.69% 0.64%
2Q/14 3Q/14 4Q/14 1Q/15 2Q/15 3Q/15
Spread Yield cost
1.53% 1.61% 1.54% 1.55% 1.58% 1.71%
2.32% 2.35% 2.28% 2.30% 2.31% 2.33%
0.79% 0.74% 0.75% 0.75% 0.73% 0.63%
2Q/14 3Q/14 4Q/14 1Q/15 2Q/15 3Q/15
Spread Yield cost
* Overseas loan includes overseas branches and OBU loan; un-audited internal numbers..
Mega Bank overseas loan interest spread* Mega Bank total loan interest spread*
Mega Bank domestic loan interest spread*
1.37% 1.35% 1.33% 1.35% 1.35% 1.38%
2.04% 2.00% 1.99% 2.02% 2.02% 2.03%
0.66% 0.65% 0.66% 0.67% 0.67% 0.65%
2Q/14 3Q/14 4Q/14 1Q/15 2Q/15 3Q/15
Spread Yield cost
11
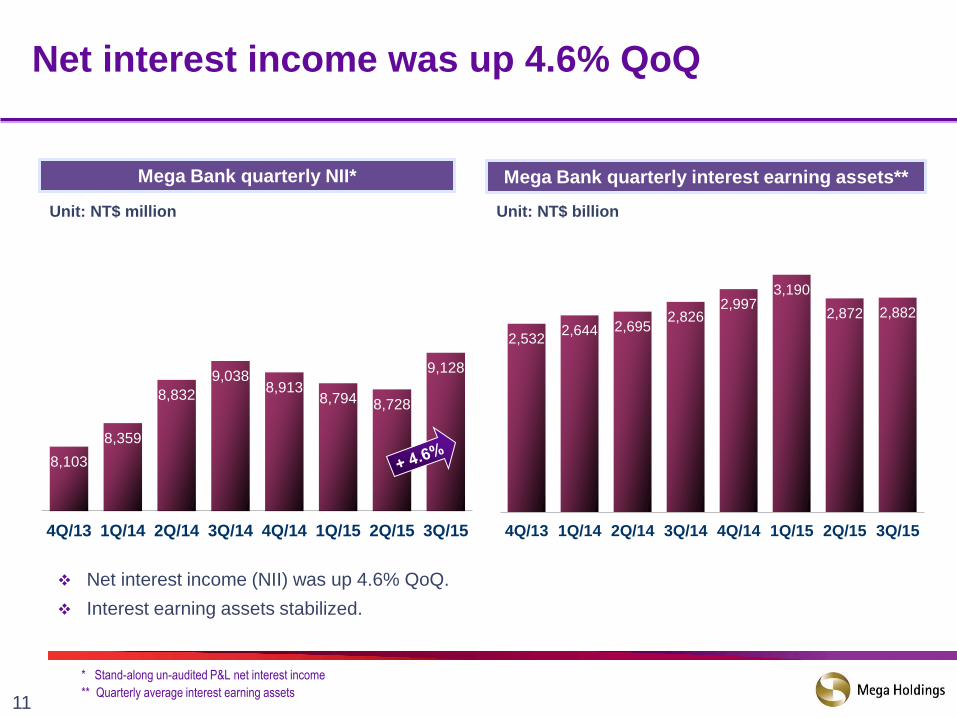
Net interest income was up 4.6% QoQ
Mega Bank quarterly NII*
Unit: NT$ million
8,103
8,359
8,832
9,038 8,913
8,794 8,728
9,128
4Q/13 1Q/14 2Q/14 3Q/14 4Q/14 1Q/15 2Q/15 3Q/15
2,532 2,644 2,695
2,826 2,997
3,190
2,872 2,882
4Q/13 1Q/14 2Q/14 3Q/14 4Q/14 1Q/15 2Q/15 3Q/15
Mega Bank quarterly interest earning assets**
Unit: NT$ billion
Net interest income (NII) was up 4.6% QoQ.
Interest earning assets stabilized.
* Stand-along un-audited P&L net interest income
** Quarterly average interest earning assets

12
367 336
256
501 510
751
594
513
4Q/13 1Q/14 2Q/14 3Q/14 4Q/14 1Q/15 2Q/15 3Q/15
Lower-yield USD inter-banks assets declined
further
Mega Bank RMB inter-banks assets*
* Average end balance of that quarter; includes due from central banks, due from banks, cash and cash equivalence
Mega Bank USD inter-banks assets*
83
106 116
133 111
98 82 77
4Q/13 1Q/14 2Q/14 3Q/14 4Q/14 1Q/15 2Q/15 3Q/15
Unit: NT$ billion Unit: NT$ billion
Lower-yield USD inter-banks assets declined 13.6% QoQ in 3Q/2015
4.80 4.94 4.91 4.91 5.17 4.98 5.05 RMB FX
rate 5.10 29.85 30.45 29.78 29.78 30.85
USD FX
rate 31.62 31.30 32.92

13
Total NIM was up 4bps QoQ
* NIM = annualized net interest income / average interest earning assets of that quarter.
Mega Bank quarterly FCY NIM*
1.27%
1.18%
1.11%
1.22%
1.26%
3Q/14 4Q/14 1Q/15 2Q/15 3Q/15
NIM improved across the board, except RMB.
Mega Bank quarterly Total NIM* Mega Bank quarterly NTD NIM*
Mega Bank monthly USD NIM Mega Bank monthly RMB NIM
1.41% 1.22% 1.09%
1.30% 1.34%
3Q/14 4Q/14 1Q/15 2Q/15 3Q/15
1.12% 1.13% 1.13% 1.13%
1.17%
3Q/14 4Q/14 1Q/15 2Q/15 3Q/15
1.25% 1.01%
0.82% 1.06%
1.22%
3Q/14 4Q/14 1Q/15 2Q/15 3Q/15
2.04% 1.99% 2.10% 1.70% 1.61%
3Q/14 4Q/14 1Q/15 2Q/15 3Q/15

14
Inter-banks
assets
38%
Fin. Assets
14%
Trade
finance
45%
Loan
3%
Inter-banks
deposit
17%
Demand
deposit
7%
Others
2%
Time
deposit
74%
Mega Bank 1-3Q/15 RMB interest earning assets* Mega Bank 1-3Q/15 RMB interest bearing liabilities*
Total:
NT$203,246mn
Total:
NT$155,635mn
• * Daily average balance of that period
• ** NII: net interest income; NIM: net interest margin
Mega Bank RMB assets & liabilities*
RMB assets was up 3.5% QoQ; while RMB NII was
up 10.3% QoQ
154 165
202 196 203
145 147 141 151 156
3Q/14 4Q/14 1Q/15 2Q/15 3Q/15
RMB assets RMB liabilities
Unit: NT$bn
2.04% 1.99% 2.10% 1.70% 1.61%
Mega Bank RMB NIM & NII**
881 986 1,061
799 881
3Q/14 4Q/14 1Q/15 2Q/15 3Q/15

15
1 67 86 88 91
127 89
170 86
190 144 201
247 140 244
378 496 132 163
159 161
160
214
213 125
100 118 105
118
127
102
97 138
4Q/13 1Q/14 2Q/14 3Q/14 4Q/14 1Q/15 2Q/15 3Q/15
858
Mutual fund sales fee was down; but
bancassurance fee was up 31.2% QoQ
Mega Bank wealth management gross fee breakdown*
Unit: NT$MN
* Mega Bank internal data; gross wealth mgmt fee, NOT net wealth mgmt fee.
** Profit sharing scheme of fund mgmt fee and trust account mgmt fee.
Structured products fee
Mutual fund fee
Bancassurance fee
Management fee**
617
554
Total: 490
554
649
845
510

16
Bank fee was up 6% YoY, driven by WM and corp.
loan fee growth
1,156 1,460
2,310
309 216
1,249
669
1,891
1,302
2,522
336 238
918 715
Wealth Mgmt* FX Corp. loan Custodian Credit card Securities Bills
1-3Q/14 1-3Q/15
Mega Bank net fee breakdown
Unit: NT$MN
WM 24%
FX 16%
Corp. loan 32%
Custodian 4%
Credit Card 3%
Securities 12%
Bills 9%
* Net wealth mgmt fee, deducting all the cost associated with product sales, excluding fee allocated to Mega life insurance agent and Mega SITE.
Mega Securities
net fee
Mega Bills net
fee
Bank WM net fee was up 64% YoY due to strong bancassurance
sales fee.
Bank corp. loan fee was up 9% YoY, driven by syndication loan
fee.
Securities sub. fee was down 27% YoY due to poor equity market
trading volume.
Bills sub. fee was up 7% YoY due to better CP issuance fee.
Highlights Mega FHC 1-3Q/15 net fee breakdown

17
Asset quality remained strong
0.09%
0.15%
0.06% 0.08% 0.08% 0.09%
0.28% 0.30%
0.25% 0.26% 0.25%
20,225 21,114
21,544 21,708 21,412 22,089
2Q/14 3Q/14 4Q/14 1Q/15 2Q/15 3Q/15
1333.85%
809.11%
1986.37%
1515.62% 1466.97%
1365.30%
433.61% 442.08% 516.38% 490.67% 501.14%
Mega Bank NPL balance & NPL ratio* Mega Bank loan loss reserved and coverage ratio
Unit: NT$MN Unit: NT$MN
* 90 days standard
Mega
Market
Avg.
Market Avg.
Mega
1,516
2,610
1,085
1,432 1,460 1,618
2Q/14 3Q/14 4Q/14 1Q/15 2Q/15 3Q/15

18
0.34%
0.19%
0.34% 0.43%
0.18% 0.09%
2010 2011 2012 2013 2014 1-3Q/15
New NPL
0.07% 0.17%
0.00% 0.01% 0.01% 0.00%
2Q/14 3Q/14 4Q/14 1Q/15 2Q/15 3Q/15
Large corp. NPL%
0.10% 0.14% 0.12% 0.12% 0.15% 0.17%
2Q/14 3Q/14 4Q/14 1Q/15 2Q/15 3Q/15
Mortgage NPL %
New NPL hit new low
0.14% 0.17% 0.12% 0.17% 0.16% 0.16%
2Q/14 3Q/14 4Q/14 1Q/15 2Q/15 3Q/15
SME NPL %
Mega Bank NPL ratio by customer *
* Excludes gov. loan, gov-linked corp. loan and other corp. loan, which all have 0% NPL.
** Annualized new NPL balance / total loan. Mega Bank Internal number.
Mega Bank new NPL as % of total loan **
19
Agenda
Operation Highlights 1
2 Financial Performance
3 Appendix

20
Net interest income
65%
Net fee revenue
19%
Net trading gain 9%
Insurance premium
3%
Other Revenue
4%
NII was up 3% YoY; fee was up 6% YoY
27,309
7,640 7,146
1,161 2,747
28,054
8,111
3,797
1,285 1,830
Net interestincome
Net feerevenue
Net tradinggain**
Insurancepremium
Others
1-3Q/14 1-3Q/15 Unit: NT$MN
Mega Group consolidated net revenue * Mega Group 1-3Q/2015 net revenue breakdown
* Un-audited figures.
** Net trading gain includes short-term assets, AFS assets, HTM assets, equity method assets, property and FX service derived trading gain,
and minus (add) asset impairment loss (write back).
**
NII was up 3% YoY due to loan growth and NIM
improvement .
Fee revenue was up 6% YoY due to strong WM and
syndication loan fee.
Trading gain was down 47% YoY due to domestic
equity and domestic convertible bond position mark-
to-market losses.
Highlights Includes TMT
NPL recovery of
NT$0.7bn
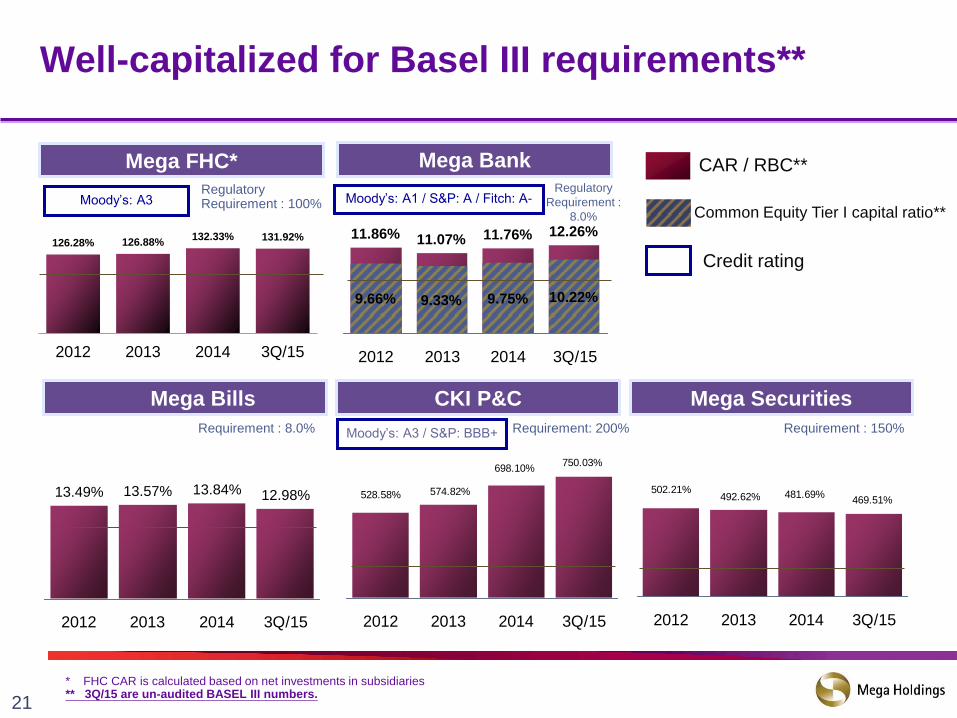
21
481.69%492.62%502.21%
469.51%
2012 2013 2014 3Q/15
750.03%
528.58% 574.82%
698.10%
2012 2013 2014 3Q/15
13.49% 13.57% 13.84% 12.98%
2012 2013 2014 3Q/15
11.86% 11.07% 11.76% 12.26%
10.22%9.75%9.33%9.66%
2012 2013 2014 3Q/15
Mega Bank
Mega Bills Mega Securities CKI P&C
Mega FHC*
Moody’s: A3
126.28% 126.88% 132.33% 131.92%
2012 2013 2014 3Q/15
Requirement: 200% Requirement : 150% Requirement : 8.0%
Regulatory
Requirement :
8.0%
Regulatory Requirement : 100%
CAR / RBC**
Common Equity Tier I capital ratio**
* FHC CAR is calculated based on net investments in subsidiaries ** 3Q/15 are un-audited BASEL III numbers.
Moody’s: A3 / S&P: BBB+
Well-capitalized for Basel III requirements**
Moody’s: A1 / S&P: A / Fitch: A-
Credit rating

22
7.62% 8.74%
10.33% 9.95%
12.03% 11.10%
ROE
0.61% 0.69%
0.81% 0.77%
0.95% 0.88%
ROA
1.37
1.57
1.88 1.96
2.43
1.75
0.9 0.85 1.10
1.11
1.40
2010 2011 2012 2013 2014 1-3Q/15*
EPS
cashdividend
Unit: NT$
Consistent profitability and attractive dividend
policy
Key Profitability Ratios To prevent over-inflated capital base
as well as to maintain sufficient capital
for future growth, our dividend policy
is:
Maintain high payout ratio
At least 50% of dividend payout in
cash form.
57%
Payout
58%
Payout
0.2
80%
Payout
1.10
Stock
dividend
0.15
64%
Payout
1.00
59%
Payout
* 1-3Q/15 are un-audited numbers; ROE & ROA are annualized numbers.
Cash div.
yield 4.69% 4.26% 5.02% 4.42% 5.73%

23
NT$MN, except per share data 1-3Q/2015* 1-3Q/2014 YoY 2014
Net interest income 28,054 27,309 3% 36,674
Net fee revenue 8,111 7,640 6% 11,121
Insurance premium 1,285 1,161 11% 1,529
Gain from fin. assets at fair value thru P&L -376 3,461 -111% 3,826
Available for sales asset gain 1,393 1,708 -18% 1,812
Equity method investment gain 204 95 115% 152
FX spread gain 2,478 2,071 20% 3,283
Asset impairment loss (write-back) -416 -229 82% -374
Property gain 514 40 - -
NPL recovery gain - 1,298
Other non-interest revenue (net) 1,830 2,747 -33% 1,183
Operating net revenue 43,077 46,003 -6% 60,504
Operating expense -17,845 -16,715 7% -23,795
Pre-provision operating profit 25,232 29,288 -14% 36,709
Provision expense on loan 1,257 -1,301 -197% -1,588
Reserved on insurance 8 74 - 208
Pretax profit 26,497 28,061 -6% 35,329
Tax -4,870 -4,269 14% -5,089
Minority shareholder interest 122 19 - 19
Net profit 21,749 23,811 -9% 30,259
EPS (NT$) 1.75 1.91 -8% 2.43
1-3Q/2015 Mega FHC consolidated P&L statement*
Cost-to-income ratio:
41.4%; includes
$0.22bn donation to
Hua-Long Textile
employee and
additional $0.8bn biz
tax vs. last year **
TMT NPL
recovery
$0.7bn
Includes Hua-Long
Textile recovery of
$0.99bn +
Powerchip recovery of
$0.64bn
* Un-audited consolidated P&L. ** Business tax was increased from 2% to 5% starting July/2014

24
1-3Q/2015 Mega FHC consolidated balance sheet*
NT$MN 1-3Q/2015* 1-3Q/2014 YoY 2014 YTD
Assets:
Cash and due from banks 528,642 734,569 -28% 635,381 -17%
Bills and bonds under RP agreement 8,324 7,483 11% 11,874 -30%
Fin. assets at fair value through P&L 182,103 176,664 3% 181,367 0%
AFS financial assets 321,487 282,930 14% 280,699 15%
HTM financial assets 190,421 164,044 16% 163,997 16%
Other financial assets 17,241 20,677 -17% 20,269 -15%
A/R, net 221,612 200,991 10% 201,279 10%
Loan, net 1,789,937 1,708,199 5% 1,734,481 3%
Equity method LT investments, net 2,917 2,664 9% 2,663 10%
Land, premises and equipments, net 23,343 23,959 -3% 24,162 -3%
Others 16,029 13,567 18% 18,764 -15%
Total assets 3,302,056 3,335,747 -1% 3,274,936 1%
Liabilities
Due to banks 464,155 727,563 -36% 528,530 -12%
Deposits 2,166,326 1,897,642 14% 2,035,625 6%
CP & Bond payable 66,834 69,896 -4% 71,563 -7%
Bills & bonds sold under repurchase agreement 173,821 233,706 -26% 222,507 -22%
Other liabilities 169,181 153,869 10% 155,643 9%
Total liabilities 3,040,317 3,082,676 -1% 3,013,868 1%
Capital stock (common stock) 124,498 124,498 0% 124,498 0%
Capital surplus 55,269 55,274 0% 55,274 0%
Retain earning 81,927 71,542 15% 77,856 5%
Equity adjustment items -96 1,599 - 3,277 -
Minority shareholder interest 141 157 -10% 162 -13%
Total stockholders' equity 261,739 253,070 3% 261,067 0%
Total liabilities and stockholders' equity 3,302,056 3,335,746 -1% 3,274,935 1%
Book value per share (NT$) 21.02 20.33 3% 20.96 0%
* Un-audited consolidated balance sheet.

25
NT$MN, except per share data 1-3Q/2015* 1-3Q/2014 YoY 2014
Net interest income 26,914 26,292 2% 35,292
Net fee revenue 6,375 6,039 6% 7,521
Gain from fin. assets at fair value thru P&L -1,949 1,557 -225% 1,370
Available for sales asset gain 1,129 1,161 -3% 1,277
Equity method investment gain 154 80 93% 114
FX spread gain 2,398 2,077 15% 3,239
Asset impairment loss (write-back) -416 -216 - -217
NPL disposal gain 0 703 - -
Other non-interest revenue (net) 1,141 934 22% 2,540
Operating net revenue 35,746 38,627 -7% 51,136
Operating expense -14,225 -13,044 9% -18,659
Pre-provision operating profit 21,521 25,583 -16% 32,477
Provision expense on loan 1,464 -1,709 - -2,249
Pretax profit 22,985 23,874 -4% 30,228
Tax -3,865 -3,390 14% -4,293
Net profit 19,120 20,484 -7% 25,935
EPS (NT$) 2.44 2.66 -8% 3.37
1-3Q/2015 Mega Bank P&L statement*
* Un-audited consolidated P&L. ** Business tax was increased from 2% to 5% starting July/2014
TMT NPL
recovery Cost-to-income ratio:
39.8%; includes
$0.22bn donation to
Hua-Long Textile
employee and
additional $0.8bn biz
tax vs. last year **
Includes Hua-Long
Textile recovery of
$0.99bn +
Powerchip recovery of
$0.64bn

26
1-3Q/2015 Mega Bank balance sheet*
NT$MN 1-3Q/2015* 1-3Q/2014 YoY 2014 YTD
Assets:
Cash and due from banks 520,661 729,775 -29% 630,105 -17%
Bills and bonds under RP agreement 11,744 4,344 170% 5,850 101%
Fin. assets at fair value through P&L 44,132 38,330 15% 43,697 1%
AFS financial assets 216,784 193,193 12% 187,345 16%
HTM financial assets 188,668 162,378 16% 162,084 16%
Other financial assets 10,159 13,540 -25% 13,651 -26%
A/R, net 194,679 168,254 16% 171,054 14%
Loan, net 1,789,937 1,708,199 5% 1,734,481 3%
Equity method LT investments, net 2,877 2,737 5% 2,733 5%
Land, premises and equipments, net 15,100 15,027 0% 15,174 0%
Others (net) 8,856 7,044 26% 10,712 -17%
Total assets 3,003,597 3,042,821 -1% 2,976,886 1%
Liabilities
Due to banks 434,107 720,694 -40% 515,603 -16%
Deposits 2,168,212 1,901,912 14% 2,037,885 6%
CP & Bond payable 42,600 50,900 -16% 50,200 -15%
Bills & bonds sold under repurchase agreement 7,884 58,535 -87% 50,190 -84%
Other liabilities 118,649 98,638 20% 104,332 14%
Total liabilities 2,771,452 2,830,679 -2% 2,758,210 0%
Capital stock (common stock) 80,000 77,000 4% 77,000 4%
Capital surplus 52,019 46,502 12% 46,502 12%
Retain earning 100,255 87,029 15% 92,465 8%
Equity adjustment items (129) 1,611 -108% 2,708 -105%
Total stockholders' equity 232,145 212,142 9% 218,675 6%
Total liabilities and stockholders' equity 3,003,597 3,042,821 -1% 2,976,885 1%
Book value per share (NT$) 29.02 27.55 5% 28.40 2%
* Un-audited consolidated balance sheet.

27
Agenda
Operation Highlights 1
2
Appendix
Financial Performance
3

28
38 offices in 19 countries; 15 offices in SE Asia
Sydney
Brisbane
Melbourne
Labuan Singapore
Thailand: 1 sub.+ 4 branches
Ho Chi Minh City
Manila
Bahrain*
Paris
Amsterdam London
Los Angeles
Vancouver
Richmond
Panama
Colon
Silicon Valley Chicago New York
Toronto
Osaka
Tokyo
Taiwan (OBU)
* Bahrain, Kuala Lumpur, Mumbai and Abu Dhabi are rep. offices
Mega Bank’s Overseas Franchise
Mumbai* Abu Dhabi*
HK
Newly Set Up:
• Ningbo branch, 3rd office in China, opened in
May.
• Phnom Penh, Tuol Kouk sub-branch, 4th office
in Cambodia, opened in July.
In Progress:
• Yangon rep. office in Myanmar , approved.
• Kunshan sub-branch, 4th office in China ,
approved.
• Abu Dhabi branch upgrade, approved.
• Hai Duong (2nd) branch in Vietnam, TBA.
Kuala Lumpur*
Cambodia: 1 branch + 3 sub-branches
China: •Suzhou branch •Wujiang sub-branch •Ningbo branch