megadroughts in north america: placing ipcc...
TRANSCRIPT
JOURNAL OF QUATERNARY SCIENCE (2009)Copyright � 2009 John Wiley & Sons, Ltd.Published online in Wiley InterScience
(www.interscience.wiley.com) DOI: 10.1002/jqs.1303Megadroughts in North America: placing IPCCprojections of hydroclimatic change in along-term palaeoclimate contextEDWARD R. COOK,1* RICHARD SEAGER,1 RICHARD R. HEIM JR,2 RUSSELL S. VOSE,2
CELINE HERWEIJER3 and CONNIE WOODHOUSE41 Lamont-Doherty Earth Observatory, Palisades, New York, USA2 NOAA/NESDIS/National Climatic Data Center, Asheville, North Carolina, USA3 Risk Management Solutions Ltd, London, UK4 University of Arizona, Tucson, Arizona, USA
Cook, E. R., Seager, R., Heim Jr, R. R., Vose, R. S., Herweijer, C. and Woodhouse, C. Megadroughts in North America: placing IPCC projections of hydroclimatic changein a long-term palaeoclimate context. J. Quaternary Sci., (2009). ISSN 0267-8179.
Received 16 November 2008; Revised 8 May 2009; Accepted 10 May 2009
ABSTRACT: IPCC Assessment Report 4 model projections suggest that the subtropical dry zones ofthe world will both dry and expand poleward in the future due to greenhouse warming. The USSouthwest is particularly vulnerable in this regard and model projections indicate a progressive dryingthere out to the end of the 21st century. At the same time, the USA has been in a state of drought overmuch of the West for about 10 years now. While severe, this turn of the century drought has not yetclearly exceeded the severity of two exceptional droughts in the 20th century. So while thecoincidence between the turn of the century drought and projected drying in the Southwest is cause
for concern, it is premature to claim that the model projections are correct. At the same time, great newinsights into past drought variability over North America have been made through the development ofthe North American Drought Atlas from tree rings. Analyses of this drought atlas have revealed pastmegadroughts of unprecedented duration in the West, largely in the Medieval period about 1000 yearsago. A vastly improved Living Blended Drought Atlas (LBDA) for North America now under develop-ment reveals these megadroughts in far greater detail. The LBDA indicates the occurrence of the sameMedieval megadroughts in the West and similar-scale megadroughts in the agriculturally andcommercially important Mississippi Valley. Possible causes of these megadroughts and their implica-tions for the future are discussed. Copyright # 2009 John Wiley & Sons, Ltd.KEYWORDS: megadrought; North America; IPCC; hydroclimatic change; palaeoclimate.
Introduction
The Intergovernmental Panel on Climate Change (IPCC)recently released its Fourth Assessment Report (AR4), ‘ClimateChange 2007’ on the causes, impacts and possible responsestrategies to future climate change. In the Working Group Ireport on ‘The Physical Science Basis’ (IPCC, 2007), a detailedexamination of model-based projections of future globalclimate change was conducted (Meehl et al., 2007). Amongthose was a multi-model assessment of projected changes inprecipitation and surface water from 1999 to 2099 based on themedium A1B forcing scenario that increases greenhouse gas
* Correspondence to: E. R. Cook, Lamont-Doherty Earth Observatory, Palisades,NY 10964, USA.E-mail: [email protected]
emissions until 2050 and gradually decreases them thereafter(Nakicenovic and Swart, 2000).
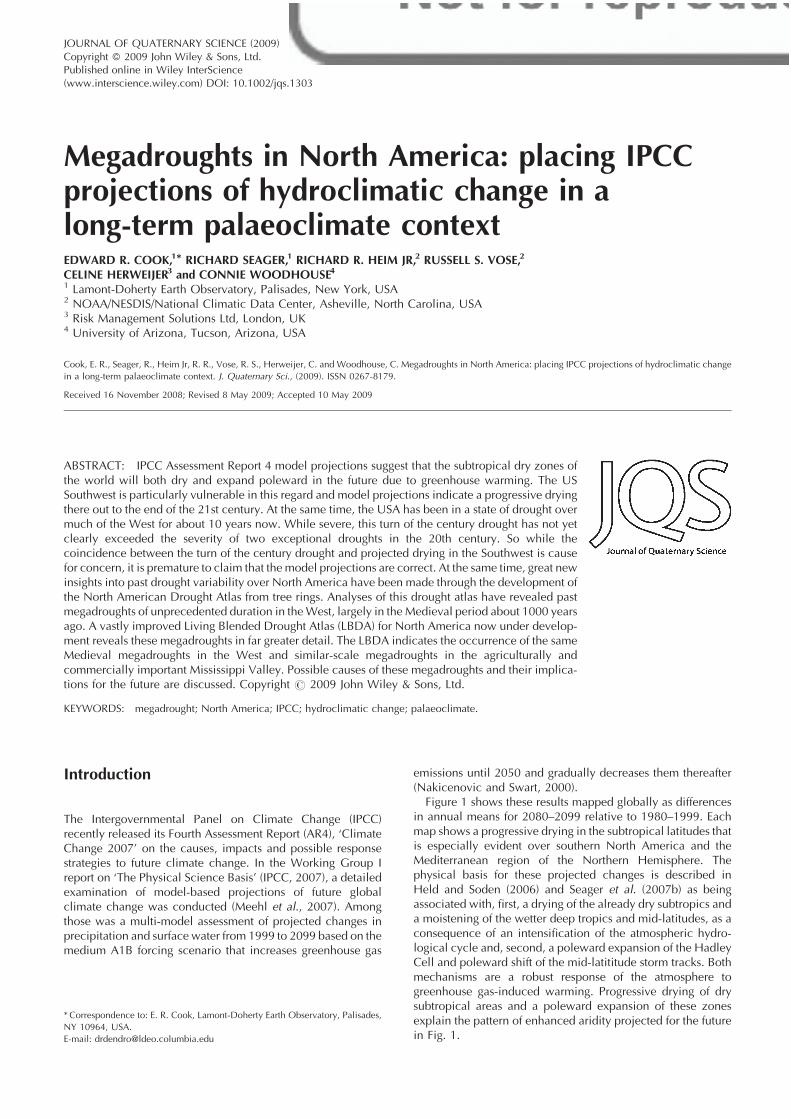
Figure 1 shows these results mapped globally as differencesin annual means for 2080–2099 relative to 1980–1999. Eachmap shows a progressive drying in the subtropical latitudes thatis especially evident over southern North America and theMediterranean region of the Northern Hemisphere. Thephysical basis for these projected changes is described inHeld and Soden (2006) and Seager et al. (2007b) as beingassociated with, first, a drying of the already dry subtropics anda moistening of the wetter deep tropics and mid-latitudes, as aconsequence of an intensification of the atmospheric hydro-logical cycle and, second, a poleward expansion of the HadleyCell and poleward shift of the mid-latititude storm tracks. Bothmechanisms are a robust response of the atmosphere togreenhouse gas-induced warming. Progressive drying of drysubtropical areas and a poleward expansion of these zonesexplain the pattern of enhanced aridity projected for the futurein Fig. 1.
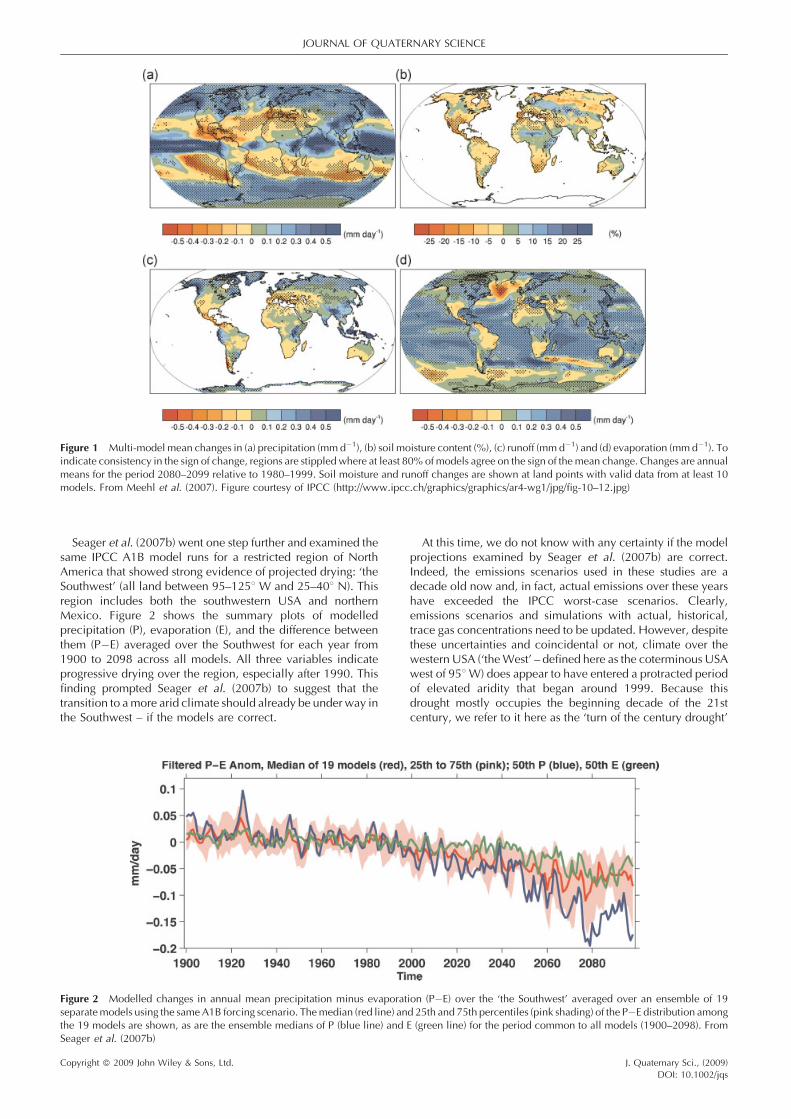
Figure 1 Multi-model mean changes in (a) precipitation (mm d�1), (b) soil moisture content (%), (c) runoff (mm d�1) and (d) evaporation (mm d�1). Toindicate consistency in the sign of change, regions are stippled where at least 80% of models agree on the sign of the mean change. Changes are annualmeans for the period 2080–2099 relative to 1980–1999. Soil moisture and runoff changes are shown at land points with valid data from at least 10models. From Meehl et al. (2007). Figure courtesy of IPCC (http://www.ipcc.ch/graphics/graphics/ar4-wg1/jpg/fig-10–12.jpg)
JOURNAL OF QUATERNARY SCIENCE
Seager et al. (2007b) went one step further and examined thesame IPCC A1B model runs for a restricted region of NorthAmerica that showed strong evidence of projected drying: ‘theSouthwest’ (all land between 95–1258 W and 25–408 N). Thisregion includes both the southwestern USA and northernMexico. Figure 2 shows the summary plots of modelledprecipitation (P), evaporation (E), and the difference betweenthem (P�E) averaged over the Southwest for each year from1900 to 2098 across all models. All three variables indicateprogressive drying over the region, especially after 1990. Thisfinding prompted Seager et al. (2007b) to suggest that thetransition to a more arid climate should already be under way inthe Southwest – if the models are correct.
Figure 2 Modelled changes in annual mean precipitation minus evaporatseparate models using the same A1B forcing scenario. The median (red line) anthe 19 models are shown, as are the ensemble medians of P (blue line) andSeager et al. (2007b)
Copyright � 2009 John Wiley & Sons, Ltd.
At this time, we do not know with any certainty if the modelprojections examined by Seager et al. (2007b) are correct.Indeed, the emissions scenarios used in these studies are adecade old now and, in fact, actual emissions over these yearshave exceeded the IPCC worst-case scenarios. Clearly,emissions scenarios and simulations with actual, historical,trace gas concentrations need to be updated. However, despitethese uncertainties and coincidental or not, climate over thewestern USA (‘the West’ – defined here as the coterminous USAwest of 958 W) does appear to have entered a protracted periodof elevated aridity that began around 1999. Because thisdrought mostly occupies the beginning decade of the 21stcentury, we refer to it here as the ‘turn of the century drought’
ion (P�E) over the ‘the Southwest’ averaged over an ensemble of 19d 25th and 75th percentiles (pink shading) of the P�E distribution amongE (green line) for the period common to all models (1900–2098). From
J. Quaternary Sci., (2009)DOI: 10.1002/jqs
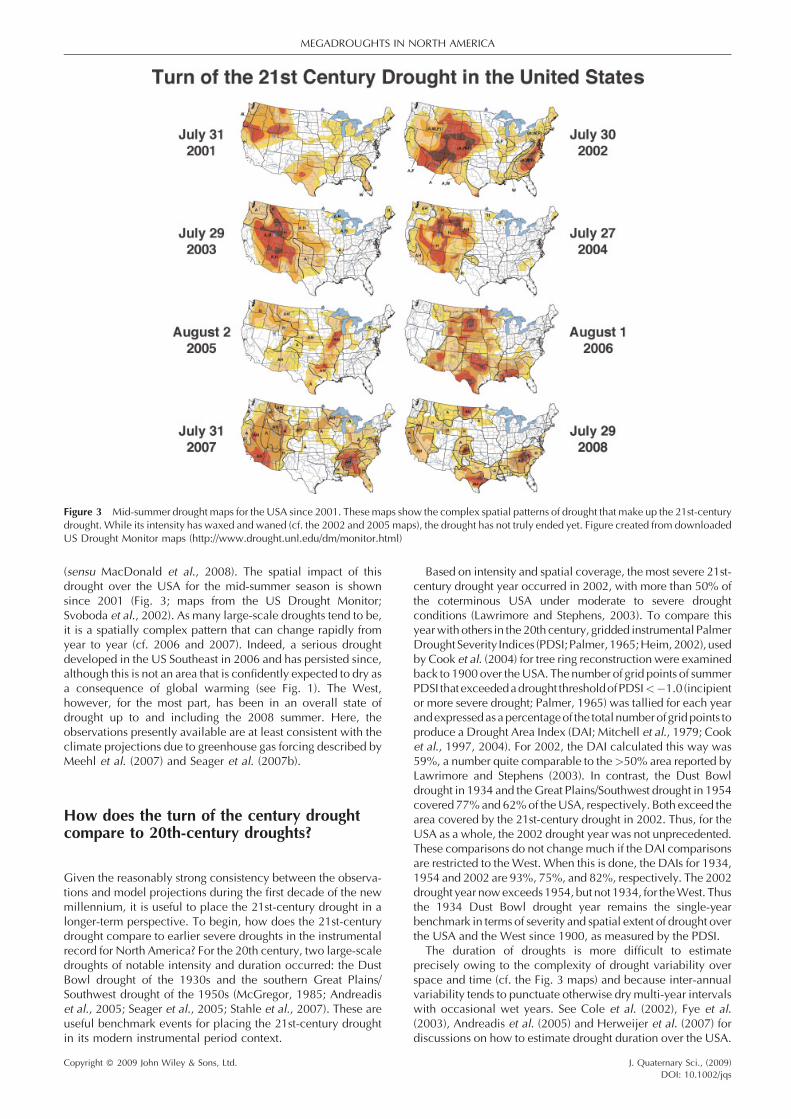
Figure 3 Mid-summer drought maps for the USA since 2001. These maps show the complex spatial patterns of drought that make up the 21st-centurydrought. While its intensity has waxed and waned (cf. the 2002 and 2005 maps), the drought has not truly ended yet. Figure created from downloadedUS Drought Monitor maps (http://www.drought.unl.edu/dm/monitor.html)
MEGADROUGHTS IN NORTH AMERICA
(sensu MacDonald et al., 2008). The spatial impact of thisdrought over the USA for the mid-summer season is shownsince 2001 (Fig. 3; maps from the US Drought Monitor;Svoboda et al., 2002). As many large-scale droughts tend to be,it is a spatially complex pattern that can change rapidly fromyear to year (cf. 2006 and 2007). Indeed, a serious droughtdeveloped in the US Southeast in 2006 and has persisted since,although this is not an area that is confidently expected to dry asa consequence of global warming (see Fig. 1). The West,however, for the most part, has been in an overall state ofdrought up to and including the 2008 summer. Here, theobservations presently available are at least consistent with theclimate projections due to greenhouse gas forcing described byMeehl et al. (2007) and Seager et al. (2007b).
How does the turn of the century droughtcompare to 20th-century droughts?
Given the reasonably strong consistency between the observa-tions and model projections during the first decade of the newmillennium, it is useful to place the 21st-century drought in alonger-term perspective. To begin, how does the 21st-centurydrought compare to earlier severe droughts in the instrumentalrecord for North America? For the 20th century, two large-scaledroughts of notable intensity and duration occurred: the DustBowl drought of the 1930s and the southern Great Plains/Southwest drought of the 1950s (McGregor, 1985; Andreadiset al., 2005; Seager et al., 2005; Stahle et al., 2007). These areuseful benchmark events for placing the 21st-century droughtin its modern instrumental period context.
Copyright � 2009 John Wiley & Sons, Ltd.
Based on intensity and spatial coverage, the most severe 21st-century drought year occurred in 2002, with more than 50% ofthe coterminous USA under moderate to severe droughtconditions (Lawrimore and Stephens, 2003). To compare thisyear with others in the 20th century, gridded instrumental PalmerDroughtSeverity Indices (PDSI;Palmer,1965;Heim,2002), usedby Cook et al. (2004) for tree ring reconstruction were examinedback to 1900 over the USA. The number of grid points of summerPDSI thatexceededadrought thresholdofPDSI<�1.0 (incipientor more severe drought; Palmer, 1965) was tallied for each yearandexpressed asa percentageof the totalnumberof grid points toproduce a Drought Area Index (DAI; Mitchell et al., 1979; Cooket al., 1997, 2004). For 2002, the DAI calculated this way was59%, a number quite comparable to the >50% area reported byLawrimore and Stephens (2003). In contrast, the Dust Bowldrought in 1934 and the Great Plains/Southwest drought in 1954covered 77% and 62% of the USA, respectively. Both exceed thearea covered by the 21st-century drought in 2002. Thus, for theUSA as a whole, the 2002 drought year was not unprecedented.These comparisons do not change much if the DAI comparisonsare restricted to the West. When this is done, the DAIs for 1934,1954 and 2002 are 93%, 75%, and 82%, respectively. The 2002drought year now exceeds 1954, but not 1934, for the West. Thusthe 1934 Dust Bowl drought year remains the single-yearbenchmark in terms of severity and spatial extent of drought overthe USA and the West since 1900, as measured by the PDSI.
The duration of droughts is more difficult to estimateprecisely owing to the complexity of drought variability overspace and time (cf. the Fig. 3 maps) and because inter-annualvariability tends to punctuate otherwise dry multi-year intervalswith occasional wet years. See Cole et al. (2002), Fye et al.(2003), Andreadis et al. (2005) and Herweijer et al. (2007) fordiscussions on how to estimate drought duration over the USA.
J. Quaternary Sci., (2009)DOI: 10.1002/jqs

JOURNAL OF QUATERNARY SCIENCE
Suffice to say, there is no unique solution for calculatingdrought duration. Thus Stahle et al. (2007) estimated that theDust Bowl drought lasted from 1929 to 1940 (12 years) and thesouthern Great Plains/Southwest drought from 1951 to 1964(14 years). In contrast, Seager et al. (2005) defined the DustBowl and southern Great Plains/Southwest droughts asoccurring from 1932 to 1939 (8 years) and from 1948 to1957 (10 years), and Andreadis et al. (2005) estimated the sametwo droughts as occurring from 1932 to 1938 (7 years) and from1950 to 1957 (8 years). The 21st-century drought began around1999 and is still in progress, so its current 10-year duration mustbe viewed as comparable to the previous two droughts withinthe limits of how duration is estimated. Should the currentdrought persist, and perhaps even intensify as suggested bymodel projections (Seager et al., 2007b), the 21st-centurydrought may yet emerge as an unprecedented event comparedto the exceptional droughts of the 20th century. Only time willtell in this regard.
How does the 21st-century droughtcompare to droughts over the pastmillennium?
There is abundant evidence now that some droughts in NorthAmerica prior to the 20th century were remarkably more severecompared to anything we have experienced since that time.Perhaps the most famous example is the ‘Great Drouth’ (sic) ofAD 1276–1299 described by A. E. Douglass (1929, 1935) as thelikely cause of the abandonment of Anasazi cliff dwellingsacross the Colorado Plateau. This 24-year drought easilyexceeds the duration of the worst 20th-century droughtsdescribed earlier. Weakley (1965) found evidence for an evenlonger 38-year drought lasting from AD 1276 to 1313 inNebraska that may have been a more prolonged northerlyextension of the ‘Great Drouth’. Whether or not these droughtsare manifestations of the same event, they pale in comparisonto two extraordinary droughts discovered by Stine (1994) inCalifornia that lasted more than two centuries before AD 1112and more than 140 years before AD 1350 (each based on manycalibrated radiocarbon dates with approximate 50-yearstandard deviations). The durations of these ‘Stine droughts’were based on the number of annual rings in relic tree stumpsrooted in present-day lakes, marshes and streams on the eastside of the Sierra Nevada mountains, solid first-order evidenceof the minimum duration of each megadrought because thesampled tree species cannot live with their roots in water. Eachof these ‘megadroughts’ (by modern standards droughts ofunusually long duration that typically exceed those observed inthe instrumental records; Woodhouse and Overpeck, 1998;Stahle et al., 2000) falls in the so-called Medieval Warm Period(MWP) popularised by Hubert Lamb (1965) as a period ofunusual warmth in Europe and drier-than-average summers inEngland and Wales.
Interest in Lamb’s MWP has typically revolved around itswarmth relative to today (e.g. Crowley and Lowery, 2000;Mann and Jones, 2003; Mann et al., 2003) and its global extent(e.g. Hughes and Diaz, 1994; Bradley et al., 2001; Broecker,2001; Osborn and Briffa, 2006). (See Jansen et al. (2007) for acomprehensive evaluation of the evidence for an MWP and itscomparison to today’s warming.) However, Stine (1994)pointed out that too much emphasis was being placed ontemperature change during the MWP at the expense ofevidence for highly unusual hydroclimatic variability at thesame time in other parts of the world. He therefore suggested
Copyright � 2009 John Wiley & Sons, Ltd.
that the MWP moniker be replaced by the more general‘Medieval Climate Anomaly’ (or MCA) moniker to avoidprejudicing future palaeoclimatic analyses. This suggestion isnow being taken to heart with the growing realization thatunusual hydroclimatic variability may be an even moreimportant characteristic of the MCA (Graham et al., 2007;Herweijer et al., 2007; Seager et al., 2007a).
Past megadroughts, both during and subsequent to the MCAperiod (defined here as falling principally in the AD 900–1300period; Cook et al., 2004), have been reported now over muchof the USA since the work of Douglass (1929, 1935) and Stine(1994) (e.g. Grissino-Mayer, 1996; Laird et al., 1996; Croninet al., 2000; Stahle et al., 2000; Benson et al., 2002; Masonet al., 2004; Yuan et al., 2004; Pederson et al., 2005; Boothet al., 2006). However, the joint temporal and spatial propertiesof these megadroughts were not adequately described until thedevelopment of the North American Drought Atlas (NADA;Cook and Krusic, 2004). The NADA is a set of annually resolvedsummer (June–August) PDSI reconstructions from tree ringsestimated on a 286-point 2.58� 2.58 regular grid that coversmost of North America (Fig. 4(a)) (see Cook et al., 1999, for thebasic methodology used to develop the reconstructions for theNADA). Depending on the region of the grid, the PDSIreconstructions in the NADA are several centuries to amillennium or more in length, with the majority of the longestreconstructions extending back through the MCA being foundin the West (the area within the irregular polygon in Fig. 4(a)).
Cook et al. (2004) transformed the gridded summer PDSIreconstructions in the irregular polygon into estimates of areaaffected by drought each year (DAI based on a PDSI<�1threshold as before) and produced the time series shown inFig. 4(b) (redrawn from Cook et al., 2004). While the annualvalues indicated in Fig. 4(b) are important for understanding thedetails of drought history over the West, the real story isexpressed in the solid black curve (60-year low-pass filteredDAI). The MCA period stands out clearly this way as anextended period of elevated aridity over the West that has notbeen matched since AD 1300. The horizontal red and bluelines show the difference in DAI between the MCA and the 20thcentury up through 2003. The difference between those meansis highly significant (P< 0.001) and translates into a 41%increase in area affected by drought in the West during the MCArelative to the 20th century (Cook et al., 2004). All of thishappened prior to the strong greenhouse gas warming thatbegan with the Industrial Revolution, but perhaps similar totoday also during a period of above-average warmth in theWest (the MWP; Lamb, 1965; LaMarche, 1974). However, asfor the case of future drying, it is probable that themegadroughts were driven by a decrease in precipitation.Higher temperatures, for which there is only tenuous evidencein the West during the MCA, could contribute by increasingevaporative demand and reducing soil moisture, but areunlikely to be able to create megadroughts acting alone. Whilemodel projections of future drying and MCA megadroughtsmay be comparable in the hydrological sense, they havedifferent causes. Future drying in the models is a consequenceof overall global warming and how it impacts the atmosphericcirculation and hydrological cycle, but there is no evidence thatthe MCA was a time of global warming of strength comparableto the current day or model projections of the current century.Proxy records indicate a cold MCA in the tropical PacificOcean (Cobb et al., 2003) as well. While that is also acharacteristic of the 21st-century drought (Seager, 2007), it isnot clear from the models whether this pattern will persist in thefuture (Vecchi et al., 2008).
The NADA has transformed our understanding of pastdroughts over much of North America, but there are ways that it
J. Quaternary Sci., (2009)DOI: 10.1002/jqs
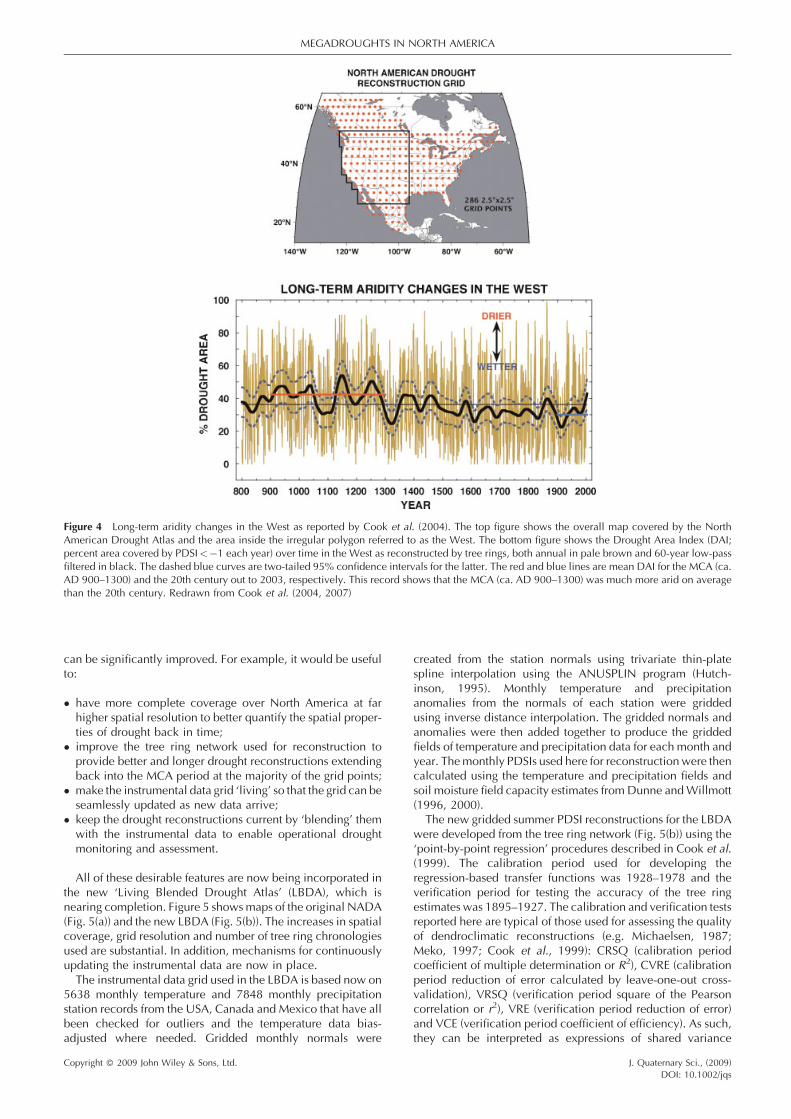
Figure 4 Long-term aridity changes in the West as reported by Cook et al. (2004). The top figure shows the overall map covered by the NorthAmerican Drought Atlas and the area inside the irregular polygon referred to as the West. The bottom figure shows the Drought Area Index (DAI;percent area covered by PDSI<�1 each year) over time in the West as reconstructed by tree rings, both annual in pale brown and 60-year low-passfiltered in black. The dashed blue curves are two-tailed 95% confidence intervals for the latter. The red and blue lines are mean DAI for the MCA (ca.AD 900–1300) and the 20th century out to 2003, respectively. This record shows that the MCA (ca. AD 900–1300) was much more arid on averagethan the 20th century. Redrawn from Cook et al. (2004, 2007)
MEGADROUGHTS IN NORTH AMERICA
can be significantly improved. For example, it would be usefulto:
� h
Co
ave more complete coverage over North America at farhigher spatial resolution to better quantify the spatial proper-ties of drought back in time;
� im
prove the tree ring network used for reconstruction toprovide better and longer drought reconstructions extendingback into the MCA period at the majority of the grid points;� m
ake the instrumental data grid ‘living’ so that the grid can beseamlessly updated as new data arrive;� k
eep the drought reconstructions current by ‘blending’ themwith the instrumental data to enable operational droughtmonitoring and assessment.All of these desirable features are now being incorporated inthe new ‘Living Blended Drought Atlas’ (LBDA), which isnearing completion. Figure 5 shows maps of the original NADA(Fig. 5(a)) and the new LBDA (Fig. 5(b)). The increases in spatialcoverage, grid resolution and number of tree ring chronologiesused are substantial. In addition, mechanisms for continuouslyupdating the instrumental data are now in place.
The instrumental data grid used in the LBDA is based now on5638 monthly temperature and 7848 monthly precipitationstation records from the USA, Canada and Mexico that have allbeen checked for outliers and the temperature data bias-adjusted where needed. Gridded monthly normals were
pyright � 2009 John Wiley & Sons, Ltd.
created from the station normals using trivariate thin-platespline interpolation using the ANUSPLIN program (Hutch-inson, 1995). Monthly temperature and precipitationanomalies from the normals of each station were griddedusing inverse distance interpolation. The gridded normals andanomalies were then added together to produce the griddedfields of temperature and precipitation data for each month andyear. The monthly PDSIs used here for reconstruction were thencalculated using the temperature and precipitation fields andsoil moisture field capacity estimates from Dunne and Willmott(1996, 2000).
The new gridded summer PDSI reconstructions for the LBDAwere developed from the tree ring network (Fig. 5(b)) using the‘point-by-point regression’ procedures described in Cook et al.(1999). The calibration period used for developing theregression-based transfer functions was 1928–1978 and theverification period for testing the accuracy of the tree ringestimates was 1895–1927. The calibration and verification testsreported here are typical of those used for assessing the qualityof dendroclimatic reconstructions (e.g. Michaelsen, 1987;Meko, 1997; Cook et al., 1999): CRSQ (calibration periodcoefficient of multiple determination or R2), CVRE (calibrationperiod reduction of error calculated by leave-one-out cross-validation), VRSQ (verification period square of the Pearsoncorrelation or r2), VRE (verification period reduction of error)and VCE (verification period coefficient of efficiency). As such,they can be interpreted as expressions of shared variance
J. Quaternary Sci., (2009)DOI: 10.1002/jqs

Figure 5 The old NADA drought grid and tree ring network (a) vs. the new LBDA drought grid and tree ring network (b). The California–Nevada(Region A) and the Mississippi Valley (Region B) areas examined for megadroughts are indicated. See the text for details
JOURNAL OF QUATERNARY SCIENCE
between the actual data and the tree ring estimates. However,unlike CRSQ, which can never be negative, CVRE, VRSQ (byretaining the sign of r after squaring), VRE and VCE can alsohave negative values, indicating that there is no skill in theestimates.
Maps showing the calibration and verification results overthe full North American grid are shown in Fig. 6. Only CVRE isshown for the calibration period because it is a moreconservative and less biased expression of goodness-of-fit.White areas in the grid indicate places where calibration and/orverification failed (CVRE< 0, VRSQ with P> 0.10, VRE< 0,VCE< 0). Assessing ‘true’ failure in the verification period ismore difficult to determine, however, because the number ofthe meteorological stations reporting temperature and precipi-tation data used for calculating PDSI declines markedly prior to1930 over large areas of northern Canada, Alaska and Mexico.For this reason, all reconstructions are left in the LBDA with thebelief that the quality of some may be higher than theirverification statistics indicate.
The calibration map indicates that 95% of the grid pointsachieved a CVRE> 0, with a median value of 0.29. For VRSQ,VRE and VCE, the percent successful outcomes decreased to59% (median VRSQ¼ 0.23), 53% (median VRE¼ 0.21) and
Copyright � 2009 John Wiley & Sons, Ltd.
39% (median VCE¼ 0.20), respectively. However, perform-ance is geographically variable, with Alaska and westernCanada verifying reasonably well. When the region isrestricted to the 30–508 N latitude band, where almost allgrid points successfully calibrate and verify, median CVRE,VRSQ, VRE and VCE all increase, to 0.43, 0.33, 0.31, and 0.27,respectively. These values are comparable to those reported byCook et al. (1999) for the coterminous USA only.
Regional examples of megadroughts in thenew Living Blended Drought Atlas
Two examples of how the new LBDA can inform us morecompletely about the temporal and spatial properties of pastMedieval megadroughts over North America will be shownnext. The geographic areas chosen are also located in Fig. 5(b):California–Nevada (A) and the Mississippi Valley (B). Theformer will revisit the Stine droughts and show how thenew drought atlas can provide detailed insights intothe temporal and spatial properties of drought and wetness
J. Quaternary Sci., (2009)DOI: 10.1002/jqs
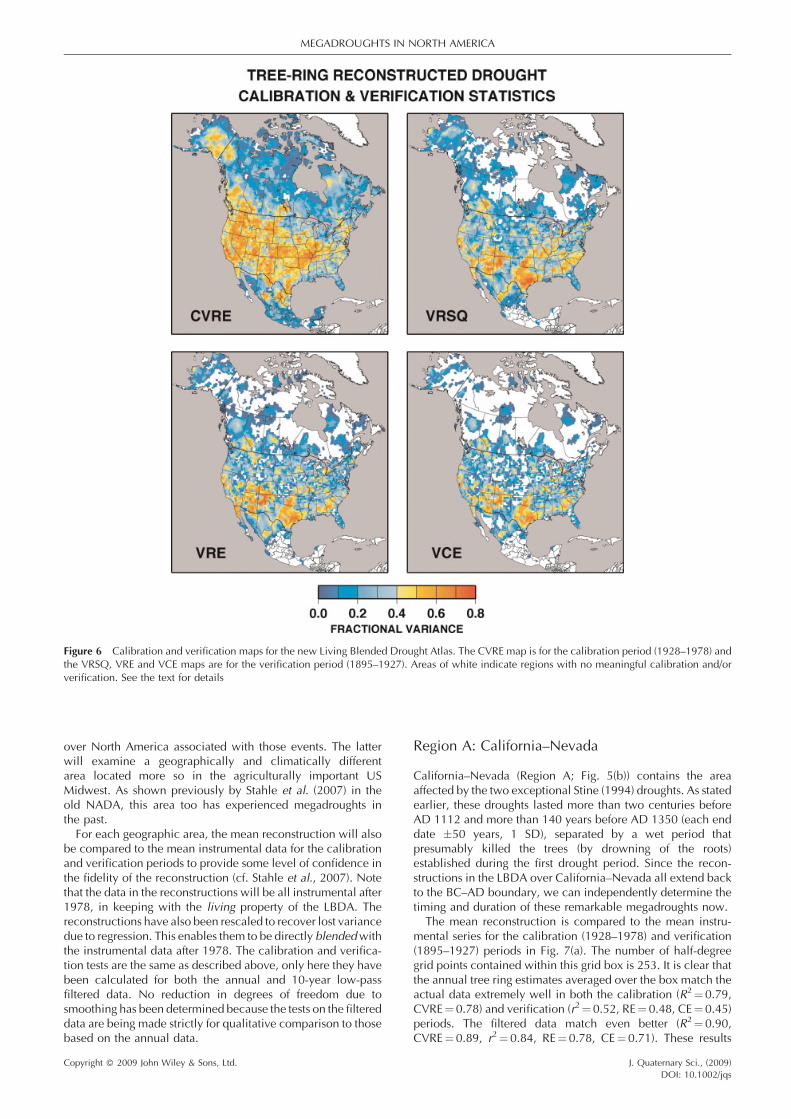
Figure 6 Calibration and verification maps for the new Living Blended Drought Atlas. The CVRE map is for the calibration period (1928–1978) andthe VRSQ, VRE and VCE maps are for the verification period (1895–1927). Areas of white indicate regions with no meaningful calibration and/orverification. See the text for details
MEGADROUGHTS IN NORTH AMERICA
over North America associated with those events. The latterwill examine a geographically and climatically differentarea located more so in the agriculturally important USMidwest. As shown previously by Stahle et al. (2007) in theold NADA, this area too has experienced megadroughts inthe past.
For each geographic area, the mean reconstruction will alsobe compared to the mean instrumental data for the calibrationand verification periods to provide some level of confidence inthe fidelity of the reconstruction (cf. Stahle et al., 2007). Notethat the data in the reconstructions will be all instrumental after1978, in keeping with the living property of the LBDA. Thereconstructions have also been rescaled to recover lost variancedue to regression. This enables them to be directly blended withthe instrumental data after 1978. The calibration and verifica-tion tests are the same as described above, only here they havebeen calculated for both the annual and 10-year low-passfiltered data. No reduction in degrees of freedom due tosmoothing has been determined because the tests on the filtereddata are being made strictly for qualitative comparison to thosebased on the annual data.
Copyright � 2009 John Wiley & Sons, Ltd.
Region A: California–Nevada
California–Nevada (Region A; Fig. 5(b)) contains the areaaffected by the two exceptional Stine (1994) droughts. As statedearlier, these droughts lasted more than two centuries beforeAD 1112 and more than 140 years before AD 1350 (each enddate �50 years, 1 SD), separated by a wet period thatpresumably killed the trees (by drowning of the roots)established during the first drought period. Since the recon-structions in the LBDA over California–Nevada all extend backto the BC–AD boundary, we can independently determine thetiming and duration of these remarkable megadroughts now.
The mean reconstruction is compared to the mean instru-mental series for the calibration (1928–1978) and verification(1895–1927) periods in Fig. 7(a). The number of half-degreegrid points contained within this grid box is 253. It is clear thatthe annual tree ring estimates averaged over the box match theactual data extremely well in both the calibration (R2¼ 0.79,CVRE¼ 0.78) and verification (r2¼ 0.52, RE¼ 0.48, CE¼ 0.45)periods. The filtered data match even better (R2¼ 0.90,CVRE¼ 0.89, r2¼ 0.84, RE¼ 0.78, CE¼ 0.71). These results
J. Quaternary Sci., (2009)DOI: 10.1002/jqs

Figure 7 California–Nevada drought as reconstructed from tree rings in the new living blended drought atlas. The upper graph shows the mean actualvs. mean estimated drought over the area shown in Fig. 5(b). The middle graph shows the mean reconstruction from AD 800 to 2005 with the suggestedtime period of the two Stine megadroughts. The lower graph shows the maps of PDSI for the Stine megadrought periods and the intervening pluvial. Seethe text for details
JOURNAL OF QUATERNARY SCIENCE
lend confidence to the interpretation of the full record as areliable series of past drought over California and Nevada.
Figure 7(b) shows the mean reconstruction just back to AD800 after being 10-year and 50-year low-pass filtered toemphasize the occurrence of megadroughts. In so doing, it ispossible to pick out the likely intervals covered by the two Stinedroughts (Stine no. 1: AD 832–1074; Stine no. 2: AD 1122–1299) and the intervening pluvial (AD 1075–1121) that killed
Copyright � 2009 John Wiley & Sons, Ltd.
the first group of trees. These dates enclose those determined byGraham and Hughes (2007) (AD 900–1009 and AD 1176–1274) for more geographically targeted reconstruction of theMono Lake Medieval low stands based on a one grid pointreconstruction from the original NADA located at 37.58 N,1208 W. These differences are not necessarily in conflict,however, because the estimated timing of the Mono Lake lowstands may simply be reflecting the driest subperiods within the
J. Quaternary Sci., (2009)DOI: 10.1002/jqs

MEGADROUGHTS IN NORTH AMERICA
two more geographically extensive megadrought epochs overCalifornia and Nevada. While the start and end dates assignedhere to the Stine droughts may not be exact, they fall within theradiocarbon uncertainties of Stine’s original termination dates(AD 1112 and AD 1350� 50, 1 SD) and have durations(243 and 178 years) consistent with those reported by Stine(>200 and >140 years). The pluvial sandwiched between thetwo droughts is consequently determined here to have lasted47 years.
Figure 7(c) shows the spatial patterns of drought and wetnessover most of North America during the Stine drought andpluvial epochs. Each drought shows protracted dryness overCalifornia and Nevada as expected, with the footprint of the firstdrought being more spatially restricted there. In both cases, theoverall pattern of PDSI is remarkably similar, with wetconditions in the US Northwest and Canada, the southernGreat Plains and the Northeast, and dry conditions in theMississippi Valley, Central Great Plains and Southeast. Thespatial similarities between the two Stine drought maps suggesta common set of forcings. In contrast, the pluvial shows apattern of persistent wetness projecting into California from thenortheast, but drought and wetness elsewhere similar to thatfound during the droughts. Understanding the causes of theseremarkable MCA megadroughts during a period of nosignificant anthropogenic climate forcing (but still in a warmerworld perhaps) ought to be a high priority given the modelprojections of increasing aridity in the Southwest due toanticipated greenhouse warming (Seager et al., 2007b). At thesame time, it is just as scientifically interesting to ask whatabrupt changes caused the pluvial to begin and end.
It is notable that the spatial patterns associated with the twoextended Californian–Nevada droughts are distinctly differentfrom that of the shorter MCA megadroughts such as that at theend of the 13th century, one in the middle of the 12th centuryand others (Herweijer et al., 2007). These tended to havesimilar spatial patterns to modern-day droughts and impactedall of Southwestern North America and the Plains with wetconditions to the north. That pattern has been used to argue thatthe causes of these megadroughts were similar to the causes ofthe modern droughts: sustained tropical SST anomalies and, inparticular, a more La Nina-like state of the tropical PacificOcean (Seager et al., 2007a). However, tropical ocean forcingcannot easily explain the continental patterns of NorthAmerican hydroclimate associated with the California–Nevadaextended megadroughts.
Region B: Mississippi Valley
The Mississippi Valley (Region B; Fig. 5(b)) has not received asmuch attention as the West regarding past megadroughts.Stahle et al. (2000) described the occurrence of a late 16th-century megadrought there that may have propagated north-ward from Mexico. However, relatively few Mississippi Valleytree ring chronologies beginning before AD 1500 wereavailable for PDSI reconstruction in the original NADA. Thisprompted Stahle et al. (2007) to restrict their examination ofmegadroughts prior to AD 1500 to the West. An updatedversion of the original NADA has now been produced on thesame 2.58 grid (NADAv2a; http://www.ncdc.noaa.gov/cgi-bin/paleo/pd08plot.pl) based on the greatly expanded tree ringnetwork used subsequently in the LBDA. NADAv2a revealedthe occurrence of significant ‘Mississippian’ megadroughts inthe 14th and 15th centuries as well (Cook et al., 2007). Giventhe agricultural and commercial importance of the greaterMississippi Valley region, the new LBDA will be used now to
Copyright � 2009 John Wiley & Sons, Ltd.
examine in more detail the likely occurrence of megadroughtsthere over the past millennium.
The mean reconstruction is compared to the mean instru-mental series for the calibration and verification periods inFig. 8(a). The number of half-degree grid points containedwithin this somewhat larger grid box is 467. As was the case forCalifornia–Nevada, the annual tree ring estimates match theactual data well in both the calibration (R2¼ 0.88,CVRE¼ 0.87) and verification (r2¼ 0.70, RE¼ 0.45, CE¼0.45) periods. The filtered data match even better (R2¼ 0.92,CVRE¼ 0.91, r2¼ 0.91, RE¼ 0.78, CE¼ 0.77). These resultsalso lend confidence to the interpretation of the full record as areliable series of past drought over the Mississippi Valley.
Figure 8(b) shows the mean reconstruction back to AD 900after being 10-year and 50-year low-pass filtered to emphasisethe occurrence of megadroughts, as before. While the meanreconstruction extends back to AD 490, the number of gridpoints with data over most of the domain only extend backusefully to AD 900. Three megadrought periods are highlightedas likely to have occurred in AD 940–985 (46 years), AD 1100–1247 (148 years) and AD 1340–1400 (61 years). In all threecases, both the 10- and 50-year low-pass filtered curves arebelow the zero line (indicating drier conditions) for the fullperiods selected here. These droughts are consistent in timingand duration with inferred megadroughts in the northern GreatPlains based on elevated salinity (i.e., reduced rainfall) periodsin Moon Lake, Coldwater Lake and Rice Lake in North Dakota(Laird et al., 1996; Fritz et al., 2000). The middle and late perioddroughts have also been implicated in the collapse of theCahokia culture in the Mississippi Valley, based on the analysisof the NADAv2a data (Benson et al., 2007, 2009). Other seriousdroughts in the mid 15th and late 16th centuries previouslydescribed by Cook et al. (2007) and Stahle et al. (2007) are alsoapparent, but will not be addressed further.
Figure 8(c) shows the spatial patterns of these three‘Mississippian’ megadroughts that largely fall in the MCAperiod. Each drought shows protracted dryness over theMississippi Valley, as expected, with extensions into thesoutheastern USA and southeastern Canada. The map for AD1100–1247 also indicates an extension of prolonged droughtinto the northern Great Plains, consistent with the megadroughtreported by Laird et al. (1996) for North Dakota. In contrast,wetter conditions are indicated for parts of the northeasternUSA during all three Mississippian megadroughts. However,the spatial pattern in the West changes over time from drier towetter conditions by the time of the AD 1340–1400Mississippian megadrought. This suggests that some changeswere underway in the coupled ocean–atmosphere system asclimate was moving from the MCA period into the cooler LittleIce Age. Again, the spatial pattern associated with theMississippian megadroughts is different from that associatedwith typical tropical SST-forced droughts of the instrumentalperiod. The long record also indicates that drought in theagriculturally and commercially important Mississippi Valleyhas been far worse in the past compared to anything we haveexperienced over the relatively short instrumental record. Thisis a justifiable cause for concern.
Causes and implications for the future
The occurrence of remarkable megadroughts in geographicallyseparate regions of North America during the MCA period andthe transition into the Little Ice Age is very troubling. Theclimate system clearly has the capacity to get ‘stuck’ in drought-
J. Quaternary Sci., (2009)DOI: 10.1002/jqs

Figure 8 Mississippi Valley drought as reconstructed from tree rings in the new Living Blended Drought Atlas. The upper graph shows the meanactual vs. mean estimated drought over the area shown in Fig. 5(b). The middle graph shows the mean reconstruction from AD 900 to 2005 with threemegadrought periods indicated. The lower graph shows the maps of PDSI for the three megadrought periods. See the text for details
JOURNAL OF QUATERNARY SCIENCE
inducing modes over North America that can last severaldecades to a century or more. There is an excellentunderstanding now that the multi-year historical droughts inthe West are frequently linked to cool La Nina-like sea surfacetemperatures (SSTs) in the tropical Pacific El Nino–SouthernOscillation (ENSO) region (e.g. Cole et al., 2002; Fye et al.,2004; Seager et al., 2005; Herweijer et al., 2006; Cook et al.,2007; Herweijer and Seager, 2008), the turn of the centurydrought being the most recent example (Seager, 2007). There is
Copyright � 2009 John Wiley & Sons, Ltd.
also a strong indication that inter-annual drought and wetnessin the Mississippi Valley are associated with the state of theNorth Atlantic Oscillation (NAO) (Fye et al., 2006). Recentmodelling studies by Seager et al. (2008a) and Feng et al. (2008)have also tested the influence of both Atlantic and Pacific SSTson the development of drought in North America. Their resultssuggest that either a cold tropical Pacific or a warm NorthAtlantic can produce droughts. Feng et al. (2008) argued thatboth are probably necessary to produce the intensity and
J. Quaternary Sci., (2009)DOI: 10.1002/jqs

MEGADROUGHTS IN NORTH AMERICA
longevity of megadroughts in North America. Despiteimproved understanding of the causes of droughts on themulti-year to decadal timescale, the causes during theMedieval period of multi-decadal droughts grouped togetherin a period that lasted centuries remain largely unknown.
On longer than multi-year timescales, McCabe et al. (2004)and Huang et al. (2005) have argued that Pacific decadalvariability (sometimes called the Pacific Decadal Oscillation(PDO); Mantua et al., 1997) and the Atlantic Multi-decadalOscillation (AMO; Enfield et al., 2001) are importantcontributors to the low-frequency modulation of wetness anddryness over North America. Since the PDO (20–30 years) andthe AMO (65–80 years) have timescales of variability consistentwith the duration of past megadroughts, it is conceivable thatthey have contributed to the development of those epochs.However, the PDO could also be just a low-frequency versionof ENSO (Zhang et al., 1997), so it need not necessarily be anindependent contributor to low-frequency drought variabilityover North America. The AMO may be a different matter basedon the modelling results of Sutton and Hodson (2005, 2007),Feng et al. (2008) and Seager et al. (2008a), which all showedthat warm tropical North Atlantic SSTs can induce drying overwestern and southern North America. In addition, Dong et al.(2006) suggest that the AMO may even modulate ENSO onmulti-decadal timescales via the impact it has on winds over thetropical Pacific Ocean. It remains unclear, however, whetherthese natural phenomena could give rise to the centennialtimescale variations seen in the North American drought recordor whether external forcing must be appealed to.
Marine coral records from the core ENSO region of thetropical Pacific also support the concept of decadal and longerENSO variability during the last millennium (Cobb et al., 2003),with some indication that the MCA period experiencedpersistent La Nina-like SST conditions that would bedrought-inducing over North America. Modelling experimentsconducted by Seager et al. (2008b) indicate that tropical PacificSSTs reconstructed from fossil coral d18O isotope measure-ments for the 1320–1462 period can produce significantdroughts over North America that are consistent with the multi-decadal tree ring reconstructed MCA megadroughts within thisperiod in terms of amplitude and spatial pattern. However, thedetailed, temporal, model–data match-up was poor, indicatinga potential role for forcing from other ocean basins, assuggested by Feng et al. (2008). Further, the cause of thisunusual period of cool La Nina-like SSTs during the MCAperiod is not adequately understood.
Model experiments using the Zebiak–Cane ENSO model(Zebiak and Cane, 1987) forced by a combination of low-frequency solar irradiance and episodic pulses of explosivevolcanism have produced persistent La Nina-like SSTs duringthe MCA period of strong solar irradiance and weakervolcanism than in the following centuries (Mann et al.,2005; Emile-Geay et al., 2007). One notable event was aninterruption of North American drought by an El Nino inducedby the massive 1258 eruption (Emile-Geay et al., 2008). Thebasic mechanism in the Zebiak–Cane model that leads to thedevelopment of cool La Nina-like SSTs in response to positivesolar forcing is a strong Bjerknes feedback. In the west Pacificwarm pool, where the thermocline is deep and upwelling isweak, SSTs warm to balance the stronger solar radiation withincreased evaporation. In the eastern equatorial Pacific the SSTwarming is partially offset by upwelling of cool water in theequatorial Pacific cold tongue. Hence, in response to increasedinsolation, the west warms by more than the east. This increasesthe east–west SST gradient, which forces a stronger Walkercirculation and sets in motion a positive Bjerknes feedback: asthe Walker circulation intensifies, upwelling increases, and the
Copyright � 2009 John Wiley & Sons, Ltd.
thermocline shoals in the east, which together cause actualcooling of SSTs in the east, i.e. the development of a La Nina-like state. The process by which the Bjerknes feedback creates aLa Nina-like response to positive radiative forcing has beendescribed as an ‘ocean dynamical thermostat’ by Clement et al.(1996) (see also Cane et al., 1997; Cane, 2005).
Enhanced radiative forcing over the tropical Pacific appearsto stimulate the dynamical themostat both in modern times(Clement et al., 1996) and in MCA times, based on modelexperiments (Mann et al., 2005; Emile-Geay et al., 2007). Ineach case, serious droughts over the West have occurred. Thisappears not to be a coincidence, but much more still needs tobe learned about the coupled ocean–atmosphere conditionsduring the MCA period before we can be certain. Thismechanism for drying of western parts of North America isdistinct from that working in model projections of 21st-centuryclimate. The models used in IPCC AR4 do not robustly predict ashift to a more El Nino-like or more La Nina-like state, withsome models going one way and others going the other way,but with almost all of them drying the subtropics in general,including southwestern North America. As explained by Heldand Soden (2006) and Seager et al. (2007b) the model-projected drying arises from overall planetary warming and notby any change in the spatial patterns of tropical SSTs. Of course,it is possible that the model projections of tropical SSTs arewrong and that in nature the dynamical thermostat will causeless warming of eastern equatorial Pacific SSTs than elsewhereand create a more La Nina-like ocean state in the currentcentury. However, doubts about how ENSO will change in thefuture makes any such pronouncement highly uncertain at thistime (Cane, 2005; Collins et al., 2005; Vecchi et al., 2008).Further, it is not clear if a shift to a more La Nina-like state in thecurrent century will make drying in southwestern NorthAmerica, and the subtropics in general, more or less extremethan that induced by overall warming alone.
Conclusions and recommendations
There is no question now that profound megadroughts haveoccurred in North America during the last millennium,principally during MCA times and into the early part of theLittle Ice Age. These droughts have occurred without any needfor enhanced radiative forcing due to anthropogenic green-house gas forcing. There are additional model-based resultssuggesting that the MCA megadroughts were associated withenhanced warming during a time of increased solar irradiance.A ‘dynamical thermostat’ response to this warming in a modelresulted in the development of prolonged La Nina-like SSTs inthe eastern tropical Pacific (Mann et al., 2005; Emile-Geayet al., 2007). IPCC model projections also indicate thelikelihood that the subtropical dry zones will both dry andexpand poleward (Meehl et al., 2007) as warming increasesdue to greenhouse gas forcing, with the US Southwestbecoming increasingly dry in the future (Seager et al.,2007b). While there is no guarantee that the response of theclimate system to greenhouse gas forcing will result inmegadroughts of the kind experienced by North America inthe past, the IPCC model projections are not comforting.
To the degree that drought over large parts of North Americais controlled by ENSO, both past and present, the need to knowmore precisely how ENSO variability and the mean tropicalPacific climate state have changed in the past and will likelychange in the future is critically important. Linking togethertropical Pacific coral records of past ENSO variability and
J. Quaternary Sci., (2009)DOI: 10.1002/jqs

JOURNAL OF QUATERNARY SCIENCE
tropical Pacific climate to form a complete annual record ofchange over the past millennium (Cobb et al., 2003) wouldgreatly enhance our ability to test the linkages between thetropical Pacific and past drought in North America andelsewhere around the globe (Herweijer and Seager, 2008).Current climate model projections of ENSO and the tropicalPacific climate in response to global warming are also tooinconsistent and need to be improved (Cane, 2005; Collinset al., 2005; Vecchi et al., 2008). The influence of the NorthAtlantic SSTs and the AMO on drought over North America alsoneeds to be better understood. Improving the palaeoclimateestimates of past SSTs in the North Atlantic would be animportant step in that direction. Finally, expanding the tree ringdrought atlas to other parts of the globe will help greatly byproviding a more global footprint of past extra-tropical droughtfor analysis, modelling and hypothesis testing.
Acknowledgements This research was funded in full or in part underthe Cooperative Institute for Climate Applications Research (CICAR)award numbers NA03OAR4320179 and NA08OAR4320754 from theNational Oceanic and Atmospheric Administration, US Department ofCommerce. We also acknowledge the support of the NOAA/NESDIS/National Climatic Data Center and a grant to RS from the NSF EarthSystem History program. The statements, findings, conclusions andrecommendations are those of the author(s) and do not necessarilyreflect the views of the National Oceanic and Atmospheric Adminis-tration or the Department of Commerce. Lamont-Doherty PublicationNumber 7276.
References
Andreadis KM, Clark EA, Wood AW, Hamlet AF, Lettenmaier DP. 2005.Twentieth-century drought in the conterminous United States. Jour-nal of Hydrometeorology 6: 985–1001.
Benson L, Kashgarian M, Dye R, Lund S, Paillet F, Smooth J, Kester C,Mensing S, Meko D, Lindstrom S. 2002. Holocene multidecadal andmulticentennial droughts affecting Northern California and Nevada.Quaternary Science Reviews 21: 659–682.
Benson LV, Berry MS, Jolie EA, Spangler JD, Stahle DW, Hattori EM.2007. Possible impacts of early-11th, middle-12th, and late 13thcentury droughts on western Native Americans and the MississippianCahokians. Quaternary Science Reviews 26: 336–350.
Benson LV, Pauketat TR, Cook ER. 2009. Cahokia’s boom and bust inthe context of climate change. American Antiquities (in press).
Booth RK, Notaro M, Jackson ST, Kutzbach JE. 2006. Widespreaddrought episodes in the western Great Lakes region during the past2000 years: geographic extent and potential mechanisms. Earth andPlanetary Science Letters 242: 415–427.
Bradley RS, Briffa KR, Crowley TJ, Hughes MK, Jones PD, Mann ME.2001. The scope of the Medieval Warming. Science 292: 2011–2012.
Broecker WS. 2001. Was the Medieval Warm Period global? Science291: 1497–1499.
Cane MA. 2005. The evolution of El Nino, past and future. Earth andPlanetary Science Letters 164: 1–10.
Cane MA, Clement AC, Kaplan A, Kushnir Y, Murtugudde R, Pozdnya-kov D, Seager R, Zebiak SE. 1997. 20th century sea surface tempera-ture trends. Science 275: 957–960.
Clement AC, Seager R, Cane MA, Zebiak SE. 1996. An ocean dynamicalthermostat. Journal of Climate 9: 2190–2196.
Cobb KM, Charles CD, Edwards RL, Cheng H, Kastner M. 2003.El Nino–Southern Oscillation and tropical Pacific climate duringthe last millennium. Nature 424: 271–276.
Cole J, Overpeck JT, Cook ER. 2002. Multi-year La Nina events andpersistent drought in the contiguous United States. GeophysicalResearch Letters 29: 1647–1650.
Copyright � 2009 John Wiley & Sons, Ltd.
Collins M, CMIP Modelling Groups. 2005. El Nino- or La Nina-likeclimate change? Climate Dynamics 24: 89–104.
Cook ER, Krusic PJ. 2004. North American summer PDSI reconstruc-tions. IGBP PAGES/World Data Center for Paleoclimatology DataContribution Series No. 2004-045, NOAA/NGDC PaleoclimatologyProgram, Boulder, CO.
Cook ER, Meko DM, Stockton CW. 1997. A new assessment of possiblesolar and lunar forcing of the bi-decadal drought rhythm in thewestern United States. Journal of Climate 10: 1343–1356.
Cook ER, Meko DM, Stahle DW, Cleaveland MK. 1999. Droughtreconstructions for the continental United States. Journal of Climate12: 1145–1162.
Cook ER, Woodhouse C, Eakin CM, Meko DM, Stahle DW. 2004. Long-term aridity changes in the western United States. Science 306:1015–1018.
Cook ER, Seager R, Cane MA, Stahle DW. 2007. North Americandrought: reconstructions, causes and consequences. Earth ScienceReviews 81: 93–134.
Cronin T, Willard D, Karlsen A, Ishman S, Verardo S, McGeehin J,Kerhin R, Holmes C, Colman S, Zimmerman A. 2000. Climaticvariability in the eastern United States over the past millennium fromChesapeake Bay sediments. Geology 28: 3–6.
Crowley TJ, Lowery T. 2000. How warm was the Medieval WarmPeriod? Ambio 29: 51–54.
Dong B, Sutton RT, Scaife AA. 2006. Multidecadal modulationof El Nino–Southern Oscillation (ENSO) variance by AtlanticOcean sea surface temperatures. Geophysical Research Letters 33:L08705.
Douglass AE. 1929. The secret of the Southwest solved with talkativetree rings. National Geographic December: 736–770.
Douglass AE. 1935. Dating Pueblo Bonito and other ruins of theSouthwest. National Geographic Society Contributed TechnicalPapers. Pueblo Bonito Series 1: 1–74.
Dunne KA, Willmott CJ. 1996. Global distribution of plant-extractablewater capacity of soil. International Journal of Climatology 16: 841–859.
Dunne KA, Willmott CJ. 2000. Global distribution of plant-extractablewater capacity of soil (Dunne). Dataset. Oak Ridge National Labora-tory Distributed Active Archive Center, Oak Ridge, TN http://www.daac.ornl.gov.
Emile-Geay J, Cane MA, Seager R, Kaplan A, Almasi P. 2007. El Nino asa mediator of the solar influence on climate. Paleoceanography 22:PA3210.
Emile-Geay J, Seager R, Cane MA, Cook ER, Haug GH. 2008. Volca-noes and ENSO over the past millennium. Journal of Climate 21:3134–3148.
Enfield DB, Mestas-Nunez AM, Trimble PJ. 2001. The Atlanticmultidecadal oscillation and its relation to rainfall and riverflows in the continental U.S. Geophysical Research Letters 28:2077–2080.
Feng S, Oglesby RJ, Rowe CM, Loope DB, Hu Q. 2008. Atlantic andPacific SST influences on Medieval drought in North America simu-lated by the Community Atmospheric Model. Journal of GeophysicalResearch 113: D11101.
Fritz SC, Laird KR, Engstrom DR. 2000. Hydrologic variation in thenorthern Great Plains during the last two millennia. QuaternaryResearch 53: 175–184.
Fye F, Stahle DW, Cook ER. 2003. Paleoclimatic analogs to 20thcentury moisture regimes across the USA. Bulletin of the AmericanMeteorological Society 84: 901–909.
Fye FK, Stahle DW, Cook ER. 2004. Twentieth-century sea surfacetemperature patterns in the Pacific during decadal moisture regimesover the United States. Earth Interactions 8: 1–22.
Fye FK, Stahle DW, Cook ER, Cleaveland MK. 2006. NAO influence onsub-decadal moisture variability over central North America. Geo-physical Research Letters 33: L15707.
Graham NE, Hughes MK. 2007. Reconstructing the Mediaeval lowstands of Mono Lake, Sierra Nevada, California, USA. The Holocene17: 1197–1210.
Graham NE, Hughes MK, Ammann CM, Cobb KM, Hoerling MP,Kennett DJ, Kennett JP, Rein B, Stott L, Wigand PE, Xu T. 2007.Tropical Pacific-mid latitude teleconnections in medieval times.Climatic Change 83: 241–285.
J. Quaternary Sci., (2009)DOI: 10.1002/jqs
MEGADROUGHTS IN NORTH AMERICA
Grissino-Mayer HD. 1996. A 2129-year reconstruction of precipitationfor northwestern New Mexico, U.S.A. In Tree Rings, Environment,and Humanity, Dean JS, Meko DM, Swetnam TW (eds). Radio-carbon: Tucson, AZ; 191–204.
Heim RR Jr. 2002. A review of twentieth-century drought indices usedin the United States. Bulletin of the American Meteorological Society83: 1149–1165.
Held IM, Soden BJ. 2006. Robust responses of the hydrological cycle toglobal warming. Journal of Climate 19: 5686–5699.
Herweijer C, Seager R. 2008. The global footprint of persistent extra-tropical drought in the instrumental era. International Journal ofClimatology 28: 1761–1774.
Herweijer C, Seager R, Cook ER. 2006. North American Droughts of themid-to-late nineteenth century: a history, simulation and implicationfor Mediaeval drought. The Holocene 16: 159–171.
Herweijer C, Seager R, Cook ER, Emile-Geay J. 2007. North Americandroughts of the last millennium from a gridded network of tree-ringdata. Journal of Climate 20: 1353–1376.
Huang H-P, Seager R, Kushnir Y. 2005. The 1976/77 transition inprecipitation over the Americas and the influence of tropical seasurface temperatures. Climate Dynamics 24: 721–740.
Hughes MK, Diaz HF. 1994. Was there a ‘Medieval Warm Period’?Climatic Change 26: 109–142.
Hutchinson MF. 1995. Interpolating mean rainfall using thin platesmoothing splines. International Journal of Geographical InformationSystems 9: 385–403.
IPCC. 2007. Climate Change 2007: The Physical Science Basis. Con-tribution of Working Group I to the Fourth Assessment Report of theIntergovernmental Panel on Climate Change, Solomon S, Qin D,Manning M, Chen Z, Marquis M, Averyt KB, Tignor M, Miller HL(eds). Cambridge University Press: Cambridge, UK.
Jansen E, Overpeck J, Briffa KR, Duplessy J-C, Joos F, Masson-Delmotte V, Olago D, Otto-Bliesner B, Peltier WR, Rahmstorf S,Ramesh R, Raynaud D, Rind D, Solomina O, Villalba R, Zhang D.2007. Palaeoclimate. In Climate Change 2007: The PhysicalScience Basis. Contribution of Working Group I to the FourthAssessment Report of the Intergovernmental Panel on ClimateChange, Solomon S, Qin D, Manning M, Chen Z, Marquis M,Averyt KB, Tignor M, Miller HL (eds). Cambridge University Press:Cambridge, UK.
Laird KR, Fritz SC, Maasch KA, Cumming BF. 1996. Greater droughtintensity and frequency before A.D. 1200 in the Northern GreatPlains, U.S.A. Nature 384: 552–554.
LaMarche VC Jr. 1974. Paleoclimatic inferences from long tree-ringrecords. Science 183: 1043–1048.
Lamb HH. 1965. The early medieval warm epoch and its sequel.Palaeogeography, Palaeoclimatology, Palaeoecology 1: 13–37.
Lawrimore J, Stephens S. 2003. Climate of 2002 Annual Review. NOAANational Climatic Data Center. Report available at http://lwf.ncdc.noaa.gov/oa/climate/research/2002/ann/drought-summar-y.html [2 June 2009].
MacDonald GM, Stahle DW, Diaz JV, et al. 2008. Climate warmingand 21st-century drought in southwestern North America. Eos,Transactions of the American Geophysical Union 89: 82.
Mann ME, Jones PD. 2003. Global surface temperatures over the pasttwo millennia. Geophysical Research Letters 30: 1820.
Mann ME, Ammann CM, Bradley RS, Briffa KR, Crowley TJ, HughesMK, Jones PD, Oppenheimer M, Osborn TJ, Overpeck JT, RutherfordS, Trenberth KE, Wigley TML. 2003. On past temperatures andanomalous late 20th century warmth. Eos, Transactions of the Amer-ican Geophysical Union 84(27), doi: 10.1029/2003EO270003
Mann ME, Cane MA, Zebiak SE, Clement A. 2005. Volcanic and solarforcing of the tropical Pacific over the past 1000 years. Journal ofClimate 18: 447–456.
Mantua NJ, Hare SR, Zhang Y, Wallace JM, Francis RC. 1997.A Pacific interdecadal oscillation with impacts on salmon pro-duction. Bulletin of the American Meteorological Society 78:1069–1079.
Mason JA, Swinehart JB, Goble RJ, Loope DB. 2004. Late Holocenedune activity linked to hydrological drought, Nebraska Sand Hills,USA. The Holocene 14: 209–217.
McCabe GJ, Palecki MA, Betancourt JL. 2004. Pacific and AtlanticOcean influences on multidecadal drought frequency in the United
Copyright � 2009 John Wiley & Sons, Ltd.
States. Proceedings of the National Academy of Sciences 101: 4136–4141.
McGregor KM. 1985. Drought during the 1930s and 1950s in thecentral United States. Physical Geography 6: 288–301.
Meehl GA, Stocker TF, Collins WD, Friedlingstein P, Gaye AT, GregoryJM, Kitoh A, Knutti R, Murphy JM, Noda A, Raper SCB, Watterson IG,Weaver AJ, Zhao Z-C. 2007. Global climate projections. In ClimateChange 2007: The Physical Science Basis. Contribution of WorkingGroup I to the Fourth Assessment Report of the IntergovernmentalPanel on Climate Change, Solomon S, Qin D, Manning M, Chen Z,Marquis M, Averyt KB, Tignor M, Miller HL (eds). CambridgeUniversity Press: Cambridge, UK.
Meko DM. 1997. Dendroclimatic reconstruction with time varying pre-dictor subsets of tree indices. Journal of Climate 10: 687–696.
Michaelsen J. 1987. Cross validation in statistical climate forecastmodels. Journal of Climate and Applied Meteorology 26: 1589–1600.
Mitchell JM Jr, Stockton CW, Meko DM. 1979. Evidence of a 22-yearrhythm of drought in the western United States related to the Halesolar cycle since the 17th century. In Solar–Terrestrial Influences onWeather and Climate, McCormac BM, Seliga TA (eds). D. Reidel:Dordrecht; 125–144.
Nakicenovic N, Swart R (eds). 2000. Special Report on EmissionsScenarios. Cambridge University Press: New York.
Osborn TJ, Briffa KR. 2006. The spatial extent of 20th-century warmth inthe context of the past 1200 years. Science 311: 841–844.
Palmer WC. 1965. Meteorological Drought. Weather Bureau ResearchPaper 45, US Department of Commerce, Washington, DC.
Pederson DC, Peteet DM, Kurdyla D, Guilderson T. 2005. MedievalWarming, Little Ice Age, and European impact on the environmentduring the last millennium in the lower Hudson Valley, New York,USA. Quaternary Research 63: 238–249.
Seager R. 2007. The turn of the century North American drought: globalcontext, dynamics and past analogues. Journal of Climate 20: 1353–1376.
Seager R, Kushnir Y, Herweijer C, Naik N, Velez J. 2005. Modelingof tropical forcing of persistent droughts and pluvials overwestern North America: 1856–2000. Journal of Climate. 18:4068–4091.
Seager R, Graham N, Herweijer C, Gordon AL, Kushnir Y, Cook E.2007a. Blueprints for Medieval hydroclimate. Quaternary ScienceReviews 26: 2322–2336.
Seager R, Ting M, Held I, Kushnir Y, Lu J, Vecchi G, Huang H-P, HarnikN, Leetmaa A, Lau N-C, Li C, Velez J, Naik N. 2007b. Modelprojections of an imminent transition to a more arid climate insouthwestern North America. Science 316: 1181–1184.
Seager R, Kushnir Y, Ting MF, Cane M, Naik N, Velez J. 2008a. Wouldadvance knowledge of 1930s SSTs have allowed prediction of theDust Bowl drought? Journal of Climate 21: 3261–3281.
Seager R, Burgman R, Kushnir Y, Clement AC, Cook ER, Naik N, MillerJ. 2008b. Tropical Pacific forcing of North American Medievalmegadroughts: testing the concept with an atmosphere model forcedby coral-reconstructed SSTs. Journal of Climate 21: 6175–6190.
Stahle DW, Cook ER, Cleaveland MK, Therrell MD, Meko DM,Grissino-Mayer HD, Watson E, Luckman BH. 2000. Tree-ringdata document 16th century megadrought over North America.Eos, Transactions of the American Geophysical Union. 81: 121–125.
Stahle DW, Fye FK, Cook ER, Griffin RD. 2007. Tree-ring reconstructedmegadroughts over North America since AD 1300. Climatic Change83: 133–149.
Stine S. 1994. Extreme and persistent drought in California and Pata-gonia during mediaeval time. Nature 369: 546–549.
Sutton RT, Hodson DLR. 2005. Atlantic Ocean forcing of NorthAmerican and European summer climate. Science 309: 115–118.
Sutton RT, Hodson DLR. 2007. Climate response to basin-scale warm-ing and cooling for the North Atlantic Ocean. Journal of Climate 20:891–907.
Svoboda M, LeComte D, Hayes M, Heim R, Gleason K, Angel J, RippeyB, Tinker R, Palecki M, Stooksbury D, Miskus D, Stephens S. 2002.The drought monitor. Bulletin of the American MeteorologicalSociety 83: 1181–1190. http://www.drought.unl.edu/dm/moni-tor.html [2 June 2009].
J. Quaternary Sci., (2009)DOI: 10.1002/jqs
JOURNAL OF QUATERNARY SCIENCE
Vecchi GA, Clement A, Soden BJ. 2008. Examining the tropicalPacific’s response to global warming. EOS, Transactions of theAmerican Geophysical Union 89: 81, 83.
Weakly HE. 1965. Recurrence of drought in the Great Plains during thelast 700 years. Agricultural Engineering 46: 85.
Woodhouse CA, Overpeck JT. 1998. 2000 years of drought variabilityin the central United States. Bulletin of the American MeteorologicalSociety 79: 2693–2714.
Copyright � 2009 John Wiley & Sons, Ltd.
Yuan F, Linsley BK, Lund SP, McGeehin JP. 2004. A 1200 year recordof hydrologic variability in the Sierra Nevada from sediments inWalker Lake, Nevada. Geochemistry, Geophysics and Geosystems 5:Q03007.
Zebiak SE, Cane MA. 1987. A model El Nino–Southern Oscillation.Monthly Weather Review 115: 2262–2278.
Zhang Y, Wallace JM, Battisti DS. 1997. ENSO-like interdecadalvariability: 1900–93. Journal of Climate 10: 1004–1020.
J. Quaternary Sci., (2009)DOI: 10.1002/jqs