melbourne 2030 audit: analysis of progress and findings ... · pdf filemelbourne 2030 audit:...
TRANSCRIPT

Melbourne 2030 Audit:Analysis of Progress and
Findings from the 2006 Census

The Department of Planning and Community
Development (DPCD) was established on 14 August 2007
and will deliver improvements in urban development,
including ensuring growing communities have the
support, services and infrastructure they need.
The department will also focus on building strong
local communities across the state and will make
sure that community development is at the core of
planning and urban development.
References to the Department of Sustainability
and Environment (DSE) within this document can
be generally taken as referring to the Department of
Planning and Community Development,
except where they refer to environmental functions
which remain the focus of the DSE. References to the former
Department for Victorian Communities (DVC) can also
generally be taken as referring to the Department of Planning
and Community Development.
Published by the Department of Planning and Community Development8 Nicholson Street, East Melbourne Victoria 3002© Copyright State Government of Victoria 2007This publication is copyright. No part may be reproduced by any process except in accordance with provisions of the Copyright Act 1968.Authorised by the Victorian Government, Melbourne.ISBN 978-1-74208-133-5.

3 Melbourne 2030 Audit: Analysis of Progress and Findings from the 2006 Census
Contents
Purpose of this document
This report outlines key findings of the 2006 Census and provides an analysis of progress made in implementing Melbourne 2030. These findings have been informed by early analysis of 2006 Census data, a review of Victorian Government actions in implementing Melbourne 2030 and the views of key stakeholders. This report will assist the work of the independent Audit Expert Group and organisations interested in Melbourne 2030 and the Audit.
The report is structured around six key questions for consideration during Stages 2 and 3 of the Audit.
What have been the major external trends in the last five years? 6
Has the first five year Implementation Program been completed? 14
What progress has been made in major policy areas? 15
Activity centres 15
Urban Growth Boundary 22
Green wedges 23
Growth area planning 25
Parks, waterways and open space 29
Protecting the suburbs and better urban design outcomes 30
Transport 32
Environmental sustainability 38
A more prosperous city 40
A fairer city and housing affordability 42
Better planning decisions 47
Partnerships in Melbourne 2030 implementation 48
Is new development reflecting the intent of Melbourne 2030? 50
What policy refinements are needed? 54
What initiatives need to be completed over the next five years to enhance effective implementation of Melbourne 2030? 54
The Audit is an important opportunity to reflect on what has been done and what needs to be done in the future to enhance Melbourne’s liveability. More detailed information about the findings of the Audit will be provided when it is completed in 2008.

Melbourne 2030 Audit: Analysis of Progress and Findings from the 2006 Census4
About Melbourne 2030
Melbourne 2030 - Planning for Sustainable Growth is the Victorian Government’s strategic plan to manage growth and change across metropolitan Melbourne. Released in 2002, it provides a long-term framework to reduce urban sprawl, consolidate an increased share of urban development around transport nodes to more efficiently use existing infrastructure, and improve access to services and facilities. At the core of Melbourne 2030 are nine ‘directions’ or desired results. Achieving these over time depends on putting into action specific, carefully-framed policies and initiatives:
Direction 1 – A more compact city
Direction 2 – Better management of metropolitan growth
Direction 3 – Networks with the regional cities
Direction 4 – A more prosperous city
Direction 5 – A great place to be
Direction 6 – A fairer city
Direction 7 – A greener city
Direction 8 – Better transport links
Direction 9 – Better planning decisions, careful management
About the Melbourne 2030 Audit
In June 2006, the Minister for Planning announced an audit of Melbourne 2030 would focus on:
assessing whether new development on the ground ■
reflected the intent of Melbourne 2030
assessing whether the first five year ■
implementation program had been completed and its effectiveness
identifying initiatives to be completed over the next ■
five years to continue effectively implementing Melbourne 2030.
While it is too early in the life of Melbourne 2030 to assess the full impact of all implementation activities, it is important to take stock of progress and make adjustments where necessary.
For over 150 years, Melbourne has benefited from an ongoing process of metropolitan planning which continues to look ahead 25 to 30 years (and longer with respect to major infrastructure decisions). The Audit is a key step in continuing that legacy and delivering on Policy 9.3 in Melbourne 2030 which commits to keeping Melbourne 2030 up to date.
Introduction

5 Melbourne 2030 Audit: Analysis of Progress and Findings from the 2006 Census
The Victorian Government has established a three stage process for the Audit which will provide for input by interested parties:
> Stage 1 - a stocktake conducted by the Department of Sustainability and Environment (now the Department of Planning and Community Development) which considers recent trends and the views of key stakeholders. This ‘Melbourne 2030 Audit: Analysis of Progress and Findings from the 2006 Census’ report forms part of Stage 1 of the Audit.
> Stage 2 - establishment of an independent Audit Expert Group (AEG) to:
consider information gathered during the stocktake ■
consider information and views provided through ■
a public submissions process
provide advice to the government on priorities ■
for enhancing and promoting Melbourne’s liveability through Melbourne 2030 implementation.
The AEG is expected to submit its report and recommendations to the Minister for Planning in early 2008.
> Stage 3 - consideration by the State Government of the information and advice gathered from Stages 1 and 2.
About the Audit Expert Group (AEG)
In June 2007, the Minister for Planning announced a four-member independent AEG to provide advice during Stage 2 of the Audit, including helping review submissions from the community, local government, industry and key stakeholders. The members of the AEG are:
Chair: Professor Rob Moodie ■ , current Chair of Global Health, University of Melbourne. Former CEO of the Victorian Health Promotion Foundation with almost 30 years experience in multi-disciplinary public policy roles.
Michael Wright (Queens Counsel) ■ , a specialist in planning law for 40 years.
David Whitney ■ , an eminent Victorian planner with over 35 years experience.
Dr Ann McAfee ■ , an international planning expert with many years of experience at the City of Vancouver (Canada).
The terms of reference for the AEG are available on the Melbourne 2030 website (www.melbourne2030.vic.gov.au).

Melbourne 2030 Audit: Analysis of Progress and Findings from the 2006 Census6
Major external trends identified during Stage 1 of the Audit are summarised as:
Population and household growth ■ - The 2006 Census shows Australia continued to record faster population growth than other major developed world economies. Victoria’s average annual growth rate was 1.3 per cent in the period 2001-2006, compared with 1.1 per cent in 1996-2001 and 0.6 per cent in 1991-1996. At 30 June 2006, the population of Melbourne was 3.74 million and the population of regional Victoria was 1.38 million. The fastest growing municipalities in metropolitan Melbourne were located on the urban fringe, as well as the municipality of Melbourne, continuing the trend established in the 1996-2001 intercensal period. There were no municipalities in the Melbourne metropolitan region that lost population between 2001 and 2006. This compares with the period 1996-2001 when three municipalities lost population. Declining household size is also a trend, with 90 per cent of additional households between 2001 and 2031 projected to be one and two person households. Updated population and demographic projections will be prepared in 2008, informed by the results of the 2006 Census.
Economic growth ■ - Analysis of trends shows economic growth has been strong in the last five years. These trends are discussed further under the section: ‘A more prosperous city’.
Ageing of the population ■ - Ageing of the population is a central characteristic of population change in Australia. Across Melbourne, there are two concurrent trends emerging. The first is the increase in the number of metropolitan households with members in older age groups. The second is the trend for more localised ageing of the population associated with the stage in the development cycle of particular suburbs. As a result, there is a particularly pronounced ageing trend in the band of middle suburbs which were settled in the post-war years.
Environmental issues, including climate ■
change and water management - Environmental issues have evolved into central policy considerations at the core of government decision-making. These challenges were anticipated when developing Melbourne 2030, and the framework it provides for managing environmental issues remains appropriate. However the degree of urgency attached to addressing them has increased.
Rising petrol prices and transport costs ■ - Increasing petrol and transport costs have highlighted the importance of ensuring Melbourne’s public transport is a viable option for a higher proportion of journeys. While this was also anticipated when Melbourne 2030 was released in 2002, significant growth in public transport patronage and the possibility of future petrol price rises make the implementation of activity centre policy and an ongoing commitment to improving the Principal Public Transport Network more urgent. Investment in the transport system has increased significantly since Melbourne 2030 was released, particularly after the Linking Melbourne: Metropolitan Transport Plan was released and $10.5 billion was committed in Meeting Our Transport Challenges.
Housing affordability ■ - This has generally declined across Australia since 1999, driven mainly by increased demand for housing as cheap and easily accessible finance became available and strong growth occurred in disposable incomes. The significant upturn in demand has put pressure on housing prices. Melbourne 2030 policies have positioned Victoria relatively well compared to other states, particularly with respect to the effective management of land supply which will remain critically important.
What have been the major external trends in the last five years?

7 Melbourne 2030 Audit: Analysis of Progress and Findings from the 2006 Census
What are the implications of the external trends for Melbourne 2030 implementation?
The analysis of trends indicates that the fundamental assumptions of Melbourne 2030 remain sound and the strategic framework it provides remains adaptable to changing circumstances, such as the higher than projected population growth Melbourne is experiencing. Implementation has, however, become more urgent given the increasing awareness of climate change impacts and the need for significant and early action on greenhouse gas emission reductions, water shortages, higher petrol prices and housing affordability issues, for example.
The following pages provide key demographic information from the 2006 Census which will provide an important context for Stages 2 and 3 of the Audit:
Australia’s population growth ■
Victoria’s population growth ■
Metropolitan Melbourne’s population growth ■
Regional Victoria’s population growth ■
Ageing of the population ■
Household formation ■
More detailed analysis of the 2006 Census results will continue to occur and will inform later stages of the Audit.
National and local demographic trends
This section details national and local demographic trends which provide an important context for Stages 2 and 3 of the Audit.
Australia’s population growth
Australia continues to record faster population growth than other major developed world economies. Within South East Asia, Australia’s population growth is faster than that of China and New Zealand, but slower than our other major trading partners. The average annual growth rate for Australia in the period 2001-2006 was 1.3 per cent.

Melbourne 2030 Audit: Analysis of Progress and Findings from the 2006 Census8
Victoria’s population growth
At 30 June 2006, the population of Victoria was estimated to be 5.1 million with:
3.7 million people in Melbourne ■
1.4 million people in regional Victoria. ■
Victoria’s average annual growth rate was 1.3 per cent in the period 2001-2006, the same rate as for Australia overall. In Victoria the relative contribution of the components of population change has varied considerably over the last 30 years that this data has been collected (Figure 1):
Natural increase has been a relatively stable ■
component of growth.
Overseas migration has been comparatively volatile, ■
its cycles often corresponding to domestic economic and labour market conditions.
Interstate migration has generally been strongly ■
negative although the transition and regeneration of Victoria’s economy over the last ten years has resulted in this changing.
Victoria is currently experiencing a combination of strong natural increase and overseas migration and very low interstate losses. The other relevant component of change for Melbourne is ‘within state’ migration - the movement of people between Melbourne and regional Victoria.
In terms of Melbourne 2030, a major increase in migration would result in faster population growth, with Melbourne reaching an extra million people, and 620,000 households, earlier than 2030.
Figure 1 Components of Victoria’s population change, 1972-2006
Source: Department of Sustainability and Environment 2007

9 Melbourne 2030 Audit: Analysis of Progress and Findings from the 2006 Census
Figure 2 Average annual population growth, Melbourne Local Government Areas (LGAs), 2001-2006
Source: Department of Sustainability and Environment 2007
Metropolitan Melbourne’s population growth
Analysis of 2006 Census data shows that:
In the period 2001-2006, Melbourne recorded ■
the largest absolute growth of all state capital cities (272,700), ahead of Brisbane (191,300) and Sydney (156,100).
Melbourne’s average annual growth rate was 1.5 per ■
cent in the period 2001-2006. Melbourne grew faster in the period 2001-2006 compared to 1996-2001.
Melbourne’s share of Victoria’s population was ■
estimated to be 73 per cent in 2006.
Between 2001 and 2006, the fastest growing ■
municipalities within metropolitan Melbourne were located on the urban fringe, as well as the municipality of Melbourne (Figure 2), continuing the trend established in the 1996-2001 intercensal period (Figure 3).
The municipalities of Melton and Melbourne ■
recorded average annual population growth rates of 8.9 per cent and 8.6 per cent respectively, and were also the fastest growing municipalities in Victoria in the period 2001-2006.
Wyndham (5.9 per cent), Cardinia (4.5 per cent) ■
and Casey (4.1 per cent) also recorded high average annual growth rates over the period 2001-2006.
These five municipalities also grew at faster rates ■
than the previous intercensal period.
Casey recorded the largest absolute growth ■
between 2001 and 2006, numbering some 40,700 persons. This was followed by Wyndham (28,900) and Melton (28,100).
There were no municipalities in the metropolitan ■
region that lost population between 2001 and 2006 (Figure 4). This compares with the period 1996-2001 when three municipalities lost population (Greater Dandenong, Moreland and Maribyrnong).
Average Annual Population Growth
More than 2.0%
1.0% to 2.0%
0.0% to 1.0%

Melbourne 2030 Audit: Analysis of Progress and Findings from the 2006 Census10
Figure 3 Average annual population growth, Melbourne LGAs, 1996-2001
Source: Department of Sustainability and Environment 2007
Figure 4 Absolute population change, Melbourne LGAs, 2001-2006
Source: Department of Sustainability and Environment 2007
Average Annual Population Growth
More than 2.0%
1.0% to 2.0%
0.0% to 1.0%
Population decline
Population Change (No. of persons)
30,00015,0003,000
11 Melbourne 2030 Audit: Analysis of Progress and Findings from the 2006 Census
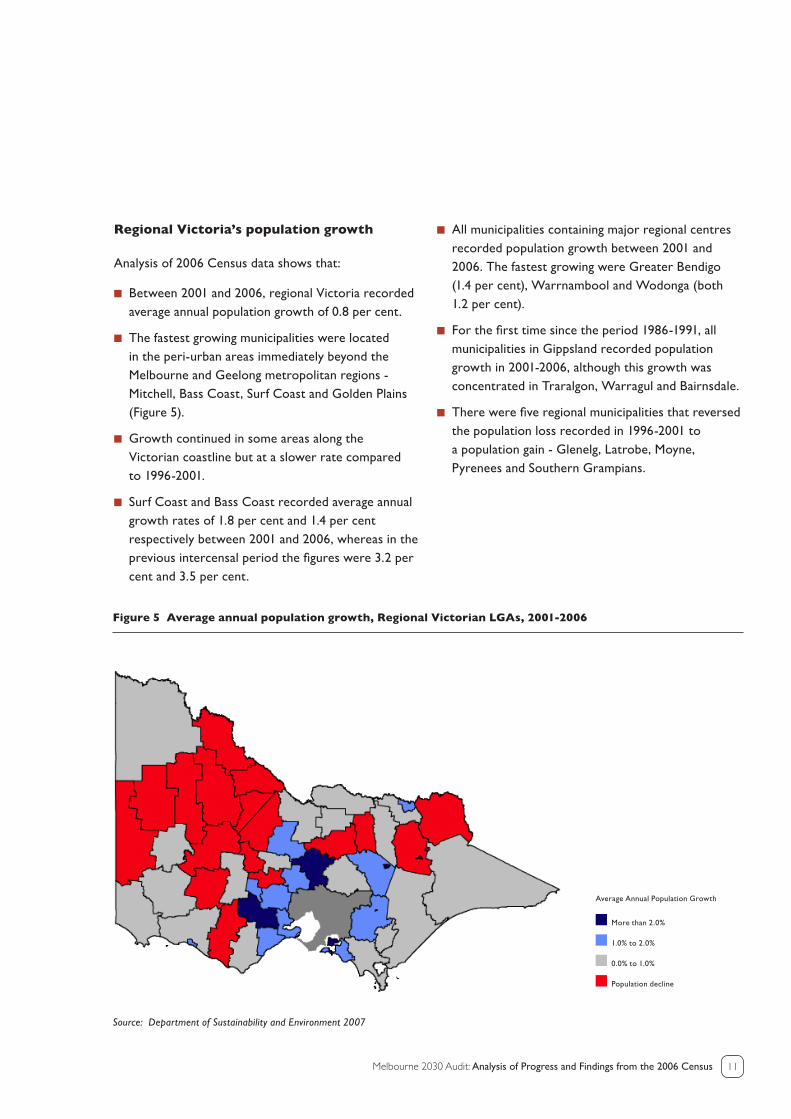
Regional Victoria’s population growth
Analysis of 2006 Census data shows that:
Between 2001 and 2006, regional Victoria recorded ■
average annual population growth of 0.8 per cent.
The fastest growing municipalities were located ■
in the peri-urban areas immediately beyond the Melbourne and Geelong metropolitan regions - Mitchell, Bass Coast, Surf Coast and Golden Plains (Figure 5).
Growth continued in some areas along the ■
Victorian coastline but at a slower rate compared to 1996-2001.
Surf Coast and Bass Coast recorded average annual ■
growth rates of 1.8 per cent and 1.4 per cent respectively between 2001 and 2006, whereas in the previous intercensal period the figures were 3.2 per cent and 3.5 per cent.
All municipalities containing major regional centres ■
recorded population growth between 2001 and 2006. The fastest growing were Greater Bendigo (1.4 per cent), Warrnambool and Wodonga (both 1.2 per cent).
For the first time since the period 1986-1991, all ■
municipalities in Gippsland recorded population growth in 2001-2006, although this growth was concentrated in Traralgon, Warragul and Bairnsdale.
There were five regional municipalities that reversed ■
the population loss recorded in 1996-2001 to a population gain - Glenelg, Latrobe, Moyne, Pyrenees and Southern Grampians.
Figure 5 Average annual population growth, Regional Victorian LGAs, 2001-2006
Source: Department of Sustainability and Environment 2007
Average Annual Population Growth
More than 2.0%
1.0% to 2.0%
0.0% to 1.0%
Population decline

Melbourne 2030 Audit: Analysis of Progress and Findings from the 2006 Census12
Proportion
More than 30% (16)
20% to 29.9% (129)
10% to 19.9% (241)
5% to 9.9% (51)
Less than 5% (63)
Ageing of the population
Australia’s population is ageing. Figure 6 illustrates projected growth in older age groups within metropolitan Melbourne.
Two trends are emerging:
the number of metropolitan households with ■
members in older age groups is increasing
some suburbs have a greater proportion of older ■
people than others, mainly the middle suburbs settled in the post-war years, although this trend is expected to move to outer suburbs over time (Figure 7).
Figure 6 Projected population change of age groups in metropolitan Melbourne, 2001-2031
Source: Victoria in Future 2004
Figure 7 Proportion of population 60 years and over, Melbourne suburbs, 2006
Source: 2006 ABS Census
Male Female

13 Melbourne 2030 Audit: Analysis of Progress and Findings from the 2006 Census
Household formation
Owing to the twin processes of an ageing population and social fragmentation, typified in Figure 8, average household size continues to decline thereby causing household growth to be faster than population growth rates.
Figure 8 Impacts of an ageing population and social fragmentation on housing demand
Source: Department of Sustainability and Environment 2007
The Victoria in Future 2004 (DSE 2004) projections use changing age-specific household trends to estimate future household formation. These projections have not yet been updated to include information from the 2006 Census but the Victoria in Future 2004 projections indicated that, in line with long term historical trends, average household size is projected to fall from 2.61 in 2001 to 2.31 by 2031.
It is further projected that about 90 per cent of additional (not new) households from 2001 to 2031 will be one and two person households.
2 dwellings -5 people
3 dwellings -6+ people
4 dwellings -6 people
Separation/Divorce
Loneperson
household
Moving out of home
Partnering/getting married
Birth ofa child
Couple with2 children household
Couple with1 child
household
1 dwelling -4 people
Couple with1 child
household
Couple withno children household
Couple withno children household
Group household
Couple withno children household
Loneperson
household
Singleparent
household
Moving out of home
Death of apartner

Melbourne 2030 Audit: Analysis of Progress and Findings from the 2006 Census14
A comprehensive five year Implementation Program was launched in November 2003. The program reflected feedback received through the submissions process that followed the release of Melbourne 2030.
Of the 226 initiatives set out in the Implementation Program, government departments and agencies report that over 95 per cent of initiatives have been completed or are underway.
It is not possible to provide quantitative measures to assess the effectiveness of all Melbourne 2030 policies and initiatives. Even where an initiative may have started or have been completed, it may take time to measure its effect and we are only five years into the
implementation of a 30 year strategy. An example of this is the significant investments contained within Meeting Our Transport Challenges.
An examination of progress in key policy areas, as presented below, is a starting point to consider the effectiveness of the first five year Implementation Program. This is one of the most important overarching questions for Stage 2 of the Audit and will be a focus for the Audit Expert Group.
Has the first five year Implementation Program been completed?

15 Melbourne 2030 Audit: Analysis of Progress and Findings from the 2006 Census
What progress has been made in major policy areas?
The following sections provide findings in relation to progress in major Melbourne 2030 policy areas.
Relevant Melbourne 2030 policies
Policy 1.1 ■ - Build up activity centres as a focus for high-quality development, activity and living for the whole community.
Policy 1.2 ■ - Broaden the base of activity in centres that are currently dominated by shopping to include a wider range of services over longer hours, and restrict out-of-centre development.
Policy 1.3 ■ - Locate a substantial proportion of new housing in or close to activity centres and other strategic redevelopment sites that offer good access to services and transport.
Activity Centres
Structure planning
Councils and the State Government have invested considerable resources in activity centre structure planning. Structure plans have been completed or are underway for 89 of Melbourne’s 120 principal and major activity centres (74 per cent). Following this section is a summary of the range of support that has been provided to local government to support the preparation and implementation of individual structure plans in partnership with the government, communities and the private sector to put Melbourne 2030 activity centre policy into action (see pages 16-17).
However, there are concerns that:
some structure planning has not sufficiently provided ■
for the scale of retail, office and other development likely to be needed in future years
not all structure plans are clear about where ■
future growth and change will be realistically accommodated.
More explicit designation of transition areas around appropriate existing centres may also be required to provide for and manage housing growth.
Stakeholders have called for clearer and more efficient processes for preparing, approving and implementing structure plans. Work is occurring with industry and local government to explore issues and solutions to deficiencies in the structure planning process.
There is also a strong call from stakeholders for Victorian Government agencies and local councils to prioritise planning efforts in the short-term towards a smaller number of ‘market ready’ centres, while long-term plans are completed for other centres in conjunction with local communities. However, stakeholders also recognise that the designation of the existing and planned network of activity centres supports maximum market choice, investments made in the Principal Public Transport Network, and delivery of a more sustainable city.
Transit Cities
Over $400 million has been committed to the Transit Cities program including significant investments in Dandenong and Footscray. Initial planning has been completed in other Transit Cities which can inform and help to prioritise future investments as centres become ‘market-ready’ (see the Transit Cities Case Studies on pages 18-19).
Melbourne 2030 Audit: Analysis of Progress and Findings from the 2006 Census16
Activity centres
Retail, commercial and office development
Updated projections regarding the amount of commercial and retail floor-space likely to be required suggest that a share of this growth will continue to need to be accommodated in new centres as not all future demand can easily be accommodated in all parts of the existing network of centres. This indicates a need for clearer processes and standards for designating new centres which conform with Melbourne 2030 principles.
An identified policy gap is the need for a review of retail planning policy and the Minister for Planning announced a Retail Policy Review in May 2007, the first review of its kind in over a decade. A major element of Melbourne 2030 is a network of activity centres (both existing and new) connected by a high quality public transport network. This objective provides an important context for the retail review expected to conclude in 2008.
The proportion of new office development being built outside activity centres cannot currently be accurately measured. The department’s land use database project will develop the capacity to accurately map the space devoted to existing land uses, in and outside activity centres, and the projected impact of new development approvals for retail, office, residential and other major land uses.
Housing development
The proportion of new housing located in or close to activity centres and strategic redevelopment sites is discussed under: “Is new development reflecting the intent of Melbourne 2030?”
Support to local government for activity centre structure planningThe Victorian Government is providing a range of practical support to local governments to develop structure plans for individual centres to implement Melbourne 2030 activity centre policy. Support includes:
Direct funding to support structure plan preparation and implementation:
The $5.6 million ■ Melbourne 2030 Local Government Assistance Fund which provided two streams of grants to councils to support Melbourne 2030 implementation. $3.1 million was provided in the form of $100,000 ‘base grants’ to each of the 31 metropolitan councils, and $2.5 million in competitive ‘targeted grants’ for priority projects. Of the targeted grants, around $835,000 was directed to support structure planning projects in 15 activity centres, with the remainder of funds directed to other priorities including growth area and green wedge planning. In addition, many of the 31 metropolitan councils used the $100,000 base grants to support structure planning.
The $13.5 million ■ Creating Better Places program provides grants for councils to undertake urban improvement and heritage projects in principal and major activity centres. Seven activity centres have received funding for structure planning preparation in the first two years of the Creating Better Places program and many others have received grants to support implementation of structure plans.
Expert technical help to finalise and implement structure plans:
A $3 million ■ Expert Assistance Program was established in the 2007-2008 State Budget to provide councils with expert advice in finalising and implementing activity centre structure plans.
Guidance in how to prepare and implement structure plans:
The Structure Planning for Activity Centres Practice ■
Note advises councils on structure plan preparation and implementation processes. Following feedback from stakeholders in 2006 and 2007, the note is currently being reviewed and improved to make it clearer and simpler.
Table 1 provides a list of the activity centres which have received direct grants to support the preparation of structure plans. Further information on activity centres which have received other support under the programs listed above for the implementation of structure plans including bridging projects and capital works is available from www.melbourne2030.vic.gov.au.

17 Melbourne 2030 Audit: Analysis of Progress and Findings from the 2006 Census
TABLE 1. Direct grants to support the preparation of structure plans from the $5.6 million Melbourne 2030 Local Government Assistance Fund and the $13.5 million Creating Better Places program.
Activity Centre Municipality Victorian Government funding
Airport West Moonee Valley $80,000
Braybrook - Central West Maribyrnong $50,000
Burwood Heights Whitehorse $60,000
Camberwell Junction Boroondara $85,000
Chadstone Stonnington $50,000
Cheltenham, Mentone, Moorabbin and Mordialloc Kingston $90,000
Chirnside Park and Lilydale Yarra Ranges $75,000
Coburg Moreland $50,000
Croydon Maroondah $40,000
Eltham Nillumbik $100,000
Fitzroy - Smith Street Yarra $50,000
Hastings Mornington Peninsula $50,000
Highpoint Maribyrnong $40,000
Knox Central Knox $15,000
Megamile - Nunawading Whitehorse $50,000
Monash University - Specialised Activity Centre
and Clayton Precinct Monash $50,000
Mornington Mornington Peninsula $40,000
Springvale Greater Dandenong $55,000
Sunbury Hume $45,000
Sunshine Brimbank $85,000
Wheelers Hill, Brandon Park Monash $30,000
Williamstown Hobsons Bay $35,000
Note: Projects are at various stages of completion, and progress is monitored regularly by the Department of Planning and Community Development.

Melbourne 2030 Audit: Analysis of Progress and Findings from the 2006 Census18
Ballarat
A second railway station will be built in Ballarat as part of $11 million in rail upgrades for the city. The second station, to be located at Gillies Street, Wendouree, will serve increased rail patronage, ease car parking issues and improve transport links to the west of Ballarat.
Other projects include:
a $2.6 million renovation of ■
the Ballarat Station Train Hall, which opened in March 2006
further improvements and ■
upgrades to facilities at the Ballarat Central Station
improvements to the ■
surrounding area and better links to the Ballarat central activity centre, providing opportunities for mixed use development in the area.
Dandenong
$290 million in Transit City funding has been committed to Revitalising Central Dandenong.
Projects include:
VicUrban’s Metro 3175 ■
residential development which will provide around 1,000 new dwellings
construction of the George ■
Street bridge across the Dandenong rail line as a new gateway into central Dandenong
revitalisation of Lonsdale ■
Street to create a pedestrian friendly boulevard
a One Stop Planning Shop ■
for investment marketing and development approvals
creation of a City Walk ■
connecting Dandenong Rail Station with the city centre
acquisition of land for City ■
Walk and for consolidating sites for redevelopment
facilitating significant private ■
sector investment
development of the rail station ■
precinct.
Footscray
Building on earlier investments in planning and public works, the government committed $52.1 million in the 2007-2008 Budget to the Footscray Renewal initiative, to be delivered in partnership with the Maribyrnong City Council.
This project includes:
upgrade of Nicholson Street ■
mall and other main streets in central Footscray
a new, modern pedestrian ■
bridge and public forecourt at Footscray Station
land acquisition on Irving ■
Street and active facilitation of development of strategic sites in the station precinct
Transit Cities is a major Victorian Government program to demonstrate and implement Melbourne 2030 principles. It seeks to revitalise key suburban and regional centres through high quality mixed use development by the private sector, and is helping to revitalise 13 key metropolitan and regional centres and make them economically stronger, better places to live and work. The Transit Cities are: Ballarat, Bendigo, Box Hill, Broadmeadows, Dandenong, Epping, Footscray, Frankston, Geelong, Latrobe-Warragul, Ringwood, Sydenham and Werribee.
The Victorian Government has focussed investment in structure planning and capital works in Transit City centres. It has established effective partnerships between government departments, councils and private investors to lay the foundations for long term urban change and transformation in accordance with Melbourne 2030 principles. The government has provided funding for the planning and development of each Transit City. The investments being made in Transit Cities are playing a key role in stimulating private sector investment in these locations. Each Transit City is different and the approach for long term planning has been tailored to suit the needs of the particular area in partnership with councils, communities and the private sector. A brief summary of the approach and actions in 6 of the 13 Transit Cities is provided here as an example of the work undertaken.
Transit Cities case studies

19 Melbourne 2030 Audit: Analysis of Progress and Findings from the 2006 Census
a new One Stop Planning ■
Shop for the marketing and development of central Footscray.
These major commitments build on Maribyrnong City Council’s exemplary strategic planning and follow the $1 million upgrade of Maddern Square in central Footscray.
Frankston
$10.5 million has been provided over the past five years to Frankston Transit City, with achievements to date including:
development of a Master Plan ■
a new learning centre at the ■
Chisholm Institute of TAFE
upgrading of Wells Street. ■
An additional $11.6 million over four years was committed in 2006/2007 to revitalise the Kananook Creek precinct by creation of a new boardwalk and other improvements in the central area to unlock latent development potential.
Geelong
In addition to substantial recent investment in Geelong’s foreshore, the Victorian Government committed $5.8 million over two years in the 2007-2008 State Budget to acquire land in the Geelong Station precinct to enable a future pedestrian link to the Transport Accident Commission (TAC) building and the waterfront. Work is underway on detailed design and
scoping works to pave the way for integration of the station and cultural precincts.
Other Transit City activities underway in Geelong include:
preparation of two Master Plans ■
to guide future improvements and works in the Geelong Cultural and Railway Station Precincts
better management of traffic, ■
improving cyclist and pedestrian movement
planning for better linkages ■
between Geelong Railway Station, Deakin University, the central activities district and the waterfront area.
Ringwood
In Ringwood Transit City, over $9.6 million has been allocated over the past five years towards creating a pedestrian-friendly town centre, linking Ringwood Station to the Eastland, Ringwood Market and Centro Ringwood shopping centres.
Recent projects include:
a streetscape upgrade to better ■
link the Ringwood Lake and Mullum-Mullum Creek bike and walking trails
improvements to Ringwood ■
Street including new street lighting, trees, seating, paving and relocation of powerlines underground.
Recent studies on development activity indicate that since May 2003
there has been significant progress in both planning approvals and construction in Ringwood, with:
over 79,000 m ■ 2 of commercial floorspace approved, with more than 11,500 m2 of commercial floorspace built or under construction
nearly 54,000 m ■ 2 of total retail floorspace approved, with close to 4,000 m2 built or under construction
over 1,000 residential dwellings ■
approved, with over 100 new dwellings built or under construction.
The Department of Infrastructure and Department of Planning and Community Development are currently progressing design work for possible future improvements to the Ringwood public transport interchange and broader station precinct.

Melbourne 2030 Audit: Analysis of Progress and Findings from the 2006 Census20
The Greensborough Project – Greensborough principal activity centre
The $400 million Greensborough Project will revitalise the town centre and help set the future planning and development of the Greensborough activity centre. As part of this project, the Victorian Government has committed $7 million to support the implementation of the Greensborough Principal Activity Centre Structure Plan in partnership with Banyule City Council and private industry.
Activities include:a new town square with community ■
facilitiesa Collaborative Office (civic centre) ■
expanded shopping facilities ■
pedestrian walks to enable greater ■
pedestrian accessan aquatic and leisure centre ■
additional car-parking through ■
construction of a multi-deck car park.
The development focuses on good urban design and aims to encourage more people to live and work in the Greensborough activity centre. Economic benefits for the local community are estimated at $210 million per year, with 1,800 new jobs predicted. The project is an excellent example of state and local government, along with the private sector, working collaboratively to achieve development and change on the ground, based on Melbourne 2030 principles.
South Melbourne Central Structure Plan
Port Phillip City Council has led the development of an exemplary structure plan for South Melbourne Central (the South Melbourne activity centre) in partnership with the local community, landowners, industry and the Victorian Government. The Plan is now being implemented in line with Melbourne 2030 objectives. It combines activity centre structure planning with integrated transport planning by addressing sustainable transport initiatives such as pedestrian spines, public transport options and bike paths and lanes.
Port Phillip City Council received the Planning Institute of Australia Victoria Division ‘2004 Planning Minister’s Award for Melbourne 2030 Implementation’ for its work in developing the South Melbourne Central Structure Plan.
Case studies of innovative activity centre planning and development
Since the release of Melbourne 2030, councils have undertaken significant planning work to assist in the implementation of Melbourne 2030’s activity centre policies. A selection of four projects which demonstrate Melbourne 2030 activity centre policies in action are profiled here.
21 Melbourne 2030 Audit: Analysis of Progress and Findings from the 2006 Census
‘The Village’ at Clayton South
‘The Village’ is a housing development that will cater for 330 to 400 households. The site of the development is an old timber yard between the Westall Railway Station and the Westall neighbourhood shopping centre, close to the Clayton and Springvale activity centres.
It will offer a diversity of medium and higher density housing, along with pedestrian thoroughfares and convenient access to the railway station. The development will also promote environmental sustainability through reuse of stormwater, a minimum 5-star energy rating and retention of native vegetation.
‘The Village’ demonstrates Melbourne 2030 principles in action through provision of diverse housing, improved access to public transport and environmental sustainability.
This is an example of increased housing densities around high capacity public transport, making better use of existing infrastructure.
Lynbrook Neighbourhood Centre
Through its precinct structure planning, Casey City Council identified the need for a Neighbourhood Centre on a VicUrban site on the corner of Lynbrook Boulevard and South Gippsland Highway. The council used the principles of Melbourne 2030 to develop a proposal for a mainstreet complex which focussed on people, rather than a car-based centre. The site was rezoned, with a permit for development being issued at the same time. This ensured that all necessary approvals were in place and consistent with Melbourne 2030 prior to the developer beginning construction.
Lynbrook now has a small, main-street based Neighourhood Centre with a community facility and medical centre. The Centre is an example of council working with VicUrban and developers to implement Melbourne 2030.
Other projects
The Activity Centres Thematic Working Group, a sub group of the stakeholder-based Melbourne 2030 Implementation Reference Group, identified eight on-the-ground projects that demonstrate various elements of Melbourne 2030. Projects are located in activity centres or on strategic redevelopment sites in the metropolitan area and were selected as it was considered that each demonstrated one or more of the key directions of Melbourne 2030:
Pentridge Village, Coburg ■
Bayside Entertainment, ■
FrankstonMaddern Square Redevelopment, ■
FootscrayMason Street Residential ■
Redevelopment, NewportPelican Park Precinct, Hastings ■
Gordon Street Apartment ■
Building, ElsternwickMixed Use Development at 332 ■
Centre Road, BentleighCarnegie Library and Community ■
Centre.
More information on these projects is available at www.melbourne2030.vic.gov.au

Melbourne 2030 Audit: Analysis of Progress and Findings from the 2006 Census22
Relevant Melbourne 2030 policies
Policy 2.1 ■ - Establish an urban growth boundary to set clear limits to metropolitan Melbourne’s outward development.
Policy 2.2 ■ - Concentrate urban expansion into growth areas that are served by high-capacity public transport.
Urban Growth Boundary
In 2002, the Victorian Government introduced the Urban Growth Boundary (UGB), as set out in Melbourne 2030, through an amendment to the planning schemes of fringe municipalities.
The Planning and Environment (Metropolitan Green Wedge Protection) Act 2003 requires a positive resolution of both Houses of Parliament before the UGB can be changed. Planning authorities must now also consult with and be authorised by the Minister for Planning before preparing or exhibiting an amendment to a planning scheme that would change the UGB.
Submissions to amend the UGB (outside of designated growth areas) were considered during 2003. A small number of amendments were ratified by Parliament in late 2003. The UGB is now largely permanent outside growth areas.
Between 2003 and 2005, the Victorian Government established and worked with Smart Growth Committees in the five growth areas designated in Melbourne 2030 to develop proposals for managing future growth. The government considered all proposals from these committees and in November 2005 released A plan for Melbourne’s growth areas and amended the UGB to ensure sufficient land supply for around 25 years of projected development. Changes to the UGB in November 2005 directed growth to areas best served by existing infrastructure and avoided options with higher short-term infrastructure costs.
Consistent with Melbourne 2030, future changes to the UGB should only occur in relation to the needs demonstrated in the designated growth areas. Changes will be required periodically to maintain a long-term supply of land of 15 to 25 years. In particular, household growth projections are now being prepared, informed by the 2006 Census, and it is possible there will be a higher household growth rate than forecast following the 2001 Census. If so, there will be a corresponding reduction in projected land supply, although this may be partially offset by increases in average densities of development. This situation continues to be monitored through the Urban Development Program.
Melbourne 2030 includes a commitment to undertake an examination of the need to extend the UGB concept to small townships and recognises that this requires the active involvement of local government. Strategic planning investigations have not yet been carried out in relation to all townships to assess whether a UGB is warranted or where it should be located.

23 Melbourne 2030 Audit: Analysis of Progress and Findings from the 2006 Census
Relevant Melbourne 2030 policies
Policy 2.4 ■ - Protect the green wedges of metropolitan Melbourne from inappropriate development.
Green wedges
Melbourne 2030 has established, for the first time, a comprehensive planning framework for Melbourne’s green wedges - areas outside the Urban Growth Boundary (UGB) that include:
valuable agricultural land ■
strong environmental and landscape values ■
open space and parks ■
important recreation and tourism resources ■
important functions that support Melbourne such as ■
airports, sewerage plants, quarries, waste disposal sites and other uses that support urban activity but cannot be located in areas close to urban living.
Direction 2 of Melbourne 2030 identifies 12 green wedges spanning 17 municipalities, and sets out the key features and related values for each as a basis for future planning. The government has introduced a number of planning changes to establish and protect green wedges, including:
finalisation of the UGB (discussed in UGB section) ■
amendment of the ■ Planning and Environment Act 1987 to recognise the UGB and green wedge land
introduction of new green wedge zones in planning ■
schemes
development of green wedge management plans to ■
determine how best to manage future changes and opportunities.
New zones to protect green wedges
Following public consultation, two new zones – a Green Wedge Zone and a Rural Conservation Zone – were incorporated into relevant planning schemes and applied to green wedges in 2003. Amendments have been made to the green wedge zones since their introduction to fine tune them. Overall the zones are operating well, however planning decisions continue to be monitored to ensure the intent of the government’s green wedge policies continue to be achieved.
Green Wedge Management Plans
Melbourne 2030 proposes that a Green Wedge Management Plan be developed by each council in a green wedge zone to deal with issues specific to each green wedge. The government provided initial support as part of the $5.6 million Melbourne 2030 Local Government Assistance Fund in 2002-2005, and committed a further $350,000 to assist councils in their work on these plans in 2007.
Completing Green Wedge Management Plans for individual green wedges is an important outstanding task. In developing plans so far, it is clear that planning policy and regulation will not resolve many issues, although both will have some role to play.

Melbourne 2030 Audit: Analysis of Progress and Findings from the 2006 Census24
The following two case studies provide examples of planning underway in contrasting green wedge areas:
Green wedges case studies
Werribee South – Wyndham City Council
The Werribee South Green Wedge presents a diverse and complex range of environments and activities. This includes valuable agricultural areas, tourist attractions, internationally recognised wetlands and metropolitan infrastructure such as the Western Treatment Plant. To successfully plan for these features, Wyndham City Council divided the green wedge zone into individual precincts of common activity, land-use, management or tenure to form distinctive planning units. The Werribee South Green Wedge Management Plan provides strategic directions for each precinct and a set of policy principles and actions to guide and implement planning and management across the green wedge.
Wyndham City Council recently placed the draft Plan on public exhibition with the draft Werribee South Green Wedge Policy as a planning scheme amendment. The amendment proposes to incorporate the objectives of the Management Plan into the Wyndham Planning Scheme.
Nillumbik Green Wedge Management Plan – Nillumbik Shire Council
Nillumbik Shire Council is currently preparing a Green Wedge Management Plan.
To date two significant documents have been prepared:
a background paper summarising ■
existing information on the Nillumbik Green Wedge, including: land use, environmental inventory, infrastructure and services, social and economic information and environmental and economic programs
an issues paper that provides an ■
overview of key issues facing the Nillumbik Green Wedge.
This work has allowed the council to take stock of its green wedge area, inform its public consultation process and identify where further research is necessary to explore identified issues.
In line with the General Practice Note Preparing a Green Wedge Management Plan (DSE, August 2005), Council is making excellent progress in developing a Plan which will be informed by the Nillumbik Green Wedge communities and stakeholders.
25 Melbourne 2030 Audit: Analysis of Progress and Findings from the 2006 Census
Relevant Melbourne 2030 policies
Policy 2.3 ■ - Manage the sequence of development in growth areas so that services are available from early in the life of new communities.
Growth area planning
Substantial effort has been focused on growth area planning during the first five years of Melbourne 2030 implementation. This is one of the strongest areas of overall implementation progress and achievements include settling of the UGB, maintaining a long-term land supply and releasing A plan for Melbourne’s growth areas in November 2005.
A plan for Melbourne’s growth areas included a commitment to create a new Growth Areas Authority to work in partnership with local councils, the community, developers and infrastructure providers to ensure effective coordination of growth area planning, infrastructure and service provision. In 2006, the Planning and Environment Act was amended to create the Growth Areas Authority, which began operating in September 2006 (see ‘The Work of the Growth Areas Authority’).
The establishment of the Growth Areas Authority is engendering in government agencies, councils and developers a much greater focus on planning for the development of new communities. Precinct Structure Planning Guidelines are now guiding integrated planning for new suburbs, and planning guidelines for employment precincts will be released later in 2007.
The Sustainable Neighbourhoods package of enhanced planning scheme requirements for all residential subdivisions was introduced in 2006. It implements Victorian Government policy to achieve more liveable and sustainable communities. The new residential subdivision provisions set out requirements for designing and assessing residential subdivisions in urban areas throughout Victoria. These changes are supported by complementary State Planning Policy provisions for subdivisions, and changes in relevant zones, overlays and planning practice notes.
Growth at the fringe of Melbourne is expected to continue to be significant over the next five years. Improving the liveability of Melbourne’s outer suburbs and continuing efforts to ensure growing communities have the necessary support, services and infrastructure will be critical.

Melbourne 2030 Audit: Analysis of Progress and Findings from the 2006 Census26
Established by legislation in 2006, the Growth Areas Authority (GAA) is governed by a Board appointed by the Minister for Planning. The GAA is working in close partnership with councils, government agencies and developers to improve management of growth on Melbourne’s fringes.
Land supply
One of the roles of the GAA is advising the Minister for Planning on the adequacy of land supply, the sequencing of land release and land rezoning proposals. In undertaking this work the GAA considers the Department of Planning and Community Development’s Urban Development Program (UDP) annual reports as well as its own activities and engagement with councils and developers.
In the metropolitan area, the 2006 UDP report identified potential shortfalls in zoned residential land in Casey-Cardinia and employment land in Hume.
The GAA has been working actively with these three councils and with their support, aims to have significant new zoned land available early next year. (See Table 2 for anticipated zoned land additions as a result of this work.) This work will contribute to ensuring adequate zoned land to maintain competition and downward pressure on land prices.
Streamlining planning processes in the growth areas
Creating sustainable communities is a complex process. The planning and approvals time usually takes 3-5 years. A key aim of the GAA is to significantly reduce that timeframe by working with all the players involved to reduce duplication and unlock good development outcomes. Streamlining planning processes will involve significant consultation to ensure that proposed changes to existing practice provide an effective way forward and deliver improved outcomes for growth area communities.
Emerging directions & priorities for the GAA
The GAA has identified the following as key emerging priorities:
in depth infrastructure planning and co-ordination in ■
cooperation with councils and state agenciesland use supply/demand analysis leading to clearer ■
directions for long term future growthimplementation of a reformed planning system ■
continued emphasis on opening new development ■
areas to meet demand for both employment and residential land, thereby improving affordability and Victoria’s competitive advantage.
Community development
The GAA is working with councils to create sustainable communities, not just subdivisions. This requires a broader focus than traditional subdivision practices, incorporating community involvement and governance structures that can enable current and future residents to have a say in the development of their neighbourhood. The GAA, in partnership with councils, the Department of Planning and Community Development and a number of agencies, is commissioning the Creating liveable new communities project to identify the key elements needed to create sustainable new communities in Melbourne’s growth areas. The project aims to develop a strategic framework and best practice tools to enhance the GAA’s and partner organisations’ capacity to create safe, healthy, active and strong communities.
The work of the Growth Areas Authority (GAA)
27 Melbourne 2030 Audit: Analysis of Progress and Findings from the 2006 Census
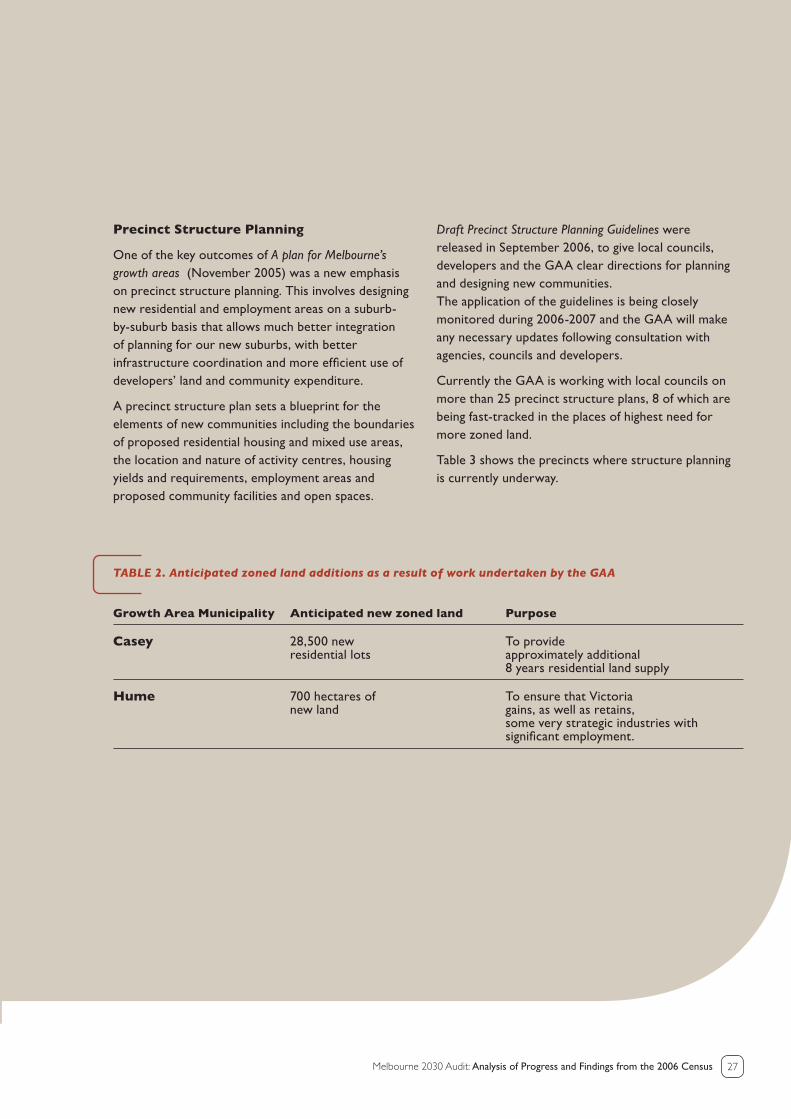
TABLE 2. Anticipated zoned land additions as a result of work undertaken by the GAA
Growth Area Municipality Anticipated new zoned land Purpose
Casey 28,500 new To provide residential lots approximately additional 8 years residential land supply
Hume 700 hectares of To ensure that Victoria new land gains, as well as retains, some very strategic industries with significant employment.
Precinct Structure Planning
One of the key outcomes of A plan for Melbourne’s growth areas (November 2005) was a new emphasis on precinct structure planning. This involves designing new residential and employment areas on a suburb-by-suburb basis that allows much better integration of planning for our new suburbs, with better infrastructure coordination and more efficient use of developers’ land and community expenditure.
A precinct structure plan sets a blueprint for the elements of new communities including the boundaries of proposed residential housing and mixed use areas, the location and nature of activity centres, housing yields and requirements, employment areas and proposed community facilities and open spaces.
Draft Precinct Structure Planning Guidelines were released in September 2006, to give local councils, developers and the GAA clear directions for planning and designing new communities. The application of the guidelines is being closely monitored during 2006-2007 and the GAA will make any necessary updates following consultation with agencies, councils and developers.
Currently the GAA is working with local councils on more than 25 precinct structure plans, 8 of which are being fast-tracked in the places of highest need for more zoned land.
Table 3 shows the precincts where structure planning is currently underway.

Melbourne 2030 Audit: Analysis of Progress and Findings from the 2006 Census28
Precinct Total area (ha) Estimated residential lot yield
Casey–CardiniaCardinia Rd Employment Precinct 458 *Cardinia Rd 1,178 10,000Clyde North & Botanic Ridge 1,000 14,000Cranbourne East 971 4,500Cranbourne North 300 2,500Cranbourne West 799 3,500Fountain Gate Activity Centre 250 1,000Hampton Park Hill 250 500Officer Employment Precinct 1,354 *Officer 1,093 10,000Pakenham Activity Centre 200 *Pakenham Employment Precinct 700 *Hume Craigieburn TBD TBDCraigieburn Town Centre 72 *Folkstone 300 *Greenvale Lakes 209 1,900Merrifield 400 *Melton–Caroline SpringsMacpherson 150 1,500Robinsons Rd Area A 200 *Robinsons Rd Area B 60 *Robinsons Rd Area C 250 *Taylors Hill West 200 1,900Toolern 1,900 15,000WhittleseaAurora 595 8,500Epping North 259 1,850Epping North East 462 4,500Harvest Home Rd 146 1,000WyndhamPoint Cook 300 2,500Riverwalk 200 2,200Truganina Employment Area 888 *Werribee Technology Park 926 *Werribee West 1,000 10,000
* Employment land, therefore no residential lot yield. TBD – To be determined.
TABLE 3. Precincts where structure plans are currently underway.

29 Melbourne 2030 Audit: Analysis of Progress and Findings from the 2006 Census
The Victorian Government’s open space strategy Linking People and Spaces sets out a long-term program of metropolitan parkland and trail development and links closely with Melbourne 2030 objectives. It includes commitments to rectify gaps in the network of metropolitan open space and to create new parks in nominated areas to serve growth areas.
Improvements to metropolitan and regional open space and gaps in the Metropolitan Trail Network are being addressed primarily through: reserving and acquiring land for new regional parks (DSE); and planning and establishing new regional parks and grants funding for councils to complete gaps in the Metropolitan Trail Network (Parks Victoria).
In the 2006-2007 State Budget, the government announced a major component of the park and trail development priorities identified in Melbourne 2030 . The budget included $3.3 million to establish new parks at Werribee, Melton, Craigieburn and Point Gellibrand, expanding the metropolitan park estate by over 1,000 hectares.
Funding in the order of $90,000 has been secured in the 2007-2008 State Budget to progress long-term planning for new regional parks on Kororoit Creek at Caroline Springs, for a second regional park north of Werribee and for a regional park at Cranbourne East.
In addition, $8 million over four years was provided to extend off-road bike trails in Melbourne. These works will eliminate major gaps in the Metropolitan Trail Network (Capital City Trail, Darebin Creek Trail, and Bay Trail at Point Cook). This investment improves access for residents in the west of Melbourne to metropolitan park facilities and improves opportunities to participate in off-road recreational cycling.
A further $8 million program was established in 2007-2008 for actions around Port Phillip Bay to enhance the beaches as important recreational spaces through a program of beach renourishment.
The Metropolitan Parkland Acquisition Program has directed over $50 million in the last three years to purchase properties to add to parks at Yarra Valley, Plenty Gorge and Cardinia Creek. Land has been
acquired for three new regional parks at Merri Creek, Werribee River and Melton through land transfers between VicRoads, Melbourne Water and the Shire of Melton at no cost to the State Government.
The government also announced a further $13.2 million over four years in the 2007-2008 State Budget to develop metropolitan parklands.
High priority infrastructure and landscaping for riverbank and water-based activities occurred along the lower Yarra River before the 2006 Commonwealth Games. Projects to strengthen planning controls and safeguard public access along the Yarra and Maribyrnong river corridors are nearing completion. Both these projects have proceeded with strong community and council support, although they have taken longer to complete than originally anticipated.
Local open space planning and provision remains primarily a council responsibility. In the growth areas, Precinct Structure Plans are currently being prepared by councils and the Growth Areas Authority. The structure plans will address the provision of open space in growth areas. In established areas the focus will more often be on improving existing open space by carefully targeting acquisition of new land and making better use of other government land.
Quality of information is inconsistent with respect to the availability, usage and distribution of open space in different areas of Melbourne, and the likely future demands given growth and changing demographics. Further coordinated research and data collection is required.
There is evidence of a recent surge in participation in team sports, and the inability of some councils to provide or access open space to meet this demand.
As a result, work commenced in 2007, led by the Department of Sustainability and Environment and the former Department for Victorian Communities examining the provision of open space in different areas across Melbourne and the appropriate roles of Victorian and local governments. Councils have been surveyed and results will be considered later in 2007, leading to potential policy responses in 2008.
Parks, waterways and open space
Relevant Melbourne 2030 policiesPolicy 5.6 ■ - Improve the quality and distribution of local open space and ensure long-term protection of public open space.Policy 5.7 ■ - Rectify gaps in the network of metropolitan open space by creating new parks and ensure major open space corridors are protected and enhanced. Policy 5.9 ■ - Protect coastal and foreshore environments, and improve public access and recreational facilities around Port Phillip Bay and Western Port.

Melbourne 2030 Audit: Analysis of Progress and Findings from the 2006 Census30
Over the past five years, effort has been directed to improving and promoting good urban design and to recognising and protecting heritage places and values, cultural identity and neighbourhood character. The Office of the Victorian Government Architect was established in 2005 and provides leadership and advice across government in relation to urban design and architecture and has supported the implementation of many Melbourne 2030 initiatives. Victorian Government training, guidance and support for councils in urban design matters has increased significantly in recent years.
A range of publications have been released, including Activity Centre Design Guidelines, Guidelines for Higher Density Residential Development, and Safer Design Guidelines for Victoria. These provide detailed guidance to councils and proponents on designing public and private realms. Draft Precinct Structure Planning Guidelines to guide the design and creation of integrated new communities in growth areas were developed in 2006. The $13.5 million Creating Better Places grants program was introduced to provide funding for physical improvements, urban revitalisation projects, place managers and strategic planning in and around activity centres and at key cities and towns within the networked cities region. One hundred projects have been funded through the Creating Better Places program to date and details are available on the Melbourne 2030 website.
Significant direct investments have been made by the Victorian Government in central Melbourne, in recognition of Melbourne’s capital city role and to support the staging of the 2006 Commonwealth Games. Several high quality public spaces and venues have been completed or are underway within Melbourne’s central area including Southern Cross Station, the Queensbridge precinct, sporting precinct projects such as the Melbourne Cricket Ground and the Melbourne Sports and Aquatic Centre, the Melbourne Convention Centre, the Melbourne Recital Hall and the Melbourne Theatre Company theatre. The Inner Melbourne Action Plan developed by the cities of Melbourne, Port Phillip, Yarra and Stonnington also provides strong support for excellence in urban design through its objective to make inner Melbourne more liveable, including initiatives to improve signage for walking, walking links and pedestrian safety.
Proposition 3047, an architectural and urban design competition jointly supported by ar magazine, the City of Hume, the Department of Sustainability and Environment and Colonial First State, was run during 2005 and 2006, and provided an important demonstration project for the town centre of Broadmeadows Transit City.
A range of actions have been undertaken since the release of Melbourne 2030 in relation to heritage, including:
Guidelines for Assessment of Heritage Planning ■
Applications have been introduced to improve the policy framework for assessing development.
An Advisory Committee to review heritage ■
provisions in planning schemes has been established.
Financial and advisory support has been provided ■
to councils to complete heritage studies and to encourage and recognise good heritage practice.
The local government heritage advisory service ■
program continues to provide practical assistance and support at the local level.
Protecting the suburbs and better urban design outcomes
Relevant Melbourne 2030 policies
Policy 5.1 ■ - Promote good urban design to make the environment more liveable and attractive.
Policy 5.2 ■ - Recognise and protect cultural identity, neighbourhood character and sense of place.
Policy 5.3 ■ - Improve community safety and encourage neighbourhood design that makes people feel safe.
Policy 5.4 ■ - Protect heritage places and values.
Policy 5.5 ■ - Promote excellent neighbourhood design to create attractive, walkable and diverse communities.

31 Melbourne 2030 Audit: Analysis of Progress and Findings from the 2006 Census
In November 2004, the Victorian Government introduced the Protecting the suburbs package of interim height controls for centres and a new Residential 3 Zone to provide greater protection for residential areas not designated for significant change. Achievements to date relating to neighbourhood character include:
approving major local neighbourhood character ■
amendments to more than 15 metropolitan planning schemes
ensuring local variation of key neighbourhood ■
character provisions to recognise and protect existing neighbourhood character values
implementing interim height controls over 130 areas/ ■
neighbourhood centres
approving the Residential 3 Zone with a mandatory ■
nine metre height limit across residential areas in the cities of Knox, Manningham and Kingston.
Several other councils are seeking to capitalise on the benefits of the new residential zone to protect neighbourhood character values.
Some concerns exist about the complexity and effort required to introduce local variations to planning rules in areas designated for minimal change. There has been a strong call from stakeholders for clearer state policy to guide the next generation of municipal planning schemes and for provision of planning tools that are easier to introduce and provide councils with the ability to direct growth and change to designated areas.
The Aboriginal Heritage Act 2006 came into effect on 28 May 2007 and establishes a consistent, statewide approach to protecting and managing aboriginal cultural heritage. Land development proposals involving high impact activities, located in designated areas of cultural heritage sensitivity, are now subject to assessment at the early planning stages. Where aboriginal cultural heritage is likely to be affected, a planning permit cannot be issued for development until an approved Cultural Heritage Management Plan is prepared.

Melbourne 2030 Audit: Analysis of Progress and Findings from the 2006 Census32
Changing travel and mobility patterns
Melbourne has a diverse spread of activities and associated complex travel patterns. We have:
an economy which is increasingly service ■
based where face to face contact is necessary, notwithstanding the continued growth of electronic communication
high levels of personal mobility and high proportions ■
of people of working age. Within those ages, a high percentage of people are working, either full or part time
a level of affluence which facilitates high levels of ■
personal mobility through increased per capita car ownership.
This growth in personal mobility combined with increasing economic activity and associated freight movements poses a continuing challenge to land use and transport planners, both in terms of the number of trips and the complexity of travel patterns.
Transport investments
A solid start has been made in planning and implementing the transport directions of Melbourne 2030. Transport investments between 2002 and 2007 have increased significantly (Figure 9). Detailed information on investments in transport infrastructure and services over the period since the release of Melbourne 2030 is publicly available but not included in this document. Some of the significant transport investments and improvements since the release of Melbourne 2030 are included in the ‘Major investments in transport infrastructure and service improvements since the release of Melbourne 2030 (2002-2007)’ box.
The release of the $10.5 billion Meeting Our Transport Challenges in 2006 strongly supports Melbourne 2030 and will have increasing influence as new investment flows into more sustainable transport modes (particularly public transport) and better modal integration is implemented. It will, however, continue to be important to cluster new development around existing public transport infrastructure due to the high costs of providing new high capacity public transport (see ‘Meeting Our Transport Challenges’ box).
Another significant step was the creation and appointment of the Coordinator General of Infrastructure in 2006 to improve coordination and integration of transport and land use planning and policy.
Relevant Melbourne 2030 policies
Policy 4.3 ■ - Further develop the key transport gateways and freight links and maintain Victoria’s position as the nation’s premier logistics centre.
Policy 8.1 ■ - Upgrade and develop the Principal Public Transport Network and local public transport services to connect activity centres and link Melbourne to the regional cities.
Policy 8.2 ■ - Improve the operation of the existing public transport network with faster, more reliable and efficient on-road and rail public transport.
Policy 8.3 ■ - Plan urban development to make jobs and community services more accessible.
Policy 8.4 ■ - Coordinate development of all transport modes to provide a comprehensive transport system.
Policy 8.5 ■ - Manage the road system to achieve integration, choice and balance by developing an efficient and safe network and making the most of existing infrastructure.
Policy 8.6 ■ - Review transport practices, including design, construction and management, to reduce environmental impacts.
Policy 8.7 ■ - Give more priority to cycling and walking in planning urban development and in managing our road system and neighbourhoods.
Policy 8.8 ■ - Promote the use of sustainable personal transport options.
Transport

33 Melbourne 2030 Audit: Analysis of Progress and Findings from the 2006 Census
Transport investments
Figure 9 Annual Victorian road and transport expenditure 2001-2006
Source: Budget Information Paper (BIP) No.1 and Accident Black Spots Program.
TAC Funded Road Safety Program
Rail and Other Transport (State funded)
Commonwealth Funded Road Projects
Commonwealth Funded Rail Projects
Metro Roads (State and Better Roads)
Rural Roads (State and Better Roads)
2001-02 2002-03 2003-04 2004-05 2005-06 2006-07
1.20
1.00
0.80
0.60
0.40
0.20
0.00
$bi
llio
n pe
r ye
ar

Melbourne 2030 Audit: Analysis of Progress and Findings from the 2006 Census34
Public transport patronage
Public transport patronage is growing, particularly for travel into the centre of Melbourne. In the two years to the end of June 2006, there has been an increase in the mode share of public transport from 7.7 per cent in 2003-2004 to 8.8 per cent in 2005-2006.
During this time, the number of public transport trips has grown by 70,000 trips per day, or 7 per cent from 2003-2004 to 2005-2006. Overall, total metropolitan public transport patronage exceeded 418 million in 2006-2007.
Growth in public transport trips is required, to offset the number of car trips in order to achieve the target of 20/2020 (that public transport’s share of motorised trips within metropolitan Melbourne will be 20 per cent by the year 2020).
Metropolitan train patronage grew by 12.2 per cent ■
during 2006-2007, by 23 per cent over the past two years and by more than 50 per cent in the period from 1998-1999 to 2006-2007
Tram patronage grew by 3.6 per cent in 2006-2007, ■
which is higher than the compound annual growth rate of 3 per cent over the previous 10 years
Melbourne’s bus network has also recorded an ■
increase in patronage, reflecting outcomes of 2005-2006 State Budget initiatives, support for new SmartBus routes and services and the first package of service extensions introduced under Meeting Our Transport Challenges. The number of metropolitan bus passengers increased by 7.4 per cent over the past year.
Regional public transport services were boosted ■
with the introduction of regional fast rail services in 2006. Patronage since their introduction has increased by more than 30 per cent.
Public transport service coverage
The Melbourne Atlas - using information provided by the Department of Infrastructure - found that:
on weekdays, 90 per cent of the population within ■
Melbourne’s UGB are within 400 metres of a tram or bus service or 800 metres of a rail service; and
on weekends, this falls to 59 per cent reflecting ■
reduced weekend services.
Melbourne’s train and tram systems are primarily radial, serving best those people who live and work near a route. Journey to Work statistics reveal that even people who travel just a few kilometres to work will favour using a car if their home or workplace is not close to a train or tram route, or if they have to board more than one public transport vehicle to get to work.
For most of Melbourne’s local government areas (LGAs), around 50 per cent of working citizens are employed in the same or neighbouring LGAs. Many people make non-radial journeys to work. Recognising this, Meeting Our Transport Challenges (MOTC) boosts spending on non-radial transport including the development of a cross-town bus transport network ($1.4 billion will be spent over ten years on SmartBus and local buses).
Public transport considered in major new developments
The Director of Public Transport was made a Referral Authority (Clause 52.37) in October 2006. This requires Responsible Authorities (generally local councils) to refer applications for major residential, retail, commercial, office and industrial developments to the Director of Public Transport for consideration. This reform supports Melbourne 2030 policy and will contribute to the better integration of major subdivisions and developments with public transport and better allow for future service, infrastructure and accessibility improvements.

35 Melbourne 2030 Audit: Analysis of Progress and Findings from the 2006 Census
Sustainable transport planning for new suburbs and major subdivisions
New access and mobility provisions for residential subdivisions were introduced into the Victoria Planning Provisions in October 2006 (Clause 56 – Residential Subdivision). This requires integrated planning of the neighbourhood street network to promote walking, cycling and use of public transport.
Integrated planning of sustainable transport needs for Melbourne’s growth areas is also now occurring through the work of the Growth Areas Authority in developing and implementing Precinct Structure Plans within the planning system.
Support for walking and cycling
In 2006, Meeting Our Transport Challenges allocated $135 million to develop smarter, healthier travel choices. This includes $70 million over ten years for pedestrian and bicycle infrastructure improvements such as extending the Principal Bicycle Network and Metropolitan Trail Network, shared pathways, and installation of pedestrian crossings, particularly across busy arterial roads.
Significant projects to date include the completion of the Federation Trail - a $12.5 million shared path extending 23 km between Millers Road, Brooklyn and the Werribee River, Werribee, which opened to the public in October 2006. The Principal Bicycle Network is currently being reviewed.
Support is also being provided for walking and cycling through:
TravelSmart ■ - a travel behaviour change program that can be applied in schools, universities, workplaces and communities, to encourage people to walk, cycle and use public transport ($30 million over ten years)
Local Area Access Program ■ (LAAP) - which supports councils to develop demonstration projects, typically small-scale infrastructure projects, that will show the
way forward in addressing the physical, attitudinal and institutional barriers to walking and cycling ($16 million over four years)
In 2006-2007, grants to local governments have been provided for 11 TravelSmart projects and 19 LAAP projects.
Freight, airports and seaports
Melbourne’s freight traffic is expected to double over the next 20 years. Progress has been made in strengthening Melbourne’s freight infrastructure since the release of Melbourne 2030.
The Dynon Port Rail Link will be constructed to ■
provide increased rail freight capacity and allow uninterrupted 24 hour rail access to the Port of Melbourne. An important yet difficult problem remains in addressing the impacts of freight traffic in local areas, particularly in and around the Port of Melbourne.
Holistic strategic frameworks for land use planning ■
for the region’s airports and seaports are being developed. This is critical to protect and enhance Melbourne’s national transport gateways.
The ■ Melbourne Port@L Strategy was released in 2006 and outlines a vision to develop the Port of Melbourne, the Dynon precinct and its transport links as a world-class inter-modal hub.
The consultation draft of the ■ Port of Hastings Land Use and Transport Strategy addressed the need to integrate port development and port transport access with metropolitan, regional and national networks and planning.
The ■ Victorian Ports Strategic Framework provides a framework for developing and releasing draft land use strategies for the ports of Melbourne, Geelong, Hastings and Portland during 2006 and 2007.

Melbourne 2030 Audit: Analysis of Progress and Findings from the 2006 Census36
Melbourne 2030 policies have directly supported the substantial increase in the level of investment in transport in Victoria since 2001-2002 (see Figure 9). This increased investment has led to new transport infrastructure and service improvements. Significant projects/ improvements include:
redevelopment of Southern ■
Cross Station
completion of regional fast rail ■
services to Ballarat, Bendigo, Geelong and the Latrobe Valley
plans for new stations in growing ■
areas and refurbishment of metropolitan rail stations
electrification of the ■
St Albans to Watergardens and Broadmeadows to Craigieburn rail lines
additional Park and Ride facilities ■
extension to tram routes to ■
Vermont South, Box Hill and Docklands
delivery of SmartBus services ■
on Blackburn, Springvale and Wellington Roads
new and improved bus routes ■
under local area bus reviews (to date completed in Moreland, Maribyrnong/Moonee Valley, Nillumbik, Whittlesea, Frankston)
new train timetables with ■
additional services and extended operating hours
elimination of metropolitan ■
Zone 3
upgrades of tram and bus ■
stops to comply with the Commonwealth Disability Discrimination Act 1992
free public tranpsort travel ■
on Sunday and improved concessions for seniors
safety improvements, including ■
upgrades to railway level crossings
completion of the Hallam and ■
Craigieburn Bypasses and Geelong Road upgrade
commencement of the Eastlink, ■
Pakenham and Deer Park Bypasses and the Geelong Ring Road
completion of Greensborough ■
Hwy, Cooper St, Whittlesea and Edgars Road, Epping
grants to local governments ■
for 11 TravelSmart projects and 19 Local Area Access Program projects.
Major investments in transport infrastructure and service improvements since the release of Melbourne 2030 (2002-2007)

37 Melbourne 2030 Audit: Analysis of Progress and Findings from the 2006 Census
Meeting Our Transport Challenges (2006) is the government’s $10.5 billion statewide action plan for expanding the reach and capacity of Victoria’s transport system over the next 25 years.
This major statement directly implements many policies in Melbourne 2030, the Metropolitan Transport Plan and Moving Forward, the government’s policy statement for provincial Victoria.
Under Meeting Our Transport Challenges, the Victorian Government will inject an unprecedented $10.5 billion over 10 years into improving the state’s transport system to sustain Victoria’s and Melbourne’s liveability into the future. Investment includes:
$2 billion for rail network and ■
service improvements including new stations
$1.4 billion to develop a better ■
cross town public transport network
$1.8 billion for new trains and ■
trams and improved services
$1.3 billion for better road ■
connections to Melbourne’s growing suburbs
$1.1 billion for road and rail ■
safety and security
$865 million redevelopment of ■
the Monash-West Gate corridor, strengthening the West Gate Bridge and conducting the East-West Needs Assessment study
$710 million to make public ■
transport more accessible, create better community connections and improve planning for the future
$690 million for major ■
upgrades of regional roads
$510 million for better public ■
transport in Provincial Victoria
$135 million to promote greater ■
use of public transport, walking and cycling.
Meeting Our Transport Challenges

Melbourne 2030 Audit: Analysis of Progress and Findings from the 2006 Census38
Relevant Melbourne 2030 policies
Policy 5.8 ■ - Improve the environmental health of the bays and their catchments. Policy 7.1 ■ - Ensure that water resources are managed in a sustainable way. Policy 7.2 ■ - Reduce the amount of waste generated and encourage increased reuse and recycling of waste materials. Policy 7.3 ■ - Contribute to national and international efforts to reduce energy usage and greenhouse gas emissions. Policy 7.4 ■ - Reduce the impact of stormwater on bays and catchments.
Environmental Sustainability
Monitoring of Melbourne’s environment is undertaken and reported by many agencies in more detail than can be provided in these findings. A high priority has been given to work over the last few years to position Melbourne to respond to current and future environmental sustainability challenges.
In particular, progress has been made by the Victorian Government with the management of water and a range of actions are underway to provide water security for Victoria’s growing population and economy, and action has been accelerated to improve climate change responses. These issues have been the subject of significant public interest and major policy statements by government, available in other documents such as Our Water Our Future and Our Environment, Our Future.
Planning system changes, including the Sustainable Neighbourhood Provisions, are in place to support the policies and targets set out in the government’s water strategies. These will help ensure new residential development uses water efficiently and greater use is made of recycled water and other supply options where economically feasible.
The Sustainable Neighbourhood Provisions and the Victorian building regulations through the ‘5 Star’ system (for construction) are also contributing to improved residential energy efficiency and water conservation.
This reform has contributed to the state’s efforts to reduce greenhouse gas emissions, with around 100,000 new homes now built to the ‘5 Star’ standard, delivering greenhouse savings of 136,000 tonnes and water savings of over 1.8 billion litres each year.
The development of a Victorian Energy Efficiency Target scheme will support improvements in the energy/greenhouse performance of existing buildings through requirements on energy retailers. However, with energy consumption increasing in the residential and commercial sectors, reducing greenhouse gas emissions remains an important challenge.
In 2006, VicUrban released a Sustainability Charter which establishes guidelines that define its vision and provide a framework for the design, implementation and delivery of its projects, including environmental leadership. Delivering sustainable environmental outcomes in communities is a key focus of VicUrban. It achieves this by protecting and managing natural systems, habitat and bio-diversity and through adopting innovative and efficient use of precious resources, such as materials, water and energy.
For example, VicUrban’s Aurora community in Epping North is the largest ‘6 Star’ residential development of its kind in Australia. Aurora will provide third pipe recycled water for toilet flushing and garden watering, reducing the demand on drinking water by up to 60%. VicUrban has developed the Eco-Selector tool to guide builders in selecting environmentally friendly building materials and homes at Aurora are reducing building waste by up to 85%.
VicUrban pioneered Water Sensitive Urban Design at Lynbrook in south-east Melbourne which has been successfully taken up and replicated by other developers across Melbourne and is an integral part of VicUrban communities. VicUrban also established the industry standard for harvesting stormwater for recycling and re-use.
VicUrban has adopted an ecologically sound approach to preserving local flora and fauna, landscape design and plantings. Rejuvenating degraded waterways such as Kororoit Creek running through estates at Tenterfield and Cairnlea, and Skeleton Creek at The Boardwalk has enhanced and improved existing habitat to protect endangered species such as the Growling Grass Frog and Legless Lizard. Three grassland reserves have been created at Cairnlea to protect endangered ecosystems and their flora and fauna.
39 Melbourne 2030 Audit: Analysis of Progress and Findings from the 2006 Census
River and bay water quality, along with biodiversity values, all face pressure from urban growth. Currently, 53 per cent of waterways are rated as in ‘moderate’ to ‘excellent’ condition, with 46 per cent in ‘poor’ or ‘very poor’ condition.
Urban runoff is considered to be the biggest source of diffuse pollutants across the catchments. Reductions in nutrient discharges into Port Phillip Bay have been achieved, with Melbourne Water reducing nitrogen discharges by 500 tonnes a year through a $160 million environmental upgrade of the Western Treatment Plant.
The health of Port Phillip Bay overall has been assessed as good. Further reductions to nutrient discharges into Port Phillip Bay and sediment discharge into Western Port will be needed to protect the health of Melbourne’s waterways and marine environment. Particular attention will be needed to ensure the health of the Westernport catchment, given the expansion in urban development planned in the municipalities of Casey and Cardinia and risks posed by runoff from these areas.
In 2002, the Victorian Government released its Victorian Greenhouse Strategy, outlining a suite of actions aimed at reducing greenhouse gas emissions and committing to undertake research on climate change impacts and adaptation. The 2005 update to this strategy identifies the crucial role played by Melbourne 2030 policies of urban containment and consolidation around transport nodes in influencing future trends in energy use and greenhouse gas emissions. A package of new measures announced during 2006 will contribute to driving improvements in the energy efficiency and performance of the built environment. An initial risk assessment of the impact of climate change on infrastructure has been completed and an assessment of coastal vulnerability is currently underway.
However, adaptation to the impacts of climate change is an area of work requiring significant further research and action in future years.
Over the last five years native vegetation that has been removed has been offset by gains in extent and/or site condition or by enhanced protection of habitat for some threatened species. A small but steady increase in the restoration of river corridors has occurred since 2002. New tools to make the administration of native vegetation rules simpler continue to be introduced including Bush Broker, changes to the Victoria Planning Provisions, Native Vegetation Precinct Plans and precinct structure planning in growth areas.
Overall, Melbourne’s air quality is good and the gradual downward trend in maximum measured levels of some key air pollutants has continued since 2002, largely reflecting the progressive tightening of emission standards for new motor vehicles.
Policies to improve the performance of new wood heaters have also contributed to management of fine particles which is a continuing issue of concern. Maintenance of good air quality as Melbourne grows will rely on continual efforts to grow the mode share of non-motorised transport and continual attention to vehicle and fuel performance standards.
Progress is being made in encouraging recycling and diverting waste from landfill disposal. In 2002-2003, total recovery of waste from landfill disposal was 51 per cent and this increased to a 55 per cent recovery in 2004-2005.
This pattern has been mirrored in non-residential sectors with increases in waste recovered from construction and demolition activity from 48 per cent in 2002 to 57 per cent in 2005. Ongoing action is needed to move towards the government’s waste reduction targets.
In June 2007, the Minister for Planning announced a review of planning scheme provisions applying to waste transfer stations and materials recycling. This will support efforts to encourage recycling and good waste management practices and to ensure these activities occur with proper safeguards to the environment and the amenity and safety of local communities.
Policy 7.5 ■ - Protect ground water and land resources.Policy 7.6 ■ - Ensure that land-use and transport planning and infrastructure provision contribute to improved air quality. Policy 7.7 ■ - Protect native habitat and areas of important biodiversity through appropriate land-use planning. Policy 7.8 ■ - Promote the concept of sustainability and develop benchmarks to measure progress. Policy 7.9 ■ - Lead by example in environmental management.

Melbourne 2030 Audit: Analysis of Progress and Findings from the 2006 Census40
Victoria’s economy has prospered and performed well by national and international standards over recent years. Victoria’s Gross State Product increased over 3 per cent per annum to around $230 billion from 2001-2006. Over the same period, real value total factor income for Melbourne increased 2.7 per cent per annum to $135 billion.
This sustained increase in the output of the city is a good indicator of the robustness and adaptability of Melbourne’s economy in the face of national and international pressures. In turn, this reflects the high quality of the region’s labour force and its strong education and research capability.
Melbourne 2030 seeks to strengthen Central Melbourne’s capital city functions and its role as the primary business, retail, sport and entertainment hub for the metropolitan area.
The available data indicates that the inner city has advanced consumer and producer services, relying on knowledge economy jobs that attract a highly skilled workforce from across the region, while industrial and some manufacturing, storage, retailing, education and health sector jobs have become more widely dispersed across the city. The capacity to expand industry and population-based services in outer areas while fostering new knowledge-based industries in inner areas is an indicator of Melbourne’s adaptability.
Business and property services which use premium office space have not decentralised with population growth to the same extent as other services, such as retailing. Melbourne has been able to offer a wide range of office accommodation options in St Kilda Road, Docklands, Southbank, the CBD and other inner city locations and so has not experienced the intense demand for offices in outer suburbs as has occurred in other rapidly expanding cities.
Around 75 per cent of stand-alone office jobs are located in inner Melbourne where public transport accessibility is better than in other areas. Further research is required to understand the dynamics of the office market and the amount of space for office, retail and other services that will be required at suburban centres.
Melbourne has world-renowned research clusters, which the Victorian Government is supporting. Melbourne 2030 recognises their strategic importance by nominating them as Specialised Activity Centres. They include the medical research precincts around major hospitals such as the Alfred and the Austin, the four universities and related technology parks (including the Monash University and Health Research Precinct at Clayton, which is the site of the Synchrotron), and the Werribee Animal and Food Research Precinct.
The State Government is working with local governments to develop and implement structure plans to ensure these research precincts continue to grow. For example, the Parkville Precinct Strategic Plan and the Monash Technology Precinct Plan were both completed in 2006.
Future planning will need to ensure that the economic role and functions of Specialised Activity Centres continues to be prioritised above other competing objectives when undertaking planning for these centres if their potential is to be realised. Some experts have suggested that policy refinement may be warranted to ensure this objective is clear and prioritised.
Adequate industrial land for the next 12 years is already zoned, and the balance needed to provide a 25 year land supply has been identified in forward strategic plans including Growth Area Framework Plans. Progress has been made in protecting stone resources through referencing of Extractive Industry Interest Areas in the
A more prosperous city
Relevant Melbourne 2030 policies
Policy 4.1 ■ - Maintain access to productive natural resources and an adequate supply of well-located land for energy generation, infrastructure and industry.
Policy 4.2 ■ - Strengthen Central Melbourne’s capital city functions and its role as the primary business, retail, sport and entertainment hub for the metropolitan area.

41 Melbourne 2030 Audit: Analysis of Progress and Findings from the 2006 Census
State Planning Policy Framework, the introduction of new zones for green wedges and growth area planning which has generally avoided urban development in Extractive Industry Interest Areas.
A 2006 ACIL-Tasman consultant survey found that all areas within the UGB had metropolitan-equivalent broadband access. The Victorian Government does not control the quality or extent of broadband services, but has contributed in its activities to expanded broadband services. For example, regional rail projects have provided for the installation of high speed fibre optics to regional networked cities.
Infrastructure investments in the Yarra River precinct and the Melbourne Cricket Ground (MCG)/River Sporting Precinct have been delivered and were showcased in the 2006 Commonwealth Games, adding to the recreational and tourism potential of the Yarra River. The MCG and Melbourne Sports and Aquatic Centre redevelopments have also played an important role in attracting international tourists and events to Melbourne.
Collaboration between the government and the City of Melbourne on major projects has helped to ensure Central Melbourne retains its international and national standing as a leader in city design and amenity. The Southbank Plan has been finalised and $5 million allocated to plan for major enhancements in the arts and cultural precincts including a pedestrian ramp to connect St Kilda Road to the Sturt Street arts venues.
Policy 4.4 ■ - Create opportunities for innovation and the knowledge economy within existing and emerging industries, research and education.
Policy 4.5 ■ - Encourage the continued deployment of broadband telecommunications services that are easily accessible.
Policy 5.10 ■ - Maintain and develop metropolitan Melbourne as a desirable tourist destination.

Melbourne 2030 Audit: Analysis of Progress and Findings from the 2006 Census42
A fairer city and housing affordability
Relevant Melbourne 2030 policies
Policy 6.1 ■ - Increase the supply of well-located affordable housing.
Policy 6.2 ■ - Plan for a more equitable distribution of social infrastructure.
Policy 6.3 ■ - Improve the coordination and timing of the installation of services and infrastructure in new development areas.
Policy 6.4 ■ - Develop a strong cultural environment and increase access to arts, recreation and other cultural facilities.
Since the release of Melbourne 2030, the government has put in place a range of programs and investments to advance policies in relation to Direction 6 (A fairer city) and housing affordability. These include:
A Fairer Victoria ■ in 2005, and subsequent updates in 2006 and 2007
the Urban Development Program ■
greater capital investments in public and social ■
housing
support for council-led Regional Housing Statements ■
Towards an Integrated Victorian Housing Strategy ■ (September 2006) which provides a framework for a whole-of-government approach to addressing housing issues
establishing a Building Policy and Housing ■
Affordability Unit in DPCD, charged to work with the Minister for Housing and the Minister for Planning to provide advice to government on policy innovations to support whole-of-government policy on affordable housing and implementation of Melbourne 2030 including encouraging exemplary affordable housing developments
utilising VicUrban’s capacity to innovate and deliver ■
more affordable housing.
Housing affordability
Housing affordability remains an important issue and focus of government action. Housing affordability has generally declined across Australia since 1999. Drivers of housing affordability are complex, but include increased demand for housing as cheap and easily accessible finance became available and the strong growth that has occurred in disposable incomes.
Melbourne 2030 policies have positioned Victoria relatively well compared to other states, particularly with respect to effective management of land supply which will remain a high priority issue in the future. Land as a proportion of new house and land price remains lower in Melbourne than for Australia’s five largest cities, and has remained relatively stable following a spike when the Goods and Services Tax was introduced in 2000 (Figure 10).
The Urban Development Program (UDP) monitors the supply and demand for residential and industrial land. The annual UDP report is widely used by government, councils and industry.
The most affordable housing in Melbourne is still located on the fringe and the adjoining suburbs. Maintaining supply, and continued reforms to reduce approval times and holding costs for developers, in new and established areas will keep a downward pressure on prices.
Dec‘06
Dec‘04
Dec‘05
Figure 10 Land as a proportion of new house and land price for Australia’s five largest cities
Source: HIA - APM Land Monitor, May 2007
60%
50%
40%
30%Dec‘94
Dec‘95
Dec‘96
Dec‘97
Dec‘98
Dec‘99
Dec‘00
Dec‘01
Dec‘02
Dec‘03
Perth
Sydney
Adelaide
Brisbane
Melbourne

43 Melbourne 2030 Audit: Analysis of Progress and Findings from the 2006 Census
The supply of rental dwellings affordable to households on low incomes has remained steady over the last five years. Spatially, the distribution of rental properties in Melbourne is widely spread with a concentration in the inner regions. For moderate and high income households this presents a wide range of opportunities. However, rental properties affordable for low income households are predominantly located in outer metropolitan regions.
A Fairer Victoria
In April 2005 the government released A Fairer Victoria: Creating opportunity and addressing disadvantage. This provided a $788 million investment in 14 strategy areas aimed at reducing disadvantage and creating opportunities. These included strategies to boost access to affordable housing and to build stronger communities. Specific initiatives included:
implementing ■ Melbourne 2030’s affordable housing actions
ensuring Victoria’s planning system supports ■
affordable housing objectives
expanding the ■ Neighbourhood Renewal program.
On 1 June 2006 the government announced A Fairer Victoria: Progress and next steps. This invested a further $848 million in initiatives under the 14 strategy areas. It included a particular focus on:
meeting the needs of Melbourne’s growth areas ■
disadvantage caused by homelessness. ■
At the same time the government continued initiatives designed to boost affordable housing and build stronger communities through a new place-based community renewal program.
A Fairer Victoria: Building on our commitment, released in May 2007, contained a further investment of over $1.4 billion. Community renewal was expanded. There was a continued focus on boosting affordable housing through the affordable homes for Victorian families initiative. This involves the State Government
working in partnership with local and federal governments, non-government agencies and the private sector, to implement strategies to make housing more affordable by:
making the urban planning system more responsive ■
to housing costs
fostering joint public and private sector development ■
projects
investigating new financing options ■
developing improved indicators of housing ■
affordability.
Some recent achievements in implementing A Fairer Victoria include:
establishment of seven not-for-profit housing ■
associations through the Strategy for Growth in Housing for Low Income Victorians
development of new, innovative projects to support ■
young people in housing crisis to reconnect to school, training or employment
delivery of almost 2,000 new homes to ■
disadvantaged Victorians since July 2005, including more than 550 homes in partnership with not-for-profit housing agencies
reinvigoration of the physical and social ■
infrastructure of 19 Neighbourhood Renewal sites.
Investments in social housing
Since the release of Melbourne 2030, the Victorian Government has committed capital investments of over $1.5 billion from 2002-2007 in social housing. Table 4 provides some project examples.
This represents an increased share while the Commonwealth has reduced its funding in real terms. The 2007-2008 State Budget delivered a $510 million investment which is the largest single investment ever made by a State Government in Australia in social and public housing. This brings the total investment in social and public housing in Victoria to $1.4 billion over the next four years.

Melbourne 2030 Audit: Analysis of Progress and Findings from the 2006 Census44
In the Victorian Government’s drive towards a fairer Victoria, the community-managed sector will play a stronger role in providing housing and support services for disadvantaged Victorians. This strategy emphasises strategic partnerships with rental housing agencies, local government and private industry, particularly where there is potential for partners to contribute equity and/or access to private sector finance, towards the funding of affordable housing.
A core element of the strategy is the establishment of registered rental housing agencies. This represents a significant reform which will directly assist in advancing Melbourne 2030’s policy regarding increasing the supply of well-located, affordable housing. So far, there are seven registered Housing Associations:
Loddon Mallee Housing Services Limited ■
Supported Housing Limited ■
Community Housing (Victoria) Limited ■
Melbourne Affordable Housing ■
Port Phillip Housing Association ■
Yarra Community Housing Limited ■
Rural Housing Network. ■
Housing associations will adopt a variety of roles including property development, property management, tenancy management and tenancy support. With the substantial injection of an extra $300 million over four years in the 2007-08 Victorian State Budget, there will be a significant increase in the supply of affordable housing, to complement the public housing system.
Table 4 Major capital investments in social housing since the release of Melbourne 2030 (2002–2007)
Project Budget Description
Kensington Housing Redevelopment $77 million 195 public housing units integrated with up to 455 private properties. The upgrade of two towers containing 241 dwellings.
Commonwealth Games Village Estimated 82 social housing units initially used as $35 million Games accommodation for athletes of the Melbourne 2006 Commonwealth Games with a further 18 social housing units and an aged care facility to be developed by 2011.
Carlton Housing Redevelopment $250 million, A mixture of 245 social including and 550 private apartments $50 million to replace the existing government 192 public housing flats. contribution
K2 Apartments, Raleigh Street $32.4 million 96 homes demonstrating environmentally Windsor sustainable design principles including 46 fully accessible units.
Strategy for Growth in Housing for Low Income Victorians

45 Melbourne 2030 Audit: Analysis of Progress and Findings from the 2006 Census
Regional Housing Statements
Melbourne 2030 seeks to encourage a greater diversity of housing across the metropolitan area to ensure households have access to a range of housing types, tenures and prices reflecting demographic changes and the community’s needs.
Following the release of Melbourne 2030, five local government-based metropolitan Regional Housing Working Groups (RHWG’s)were established to plan for projected housing needs to 2031. Each group developed a Regional Housing Statement (RHS) which provides a framework to plan for future housing needs and guide the development of local housing strategies and policies. RHS’s contain actions to increase housing diversity and facilitate affordable housing, including development of regionally based affordable housing goals and implementation strategies.
Short-term Regional Housing Statement actions are now being implemented. An important short term action is the development of a suite of affordability indicators. This work is being undertaken by DPCD and the Office of Housing and will underpin the development of regional affordable housing goals. The indictors will contribute to a better understanding of affordability needs and inform policy responses. Development of the indicators is well advanced and it is anticipated they will be published on the DPCD website by 2008.
The Inner RHWG is progressing short-term affordable housing actions through the Inner Melbourne Action Plan (IMAP). These actions include an integrated approach to assessing needs and developing targets for affordable housing provision and investigating planning and non-planning mechanisms to support implementation. The suite of indicators and the work of the Inner RHWG will underpin development of affordable housing actions in the Eastern, Northern, Southern and Western regions, enabling these RHWGs to build on work already underway.
VicUrban
The Victorian Government launched an Affordable and Sustainable Home Design project in 2007. Architects will produce a range of home designs which will be owned by VicUrban and licensed to volume builders for delivery in the commercial market. The project will increase choice and design quality for new home buyers.
VicUrban is using a range of market-based initiatives and partnerships to improve access to home ownership for moderate income households and to increase the supply of affordable rental housing for low income and disadvantaged households. Current initiatives include:
the Ownhome pilot, an equity share arrangement ■
that uses a no interest second mortgage to reduce the purchase price of housing
design of homes which are water and energy ■
efficient, cost less to live in, and are more affordable to buy
assisting housing associations to build affordable ■
rental homes in VicUrban communities using grant funds secured from the Victorian Property Fund.

Melbourne 2030 Audit: Analysis of Progress and Findings from the 2006 Census46
Social and cultural infrastructure
Mapping of access to services and shops in the first Melbourne Atlas (published in 2006, before the 2006 Census data was available) suggests that proximity of dwellings to small clusters of services and shops is relatively even across the existing metropolitan area. Disadvantage in accessing services is influenced by geographical proximity of houses to services, but also by the mobility of individuals and households, and local support systems.
The Growth Areas Authority is taking an active role in facilitating collaboration between councils, state agencies, non-government providers and developers regarding the provision of social infrastructure (infrastructure that contributes to or supports social and cultural purposes, such as community meeting places). Improving the provision and distribution of social infrastructure in growth areas will need to remain a priority area for attention.
Maintaining and enhancing access to cultural facilities is a key contributor to strengthening the creative potential of local communities, creating a local sense of place and adding to the vibrancy of activity centres.
The ■ Arts in the Suburbs program was allocated $3.6 million over four years in the 2007-2008 State Budget to support the range and diversity of locally-based arts and cultural facilities across suburban Melbourne. To date, the program has supported a new theatre at Burrinja (formerly the Dandenong Ranges Community Cultural Centre) and the redevelopment of the Museum of Lilydale.
A range of projects have been instigated to promote ■
arts and culture through commissioning professional artists and craftspeople to work on public projects and express artistic and community values. Demand for floor space for cultural facilities around activity centres is expected to increase in line with projected retail, commercial, housing and other demand.
Broad cultural planning assistance at the local ■
government level has also been addressed by initiatives such as the Creative Capacity Statement - Community Liaison Officers and Professionals in Residence program, which also assists in delivering Policy 5.2 of Melbourne 2030.

47 Melbourne 2030 Audit: Analysis of Progress and Findings from the 2006 Census
The efficiency of planning processes has been improved through the implementation of the Better Decisions Faster initiatives, the Streamlined Planning via Electronic Applications and Referrals (SPEAR) project, and the Cutting red tape in planning program.
The Victorian Government adopted the Better Decisions Faster initiatives in April 2004 and committed $3.1 million to implementing major initiatives. Completed actions include:
introducing annual permit activity reporting for all ■
councils
pre-authorising planning scheme amendments to ■
avoid councils spending time and resources preparing an amendment that cannot be strategically justified and which is inconsistent with Victorian Government policy
introducing a model officer report ■
developing a new ‘smart’ permit application form ■
developing a ■ Continuous Improvement Kit to help councils identify ways to improve their planning schemes and planning processes.
The subdivisions component of SPEAR was successfully piloted in August 2004 with a range of councils, referral authorities and surveying firms. Now in production, SPEAR enables subdivisions to be lodged, referred and tracked on-line, achieving time and productivity savings for clients, surveyors, councils and referral authorities. This has laid the foundation for expanding the system to support the planning permit component. Substantial funding has been provided to develop e-planning initiatives within Victoria.
In November 2005, the then Minister for Planning jointly hosted a major forum with the Eastern Metropolitan Group of councils to provide greater impetus to initiatives to streamline the planning system. Following this forum, the Minister initiated a major review to further streamline planning processes. The resulting Cutting red tape in planning program announced in August 2006, comprises 15 actions and 43 tasks to reduce and simplify planning requirements for a wide range of matters and processes.
The actions aim to deliver a range of improvements, from faster planning scheme amendment processes to more focused planning controls. Progress has been made with delivery of the program, with 23 major milestones or projects completed to date.
The Growth Areas Authority is leading a project called Streamlining Planning in Melbourne’s Growth Areas, being developed in partnership with the Department of Planning and Community Development. The Minister for Planning has appointed a Steering Committee, to be chaired by the Parliamentary Secretary for Planning. This is an important project which seeks to reform the growth area planning process to ensure Victoria has the most efficient and effective growth area planning process in Australia.
The PLANET (Planning Network) Training & Professional Development Program and the development of the Certificate IV course in Local Government (Planning) are making an important contribution to providing a continuous improvement program of professional development and training for planners.
A series of measures designed to enhance Victoria’s planning appeals system, particularly the timeliness of decisions, has been put in place.
The Victorian Government increased its support in 2004-2005 so the Victorian Civil and Administrative Tribunal Planning List could significantly reduce its backlog. In 2005-2006, the median time from application to finalisation was 16 weeks, a significant reduction from the 22 weeks taken in 2001-2002.
The number of matters pending has been consistently reduced over the period 2001 to 2006, even though the number of matters initiated has not decreased. Matters pending declined from 1,697 in 2001-2002 to 1,305 in 2005-2006.
In May 2005, legislation was introduced that allows for an applicant to amend a planning application already lodged, with appropriate safeguards to ensure other persons are not adversely affected. This streamlines the planning system by reducing the number of matters in dispute.
Better planning decisions
Relevant Melbourne 2030 policies
Policy 9.1 ■ - Achieve better planning decisions.
Policy 9.2 ■ - Speed up resolution of appeals.

Melbourne 2030 Audit: Analysis of Progress and Findings from the 2006 Census48
Local government is a critical implementation partner. The strongest partnerships have been built between individual local governments and the state through actual projects, whether state-led or council-led.
While councils generally continue to acknowledge the need for Melbourne 2030 and support its overall framework, there are many views regarding implementation priorities and varying degrees of progress and commitment.
The Victorian Government has committed or provided over $40 million in direct funding to help local governments plan and implement on-the-ground works to support Melbourne 2030 implementation. The government has also invested millions of dollars through a range of Transit Cities projects. The 2007-2008 State Budget committed $63.3 million for urban improvement and revitalisation projects in central Footscray, Geelong and Ringwood.
Funding has also been provided to the Municipal Association of Victoria (MAV) for a Melbourne 2030 Senior Liaison Officer since October 2004, to support closer working relationships between state and local government on Melbourne 2030 implementation issues. In December 2006, the MAV established a Melbourne 2030 Local Government Reference Group to strengthen the ability of councils to respond to and implement Melbourne 2030 and to provide an opportunity for exchanging information and discussing Melbourne 2030 implementation issues faced by councils.
A range of forums on various aspects of Melbourne 2030 implementation have been conducted by the Victorian Government, often in collaboration with the MAV. These forums have provided an opportunity for the government to strengthen relationships with councils.
As one of many ongoing actions to maintain partnerships with local government for implementation, senior directors from the Department of Planning and Community Development also conduct a rolling program of visits to metropolitan councils, meeting with Chief Executive Officers and planning directors. These visits provide a ‘whole-of-department’ presence, covering planning and other matters with a particular focus on Melbourne 2030 implementation.
The Department of Sustainability and Environment has also provided $135,000 through a series of grants to the Victorian Local Governance Association for the ‘Changes and Challenges’ Councillor Training Course. This two day course has been operating since 2005 and provides councillors with an understanding of their role in land use planning within the strategic framework provided by Melbourne 2030.
Councils have indicated they want closer collaboration with the Victorian Government to ensure expectations relating to implementation of Melbourne 2030 are reasonable, and to allow issues which arise in the course of implementation to be effectively addressed.
Councils have identified the benefits of providing forums where regional groupings of councils can meet and discuss region-wide issues, such as the Regional Housing Working Groups. RHWG’s were established as forums to highlight housing issues and needs, identify challenges and determine innovative and sustainable approaches to address housing issues.
Melbourne 2030 was the product of extensive community consultation, and detailed consultation on its implementation was undertaken following release, during 2002 and 2003. Community engagement formed a major component of the growth area planning process undertaken during 2003-2005.
Partnerships in Melbourne 2030 implementation
Relevant Melbourne 2030 policies
Policy 9.4 ■ - Develop a strong partnership with local government.
Policy 9.5 ■ - Implement Melbourne 2030 in an integrated way that involves the community.

49 Melbourne 2030 Audit: Analysis of Progress and Findings from the 2006 Census
The focus of community engagement over the past few years has been on supporting councils to engage with communities in relation to Melbourne 2030 implementation. This has included support through grants and partnership approaches.
Resident organisations have voiced a variety of opinions about Melbourne 2030, ranging from calls to abandon it and metropolitan policy, to support for its overall goals but a desire to change the way the strategy is implemented, particularly in local areas. Many views exist about the role of the Victorian Civil and Administrative Tribunal (VCAT). While industry welcomes VCAT’s role, resident groups continue to express concern about its role in reviewing local government decisions.
There is a consistent call from industry and professional associations, including representatives on the Melbourne 2030 Implementation Reference Group, for strong Victorian Government leadership and action in major areas of change and places of metropolitan significance to ensure the interests of Victorians and Melburnians as a whole are balanced with local views. Other organisations have called for the establishment of a metropolitan planning authority or board to drive implementation or make significant planning decisions.
Most stakeholders consider that the objectives and actions of Melbourne 2030 must be better communicated. Confusion exists in some quarters about its purpose and intent, including a widely held misconception it requires high rise development in all centres.
Some stakeholders have suggested extending Melbourne 2030 beyond 2030. Another suggestion is to focus the next five-year implementation program on a smaller number of major actions, rather than numerous smaller initiatives, to better achieve its objectives. Some stakeholders also consider that there is a need for a more comprehensive monitoring and evaluation framework.

Melbourne 2030 Audit: Analysis of Progress and Findings from the 2006 Census50
Greenfield development
Melbourne 2030 includes an aspiration that greenfield development will provide for 31 per cent of all new households, averaged over the period between 2001 and 2030. Figures contained within draft Implementation Plan 3 - Housing released in conjunction with Melbourne 2030 anticipated an increase in the share of greenfield development - from 38 per cent over the period 1997-2001 to 45.2 per cent over the period 2001-2005. This was based on the level of development already in the ‘pipeline’ and proposed for these areas and demographic projections over the 2001-2005 period. Furthermore, during high growth periods such as those recently experienced, Melbourne traditionally sees a significant increase in the amount of greenfield growth.
Analysis of 2006 Census data reveals that 48.3 per cent of household growth between 2001 and 2006 was accommodated through greenfield development (within both designated growth areas and other outer areas within metropolitan Melbourne) and 51.7 per cent was accommodated through development within the remainder of metropolitan Melbourne. This is broadly consistent with what Melbourne 2030 anticipated for the first five year period as set out in draft Implementation Plan 3 - Housing.
The average net density of residential development in new subdivisions has increased from an average of around 10 lots per hectare in 2001 to 12.2 lots per hectare in 2006. This is a positive development, with private developers seeing marketing benefits from providing a wider choice of housing options to meet changing household needs.
Activity centres and other strategic redevelopment sites
Melbourne 2030 includes an aspiration that development at activity centres and other strategic redevelopment sites will provide for 41 per cent of all new households, averaged over the period between 2001 and 2030. Figures contained within draft Implementation Plan 3 - Housing anticipated a slight increase in the share of development at activity centres and other strategic redevelopment sites - from 24 per cent over the period 1997-2001 to 26.1 per cent over the period 2001-2005. This recognised that development in and around activity centres and other strategic redevelopment sites was likely to increase only slightly in the first five years of the strategy while planning was undertaken for these areas.
The best currently available data to monitor development at activity centres and other strategic redevelopment sites is dwelling approvals data. However, there are limitations in using this data to monitor residential development activity as the data is collected by Census Collector Districts (CCDs) and the boundaries of these CCDs do not accord with areas identified in Melbourne 2030. CCDs are also subject to change and do not therefore provide a consistent framework for monitoring development over time. In addition, a dwelling approval does not always necessarily equate to construction and completion of a dwelling, particularly in inner areas.
Noting these data limitations, analysis indicates that dwelling approvals at activity centres and other strategic redevelopment sites has increased from 25 per cent in 2001-2002 to 28 per cent in 2004-2005. This overall increase is broadly consistent with what Melbourne 2030 anticipated for the first five year period, as set out in draft Implementation Plan 3 - Housing.
The DPCD’s land use database project will develop the capacity to accurately map the space devoted to existing land uses, in and outside activity centres.
Is new development reflecting the intent of Melbourne 2030 ?

51 Melbourne 2030 Audit: Analysis of Progress and Findings from the 2006 Census
Location of flats, units and apartments
Analysis of 2006 Census data indicates that the inner region saw 28.6 per cent total or 5.2 per cent average annual growth in the total number of flats, units or apartments from 2001 to 2006 (from 62,900 to 80,900). This accounted for 44.7 per cent of growth in all flats, units and apartments in metropolitan Melbourne between 2001 and 2006.
Some stakeholders have expressed concern regarding the viability of apartment developments in the current market beyond inner Melbourne, due in part to land values and construction costs. There is a general acceptance, however, that there is increasing demand for more diverse forms of housing beyond the inner region, and there are examples of diverse types of residential development meeting this demand.
Capacity to accommodate future housing
Population projections will continue to be updated
A key driver for the development of Melbourne 2030 was the need to manage and provide for future population and household growth and a significant increase in the number of smaller households (1 and 2 person).
At the time of release in 2002 the projected metropolitan housing demand was around 620,000 additional dwellings from 2001 to 2031. This projected demand was confirmed by Victoria In Future 2004 (VIF 2004) population and household projections, which updated projected metropolitan housing demand to around 627,000 additional dwellings, based on the trends shown by the 2001 Census.
Melbourne 2030 acknowledged, however, that “should the decline in the birth rate reverse or levels of international migration increase, the rate of population growth would accelerate and more people would need to be accommodated in a shorter time frame” (Melbourne 2030, p14). On the assumption that the trends suggested by the 2006 Census will continue into the future, the updated Victoria in Future 2008 (VIF 2008) projections will reflect continued strong growth at a higher rate.
The implications of revised projections will need to be carefully considered in continuing to manage metropolitan growth and change.

Melbourne 2030 Audit: Analysis of Progress and Findings from the 2006 Census52
Ability to accommodate varying projections
Consideration of Melbourne’s capacity to accommodate future housing demand has occurred since the release of Melbourne 2030. This work included detailed growth area planning investigations, the development of 5 Regional Housing Statements and preparation of a significant number of structure plans for activity centres and major redevelopment sites across metropolitan Melbourne. Studies have taken account of the general policy aspirations regarding distribution of housing across greenfield and established areas (including strategic redevelopment sites and activity centres).
This strategic planning work undertaken by the government and metropolitan councils has indicated that while population and household growth has accelerated, higher levels of growth than was projected by VIF 2004 can be accommodated within the metropolitan area.
Collectively, the Regional Housing Statements identified opportunities for over 653,000 dwellings across established and greenfields areas within the current Urban Growth Boundary between 2001 to 2031.
Within growth areas the 2006 Urban Development Program Report advises that around 190,000 additional lots can be accommodated in existing growth areas, based on conservative assumptions about land availability and lot yield / density. The development industry is gradually increasing the number of lots it can produce on a given area of land. It is expected that this trend will continue in order to meet market demand for different types of dwellings and lifestyle choices. In that event, many additional lots will be accommodated. For example, if lot yields of around 15 dwellings per hectare were being achieved on land not yet zoned for urban development, around 30,000-45,000 additional lots could be accommodated. Estimates will continue to be updated periodically as Precinct Structure Plans in growth areas are completed, local planning investigations are completed and the latest market trends are evaluated.
Identification of new opportunities
Current estimates of the capacity to accommodate future housing growth are highly likely to understate the full range of additional housing opportunities that will arise to 2030.
In general, because of significant strategic planning efforts in growth areas undertaken since 2002 by councils, the government and the Growth Areas Authority, future housing opportunities in growth areas are generally better known than in the established areas.
Further opportunities for housing exist in the established urban areas. As more strategic planning is undertaken in the established areas, particularly through structure planning of activity centres, or through other land uses shifting to residential uses, further opportunities to meet housing needs will be identified.
People will have more choices about whether they live in new suburbs or conveniently located smaller homes in established urban areas or activity centres.

53 Melbourne 2030 Audit: Analysis of Progress and Findings from the 2006 Census
Conclusion
The planning work undertaken since the release of Melbourne 2030 suggests Melbourne can continue to respond to changing circumstances, such as the potential for VIF 2008 to project higher household growth rates. The existing capacity estimates for accommodating housing growth within established areas are conservative and new opportunities will continue to be identified. Growth area planning has indicated that, should the need arise, options are available for future growth outside the Urban Growth Boundary. It should be noted that there are high costs associated with many options for such growth and that there may be long term limitations to growth in some growth areas.
Continued high growth rates would increase the importance of government, councils and industry working together to provide more housing opportunities in established areas in accordance with Melbourne 2030’s principles. These include activity centres, Transit Cities, strategic redevelopment sites near public transport, and well designed and managed infill housing to provide choice as our population ages and changes.
In periods of higher than average growth rates that occur from time to time, it is expected that the extra demand will be met by higher than average development activity in greenfields areas as the development industry is best able to respond to short term demand pressures by building in those areas. In that event, changes to the UGB in growth areas will be required periodically to maintain a long-term supply of land of 15 to 25 years and competition in local markets to keep downwards pressure on house prices.
Technical Note:
Regional Housing Statement estimates were informed by preliminary assessments by councils of long term capacity to accommodate demand for additional housing and for new types of housing. Housing opportunity estimates are based on assumptions and timeframes that vary slightly between councils. This is due to the different stages and depth of strategic analysis and planning between the councils. However, the overall analysis is robust at the regional scale and over the time involved.

Melbourne 2030 Audit: Analysis of Progress and Findings from the 2006 Census54
This is a major question for Stages 2 and 3 of the Audit and will be an important focus of the Audit Expert Group.
Retail policy was identified as a ‘policy gap’ in the early stages of the Audit and the Minister for Planning announced a Retail Policy Review in May 2007. Stakeholders and experts have also suggested that more policy development and refinement could usefully occur regarding economic issues. In particular, employment policy and a clearer articulation of the role and purpose of Specialised Activity Centres to unambiguously prioritise their economic functions may be warranted.
A more comprehensive analysis of potential policy refinements will emerge during the next stages of the Audit.
The nature and content of a future implementation program for Melbourne 2030 is a major question for Stages 2 and 3 of the Audit and will be an important focus of the independent Audit Expert Group. The Terms of Reference for the independent Audit Expert Group requires them to make recommendations about this question and it is premature to make findings on this question at this stage of the Audit.
As mentioned above, in considering the future focus of implementation, a number of stakeholders have suggested the focus of the next five-year implementation program be on a smaller number of major actions rather than numerous smaller initiatives to better achieve its objectives.
What policy refinements are needed?
What initiatives need to be completed over the next five years to enhance effective implemention of Melbourne 2030?