melodic similarity and applications using biologically ...€¦ · applied sciences article melodic...
TRANSCRIPT
applied sciences
Article
Melodic Similarity and Applications UsingBiologically-Inspired Techniques
Dimitrios Bountouridis 1,* ID , Daniel G. Brown 2, Frans Wiering 1 and Remco C. Veltkamp 1 ID
1 Department of Information and Computing Sciences, Utrecht University, 3584 CC Utrecht, The Netherlands;[email protected] (F.W.); [email protected] (R.C.V.)
2 David R. Cheriton School of Computer Science, University of Waterloo, Waterloo, ON N2L 3G1, Canada;[email protected]
* Correspondence: [email protected]; Tel.: +31-30-253-1172
Academic Editor: Meinard MüllerReceived: 30 September 2017; Accepted: 27 November 2017; Published: 1 December 2017
Abstract: Music similarity is a complex concept that manifests itself in areas such as MusicInformation Retrieval (MIR), musicological analysis and music cognition. Modelling the similarityof two music items is key for a number of music-related applications, such as cover song detectionand query-by-humming. Typically, similarity models are based on intuition, heuristics or small-scalecognitive experiments; thus, applicability to broader contexts cannot be guaranteed. We argue thatdata-driven tools and analysis methods, applied to songs known to be related, can potentially provideus with information regarding the fine-grained nature of music similarity. Interestingly, music andbiological sequences share a number of parallel concepts; from the natural sequence-representation,to their mechanisms of generating variations, i.e., oral transmission and evolution respectively.As such, there is a great potential for applying scientific methods and tools from bioinformaticsto music. Stripped-down from biological heuristics, certain bioinformatics approaches can begeneralized to any type of sequence. Consequently, reliable and unbiased data-driven solutions toproblems such as biological sequence similarity and conservation analysis can be applied to musicsimilarity and stability analysis. Our paper relies on such an approach to tackle a number of tasksand more notably to model global melodic similarity.
Keywords: melodic similarity; alignment; stability; variation; bioinformatics
1. Introduction
In 2016, digital music revenues overtook physical revenues for the first time (www.ifpi.org/downloads/GMR2016.pdf), a testament to the music industry’s adaptability to the digital age. Listenersare currently able to stream and explore massive collections of music such as Spotify’s (www.spotify.com) library of around 30 million tracks. Such a development has changed not only the way peoplelisten to music, but also the way they interact with it. According to a 2015 survey (www.midiaresearch.com/blog/midia-chart-of-the-week-music-discovery), 35% of users of streaming services use them todiscover new songs and artists, new and exciting music for their unique personal taste or listeninghabits. At the same time, the proliferation of digital music services has raised the listeners’ interestin the accompaniment chords (www.chordify.com), the lyrics (www.musixmatch.com), the originalversions of a cover, the sample (loop) (www.whosampled.com) that a song uses and many morescenarios that service providers cannot deal with manually.
This development brings Music Information Retrieval (MIR) to the centre of attention. The fieldincludes research about accurate and efficient computational methods, applied to various musicretrieval and classification tasks such as melody retrieval, cover song detection, automatic chordextraction and of course music recommendation. Such applications require us to build representations
Appl. Sci. 2017, 7, 1242; doi:10.3390/app7121242 www.mdpi.com/journal/applsci
Appl. Sci. 2017, 7, 1242 2 of 29
of previously seen classes (e.g., sets of covers of the same song), which can be only compared toa query (e.g., a cover song whose original is unknown) by means of a meaningful music similarityfunction. A robust MIR system should model the fuzziness and uncertainty of the differences betweentwo musical items perceived as similar. As Van Kranenburg argues specifically about folk songmelodies: “knowledge about the relation between a desired melody and the way this melody is sungfrom memory” can increase the robustness of melody retrieval tasks [1].
However, this “knowledge”, the exact mechanics of perceived similarity, is still unknownor incomplete [2]. This is not surprising considering music’s inherently complex nature [3,4].The perceived similarity between two musical pieces is known to be subjective: judgements of differentindividuals can vary significantly. Marsden [5] argues that similarity involves interpretation, which byitself is a personal creative act. Ellis et al. [6] argue that the individual perception of similarity canshow variation depending on the listener’s mood or familiarity with the musical culture and can evenchange through time. The individual interpretation can be affected also by the multidimensionality ofmusic, since similarity between two songs can be a function of timbre, melody, rhythm, structure orindeed any combinations of those (or other) dimensions. To make matters worse, music similarity isknown to be contextual, thus depending on the circumstances of comparison. Deliège [7] argues thatsimilarity can appear as stable only when the context, “the structure of the natural world or a specificcultural system” is quite stable itself.
To overcome, or avoid addressing the aforementioned issues, many MIR approaches to similarityrely on cognition studies, expert heuristics, music theory or formalized models in general. Cognitionstudies are scientifically well-founded, but often cannot capture the general consensus due to practicallimitations, such as access to a sufficient number of participants that fit a certain profile for the study.Expert knowledge, on the other hand, can be a valuable source of information, but with regard tomusic, expert knowledge cannot fully explain its highly complex nature and the sophisticated humanperception. In addition, heuristic approaches have the risk of being descriptive rather than predictive.Formalized models founded on music theory typically neglect that it is not a theory of music perceptionof similarity. In addition, such models have the highest risk of being solely descriptive, thus notproviding us with new knowledge. To their defence, all such approaches can have a certain practicalvalidity, but limited explanatory power, as long as they are evaluated only on a reliable ground-truthand are applied to narrow contexts. Human ratings of similarity are highly problematic with studiesshowing that subjects are inconsistent with each other and even with themselves [8,9]. Regarding theassessment of similarity between song-triads particularly, Tversky [10] argues that subjects are affectedby the song order of appearance and even the song popularity. Regarding the context, a one-fits-allmodel of similarity is impossible, and as Marsden argues: “the best one can hope for is a measurewhich will usefully approximate human judgements of similarity in a particular situation” [5].
As long as music cognition fails to provide us a blueprint of how to develop a computational,generalizable model of music similarity, we are required to explore alternative, data-driven approachesthat aim to model the knowledge extracted from the data and the data relations. Data-drivenmusic similarity is not a new concept in MIR, but such studies [11,12] have focused on high-levelsimilarity (genre, artist) where listeners’ opinions are fuzzy. Approaches on more fine-grained musicsimilarity at the note or chord level, such as the work of Hu et al. [13], are scarce for a legitimatereason: in order for the data relations to be bias-free and visible, the data need to be organizedin a proper-for-knowledge-extraction form. Properly annotated and disambiguated corpora ofnote-to-note or chord-to-chord relationships are extremely hard to find.
Fortunately, algorithms that properly organize sequential data have been widely used andare fundamental in the field of bioinformatics. One of the most notable algorithms from the vastbioinformatics toolbox, pairwise sequence alignment via dynamic programming, has been successfullyadapted by MIR to compare musical items such as melodies [14] or chord sequences [15]. On closerlook, musical and biological sequences are not as unrelated as one might think: even as early as the1950s, it had been observed that they share a number of resembling concepts [16]. Krogh states that
Appl. Sci. 2017, 7, 1242 3 of 29
“the variation in a class of sequences can be described statistically, and this is the basis for most methodsused in biological sequence analysis” [17]. By acknowledging that the variation of certain quantifiablemusical features in a group of related music sequences can be described statistically, as well [18],we gain access to a number of sophisticated, data-driven approaches and bias-free tools that can beadopted from bioinformatics, allowing the modelling of music similarity.
1.1. From Bioinformatics to MIR
Bioinformatics use statistical and computational techniques to connect molecular biology andgenetics. Bioinformatics deal with different types of data. DNA sequences carry most of the inheritedgenetic information of living organisms. These sequences can be represented as a string overa four-letter alphabet {A,C,G,T}, where each symbol represents a nucleotide base. DNA sequencescan be as long as several billion symbols, depending on the organism. The instructions to formproteins, which are essential to living organisms, are encoded in the DNA in the form of subsequencesor sections called genes. Through a translation process, certain genes are mapped into long chainsof amino acids, which fold into three-dimensional protein structures. For computational purposes,proteins can likewise be considered as strings of characters (typically several hundred symbols) froma 20-letter alphabet (since there are 20 different common amino acids).
Music, unlike static forms of art, has a temporal nature. As such, music perception relies ontemporal processing [19]. As Gurney argues regarding melodies specifically: “The elements are unitssucceeding one another in time; and though each in turn, by being definitely related to its neighbours,is felt as belonging to a larger whole” [20]. The same idea actually holds for other music elements,such as chords (notes sounding almost simultaneously) or rhythm. It is therefore not surprising thatcertain music items, such as symbolic scores, chord transcriptions and others, similarly to DNA orproteins, can be naturally represented as sequences of characters from a finite alphabet. When it comesto music applications, the importance of sequence representation has been demonstrated most notablyby Casey and Slaney [21] and by numerous other works that adopted it over the years.
A core assumption of molecular biology is that of homology: related sequences diverge froma common ancestor through random processes, such as mutation, insertion, deletion, and morecomplex events, aided by natural selection. This process of genetic variation provides the basis forthe biodiversity of organisms. Homologues might share preferentially “conserved” regions, subjectedto fewer mutations compared to the rest of the sequence [22], which are considered crucial for thefunctionality of a protein [23]. Similarly, a fundamental observation in music is that music informationpassing orally, or in other form, can be subjected to noise. Due to our limited cognitive capacity,or for artistic purposes, a musical piece can change throughout a network of musical actors. A folksong that has been transmitted from mouth to mouth and from generation to generation, might differdramatically from its original version. Even recorded songs can differ when covered by other artists orperformed live. There is a strong resemblance to biological evolution since music homologues can occurby altering, inserting, deleting or duplicating music elements to a certain extent [16]. Intuitively also,certain salient parts of a melody or a chord progression are less likely to mutate, thus remaining“conserved”, in an alternative version.
Identifying similarity is crucial not only for MIR, but for bioinformatics applications, as well.Finding homologues through sequence-similarity search is key. Besides the systematic organization,homologue search can help relate certain characteristic behaviours of a poorly-known proteinsequence [24]. In addition, experimental results on model species can be applied to humans.Pairwise sequence alignment is the most popular method for assessing the similarity of two sequences.The idea is to introduce gaps ‘-’ to sequences so that they share the same length, while placing“related” sequence elements in the same positions. As such, pairwise alignment aims to find theoptimal alignment with respect to a scoring function that optimally captures the evolutionaryrelatedness between amino acids (how probable it is for one amino acid to be mutated to another).Another important bioinformatics application is finding conserved regions or patterns among multiple
Appl. Sci. 2017, 7, 1242 4 of 29
homologue sequences which allows for the estimation of their evolutionary distance, for phylogeneticanalysis and more. This is achieved by aligning three or more sequences simultaneously, a processtypically called Multiple Sequence Alignment (MSA).
1.2. Contribution
In this paper, we argue that MIR can benefit immensely by exploring the full potential of tools,methods and knowledge from the field of bioinformatics and biological sequence analysis, particularlyconsidering melodic-similarity related applications. Despite the high resemblance of concepts(see Table 1), MIR has yet to fully adopt sophisticated solutions such as multiple sequence alignment.As Van Kranenburg suggested, there is a potential for MIR to harvest the bioinformatics’ long historyof algorithm development, improvement and optimization for biological sequence analysis [1].
Table 1. Shared concepts and terms between music and bioinformatics.
Music Bioinformatics
Melodies, chord progressions DNA, proteinsOral transmission, cover songs Evolution
Variations, covers HomologuesTune family, clique Homology, family
Cover song identification, melody retrieval Homologue detectionStability Conservation
Our previous works on aligning polyphonic voices [25] and melody retrieval [26] more notably,briefly touched on the relationship between MIR and bioinformatics. However, their ideas andbioinformatics-inspired solutions facilitated the work presented in this paper. As such, this paper’scontribution relies first on establishing a strong connection between musical and biological sequences.This allows us to adopt analysis pipelines and algorithms from bioinformatics to: (a) gain newinsights regarding music similarity by performing a stability analysis, and (b) present novel solutionsfor tackling melody retrieval by modelling global similarity. Most importantly, our pipelines arepurely data-driven and free of heuristics, as opposed to other MIR methods. To validate thegeneralization-ability of our approach, we apply it to two melodic datasets of different music.As such, we diverge from previous MIR studies that focused on a specific subset of all possiblemusic. In addition, previous work on datasets of chord sequences [27] also supports the usability ofthis approach to more than melodic data.
The remainder of this paper is organized as follows: Section 2 acts as an introduction thefundamental sequence comparison and analysis tools derived from bioinformatics. Section 3 describesthe musical datasets used in our work. From there on, we apply the bioinformatics methods and toolsto the datasets. Section 4 investigates the concept of “meaningful” alignments, while Section 5 usesthe findings of 4 to present an analysis of music stability. Section 6 tackles the problems of modellingglobal similarity. Finally, Section 7 discusses the conclusions of this paper.
2. Methods and Tools
This section aims to describe the fundamental methods used in biological sequence analysis:pairwise alignment and multiple sequence alignment. Understanding their mechanics and limitationsis crucial for successfully applying them to MIR tasks. However, the reader familiar with these methodscan skip to Section 3 directly.
2.1. Pairwise Alignment
An intuitive method for DNA or protein sequence comparison is the Levenshtein (or Edit)distance, which computes the minimal number of one-symbol substitutions, insertions and deletionsto transform one sequence into the other. Such operations can be naturally mapped to the biological
Appl. Sci. 2017, 7, 1242 5 of 29
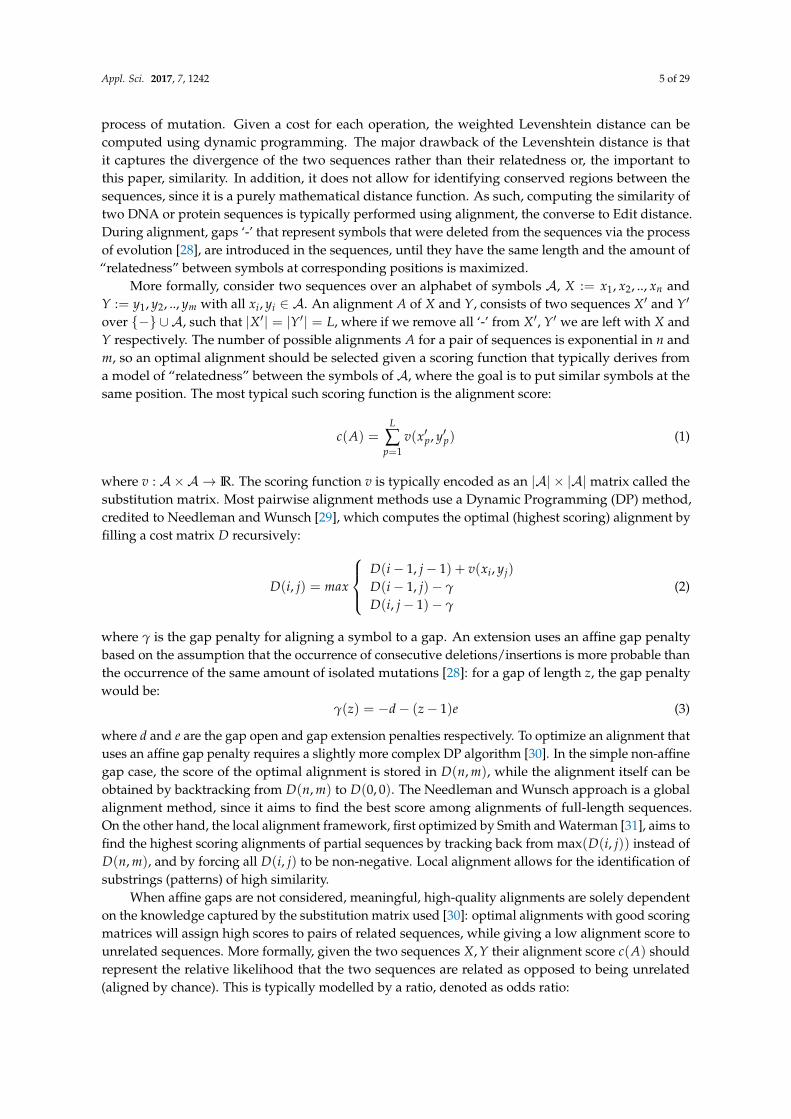
process of mutation. Given a cost for each operation, the weighted Levenshtein distance can becomputed using dynamic programming. The major drawback of the Levenshtein distance is thatit captures the divergence of the two sequences rather than their relatedness or, the important tothis paper, similarity. In addition, it does not allow for identifying conserved regions between thesequences, since it is a purely mathematical distance function. As such, computing the similarity oftwo DNA or protein sequences is typically performed using alignment, the converse to Edit distance.During alignment, gaps ‘-’ that represent symbols that were deleted from the sequences via the processof evolution [28], are introduced in the sequences, until they have the same length and the amount of“relatedness” between symbols at corresponding positions is maximized.
More formally, consider two sequences over an alphabet of symbols A, X := x1, x2, .., xn andY := y1, y2, .., ym with all xi, yi ∈ A. An alignment A of X and Y, consists of two sequences X′ and Y′
over {−} ∪A, such that |X′| = |Y′| = L, where if we remove all ‘-’ from X′, Y′ we are left with X andY respectively. The number of possible alignments A for a pair of sequences is exponential in n andm, so an optimal alignment should be selected given a scoring function that typically derives froma model of “relatedness” between the symbols of A, where the goal is to put similar symbols at thesame position. The most typical such scoring function is the alignment score:
c(A) =L
∑p=1
v(x′p, y′p) (1)
where v : A×A → IR. The scoring function v is typically encoded as an |A| × |A|matrix called thesubstitution matrix. Most pairwise alignment methods use a Dynamic Programming (DP) method,credited to Needleman and Wunsch [29], which computes the optimal (highest scoring) alignment byfilling a cost matrix D recursively:
D(i, j) = max
D(i− 1, j− 1) + v(xi, yj)
D(i− 1, j)− γ
D(i, j− 1)− γ
(2)
where γ is the gap penalty for aligning a symbol to a gap. An extension uses an affine gap penaltybased on the assumption that the occurrence of consecutive deletions/insertions is more probable thanthe occurrence of the same amount of isolated mutations [28]: for a gap of length z, the gap penaltywould be:
γ(z) = −d− (z− 1)e (3)
where d and e are the gap open and gap extension penalties respectively. To optimize an alignment thatuses an affine gap penalty requires a slightly more complex DP algorithm [30]. In the simple non-affinegap case, the score of the optimal alignment is stored in D(n, m), while the alignment itself can beobtained by backtracking from D(n, m) to D(0, 0). The Needleman and Wunsch approach is a globalalignment method, since it aims to find the best score among alignments of full-length sequences.On the other hand, the local alignment framework, first optimized by Smith and Waterman [31], aims tofind the highest scoring alignments of partial sequences by tracking back from max(D(i, j)) instead ofD(n, m), and by forcing all D(i, j) to be non-negative. Local alignment allows for the identification ofsubstrings (patterns) of high similarity.
When affine gaps are not considered, meaningful, high-quality alignments are solely dependenton the knowledge captured by the substitution matrix used [30]: optimal alignments with good scoringmatrices will assign high scores to pairs of related sequences, while giving a low alignment score tounrelated sequences. More formally, given the two sequences X, Y their alignment score c(A) shouldrepresent the relative likelihood that the two sequences are related as opposed to being unrelated(aligned by chance). This is typically modelled by a ratio, denoted as odds ratio:
Appl. Sci. 2017, 7, 1242 6 of 29
P(X, Y|M)
P(X, Y|R) (4)
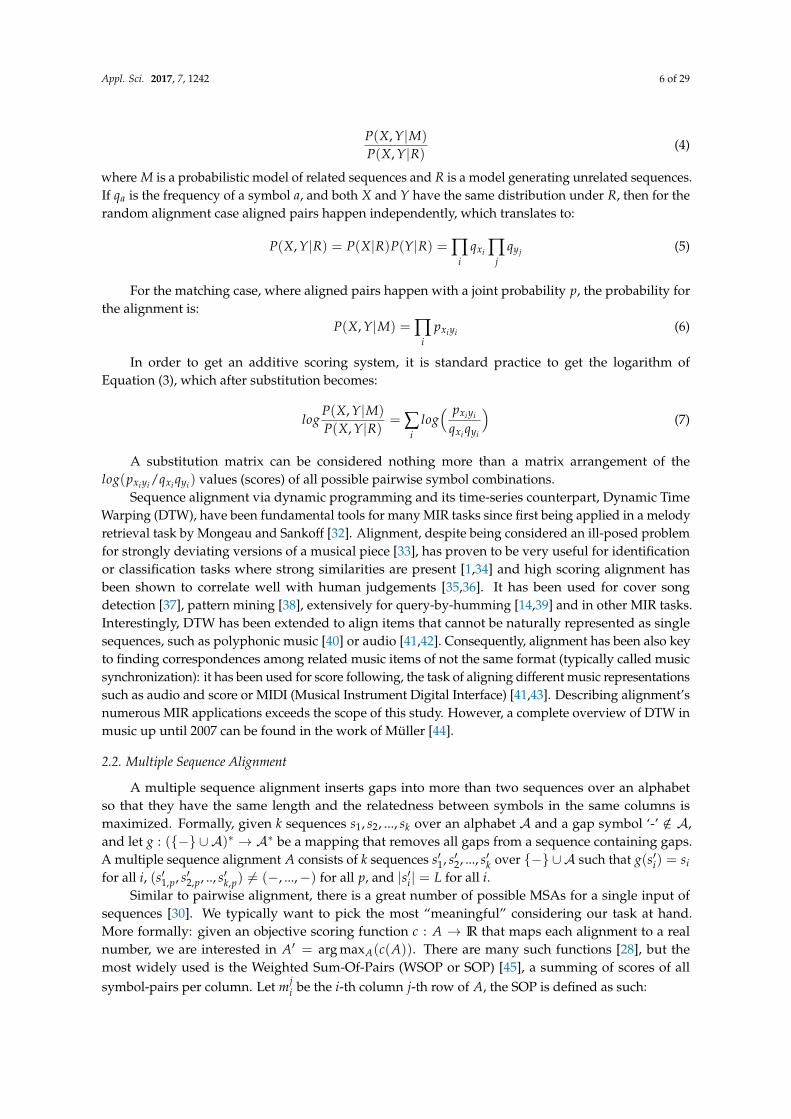
where M is a probabilistic model of related sequences and R is a model generating unrelated sequences.If qa is the frequency of a symbol a, and both X and Y have the same distribution under R, then for therandom alignment case aligned pairs happen independently, which translates to:
P(X, Y|R) = P(X|R)P(Y|R) = ∏i
qxi ∏j
qyj (5)
For the matching case, where aligned pairs happen with a joint probability p, the probability forthe alignment is:
P(X, Y|M) = ∏i
pxiyi (6)
In order to get an additive scoring system, it is standard practice to get the logarithm ofEquation (3), which after substitution becomes:
logP(X, Y|M)
P(X, Y|R) = ∑i
log( pxiyi
qxi qyi
)(7)
A substitution matrix can be considered nothing more than a matrix arrangement of thelog(pxiyi /qxi qyi ) values (scores) of all possible pairwise symbol combinations.
Sequence alignment via dynamic programming and its time-series counterpart, Dynamic TimeWarping (DTW), have been fundamental tools for many MIR tasks since first being applied in a melodyretrieval task by Mongeau and Sankoff [32]. Alignment, despite being considered an ill-posed problemfor strongly deviating versions of a musical piece [33], has proven to be very useful for identificationor classification tasks where strong similarities are present [1,34] and high scoring alignment hasbeen shown to correlate well with human judgements [35,36]. It has been used for cover songdetection [37], pattern mining [38], extensively for query-by-humming [14,39] and in other MIR tasks.Interestingly, DTW has been extended to align items that cannot be naturally represented as singlesequences, such as polyphonic music [40] or audio [41,42]. Consequently, alignment has been also keyto finding correspondences among related music items of not the same format (typically called musicsynchronization): it has been used for score following, the task of aligning different music representationssuch as audio and score or MIDI (Musical Instrument Digital Interface) [41,43]. Describing alignment’snumerous MIR applications exceeds the scope of this study. However, a complete overview of DTW inmusic up until 2007 can be found in the work of Müller [44].
2.2. Multiple Sequence Alignment
A multiple sequence alignment inserts gaps into more than two sequences over an alphabetso that they have the same length and the relatedness between symbols in the same columns ismaximized. Formally, given k sequences s1, s2, ..., sk over an alphabet A and a gap symbol ‘-’ /∈ A,and let g : ({−} ∪ A)∗ → A∗ be a mapping that removes all gaps from a sequence containing gaps.A multiple sequence alignment A consists of k sequences s′1, s′2, ..., s′k over {−} ∪A such that g(s′i) = sifor all i, (s′1,p, s′2,p, .., s′k,p) 6= (−, ...,−) for all p, and |s′i| = L for all i.
Similar to pairwise alignment, there is a great number of possible MSAs for a single input ofsequences [30]. We typically want to pick the most “meaningful” considering our task at hand.More formally: given an objective scoring function c : A → IR that maps each alignment to a realnumber, we are interested in A′ = arg maxA(c(A)). There are many such functions [28], but themost widely used is the Weighted Sum-Of-Pairs (WSOP or SOP) [45], a summing of scores of allsymbol-pairs per column. Let mj
i be the i-th column j-th row of A, the SOP is defined as such:
Appl. Sci. 2017, 7, 1242 7 of 29
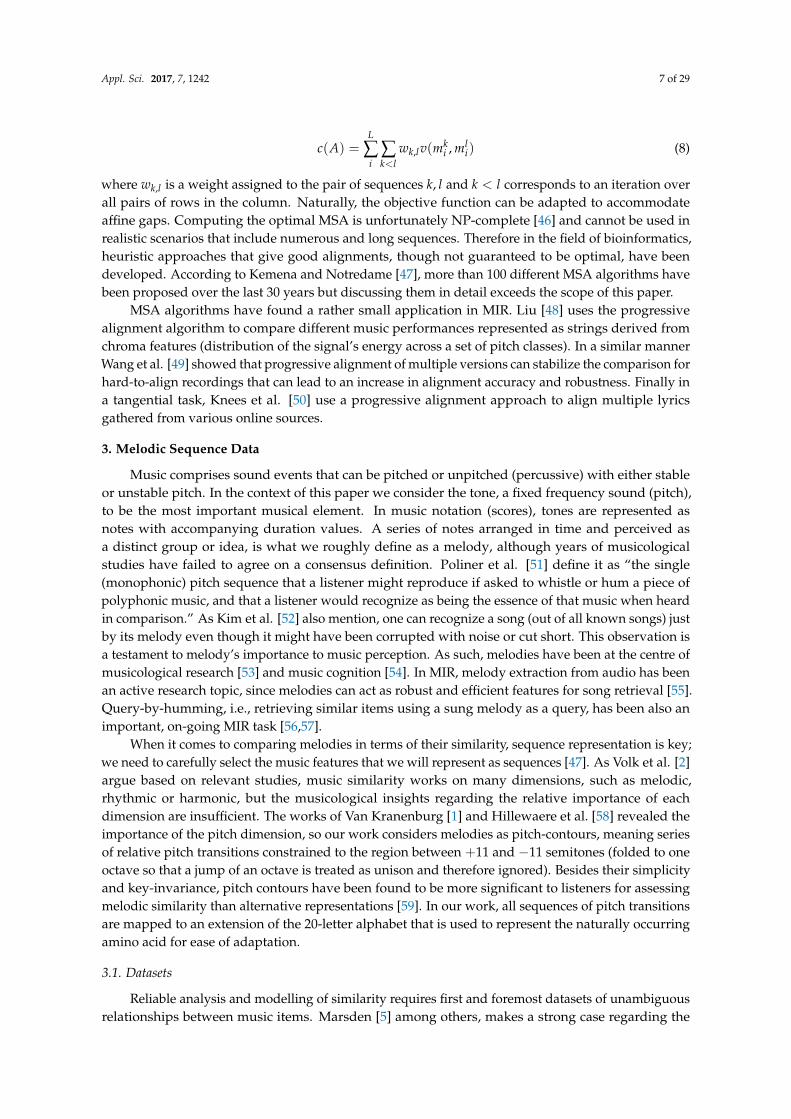
c(A) =L
∑i
∑k<l
wk,lv(mki , ml
i) (8)
where wk,l is a weight assigned to the pair of sequences k, l and k < l corresponds to an iteration overall pairs of rows in the column. Naturally, the objective function can be adapted to accommodateaffine gaps. Computing the optimal MSA is unfortunately NP-complete [46] and cannot be used inrealistic scenarios that include numerous and long sequences. Therefore in the field of bioinformatics,heuristic approaches that give good alignments, though not guaranteed to be optimal, have beendeveloped. According to Kemena and Notredame [47], more than 100 different MSA algorithms havebeen proposed over the last 30 years but discussing them in detail exceeds the scope of this paper.
MSA algorithms have found a rather small application in MIR. Liu [48] uses the progressivealignment algorithm to compare different music performances represented as strings derived fromchroma features (distribution of the signal’s energy across a set of pitch classes). In a similar mannerWang et al. [49] showed that progressive alignment of multiple versions can stabilize the comparison forhard-to-align recordings that can lead to an increase in alignment accuracy and robustness. Finally ina tangential task, Knees et al. [50] use a progressive alignment approach to align multiple lyricsgathered from various online sources.
3. Melodic Sequence Data
Music comprises sound events that can be pitched or unpitched (percussive) with either stableor unstable pitch. In the context of this paper we consider the tone, a fixed frequency sound (pitch),to be the most important musical element. In music notation (scores), tones are represented asnotes with accompanying duration values. A series of notes arranged in time and perceived asa distinct group or idea, is what we roughly define as a melody, although years of musicologicalstudies have failed to agree on a consensus definition. Poliner et al. [51] define it as “the single(monophonic) pitch sequence that a listener might reproduce if asked to whistle or hum a piece ofpolyphonic music, and that a listener would recognize as being the essence of that music when heardin comparison.” As Kim et al. [52] also mention, one can recognize a song (out of all known songs) justby its melody even though it might have been corrupted with noise or cut short. This observation isa testament to melody’s importance to music perception. As such, melodies have been at the centre ofmusicological research [53] and music cognition [54]. In MIR, melody extraction from audio has beenan active research topic, since melodies can act as robust and efficient features for song retrieval [55].Query-by-humming, i.e., retrieving similar items using a sung melody as a query, has been also animportant, on-going MIR task [56,57].
When it comes to comparing melodies in terms of their similarity, sequence representation is key;we need to carefully select the music features that we will represent as sequences [47]. As Volk et al. [2]argue based on relevant studies, music similarity works on many dimensions, such as melodic,rhythmic or harmonic, but the musicological insights regarding the relative importance of eachdimension are insufficient. The works of Van Kranenburg [1] and Hillewaere et al. [58] revealed theimportance of the pitch dimension, so our work considers melodies as pitch-contours, meaning seriesof relative pitch transitions constrained to the region between +11 and −11 semitones (folded to oneoctave so that a jump of an octave is treated as unison and therefore ignored). Besides their simplicityand key-invariance, pitch contours have been found to be more significant to listeners for assessingmelodic similarity than alternative representations [59]. In our work, all sequences of pitch transitionsare mapped to an extension of the 20-letter alphabet that is used to represent the naturally occurringamino acid for ease of adaptation.
3.1. Datasets
Reliable analysis and modelling of similarity requires first and foremost datasets of unambiguousrelationships between music items. Marsden [5] among others, makes a strong case regarding the
Appl. Sci. 2017, 7, 1242 8 of 29
validity of similarity ranking annotations, considering the paradigm differences of the listeningexperiments that generated them. However, he is more supportive to binary or definite annotations ofsimilarity, such as songs known to be covers, or songs known to be related from musicological studies.Such data can be used to verify a computational model with regard to its retrieval or classificationperformance, since the distance for music items within a category should be less than the distanceof items belonging to different categories. As such, this paper uses two datasets of symbolicallyrepresented melodies of varying size and nature, containing melodies that are considered related(e.g., covers of the same song) grouped into definite groups called either families, classes or cliques.Summary statistics for both sets are presented in Table 2.
The Annotated Corpus of the Meertens Tune Collections [60], or TUNEFAM-26, is a set of 360 Dutchfolk songs grouped into 26 “tune families” by Meertens Institute experts. Each contains a group ofmelody renditions related through an oral transmission process. For this dataset, expert annotatorsassessed the perceived similarity of every melody over a set of dimensions (contour, rhythm, lyrics,etc.) to a set of 26 prototype “reference melodies”. In addition, the dataset contains 1426 annotatedmotif occurrences grouped into 104 classes, where “motifs” correspond to recurring patterns inside themelodies of a tune family. The Cover Song Variation dataset [61], or CSV-60, is a set of expert-annotated,symbolically-represented vocal melodies derived from matching structural segments (such as versesand choruses) of different renditions of sixty pop and rock songs. CSV-60 is inherently different fromTUNEFAM-26 in two ways. First, the grouping of melodies into classes is certain: the songs werepre-chosen as known covers of songs of interest. Secondly, cover songs are typically not a by-productof an oral transmission process since cover artists have access to the original version.
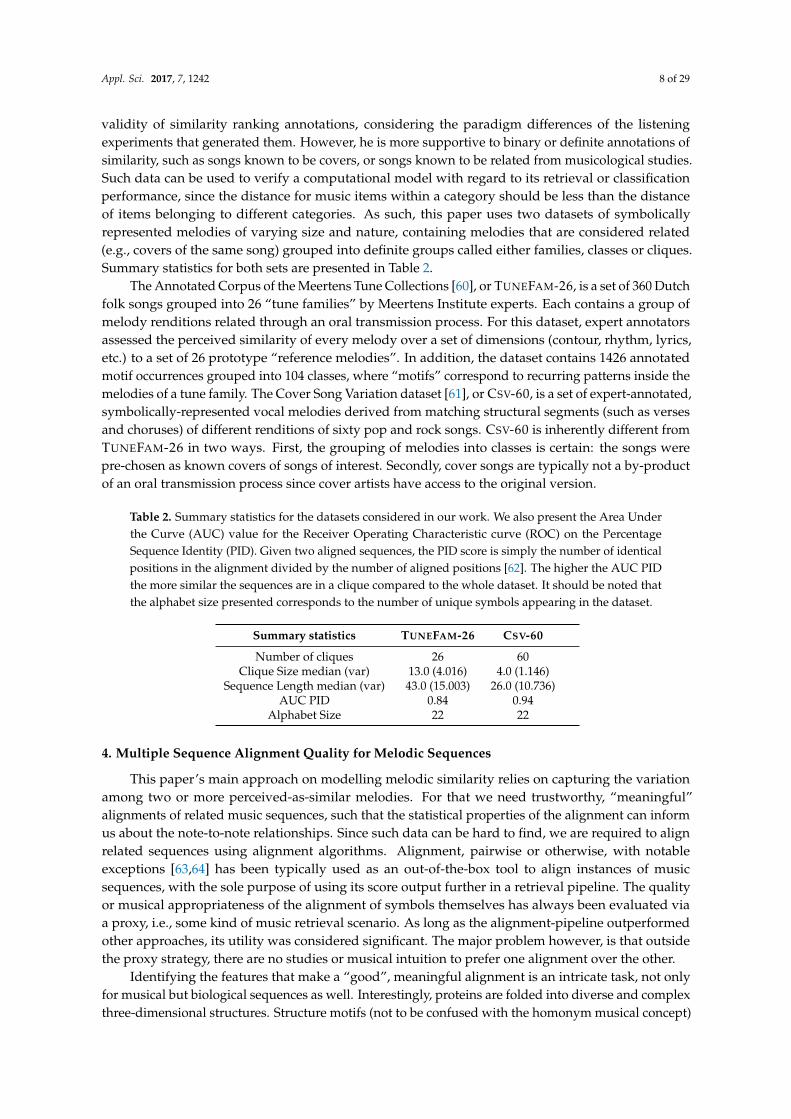
Table 2. Summary statistics for the datasets considered in our work. We also present the Area Underthe Curve (AUC) value for the Receiver Operating Characteristic curve (ROC) on the PercentageSequence Identity (PID). Given two aligned sequences, the PID score is simply the number of identicalpositions in the alignment divided by the number of aligned positions [62]. The higher the AUC PIDthe more similar the sequences are in a clique compared to the whole dataset. It should be noted thatthe alphabet size presented corresponds to the number of unique symbols appearing in the dataset.
Summary statistics TUNEFAM-26 CSV-60
Number of cliques 26 60Clique Size median (var) 13.0 (4.016) 4.0 (1.146)
Sequence Length median (var) 43.0 (15.003) 26.0 (10.736)AUC PID 0.84 0.94
Alphabet Size 22 22
4. Multiple Sequence Alignment Quality for Melodic Sequences
This paper’s main approach on modelling melodic similarity relies on capturing the variationamong two or more perceived-as-similar melodies. For that we need trustworthy, “meaningful”alignments of related music sequences, such that the statistical properties of the alignment can informus about the note-to-note relationships. Since such data can be hard to find, we are required to alignrelated sequences using alignment algorithms. Alignment, pairwise or otherwise, with notableexceptions [63,64] has been typically used as an out-of-the-box tool to align instances of musicsequences, with the sole purpose of using its score output further in a retrieval pipeline. The qualityor musical appropriateness of the alignment of symbols themselves has always been evaluated viaa proxy, i.e., some kind of music retrieval scenario. As long as the alignment-pipeline outperformedother approaches, its utility was considered significant. The major problem however, is that outsidethe proxy strategy, there are no studies or musical intuition to prefer one alignment over the other.
Identifying the features that make a “good”, meaningful alignment is an intricate task, not onlyfor musical but biological sequences as well. Interestingly, proteins are folded into diverse and complexthree-dimensional structures. Structure motifs (not to be confused with the homonym musical concept)
Appl. Sci. 2017, 7, 1242 9 of 29
diverge slower in the evolutionary time scale than sequences, and consequently homology detectionamong highly divergent sequences is easier in the structural than the sequence domain, though theactual algorithms for three-dimensional shape alignment are complex. As such, structure motifs havebeen used to aid the alignment of highly-divergent sequences [65]. In addition, reference alignmentsproduced from biological information, such as a conserved structure, have been frequently used toassess the quality of an MSA [66].
We argue that similar to biological sequences, a “good” meaningful alignment of musicalsignificance, can be only evaluated via a trustworthy reference alignment. Previous related work [67]generated “trustworthy” alignments of the CSV-60 set by using a progressive alignment algorithmextended on three musical dimensions (pitch, onset, duration). Bountouridis and Van Balen’s choicewas based largely on intuition, since there is no literature supporting those three dimensions. Prätzlichand Müller [64] investigated the evaluation of music alignment by using solely triplets of recordings ofthe same piece and made clear that there are theoretical considerations of alignment quality-assessmentwithout a reference alignment. Therefore, the question becomes whether there exists a musical analogyto the protein structure motifs.
In musicology shared, transformed but yet recognizable musical patterns are called “variations”and according to musicological and cognitive studies, variations are essential to the human perceptionof music similarity [2]. Specifically when it comes to classifying folk songs into tune families,i.e., groups of songs with a common ancestor, Cowdery [68] considers the shared patterns to be a keycriterion. An annotation study on Dutch folk songs by Volk and Van Kranenuburg [4] also supportedthis claim by proving that shared, stable musical patterns, called motifs were important for the expertassessment of music similarity. Consequently, we can theoretically use the motif alignment as referencefor evaluating the quality of musical sequence alignment. For example, consider the followingsequences with expert annotated motifs “AB” (red) and “AFF” (cyan): AFFGABBBBC, ABDDBBC andAFFABB. Two possible alignments with equal SOP scores are:
AFFGABB-BBC AFFGABB-BBC––––ABDDBBC A––––BDDBBCAFF-ABB–––– AFF-ABB––––
From a musicological perspective though, the first alignment is considered of higher quality,since it aligns perfectly those subsequences that are annotated as same-label motifs. It is of highimportance to investigate which MSA algorithms and settings are optimal with regard to motifalignment (for example, which algorithm would be more likely to generate the first alignmentrather than the second). The following paragraphs describe the appropriate experiments to answersuch question.
Our experiment pipeline comprises aligning a group of related sequences (that include motifs)using different motif-agnostic MSA strategies, and then comparing the resulting alignment of motifsto a reference optimal motif alignment. The comparison is not based on a distance function betweenthe alignments, but rather on assigning a score to both of them. Besides the different MSA strategies(to be discussed in Section 4.3), the pipeline requires the following: first, a motif alignment scoringfunction that is well-founded (see Section 4.1). Secondly, it requires a dataset of musical sequences thatcontain annotated motifs for each clique, combined with trustworthy alignments of these motifs thatwould act as a reference (see Section 4.2).
4.1. Motif Alignment Scoring
The only information available to compute a meaningful motif-based MSA score is the motifs’position in the sequence, length and notes they contain. Due to the lack of knowledge regarding whichpairs of pitches should be aligned together, the motif alignment scoring method cannot be foundedon the pitch dimension. We are confident for only one thing: the notes belonging to same-labelled
Appl. Sci. 2017, 7, 1242 10 of 29
motifs should be somehow aligned. As a consequence, we focus on an intuitive scoring function thatis maximized when same-labelled motifs are maximally overlapped. Given a function label(xi) thatreturns the motif label of the i-th note of a sequence X, the WSOP score (denoted motif-SOP) of an MSAis based on the following scoring function:
v(xm, ym) =
+1 if label(xm) = label(ym)
−1 if label(xm) 6= label(ym)
0 if label(xm) = ∅ or label(ym) = ∅(9)
In other words, we only penalize those alignments that align notes belonging to different motifs.Alignment between notes not belonging to any motif (label(xi) = ∅), and labelled notes are consideredneutral since no studies or intuition suggests otherwise. The particular scoring function would assignthe same motif-SOP score for both the following alignments, since only the alignment of motif labels(represented as colours) is taken into consideration:
AFFGABB-BBC -AFFGABB-BBC––––ABDDBBC –––––ABDDBBC-AFFABB–––– A-FF-ABB––––
4.2. Dataset and Reference Motif Alignments
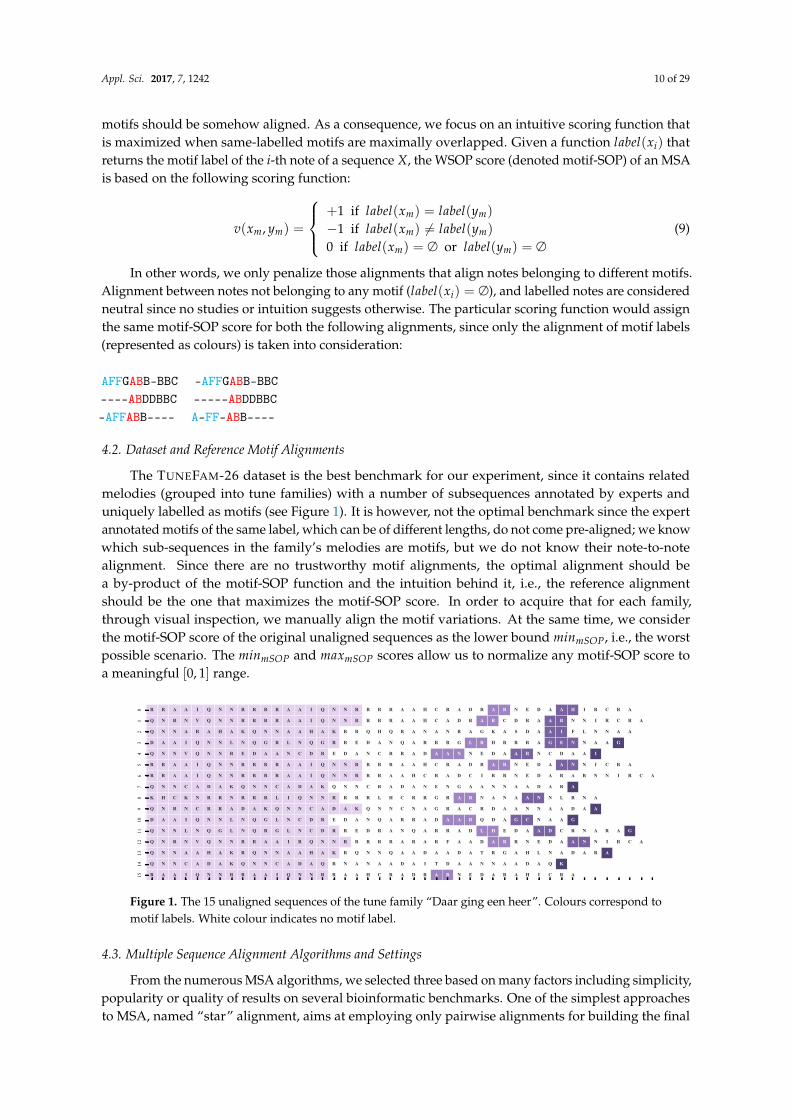
The TUNEFAM-26 dataset is the best benchmark for our experiment, since it contains relatedmelodies (grouped into tune families) with a number of subsequences annotated by experts anduniquely labelled as motifs (see Figure 1). It is however, not the optimal benchmark since the expertannotated motifs of the same label, which can be of different lengths, do not come pre-aligned; we knowwhich sub-sequences in the family’s melodies are motifs, but we do not know their note-to-notealignment. Since there are no trustworthy motif alignments, the optimal alignment should bea by-product of the motif-SOP function and the intuition behind it, i.e., the reference alignmentshould be the one that maximizes the motif-SOP score. In order to acquire that for each family,through visual inspection, we manually align the motif variations. At the same time, we considerthe motif-SOP score of the original unaligned sequences as the lower bound minmSOP, i.e., the worstpossible scenario. The minmSOP and maxmSOP scores allow us to normalize any motif-SOP score toa meaningful [0, 1] range.
0 1 2 3 4 5 6 7 8 9 10 11 12 13 14 15 16 17 18 19 20 21 22 23 24 25 26 27 28 29 30 31 32 33 34 35 36 37 38 39 40 41 42 43 44
01
23
45
67
89
1011
1213
1415
R R A A I Q N N R R R R A A I Q N N R R R R A A H C R A D R A R N E D A A H I R C R A
Q N R N V Q N N R R R R A A I Q N N R R R R A A H C A D R A R C D R A A R N N I R C R A
Q N N A R A H A K Q N N A A H A K R R Q H Q R A N A N R A G K A S D A A I F L N N A A
D A A I Q N N L N Q G R L N Q G R R E D A N Q A R R R G L R H R R R A G E N N A A G
Q N N V Q N N R E D A A N C D R E D A N C R R A D A A N N E D A A R N C D A A I
R R A A I Q N N R R R R A A I Q N N R R R R A A H C R A D R A R N E D A A N N I C R A
R R A A I Q N N R R R R A A I Q N N R R R A A H C R A D C I R R N E D A R A R N N I R C A
Q N N C A D A K Q N N C A D A K Q N N C R A D A N E N G A A N N A A D A R A
K H C K N R R N R R R L I Q N N R R R R L H C R R G R A R N A N A A N N L R N A
Q N R N C R R A D A K Q N N C A D A K Q N N C N A G R A C R D A A N N A A D A A
D A A I Q N N L N Q G L N C D R E D A N Q A R R A D A A R Q D A G C N A A G
Q N N L N Q G L N Q R G L N C D R R E D R A N Q A R R A D L H E D A A D C R N A R A G
Q N R N V Q N N R R A A I R Q N N R R R R R A R A R F A A D A R R N E D A A N N I R C A
Q N N A A H A K R Q N N A A H A K R Q N N Q A A D A A D A T R G A H L N A D A R A
Q N N C A D A K Q N N C A D A Q R N A N A A D A I T D A A N N A A D A Q K
R A A I Q N N R R A A I Q N N R R A A H C R A D R A R N E D A R A H I C R A
Figure 1. The 15 unaligned sequences of the tune family “Daar ging een heer”. Colours correspond tomotif labels. White colour indicates no motif label.
4.3. Multiple Sequence Alignment Algorithms and Settings
From the numerous MSA algorithms, we selected three based on many factors including simplicity,popularity or quality of results on several bioinformatic benchmarks. One of the simplest approachesto MSA, named “star” alignment, aims at employing only pairwise alignments for building the final
Appl. Sci. 2017, 7, 1242 11 of 29
MSA. The idea is to first find the most “central” among the sequences, pairwise align it to each one ofthe rest and then combine the pairwise alignments into a single MSA. This method does not necessarilyattempt to optimize the objective function (see Section 2.2) and as such is rarely used. In our case,star alignment can act as a naive baseline for the more sophisticated algorithms to be compared against.
Progressive Alignment (PA) [69] is one of the most popular and intuitive approaches, and itcomprises three fundamental steps. At first, all pairwise alignments between sequences are computedto determine the similarity between each pair. At the second step, a similarity tree (guide tree) isconstructed using a hierarchical clustering method, which in biological sequences is sometimes usedto attempt to identify evolutionary relationships between taxa. Finally, working from the leaves ofthe tree to the root, one aligns alignments, until reaching the root of the tree, where a single MSAis built. The drawback of PA, is that incorrect gaps (especially those at early stages) are retainedthroughout the process since the moment they are first inserted (the “once a gap, always a gap” rule).Iterative refinement methods [70,71] aim to tackle this problem by iteratively removing each sequenceand realigning it with a profile created from the MSA of the rest, until an objective function has beenmaximized. Our experiments use the PA-based T-COFFEE software (Tree-based consistency objectivefunction for alignment evaluation) [72]. T-COFFEE aims to tackle the problem by making better useof information in the early stages . It uses an objective function (called COFFEE [73]) that first buildsa library of all optimal pairwise alignments and secondly, scores a multiple sequence alignment bymeasuring its consistency with the library: how many of the aligned pairs in the MSA appear inthe library.
Locating very similar short and shared sub-regions between large sequences has been in importanttask in bioinformatics. Such segments can efficiently reduce MSA runtimes and as a consequence,MSA solutions that incorporate some of form of segmentation, such as DIALIGN[74] and MAFFT [75],have found successful application. MAFFT in particular, is a progressive alignment method at its core,but incorporates the Fast Fourier Transform (FFT) for biological sequences. In addition, MAFFT allowsthe usage of the iterative refinement method. For non-biological sequences, MAFFT offers a “text”alignment option that excludes biological and chemically-inspired heuristics from its pipeline. In sucha case, segmenting the sequences becomes a by-product of MAFFT’s objective function that incorporatesboth a WSOP and a COFFEE-like scoring. According to MAFFT’s website (mafft.cbrc.jp/alignment/software), “the use of the WSOP score has the merit that a pattern of gaps can be incorporated into theobjective function”.
MAFFT offers three different strategies for the initial pairwise alignment, that behave differentlywith regard to the structure of the sequences. Local alignment with affine gap costs localpair isappropriate for unaligned sequences centred around a conserved region. The genafpair strategyuses local alignment with generalized affine gap costs [76] and is appropriate for sequences withseveral conserved sub-sequences in long unalignable regions. Global alignment with affine gap costsglobalpair is appropriate for throughout alignable sequences. A lesser known option, which canbe applied on top of localpair and globalpair strategies, is allowshift which is appropriate forsequences that are largely similar but contaminated by small dissimilar regions.
Each MSA algorithm aims to find the alignment that maximizes the SOP score on the Identity(ID) scoring scheme, i.e., v(x, y) = +1 if x = y and v(x, y) = −1 if x 6= y. As a matrix, the ID schemehas +1 in the diagonal and −1 otherwise. The effect and importance of gap penalties, or gap settings(see Equation (3)), is well known for biological sequences [77] and for musical sequences as well [78].Understanding their behaviour with regard to the MSA is crucial, especially when different matricesare used. Since literature suggests setting them empirically [77] and the ID matrix is used on eachMSA algorithm in our case, we experiment with a only a small variety of gap settings. At the sametime, we keep in mind that there is no guarantee that these settings optimize the performance ofall MSA algorithms. Regarding T-COFFEE, such penalties are not essential when building the MSA,since in theory the penalties are estimated from the library of pairwise alignments. In practice, it issuggested to experiment with different settings while keeping in mind that the penalties are not related
Appl. Sci. 2017, 7, 1242 12 of 29
to the substitution matrix. Gap open can be in the range of [0,−5000] and gap extension in the rangeof [−1,−10].
4.4. Results
For each clique of sequences we generated a reference motif alignment manually, and computed itsmotif-SOP score (called Sre f ). At the same time, for each motif-agnostic configuration (MSA algorithm,gap settings), we aligned the melodic sequences. Each resulting alignment was also assigneda motif-SOP score (called Sauto). In order to identify the best MSA configuration with respect tomotif alignment, we compute its normalized motif-SOP score Sre f /Sauto.
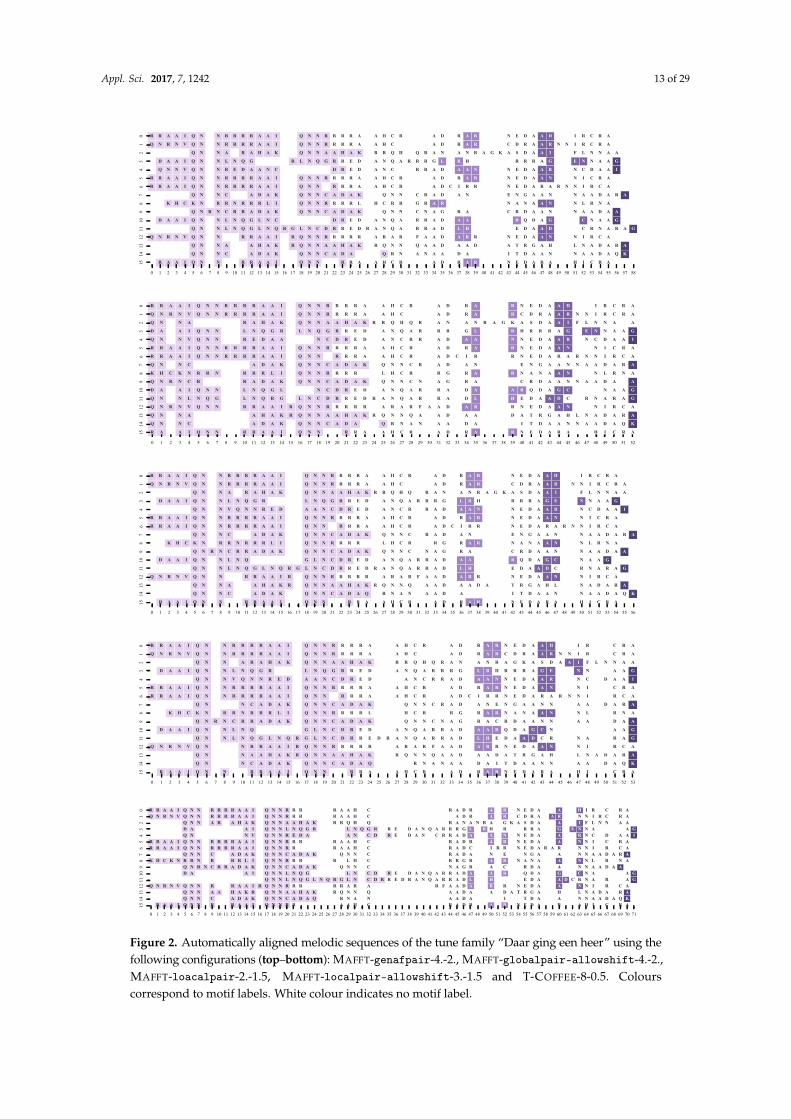
Before proceeding into the quantitative results, it is worth visually examining the alignmentscreated by the MSA algorithms. Figure 2 presents different alignments of the tune family“Daar_ging_een_heer_1” for a number of configurations. Regarding quantitative results, Figure 3 andTable 3 present the normalized motif-SOP score for different configurations. There are a number ofobservations that become immediately apparent: first, the normalized motif-SOP score can be less thanzero, since the original unaligned sequences, that act as the lower bound, may include correctly alignedmotifs by random chance (see Figure 1). Secondly as expected, star alignment is the worst performingalgorithm across all gap settings. Regarding the relative performance of the configurations themselves(excluding star alignment), a Friedman significance test showed that there was a statistically significantdifference in motif-SOP depending on the configuration with p = 0.041. However, post hoc analysiswith Wilcoxon signed-rank tests and Bonferroni correction, revealed that there were no significantdifferences among any pair of configurations.
Regarding the overall performance of the algorithms themselves, a Friedman significance testshowed that there was a statistically significant difference in normalized motif-SOP depending onthe algorithm with p < 10−6. Post hoc analysis with Wilcoxon signed-rank tests and a Bonferronicorrection resulted in a significance level set at p < 0.003. p values for all possible pairs are presentedin Table 4. It is clear that MAFFT, run with the globalpair strategy, outperforms T-COFFEE and thatof the three MAFFT strategies, globalpair performs the best. A Wilcoxon signed-rank test betweenall the MAFFT algorithms using and not using the allowshift option, revealed that the allowshiftoption does not have a significant impact on the results, p = 0.11.
Finally, regarding the gap settings, significance tests showed that for MAFFT and T-COFFEE
in general, there is a significant difference depending on the gap penalties used. For T-COFFEE inparticular, large gap settings such as (−60,−3) or (−40,−2) are not recommended. For MAFFT on theother hand, small gap penalties, such as (−0.8,−0.5) should be avoided. However it should be notedthat for each particular MAFFT strategy, gap settings have no significant effect.
Appl. Sci. 2017, 7, 1242 13 of 29
0 1 2 3 4 5 6 7 8 9 10 11 12 13 14 15 16 17 18 19 20 21 22 23 24 25 26 27 28 29 30 31 32 33 34 35 36 37 38 39 40 41 42 43 44 45 46 47 48 49 50 51 52 53 54 55 56 57 58
01
23
45
67
89
1011
1213
1415
R R A A I Q N N R R R R A A I Q N N R R R R A A H C R A D R A R N E D A A H I R C R A
Q N R N V Q N N R R R R A A I Q N N R R R R A A H C A D R A R C D R A A R N N I R C R A
Q N N A R A H A K Q N N A A H A K R R Q H Q R A N A N R A G K A S D A A I F L N N A A
D A A I Q N N L N Q G R L N Q G R R E D A N Q A R R R G L R H R R R A G E N N A A G
Q N N V Q N N R E D A A N C D R E D A N C R R A D A A N N E D A A R N C D A A I
R R A A I Q N N R R R R A A I Q N N R R R R A A H C R A D R A R N E D A A N N I C R A
R R A A I Q N N R R R R A A I Q N N R R R A A H C R A D C I R R N E D A R A R N N I R C A
Q N N C A D A K Q N N C A D A K Q N N C R A D A N E N G A A N N A A D A R A
K H C K N R R N R R R L I Q N N R R R R L H C R R G R A R N A N A A N N L R N A
Q N R N C R R A D A K Q N N C A D A K Q N N C N A G R A C R D A A N N A A D A A
D A A I Q N N L N Q G L N C D R E D A N Q A R R A D A A R Q D A G C N A A G
Q N N L N Q G L N Q R G L N C D R R E D R A N Q A R R A D L H E D A A D C R N A R A G
Q N R N V Q N N R R A A I R Q N N R R R R R A R A R F A A D A R R N E D A A N N I R C A
Q N N A A H A K R Q N N A A H A K R Q N N Q A A D A A D A T R G A H L N A D A R A
Q N N C A D A K Q N N C A D A Q R N A N A A D A I T D A A N N A A D A Q K
R A A I Q N N R R A A I Q N N R R A A H C R A D R A R N E D A R A H I C R A
0 1 2 3 4 5 6 7 8 9 10 11 12 13 14 15 16 17 18 19 20 21 22 23 24 25 26 27 28 29 30 31 32 33 34 35 36 37 38 39 40 41 42 43 44 45 46 47 48 49 50 51 52
01
23
45
67
89
1011
1213
1415
R R A A I Q N N R R R R A A I Q N N R R R R A A H C R A D R A R N E D A A H I R C R A
Q N R N V Q N N R R R R A A I Q N N R R R R A A H C A D R A R C D R A A R N N I R C R A
Q N N A R A H A K Q N N A A H A K R R Q H Q R A N A N R A G K A S D A A I F L N N A A
D A A I Q N N L N Q G R L N Q G R R E D A N Q A R R R G L R H R R R A G E N N A A G
Q N N V Q N N R E D A A N C D R E D A N C R R A D A A N N E D A A R N C D A A I
R R A A I Q N N R R R R A A I Q N N R R R R A A H C R A D R A R N E D A A N N I C R A
R R A A I Q N N R R R R A A I Q N N R R R A A H C R A D C I R R N E D A R A R N N I R C A
Q N N C A D A K Q N N C A D A K Q N N C R A D A N E N G A A N N A A D A R A
K H C K N R R N R R R L I Q N N R R R R L H C R R G R A R N A N A A N N L R N A
Q N R N C R R A D A K Q N N C A D A K Q N N C N A G R A C R D A A N N A A D A A
D A A I Q N N L N Q G L N C D R E D A N Q A R R A D A A R Q D A G C N A A G
Q N N L N Q G L N Q R G L N C D R R E D R A N Q A R R A D L H E D A A D C R N A R A G
Q N R N V Q N N R R A A I R Q N N R R R R R A R A R F A A D A R R N E D A A N N I R C A
Q N N A A H A K R Q N N A A H A K R Q N N Q A A D A A D A T R G A H L N A D A R A
Q N N C A D A K Q N N C A D A Q R N A N A A D A I T D A A N N A A D A Q K
R A A I Q N N R R A A I Q N N R R A A H C R A D R A R N E D A R A H I C R A
0 1 2 3 4 5 6 7 8 9 10 11 12 13 14 15 16 17 18 19 20 21 22 23 24 25 26 27 28 29 30 31 32 33 34 35 36 37 38 39 40 41 42 43 44 45 46 47 48 49 50 51 52 53 54 55 56
01
23
45
67
89
1011
1213
1415
R R A A I Q N N R R R R A A I Q N N R R R R A A H C R A D R A R N E D A A H I R C R A
Q N R N V Q N N R R R R A A I Q N N R R R R A A H C A D R A R C D R A A R N N I R C R A
Q N N A R A H A K Q N N A A H A K R R Q H Q R A N A N R A G K A S D A A I F L N N A A
D A A I Q N N L N Q G R L N Q G R R E D A N Q A R R R G L R H R R R A G E N N A A G
Q N N V Q N N R E D A A N C D R E D A N C R R A D A A N N E D A A R N C D A A I
R R A A I Q N N R R R R A A I Q N N R R R R A A H C R A D R A R N E D A A N N I C R A
R R A A I Q N N R R R R A A I Q N N R R R A A H C R A D C I R R N E D A R A R N N I R C A
Q N N C A D A K Q N N C A D A K Q N N C R A D A N E N G A A N N A A D A R A
K H C K N R R N R R R L I Q N N R R R R L H C R R G R A R N A N A A N N L R N A
Q N R N C R R A D A K Q N N C A D A K Q N N C N A G R A C R D A A N N A A D A A
D A A I Q N N L N Q G L N C D R E D A N Q A R R A D A A R Q D A G C N A A G
Q N N L N Q G L N Q R G L N C D R R E D R A N Q A R R A D L H E D A A D C R N A R A G
Q N R N V Q N N R R A A I R Q N N R R R R R A R A R F A A D A R R N E D A A N N I R C A
Q N N A A H A K R Q N N A A H A K R Q N N Q A A D A A D A T R G A H L N A D A R A
Q N N C A D A K Q N N C A D A Q R N A N A A D A I T D A A N N A A D A Q K
R A A I Q N N R R A A I Q N N R R A A H C R A D R A R N E D A R A H I C R A
0 1 2 3 4 5 6 7 8 9 10 11 12 13 14 15 16 17 18 19 20 21 22 23 24 25 26 27 28 29 30 31 32 33 34 35 36 37 38 39 40 41 42 43 44 45 46 47 48 49 50 51 52 53
01
23
45
67
89
1011
1213
1415
R R A A I Q N N R R R R A A I Q N N R R R R A A H C R A D R A R N E D A A H I R C R A
Q N R N V Q N N R R R R A A I Q N N R R R R A A H C A D R A R C D R A A R N N I R C R A
Q N N A R A H A K Q N N A A H A K R R Q H Q R A N A N R A G K A S D A A I F L N N A A
D A A I Q N N L N Q G R L N Q G R R E D A N Q A R R R G L R H R R R A G E N N A A G
Q N N V Q N N R E D A A N C D R E D A N C R R A D A A N N E D A A R N C D A A I
R R A A I Q N N R R R R A A I Q N N R R R R A A H C R A D R A R N E D A A N N I C R A
R R A A I Q N N R R R R A A I Q N N R R R A A H C R A D C I R R N E D A R A R N N I R C A
Q N N C A D A K Q N N C A D A K Q N N C R A D A N E N G A A N N A A D A R A
K H C K N R R N R R R L I Q N N R R R R L H C R R G R A R N A N A A N N L R N A
Q N R N C R R A D A K Q N N C A D A K Q N N C N A G R A C R D A A N N A A D A A
D A A I Q N N L N Q G L N C D R E D A N Q A R R A D A A R Q D A G C N A A G
Q N N L N Q G L N Q R G L N C D R R E D R A N Q A R R A D L H E D A A D C R N A R A G
Q N R N V Q N N R R A A I R Q N N R R R R R A R A R F A A D A R R N E D A A N N I R C A
Q N N A A H A K R Q N N A A H A K R Q N N Q A A D A A D A T R G A H L N A D A R A
Q N N C A D A K Q N N C A D A Q R N A N A A D A I T D A A N N A A D A Q K
R A A I Q N N R R A A I Q N N R R A A H C R A D R A R N E D A R A H I C R A
0 1 2 3 4 5 6 7 8 9 10 11 12 13 14 15 16 17 18 19 20 21 22 23 24 25 26 27 28 29 30 31 32 33 34 35 36 37 38 39 40 41 42 43 44 45 46 47 48 49 50 51 52 53 54 55 56 57 58 59 60 61 62 63 64 65 66 67 68 69 70 71
01
23
45
67
89
1011
1213
1415
R R A A I Q N N R R R R A A I Q N N R R R R A A H C R A D R A R N E D A A H I R C R AQ N R N V Q N N R R R R A A I Q N N R R R R A A H C A D R A R C D R A A R N N I R C R A
Q N N A R A H A K Q N N A A H A K R R Q H Q R A N A N R A G K A S D A A I F L N N A AD A A I Q N N L N Q G R L N Q G R R E D A N Q A R R R G L R H R R R A G E N N A A GQ N N V Q N N R E D A A N C D R E D A N C R R A D A A N N E D A A R N C D A A I
R R A A I Q N N R R R R A A I Q N N R R R R A A H C R A D R A R N E D A A N N I C R AR R A A I Q N N R R R R A A I Q N N R R R A A H C R A D C I R R N E D A R A R N N I R C A
Q N N C A D A K Q N N C A D A K Q N N C R A D A N E N G A A N N A A D A R AK H C K N R R N R R R L I Q N N R R R R L H C R R G R A R N A N A A N N L R N A
Q N R N C R R A D A K Q N N C A D A K Q N N C N A G R A C R D A A N N A A D A AD A A I Q N N L N Q G L N C D R E D A N Q A R R A D A A R Q D A G C N A A G
Q N N L N Q G L N Q R G L N C D R R E D R A N Q A R R A D L H E D A A D C R N A R A GQ N R N V Q N N R R A A I R Q N N R R R R R A R A R F A A D A R R N E D A A N N I R C A
Q N N A A H A K R Q N N A A H A K R Q N N Q A A D A A D A T R G A H L N A D A R AQ N N C A D A K Q N N C A D A Q R N A N A A D A I T D A A N N A A D A Q K
R A A I Q N N R R A A I Q N N R R A A H C R A D R A R N E D A R A H I C R A
Figure 2. Automatically aligned melodic sequences of the tune family “Daar ging een heer” using thefollowing configurations (top–bottom): MAFFT-genafpair-4.-2., MAFFT-globalpair-allowshift-4.-2.,MAFFT-loacalpair-2.-1.5, MAFFT-localpair-allowshift-3.-1.5 and T-COFFEE-8-0.5. Colourscorrespond to motif labels. White colour indicates no motif label.

Appl. Sci. 2017, 7, 1242 14 of 29
0.8-0.5 1-0.5 2-1.0 2-1.5 3-1.5 4-2 6-3Gap Settings
0.4
0.2
0.0
0.2
0.4
0.6
0.8
1.0N
orm
alis
ed m
otif
Sum
-of-
Pairs
Sco
re
T-CoffeeMAFFT-localMAFFT-local-allowshiftMAFFT-globalMAFFT-global-allowshiftMAFFT-genafStar
Figure 3. Normalized motif-Sum-Of-Pairs (SOP) score (y-axis) for different gap settings (x-axis) andMultiple Sequence Alignment (MSA) algorithms.
Table 3. Median (standard deviation) normalized motif-SOP scores for different MSA algorithms andgap settings. For T-COFFEE, the gap open values are multiplied by 10.
Algorithm 0.8–0.5 1–0.5 2–1.0 2–1.5 3–1.5 4–2 6–3
MAFFT-genaf 0.57 (0.95) 0.61 (0.83) 0.71 (0.68) 0.71 (0.68) 0.70 (0.61) 0.76 (0.53) 0.75 (0.80)MAFFT-global 0.72 (0.60) 0.78 (0.60) 0.77 (0.49) 0.77 (0.48) 0.75 (0.50) 0.75 (0.41) 0.76 (0.25)
MAFFT-global-allowshift 0.76 (0.83) 0.75 (0.70) 0.78 (0.49) 0.78 (0.47) 0.76 (0.46) 0.82 (0.40) 0.76 (0.26)MAFFT-local 0.72 (0.58) 0.71 (0.57) 0.75 (0.50) 0.78 (0.45) 0.73 (0.46) 0.76 (0.38) 0.71 (0.24)
MAFFT-local-allowshift 0.69 (0.68) 0.67 (0.72) 0.78 (0.60) 0.77 (0.45) 0.79 (0.45) 0.77 (0.35) 0.77 (0.29)T-COFFEE 0.65 (0.72) 0.65 (0.72) 0.62 (0.78) 0.62 (0.78) 0.63 (0.80) 0.58 (0.95) 0.58 (1.04)
Star 0.00 (0.49) 0.00 (0.48) 0.04 (0.33) 0.08 (0.37) 0.13 (0.37) 0.12 (0.29) 0.12 (0.24)
Table 4. p values of the Wilcoxon signed-rank tests for pairs of algorithms with regard to the normalizedmotif-SOP score. “-a” indicates the allowshift option. p-values larger than 0.05 are not presented.
Algorithm MAFFT-genaf MAFFT-global MAFFT-global-a MAFFT-local MAFFT-local-a
MAFFT-global < 10−6
MAFFT-global-a < 10−5
MAFFT-localMAFFT-local-a < 10−3
T-COFFEE < 10−4 < 10−4
4.5. Discussion
In this section, we first established a measure of MSA quality based on motifs. Secondly,we evaluated different MSA algorithms and gap settings on a dataset of folk song melodies. Despite thesmall dataset of 26 tune families, the results offer strong proof about the benefits of the MSA algorithms,and MAFFT in particular. Regarding MAFFT’s success, we hypothesize that it can be attributed to itsobjective function that results to gap-free segments. According to Margulis [79], the phrase structure ofa melody is of major importance for the human perception of variation patterns. By treating the locatedsub-regions as gap-free segments, MAFFT can be the closest to partitioning melodies into perceptuallymeaningful units without using heuristics or expert knowledge.
In general, by establishing a reliable strategy to align multiple instances of melodies, we eliminatethe prerequisite to invent a retrieval/classification proxy to assess the quality of an alignment.We can also now benefit from both the alignment score and the alignment’s structure itself.Particularly regarding the latter, since the alignment of notes is musically significant, we can now
Appl. Sci. 2017, 7, 1242 15 of 29
extract knowledge about their relationships. For example, we can perform reliable analysis on notionssuch as stability (as we do in the following Section 5) or generate models of similarity (as we do inSection 6).
5. Analysis of Melodic Stability
It has been theorized that our perception and memorization of melodies is dynamic, meaningthat certain musical events throughout a melody’s length, can be perceived as more stable (resistant tochange) than others depending on the context [80]. Klusen et al. [81] showed that every note ina melody can be altered in an oral transmission scenario, but some notes are more stable than others.Numerous studies from cognition [80,82,83] to corpus-based analysis points-of-view [84], have alsoevaluated the importance of certain musical factors with regard to their influence on the perceivedmusic stability. Since the alteration of stable elements can affect the process of recognition, stability isalso a key component for understanding music similarity. Unsurprisingly, stability and music variation(stability’s counterpart ) have been at the core of both musicology and MIR. From a musicologicalperspective, knowledge of the mechanics of those concepts would allow researchers to trace, classify orpossibly even pinpoint in time variations of songs. Similarly, scientists from computational disciplinesmay use knowledge of stable musical elements to improve the automatic classification and retrieval ofmusical objects, such as the work of Van Balen et al. [85]. Therefore, before proceeding into modellingmusic similarity (see Section 6), it is worth investigating the complementary concept of music stability.
Interestingly, conservation is at the centre of biological sequence analysis, in the same way thatstability is at the core of musicology or MIR. As Valdar [23] nicely describes, a multiple sequencealignment of protein homologue sequences (together with the phylogeny) is a historical record thattells a story about the evolutionary processes applied and how they shaped a protein through time.Useful and important regions of a protein sequence often appear as “conserved” columns in the MSA,and major sequence events that appear on a phylogenetic tree often correspond to epochal moments innatural history.
In this section we argue that, much as an MSA of protein homologues can inform us about thestatistical properties of the evolutionary processes, an MSA of related melodies can provide us withvaluable information regarding the processes of musical variation. We aim to determine and analyseregions of less variation inside a selection of related melodies, or in other words, regions of melodicstability. Analysing stability requires trustworthy MSAs such that the assignment of correspondingnotes across different versions can be directly observed by looking at the MSA’s columns. The findingsof Section 4 allows us to be confident regarding the results of a stability analysis since it can beconducted on high-quality, musically meaningful alignments.
5.1. Setup
We are interested in applying the best alignment configuration (as established on Section 4) tothe TUNEFAM-26 and CSV-60 melodic datasets. We can later perform an analysis on the alignedcliques (tune families or cover song melodies) by using an appropriate measure of stability appliedon each column of the MSA. The results from Section 4 have indicated that the best MSA algorithmfor melodic sequences is MAFFT, while its globalpair and localpair strategies are indistinguishablein terms of alignment quality. Gap settings have little or no effect per strategy, MAFFT options andgap penalties had minimal effect on alignment quality, so we explored several parameterizations:MAFFT-globalpair with (−4,−2) gap penalties, MAFFT-globalpair-allowshift with (−4,−2) gappenalties and MAFFT-localpair-allowshift with (−2,−1) gap penalties.
A quantitative measure of stability, suitable for music sequences, does not exist as a result ofthe lack of supporting literature and research. Nevertheless, Bountouridis and Van Balen [67] usea probabilistic interpretation of the WSOP measure that aims to answer the following question: giventhat we observe a single, randomly chosen melodic element, what is the probability for this element toappear unchanged when we observe a new, unseen a variation of it. In practice, given a set of k aligned
Appl. Sci. 2017, 7, 1242 16 of 29
sequences of length m such as Si : si,1, , si,2, ..., si,m, the stability of the non-gap symbol e in position j isdefined as:
stab(e, j) =∑k
i=1 |si,j = e| − 1k− 1
(10)
while the stability of the j-th MSA column is simply PSj = ∑ stab(e, j) over all unique e.It is worth examining the related bioinformatics literature regarding the equivalent concept of
conservation scores. Valdar [23] mentions that “there is no rigorous mathematical test for judginga conservation measure”. A scoring method can be only judged with respect to biochemical intuition,and therefore a number of conservation scores have been proposed through the years [22]. The sameauthors list a number of intuitive prerequisites that a conservation score should fulfil, includingsequence weighting (to avoid bias due to near-duplicate sequences) or the consideration of prior aminoacid frequencies. However, applying the same prerequisites to music sequences is not supported by anymusical literature. Consequently, our analysis adopts two widely used and interpretable conservationscores from bioinformatics: the WSOP score (already discussed thoroughly) and Information Content(IC). Based on Shannon’s entropy, the IC score of the j-th column is defined as such:
ICj =Na
∑i=1
Pe,jlog(Pe,j
Qe) (11)
where Na is alphabet size, Pe,j is the frequency of a particular symbol e in the j-th column, while Qe isthe expected frequency of symbol e in the dataset (prior). It should be noted that symbols in a columnwith zero frequency are not taken into account.
5.2. Analysis
The next paragraphs present a brief analysis on stability and variation with regard to two musicdimensions, position and pitch intervals. However, it is possible to extend the analysis to dimensionssuch as note durations [67] or interval n-grams. Janssen et al. [84] on their corpus-based analysis onthe TUNEFAM-26 dataset, investigated stability with regard to global features related to memorability,i.e., a phrase length, its position in the melody, its repetitiveness and others.
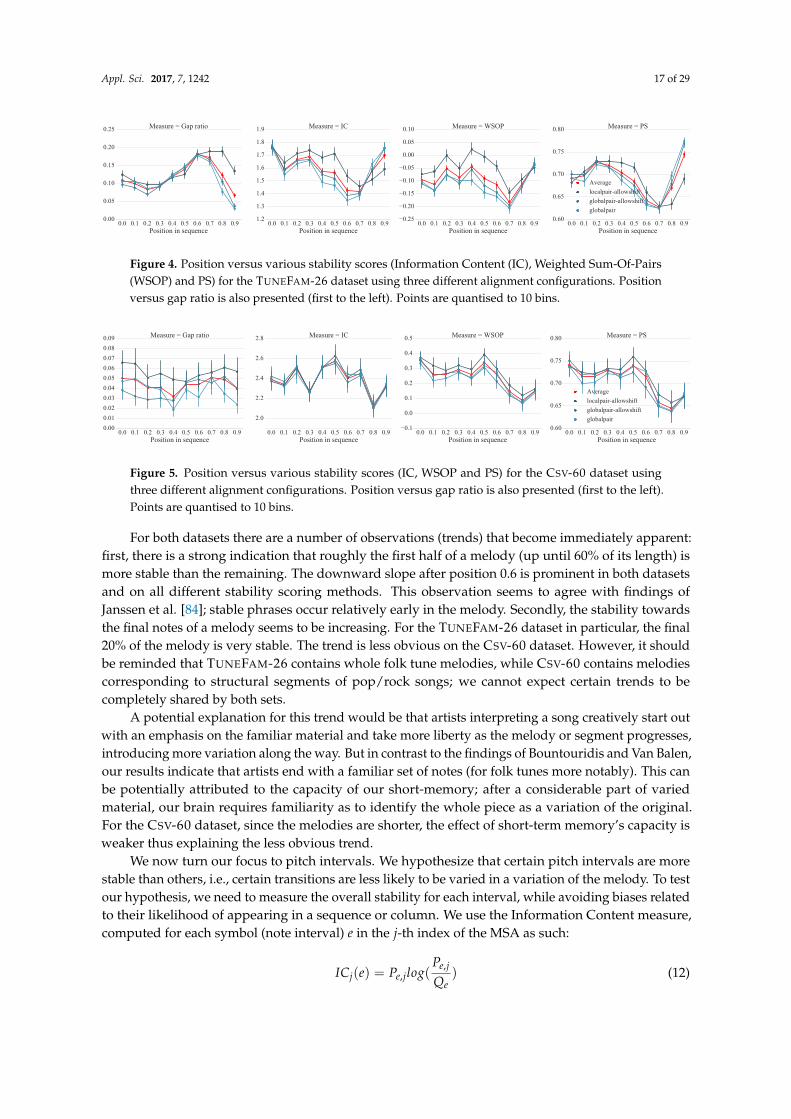
We hypothesize that certain parts of a melody, such as the beginning or end, are more robust tovariations. We are therefore interested in the stability with regard to a note’s relative position in themelody. Each column j of an MSA has a computed stability score. Each i-th index of a sequence inthe MSA is assigned the stability score of its corresponding column. It should be noted that due togaps, the i-th index of two different sequences may not correspond to the same j column. For eachdataset (TUNEFAM-26 and CSV-60) we accumulate all the position versus stability data, where positioncorresponds the i-th index normalized to the [0, 1] range. Figures 4 and 5 present the stability scoresusing different scoring methods (computed over three different alignment configurations) versus therelative position of a note (interval in our case) for the TUNEFAM-26 and CSV-60 datasets respectively.The corresponding gap ratio of the MSA versus the note position is also presented as a reference,since all conservation scores are affected by the amount of gaps per column.
Appl. Sci. 2017, 7, 1242 17 of 29
0.0 0.1 0.2 0.3 0.4 0.5 0.6 0.7 0.8 0.9Position in sequence
0.00
0.05
0.10
0.15
0.20
0.25
Val
ue
Measure = Gap ratio
0.0 0.1 0.2 0.3 0.4 0.5 0.6 0.7 0.8 0.9Position in sequence
1.2
1.3
1.4
1.5
1.6
1.7
1.8
1.9 Measure = IC
0.0 0.1 0.2 0.3 0.4 0.5 0.6 0.7 0.8 0.9Position in sequence
0.25
0.20
0.15
0.10
0.05
0.00
0.05
0.10 Measure = WSOP
0.0 0.1 0.2 0.3 0.4 0.5 0.6 0.7 0.8 0.9Position in sequence
0.60
0.65
0.70
0.75
0.80 Measure = PS
Averagelocalpair-allowshiftglobalpair-allowshiftglobalpair
Figure 4. Position versus various stability scores (Information Content (IC), Weighted Sum-Of-Pairs(WSOP) and PS) for the TUNEFAM-26 dataset using three different alignment configurations. Positionversus gap ratio is also presented (first to the left). Points are quantised to 10 bins.
0.0 0.1 0.2 0.3 0.4 0.5 0.6 0.7 0.8 0.9Position in sequence
0.000.010.020.030.040.050.060.070.080.09
Val
ue
Measure = Gap ratio
0.0 0.1 0.2 0.3 0.4 0.5 0.6 0.7 0.8 0.9Position in sequence
2.0
2.2
2.4
2.6
2.8 Measure = IC
0.0 0.1 0.2 0.3 0.4 0.5 0.6 0.7 0.8 0.9Position in sequence
0.1
0.0
0.1
0.2
0.3
0.4
0.5 Measure = WSOP
0.0 0.1 0.2 0.3 0.4 0.5 0.6 0.7 0.8 0.9Position in sequence
0.60
0.65
0.70
0.75
0.80 Measure = PS
Averagelocalpair-allowshiftglobalpair-allowshiftglobalpair
Figure 5. Position versus various stability scores (IC, WSOP and PS) for the CSV-60 dataset usingthree different alignment configurations. Position versus gap ratio is also presented (first to the left).Points are quantised to 10 bins.
For both datasets there are a number of observations (trends) that become immediately apparent:first, there is a strong indication that roughly the first half of a melody (up until 60% of its length) ismore stable than the remaining. The downward slope after position 0.6 is prominent in both datasetsand on all different stability scoring methods. This observation seems to agree with findings ofJanssen et al. [84]; stable phrases occur relatively early in the melody. Secondly, the stability towardsthe final notes of a melody seems to be increasing. For the TUNEFAM-26 dataset in particular, the final20% of the melody is very stable. The trend is less obvious on the CSV-60 dataset. However, it shouldbe reminded that TUNEFAM-26 contains whole folk tune melodies, while CSV-60 contains melodiescorresponding to structural segments of pop/rock songs; we cannot expect certain trends to becompletely shared by both sets.
A potential explanation for this trend would be that artists interpreting a song creatively start outwith an emphasis on the familiar material and take more liberty as the melody or segment progresses,introducing more variation along the way. But in contrast to the findings of Bountouridis and Van Balen,our results indicate that artists end with a familiar set of notes (for folk tunes more notably). This canbe potentially attributed to the capacity of our short-memory; after a considerable part of variedmaterial, our brain requires familiarity as to identify the whole piece as a variation of the original.For the CSV-60 dataset, since the melodies are shorter, the effect of short-term memory’s capacity isweaker thus explaining the less obvious trend.
We now turn our focus to pitch intervals. We hypothesize that certain pitch intervals are morestable than others, i.e., certain transitions are less likely to be varied in a variation of the melody. To testour hypothesis, we need to measure the overall stability for each interval, while avoiding biases relatedto their likelihood of appearing in a sequence or column. We use the Information Content measure,computed for each symbol (note interval) e in the j-th index of the MSA as such:
ICj(e) = Pe,jlog(Pe,j
Qe) (12)
Appl. Sci. 2017, 7, 1242 18 of 29
where Pe,j is the frequency of a particular symbol e in the jth column, while Qe is the expected frequencyof symbol e (prior).
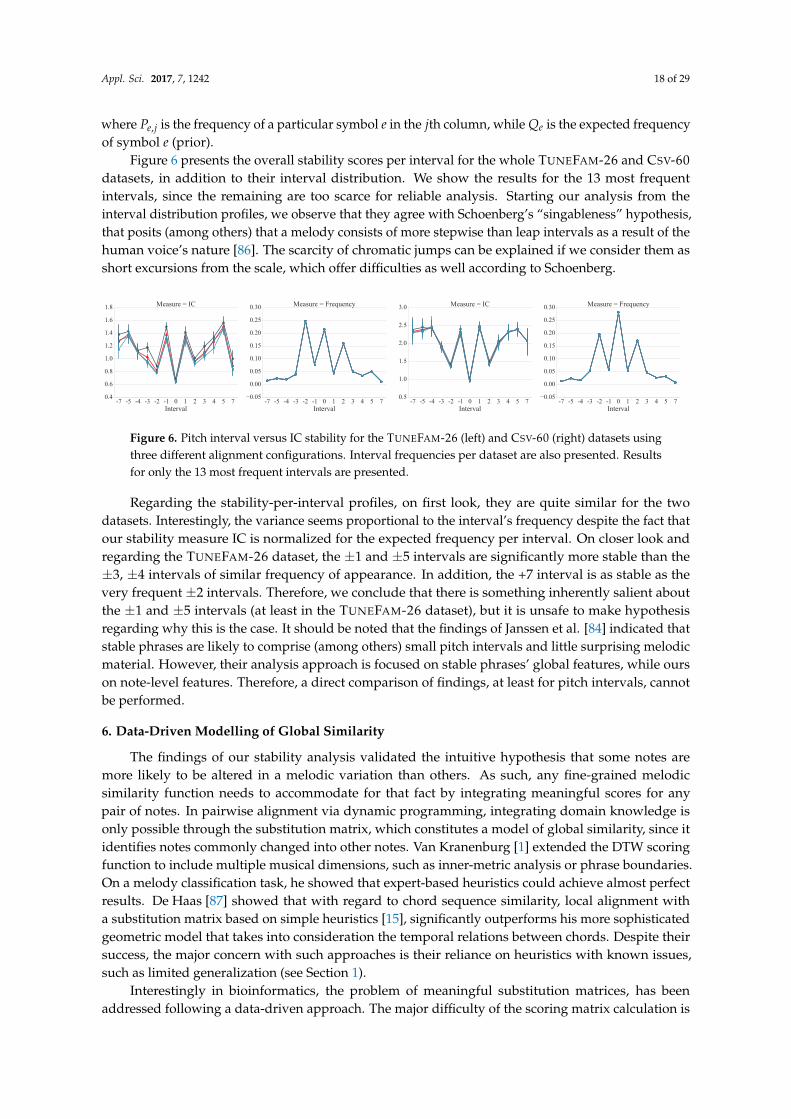
Figure 6 presents the overall stability scores per interval for the whole TUNEFAM-26 and CSV-60datasets, in addition to their interval distribution. We show the results for the 13 most frequentintervals, since the remaining are too scarce for reliable analysis. Starting our analysis from theinterval distribution profiles, we observe that they agree with Schoenberg’s “singableness” hypothesis,that posits (among others) that a melody consists of more stepwise than leap intervals as a result of thehuman voice’s nature [86]. The scarcity of chromatic jumps can be explained if we consider them asshort excursions from the scale, which offer difficulties as well according to Schoenberg.
-7 -5 -4 -3 -2 -1 0 1 2 3 4 5 7Interval
0.4
0.6
0.8
1.0
1.2
1.4
1.6
1.8
Val
ue
Measure = IC
-7 -5 -4 -3 -2 -1 0 1 2 3 4 5 7Interval
0.05
0.00
0.05
0.10
0.15
0.20
0.25
0.30 Measure = Frequency
-7 -5 -4 -3 -2 -1 0 1 2 3 4 5 7Interval
0.5
1.0
1.5
2.0
2.5
3.0
Val
ue
Measure = IC
-7 -5 -4 -3 -2 -1 0 1 2 3 4 5 7Interval
0.05
0.00
0.05
0.10
0.15
0.20
0.25
0.30 Measure = Frequency
Figure 6. Pitch interval versus IC stability for the TUNEFAM-26 (left) and CSV-60 (right) datasets usingthree different alignment configurations. Interval frequencies per dataset are also presented. Resultsfor only the 13 most frequent intervals are presented.
Regarding the stability-per-interval profiles, on first look, they are quite similar for the twodatasets. Interestingly, the variance seems proportional to the interval’s frequency despite the fact thatour stability measure IC is normalized for the expected frequency per interval. On closer look andregarding the TUNEFAM-26 dataset, the ±1 and ±5 intervals are significantly more stable than the±3, ±4 intervals of similar frequency of appearance. In addition, the +7 interval is as stable as thevery frequent ±2 intervals. Therefore, we conclude that there is something inherently salient aboutthe ±1 and ±5 intervals (at least in the TUNEFAM-26 dataset), but it is unsafe to make hypothesisregarding why this is the case. It should be noted that the findings of Janssen et al. [84] indicated thatstable phrases are likely to comprise (among others) small pitch intervals and little surprising melodicmaterial. However, their analysis approach is focused on stable phrases’ global features, while ourson note-level features. Therefore, a direct comparison of findings, at least for pitch intervals, cannotbe performed.
6. Data-Driven Modelling of Global Similarity
The findings of our stability analysis validated the intuitive hypothesis that some notes aremore likely to be altered in a melodic variation than others. As such, any fine-grained melodicsimilarity function needs to accommodate for that fact by integrating meaningful scores for anypair of notes. In pairwise alignment via dynamic programming, integrating domain knowledge isonly possible through the substitution matrix, which constitutes a model of global similarity, since itidentifies notes commonly changed into other notes. Van Kranenburg [1] extended the DTW scoringfunction to include multiple musical dimensions, such as inner-metric analysis or phrase boundaries.On a melody classification task, he showed that expert-based heuristics could achieve almost perfectresults. De Haas [87] showed that with regard to chord sequence similarity, local alignment witha substitution matrix based on simple heuristics [15], significantly outperforms his more sophisticatedgeometric model that takes into consideration the temporal relations between chords. Despite theirsuccess, the major concern with such approaches is their reliance on heuristics with known issues,such as limited generalization (see Section 1).
Interestingly in bioinformatics, the problem of meaningful substitution matrices, has beenaddressed following a data-driven approach. The major difficulty of the scoring matrix calculation is
Appl. Sci. 2017, 7, 1242 19 of 29
the computation of the joint probability pxiyi (see Equation 7) that expresses the likelihood of the twosymbols at homologous sites. In bioinformatics, the key idea for solving this problem is that trustedalignments of related sequences can provide information regarding the mutability of symbols. One ofthe most widely-used matrices for protein comparison, BLOSUM [88], is actually derived from a largenumber of manually constructed, expert-aligned amino-acid sequences by counting how often certainamino-acids are substituted (mutated).
It follows naturally to investigate the potential of data-driven approaches in the MIR domain aswell. Hirjee and Brown [89,90] generated a data-driven phoneme substitution matrix from misheardlyrics, gathered from online sources, and successfully applied it on a lyrics retrieval task. Similarly,Bountouridis et al. [27] used online sources to generate a chord similarity matrix for the task of coversong detection. Hu et al. [13] on the other hand, based their approach on pairs of aligned sung andreference melodies for the task of query-by-humming, but failed to significantly outperform a simpleheuristic matrix. This might be attributed to the lack of experimentation with gap penalties or thenoisy frame-based instead of note-based representation. Another major drawback for them was theamount of data, which consisted of only 40 sung melodies. We argue that expert-based alignments aregenerally problematic due to their limited quantity. Online sources have been shown to be potentialsolutions for lyrics or chords, but their existence cannot be guaranteed for all possible musical itemssuch as melodies.
To eliminate the need for trustworthy pre-aligned melodic variations, in this section we proposethe usage of trusted alignment algorithms as discussed in Section 4. Alignments generated by suchalgorithms can provide us with the appropriate information to generate a substitution matrix bycomputing log odds ratios for any pairs of symbols. While trusted alignment algorithms reducethe need for expert or crowd-sourced alignments, they still require melodies grouped (by expertspreferably) into related cliques or tune families. These are still hard to find and as such, the applicabilityof our approach in real-life scenarios can be limited. Interestingly, in the same way that melody cliquescontain melodic variants, melodies themselves may contain short recurring fragments, intra-songmotifs. Such motifs may appear in variations throughout the melody. It is therefore also possibleto generate a model of similarity among intra-song motifs if properly aligned. We hypothesize thatintra-song motivic similarity can approximate the melodic similarity, or in other words, independentmelodies contain enough information to explain variations in melodic cliques.
In the following paragraphs we present two data-driven approaches for capturing global similarityrealized as substitution matrices for the TUNEFAM-26 and CSV-60 datasets. First, a matrix generated byalignments of melodic variations belonging to a clique (denoted simply melodic similarity). Secondly,matrices generated from different alignments of individual melodies with themselves (denotedintra-song motivic similarity). In order to assess their quality, we later perform an experiment toevaluate their retrieval performance.
6.1. Generating Substitution Matrices
Before discussing the alignments used, we explain the general process of converting theminto a scoring system (a substitution matrix). The SubsMat package from the bioinformatics libraryBiopython provides routines for creating the typical log-odds substitution matrices. For our data,we firstly create the Accepted Replacement Matrix (ARM), meaning the counted number ofreplacements (confusions) according to the alignments. In order to avoid matrix entries of valuezero, we apply pseudo-counts, meaning we add one to each entry. We generate the log-odds matrixM by applying a function that builds the observed frequency matrix from the ARM. We use thedefault settings: log base b = 10 and a multiplication factor f of 10. For two symbols x and y,their corresponding log-odds score is:
M(x, y) = logb
( pxy
qxqy
)× f (13)
Appl. Sci. 2017, 7, 1242 20 of 29
with M(x, y) rounded to the nearest integer. We normalize the matrix by dividing each of its elementswith max(M(x, y)), so that the maximum score assigned to a pair of symbols is one.
6.2. Computing the Alignments for Melodic and Intra-Song Motivic Similarity
For the modelling of melodic similarity, the results from Section 4 have indicated that, althoughMAFFT is the best alignment strategy, the differences between various configurations are ratherinsignificant. Therefore, instead of generating a substitution matrix from clique alignments of oneconfiguration only, we decided to use the following: MAFFT-globalpair with (−4,−2) gap penalties,MAFFT-globalpair-allowshiftwith (−4,−2) gap penalties and MAFFT-localpair-allowshiftwith(−2,−1) gap penalties. The melodic similarity matrices generated for the TUNEFAM-26 and CSV-60datasets are denoted TFAM-matrix and CSV-matrix respectively.
For the modelling of intra-song motivic similarity, the idea is to align each sequence withartificial versions of itself, such that all possible instances of intra-song motifs are aligned. In sucha context, a useful and informative version of a sequence is one that when aligned to the original,maximizes the overlap between different instances of perceived-as-similar motifs. This informativenesscriterion partially agrees with Hertz’s and Stormo’s definition of interesting alignments: those whosesymbol frequencies most differ from the a priori probabilities of the symbols [91]. However,since informativeness can be erroneously biased, we are interested in alignments that at the same timeminimize the overlap between perceptually different motifs.
Let us consider an example sequence So with two known motif instances “ABF” (cyan),“AGG” (green) of label L1 and one motif instance “KLM” (red) of label L2: XXABFXXXAGGXXXKLM.Furthermore, consider three versions of the So sequence based on arbitrary splitting in segments andfurther duplication or shuffling: KLXXXXABFXXXAGGXF, XAGGXXABFXAGGX and AGGXXKLMXXXABFXXX.Three possible pairwise alignments of the versions with the original are:
–––-XXABFXXXAGGXXXKLM XXABFXXXAGGXXXKLM– XXABFXXX–––––AGGXXXKLMLMXXXXABFXXXAGG––XK–– X–AGGXX–ABFX––AGGX ––AGGXXXKLMXXABFXXX–––
The first example contains alignment of same-label motif instances with themselves (e.g., ABFto ABF), which provide no new information regarding their variation and therefore is of no value.The second alignment matches different instances of same-label motifs (e.g., ABF to AGG) but incorrectlyaligns different-label motifs (e.g., AGG to KLM). It is only the third case that satisfies our criteria of auseful version of a sequence.
In order to identify the method that can be better used in practice to align any intra-songmotifs (where the actual motifs are unknown), we design a simple experiment: we select all singlesequences from the TUNEFAM-26 dataset that contain annotated motifs with two instances and devisethree version-creation methods based on intuition. We then pairwise-align each original sequence toits different versions using different configurations of motif-agnostic alignment algorithms. In ourexperiment, the usefulness criteria are formulated as such: we are given the set L of all motif labelsin a sequence S and Mk = {mk
1, mk2, ..., mk
j }, the set of all instances of intra-song motifs of label k ∈ L.We are interested in generating and pairwise-aligning different sequence versions with S, such thataverage relative likelihood RM that the different instances ∈ Mk, ∀ k are aligned as opposed to bealigned by chance, is greater than one and maximal:
rkM = ∑
i,j j 6=i
pmki mk
j
qmkiqmk
j
RM =1L ∑
k∈Lrk
M (14)
At the same time the average relative likelihood RNM that any instances of different-labels motifsare aligned as opposed to be aligned by chance should be less than one and minimal:
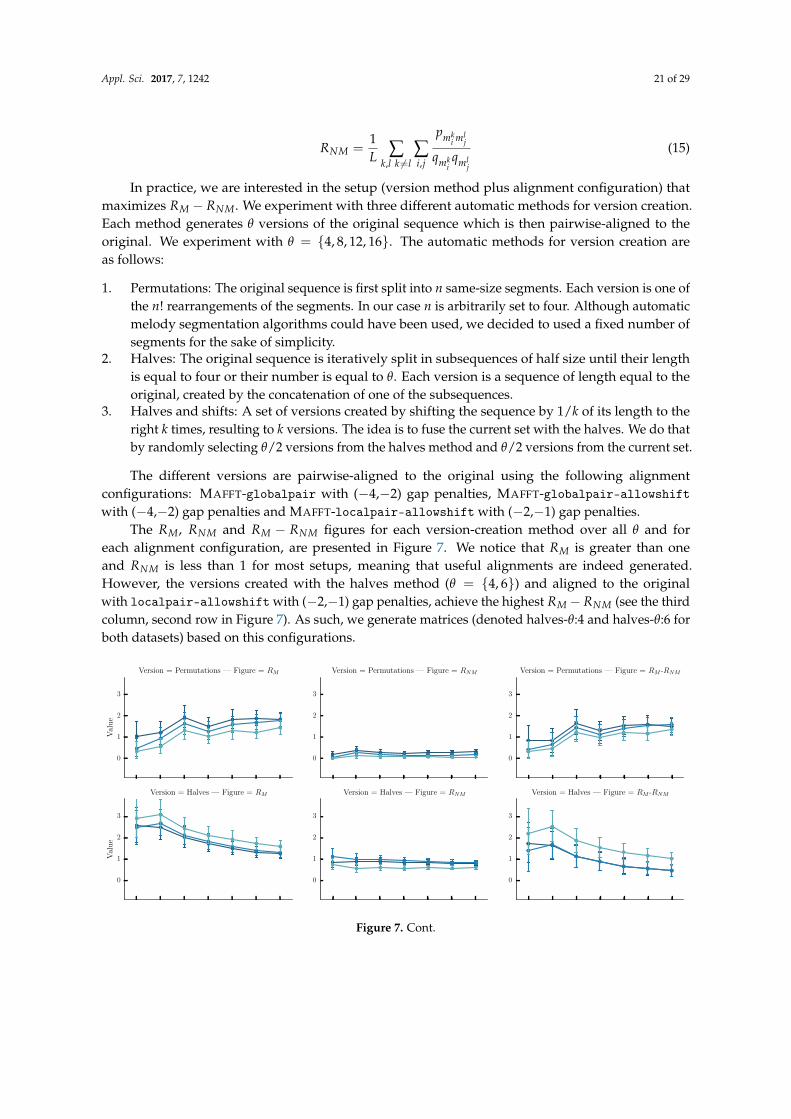
Appl. Sci. 2017, 7, 1242 21 of 29
RNM =1L ∑
k,l k 6=l∑i,j
pmki ml
j
qmkiqml
j
(15)
In practice, we are interested in the setup (version method plus alignment configuration) thatmaximizes RM − RNM. We experiment with three different automatic methods for version creation.Each method generates θ versions of the original sequence which is then pairwise-aligned to theoriginal. We experiment with θ = {4, 8, 12, 16}. The automatic methods for version creation areas follows:
1. Permutations: The original sequence is first split into n same-size segments. Each version is one ofthe n! rearrangements of the segments. In our case n is arbitrarily set to four. Although automaticmelody segmentation algorithms could have been used, we decided to used a fixed number ofsegments for the sake of simplicity.
2. Halves: The original sequence is iteratively split in subsequences of half size until their lengthis equal to four or their number is equal to θ. Each version is a sequence of length equal to theoriginal, created by the concatenation of one of the subsequences.
3. Halves and shifts: A set of versions created by shifting the sequence by 1/k of its length to theright k times, resulting to k versions. The idea is to fuse the current set with the halves. We do thatby randomly selecting θ/2 versions from the halves method and θ/2 versions from the current set.
The different versions are pairwise-aligned to the original using the following alignmentconfigurations: MAFFT-globalpair with (−4,−2) gap penalties, MAFFT-globalpair-allowshiftwith (−4,−2) gap penalties and MAFFT-localpair-allowshift with (−2,−1) gap penalties.
The RM, RNM and RM − RNM figures for each version-creation method over all θ and foreach alignment configuration, are presented in Figure 7. We notice that RM is greater than oneand RNM is less than 1 for most setups, meaning that useful alignments are indeed generated.However, the versions created with the halves method (θ = {4, 6}) and aligned to the originalwith localpair-allowshift with (−2,−1) gap penalties, achieve the highest RM − RNM (see the thirdcolumn, second row in Figure 7). As such, we generate matrices (denoted halves-θ:4 and halves-θ:6 forboth datasets) based on this configurations.
0
1
2
3
Val
ue
Version = Permutations — Figure = RM
0
1
2
3
Version = Permutations — Figure = RNM
0
1
2
3
Version = Permutations — Figure = RM -RNM
0
1
2
3
Val
ue
Version = Halves — Figure = RM
0
1
2
3
Version = Halves — Figure = RNM
0
1
2
3
Version = Halves — Figure = RM -RNM
4 6 8 10 12 14 16
θ
0
1
2
3
Val
ue
Version = Halves And Shifts — Figure = RM
4 6 8 10 12 14 16
θ
0
1
2
3
Version = Halves And Shifts — Figure = RNM
4 6 8 10 12 14 16
θ
0
1
2
3
Version = Halves And Shifts — Figure = RM -RNM
globalpair-(4,2)
globalpair-(4,2)-as
localpair-(2,1)-as
Figure 7. Cont.
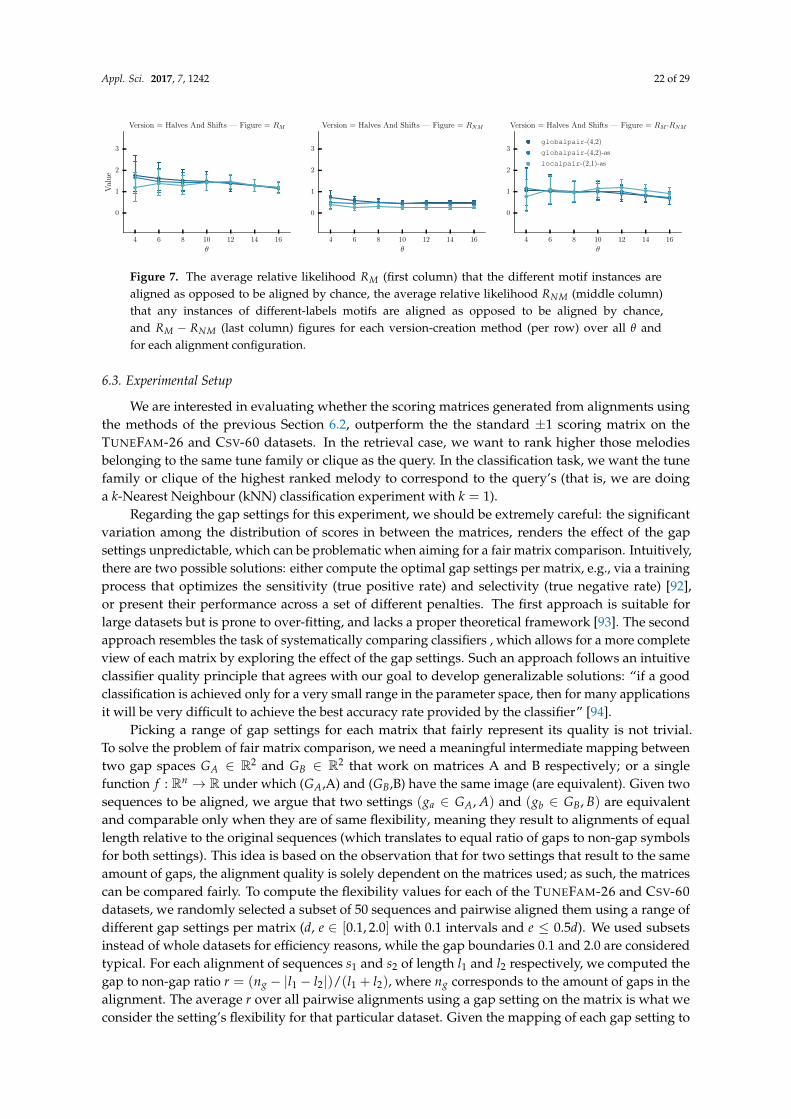
Appl. Sci. 2017, 7, 1242 22 of 29
0
1
2
3
Val
ue
Version = Permutations — Figure = RM
0
1
2
3
Version = Permutations — Figure = RNM
0
1
2
3
Version = Permutations — Figure = RM -RNM
0
1
2
3
Val
ue
Version = Halves — Figure = RM
0
1
2
3
Version = Halves — Figure = RNM
0
1
2
3
Version = Halves — Figure = RM -RNM
4 6 8 10 12 14 16
θ
0
1
2
3
Val
ue
Version = Halves And Shifts — Figure = RM
4 6 8 10 12 14 16
θ
0
1
2
3
Version = Halves And Shifts — Figure = RNM
4 6 8 10 12 14 16
θ
0
1
2
3
Version = Halves And Shifts — Figure = RM -RNM
globalpair-(4,2)
globalpair-(4,2)-as
localpair-(2,1)-as
Figure 7. The average relative likelihood RM (first column) that the different motif instances arealigned as opposed to be aligned by chance, the average relative likelihood RNM (middle column)that any instances of different-labels motifs are aligned as opposed to be aligned by chance,and RM − RNM (last column) figures for each version-creation method (per row) over all θ andfor each alignment configuration.
6.3. Experimental Setup
We are interested in evaluating whether the scoring matrices generated from alignments usingthe methods of the previous Section 6.2, outperform the the standard ±1 scoring matrix on theTUNEFAM-26 and CSV-60 datasets. In the retrieval case, we want to rank higher those melodiesbelonging to the same tune family or clique as the query. In the classification task, we want the tunefamily or clique of the highest ranked melody to correspond to the query’s (that is, we are doinga k-Nearest Neighbour (kNN) classification experiment with k = 1).
Regarding the gap settings for this experiment, we should be extremely careful: the significantvariation among the distribution of scores in between the matrices, renders the effect of the gapsettings unpredictable, which can be problematic when aiming for a fair matrix comparison. Intuitively,there are two possible solutions: either compute the optimal gap settings per matrix, e.g., via a trainingprocess that optimizes the sensitivity (true positive rate) and selectivity (true negative rate) [92],or present their performance across a set of different penalties. The first approach is suitable forlarge datasets but is prone to over-fitting, and lacks a proper theoretical framework [93]. The secondapproach resembles the task of systematically comparing classifiers , which allows for a more completeview of each matrix by exploring the effect of the gap settings. Such an approach follows an intuitiveclassifier quality principle that agrees with our goal to develop generalizable solutions: “if a goodclassification is achieved only for a very small range in the parameter space, then for many applicationsit will be very difficult to achieve the best accuracy rate provided by the classifier” [94].
Picking a range of gap settings for each matrix that fairly represent its quality is not trivial.To solve the problem of fair matrix comparison, we need a meaningful intermediate mapping betweentwo gap spaces GA ∈ R2 and GB ∈ R2 that work on matrices A and B respectively; or a singlefunction f : Rn → R under which (GA,A) and (GB,B) have the same image (are equivalent). Given twosequences to be aligned, we argue that two settings (ga ∈ GA, A) and (gb ∈ GB, B) are equivalentand comparable only when they are of same flexibility, meaning they result to alignments of equallength relative to the original sequences (which translates to equal ratio of gaps to non-gap symbolsfor both settings). This idea is based on the observation that for two settings that result to the sameamount of gaps, the alignment quality is solely dependent on the matrices used; as such, the matricescan be compared fairly. To compute the flexibility values for each of the TUNEFAM-26 and CSV-60datasets, we randomly selected a subset of 50 sequences and pairwise aligned them using a range ofdifferent gap settings per matrix (d, e ∈ [0.1, 2.0] with 0.1 intervals and e ≤ 0.5d). We used subsetsinstead of whole datasets for efficiency reasons, while the gap boundaries 0.1 and 2.0 are consideredtypical. For each alignment of sequences s1 and s2 of length l1 and l2 respectively, we computed thegap to non-gap ratio r = (ng − |l1 − l2|)/(l1 + l2), where ng corresponds to the amount of gaps in thealignment. The average r over all pairwise alignments using a gap setting on the matrix is what weconsider the setting’s flexibility for that particular dataset. Given the mapping of each gap setting to
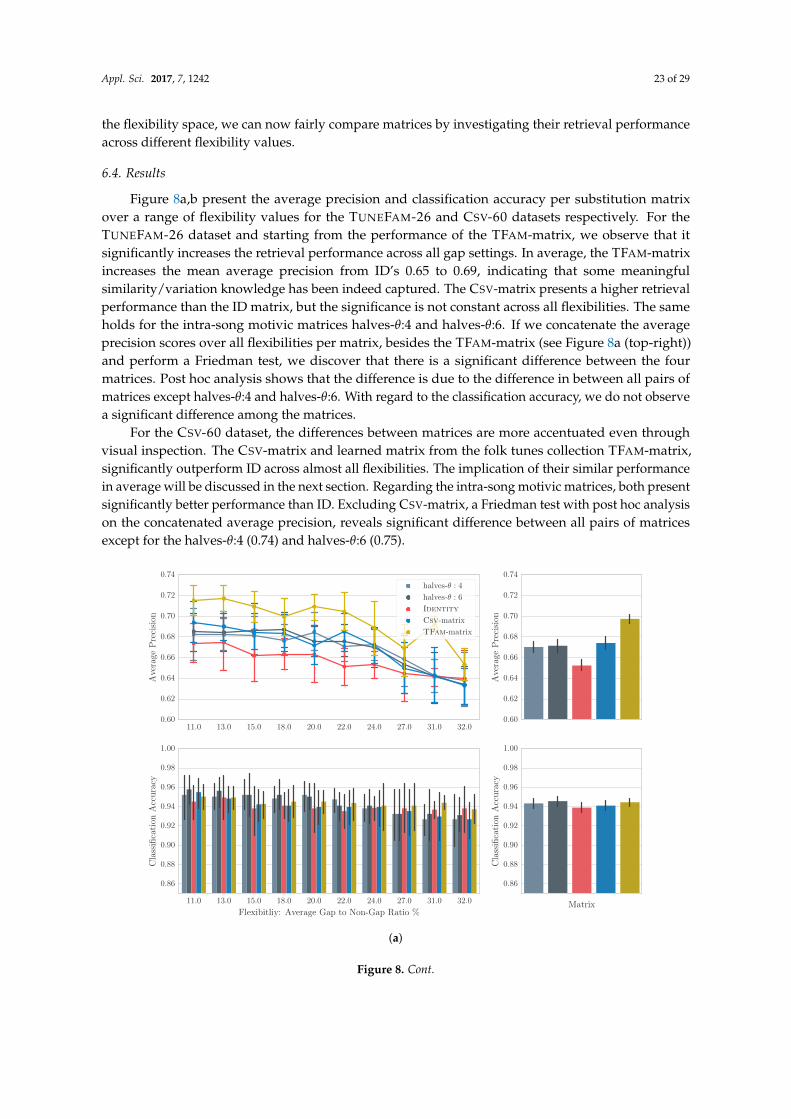
Appl. Sci. 2017, 7, 1242 23 of 29
the flexibility space, we can now fairly compare matrices by investigating their retrieval performanceacross different flexibility values.
6.4. Results
Figure 8a,b present the average precision and classification accuracy per substitution matrixover a range of flexibility values for the TUNEFAM-26 and CSV-60 datasets respectively. For theTUNEFAM-26 dataset and starting from the performance of the TFAM-matrix, we observe that itsignificantly increases the retrieval performance across all gap settings. In average, the TFAM-matrixincreases the mean average precision from ID’s 0.65 to 0.69, indicating that some meaningfulsimilarity/variation knowledge has been indeed captured. The CSV-matrix presents a higher retrievalperformance than the ID matrix, but the significance is not constant across all flexibilities. The sameholds for the intra-song motivic matrices halves-θ:4 and halves-θ:6. If we concatenate the averageprecision scores over all flexibilities per matrix, besides the TFAM-matrix (see Figure 8a (top-right))and perform a Friedman test, we discover that there is a significant difference between the fourmatrices. Post hoc analysis shows that the difference is due to the difference in between all pairs ofmatrices except halves-θ:4 and halves-θ:6. With regard to the classification accuracy, we do not observea significant difference among the matrices.
For the CSV-60 dataset, the differences between matrices are more accentuated even throughvisual inspection. The CSV-matrix and learned matrix from the folk tunes collection TFAM-matrix,significantly outperform ID across almost all flexibilities. The implication of their similar performancein average will be discussed in the next section. Regarding the intra-song motivic matrices, both presentsignificantly better performance than ID. Excluding CSV-matrix, a Friedman test with post hoc analysison the concatenated average precision, reveals significant difference between all pairs of matricesexcept for the halves-θ:4 (0.74) and halves-θ:6 (0.75).
11.0 13.0 15.0 18.0 20.0 22.0 24.0 27.0 31.0 32.00.60
0.62
0.64
0.66
0.68
0.70
0.72
0.74
Ave
rage
Pre
cisi
on
halves-θ : 4
halves-θ : 6
Identity
Csv-matrix
TFam-matrix
0.60
0.62
0.64
0.66
0.68
0.70
0.72
0.74
Ave
rage
Pre
cisi
on
11.0 13.0 15.0 18.0 20.0 22.0 24.0 27.0 31.0 32.0
Flexibitliy: Average Gap to Non-Gap Ratio %
0.86
0.88
0.90
0.92
0.94
0.96
0.98
1.00
Cla
ssifi
cati
onA
ccu
racy
Matrix
0.86
0.88
0.90
0.92
0.94
0.96
0.98
1.00
Cla
ssifi
cati
onA
ccu
racy
(a)
Figure 8. Cont.
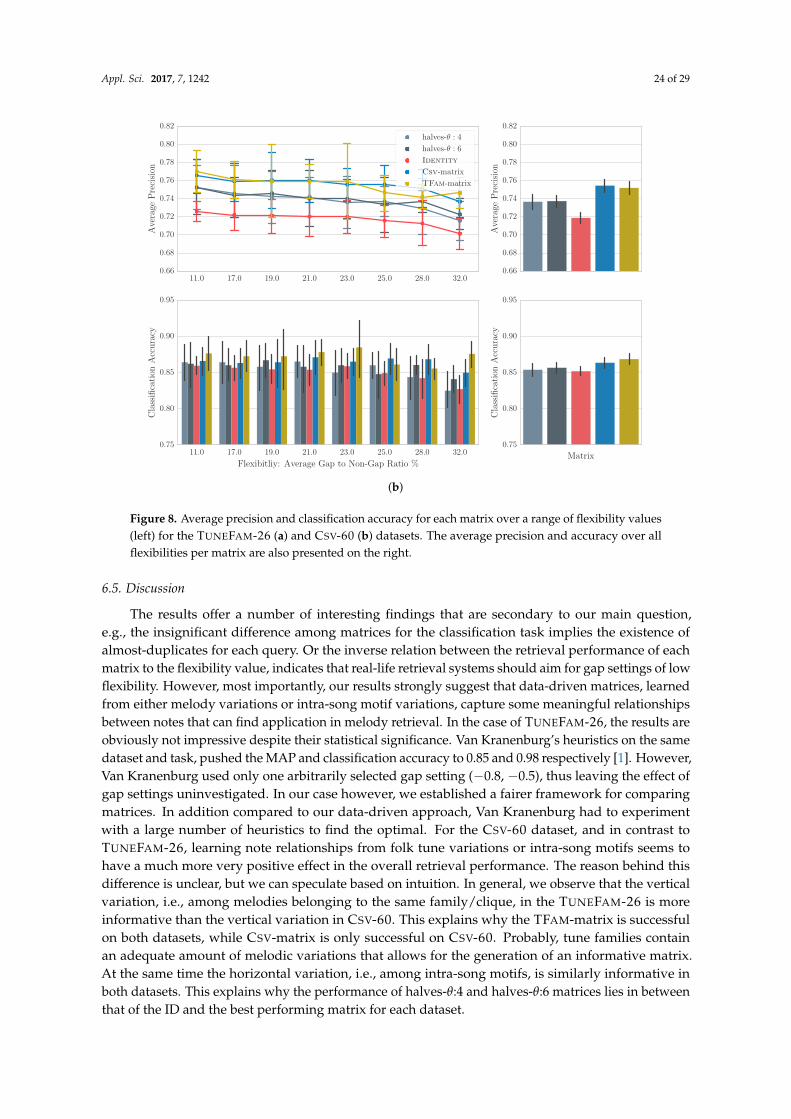
Appl. Sci. 2017, 7, 1242 24 of 29
11.0 17.0 19.0 21.0 23.0 25.0 28.0 32.00.66
0.68
0.70
0.72
0.74
0.76
0.78
0.80
0.82
Ave
rage
Pre
cisi
on
halves-θ : 4
halves-θ : 6
Identity
Csv-matrix
TFam-matrix
0.66
0.68
0.70
0.72
0.74
0.76
0.78
0.80
0.82
Ave
rage
Pre
cisi
on
11.0 17.0 19.0 21.0 23.0 25.0 28.0 32.0
Flexibitliy: Average Gap to Non-Gap Ratio %
0.75
0.80
0.85
0.90
0.95
Cla
ssifi
cati
onA
ccu
racy
Matrix
0.75
0.80
0.85
0.90
0.95
Cla
ssifi
cati
onA
ccu
racy
(b)
Figure 8. Average precision and classification accuracy for each matrix over a range of flexibility values(left) for the TUNEFAM-26 (a) and CSV-60 (b) datasets. The average precision and accuracy over allflexibilities per matrix are also presented on the right.
6.5. Discussion
The results offer a number of interesting findings that are secondary to our main question,e.g., the insignificant difference among matrices for the classification task implies the existence ofalmost-duplicates for each query. Or the inverse relation between the retrieval performance of eachmatrix to the flexibility value, indicates that real-life retrieval systems should aim for gap settings of lowflexibility. However, most importantly, our results strongly suggest that data-driven matrices, learnedfrom either melody variations or intra-song motif variations, capture some meaningful relationshipsbetween notes that can find application in melody retrieval. In the case of TUNEFAM-26, the results areobviously not impressive despite their statistical significance. Van Kranenburg’s heuristics on the samedataset and task, pushed the MAP and classification accuracy to 0.85 and 0.98 respectively [1]. However,Van Kranenburg used only one arbitrarily selected gap setting (−0.8, −0.5), thus leaving the effect ofgap settings uninvestigated. In our case however, we established a fairer framework for comparingmatrices. In addition compared to our data-driven approach, Van Kranenburg had to experimentwith a large number of heuristics to find the optimal. For the CSV-60 dataset, and in contrast toTUNEFAM-26, learning note relationships from folk tune variations or intra-song motifs seems tohave a much more very positive effect in the overall retrieval performance. The reason behind thisdifference is unclear, but we can speculate based on intuition. In general, we observe that the verticalvariation, i.e., among melodies belonging to the same family/clique, in the TUNEFAM-26 is moreinformative than the vertical variation in CSV-60. This explains why the TFAM-matrix is successfulon both datasets, while CSV-matrix is only successful on CSV-60. Probably, tune families containan adequate amount of melodic variations that allows for the generation of an informative matrix.At the same time the horizontal variation, i.e., among intra-song motifs, is similarly informative inboth datasets. This explains why the performance of halves-θ:4 and halves-θ:6 matrices lies in betweenthat of the ID and the best performing matrix for each dataset.
Appl. Sci. 2017, 7, 1242 25 of 29
In summary, the results indicate that vertical variation models are more beneficial in a retrievalscenario. At the same time, the captured relationships of the horizontal models seem inadequate toapproximate their performance. This implies that the way a song varies across its length does notfollow the same principles as its variation through time, but further confirmation with note-to-notealignments of intra-song motifs and melodic variations is required. Nevertheless, the modelling ofhorizontal variation can be considered highly appropriate for practical scenarios of melody retrievaland classification where clique information is unavailable.
7. Conclusions
Modelling music similarity is a fundamental, but intricate task in MIR. Most previous workson music similarity, practical or theoretical, relied heavily on heuristics. In contrast, our workfocused on acquiring knowledge on music and melodic similarity in particular from the data itself.Since data-driven methods and tools have been under development for years in bioinformatics,and since biological and music sequence share resembling concepts, we investigated their applicabilityinside a musical context.
First, we tackled the concept of meaningful and musically significant alignments of relatedmelodies, by applying the bioinformatics structural alignment metaphor to music motifs. Our resultsrevealed that the MAFFT multiple alignment algorithm, which uses gap-free sections as anchor points,is a natural fit for multiple melodic sequences; a strong indication of the importance of musical patternsfor melodic similarity. Trusted MSA techniques made it possible to organize melodic variations suchthat melodic stability/variation can be analysed. We argue that our stability analysis findings are freeof heuristics or biases that might have been introduced following other approaches.
Secondly, we investigated the modelling of global melodic similarity. We captured the probabilityof one note to be changed to another in a variation and created musically appropriate note-substitutionscoring matrices for melodic alignment. We then put these matrices successfully to the test by designingretrieval and classification tasks. Our data-driven modelling of music similarity outperforms the naive±1 matrix, indicating that indeed some novel knowledge was captured. Additionally, we showedthat variations inside a melody can be an alternative source for modelling the similarity of variationsamong tune families or cliques of covers.
In general, we showed that bioinformatics tools and methods can find successful applicationin music, to answer in a reliable, data-driven way a number of important, on-going questionsin MIR. We argue data-driven approaches, such as ours, constitute an ideal balance betweenthe two occasionally contradicting goals of MIR, problem solving and knowledge acquisition.Unfortunately, in the current age of big data, the potential in exploring musical relationships that canaid both the digital music services and our understanding of music itself remains largely idle. We hopethat our work will stimulate future research to focus on a more constructive direction.
Author Contributions: Dimitrios Bountouridis and Daniel G. Brown both developed the relationship tobioinformatics applications and designed the experiments. Dimitrios Bountouridis performed the experiments,analysed the data and wrote the paper. Daniel G. Brown, Frans Wiering and Remco C. Veltkamp contributed tothe writing of the paper.
Conflicts of Interest: The authors declare no conflict of interest. The founding sponsors had no role in the designof the study; in the collection, analyses or interpretation of data; in the writing of the manuscript; nor in thedecision to publish the results.
References
1. Van Kranenburg, P. A Computational Approach to Content-Based Retrieval of Folk Song Melodies.Ph.D. Thesis, Utrecht University, Utrecht, The Netherlands, 2010.
2. Volk, A.; Haas, W.; Kranenburg, P. Towards modelling variation in music as foundation for similarity.In Proceedings of the International Conference on Music Perception and Cognition, Thessaloniki, Greece,23–28 July 2012; pp. 1085–1094.
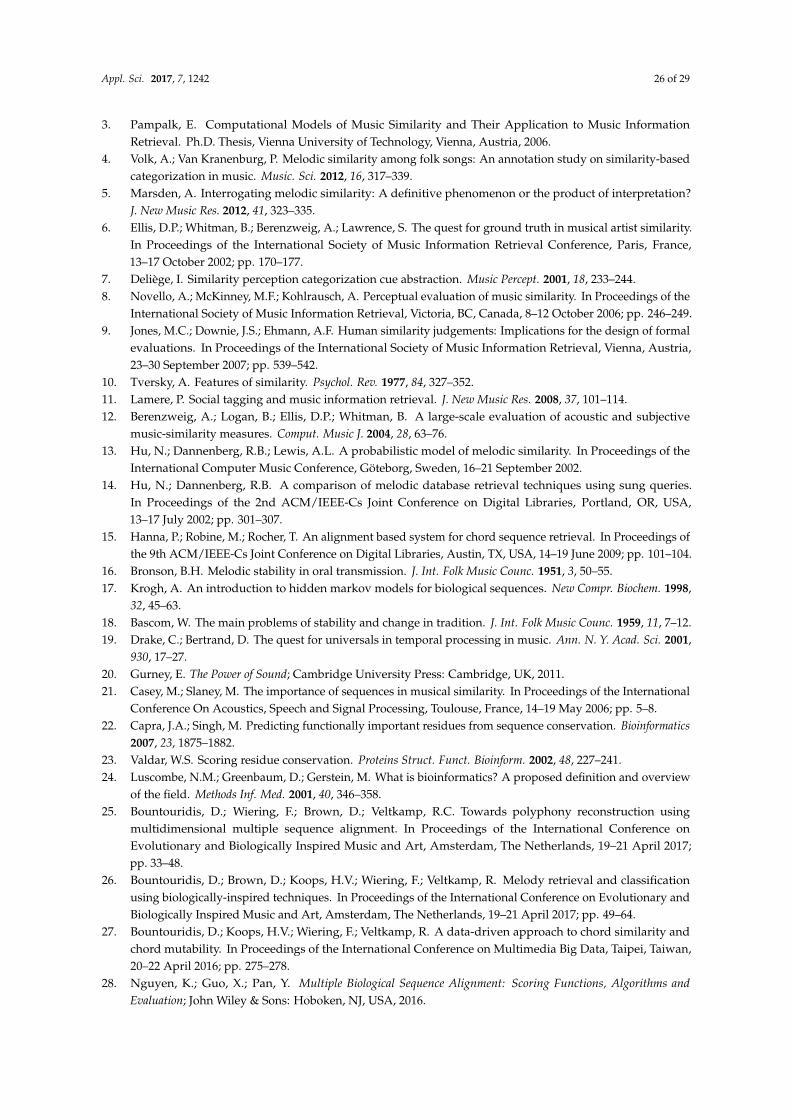
Appl. Sci. 2017, 7, 1242 26 of 29
3. Pampalk, E. Computational Models of Music Similarity and Their Application to Music InformationRetrieval. Ph.D. Thesis, Vienna University of Technology, Vienna, Austria, 2006.
4. Volk, A.; Van Kranenburg, P. Melodic similarity among folk songs: An annotation study on similarity-basedcategorization in music. Music. Sci. 2012, 16, 317–339.
5. Marsden, A. Interrogating melodic similarity: A definitive phenomenon or the product of interpretation?J. New Music Res. 2012, 41, 323–335.
6. Ellis, D.P.; Whitman, B.; Berenzweig, A.; Lawrence, S. The quest for ground truth in musical artist similarity.In Proceedings of the International Society of Music Information Retrieval Conference, Paris, France,13–17 October 2002; pp. 170–177.
7. Deliège, I. Similarity perception categorization cue abstraction. Music Percept. 2001, 18, 233–244.8. Novello, A.; McKinney, M.F.; Kohlrausch, A. Perceptual evaluation of music similarity. In Proceedings of the
International Society of Music Information Retrieval, Victoria, BC, Canada, 8–12 October 2006; pp. 246–249.9. Jones, M.C.; Downie, J.S.; Ehmann, A.F. Human similarity judgements: Implications for the design of formal
evaluations. In Proceedings of the International Society of Music Information Retrieval, Vienna, Austria,23–30 September 2007; pp. 539–542.
10. Tversky, A. Features of similarity. Psychol. Rev. 1977, 84, 327–352.11. Lamere, P. Social tagging and music information retrieval. J. New Music Res. 2008, 37, 101–114.12. Berenzweig, A.; Logan, B.; Ellis, D.P.; Whitman, B. A large-scale evaluation of acoustic and subjective
music-similarity measures. Comput. Music J. 2004, 28, 63–76.13. Hu, N.; Dannenberg, R.B.; Lewis, A.L. A probabilistic model of melodic similarity. In Proceedings of the
International Computer Music Conference, Göteborg, Sweden, 16–21 September 2002.14. Hu, N.; Dannenberg, R.B. A comparison of melodic database retrieval techniques using sung queries.
In Proceedings of the 2nd ACM/IEEE-Cs Joint Conference on Digital Libraries, Portland, OR, USA,13–17 July 2002; pp. 301–307.
15. Hanna, P.; Robine, M.; Rocher, T. An alignment based system for chord sequence retrieval. In Proceedings ofthe 9th ACM/IEEE-Cs Joint Conference on Digital Libraries, Austin, TX, USA, 14–19 June 2009; pp. 101–104.
16. Bronson, B.H. Melodic stability in oral transmission. J. Int. Folk Music Counc. 1951, 3, 50–55.17. Krogh, A. An introduction to hidden markov models for biological sequences. New Compr. Biochem. 1998,
32, 45–63.18. Bascom, W. The main problems of stability and change in tradition. J. Int. Folk Music Counc. 1959, 11, 7–12.19. Drake, C.; Bertrand, D. The quest for universals in temporal processing in music. Ann. N. Y. Acad. Sci. 2001,
930, 17–27.20. Gurney, E. The Power of Sound; Cambridge University Press: Cambridge, UK, 2011.21. Casey, M.; Slaney, M. The importance of sequences in musical similarity. In Proceedings of the International
Conference On Acoustics, Speech and Signal Processing, Toulouse, France, 14–19 May 2006; pp. 5–8.22. Capra, J.A.; Singh, M. Predicting functionally important residues from sequence conservation. Bioinformatics
2007, 23, 1875–1882.23. Valdar, W.S. Scoring residue conservation. Proteins Struct. Funct. Bioinform. 2002, 48, 227–241.24. Luscombe, N.M.; Greenbaum, D.; Gerstein, M. What is bioinformatics? A proposed definition and overview
of the field. Methods Inf. Med. 2001, 40, 346–358.25. Bountouridis, D.; Wiering, F.; Brown, D.; Veltkamp, R.C. Towards polyphony reconstruction using
multidimensional multiple sequence alignment. In Proceedings of the International Conference onEvolutionary and Biologically Inspired Music and Art, Amsterdam, The Netherlands, 19–21 April 2017;pp. 33–48.
26. Bountouridis, D.; Brown, D.; Koops, H.V.; Wiering, F.; Veltkamp, R. Melody retrieval and classificationusing biologically-inspired techniques. In Proceedings of the International Conference on Evolutionary andBiologically Inspired Music and Art, Amsterdam, The Netherlands, 19–21 April 2017; pp. 49–64.
27. Bountouridis, D.; Koops, H.V.; Wiering, F.; Veltkamp, R. A data-driven approach to chord similarity andchord mutability. In Proceedings of the International Conference on Multimedia Big Data, Taipei, Taiwan,20–22 April 2016; pp. 275–278.
28. Nguyen, K.; Guo, X.; Pan, Y. Multiple Biological Sequence Alignment: Scoring Functions, Algorithms andEvaluation; John Wiley & Sons: Hoboken, NJ, USA, 2016.
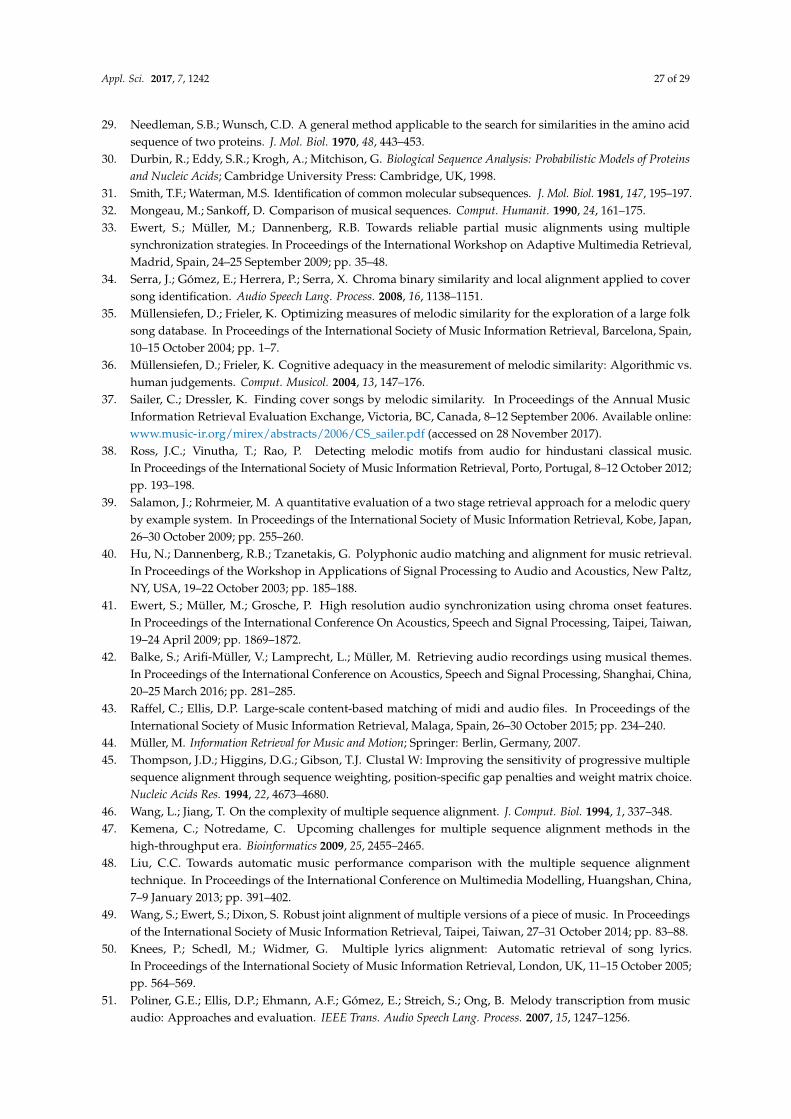
Appl. Sci. 2017, 7, 1242 27 of 29
29. Needleman, S.B.; Wunsch, C.D. A general method applicable to the search for similarities in the amino acidsequence of two proteins. J. Mol. Biol. 1970, 48, 443–453.
30. Durbin, R.; Eddy, S.R.; Krogh, A.; Mitchison, G. Biological Sequence Analysis: Probabilistic Models of Proteinsand Nucleic Acids; Cambridge University Press: Cambridge, UK, 1998.
31. Smith, T.F.; Waterman, M.S. Identification of common molecular subsequences. J. Mol. Biol. 1981, 147, 195–197.32. Mongeau, M.; Sankoff, D. Comparison of musical sequences. Comput. Humanit. 1990, 24, 161–175.33. Ewert, S.; Müller, M.; Dannenberg, R.B. Towards reliable partial music alignments using multiple
synchronization strategies. In Proceedings of the International Workshop on Adaptive Multimedia Retrieval,Madrid, Spain, 24–25 September 2009; pp. 35–48.
34. Serra, J.; Gómez, E.; Herrera, P.; Serra, X. Chroma binary similarity and local alignment applied to coversong identification. Audio Speech Lang. Process. 2008, 16, 1138–1151.
35. Müllensiefen, D.; Frieler, K. Optimizing measures of melodic similarity for the exploration of a large folksong database. In Proceedings of the International Society of Music Information Retrieval, Barcelona, Spain,10–15 October 2004; pp. 1–7.
36. Müllensiefen, D.; Frieler, K. Cognitive adequacy in the measurement of melodic similarity: Algorithmic vs.human judgements. Comput. Musicol. 2004, 13, 147–176.
37. Sailer, C.; Dressler, K. Finding cover songs by melodic similarity. In Proceedings of the Annual MusicInformation Retrieval Evaluation Exchange, Victoria, BC, Canada, 8–12 September 2006. Available online:www.music-ir.org/mirex/abstracts/2006/CS_sailer.pdf (accessed on 28 November 2017).
38. Ross, J.C.; Vinutha, T.; Rao, P. Detecting melodic motifs from audio for hindustani classical music.In Proceedings of the International Society of Music Information Retrieval, Porto, Portugal, 8–12 October 2012;pp. 193–198.
39. Salamon, J.; Rohrmeier, M. A quantitative evaluation of a two stage retrieval approach for a melodic queryby example system. In Proceedings of the International Society of Music Information Retrieval, Kobe, Japan,26–30 October 2009; pp. 255–260.
40. Hu, N.; Dannenberg, R.B.; Tzanetakis, G. Polyphonic audio matching and alignment for music retrieval.In Proceedings of the Workshop in Applications of Signal Processing to Audio and Acoustics, New Paltz,NY, USA, 19–22 October 2003; pp. 185–188.
41. Ewert, S.; Müller, M.; Grosche, P. High resolution audio synchronization using chroma onset features.In Proceedings of the International Conference On Acoustics, Speech and Signal Processing, Taipei, Taiwan,19–24 April 2009; pp. 1869–1872.
42. Balke, S.; Arifi-Müller, V.; Lamprecht, L.; Müller, M. Retrieving audio recordings using musical themes.In Proceedings of the International Conference on Acoustics, Speech and Signal Processing, Shanghai, China,20–25 March 2016; pp. 281–285.
43. Raffel, C.; Ellis, D.P. Large-scale content-based matching of midi and audio files. In Proceedings of theInternational Society of Music Information Retrieval, Malaga, Spain, 26–30 October 2015; pp. 234–240.
44. Müller, M. Information Retrieval for Music and Motion; Springer: Berlin, Germany, 2007.45. Thompson, J.D.; Higgins, D.G.; Gibson, T.J. Clustal W: Improving the sensitivity of progressive multiple
sequence alignment through sequence weighting, position-specific gap penalties and weight matrix choice.Nucleic Acids Res. 1994, 22, 4673–4680.
46. Wang, L.; Jiang, T. On the complexity of multiple sequence alignment. J. Comput. Biol. 1994, 1, 337–348.47. Kemena, C.; Notredame, C. Upcoming challenges for multiple sequence alignment methods in the
high-throughput era. Bioinformatics 2009, 25, 2455–2465.48. Liu, C.C. Towards automatic music performance comparison with the multiple sequence alignment
technique. In Proceedings of the International Conference on Multimedia Modelling, Huangshan, China,7–9 January 2013; pp. 391–402.
49. Wang, S.; Ewert, S.; Dixon, S. Robust joint alignment of multiple versions of a piece of music. In Proceedingsof the International Society of Music Information Retrieval, Taipei, Taiwan, 27–31 October 2014; pp. 83–88.
50. Knees, P.; Schedl, M.; Widmer, G. Multiple lyrics alignment: Automatic retrieval of song lyrics.In Proceedings of the International Society of Music Information Retrieval, London, UK, 11–15 October 2005;pp. 564–569.
51. Poliner, G.E.; Ellis, D.P.; Ehmann, A.F.; Gómez, E.; Streich, S.; Ong, B. Melody transcription from musicaudio: Approaches and evaluation. IEEE Trans. Audio Speech Lang. Process. 2007, 15, 1247–1256.
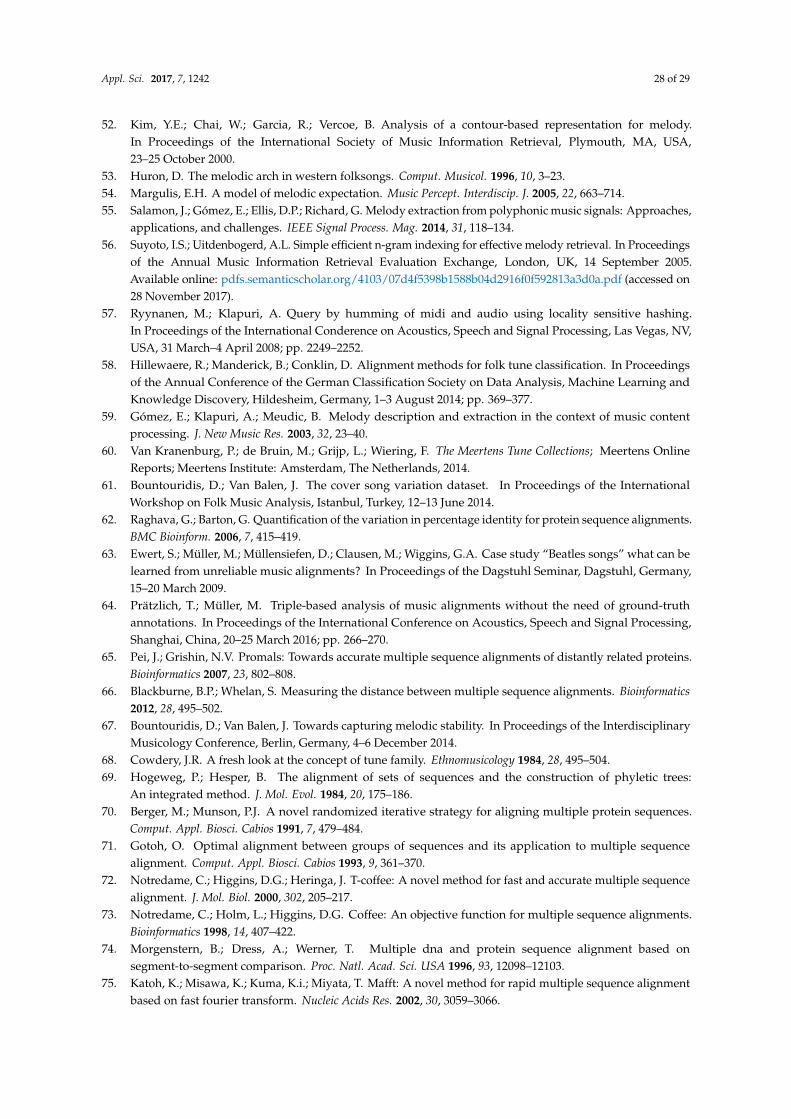
Appl. Sci. 2017, 7, 1242 28 of 29
52. Kim, Y.E.; Chai, W.; Garcia, R.; Vercoe, B. Analysis of a contour-based representation for melody.In Proceedings of the International Society of Music Information Retrieval, Plymouth, MA, USA,23–25 October 2000.
53. Huron, D. The melodic arch in western folksongs. Comput. Musicol. 1996, 10, 3–23.54. Margulis, E.H. A model of melodic expectation. Music Percept. Interdiscip. J. 2005, 22, 663–714.55. Salamon, J.; Gómez, E.; Ellis, D.P.; Richard, G. Melody extraction from polyphonic music signals: Approaches,
applications, and challenges. IEEE Signal Process. Mag. 2014, 31, 118–134.56. Suyoto, I.S.; Uitdenbogerd, A.L. Simple efficient n-gram indexing for effective melody retrieval. In Proceedings
of the Annual Music Information Retrieval Evaluation Exchange, London, UK, 14 September 2005.Available online: pdfs.semanticscholar.org/4103/07d4f5398b1588b04d2916f0f592813a3d0a.pdf (accessed on28 November 2017).
57. Ryynanen, M.; Klapuri, A. Query by humming of midi and audio using locality sensitive hashing.In Proceedings of the International Conderence on Acoustics, Speech and Signal Processing, Las Vegas, NV,USA, 31 March–4 April 2008; pp. 2249–2252.
58. Hillewaere, R.; Manderick, B.; Conklin, D. Alignment methods for folk tune classification. In Proceedingsof the Annual Conference of the German Classification Society on Data Analysis, Machine Learning andKnowledge Discovery, Hildesheim, Germany, 1–3 August 2014; pp. 369–377.
59. Gómez, E.; Klapuri, A.; Meudic, B. Melody description and extraction in the context of music contentprocessing. J. New Music Res. 2003, 32, 23–40.
60. Van Kranenburg, P.; de Bruin, M.; Grijp, L.; Wiering, F. The Meertens Tune Collections; Meertens OnlineReports; Meertens Institute: Amsterdam, The Netherlands, 2014.
61. Bountouridis, D.; Van Balen, J. The cover song variation dataset. In Proceedings of the InternationalWorkshop on Folk Music Analysis, Istanbul, Turkey, 12–13 June 2014.
62. Raghava, G.; Barton, G. Quantification of the variation in percentage identity for protein sequence alignments.BMC Bioinform. 2006, 7, 415–419.
63. Ewert, S.; Müller, M.; Müllensiefen, D.; Clausen, M.; Wiggins, G.A. Case study “Beatles songs” what can belearned from unreliable music alignments? In Proceedings of the Dagstuhl Seminar, Dagstuhl, Germany,15–20 March 2009.
64. Prätzlich, T.; Müller, M. Triple-based analysis of music alignments without the need of ground-truthannotations. In Proceedings of the International Conference on Acoustics, Speech and Signal Processing,Shanghai, China, 20–25 March 2016; pp. 266–270.
65. Pei, J.; Grishin, N.V. Promals: Towards accurate multiple sequence alignments of distantly related proteins.Bioinformatics 2007, 23, 802–808.
66. Blackburne, B.P.; Whelan, S. Measuring the distance between multiple sequence alignments. Bioinformatics2012, 28, 495–502.
67. Bountouridis, D.; Van Balen, J. Towards capturing melodic stability. In Proceedings of the InterdisciplinaryMusicology Conference, Berlin, Germany, 4–6 December 2014.
68. Cowdery, J.R. A fresh look at the concept of tune family. Ethnomusicology 1984, 28, 495–504.69. Hogeweg, P.; Hesper, B. The alignment of sets of sequences and the construction of phyletic trees:
An integrated method. J. Mol. Evol. 1984, 20, 175–186.70. Berger, M.; Munson, P.J. A novel randomized iterative strategy for aligning multiple protein sequences.
Comput. Appl. Biosci. Cabios 1991, 7, 479–484.71. Gotoh, O. Optimal alignment between groups of sequences and its application to multiple sequence
alignment. Comput. Appl. Biosci. Cabios 1993, 9, 361–370.72. Notredame, C.; Higgins, D.G.; Heringa, J. T-coffee: A novel method for fast and accurate multiple sequence
alignment. J. Mol. Biol. 2000, 302, 205–217.73. Notredame, C.; Holm, L.; Higgins, D.G. Coffee: An objective function for multiple sequence alignments.
Bioinformatics 1998, 14, 407–422.74. Morgenstern, B.; Dress, A.; Werner, T. Multiple dna and protein sequence alignment based on
segment-to-segment comparison. Proc. Natl. Acad. Sci. USA 1996, 93, 12098–12103.75. Katoh, K.; Misawa, K.; Kuma, K.i.; Miyata, T. Mafft: A novel method for rapid multiple sequence alignment
based on fast fourier transform. Nucleic Acids Res. 2002, 30, 3059–3066.
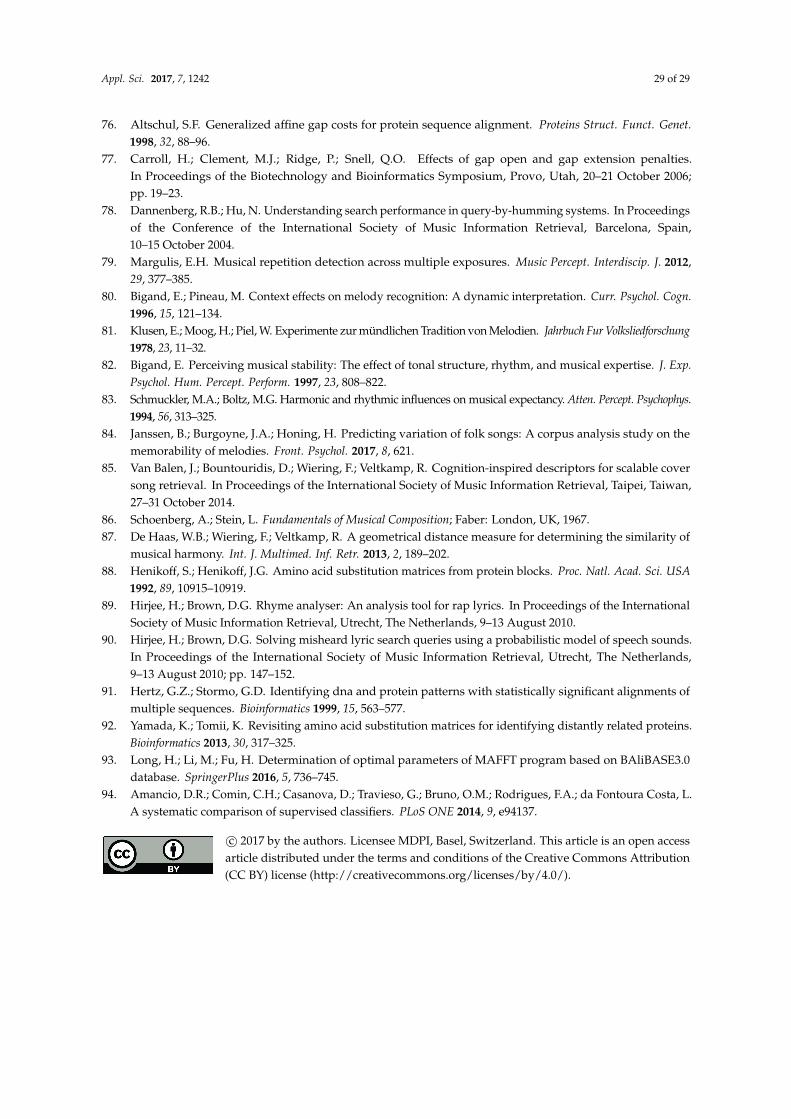
Appl. Sci. 2017, 7, 1242 29 of 29
76. Altschul, S.F. Generalized affine gap costs for protein sequence alignment. Proteins Struct. Funct. Genet.1998, 32, 88–96.
77. Carroll, H.; Clement, M.J.; Ridge, P.; Snell, Q.O. Effects of gap open and gap extension penalties.In Proceedings of the Biotechnology and Bioinformatics Symposium, Provo, Utah, 20–21 October 2006;pp. 19–23.
78. Dannenberg, R.B.; Hu, N. Understanding search performance in query-by-humming systems. In Proceedingsof the Conference of the International Society of Music Information Retrieval, Barcelona, Spain,10–15 October 2004.
79. Margulis, E.H. Musical repetition detection across multiple exposures. Music Percept. Interdiscip. J. 2012,29, 377–385.
80. Bigand, E.; Pineau, M. Context effects on melody recognition: A dynamic interpretation. Curr. Psychol. Cogn.1996, 15, 121–134.
81. Klusen, E.; Moog, H.; Piel, W. Experimente zur mündlichen Tradition von Melodien. Jahrbuch Fur Volksliedforschung1978, 23, 11–32.
82. Bigand, E. Perceiving musical stability: The effect of tonal structure, rhythm, and musical expertise. J. Exp.Psychol. Hum. Percept. Perform. 1997, 23, 808–822.
83. Schmuckler, M.A.; Boltz, M.G. Harmonic and rhythmic influences on musical expectancy. Atten. Percept. Psychophys.1994, 56, 313–325.
84. Janssen, B.; Burgoyne, J.A.; Honing, H. Predicting variation of folk songs: A corpus analysis study on thememorability of melodies. Front. Psychol. 2017, 8, 621.
85. Van Balen, J.; Bountouridis, D.; Wiering, F.; Veltkamp, R. Cognition-inspired descriptors for scalable coversong retrieval. In Proceedings of the International Society of Music Information Retrieval, Taipei, Taiwan,27–31 October 2014.
86. Schoenberg, A.; Stein, L. Fundamentals of Musical Composition; Faber: London, UK, 1967.87. De Haas, W.B.; Wiering, F.; Veltkamp, R. A geometrical distance measure for determining the similarity of
musical harmony. Int. J. Multimed. Inf. Retr. 2013, 2, 189–202.88. Henikoff, S.; Henikoff, J.G. Amino acid substitution matrices from protein blocks. Proc. Natl. Acad. Sci. USA
1992, 89, 10915–10919.89. Hirjee, H.; Brown, D.G. Rhyme analyser: An analysis tool for rap lyrics. In Proceedings of the International
Society of Music Information Retrieval, Utrecht, The Netherlands, 9–13 August 2010.90. Hirjee, H.; Brown, D.G. Solving misheard lyric search queries using a probabilistic model of speech sounds.
In Proceedings of the International Society of Music Information Retrieval, Utrecht, The Netherlands,9–13 August 2010; pp. 147–152.
91. Hertz, G.Z.; Stormo, G.D. Identifying dna and protein patterns with statistically significant alignments ofmultiple sequences. Bioinformatics 1999, 15, 563–577.
92. Yamada, K.; Tomii, K. Revisiting amino acid substitution matrices for identifying distantly related proteins.Bioinformatics 2013, 30, 317–325.
93. Long, H.; Li, M.; Fu, H. Determination of optimal parameters of MAFFT program based on BAliBASE3.0database. SpringerPlus 2016, 5, 736–745.
94. Amancio, D.R.; Comin, C.H.; Casanova, D.; Travieso, G.; Bruno, O.M.; Rodrigues, F.A.; da Fontoura Costa, L.A systematic comparison of supervised classifiers. PLoS ONE 2014, 9, e94137.
c© 2017 by the authors. Licensee MDPI, Basel, Switzerland. This article is an open accessarticle distributed under the terms and conditions of the Creative Commons Attribution(CC BY) license (http://creativecommons.org/licenses/by/4.0/).