members equity bank limited - me bank - the online … dickson company secretary i rogerson auditors...
TRANSCRIPT

ABN: 56 070 887 679
Annual Financial Report
For the financial year ended 30 June 2017
Members Equity Bank Limited

Members Equity Bank Limited
Annual financial report
for the financial year ended 30 June 2017
General Information
Australian Business Number
56 070 887 679
Directors
K Hodgson Chairman
C Bart (appointed 1 July 2016)
C Christian
G Combet
A De Salis (retired 14 November 2016)
J Milne (leave of absence from 1 April 2017 to 31 October 2017)
J Nesbitt (appointed 2 February 2017)
E Rubin (appointed 4 October 2016)
G Weaven (retired 31 December 2016)
Chief Executive Officer
J McPhee
Chief Financial Officer
G Dickson
Company Secretary
I Rogerson
Auditors
Deloitte Touche Tohmatsu
550 Bourke Street
Melbourne VIC 3000
Registered office
Level 28
360 Elizabeth Street
Melbourne VIC 3000
Country of incorporation
Australia
Country of domicile
Australia
Regulatory Disclosures
The regulatory disclosures required by Australian Prudential Regulation Authority (APRA) Prudential Standard APS330 are
located on the Company's website at www.mebank.com.au.

Members Equity Bank Limited
Annual financial report
for the financial year ended 30 June 2017
Contents
Directors' report
Auditor's independence declaration
Independent auditor's report
Directors' declaration
Statement of profit or loss and other comprehensive income
Statement of financial position
Statement of changes in equity
Statement of cash flows
Notes to the financial statements
Page
18
16
1
9
17
10
14
15
13

Members Equity Bank Limited
Directors' report
for the financial year ended 30 June 2017
The directors of Members Equity Bank Limited ("the Company") submit herewith the annual financial report of "the Group" (being the
Company and its subsidiaries) for the financial year ended 30 June 2017.
In order to comply with the provisions of the Corporations Act 2001, the directors report as follows:
Directors
The names of the directors of the Company during or since the end of the financial year are:
K Hodgson Chairman
C Bart (appointed 1 July 2016)
C Christian
G Combet
A De Salis (retired 14 November 2016)
J Milne (leave of absence from 1 April 2017 to 31 October 2017)
J Nesbitt (appointed 2 February 2017)
E Rubin (appointed 4 October 2016)
G Weaven (retired 31 December 2016)
Principal activities
The principal activities of the Group during the financial year comprised:
• provision of banking services under a banking licence;
• funding, management, and servicing of residential and consumer lending portfolios; and
• carrying out associated funding activities for off balance sheet portfolios.
Dividends
No dividends have been paid or declared since the start of the financial year (2016: $nil). The directors do not recommend the payment
of a dividend in respect of the financial year ended 30 June 2017.
Review of operations and results
Profit for the year ended 30 June 2017 was $61.8 million compared to $76.8 million for the year ended 30 June 2016. The results were
broadly in line with expectations.
Significant items
Effective 1 December 2016, the Group sold its commercial loans and asset finance portfolios to RedZed Lending Solutions Pty
Ltd. As a result of this sale, the Group has recognised a pre-tax loss on disposal of $8.9 million for the financial year ended 30
June 2017.
Subsequent events
There are no matters or circumstances occurring subsequent to the end of the financial year that have significantly affected, or may
significantly affect, the operations of the Group, the results of those operations, or the state of affairs of the Group in future financial
years.
Likely developments and expected results
On 19 July 2017, APRA released an Information Paper outlining their conclusions with respect to the quantum and timing of capital
increases that will be required for Australian Authorised Deposit-taking Institutions (ADI) to achieve ‘unquestionably strong’
capital ratios. For ADIs such as ME (that do not use the Internal Ratings Based methodology for capital) the effective increase in
capital requirements to meet the ‘unquestionably strong’ benchmark is expected to be around 50 basis points. All ADIs are
expected to meet the new benchmarks by 1 January 2020.
The 50 basis points increase in capital requirements is expected to apply across all three capital ratios i.e. Common Equity Tier 1
(CET1), Tier 1 and Total Capital Ratio, resulting in the Board-approved minimum total capital ratio increasing from 11.5% to 12%.
APRA has indicated that there will be a further consultation process on the specific mechanics of how the changes will be
effected.
As at 30 June 2017, a 50 basis points increase in total capital requirements equates to approximately $50 million. Following the
Standard & Poor's sector-wide downgrade on 22 May 2017, the Group intends to increase the amount of capital held and this
will also satisfy the proposed regulatory capital increases highlighted above. The increase in capital is expected to comprise
ordinary share capital and Additional Tier 1 capital (the latter subject to market conditions).
Corporate governance statement
The Group's approach to corporate governance is based on the belief that in order to encourage the long term growth of the Group and
meet the interests of shareholders, it is important to address the relationships between Board, executive management, shareholders,
customers, the community and other stakeholders (including regulators) through appropriate policies and processes. The Board's
Page 1

Members Equity Bank Limited
Directors' report
for the financial year ended 30 June 2017
approach is cognisant of the ASX Corporate Governance Council Corporate Governance Principles and Recommendations and other
better practice guides to ensure that the Group's governance standards meet both industry and community expectations. The Board
remains committed to achieving the highest standard of internal corporate governance wherever appropriate, including promotion of
gender diversity across the organisation. In addition, the Board is governed by the requirements of the APRA including those
contained in ADI Prudential Standards.
Board Composition
The composition of the Board is determined in accordance with the Company's Constitution and the following guidelines:
• the Board maintains a majority of independent non-executive directors; and
• the Board comprises directors with an appropriate range of qualifications and experience.
In addition, each director must satisfy the Board’s Fit and Proper Policy.
The Constitution provides, amongst other matters, that directors may not hold office for more than 3 years without standing for
re-election. Retiring directors are eligible for re-election. Ms De Salis retired as a director effective from 14 November 2016 and Mr
Weaven retired as a director effective from 31 December 2016. Mr Combet offered himself for re-election by the shareholders as a
director of the Company and was re-elected in November 2016.
The Board has a diverse range of experience in banking and financial services as well as in other sectors. The experience of the Board
members is set out below:
Ken Hodgson - Non Executive Director
Director since January 2012 (Chairman since January 2016)
In addition to his role as Chairman of the Board Mr Hodgson is the Chair of the People and Remuneration Committee and the
Nominations Committee. During the year, he was also a member of the Risk and Compliance Committee (from 1 July 2016 to 5
April 2017) and the Audit and Governance Committee. He is a director of Hydro Tasmania and spent 28 years working at
Westpac and National Australia Bank in their retail banking divisions, including as General Manager Consumer Financial Services
at Westpac, and as General Manager Personal Financial Services at National Australia Bank.
Christine Christian - Non Executive Director
Director since November 2012
Ms Christian was the Chair of the Audit and Governance Committee (1 July 2016 to 7 June 2017), and Chair of the Risk and
Compliance Committee. Ms Christian is an independent company director. Her current directorships include FlexiGroup Limited,
Powerlinx Inc., State Library of Victoria, Sherpa Systems Pty Ltd, Lonsec Financial Group, and Victorian Managed Insurance
Authority. She has served in senior executive roles in Australia and overseas primarily in the credit risk, financial services and global
business publishing sectors, including 14 years as Chief Executive Officer of Dun & Bradstreet Australia and New Zealand.
Justin Milne - Non Executive Director
Director since November 2012
Mr Milne is on a leave of absence from the board from 1 April 2017 to 30 September 2017
Mr Milne was the Chair of the Digital Committee (from 1 July 2016 to 31 March 2017) and a member of the People and
Remuneration Committee (from 1 January 2017 to 31 March 2017), until his leave of absence commenced on April 2017. He is
the Chairman of the Australian Broadcasting Corporation and Chair of Myob Ltd and NetComm Wireless. He is a non-executive
director of Tabcorp Holdings Ltd, NBN Co and SMS Management and Technology. He has served in senior executive roles as
Group Managing Director at Telstra and was responsible for BigPond Broadband and Telstra's Media businesses. Prior to
working at Telstra, he was the CEO of OzEmail and the Microsoft Network. He is currently President of the Leichhardt Rowing
Club.
Greg Combet AM - Non Executive Director
Director since November 2014
Mr Combet is a member of the People and Remuneration Committee and Digital Committee (from 6 April 2017) and during the year
was a member of the Audit and Governance Committee, and Risk and Compliance Committee (from 1 July 2016 to 5 April 2017). He is
Deputy Chair of Industry Super Australia Pty Ltd, Deputy Chair of IFM Investors and a director of Greg Combet Pty Ltd. He also holds a
number of consultancy roles. Mr Combet held various cabinet, ministerial, and parliamentary roles within the Australian Government
from 2007 to 2013 and was formerly Secretary of ACTU and a director of AustralianSuper. He is Patron of the Black Lung Victims Group.
Cheryl Bart AO – Non Executive Director
Director since July 2016
Ms Bart is Chair of the Digital Committee (from 1 April 2017) and is a member of the Risk and Compliance Committee. She is currently
a non-executive director of SG Fleet Ltd, Audio Pixels Holding Ltd, Invictus Games Sydney 2018, Football Federation Australia (FFA)
and Ted X Sydney and is Trustee of The Prince's Trust Australia. She has a diverse director portfolio background, chairing both committees
and boards across the utilities, funds management, auto-finance and leasing, broadcasting, technology and infrastructure sectors. Previous
non-executive directorships include Chair of ANZ Trustees Ltd, and a director of Environment Protection Authority, South Australian Film
Corporation, Spark Infrastructure Ltd, and Australian Broadcasting Corporation.
Page 2

Members Equity Bank Limited
Directors' report
for the financial year ended 30 June 2017
Elana Rubin - Non-Executive Director
Director since October 2016
Ms Rubin is a member of the Digital Committee and People and Remuneration Committee (from 1 January 2017). She is currently a
director of Mirvac Group, Afterpay Touch Group, Transurban Queensland, Victorian Funds Management Corporation, LaunchVic
and Victorian Managed Insurance Authority. Ms Rubin has over 20 years' experience as a non-executive director on private,
government and not-for-profit boards, and is a member of several advisory boards in investment property and public policy. Previous
non-executive directorships include Chair of AustralianSuper, director of TAL, MLC Life and Administrator, and SecondBite.
John Nesbitt - Non Executive Director
Director since February 2017
Mr Nesbitt is Chair of the Audit and Governance Committee (from 8 June 2017) and a member of the Risk and Compliance Committee
(from 5 April 2017). Effective 28 July 2017 Mr Nesbitt has been appointed Chairman of AMP Capital Funds Management Limited and
AMP Investment Services Pty Limited. Mr Nesbitt has a lengthy banking and broader financial services experience through his roles at
Suncorp as Chief Executive Officer Suncorp Banking and Wealth, and before that, Suncorp Chief Financial Officer. He has previously
been Chair of the Perpetual Superannuation Board and has had memberships of a number of other management and industry
representative boards.
Anne De Salis - Non Executive Director
Retired November 2016
Ms De Salis was a member of the People and Remuneration Committee and Digital Committee. She was during the year a director of
Super Consumers Centre and National Indigenous Pastoral Enterprises Board. Ms De Salis has a diverse career spanning the public
and private sectors, with considerable experience in financial services, and has held senior executive / director positions with AMP,
MBF Australia, the Commonwealth Treasury and the Office of the Prime Minister, Rt Hon Paul Keating.
Garry Weaven - Non Executive Director (Chairman from 6 February 2015 to 31 December 2015)
Retired December 2016
Mr Weaven was a member of the People and Remuneration Committee. He is the Chairman of Industry Super Holdings Pty Ltd (ISH)
and other entities in the ISH Group, including IFM Holdings and IFM Investors, and is a director of the New Daily. Mr Weaven's
background includes periods as Chairman of Pacific Hydro, Assistant Secretary of the Australian Council of Trade Unions (ACTU), and
Senior Consultant to Westpac Financial Services.
Company Secretary
Isobel Rogerson
Ms Rogerson was appointed Company Secretary in June 2010 following a year in the role of Assistant Company Secretary. Prior to
joining the Company Ms Rogerson had worked in various roles at UBS Australia, and prior to that in the Wealth Management division
of the National Australia Bank. Ms Rogerson is a lawyer by training and worked in private practice for a number of years before moving
into financial services.
Board Responsibilities
The primary role of the Board is to protect the rights and interests of the Company and to create value for its shareholders and their
members having due regard to the interests of other stakeholders. The Board is ultimately responsible for the overall corporate
governance of the Company, including monitoring the business of the Company on behalf of the shareholders.
This includes:
• appointing and, if necessary, removing the Chief Executive Officer (CEO);
• reviewing and approving the business plan and budget;
• providing strategic direction to the Company by engaging with the CEO in the development and oversight of the execution of the
business plan and budget;
• monitoring performance against the business plan and budget and reviewing that performance with the CEO;
• setting the Company’s risk appetite and ensuring the Company has in place an appropriate risk management framework and
processes which support that appetite and within which management must operate;
• approving any major corporate initiatives;
• ensuring that management decisions are consistent with delegated authorities and the interests of shareholders;
• overseeing the integrity of the Company’s accounting and corporate reporting, including the external audit;
• monitoring the effectiveness of the Company's governance practices;
• assisting the CEO in creating the desired staff culture;
• fostering an environment of innovation and deep customer understanding;
• ensuring the Company’s shareholders are provided with the appropriate information in a timely manner;
• overseeing the appointment, and when necessary replacement of other senior executives;
• supporting the CEO in nurturing staff and developing succession plans;
• approving the remuneration framework; and
• performing such other functions as are prescribed by law or are assigned to the Board.
Page 3
Members Equity Bank Limited
Directors' report
for the financial year ended 30 June 2017
The Board meets regularly and follows meeting protocols designed to ensure all directors are appropriately informed and properly
consider all agenda items.
Role of CEO
The responsibility for the execution and administration of operations is delegated by the Board to the CEO. The CEO is responsible for
the leadership and management of the Group, and for the implementation of ME's strategic direction. The CEO manages in
accordance with the Authorities and Delegations Policy and the other policies approved by the Board from time to time.
Board Committees
To provide for the effective discharge of its corporate governance responsibilities and oversight responsibilities, the Board has
established Board Committees. During the year the following Committees were in place:
Audit and Governance Committee
The Audit and Governance Committee's purpose is to:
• assist the Board by providing an objective view of the effectiveness of the Company’s financial reporting framework and overall
internal control framework;
• review the development of and recommend to the Board corporate governance policies and principles applicable to the Company.
The Committee oversees:
• financial reporting policies and controls;
• compliance with applicable accounting standards to give a true and fair view of the financial position and performance of the
Company;
• the integrity of the Company's financial statements;
• the appropriateness of the accounting judgments or choices exercised by management in preparing the financial statements;
• compliance with Australian Prudential Regulation Authority’s statutory reporting requirements;
• the effectiveness of the Company’s risk management framework;
• the recommendation for appointment or removal, and annually reviewing the performance and independence of the Company's
external auditor;
• the adequacy, independence and performance of the Company's Internal Audit function;
• the appointment or if necessary removal of the Head of the Internal Audit function.
The Committee is comprised of independent non-executive directors. During the period, the Committee was chaired by Ms Christian (1
July 2016 to 7 June 2017) and by Mr Nesbitt (from 8 June 2017).
Risk and Compliance Committee
The Risk and Compliance Committee's purpose is to provide objective oversight of the implementation and operation of the Company's
risk management framework.
The Committee is responsible for:
• advising the Board on the Company’s overall current and future risk appetite and risk management strategy;
• approval of the design, implementation and review of risk management and internal compliance and control systems throughout
the Company;
• promotion of a sound risk management culture which takes account of the Company’s strategic plan and achieves a balance
between risk minimisation and reward for risks accepted.
The Committee is comprised of independent non-executive directors. During the period, the Committee was chaired by Ms Christian.
People and Remuneration Committee
The People and Remuneration Committee's purpose is to:
• provide counsel, guidance and oversight of strategic people, cultural and remuneration matters - including strategies, policies and
frameworks - which have an enterprise impact and support the Company in achieving its short and long term business objectives
while meeting its social licence to operate;
• make recommendations to the Board in connection with the fitness and propriety of directors.
The Committee is responsible for:
• reviewing and overseeing any matters affecting the capability and organisational culture of the Company;
• reviewing the Company's recruitment, retention and termination practices and overseeing the annual talent review process and
succession planning for Executives and senior leaders;
• receiving updates on proposed changes to organisational structure to support the workplace of the future;
• overseeing the development and application of the Company's Diversity and Inclusion approach and approving targets for achieving
diversity and inclusion;
• reviewing the Company's workplace and industrial relations strategies, policies and processes;
• the effectiveness of the Company's Workplace Health and Safety practices;
Page 4

Members Equity Bank Limited
Directors' report
for the financial year ended 30 June 2017
• the Company's Remuneration Policy;
• reviewing and approving the process for the oversight and evaluation of the Board, Board Committees, and directors.
The Committee is comprised of independent non-executive directors. During the period, the Committee was chaired by Mr Hodgson.
Digital Committee
The Digital Committee's purpose is to:
• oversee the end-to-end digital delivery of the Company's products and services;
• monitor the development and implementation of the IT strategy, the alignment of the IT function with the Company's business;
• receive regular reporting on the digital ecosystem and customer experience;
• monitor the investment in the IT architecture, infrastructure and support systems to underpin the safe, secure and effective
delivery of the Company's products and services.
The Committee is responsible for:
• receiving updates and demonstrations about emerging technologies and trends and their potential impact on the Company;
• receiving reports, and providing feedback on, the Company's technology strategy;
• overseeing the Company's strategies of outsourcing of material technology services;
• receiving regular reporting on the customer experience delivered by the Company's digital eco-system;
• overseeing reporting on the Company's technological investment and expenditure, including the Program of Works;
• reviewing the performance of the IT department against the strategy;
• reviewing key technology risks and associated strategies and making recommendations to the Risk and Compliance Committee;
• overseeing the effectiveness of disaster recovery plans and disaster recovery testing.
The Committee is comprised of independent non-executive directors. During the period the Committee was chaired by Mr Milne (from 1
July 2016 to 31 March 2017), and on the commencement of Mr Milne's leave of absence, by Ms Bart (from 1 April 2017).
Nominations Committee
The Nominations Committee's purpose is to make recommendations to the Board in respect of the appointment of new directors. It
meets on an as needs basis, and met during the period for the purpose of conducting interviews for the appointment of new directors.
The Committee is comprised of independent non-executive directors, and two representatives of the Company's four largest
shareholders. During the period, the Committee was chaired by Mr Hodgson.
Board Performance
The Board meets on a regular basis to address relevant operational and strategic issues affecting the Company. A program is in place
for annual self evaluation of performance by the Board and each of its Committees. A self evaluation of each of the Risk and
Compliance Committee and Audit and Governance Committee was undertaken in FY17. A self-evaluation of the performance of each
of the People and Remuneration and Digital Committee was not completed in FY17 due to changes in composition of the Committees
(with the departures of Ms De Salis and Mr Weaven). The Nominations Committee did not undertake an evaluation.
The Chairman conducted one-on-one discussions with all Directors. The Board did not conduct a self-evaluation during FY17
but plans to conduct an external evaluation during FY18.
Board attendance 1 July 2016 to 30 June 2017
C Bart
C Christian
G Combet
A De Salis
K Hodgson
J Milne
J Nesbitt
E Rubin
G Weaven
The directors attended a Board Strategy Day on 16 February 2017.
8
11 6 6
Held Eligible
11 11
11 11
11 11
Attn'd
11
7
5
11 8
Board
Meetings
9
11
11
511 5
11 11
11 8
11 5
Page 5

Members Equity Bank Limited
Directors' report
for the financial year ended 30 June 2017
Board Committee attendance 1 July 2016 to 31 December 2016
C Bart
C Christian
G Combet
A De Salis
K Hodgson
J Milne
E Rubin
G Weaven
Board Committee attendance 1 January 2017 to 31 March 2017
C Bart
C Christian
G Combet
K Hodgson
J Milne
J Nesbitt
E Rubin
Board Committee attendance 1 April 2017 to 30 June 2017
C Bart
C Christian
G Combet *
K Hodgson
J Milne
J Nesbitt
E Rubin
* Eligible for one meeting only.
Disclosures by directors
The Board has established procedures for handling matters that may compromise (or be perceived to compromise) the independence
and integrity of the Board.
Remuneration of directors and key management personnel
The names, details and aggregate remuneration of directors and key management personnel are set out in Note 28 to the financial
statements.
In determining appropriate levels of key management personnel remuneration, the People and Remuneration Committee may engage
an external consultant to provide independent advice, to ensure that the compensation is set competitively compared to the market.
1 y 1
2 y 2 2 y 2 - n/a - - n - - n -
- n - - n - - n/a -
2 y 1- y -
2 y 2
1 y 1
- n - - n - - n/a - - n - - n -
2 y 2 - n -
1 y 1
2 y 2 2 y 1 - n/a - 2 y 1 - n -
- n - - n - - n/a -
2 y 1
2 y 2
- n -- n - 2 y 2 - n/a -
Committee Committee Committee Committee Committee
Held Member Attn'd Held Member Attn'd Held Member Attn'd Held Member Attn'd Held Member Attn'd
People & Remuneration Digital Nominations Risk & Compliance Audit & Governance
- n - 1 y 1
1 y 1 1 y 1 - n/a - - n - - n -
- n - - n - - n/a -
1 y 1
1 y 0 1 y 1 - n/a - - n - - n -
1 y 1 - n - - y -
1 y 1- n/a -
1 y 1
1 y 1
- n - - n - - n/a - 1 y 1 1 y 1
- n - - n -
1 y 1 - n -
Held Member Attn'd
- n - 1 y 0 - n/a -
n -
Held Member Attn'd Held Member Attn'd
People & Remuneration Digital Nominations
Held Member Attn'd Held Member Attn'd
Risk & Compliance Audit & Governance
Committee Committee Committee Committee Committee
3 y 3 - n - - n - - n - -
- n -
Audit & Governance
Committee
- n -
3 y 3
- n -
3 y 3
Held Member Attn'd
- n -
3 y 3
Held Member Attn'd Held Member Attn'd Held Member
3y3
Attn'd
- 3 y
3
3 y 3 4
- 4
-n--n-
3 y 3
3 y3
- n -
3
2
Committee Committee Committee Committee
Held Member Attn'd
Digital Nominations Risk & Compliance
- n
People & Remuneration
y 3 - n
-
y
y 4 - n
n - 3 y3 y 3 -
3 3
y3-n--n
-
- n
3 3 y
-
- n - - n - - n - - n -
- n - 4 y 4
Page 6

Members Equity Bank Limited
Directors' report
for the financial year ended 30 June 2017
Remuneration Framework - Employees
The Company aims to provide remuneration to attract, motivate and retain employees to achieve the Company’s purpose and overall
objectives within its risk appetite and risk framework. The following guiding principles are the foundation of the Company’s
remuneration approach.
The Company uses a range of different remuneration elements to effectively reward employees. To ensure fair reward, the Company
references market competitive practices to determine which, and how, remuneration elements are used for different jobs.
Fixed pay
Fixed pay consists of salary (including packaged items) and superannuation contributions. It reflects the market competitive value of
the skills, expertise and experience required to successfully fulfil the requirements of a job at the Company. The target fixed pay
position is the median of the financial services market. Fixed pay reviews are conducted annually and adjustments are in accordance
with the Enterprise Agreement.
Short-Term Incentives (STI)
Short-term incentives reflect the relative performance of an employee within his or her job at the Company and the overall performance
of the organisation. It is the main mechanism the Company uses to reward and differentiate individual performance. The STI
opportunity that is available is linked to the size of the role the individual performs. The main STI program at the Company is the
Annual Bonus.
The Annual Bonus encompasses most employees. Where appropriate, the Board approves an Annual Bonus pool that reflects the
performance of the Company. Incentives are then allocated to employees based on individual performance. Employees with higher
performance ratings receive higher incentive payments relative to their peers. Some employees do not receive an incentive due to their
performance. Incentive amounts are provided on a pro-rata basis for those who have not worked the full year but who have worked at
least 3 months in the year, or work part time. Employees who leave during the year due to retirement or death may be allocated a
pro-rata payment based on their service and performance during the financial year.
Sales Incentive Programs are provided for sales-focused employees instead of the Annual Bonus. These programs reward sales results
achieved within the appropriate risk and values frameworks.
Long Term Incentives (LTI)
An LTI arrangement is in place for the CEO only.
Remuneration Framework - Directors
Non-executive directors of the Company are remunerated by way of one base fee (inclusive of the Superannuation Guarantee Charge
payment, at 9.5% for the period). During the year the Non-Executive Director Remuneration Policy was updated to provide for the fee to
be up to 60% (previously 50%) of the median level of non-executive director fees paid by Bendigo and Adelaide Bank Limited and
Bank of Queensland Limited (effective 1 July 2017).
In addition to the base fee, non-executive directors who participate on Board Committees may receive additional remuneration as
compensation for the additional responsibilities and workload.
Link remuneration to the generation of sustainable value for the organisation and its
Remuneration at the Company will; Because it will…
Support the strategy • Encourage performance and behaviours that contribute to the overall achievement of
governance • Encourage behaviours that support the risk management framework.
• Encourage actions clearly focused on the Company's long-term financial soundness.
competitive.
Be transparent Be structured in remuneration programs that are clearly defined, simple to understand
and clearly communicated.
Differentiate performance Motivate employees to be high performers who deliver strong sustainable results by
differentiating remuneration for performance, reflecting individual, team and organisational
the long-term business strategy of the Company.
•
performance.
Embed risk awareness and good • Encourage prudent risk taking within the Company's risk appetite.
shareholders.
Align to our values Encourage performance and behaviours that are consistent with the values and culture
of the Company.
Be fair Attract, motivate and retain high performers by providing remuneration that is market
Page 7


Liability limited by a scheme approved under Professional Standards Legislation.
Member of Deloitte Touche Tohmatsu Limited Page 9
Deloitte Touche Tohmatsu
ABN 74 490 121 060
550 Bourke Street
Melbourne VIC 3000
GPO Box 78
Melbourne VIC 3001 Australia
Tel: +61 3 9671 7000
Fax: +61 3 9671 7001
www.deloitte.com.au
7 September 2017
The Board of Directors
Members Equity Bank Limited
Level 28, 360 Elizabeth Street
MELBOURNE VIC 3000
Dear Board Members
Members Equity Bank Limited
In accordance with section 307C of the Corporations Act 2001, I am pleased to provide the following
declaration of independence to the directors of Members Equity Bank Limited.
As lead audit partner for the audit of the financial statements of Members Equity Bank Limited for
the financial year ended 30 June 2017, I declare that to the best of my knowledge and belief, there
have been no contraventions of:
(i) the auditor independence requirements of the Corporations Act 2001 in relation to the
audit; and
(ii) any applicable code of professional conduct in relation to the audit.
Yours sincerely
DELOITTE TOUCHE TOHMATSU
Mark Stretton
Partner
Chartered Accountants


Members Equity Bank Limited
Statement of profit or loss and other comprehensive income
for the financial year ended 30 June 2017
Interest and similar income
Interest and similar expense
Net interest income
Funds management fee income
Other operating income
Total net operating income
Expenses
Operating expenses
Impairment losses
Project expenses
Loss on sale of commercial loans and asset finance portfolios
Total expenses
Profit before income tax
Income tax expense
Profit for the year
Other comprehensive income
Items that will not be reclassified subsequently to
profit or loss
Items that may be reclassified subsequently to
profit or loss
Net fair value gain on available-for-sale financial assets,
net of tax
Cash flow hedges - effective portion of changes in fair
values, net of tax
Total comprehensive income for the year
Notes to the financial statements are included on pages 18 to 58.
45,361 (4,413) 38,601 (2,889)
68,432
(513) (2,010)
61,856 76,832
- - - -
(513) (2,010)
74,959
6
5
5
5
5,952
374,402
231,085
8,902
5
13,773
32,124
32,393
5
136,295
14,144
45,533
227,525 233,845
1,173,219
Notes
5 1,161,628 1,221,621
(825,302)5
$'000 $'000
5
96,573
282,591
106,520 70,060
15,012 32,393
Consolidated
2017
230,186
13,771 14,144
222,105
1,114,725
Company
2017 2016
$'000$'000
379,164
128,901
20,764
2016
10,354
370,473
259,342
28,895
103,854
28,141
8,902 -
(963,595)
209,624
106,704 70,409
286,153 263,001
88,249 107,472
26,393
314,586
(892,620)(907,035)
336,326
363,196
24,671
30,640
15,012
-
Page 14

Members Equity Bank Limited
Statement of financial position
as at 30 June 2017
Assets
Cash and cash equivalents
Investments
Derivatives
Trade and other receivables
Loans and advances
Investment in controlled entities
Plant and equipment
Intangible assets
Deferred tax assets
Other assets
Total assets
Liabilities
Deposits and other borrowings
Derivatives L
Trade and other payables
Current tax liabilities
Provisions
Subordinated debt
Total liabilities
Net assets
Equity
Issued capital
Reserves
Retained earnings
Total equity
Book value per share
Notes to the financial statements are included on pages 18 to 58.
Company
252,270
$'000
86,343
$'000
2017
22,583,561
14,555 32,892
8,330
102 102
2016
2,826,801 3,003,183
89,336
19,583,112
29,829
11,082 4,172
221,855
807,921
24,132,279 21,591,935
25,860 22,106
20,658
22,042,595
26,482 26,446
333,236 332,760
24,538,515
69,348
1,109,863 963,344
Notes
24(a)
7
16
6
14
8
10
13
9
12
16
15 24,410,231
83,620
19,098 7,246
19,534,241
25,648,378 23,005,939
9,513 9,170
8,330
807,921
21
235,211
963,344
10,780
17
1,109,863
6
20 767,922
18
19
767,922
332,760
22,237,443
(26,433)
291,162
- -
965,952
6,792
1,112,655
24,823,546
87,851
949 -
25,721 20,081
26,482 26,446
333,236
26,927
3,064,159
4,661
(37,181)
297,942
1,112,655 965,952
23,203,395
21,770,305
25,936,201
100.73$ 91.35$
Consolidated
2017 2016
$'000 $'000
8,969 8,422
14,557 32,893
2,981,442
29,829
22,503,585
- -
11,331
89,336 83,620
312,646 440,054
6,005 5,516
Page 15

Members Equity Bank Limited
Statement of changes in equity
for the financial year ended 30 June 2017
Balance at 1 July 2015
Issue of share capital
Transfer to/(from) general reserve for
credit losses
Other comprehensive income for the year
Profit for the year
Balance at 30 June 2016
Balance at 1 July 2016
Issue of share capital
Transfer to/(from) general reserve for
credit losses
Other comprehensive income for the year
Profit for the year
Balance at 30 June 2017
Notes to the financial statements are included on pages 18 to 58.
21
767,922
39,999
- -
Notes
Notes
20
21
20
21
20
21
20
767,922 235,211 18,332
$'000 $'000
-
147,847 17,381
159,330
$'000
807,921
(951) 951 - - -
(951) 951 - - -
-
-
-
875 (875) - - -
767,922
-
-
-
807,921
-
(875)
-
729,995
37,927
729,995
37,927
-
-
-
767,922
-
-
-
39,999
capital
-
61,856
Retained for credit
Consolidated
Company
Issued
-
235,211
875
17,457 2,722 (13,387)
857,616
297,942
Issued
capital
$'000
- -
-
-
44,848
76,832
-
-
1,112,655
37,927
Total
(4,899)
$'000
855,357
39,999
74,959
963,344
-
3,235
45,361
61,856
earnings
General
reserve
$'000
37,927 - -
reserve
-
18,332
-
-
Cash flow
17,381 5,245 (54,335)
3,235 (58,748) 965,952
(6,423)(2,010) (4,413)
-
(513)
-
- -
(58,748)
76,832
965,952
39,999
- 68,432
General
reserve
Retained
earnings
for credit revaluation hedge
$'000 $'000
Cash flowInvestment
losses reserve reserve
$'000
losses
Total
$'000$'000
- - (513) 38,601 38,088
- -
- -
- - -
221,855
291,162 17,457 2,722 (9,399) 1,109,863
68,432 - -
-
963,344
74,959 -
18,332
221,855 18,332 3,235 (48,000)
(2,010) (2,889)
3,235 (48,000)
Investment
5,245 (45,111)
$'000
- -
hedge
reserve
revaluation
Page 16

Members Equity Bank Limited
Statement of cash flows
for the financial year ended 30 June 2017
Cash flows from operating activities
Profit before tax
Adjustments for:
Change in operating assets
Change in operating liabilities
Non-cash items included in profit before tax
Income tax payments
Net cash provided/(used in) by operating activities
Cash flows from investing activities
Purchase of plant and equipment
Purchase of intangible assets
Proceeds from sale of plant and equipment
Dividends received
Net cash used in investing activities
Cash flows from financing activities
Proceeds from issue of shares
Net cash provided by financing activities
Net increase in cash
Cash and cash equivalents at the beginning of the
financial year
Cash and cash equivalents at the end of the
financial year
Notes to the financial statements are included on pages 18 to 58.
(26,329)
(1,952,870)
1,883,163
59,704
(25,723)
67,125
(23,435)
(20,422)
(143,972) 71,746 56,884
2,200 - - 2,500
-
(950)
- 110 110
(28,321)(30,521)
24(a)
39,999
39,999
39,999 37,927
(127,408) 79,152 (165,927)
312,646 440,054
252,270
20 39,999
440,054
86,343
37,927
Notes
13
12
(184,991)
24(c)
24(d)
24(e)
(2,920,054)
88,249 96,573
(22,485) (20,422) (22,485)
2,647,037
(10,209)
Company
2017 2016
$'000 $'000
Consolidated
2017 2016
$'000 $'000
107,472 103,854
(2,870,708)
37,927
185,780 360,902
(20,935)
(23,807)
(950) (10,209)
(26,127)
2,546,859
68,412
(1,935,676)
1,851,739
60,774
37,927
252,270
66,490
Page 17

Members Equity Bank Limited
Notes to the financial statements
for the financial year ended 30 June 2017
1 General information
Members Equity Bank Limited ("the Company") is a public company incorporated in Australia. The principal activities of the Company and
its subsidiaries ("the Group") are: provision of banking services under a banking licence; funding, management, and servicing of
residential, and consumer lending portfolios; and carrying out associated funding activities for off balance sheet portfolios.
2 Application of new and revised Accounting Standards
(i) New and revised Australian Accounting Standards affecting amounts reported and/or disclosures in the financial statements
In the current year, the Group has applied the Accounting Standards issued by the Australian Accounting Standards Board (AASB),
that are mandatorily effective for an accounting period that begins on or after 1 July 2016, and therefore relevant for the year ended
30 June 2017.
The application of these amendments does not have any material impact on the disclosures or the amounts recognised in the Group's
consolidated financial statements.
Standards affecting presentation and disclosure
AASB 1057 Application of Australian Accounting These Standards effectively move Australian specific application
Standards, AASB 2015-9 Amendments to Australian paragraphs from each Standard into a combined Standard. The
Accounting Standards – Scope and Application Standards have no impact on the application of individual
Paragraphs standards.
AASB 2014-4 Amendments to Australian Amends AASB 116 Property, Plant and Equipment and AASB 138
Accounting Standards – Clarification of Acceptable Intangible Assets to provide additional guidance on how the
Methods of Depreciation and Amortisation depreciation or amortisation of property, plant and equipment and
intangible assets should be calculated.
The amendments to AASB 116 explain that a depreciation method
applied to property, plant and equipment that is based on revenue
that is generated by an activity that includes the use of the asset
is not appropriate.
The amendments to AASB 138 introduce a rebuttable
presumption that an amortisation method for an intangible asset
that is based on the revenue generated by the activity that
includes the use of the intangible asset is inappropriate, and
provides guidance when the rebuttable presumption can be
overcome.
AASB 2014-9 Amendments to Australian Amends AASB 127 Separate Financial Statements, to allow an
Accounting Standards – Equity Method in Separate entity to account for investments in subsidiaries, joint ventures
Financial Statements and associates in its separate financial statements:
- At cost
- In accordance with AASB 9 Financial Instruments (or, if
AASB 9 is not applied, AASB 139 Financial Instruments:
Recognition and Measurement), or
- A newly introduced option of using the equity method as
described in AASB 128 Investments in Associates and Joint
Ventures.
The accounting policy option must be applied for each category
of investment.
AASB 2015-1 Amendments to Australian Key amendments include:
Accounting Standards – Annual Improvements to - AASB 5 Non-current Assets Held for Sale and Discontinued
Australian Accounting Standards 2012-2014 Cycle Operations – clarifies that when an entity reclassifies an
asset (or disposal group) directly from held for sale to held
for distribution to owners (or vice versa), such a
reclassification is not treated as a change to a plan of sale (or
distribution to owners).
- AASB 7 Financial Instruments: Disclosures – provides
Page 18

Members Equity Bank Limited
Notes to the financial statements
for the financial year ended 30 June 2017
2 Application of new and revised Accounting Standards (continued)
additional application guidance on the concept of continuing
involvement for the purposes of disclosures required by the
standard, and removes the requirement to provide
disclosures relating to offsetting financial assets and
financial liabilities in interim financial reports.
- AASB 119 Employee Benefits – clarifies the discount rate to
adopt in a regional market sharing the same currency (for
example, the Eurozone) by requiring that the depth of the
market for high quality corporate bonds should be assessed
at a currency rather than country level.
- AASB 134 Interim Financial Reporting – clarifies that certain
information required by the Standard can be given either in
the interim financial statements or incorporated by
cross-reference from the interim financial statements to
some other statement (such as management commentary or
risk report) that is available to users of the financial
statements on the same terms as the interim financial
statements and at the same time.
AASB 2015-2 Amendments to Australian Amends AASB 101 Presentation of Financial Statements to
Accounting Standards – Disclosure Initiative: provide clarification regarding the disclosure requirements in
Amendments to AASB 101 AASB 101, including narrow-focus amendments to address
concerns about existing presentation and disclosure
requirements and to ensure entities are able to use judgements
when applying a Standard in determining what information to
disclose in their financial statements.
The amendments provide additional guidance in the following areas:
- Materiality. The amendments clarify that (1) information
should not be obscured by aggregating or by providing
immaterial information (2) materiality considerations apply to
all parts of the financial statements and (3) even when a
standard requires a specific disclosure, materiality
considerations still apply, i.e. specific disclosure is not
required to be included in the financial report if it is not
material to the entity.
- Statement of financial position and statement of profit or loss
and other comprehensive income. The amendments (1)
introduce a clarification that the list of line items to be
presented in these statements can be disaggregated and
aggregated as relevant and provide additional guidance on
subtotals in these statements and (2) clarify that an entity's
share of other comprehensive income (OCI) of
equity-accounted associates and joint ventures should be
presented in aggregate as single line items based on
whether or not it will subsequently be reclassified to profit
or loss.
- Notes. The amendments add additional examples of possible
ways of ordering the notes to clarify that understandability
and comparability should be considered when determining
the order of the notes rather than being presented in the
order previously included in AASB 101.
Page 19

Members Equity Bank Limited
Notes to the financial statements
for the financial year ended 30 June 2017
2 Application of new and revised Accounting Standards (continued)
(ii) Standards and Interpretations in issue not yet adopted
The Group has assessed the impact of the following Standards and Interpretations and has concluded that there will be no
material impact on its future financial statements.
Effective for annual Expected to be initially
reporting periods applied in the financial
Standard/Interpretation beginning on or after year ending
AASB 2016-1 Amendments to Australian Accounting Standards – 1 January 2017 30 June 2018
Recognition of Deferred Tax Assets for Unrealised Losses
AASB 2016-2 Amendments to Australian Accounting Standards – 1 January 2017 30 June 2018
Disclosure Initiative: Amendments to AASB 107
At the date of approval of the financial statements, the Standards and Interpretations listed below were in issue but not yet
effective. The Group has assessed the impact of the following Standards and Interpretations and has concluded that they have
no material impact on its future financial statements.
Effective for annual Expected to be initially
reporting periods applied in the financial
Standard/Interpretation beginning on or after year ending
AASB 9 Financial Instruments, AASB 2010-7 Amendments to 1 January 2018 30 June 2019
Australian Accounting Standards arising from AASB 9 (December
2010), AASB 2014-1 Amendments to Australian Accounting
Standards (Part E – Financial Instruments), AASB 2014-7
Amendments to Australian Accounting Standards Arising From
AASB 9 (December 2014)
One of the key new requirements under AASB 9 'Financial Instruments' relates to a new impairment model based on expected
credit losses mainly impacting the Group’s Loans and Advances balances carried at amortised cost. The loan loss allowance
(individual and collective impairment as referred in Note 9) will be for either 12-month expected losses or lifetime expected
losses. The latter applies if credit risk has increased significantly since initial recognition of the financial instrument. AASB 9
Financial Instruments' is not mandatorily effective until 1 July 2018 and the Group does not intend to early adopt the standard.
The Group has established a cross functional project team which is in the process of building and testing the models, assembling
data and calibrating the impairment stage transfer criteria. The project team is in the process of beginning to build models for the
purposes of parallel runs. Based on an analysis of the Group’s financial assets and financial liabilities as at 30 June 2017 on the
basis of the facts and circumstances that exists at that date, the directors of the Company have performed a preliminary
assessment of the impact of AASB 9 'Financial Instruments' to the Group's consolidated financial statements. However, given
the additional work still required to be performed on the models and that the facts and circumstances, particularly the impact of
forward looking macro-economic information, can change between now and the implementation date this estimate is not
considered a reasonable estimate of the potential impact of AASB 9 'Financial Instruments'. The expectation is such that the
impairment provision would increase under AASB 9 'Financial Instruments'.
AASB 15 Revenue from Contracts with Customers, AASB 2014-5 1 January 2018 30 June 2019
Amendments to Australian Accounting Standards arising from
AASB 15, AASB 2015-8 Amendments to Australian Accounting
Standards – Effective Date of AASB 15, and AASB 2016-3
Amendments to Australian Accounting Standards - Clarification to
AASB 15
Interpretation 22 Foreign Currency Transactions and Advance 1 January 2018 30 June 2019
Consideration
AASB 16 Leases 1 January 2019 30 June 2020
Page 20
Members Equity Bank Limited
Notes to the financial statements
for the financial year ended 30 June 2017
3 Significant accounting policies
Statement of compliance
These financial statements are general purpose financial statements which have been prepared in accordance with the
Corporations Act 2001, Accounting Standards and Interpretations, and comply with other requirements of the law. The financial
statements comprise the consolidated financial statements of the Group and the Company. For the purposes of preparing the
consolidated financial statements, the Company is a for-profit entity. Accounting Standards include Australian Accounting
Standards. Compliance with Australian Accounting Standards ensures that the financial statements and notes of the Group comply
with International Financial Reporting Standards ('IFRS').
The financial statements were authorised for issue by the directors on 7 September 2017.
Basis of preparation
The financial report has been prepared on the basis of historical cost, except for investments and derivative financial
instruments, which have all been measured at fair value. Cost is based on the fair values of the consideration given in
exchange for assets. All amounts are presented in Australian dollars.
Fair value is the price that would be received to sell an asset or paid to transfer a liability in an orderly transaction between market
participants at the measurement date, regardless of whether that price is directly observable or estimated using another valuation
technique. In estimating the fair value of an asset or a liability, the Group takes into account the characteristics of the asset or
liability if market participants would take those characteristics into account when pricing the asset or liability at the measurement
date. Fair value for measurement and/or disclosure purposes in these consolidated financial statements is determined on such a
basis.
The Company is a company of the kind referred to in ASIC Corporations (Rounding in Financial/Directors' Reports) Instruments 2016/191,
dated 24 March 2016, and in accordance with that Corporations Instrument amounts in the financial report are rounded off to the nearest
thousand dollars, unless otherwise indicated.
The amendments to the Corporations Act 2001 in June 2010 removed the requirement to prepare parent entity financial statements
where consolidated financial statements are prepared. However, the Company has complied with ASIC Class Order [CO 10/654] to
include parent entity financial statements in the financial reports.
Comparative information has been restated to accord with changes in presentations made in the current year, except where
otherwise stated.
(a) Basis of consolidation
The financial information in the consolidated financial statements includes the parent company, Members Equity Bank Limited,
together with its consolidated subsidiaries, including structured entities controlled by the Company (see Note 10).
Subsidiaries
Subsidiaries are investees controlled by the Company. The Company controls an investee if it is exposed to, or has rights to,
variable returns from its involvement with the investee and has the ability to affect those returns through its power over the
investee. The financial statements of subsidiaries are included in the consolidated financial statements from the date on which
control commences until the date when control ceases.
Loss of control
When the Company loses control over a subsidiary, it derecognises the assets and liabilities of the subsidiary, and any related
non-controlling interest and other components of equity. Any resulting gain or loss is recognised in profit or loss. Any interest
retained in the former subsidiary is measured at fair value when control is lost.
Transactions eliminated on consolidation
Intra-group balances and transactions, and any unrealised income and expenses arising from intra-group transactions, are
eliminated in preparing the consolidated financial statements.
(b) Goods and services tax
Revenues, expenses and assets are recognised net of the amount of goods and services tax (GST), except:
(i) where the amount of GST incurred is not recoverable from the taxation authority, it is recognised as part of the cost of
acquisition of an asset or as a non-income tax expense; and
(ii) for receivables and payables which are recognised inclusive of GST. The net amount of GST recoverable from, or payable to,
the taxation authority is included as part of receivables or payables.
Page 21

Members Equity Bank Limited
Notes to the financial statements
for the financial year ended 30 June 2017
3 Significant accounting policies (continued)
Cash flows are included in the statement of cash flows on a gross basis. The GST component of cash flows arising from
investing and financing activities which is recoverable from, or payable to, the taxation authority is classified within operating cash
flows.
(c) Recognition of income and expenses
Revenue is recognised to the extent that it is probable that the economic benefits will flow to the Group and the revenue can be
reliably measured. The following specific recognition criteria must also be met before revenue is recognised.
Interest and similar income and expense
For all financial instruments measured at amortised cost and interest bearing financial assets classified as available-for-sale,
interest income or expense is recorded using the effective interest rate (EIR), which is the rate that exactly discounts estimated
future cash payments or receipts through the expected life of the financial instrument or a shorter period, where appropriate, to the
net carrying amount of the financial asset or financial liability. The calculation includes any fees or incremental costs that are
directly attributable to the instrument and are an integral part of the EIR, but not future credit loss.
Funds management fee income
Funds management fee income is recognised in accordance with the entitlement to fees for the management services provided.
Fee income
Fee income is generally recognised when the service has been provided.
Distribution from unit trusts
Distribution income is recognised on a receivable basis as of the distribution date for all securitisation funds of which the Company
is an income beneficiary.
Dividend income
Dividend income is recognised on a receivable basis as of the dividend declaration date by the subsidiaries.
(d) Income tax
Income tax expense comprises current and deferred tax. It is recognised in profit or loss except to the extent that it relates to items
recognised directly in equity or in other comprehensive income (OCI).
Current tax
Current tax comprises the expected tax payable or receivable on the taxable income or loss for the year and any adjustment to the
tax payable or receivable in respect of previous years. It is measured using tax rates enacted or substantively enacted at the
reporting date.
Deferred tax
Deferred tax is recognised on temporary differences between the carrying amounts of assets and liabilities in the consolidated
financial statements and the corresponding tax bases used in the computation of taxable profit. Deferred tax liabilities are generally
recognised for all taxable temporary differences. Deferred tax assets are generally recognised for all deductible temporary
differences to the extent that it is probable that taxable profits will be available against which those deductible temporary differences
can be utilised. Such deferred tax assets and liabilities are not recognised if the temporary difference arises from the initial
recognition (other than in a business combination) of assets and liabilities in a transaction that affects neither the taxable profit nor
the accounting profit. In addition, deferred tax liabilities are not recognised if the temporary difference arises from the initial
recognition of goodwill.
The carrying amount of deferred tax assets is reviewed at the end of each reporting period and reduced to the extent that it is no
longer probable that sufficient taxable profits will be available to allow all or part of the asset to be recovered.
Deferred tax assets and liabilities are measured at tax rates that are expected to apply in the period in which the liability is settled or
the asset realised, based on the tax rates (and tax laws) that have been enacted or substantively enacted by the end of the
reporting period. The measurement of deferred tax liabilities and assets reflects the tax consequences that would follow from the
manner in which the Group expects, at the end of the reporting period, to recover or settle the carrying amount of its assets and
liabilities.
Deferred tax liabilities and assets are offset when there is a legally enforceable right to set off current tax assets against current tax
liabilities and when they relate to income taxes levied by the same taxation authority and the Group intends to settle its current tax
assets and liabilities on a net basis.
Page 22

Members Equity Bank Limited
Notes to the financial statements
for the financial year ended 30 June 2017
3 Significant accounting policies (continued)
(e) Cash and cash equivalents
Cash comprises cash on hand and demand deposits. Cash equivalents are short-term, highly liquid investments that are readily
convertible to known amounts of cash and which are subject to an insignificant risk of changes in value. Cash and cash equivalents
are carried at amortised cost in the statement of financial position.
(f) Fair value measurement
The Group measures certain financial instruments, such as investments and derivatives, at fair value at each balance sheet date.
Fair value is defined as the price that would be received to sell an asset or paid to transfer a liability in an orderly transaction
between market participants at the measurement date. The fair value of instruments that are quoted in active markets is determined
using the quoted prices where they represent those at which regularly and recently occurring transactions take place.
If there is no quoted price in an active market, then the Group uses valuation techniques that maximise the use of relevant
observable inputs and minimise the use of unobservable inputs. The chosen valuation technique incorporates all of the factors that
market participants would take into account in pricing a transaction.
All assets and liabilities for which fair value is measured or disclosed in the financial statements are categorised within the fair value
hierarchy, described as follows, based on the lowest level input that is significant to the fair value measurement as a whole:
• Level 1 — Quoted (unadjusted) market prices in active markets for identical assets or liabilities;
• Level 2 — Valuation techniques for which the lowest level input that is significant to the fair value measurement is directly or
indirectly observable; and
• Level 3 — Valuation techniques for which the lowest level input that is significant to the fair value measurement is unobservable.
For assets and liabilities that are recognised in the financial statements on a recurring basis, the Group determines whether
transfers have occurred between levels in the hierarchy by re-assessing categorisation (based on the lowest level input that is
significant to the fair value measurement as a whole) at the end of each reporting period.
(g) Financial assets
Initial recognition and subsequent measurement
All financial assets are initially recognised on the trade date, i.e., the date the Group becomes a party to the contractual provisions
of the instrument, except for purchases or sales of financial assets that require delivery of assets within the time frame generally
established by the market concerned.
The classification of financial assets at initial recognition depends on the purpose for which the financial assets were acquired and
their characteristics. All financial assets are initially measured at their fair value plus transaction costs, except in the case of
financial assets recorded at fair value through profit or loss.
Investments
The Group has investments classified as available-for-sale investments and held-for-trading investments.
Available-for-sale investments include debt securities which are intended to be held for an indefinite period of time and which may
be sold in response to needs for liquidity or in response to changes in market conditions.
After initial measurement, available-for-sale investments are subsequently measured at fair value. Fair value is determined in the
manner described in Note 3(f). Unrealised gains and losses arising from changes in fair value are recognised in other
comprehensive income and accumulated in an 'Investment revaluation reserve'. When the investment is disposed of, the
cumulative gain or loss previously recognised in equity is recognised in the statement of profit or loss and other comprehensive
income. Interest earned whilst holding available-for-sale investments is reported as interest income using the EIR. The losses from
impairment of such investments are recognised in the statement of profit or loss and other comprehensive income.
Held-for-trading investments include debt securities which are intended to be held indefinitely as part of the liquidity coverage ratio
requirement by the APRA.
After initial measurement, held-for-trading investments are subsequently measured at fair value, with transaction costs
recognised in the statement of profit or loss and other comprehensive income as incurred. Subsequently they are measured at
fair value and any gains or losses are recognised in the statement of profit or loss and other comprehensive income as they
arise.
Page 23
Members Equity Bank Limited
Notes to the financial statements
for the financial year ended 30 June 2017
3 Significant accounting policies (continued)
Loans and receivables
Loans and receivables includes loans and advances to customers and trade and other receivables. Loans and receivables are
non-derivative financial assets with fixed or determinable payments that are not quoted in an active market. After initial
measurement, such financial assets are subsequently measured at amortised cost using the EIR method, less impairment.
Amortised cost is calculated by taking into account any discount or premium on acquisition and fees or costs that are an integral
part of the EIR. The EIR amortisation is included in interest income in the statement of profit or loss and other comprehensive income.
Derecognition of financial assets
The Group derecognises a financial asset only when the contractual rights to the cash flows from the asset expire, or it transfers
the financial asset and substantially all the risks and rewards of ownership of the asset to another entity. If the Group neither
transfers nor retains substantially all the risks and rewards of ownership and continues to control the transferred asset, the Group
recognises its retained interest in the asset and an associated liability for amounts it may have to pay. If the Group retains
substantially all the risks and rewards of ownership of a transferred financial asset, the Group continues to recognise the financial
asset and also recognises a collateralised borrowing for the proceeds received.
Impairment of financial assets
Financial assets, other than those at fair value through profit or loss, are assessed for indicators of impairment at least annually. A
financial asset or portfolio of financial assets is impaired and impairment losses are incurred if, and only if, there is objective
evidence of impairment as a result of one or more loss events that occurred after the initial recognition of the asset ("loss event")
and that loss event or events has had an impact on the estimated future cash flows of the financial asset or the portfolio that can be
reliably estimated.
Objective evidence that financial assets are impaired includes:
• significant financial difficulty of the borrower or issuer;
• default or delinquency by a borrower;
• the restructuring of a loan or advance by the Group on terms that the Group would not consider otherwise;
• indications that a borrower or issuer will enter bankruptcy; or
• the disappearance of an active market for a security.
The Group considers evidence of impairment for loans and advances at both a specific asset and a collective level. All individually
significant loans and advances are assessed for specific impairment. Those found not to be specifically impaired are then
collectively assessed for any impairment that has been incurred but not yet identified. Loans and advances that are not individually
significant are collectively assessed for impairment by grouping together loans and advances with similar risk characteristics.
In assessing collective impairment, the Group uses statistical modelling of historical trends of the probability of default, the timing of
recoveries and the amount of loss incurred, and makes an adjustment if current economic and credit conditions are such that the
actual losses are likely to be greater or lesser than is suggested by historical trends. Default rates, loss rates and the expected
timing of future recoveries are regularly benchmarked against actual outcomes to ensure that they remain appropriate.
For financial assets carried at amortised cost, the amount of the impairment is the difference between the asset’s carrying amount
and the present value of estimated future cash flows, discounted at the original effective interest rate.
The carrying amount of the financial asset is reduced by the impairment loss directly for all financial assets with the exception of
loans and advances where the carrying amount is reduced through the use of an allowance account. When a loan is uncollectible,
it is written off against the allowance account. Subsequent recoveries of amounts previously written off are credited against the
allowance account. Changes in the carrying amount of the allowance account are recognised in profit or loss.
In a subsequent period, if the amount of the impairment loss decreases and the decrease can be related objectively to an event
occurring after the impairment was recognised, the previously recognised impairment loss is reversed through profit or loss to the
extent the carrying amount of the investment at the date the impairment is reversed does not exceed what the amortised cost would
have been had the impairment not been recognised.
(h) Repurchase agreements
Securities sold under agreements to repurchase are retained within available-for-sale investments and are accounted for
accordingly in line with Note 3(g). Liability accounts are used to record the obligation to repurchase.
(i) Plant, equipment and leasehold improvements
Plant, equipment and leasehold improvements are stated at cost less accumulated depreciation and impairment. Cost includes
expenditure that is directly attributable to the acquisition or construction of the item. In the event that settlement of all or part of the
purchase consideration is deferred, cost is determined by discounting the amounts payable in the future to their present value as at
the date of acquisition.
Page 24

Members Equity Bank Limited
Notes to the financial statements
for the financial year ended 30 June 2017
3 Significant accounting policies (continued)
Depreciation is provided on plant and equipment. Depreciation is calculated on a straight-line basis so as to write off the net cost or
other revalued amount of each asset over its expected useful life to its estimated residual value. Leasehold improvements are
depreciated over the period of the lease or estimated useful life, whichever is the shorter, using the straight-line method. The
estimated useful lives, residual values and depreciation method are reviewed at the end of each annual reporting period, with the
effect of any changes recognised on a prospective basis.
The gain or loss arising on disposal or retirement of an item of plant and equipment is determined as the difference
between the sale proceeds and the carrying amount of the asset and is recognised in profit or loss.
The following useful lives are used in the calculation of depreciation:
Computer equipment 2 - 3 years
Furniture & equipment 4 - 10 years
Motor vehicles 3 years
(j) Intangible assets
Intangible assets are identifiable non-monetary assets without physical substance. They are recognised when the Group is able to
demonstrate its intention and ability to complete the development, use the software in a manner that will generate future economic
benefits, and can reliably measure the costs to complete the development.
All intangible assets are tested for impairment when there is an indication that an asset carrying amount may be greater than its
recoverable amount. The recoverable amount is determined using the market approach valuation methodology (refer Note 13).
Intangibles are stated at capitalised cost less accumulated amortisation and any accumulated impairment loss.
Core banking software
The core banking software relates to the software that performs the core operations of banking. For instance, recording of
transactions, interest calculations on loans and deposits, customer records, balance of payments and withdrawals.
Costs that are directly attributable to the acquisition and development of the core banking software are capitalised and amortised
over ten years, being the license term of the core banking system.
Other software
Other software includes costs of acquiring or internally developing software that is not core banking software. Other software is
amortised over a period of three to five years.
(k) Leasing
Leases are classified as finance leases whenever the terms of the lease transfer substantially all the risks and rewards of
ownership to the lessee. All other leases are classified as operating leases.
The Group as lessor
Amounts due from lessees under finance leases are recognised as receivables at the amount of the Group's net investment in the
leases. Finance lease income is allocated to accounting periods so as to reflect a constant periodic rate of return on the Group's
net investment outstanding in respect of the leases.
Rental income from operating leases is recognised on a straight-line basis over the term of the relevant lease. Initial indirect costs
incurred in negotiating and arranging an operating lease are added to the carrying amount of the leased asset and recognised on a
straight-line basis over the lease term.
The Group as lessee
Assets held under finance leases are initially recognised as assets of the Group at their fair value at the inception of the lease or, if
lower, at the present value of the minimum lease payments. The corresponding liability to the lessor is included in the statement of
financial position as a finance lease obligation.
Lease payments are apportioned between finance expenses and reduction of the lease obligation so as to achieve a constant rate
of interest on the remaining balance of the liability. Finance expenses are recognised immediately in profit or loss, unless they are
directly attributable to qualifying assets, in which case they are capitalised in accordance with the Group’s general policy.
Contingent rentals are recognised as expenses in the periods in which they are incurred.
Operating lease payments are recognised as an expense on a straight-line basis over the lease term, except where another
systematic basis is more representative of the time pattern in which economic benefits from the leased asset are consumed.
Contingent rentals arising under operating leases are recognised as expenses in the periods in which they are incurred.
Page 25

Members Equity Bank Limited
Notes to the financial statements
for the financial year ended 30 June 2017
3 Significant accounting policies (continued)
In the event that lease incentives are received to enter into operating leases, such incentives are recognised as a liability. The
aggregate benefit of incentives is recognised as a reduction of rental expense on a straight-line basis, except where another
systematic basis is more representative of the time pattern in which economic benefits from the leased asset are consumed.
(l) Employee benefits
Short-term and long-term employee benefits
A liability is recognised for benefits accruing to employees in respect of wages and salaries, annual leave and sick leave in the
period the related service is rendered.
Liabilities recognised in respect of short-term employee benefit, are measured at their nominal values using the remuneration rate
expected to apply at the time of settlement. Liabilities recognised in respect of long term employee benefits are measured as the
present value of the estimated future cash outflows to be made by the Group in respect of services provided by employees up to
reporting date.
Termination benefit
A liability for a termination benefit is recognised at the earlier of when the Group can no longer withdraw the offer of the termination
benefit and when the entity recognises any related restructuring costs.
(m) Provisions
Provisions are recognised when the Group has a present obligation (legal or constructive) as a result of a past event, it is probable
that the Group will be required to settle the obligation, and a reliable estimate can be made of the amount of the obligation. The
amount recognised as a provision is the best estimate of the consideration required to settle the present obligation at the end of
the reporting period, taking into account the risks and uncertainties surrounding the obligation. Where a provision is measured
using the cash flows estimated to settle the present obligation, its carrying amount is the present value of those cash flows.
When some or all of the economic benefits required to settle a provision are expected to be recovered from a third party, a
receivable is recognised as an asset if it is virtually certain that reimbursement will be received and the amount of the receivable
can be measured reliably.
(n) Financial liabilities
Initial recognition and subsequent measurement
The Group initially recognises deposits, debt securities issued, and subordinated liabilities on the date on which they are originated.
All other financial liabilities are recognised on the trade date, which is the date on which the Group becomes a party to the
contractual provisions of the instruments.
A financial liability is measured initially at fair value plus, for an item not at fair value through profit or loss, transaction costs that are
directly attributable to its acquisition or issue. The Group classifies its financial liabilities, other than loan commitments, as measured
at amortised cost or fair value through profit or loss.
Deposits and other borrowings
Deposits and other borrowings comprise negotiable certificates of deposit, term deposits, saving deposits, cheque and other demand
deposits, securities sold under agreements to repurchase, unsecured guaranteed notes and secured borrowings. Deposits and other
borrowings are recognised at inception at fair value plus directly attributable transaction costs and subsequently at amortised cost.
Interest and yield related fees are recognised in the profit or loss based upon the effective yield method.
Amounts due to other financial institutions
Amounts due to other financial institutions include amounts owing to Australian banks and other financial institutions. They are
brought to account at fair value at inception and subsequently stated at amortised cost.
Subordinated debt
Subordinated debt is recognised at fair value plus directly attributable transaction costs and subsequently measured at amortised
cost. Interest is recognised using the EIR method.
Mortgage backed securities
Mortgage backed securities relates to securities issued by securitisation trusts where the Group has assessed that it retains
substantially all the risks and rewards of ownership and continues to control the transferred assets. They are brought to account
at fair value plus directly attributable transaction costs and subsequently measured at amortised cost. Interest is taken to the
statement of profit or loss and other comprehensive income using the EIR method when incurred.
Derecognition of financial liabilities
The Group derecognises a financial liability when its contractual obligations are discharged or cancelled, or expire.
Page 26

Members Equity Bank Limited
Notes to the financial statements
for the financial year ended 30 June 2017
3 Significant accounting policies (continued)
(o) Derivatives held for risk management and hedge accounting
The Group uses derivatives such as interest rate swaps and futures to hedge its exposure to interest rate risks arising from
operating, financing and investing activities. Derivatives are recorded at fair value and carried as assets when their fair value is
positive and as liabilities when their fair value is negative. Changes in the fair value of derivatives, other than those designated
as hedging instruments (refer paragraph below), are included in 'Other operating income'.
Hedge accounting
From 1 July 2014, the Group designates certain derivatives held for risk management as hedging instruments in qualifying cash
flow hedging relationships in accordance with AASB 139 'Financial Instruments: Recognition and Measurement'. On initial
designation of the hedge, the Group formally documents the relationship between the hedging instruments and hedge items,
including the risk management objective and strategy in undertaking the hedge, together with the method that will be used to
assess the effectiveness of the hedging relationship.
The Group makes an assessment, both at inception of the hedge relationship and on an ongoing basis, of whether the hedging
instruments are expected to be highly effective in offsetting the changes in cash flows of the respective hedged items during the
period for which the hedge is designated, and whether the actual results of each hedge are within a range of 80-125%. The
effective portion of the gain or loss on the hedging instrument is initially recognised directly in equity in the cash flow hedge reserve.
The ineffective portion of the gain or loss on the hedging instrument is recognised immediately in other operating income in the
statement of profit or loss.
When the hedged forecasted variable cash flow affects the profit or loss statement, the gain or loss on the hedging instrument is
transferred from equity to the corresponding income or expense line of the income statement. When a hedging instrument expires,
or is sold, terminated, exercised, or when a hedge no longer meets the criteria for hedge accounting, any cumulative gain or loss
that has been recognised in other comprehensive income at that time remains in other comprehensive income and is recognised
when the hedged forecast transaction is ultimately recognised in the statement of profit or loss. When a forecast transaction is
no longer expected to occur, the gain or loss accumulated in equity is recognised immediately in profit or loss.
Page 27

Members Equity Bank Limited
Notes to the financial statements
for the financial year ended 30 June 2017
4 Use of judgements and estimates
In preparing these financial statements, management has made judgements, estimates and assumptions that affect the application
of the Group's accounting policies and the reported amount of assets, liabilities, income and expenses. Actual results may differ
from these estimates.
Estimates and underlying assumptions are reviewed on an ongoing basis. Revisions to estimates are recognised prospectively.
(a) Judgements
Information about judgements made in applying accounting policies that have the most significant effects on the amounts
recognised in the consolidated financial statements are set out below.
Determination of control over investees
Management applies its judgement to determine whether the control indicators set out in Note 3(a) indicate that the Group controls
a securitisation vehicle or an investment fund.
Securitisation vehicle
Certain securitisation vehicles sponsored by the Group under its securitisation programme are run according to predetermined
criteria that are part of the initial design of the vehicles. In addition, the Group is exposed to variability of returns from the vehicles
through its holding of income units in the vehicles.
Outside the day-to-day servicing of the housing loans (which is carried out by the Group under a servicing contract), key decisions
are usually required only when housing loans in the vehicles go into default. Therefore, in considering whether it has control, the
Group considers whether it manages the key decisions that most significantly affect these vehicles' returns. As a result, the Group
has concluded that it controls these vehicles (see Note 10).
Investment funds
The Group acts as fund manager to a number of investment funds. Determining whether the Group controls such an investment
fund usually focuses on the assessment of the aggregate economic interests of the Group in the fund (comprising any carried
interests and expected management fees) and the investors' rights to remove the fund manager. For all funds managed by the
Group, the investors are able to vote by 75% majority to remove the Group as fund manager without cause, and the Group does
not have any economic interest in the funds. As a result, the Group has concluded that it acts as agent for the investors in all
cases, and therefore has not consolidated these funds.
For further disclosure in respect of unconsolidated securitisation funds, please refer to Note 11.
Determination of the useful life for the core banking system
The license period for the core banking system based on the agreement in place is ten years, which is used as an indicator and
proxy to determine its useful life. Hence, the Group has determined that the useful life of the core banking system is 10 years.
Determination of amortisation period of loan origination costs
The Group has determined the amortisation period for home loan and personal loan origination costs to be 5 years and 3 years
respectively. This is in line with the average life of a home loan and a personal loan on the Group's balance sheet of 5 years and
3 years respectively before it is paid out or refinanced.
(b) Assumptions and estimation uncertainties
Information about assumptions and estimation uncertainties that have a significant risk of resulting in a material adjustment in the
next financial year is set out below.
Impairment losses on loans and advances
Impairment allowance for loans and advances represent management’s best estimate of losses incurred in the loan portfolios at the
end of the reporting period. Management is required to exercise judgement in making assumptions and estimations when
calculating impairment allowances on both individually and collectively assessed loans and advances (please refer to Note 3(g)).
Fair value of financial instruments
Management use their judgement in selecting an appropriate valuation technique for financial assets not quoted in an active
market. Valuation techniques commonly used by market practitioners are applied. Financial assets are valued using a discounted
cash flow analysis based on assumptions supported, where possible, by observable market prices or rates (please refer to Note
3(f)).
Impairment of intangible assets
Please refer to Note 13.
Page 28

Members Equity Bank Limited
Notes to the financial statements
for the financial year ended 30 June 2017
5 Revenue and expenses
Profit before income tax expense includes the
following items of revenue and expense:
Interest and similar income
Deposits with other financial institutions
Loans and advances
Investment securities
Interest rate swap contracts
Interest and similar expense
Deposits and other borrowings
Subordinated borrowings
Interest rate swap contracts
Funds management fee income
Other operating income
Fee income
Other income
Cumulative gains reclassified from equity on
disposal of available-for-sale investments
(Losses)/gains from investments held for trading
Fair value movement in derivatives
Distribution from unit trusts
Dividend income from subsidiary
Operating expenses
Staff and related costs
General administrative expenses
Transaction fee expenses
Depreciation and amortisation of:
- Plant and equipment
- Intangibles
Loss on disposal of plant and equipment
Operating lease rental expenses
Impairment losses
Loans and advances (refer to Note 9)
Overdrawn savings accounts
Project expenses
Program of work
Loss on sale of commercial loans and asset finance portfolios
Loss on sale (i)
(i) Effective 1 December 2016, the Group sold its commercial loans and asset finance portfolios to RedZed Lending Solutions Pty Ltd.
As a result of this sale, the Group has recognised a loss on disposal of $8.9 million for the financial year ended 30 June 2017.
113,760 113,760
14,041
13,108
- 8,902 - 8,902
2,200
13,771
15,012
14,144
437
233,845
6,148
404
12,230
10,247
16,769
113,542
106,458
81
24,671
10,217
152
32,393 15,012 32,393
68,538
16,769
6,148
230,186 231,085
32,124
13,173
-
113,542
13,108
Consolidated
22,080
825,302
3,318
296,602
-
240,078
5,379 9,306 10,156
15,734
20,764
65,705
-
19,478
194,841
3,944 6,299
15,734
602,476
4,025
Company
2016
593,289
895,225
1,173,219
1,014,581
$'000
25,042
10,354
69,363
6,299
2,424
3,289 2,641
2016
$'000 $'000
17,144
83,644
1,161,628
73,354
1,221,621
$'000
5,094 5,496
734,585
892,620
142,301
2017 2017
27,153
144,485
1,114,725
618,210
907,035
3,266
100,144
938,695
207,092
1,017,143
71,020 79,887
5,952
981,543 978,378
2,775
892,403
610,433
708,719
725,863
237,732
7,454
13,336
-
152
45,533
2,500
72,098
963,595
17,144
750,319
941,137
(4,753) - (4,753)
136,295
13,336
404
13,740
13,773
81
13,173
-
10,248
12,230
10,217
435
227,525
32,393 32,393
14,144
8,902 - 8,902 -
15,012
15,012
82,563
14,041
128,901
13,740
Page 29

Members Equity Bank Limited
Notes to the financial statements
for the financial year ended 30 June 2017
6 Income taxes
Income tax recognised in profit or loss
Tax expense comprises:
Current tax expense
Adjustment recognised in the current year in relation to
the current tax of prior years
Deferred tax expense/(income) relating to the origination
and reversal of temporary differences
Total tax expense
The prima facie income tax expense on pre-tax
accounting profit from operations reconciles to the
income tax expense in the financial statements as
follows:
Profit from operations
Income tax expense calculated at 30%
Effect of expenses/(income) that are not
deductible/(assessable) in determining taxable profit
Adjustment recognised in the current year in relation to
the current tax of prior years
Income tax expense recognised in profit or loss
The tax rate used in the above reconciliation is the corporate tax rate of 30% payable by Australian corporate entities on the taxable
profits under Australian tax law. There has been no change in the corporate tax rate when compared with the previous reporting
period.
Income tax recognised in other comprehensive income (OCI)
The following current and deferred amounts were charged/(credited) directly to other comprehensive income during the year:
Deferred tax
Revaluations of available-for-sale financial assets
Cash flow hedges
Current tax liabilities
Income tax payable
5,087
26,475
30,523
88,249
28,141
(815)
$'000
107,472
220
(19,440)
-
32,268
$'000
220
26,527
(1,628)
$'000 $'000 $'000
2017
$'000
(1,628)
27,326
(118)
Consolidated Company
2,083
30,640
26,176
861
2016
2016
28,972
25,436
103,854 96,573
32,241
Company
27
2016
(118)
26,511
861
1,891 (16,543) 1,238
(19,220) 2,752 (16,323) 2,099
2016 2017
5,741
26,393 30,640
(118)
(633)
(118)
Consolidated
(1,628)
- -
2017
26,393
949
$'000
28,895
31,156
$'000
36 (713)
2017
(1,628)
28,895 28,141
28,259
Page 30

Members Equity Bank Limited
Notes to the financial statements
for the financial year ended 30 June 2017
6 Income taxes (continued)
Deferred tax assets
2017
Temporary differences
Accrued expenses
Provisions
Plant and equipment and intangible assets
Financial assets held for trading
Available-for-sale financial assets
Derivatives
Cash flow hedges
Impairment allowance
Other
2016
Temporary differences
Accrued expenses
Provisions
Plant and equipment and intangible assets
Financial assets held for trading
Available-for-sale financial assets
Derivatives
Cash flow hedges
Impairment allowance
Other
2017
Temporary differences
Accrued expenses
Provisions
Plant and equipment and intangible assets
Financial assets held for trading
Available-for-sale financial assets
Derivatives
Cash flow hedges
Impairment allowance
Other
Temporary differences relating to the securitisation trusts
220
in profit
66
(6,983)
-
-
(1,387)
1,708
Opening
7,134
7,726
-
(2,270)
$'000 $'000
25,177
7,726 7,407
(1,551)
209
5,227
3,092
101
319
7,134
-
in OCI
(34)
Closing
Recognised
RecognisedOpening
(6,984)
-
3,301
balance
-
in profit
Recognised
balance
32,893
(1,551)
in profit
-
-
7,407
23,286
2,236 856
7,448 314
3,301
4,097
935
14,555
$'000
balance
662
6,749
(8,008)
-
Closing
719
2,752
3,092
balance
or loss
in OCI
(4,185)
(1,025)
35,882
$'000
-
-
(1,387)
935
68
Consolidated
(560)
$'000
6,427
Opening
in OCI
Closing
-
- 707
(1,025)
7,134
-
(1,648)
(8,009)
Consolidated
-
-
-
14,557
(19,371)
(6,984)
102
(1,167)
-
-
$'000
314 7,448
$'000
97
balance
935
3,092
-
-
-
Recognised
-
(5,741)
-
Recognised
Company
(2,248)
(1,648)
balance
-
(3,217)
or loss
$'000
861
(1,167)
25,177
$'000
2,537
815
$'000
935
220
(3,767)
32,893
(35)
$'000
658
(1,387)
(2,083)
(19,151)
$'000
102
-
-
or loss
Recognised
5,806 -
1,891
-
209
319
32,892 (16,254)
-
(16,474)
-
20,571
7,407
(3,519)
-
-
Page 31
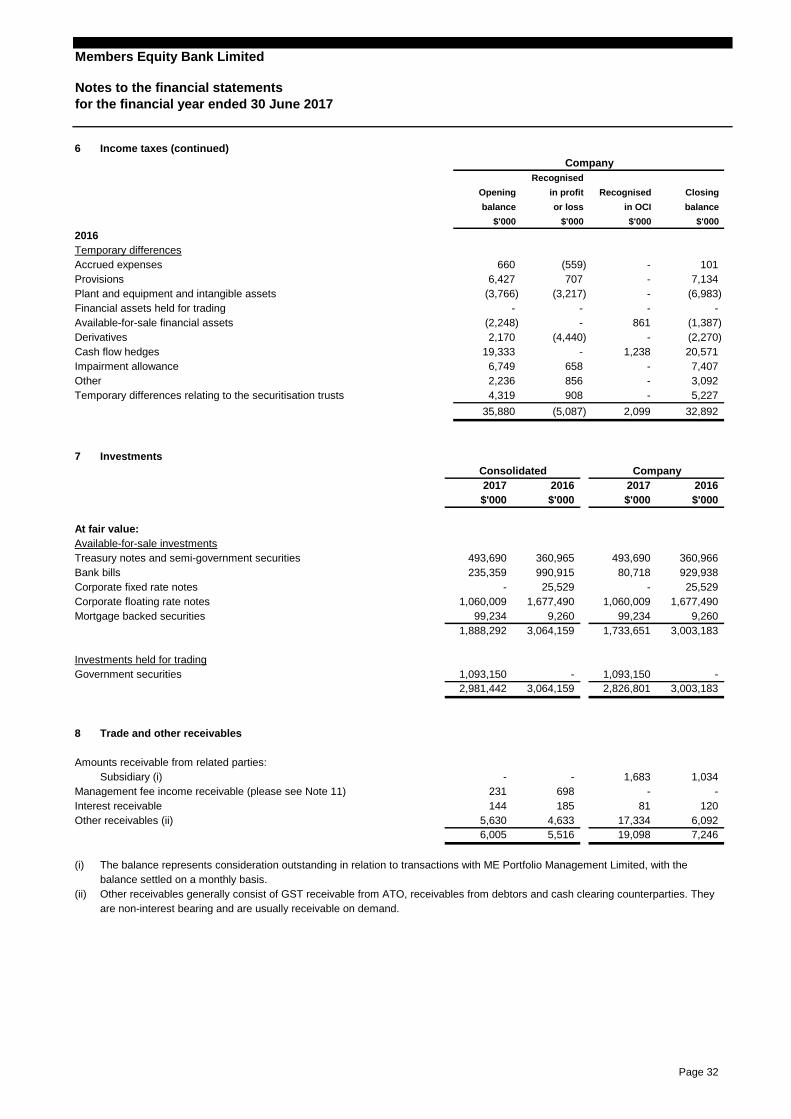
Members Equity Bank Limited
Notes to the financial statements
for the financial year ended 30 June 2017
6 Income taxes (continued)
2016
Temporary differences
Accrued expenses
Provisions
Plant and equipment and intangible assets
Financial assets held for trading
Available-for-sale financial assets
Derivatives
Cash flow hedges
Impairment allowance
Other
Temporary differences relating to the securitisation trusts
7 Investments
At fair value:
Available-for-sale investments
Treasury notes and semi-government securities
Bank bills
Corporate fixed rate notes
Corporate floating rate notes
Mortgage backed securities
Investments held for trading
Government securities
8 Trade and other receivables
Amounts receivable from related parties:
Subsidiary (i)
Management fee income receivable (please see Note 11)
Interest receivable
Other receivables (ii)
(i) The balance represents consideration outstanding in relation to transactions with ME Portfolio Management Limited, with the
balance settled on a monthly basis.
(ii) Other receivables generally consist of GST receivable from ATO, receivables from debtors and cash clearing counterparties. They
are non-interest bearing and are usually receivable on demand.
101
$'000
660
(2,248)
(6,983)
908
144
5,227
2017
Consolidated
-
32,892
$'000
-
(5,087)
6,749
1,677,490
2,170 (2,270)
2,099
balance
20,571
(3,766)
Closing
in OCI
7,134
(559)
6,427
in profit
Company
(3,217)
7,407
-
(4,440)
-
Opening
2,236
$'000
-
-
-
-
1,683
9,260
2,826,801
-
185
80,718
1,034
231
99,234
3,003,183
-
4,633
81
-
5,630
929,938 990,915
3,003,183
1,093,150 -
25,529
1,677,490
Recognised
-
1,238
-
861
balance
$'000
360,965 493,690
-
658
-
19,333
35,880
3,092
2016
493,690
$'000
-
-
or loss
Recognised
856
4,319
707
-
(1,387)
1,733,651
6,092
- 25,529
3,064,159
1,093,150
1,888,292
360,966
Company
2017 2016
5,516 19,098
99,234
17,334
1,060,009 1,060,009
9,260
2,981,442
$'000 $'000$'000
3,064,159
120
698
-
235,359
6,005 7,246
Page 32

Members Equity Bank Limited
Notes to the financial statements
for the financial year ended 30 June 2017
9 Loans and advances
Credit cards
Personal loans
Residential home loans
Commercial loans
Asset finance
Finance lease
Hire purchase
Chattel mortgage
Less:
Unearned asset finance income
Allowance for impairment losses
Movement in allowance for impairment of loans and advances
Balance at the beginning of the year
Amounts written off as uncollectible during the year
Amounts recovered during the year
Allowance for impairment losses recognised during the year
Balance at the end of the year
Individual impairment
Collective impairment
10 Investment in controlled entities
Investment at cost
The controlled entities of the Company are:
Subsidiary
ME Portfolio Management Limited (i)
Securitisation (refer Note 4(a))
SMHL Series 2008-1 Fund (ii)
SMHL Series Private Placement Trust 2010-1 (ii)
SMHL Series Securitisation Fund 2010-3 (ii)
SMHL Series Securitisation Fund 2011-2 (ii)
SMHL Series Private Placement 2011-1 (ii)
SMHL Series Private Placement 2011-3 (ii)
SMHL Series Securitisation Fund 2012-1 (ii)
SMHL Series Securitisation Fund 2013-1 (ii)
SMHL Series Securitisation Fund 2014-1 (ii)
SMHL Series Private Placement 2014-2 (ii)
SMHL Series Securitisation Fund 2015-1 (ii)
SMHL Series Securitisation Fund 2016-1 (ii)
(i) Member of the tax-consolidated group of which Members Equity Bank Limited is the head entity.
(ii) The Company holds the residual income units.
2016
22,410
18,486
13,336
$'000
Australia
112,874
-
19,566,308
-
100%
(14,995)
7,244
$'000
(7,454)
- 22,600
25,600
(16,516)
24,613
2,646
100%
-
19,615,179
164,767
161,498
194,092
71,901
18,996,001
217,371
2016
$'000
2016
13,740
(24,613)
-
24,613
7,244
22,529,185
24,613 25,600
25,600 24,613
$'000
2017
151,609
Australia
100%
Australia
102
Australia
100%
(14,995)
22,583,561
-
Consolidated
Company
2017
100%
$'000
Australia
6,127
22,410
24,613
2017
-
13,740
Consolidated
2017
164,767
-
100%
Ownership interest
151,609
22,178,401
6,127
19,534,241
-
(24,613)
(7,454)
24,613
26,706
19,583,112
217,371
22,170,326
18,356
25,600
18,356
26,706
-
(25,600)
22,600
(25,600)
18,996,248
22,609,161
39,147
22,503,585
13,336
4,979
100% 100%
Australia
2016
100%
Country of
incorporation
Company
$'000
Australia
$'000
-
Australia
Australia 100%
102
Australia
100% 100%
100%
100% 100%
100%
18,486
4,979 2,646
(16,516)
194,092
2016
100%
Australia 100% 0%
100% 100%
2017
100%100%
100%
39,147
$'000
Australia
100%100%Australia
Page 33

Members Equity Bank Limited
Notes to the financial statements
for the financial year ended 30 June 2017
11 Involvement with unconsolidated structured entities
The table below describes the types of structured entities that the Group does not consolidate but in which it holds an interest.
Type of structured entity Nature of activities Interest held by the Group
Securitisation trusts for Management and administration of housing loan portfolios. • Management and service fees
housing loans The trusts are financed through the issue of mortgage
backed securities to investors.
Managed fund Management and administration of financial assets. • Management and service fees
The fund is financed through the issue of bonds and units to
investors.
The table below sets out an analysis of the carrying amount of interests held by the Group in unconsolidated structured entities.
The maximum exposure to loss is the carrying amount of the assets held.
Securitisation trusts for residential home loans
Managed fund
The table below sets out details of fees received from unconsolidated structured entities.
Fee income earned from securitisation trusts
Fee income earned from managed fund
12 Plant and equipment
Gross carrying amount
Balance at 1 July 2015
Additions
Disposals
Balance at 30 June 2016
Additions
Disposals
Balance at 30 June 2017
Accumulated depreciation
Balance at 1 July 2015
Depreciation expense
Disposals
Balance at 30 June 2016
Depreciation expense
Disposals
Balance at 30 June 2017
Net book value
As at 30 June 2016
As at 30 June 2017
243
receivables
(22,837)(14,827)
(4,415)
27,175
Furniture &
(4,663)
18,648
22
231
2016
5,709
16,353
5,952
$'000
26,515
28,228
2,564
13,699
6,148
7,753
597
(39,138)
10,209
14,041
560
Trade & other
19,736
7,443
Computer
$'000
41,324
(6,079)
8,492
Consolidated and Company
(13,019)
1,899
843
equipment
209
138
62,472
Total
(26,119)
(8,010)
2,766
39,427
28,414
$'000
698
9,757
20,084
23,074
(5,496)
$'000
1,436
2017
equipment
13,476
950
29,829
36,773
21,148
107
$'000
463 8,330 7,867
(1,416)
(1,081)
6,288
10,354
3,584
66,602
Page 34
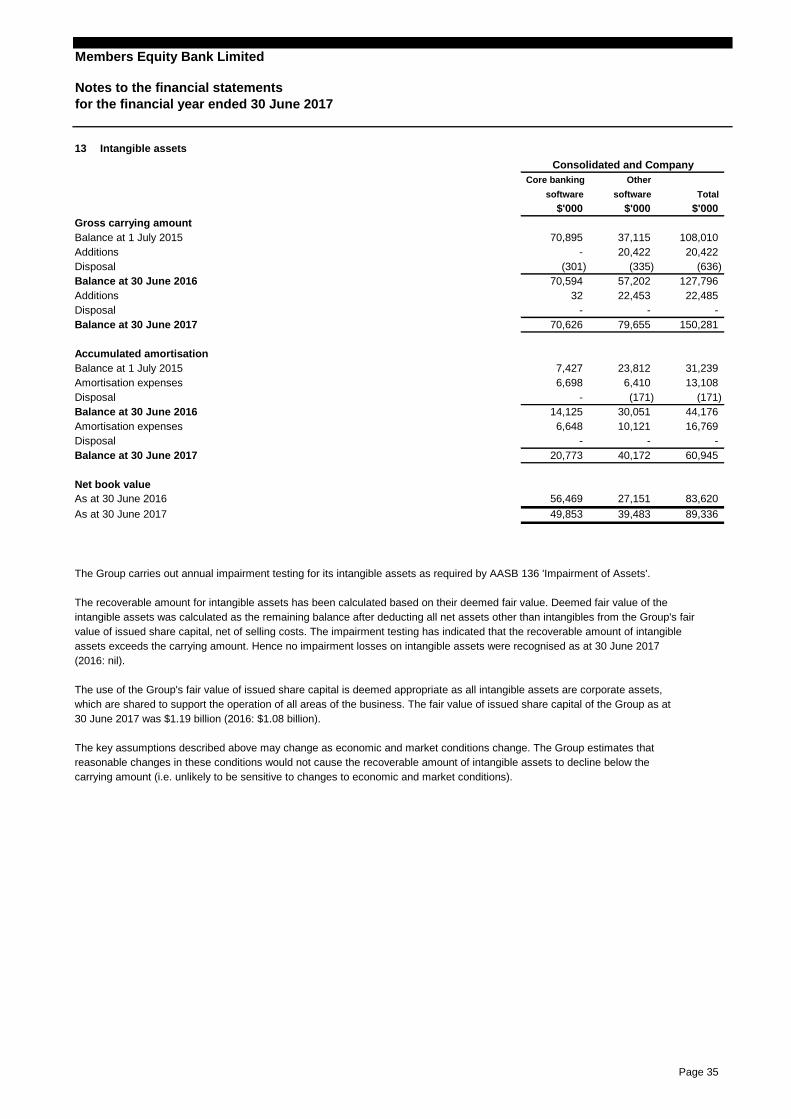
Members Equity Bank Limited
Notes to the financial statements
for the financial year ended 30 June 2017
13 Intangible assets
Gross carrying amount
Balance at 1 July 2015
Additions
Disposal
Balance at 30 June 2016
Additions
Disposal
Balance at 30 June 2017
Accumulated amortisation
Balance at 1 July 2015
Amortisation expenses
Disposal
Balance at 30 June 2016
Amortisation expenses
Disposal
Balance at 30 June 2017
Net book value
As at 30 June 2016
As at 30 June 2017
The Group carries out annual impairment testing for its intangible assets as required by AASB 136 'Impairment of Assets'.
The recoverable amount for intangible assets has been calculated based on their deemed fair value. Deemed fair value of the
intangible assets was calculated as the remaining balance after deducting all net assets other than intangibles from the Group's fair
value of issued share capital, net of selling costs. The impairment testing has indicated that the recoverable amount of intangible
assets exceeds the carrying amount. Hence no impairment losses on intangible assets were recognised as at 30 June 2017
(2016: nil).
The use of the Group's fair value of issued share capital is deemed appropriate as all intangible assets are corporate assets,
which are shared to support the operation of all areas of the business. The fair value of issued share capital of the Group as at
30 June 2017 was $1.19 billion (2016: $1.08 billion).
The key assumptions described above may change as economic and market conditions change. The Group estimates that
reasonable changes in these conditions would not cause the recoverable amount of intangible assets to decline below the
carrying amount (i.e. unlikely to be sensitive to changes to economic and market conditions).
22,453
-
$'000
13,108
$'000
20,422
70,895
16,769
7,427
57,202
23,812
56,469 27,151
32
127,796
(171)
31,239
150,281
49,853
83,620
-
20,773 40,172
22,485
70,626
Consolidated and Company
37,115
44,176
- -
20,422
(301)
70,594
79,655
-
$'000
Core banking
Total
(636)
-
108,010
Other
(335)
software software
39,483
-
10,121
89,336
60,945
6,698 6,410
- (171)
14,125 30,051
6,648
Page 35

Members Equity Bank Limited
Notes to the financial statements
for the financial year ended 30 June 2017
14 Other assets
Prepayments
Income tax receivable
15 Deposits and other borrowings
Unsecured - at amortised cost
Retail customer deposits
Business customer deposits
Superannuation banking deposits
Advised and corporate deposits
Institutional borrowings
Treasury borrowings
Medium term notes (i)
Other borrowings
Secured - at amortised cost
Mortgage backed securities (ii)
Liabilities to the securitisation trusts (iii)
Total deposits and other borrowings
(i) Medium term notes include interest payable and deferred expenses directly attributable to its issuance, with a face value of
$1,250,000,000. Of the $1,250,000,000 floating rate notes:
• $350,000,000 is due in the first half of the 2018 financial year;
• $350,000,000 is due in the second half of the 2018 financial year;
• $350,000,000 is due in the first half of the 2020 financial year; and
• $200,000,000 is due in the second half of the 2020 financial year.
(ii) Mortgage backed securities relate to securities issued by securitisation trusts where the Group has assessed that it retains
substantially all the risks and rewards of ownership and continues to control the transferred assets. The holders of these
securities have recourse only to the assets in the relevant securitisation trusts.
(iii) Liabilities to the securitisation trusts represent the residential home loans that are securitised into the special purpose
securitisation vehicles as described in Note 4(a).
8,422
9,513
16,709,470
8,969
4,958,411
Company
4,981,794
-
$'000
2017
$'000
1,255,855
716,954
1,342,619
-
4,981,794
8,422 9,170
4,958,411
24,410,231
-
4,762,236
Consolidated
507,071
$'000
716,954
19,428,437
1
564,776
4,686,747
5,707,514
1,159,179
2016
4,126,619
1,342,619
507,071
$'000
2017
4,703,842
16,709,470
-
8,969
1,255,855
4,703,842
- - 201
928,368
539,250
4,686,747
4,882,307 4,882,307
5,060,835 -
4,882,465
4,762,236
2016
-
19,428,437
1
-
5,707,514 4,126,619
8,969
24,132,279
9,513
21,591,935 21,770,305
1,159,179
539,250
564,776
4,882,465 5,060,835
928,368
Page 36

Members Equity Bank Limited
Notes to the financial statements
for the financial year ended 30 June 2017
16 Derivatives
The Group makes use of derivative instruments for risk management purposes, in particular interest rate risk, and future exposure to
foreign currency liability. This risk is managed using interest rate swap contracts, futures contracts and foreign exchange contracts.
Interest rate swaps
Interest rate swaps relate to contracts taken out by the Group with other financial institutions in which the Group either receives or
pays a floating rate of interest, respectively, in return for paying or receiving a fixed rate of interest. The payment flows are usually
netted against each other, with the difference being paid by one party to the other.
Under the terms of the International Swaps and Derivatives Association (ISDA) Collateral Guidelines for the interest rate swap
contracts, the balance of the cash collateral received by the Group as at 30 June 2017 is $nil (2016: $nil).
In addition, the Group has pledged cash collateral under the terms of the ISDA Collateral Guidelines. As at 30 June 2017, the
Group has pledged cash collateral to the value of $31,320,000 (2016: $68,320,000).
All interest rate swap contracts exchanging floating rate interest amounts for fixed rate interest amounts are designated as cash
flow hedges in order to reduce the Group's cash flow exposure resulting from variable interest rates on interest-bearing liabilities.
Interest rate swap contracts held-for-trading activities relate to contracts entered into for risk management purposes that do not meet the
AASB 139 'Financial Instruments' hedge accounting criteria, specifically basis swap contracts
Futures contracts
Futures contracts are taken out by the Group to hedge against interest rate risks inherent in investments held for trading, which are
fair valued to profit and loss.
Foreign exchange contracts
The Group has taken out foreign exchange forward contracts to hedge against exposure to foreign currency cash outflows. As the
cash outflow is highly probable, this is subject to cash flow hedge accounting under AASB 139 'Financial Instruments'.
Derivatives held for hedging - cash flow hedges
Interest rate swaps
Foreign exchange contracts
Derivatives held for trading - fair value through profit and loss
Interest rate basis swaps
Futures
Derivatives held for hedging - cash flow hedges
Interest rate swaps
Foreign exchange contracts
Derivatives held for trading - fair value through profit and loss
Interest rate basis swaps
Futures
4,661
-
2017
- -
11,331 26,927
-
Consolidated
- -
$'000
4,661 87,851
2016
Company
87,851
2017
$'000
2016
-
250
2016
$'000 $'000
2016
6,696
liabilities assets liabilities
2,118
235
26,677
-
Fair value
2,282
Fair value Fair value
1,869
Fair value Fair value
assets liabilities assets liabilities
$'000 $'000 $'000 $'000
Fair value Fair value Fair value
20,408 4,172 69,348
235 - -
2017 2017
-
assets
2,282 250 - -
6,696 - - -
11,082 20,658 4,172 69,348
Page 37

Members Equity Bank Limited
Notes to the financial statements
for the financial year ended 30 June 2017
17 Trade and other payables
Creditors and accruals
Other payables
18 Provisions
Employee benefits (i)
Restructuring provision
Other provisions (ii)
(i) Employee benefits are expected to be settled within a year with the exception of provisions for long service leave which
amounted to $7,867,412 (2016: $7,178,340).
(ii) Other provisions predominantly relate to the make good provision for all premises leased by the Group throughout Australia.
19 Subordinated debt
Floating rate notes
Agreements between the Group and the lenders provide that, in the event of liquidation, entitlement of the lenders to
repayment of the principal sum and interest thereon is and shall at all times be and remain subordinated to the rights of all
other present and future creditors of the Group.
The contractual maturity dates for repayment of the principal face value sum to the lenders are as follows:
19 December 2022 (i)
29 August 2024 (ii)
(i) The subordinated debt was issued on 19 December 2012. Whilst the maturity date of these notes is 19 December 2022, under
the terms of the agreements between the Group and the lenders, the Group is entitled to call these notes 5 years prior to the
contractual maturity date (19 December 2017).
(ii) The subordinated debt was issued on 29 August 2014. Whilst the maturity date of these notes is 29 August 2024, under
the terms of the agreements between the Group and the lenders, the Group is entitled to call these notes 5 years prior to the
contractual maturity date (29 August 2019).
In accordance APRA guidelines, the Group includes the subordinated debt as Tier 2 capital (refer to Note 27).
2017
2017
-
2,343
$'000
2017
1,900
2,321
Company
22,225
2016 2017
26,482
25,860
24,139
2016
Consolidated
26,446
Consolidated
333,236
$'000
$'000
Consolidated
$'000
17,081
$'000
22,225 24,139
333,000
33,000
332,760
9,603 9,755
2,321
$'000 $'000
333,000 333,000
2017
-
2016
300,000
333,236
$'000
17,235
333,000
$'000
300,000
1,900
332,760
$'000
2016
8,486 8,779
2016
25,721
300,000
33,000
26,446
20,081
300,000
12,503
$'000
26,482
2,343
33,000
22,106
Company
Company
33,000
10,326
2017 2016
$'000
Page 38

Members Equity Bank Limited
Notes to the financial statements
for the financial year ended 30 June 2017
20 Issued capital
11,045,873 fully paid ordinary shares (2016: 10,573,785)
Movement in issued capital of fully paid shares
Beginning of the financial year
Issue of new shares
End of the financial year
Fully paid ordinary shares carry one vote per share and carry a right to dividends.
21 Reserves
Investment revaluation reserve
General reserve for credit losses
Cash flow hedge reserve
Investment revaluation reserve
The investment revaluation reserve arises on the revaluation of available-for-sale financial assets. Where a revalued asset is sold
that portion of the reserve that relates to that financial asset is effectively realised and is recognised in profit or loss. Where a
revalued financial asset is impaired that portion of the reserve that relates to that financial asset is recognised in profit or loss.
General reserve for credit losses
APRA requires the Group to establish a general reserve under APS220 Credit Quality, for credit losses to cover future expected
losses not yet identified, which are inherent in its lending activities.
Cash flow hedge reserve
The hedging reserve comprises the effective portion of the cumulative net change in the fair value of hedging instruments used in
cash flow hedges pending subsequent recognition in profit or loss as the hedge cash flows affect profit or loss (see Note 3(o)).
22 Dividends
No dividends have been paid or declared since the start of the financial year (2016: $nil). The directors do not recommend the
payment of a dividend with respect to the year ended 30 June 2017.
Adjusted franking account balance (i)
(i) From 1 July 2011, the Company and its subsidiary have formed a tax-consolidated group with the Company as the head
entity. Accordingly, all franking credits in the subsidiary are transferred to the head entity franking account.
2016
Company
2016
Consolidated
2017
10,150,594
$'000
2,722
767,922
(37,181)
(58,748)
$'000
39,999
$'000
807,921
767,922
767,922
472,088
$'000
No.
2,722
2016
17,457
2017
3,235
$'000
(9,399)
100,968
17,457
$'000
3,235
11,045,873
2017 2016
423,191
Consolidated
128,118
10,780
2017
$'000
10,573,785
$'000
(13,387)
Company
18,332
37,927
10,573,785
$'000
2016
2016
$'000
807,921
729,995
18,332
(48,000)
767,922
No.
$'000 $'000
(26,433)6,792
Company
2017
807,921
2017
Page 39

Members Equity Bank Limited
Notes to the financial statements
for the financial year ended 30 June 2017
23 Commitments
(a) Undrawn credit
Residential home loans
Credit cards
Personal loans
Commercial loans
(b) Lease commitments
Operating lease arrangements
Operating leases are entered into as a means of acquiring access to premises, computer equipment and motor vehicles. The
rental payments detailed below have been based on the terms of the relevant lease contracts net of amounts recoverable from
sub-lessees.
Non-cancellable operating lease commitments
Not longer than 1 year
Longer than 1 year but not longer than 5 years
Longer than 5 years
567,361 418,595
286
2017
43
572,582
-
23,451
$'000
-
33,078
-
418,595 567,361
2017
572,582
286
31,281
Company
9,987
41,268
$'000
9,627
1,234,277 991,543
$'000
Company
2016
9,627
-
Consolidated
666,873
43 80
$'000$'000
23,451
2016
41,268
80
-
2016
Consolidated
$'000 $'000
2017 2017
666,873
991,543
-
9,987
$'000
33,078
31,281
2016
1,234,277
Page 40

Members Equity Bank Limited
Notes to the financial statements
for the financial year ended 30 June 2017
24 Notes to the statement of cash flows
(a) Reconciliation of cash and cash equivalents
For the purposes of the statement of cash flows, cash and cash equivalents includes cash on hand and in banks and investments at
call in money market instruments. Cash and cash equivalents at the end of the financial year as shown in the statement of cash flows
is reconciled to the related items in the statement of financial position as follows:
Cash and cash equivalents
Cash at bank
Deposits at call
(b) Cash balance not available for use in (a)
First Home Owners Grants held on behalf of customers
Cash at bank and deposits at call within securitisation trusts (i)
(i) Represents cash balances held within controlled securitisation trusts that are only available for use in accordance with the terms
of the Trust Deeds.
(c) Change in operating assets
Investments
Derivatives assets
Trade and other receivables
Loans and advances
Other assets
Movement in other comprehensive income before income tax -
available-for-sale financial assets
(d) Change in operating liabilities
Amounts due to other financial institutions
Deposits and other borrowings
Derivatives liabilities
Trade and other payables
Provisions
Subordinated debt
Movement in other comprehensive income before income tax -
cash flow hedges
(e) Non-cash items included in profit before tax
Depreciation of plant and equipment
Amortisation of intangible assets
Loss on disposal of plant and equipment, and computer software
Impairment losses
Amortisation of capitalised transaction costs
(f) Operating cash flows from interest
Interest received
Interest paid
(11,852)
1,908,366
13,108
1,207,150
(732)
67,125
14,144
416
115
95,658
148,384
82,717
10,791
31,385
2017
$'000
35
6,148
59,704 60,774
1,267,248
15,423
14,144
152 152
13,771
2,546,859
16,301 16,301
14,041
1,217,785
14,041
625,563
13,773
817,050
13,108
19,329
(7,940)
1,883,163
(4,127)
(60,924)
-
64,802 55,144
1,851,739
68,412
601,758 916,762
-
-
(2,870,708)
(1,171)
(630)
4,037
(2,871)
95,623
(6,910)
54,958
(547)
16,769
440,054
14,134
(2,871)
(6,670)
(159,437)
461
35
18,259
173,882
103,886
252,270
Company
(2,920,054)
2016
(1,935,676)
(1,783,201)
(733)
(2,994,333) (1,800,643)
124,737
124,852
(164,214)
312,646
225,069
214,985
2016
174,306
$'000
2017
$'000
(3,025,438)
115
11,203
138,340
$'000
36
-
(12,189)
416 (27)
(1,556)
2,647,037
5,640
1,876,184
(6,785)
(48,690)
(2,620)
16,769
6,148
2,536,642
Consolidated
(6,305)
(27)
(1,952,870)
36
(15,828)
3,435
890,973
86,343
35
(489)
343
2,637,510
115
3,754
3,435
Page 41

Members Equity Bank Limited
Notes to the financial statements
for the financial year ended 30 June 2017
25 Financial instruments
(a) Categories of financial instruments
Financial assets
Cash and cash equivalents
Investments
Available-for-sale financial assets
Held for trading financial assets
Derivatives
Designated hedge accounting relationship
Held for trading
Trade and other receivables
Loans and advances
Financial liabilities
Derivatives
Designated hedge accounting relationship
Held for trading
At amortised cost:
Deposits and other borrowings
Trade and other payables
Subordinated debt
The Group's principal financial assets comprise cash and cash equivalents, treasury notes and semi-government securities,
government securities, bank bills, commercial paper, fixed term deposits, floating rate notes, mortgage backed securities,
residential home loans, credit cards, and personal loans. The principal financial liabilities comprise of retail and business
deposits, negotiable certificates of deposit, medium term notes and subordinated debt. The main purpose of holding these
financial instruments is to generate a return on the capital invested by shareholders by earning a net interest margin. The Group
has various other financial instruments such as receivables and payables, which arise directly from its operations.
(b) Fair value of financial instruments
The Group measures fair value using the following fair value hierarchy, which reflects the significance of the inputs used in making
the measurements (please refer to Note 3(f)).
Valuation techniques include net present value and discounted cash flow models. Assumptions and inputs used in valuation
techniques include risk-free and benchmark interest rates, credit spreads and other premia used in estimating discount rates and
bond prices.
The objective of valuation techniques is to arrive at a fair value measurement that reflects the price that would be received to sell the
assets or paid to transfer the liability in an orderly transaction between market participants at the measurement date.
The Group uses widely recognised valuation models for determining the fair value of financial instruments such as
available-for-sale financial assets and interest rate swaps that use only observable market data and require little management
judgement and estimation. Observable prices or model inputs are usually available in the market for listed debt securities, and
simple over-the-counter derivatives such as interest rate swaps. Availability of observable market prices and model inputs reduces
the need for management judgement and estimation and also reduces the uncertainty associated with determining fair values.
Availability of observable market prices and inputs varies depending on the products and markets and is prone to changes based
on specific events and general conditions in the financial markets.
25,721
1,733,651
26,677 20,408
333,236
440,054 86,343
$'000
Consolidated
3,003,183
312,646
$'000
Company
332,760
19,534,241
$'000
21,770,305
20,081
7,246
4,172 2,104 2,353
2017
3,064,159
19,098
1,093,150 -
4,661
2017
19,583,112
252,270
22,503,585
2016
5,516
22,106
6,005
333,236
69,348
24,410,231
- 8,978 -
25,860
87,851
-
$'000
21,591,935
1,888,292
2016
1,093,150 -
250 - 250
22,583,561
332,760
8,978
24,132,279
Page 42

Members Equity Bank Limited
Notes to the financial statements
for the financial year ended 30 June 2017
25 Financial instruments (continued)
The following table shows an analysis of financial instruments recorded at fair value by level of the fair value hierarchy:
2017
Assets
Investments
Available-for-sale financial assets:
Treasury notes and semi-government securities
Bank bills
Corporate fixed rate notes
Corporate floating rate notes
Mortgage backed securities
Held for trading financial assets:
Government Securities
Derivatives
Designated hedge accounting relationship
Held for trading
Liabilities
Derivatives
Designated hedge accounting relationship
Held for trading
2016
Assets
Investments
Available-for-sale financial assets:
Treasury notes and semi-government securities
Bank bills
Corporate fixed rate notes
Corporate floating rate notes
Mortgage backed securities
Held for trading financial assets:
Government Securities
Derivatives
Designated hedge accounting relationship
Held for trading
Liabilities
Derivatives
Designated hedge accounting relationship
Held for trading
The Group does not have any financial instruments measured at level 1 and 3 and there were no transfers between level 1, 2, and 3
during the financial year.
-
235,359
-
493,690
-
$'000
99,234
26,677
-
493,690
$'000
Level 1
- -
-
- 250 - 250
- 26,927 - 26,927
- 1,677,490
3,064,159 - 3,064,159
26,677
$'000
Consolidated
$'000 $'000 $'000
Level 1
1,060,009
-
-
-
- -
Level 2 Level 3 Total
99,234
$'000
Total
1,093,150 - 1,093,150
-
-
2,981,442
-
8,978
-
-
-
1,060,009
-
2,353
-
-
Consolidated
$'000
Level 3Level 2
- 11,331 -
-
-
2,981,442
- 2,353
8,978
8,978
235,359
- 4,661 - 4,661
- - - -
- 4,661 - 4,661
- 360,965 - 360,965
- 990,915 - 990,915
- 25,529 - 25,529
- 1,677,490
- 9,260 - 9,260
- -
- 87,851 - 87,851
- - - -
- 87,851 - 87,851
Page 43

Members Equity Bank Limited
Notes to the financial statements
for the financial year ended 30 June 2017
25 Financial instruments (continued)
2017
Assets
Investments
Available-for-sale financial assets:
Treasury notes and semi-government securities
Bank bills
Corporate fixed rate notes
Corporate floating rate notes
Mortgage backed securities
Held for trading financial assets:
Government Securities
Derivatives
Designated hedge accounting relationship
Held for trading
Liabilities
Derivatives
Designated hedge accounting relationship
Held for trading
2016
Assets
Investments
Available-for-sale financial assets:
Treasury notes and semi-government securities
Bank bills
Corporate fixed rate notes
Corporate floating rate notes
Mortgage backed securities
Held for trading financial assets:
Government Securities
Derivatives
Designated hedge accounting relationship
Held for trading
Liabilities
Derivatives
Designated hedge accounting relationship
Held for trading
The Company does not have any financial instruments measured at level 1 and 3 and there were no transfers between level 1, 2,
and 3 during the financial year.
1,093,150
99,234
-
2,826,801
99,234
-
1,060,009
- -
- 1,060,009
Company
Level 1 Level 2 Level 3 Total
$'000 $'000 $'000 $'000
493,690
- 80,718 - 80,718
- - - -
493,690 - -
- - 1,093,150
-
- 2,104 - 2,104
- 11,082 - 11,082
- 20,408 - 20,408
- 250 - 250
8,978 - 8,978
2,826,801
-
- 20,658 - 20,658
Company
Level 1 Level 2 Level 3 Total
$'000 $'000 $'000 $'000
- 360,966 - 360,966
- 929,938 - 929,938
- 25,529 - 25,529
- 1,677,490 - 1,677,490
- 9,260 - 9,260
- - - -
- - - -
- 69,348 - 69,348
- 3,003,183 - 3,003,183
- 4,172 - 4,172
- - - -
- 4,172 - 4,172
- 69,348 - 69,348
Page 44
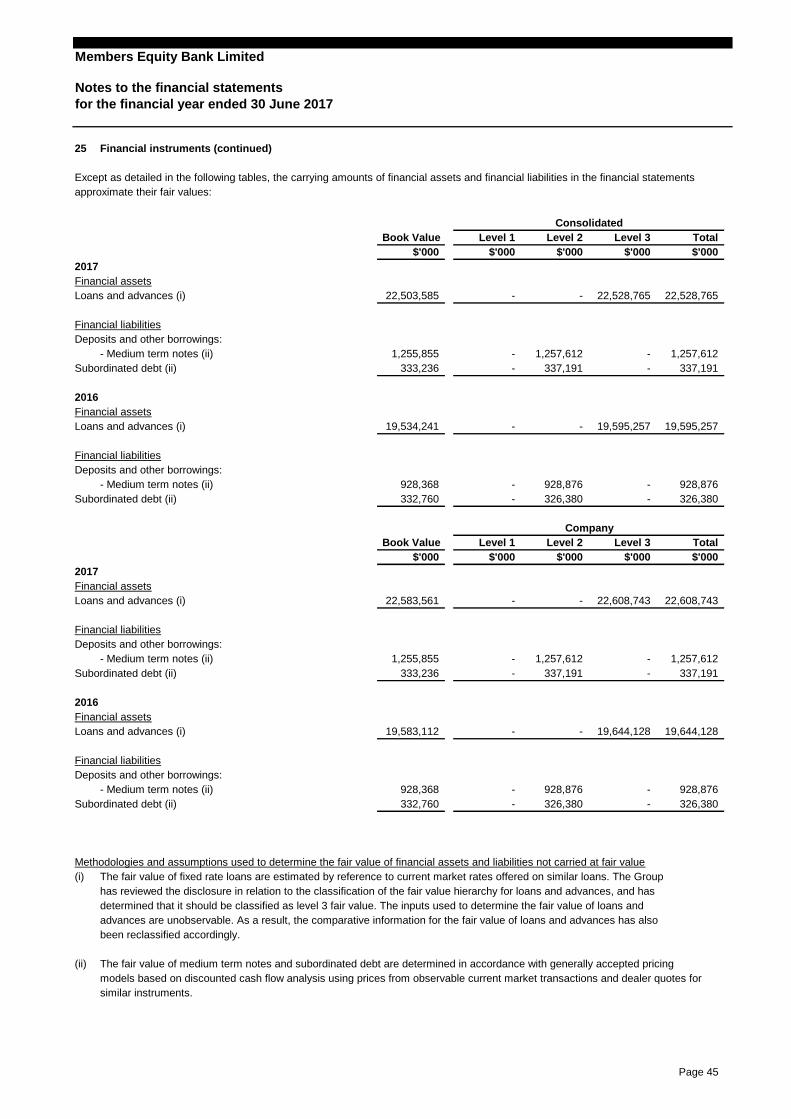
Members Equity Bank Limited
Notes to the financial statements
for the financial year ended 30 June 2017
25 Financial instruments (continued)
Except as detailed in the following tables, the carrying amounts of financial assets and financial liabilities in the financial statements
approximate their fair values:
2017
Financial assets
Loans and advances (i)
Financial liabilities
Deposits and other borrowings:
- Medium term notes (ii)
Subordinated debt (ii)
2016
Financial assets
Loans and advances (i)
Financial liabilities
Deposits and other borrowings:
- Medium term notes (ii)
Subordinated debt (ii)
2017
Financial assets
Loans and advances (i)
Financial liabilities
Deposits and other borrowings:
- Medium term notes (ii)
Subordinated debt (ii)
2016
Financial assets
Loans and advances (i)
Financial liabilities
Deposits and other borrowings:
- Medium term notes (ii)
Subordinated debt (ii)
Methodologies and assumptions used to determine the fair value of financial assets and liabilities not carried at fair value
(i) The fair value of fixed rate loans are estimated by reference to current market rates offered on similar loans. The Group
has reviewed the disclosure in relation to the classification of the fair value hierarchy for loans and advances, and has
determined that it should be classified as level 3 fair value. The inputs used to determine the fair value of loans and
advances are unobservable. As a result, the comparative information for the fair value of loans and advances has also
been reclassified accordingly.
(ii) The fair value of medium term notes and subordinated debt are determined in accordance with generally accepted pricing
models based on discounted cash flow analysis using prices from observable current market transactions and dealer quotes for
similar instruments.
-
19,583,112
333,236 337,191
337,191
-
326,380
22,528,765
-
$'000
22,528,765
$'000
19,644,128
22,583,561
Level 2
Consolidated
928,876 - 928,876
- 326,380
Company
326,380
928,368
$'000
Book Value
337,191
-
$'000
- 22,608,743
$'000
19,534,241
1,255,855
928,368
332,760
333,236
Book Value Level 1
- 1,257,612
928,876
-
$'000
-
332,760
22,503,585
-
-
1,255,855
$'000
- - 337,191
Level 1
1,257,612 1,257,612
-
Total
$'000
19,595,257
928,876
19,595,257
19,644,128
Level 3
$'000
$'000
- 326,380
Level 3
-
-
Level 2 Total
22,608,743
- -
-
-
-
1,257,612
-
Page 45

Members Equity Bank Limited
Notes to the financial statements
for the financial year ended 30 June 2017
26 Risk management
Overview
The Board has a Risk Management Framework to support the identification and management of all material risks across the Group.
A risk based assurance program provides line of sight across the management of all material risks, to help ensure both
regulatory obligations and business objectives are met.
The Risk Management Framework is centred around a unifying Risk Management Statement, signed by the CEO, which outlines
why good risk management is a critical enabler of the Group's corporate objective. There are four Risk Management Standards that
support the risk management policies, processes, guidelines, tools and practises that enable the Group to meet stakeholder
expectations, which are:
• Standard 1: Risk management leadership and accountability
• Standard 2: Risk identification and evaluation
• Standard 3: Risk control
• Standard 4: Risk management monitoring and reporting
Collectively, these elements of the framework:
• Allow the Board to establish and monitor risk appetite limits that reflect organisational strategy and good governance;
• Measure, across highly quantifiable risk classes such as credit, market, and liquidity risk, the risk capacity of the
organisation, and apply meaningful risk tolerances;
• Measure, across more qualitative risk classes, specifically operational risks, the relative distribution of risk exposures and
develop and apply meaningful risk appetite limits for 21 operational risk classes;
• Monitor risk exposures to risk limits and provide relevant reporting and insight, for both management/Board and
regulators;
• Ensure clear accountability for the key controls on which the Group relies on to operate an effective business and meet
regulatory and contractual obligations;
• Ensure adequate and effective business continuity and disaster recovery capabilities are in place, and regularly tested;
• Support the development of new or enhanced products and services, and the projects that deliver them;
• Provide insight for the Board on the risk culture of the organisation; and, overall,
• Assist the organisation make better risk based decisions to achieve its purpose and business objectives.
The framework supports a Three Lines of Defence governance model which is reflected across roles and responsibilities,
management and Board committee structures, decision making and reporting.
The risk management framework is a living document which is updated as required.
(a) Credit risk
Credit, in the context of the Group’s lending and investment activities, is the provision of funds on agreed terms and conditions to a
debtor or counterparty who is obliged to repay the amount borrowed or received. Credit may be extended, on a secured or
unsecured basis, by way of instruments such as mortgages, bonds, private placements, deposits, derivatives, and leases.
Credit risk arises as a consequence of contractual and/or contingent financial transactions between the provider and the user of
funds (the counterparty). Financial loss results when a counterparty fails to honour the terms and conditions of its obligations.
Credit risk loss levels can vary from expected levels due to a number of factors such as:
• failure to identify existing or potential credit risks when conducting lending and investment activities and then failing to develop
and implement sound and prudent credit policies to effectively manage and control these risks;
• inadequate credit granting, documentation, facility management and collection procedures;
• ineffective procedures to monitor and control the nature, characteristics, and quality of the credit portfolio; and
• failure to manage problem credits effectively.
Sound credit risk management involves establishing an appropriate credit risk strategy, maintaining a sound credit granting process,
maintaining appropriate credit administration, measurement and monitoring processes and ensuring adequate controls over credit
risk are in place for prudently managing the risk and reward relationship throughout the entire credit life cycle. The Group’s credit
risk control principles seek to effectively manage the impact of credit risk-related events.
Maximum exposure to credit risk
The carrying amount of financial assets recorded in the financial statements, net of any impairment allowance, represents the
Group's maximum exposure to credit risk. In respect to residential home loans, the Group holds mortgages over the residential
Page 46
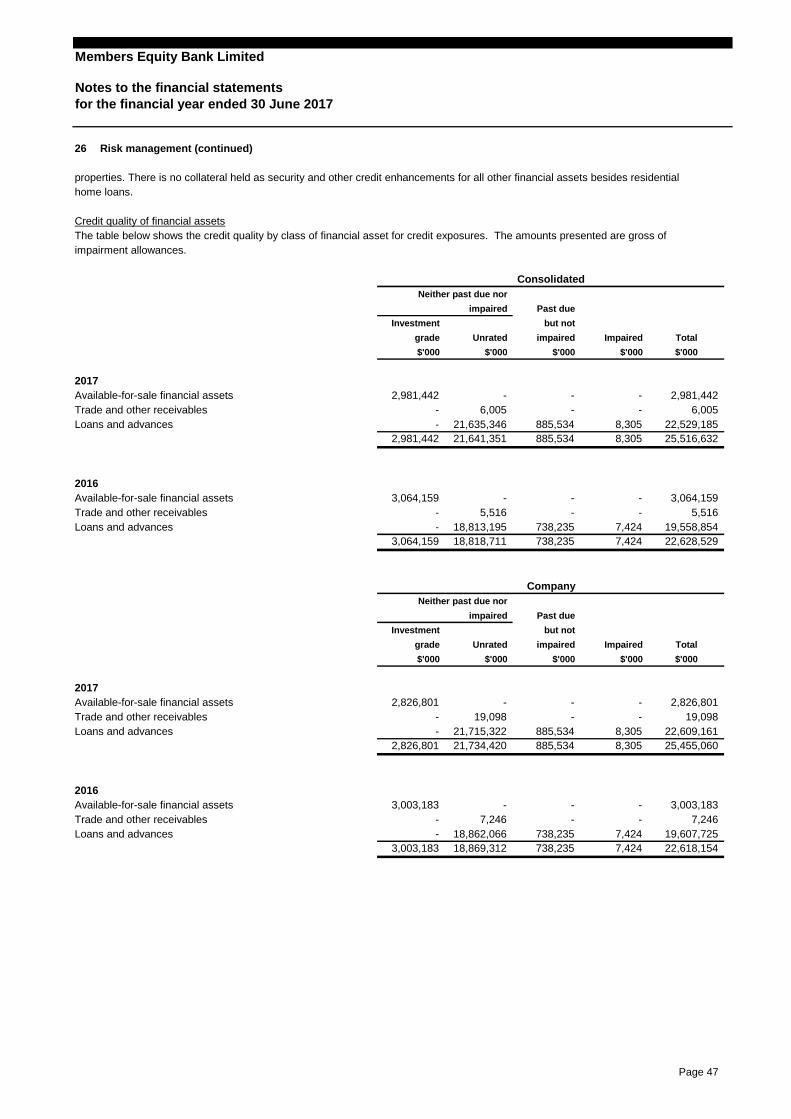
Members Equity Bank Limited
Notes to the financial statements
for the financial year ended 30 June 2017
26 Risk management (continued)
properties. There is no collateral held as security and other credit enhancements for all other financial assets besides residential
home loans.
Credit quality of financial assets
The table below shows the credit quality by class of financial asset for credit exposures. The amounts presented are gross of
impairment allowances.
2017
Available-for-sale financial assets
Trade and other receivables
Loans and advances
2016
Available-for-sale financial assets
Trade and other receivables
Loans and advances
2017
Available-for-sale financial assets
Trade and other receivables
Loans and advances
2016
Available-for-sale financial assets
Trade and other receivables
Loans and advances
$'000
3,003,183
7,424
3,003,183
-
738,235
8,305
grade
2,981,442
5,516
Investment
885,534
impaired
Neither past due nor
-
$'000
Past due
-
impaired
-
Unrated
-
-
-
-
18,869,312
21,715,322
18,818,711
22,529,185
25,516,632 885,534
21,635,346
- 5,516
885,534
$'000
Unratedgrade
-
2,826,801
6,005
Total
3,064,159
2,826,801
18,813,195 7,424
Total
-
22,609,161
-
but not
Consolidated
but not
7,424
- - -
8,305
22,618,154
$'000
Neither past due nor
-
$'000
-
-
Investment
-
738,235
-
21,641,351 2,981,442
$'000
8,305 25,455,060
19,098
19,558,854
19,098
$'000
impaired
21,734,420
-
3,064,159
Company
-
7,246
impaired
738,235
2,826,801
-
-
885,534
18,862,066
3,003,183
738,235
-
19,607,725
-
7,246
2,981,442
6,005
3,064,159
22,628,529
8,305
-
Impaired
Past due
Impaired
$'000
-
$'000 $'000
7,424
Page 47

Members Equity Bank Limited
Notes to the financial statements
for the financial year ended 30 June 2017
26 Risk management (continued)
Past due financial assets
The following table details the financial assets that are past due but not impaired at the reporting date:
2017
Net loans and advances
Credit cards
Personal loans
Residential home loans
2016
Net loans and advances
Credit cards
Personal loans
Residential home loans
A facility is considered to be past due when a contractual payment falls overdue by one or more days. When a facility is classified as
past due, the entire facility balance is disclosed in the past due analysis.
The Group assesses the allowances for impairment on loans and advances on a collective basis. Any loan facility where an
assessment of probability of default or loss would give rise to a reasonable expectation that the facilities in question will need in
the short term to be subject to a write-down or write-off will be assessed for impairment on an individual basis. Impairment
allowances are evaluated at each reporting date, unless unforeseen circumstances require more careful attention.
Impairment allowance
Reconciliation of impairment allowance by class is as follows:
Balance 1 July 2015
Impairment allowance
Balances written off
Amounts recovered
Balance 30 June 2016
Balance 1 July 2016
Impairment allowance
Balances written off
Amounts recovered
Balance 30 June 2017
4,978
615,204
126,668
2,730
home
-
(15,384)-
-
443
-
(443)
443
2,738
123,046
$'000
Consolidated
Credit
Total
3,768 14,145
2,562
8,666
87
loans
-
(46)
(5,917)
1,141
25,757
3
$'000
1,793
2,060
(1,618)
22,497
Overdrawn
157
(32)
9,160
29
accounts
24,693
loans
1,020
7,803
853,443
< 30 days
$'000
885,534
$'000
Residential
$'000
31 - 60
590,716
126,668
-
< 30 days Total
Consolidated and Company
$'000
709,610
$'000
457,799
-
11,820
13,710
$'000
82,945
$'000
days
947
1,872
13,704
44,018
16,735 -
(16,927)
14,921
61 - 90
3,211
1,315
(5,814)
-
12,100
Personal
6,043
(8,450)
(642)
437
$'000
45,820
48,560
Asset
1,967 10,969 7,803
(596)
3,560
3,431
$'000
2,955
3,431
cards
10,969
(1,371)
253
88,216 123,046
finance
7,843 489
12,668
$'000
> 90 days
9,917
738,235
Consolidated and Company
Total
10,697
days
61 - 90
1,973
92,041
$'000
-
4,340
5,511
-
Commercial
46,605
478,413
3,043
715
days
$'000
(412)
loans
7,956
31 - 60
$'000
97,057
15,356
-
days
$'000
$'000
customer
2,245
1,967
-
(389)
80
24,693
405
80
910
(8,441)
> 90 days
Page 48

Members Equity Bank Limited
Notes to the financial statements
for the financial year ended 30 June 2017
26 Risk management (continued)
Balance 1 July 2015
Impairment allowance
Balances written off
Amounts recovered
Balance 30 June 2016
Balance 1 July 2016
Impairment allowance
Balances written off
Amounts recovered
Balance 30 June 2017
Collateral held and other credit enhancements, and their financial effect
The Group holds collateral and other credit enhancements against certain of its credit exposures. The table below sets out the
principal types of collateral held against different types of financial assets.
Principal types of collateral
held
Derivative assets (i) Cash
Loans and advances:
Credit cards None
Personal loans None
Residential home loans Residential property
Commercial loans (ii) (iii) Commercial and residential property
Asset finance (ii) (iii) Floating charges over corporate assets
(i) Derivative transactions are entered into under ISDA master netting agreements. In general, under ISDA master netting
agreements in certain circumstances - e.g. when a credit event such as a default occurs - all outstanding transactions under
the agreement are terminated, the termination value is assessed and only a single net amount is due or payable in settlement
of all transactions.
(ii) The general creditworthiness of a business customer (commercial loans and asset finance) tends to be the most relevant
indicator of credit quality of a loan extended to it. However, collateral provides additional security and the Group generally
requested that business borrowers provide it. The Group may take collateral in the form of a first charge over real estate,
floating charges over all borrower assets and other liens and guarantees.
(iii) On 1 December 2016, the commercial loans and asset finance portfolios were divested.
Offsetting financial assets and financial liabilities
As at 30 June 2017, there are no financial assets and financial liabilities that are offset in the Group's statement of financial position.
The Group considers the ISDA master netting agreements do not meet the criteria for offsetting in the statement of financial position.
This is because they create for the parties to the agreement a right of set-off of recognised amounts that is enforceable only
following an event of default, insolvency or bankruptcy of the Group or the counterparties or following other predetermined events
(please refer to Note 16).
(1,618)
(46)
974 (443)
(387)
-
100%
Total
22,497
Percentage of exposure
100%
- -
100%
12,100
-
(1,371) 435
-
collateral requirements
9,160 -
(32)
that is subject to
home
--
2017
3,768
-
2,673
4,978
13,772
(15,381)
100%
(16,927)
6,043
(5,916)
25,756
(5,814)
4,340
5,511 8,666
7,803
443
cards
1,314
Residential
Asset
10,969
$'000
87
Company
$'000
3,431
Overdrawn
14,144
24,692
Personal
(642)
$'000
Commercial
- 3
-
404
$'000
2016
3,431
489 7,956
10,969
-
189 -
7,843
loans
-
1,020
156
1,967 79
Credit
2,955
(596)
$'000
customer
finance
1,967
(8,441)
79
(8,450)
$'000
-
29 1,141
7,803
2,245
24,692
loans
443
3,560
-
loans
2,730
-
$'000
(412)
2,562
accounts
Page 49

Members Equity Bank Limited
Notes to the financial statements
for the financial year ended 30 June 2017
26 Risk management (continued)
(b) Liquidity risk
Liquidity risk is the risk that the Group will encounter difficulty in accessing funds to meet commitments. The objectives of the
liquidity risk policies are to ensure that the obligations of the Group to the Australian payments system are met on a daily basis and
to ensure the Group has sufficient access to liquidity to allow depositors and other creditors to have access to their funds
whenever they are contractually entitled to them. The ability to meet these obligations is required both under normal business
conditions and under stressed business conditions.
The Group develops contingency plans to fund business activities as follows:
Under normal business conditions, the Group will maintain its Liquidity Coverage Ratio (LCR) ratio as required by APRA Prudential
Standards (APS) 210 "Liquidity" from 1 January 2017, plus a buffer over the LCR at all times.
Under adverse business conditions:
The Group will conduct regular stress testing of its liquidity position under the criteria proposed by APRA. As a minimum:
• The Group will maintain a positive net cash flow position under a name specific crisis scenario for a minimum period of 5
business days; and
• The Group will maintain a positive net cash flow position under a market or systemic crisis scenario for a minimum period of
15 months.
Under stressed conditions the minimum liquid asset portfolio is available to cover forecast cash outflows.
The table below summarises the maturity profile of the Group's financial liabilities as at 30 June 2017 based on contractual
undiscounted repayment obligations, including interest repayments up to the maturity date. Repayments which are subject to
notice are treated as if notice were given immediately. However, the Group expects that many customers will not request
repayment on the earliest date the Group could be required to pay and the table does not reflect the expected cash flows
indicated by the Group's deposit retention history.
2017
Deposits and other borrowings
Trade payables
Subordinated debt
Net settled:
Interest rate swaps (cash flow hedges)
Interest rate swaps (held-for-trading)
Foreign exchange contracts (cash flow hedges)
Total undiscounted cash flows
2016
Deposits and other borrowings
Trade payables
Subordinated debt
Net settled:
Interest rate swaps (cash flow hedges)
Interest rate swaps (held-for-trading)
Foreign exchange contracts (cash flow hedges)
Total undiscounted cash flows
25,721
$'000
to 1 year years
3,867,781
-
3,867,781 1,502,648
(19,134)
7,813,754 4,511,984
-
-
-
-
-
-
- - 270
1 - 5
months
-
4,511,984 5,809,458
362,390
(294)
$'000
7,816,366
7,239,717
-
1,743,092
11,169
-
0 - 3
At call
-
3 mths
-
(13,757)
379,921 11,804
-
3,983 63,206
(30)
5,033,065 7,232,387 1,574,297
-
6,088,854
(13,976)
-
$'000$'000
-
Consolidated
59,737
$'000
5,616,054
(9,736)
(736)
1,009 -
-
20,081
5 years
More than
5,829,193
5,708,933
5,978,444
8,443
-
-
3,780
-
5,022,977
1,802,820
(282)
-
- - - - -
Page 50

Members Equity Bank Limited
Notes to the financial statements
for the financial year ended 30 June 2017
26 Risk management (continued)
2017
Deposits and other borrowings
Trade payables
Subordinated debt
Net settled:
Interest rate swaps (cash flow hedges)
Interest rate swaps (held-for-trading)
Foreign exchange contracts
Total undiscounted cash flows
2016
Deposits and other borrowings
Trade payables
Subordinated debt
Net settled:
Interest rate swaps (cash flow hedges)
Interest rate swaps (held-for-trading)
Foreign exchange contracts
Total undiscounted cash flows
(c) Market risk
Market risk is defined as the risk of loss arising from movements in market prices. The primary market risk exposures for the Group
are interest rate risk and currency risk.
Interest rate risk
The two key risk measures monitored by management are the exposure of market value of equity (MVE) to movements in interest
rates and the volatility in forecast earnings over the next 12 months due to volatility in net interest income (NII).
The Group uses a simulation modelling approach to measuring NII volatility. The modelling takes a dynamic approach, including
simulation of the forecast balance sheet over the next 12 months. Key inputs into the simulation include forecast growth, the price
and portfolio mix of new business written, repayment rates and maturity profiles.
Under this simulation model variable rate and non contractual assets and liabilities are assumed to reprice in the first month of the
forward gap profile. Fixed rate assets and liabilities are assumed to reprice in the sooner of month of next rate set date or maturity
date.
Interest rate sensitivity analysis
The following table details the sensitivity of the Group's forecast 1 year pre tax NII and MVE to a 2% parallel shock in forward
interest rates. The simulation modelling contains a floor of 0% where the interest rate on a recognised financial instrument is below 2%.
NII measures do not take into account the potential impact of market movements on profit and loss due to the mark to market
treatment of those financial assets and liabilities carried at fair value through profit or loss at reporting date.
MVE sensitivity was calculated using a 2% parallel shock in forward interest rates at reporting date, assuming all financial assets
and liabilities are measured at fair value regardless of their accounting treatment.
30 June 2017
30 June 2016
$'000
(11,752)
- - 270 1,009 -
5,809,458
-
-
4,511,984
(12,275)
56,852 29,135
-
years
7,816,793
- -
-
-
(294)
Company
(10,718) 1,053
- 63,206
362,390
0 - 3
(6,773)
$'000
(19,298)
3,983
5,832,295
(736)
25,860
-
11,804
-
5,022,977
-
5,978,444 1,804,155
months
$'000
5 years
2% increase 2% decrease
Consolidated and Company
-
22,106
1,743,092
to 1 year
3 mths
At call
More than
$'000
1 - 5
$'000
3,780 11,169
1,502,476
-
-
2% decrease
22,871
-
Net interest income
32,767
$'000
(23,440)
- -
2% increase
$'000
5,708,933
10,611
3,867,781
5,616,054
59,737
-
$'000 $'000
6,088,854
4,511,984
(49,603)
3,867,781 5,038,778 7,239,246 1,576,293
-
(30)
7,816,366
-
7,239,717
MVE
(10,288)
379,921
-
Page 51
Members Equity Bank Limited
Notes to the financial statements
for the financial year ended 30 June 2017
26 Risk management (continued)
Currency risk
Currency risk is the risk that the value of a financial instrument will fluctuate due to changes in foreign exchange rates.
As at the end of the financial year, there is no material currency risk exposure on the Group's monetary assets and liabilities and its
forecast cash flows (2016: $nil).
(d) Operating risk
Operating risk is the risk of direct or indirect loss resulting from inadequate or failed internal processes, people and systems or from
external events.
Where possible and appropriate, the Group builds operational risk controls into each of its processes. Control processes are
designed to be appropriate to the activities conducted. While it is not possible to specify all types of control processes, the following
controls are implemented wherever appropriate:
• integration of controls in processes and role responsibilities;
• promoting compliance within the process and with all relevant laws and regulatory requirements;
• maintaining safeguards for access to, and use of, assets and records;
• where possible and appropriate, the segregation of duties through role and system-based segregation to protect against
internal fraud and avoiding conflicts of interest;
• promoting effective IT security practices, including system access controls;
• clearly communicated policies and procedures; and
• monitoring of adherence to assigned risk limits or thresholds.
(e) Macro-economic, political and regulatory risks
The Group's performance may be subject to changes in economic conditions in Australia (and globally), and any governmental or
regulatory response to those changing conditions. The changes in economic conditions could include:
• changes in economic growth, unemployment levels and consumer confidence which may lead to a decline in the demand
for the Group's products and services and the quality of existing portfolio of loans;
• changes in fiscal and monetary policy, including inflation and interest rates, which may impact profitability or cause a
decline in the demand for the Group's products and services;
• declines in aggregate investment and economic output in Australia or in key offshore regions;
• national or international political and economic instability or the instability of national or international financial markets; and
• changes in residential real estate values.
Although the Group has in place a number of strategies to minimise the exposure to economic risk and will engage in
prudent management practices to minimise its exposure in the future, these factors may nonetheless have an adverse impact on
financial performance and position. As part of these strategies the Group will undertake regular stress testing of its portfolios,
but this testing might not anticipate the exact circumstances of the change in the various factors which have an impact on the
economy, or on the Group.
The financial services industry, and banking in particular, is currently the subject of increased public scrutiny and government
and regulatory oversight, including the potential for a Royal Commission into banking. The 2017 Australia Federal Budget outlined
a number of changes to the supervision of the banking industry, including the provision of additional powers to APRA as part of
its prudential supervisory responsibilities. This is an area which continues to be the subject of significant public discussion and
media coverage.
The Group is subject to a broad range of regulatory and legal oversight, including by, among others, APRA, the Reserve Bank of
Australia, the Australian Competition and Consumer Commission, ASIC and Australian Transaction Reports and Analysis Centre.
These regulators (with others) are responsible for a broad range of laws, prudential requirements, regulations, policies and
other standards, the change in, or implementation or interpretation of, which could affect ME either directly or indirectly in
substantial and unpredictable ways.
Page 52
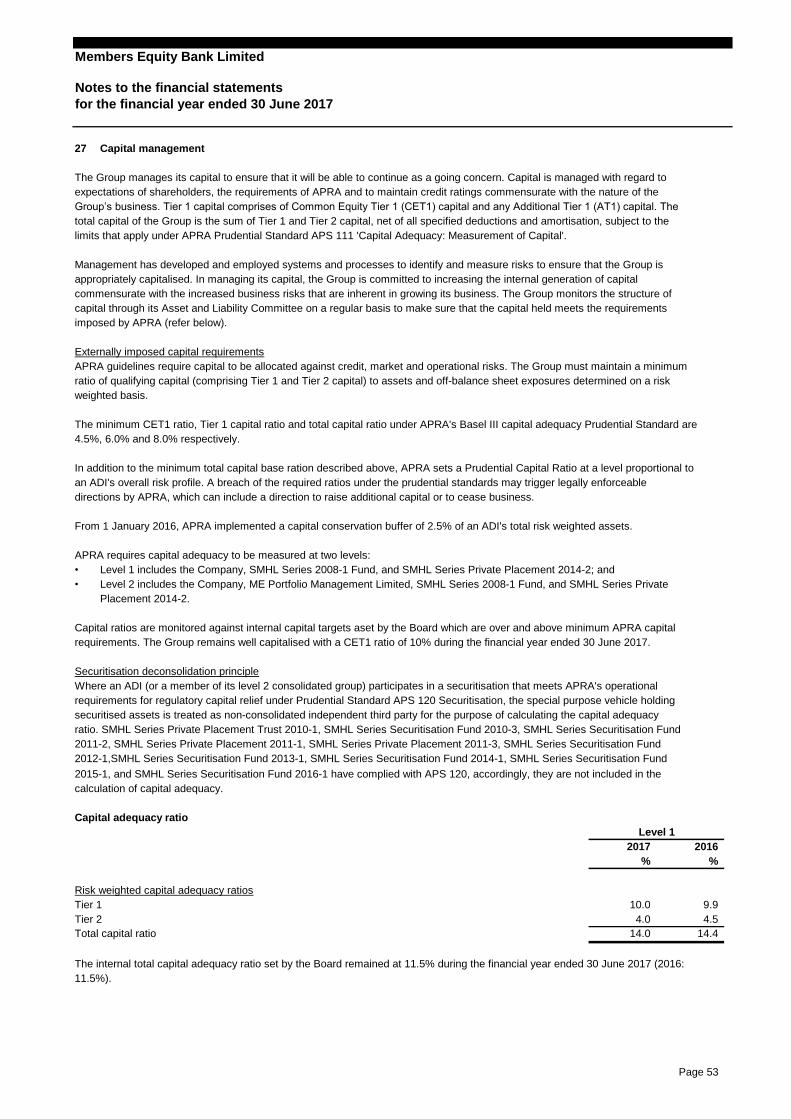
Members Equity Bank Limited
Notes to the financial statements
for the financial year ended 30 June 2017
27 Capital management
The Group manages its capital to ensure that it will be able to continue as a going concern. Capital is managed with regard to
expectations of shareholders, the requirements of APRA and to maintain credit ratings commensurate with the nature of the
Group’s business. Tier 1 capital comprises of Common Equity Tier 1 (CET1) capital and any Additional Tier 1 (AT1) capital. The
total capital of the Group is the sum of Tier 1 and Tier 2 capital, net of all specified deductions and amortisation, subject to the
limits that apply under APRA Prudential Standard APS 111 'Capital Adequacy: Measurement of Capital'.
Management has developed and employed systems and processes to identify and measure risks to ensure that the Group is
appropriately capitalised. In managing its capital, the Group is committed to increasing the internal generation of capital
commensurate with the increased business risks that are inherent in growing its business. The Group monitors the structure of
capital through its Asset and Liability Committee on a regular basis to make sure that the capital held meets the requirements
imposed by APRA (refer below).
Externally imposed capital requirements
APRA guidelines require capital to be allocated against credit, market and operational risks. The Group must maintain a minimum
ratio of qualifying capital (comprising Tier 1 and Tier 2 capital) to assets and off-balance sheet exposures determined on a risk
weighted basis.
The minimum CET1 ratio, Tier 1 capital ratio and total capital ratio under APRA's Basel III capital adequacy Prudential Standard are
4.5%, 6.0% and 8.0% respectively.
In addition to the minimum total capital base ration described above, APRA sets a Prudential Capital Ratio at a level proportional to
an ADI's overall risk profile. A breach of the required ratios under the prudential standards may trigger legally enforceable
directions by APRA, which can include a direction to raise additional capital or to cease business.
From 1 January 2016, APRA implemented a capital conservation buffer of 2.5% of an ADI's total risk weighted assets.
APRA requires capital adequacy to be measured at two levels:
• Level 1 includes the Company, SMHL Series 2008-1 Fund, and SMHL Series Private Placement 2014-2; and
• Level 2 includes the Company, ME Portfolio Management Limited, SMHL Series 2008-1 Fund, and SMHL Series Private
Placement 2014-2.
Capital ratios are monitored against internal capital targets aset by the Board which are over and above minimum APRA capital
requirements. The Group remains well capitalised with a CET1 ratio of 10% during the financial year ended 30 June 2017.
Securitisation deconsolidation principle
Where an ADI (or a member of its level 2 consolidated group) participates in a securitisation that meets APRA's operational
requirements for regulatory capital relief under Prudential Standard APS 120 Securitisation, the special purpose vehicle holding
securitised assets is treated as non-consolidated independent third party for the purpose of calculating the capital adequacy
ratio. SMHL Series Private Placement Trust 2010-1, SMHL Series Securitisation Fund 2010-3, SMHL Series Securitisation Fund
2011-2, SMHL Series Private Placement 2011-1, SMHL Series Private Placement 2011-3, SMHL Series Securitisation Fund
2012-1,SMHL Series Securitisation Fund 2013-1, SMHL Series Securitisation Fund 2014-1, SMHL Series Securitisation Fund
2015-1, and SMHL Series Securitisation Fund 2016-1 have complied with APS 120, accordingly, they are not included in the
calculation of capital adequacy.
Capital adequacy ratio
Risk weighted capital adequacy ratios
Tier 1
Tier 2
Total capital ratio
The internal total capital adequacy ratio set by the Board remained at 11.5% during the financial year ended 30 June 2017 (2016:
11.5%).
4.0
%
2017 2016
14.0
%
14.4
Level 1
4.5
10.0 9.9
Page 53

Members Equity Bank Limited
Notes to the financial statements
for the financial year ended 30 June 2017
28 Director and key management personnel compensation
(a) Details of key management personnel
The directors of the Company and other key management personnel of the Group during the year were:
Directors - Company
K Hodgson Chairman
C Bart (appointed 1 July 2016)
C Christian
G Combet
A De Salis (retired 14 November 2016)
J Milne (leave of absence from 1 April 2017 to 31 October 2017)
J Nesbitt (appointed 2 February 2017)
E Rubin (appointed 4 October 2016)
G Weaven (retired 31 December 2016)
Key management personnel
J McPhee Chief Executive Officer
A Aboud Chief Change Officer
A Beck Group Executive, Industry Affairs (resigned 1 July 2016)
C Cataldo Chief Risk Officer
G Dickson Chief Financial Officer
M Gay Chief Information Officer
H Gordon Group Executive, People Experience (resigned 3 July 2017)
I Purcell Acting Group Executive, People Experience (appointed 15 May 2017)
R James Chief Marketing Officer (resigned 22 August 2017)
A Middleton Group Executive, Sales
C Ralston Group Executive, Service Excellence
The Company remunerates all directors and key management personnel within the Group.
(b) Aggregate compensation made to key management personnel
The aggregate compensation made to key management personnel of the Group is set out below:
Key management personnel
Short term benefits
Other long term benefits
Termination benefits
Total key management personnel compensation
During the year the Group refined its application of the definitions of short term and other long term benefits. The prior year
comparatives have been updated to conform with the new interpretations for comparability.
Company
$
-
5,277,125
935,235
309,405
2016
6,483,084
2017
6,859,956
1,205,959
5,615,316
$
Page 54

Members Equity Bank Limited
Notes to the financial statements
for the financial year ended 30 June 2017
28 Director and key management personnel compensation (continued)
(c) Aggregate compensation made to directors
Board schedule of fees of the Company
Chair of the Board
Member of the Board
Audit and Governance Committee
Chair of the committee
Committee member
Risk and Compliance Committee
Chair of the committee
Committee member
People and Remuneration Committee
Chair of the committee
Committee member
Digital Committee (formerly Technology Committee)
Chair of the committee
Committee member
The aggregate compensation (entirely consisting of short term benefits) made to directors is set out below:
$
6,750 6,750
2017 2016
$
Director
6,750
13,500
168,000 168,000
84,000
Audit & Governance Committee 6,750
2017
84,000
Company
13,500
6,750
13,500
13,500
6,750
membership
Committee
6,750
6,750
13,500 13,500
-
153,000
42,000 Member of the Board
5,140 6,750
People & Remuneration Committee (ceased 14 November 2016) 6,750
97,500
2,492
-
13,500
Risk & Compliance Committee (ceased 5 April 2017)
13,500
6,750
8,671
Chair, Digital Committee (appointed 6 April 2017)
-
-
5,140 6,750
Risk & Compliance Committee (ceased 5 April 2017)
Chair, Risk & Compliance Committee (appointed 13 November 2015) 13,500
-
Audit & Governance Committee (ceased 5 April 2017)
2,492
97,500
441
Chair, People & Remuneration Committee
84,000
13,059
1,610 -
6,750
99,109
6,750
35,999
$$
97,500
5,140
-
13,500 13,500
193,390
3,219
2016
8,671
Risk & Compliance Committee
Member of the Board
Digital Committee (appointed 6 April 2017) 1,610
Audit & Governance Committee (appointed 8 June 2017)
Risk & Compliance Committee (ceased 12 November 2015) -
31,015 84,000
Technology Committee (ceased 12 November 2015)
84,000 G Combet Member of the Board 84,000
- 2,414
111,000 108,584
Digital Committee (ceased 14 Novemebr 2016)
A De Salis Member of the Board (ceased 14 Novemeber 2016)
Chair, Audit & Governance Committee (ceased 7 June 2017)
People & Remuneration Committee (appointed 6 April 2017)
6,750
K Hodgson Chair of the Board 168,000 84,000
6,750
C Bart 84,000
5,140 - Digital Committee (ceased 5 April 2017)
C Christian Member of the Board 84,000
2,414
2,414
Page 55

Members Equity Bank Limited
Notes to the financial statements
for the financial year ended 30 June 2017
28 Director and key management personnel compensation (continued)
Total directors compensation
29 Related party transactions
(a) Equity interests in related parties
Equity interests in subsidiaries
Details of the percentage of ordinary shares held in subsidiaries are disclosed in Note 10 to the financial statements.
(b) Transactions with directors and key management personnel
(i) Key management personnel compensation
Details of director and key management personnel compensation are disclosed in Note 28 to the financial statements.
(ii) Other transactions with key management personnel
Some of the directors and key management personnel held deposit accounts, home loan accounts and credit cards
with the Group throughout the year. These accounts operate within a normal customer relationship on terms and conditions
no more favourable than for other customers of the Company.
(c) Transactions between the Company and its subsidiaries
(i) During the financial year ended 30 June 2017, the following transactions occurred between the Company and its subsidiaries:
• Management fees received or receivable from the subsidiary entity of $5,950,921 (2016: $10,354,320);
• Mortgage manager fee paid or payable to the subsidiary entity of $22,311 (2016: $20,875); and
• The Company is the parent entity of a tax consolidated-group.
Payments to/from the Company are made in accordance with the terms of the tax funding and sharing agreement.
(ii) The following balances arising from transactions between the Company and its subsidiaries are outstanding at the reporting
date:
• Net receivables of $592,335 are owed from the subsidiary entity (2016: $1,033,842 ).
All amounts advanced or payable to related parties are unsecured. The amounts outstanding will be settled in cash. No
guarantees have been given or received. No expense has been recognised in the year for bad or doubtful debts in respect of the
amounts owed by related parties.
84,000
-
-
-
34,569
3,375
2,778
39,900 -
62,677 -
-
2016
1,817
2017
97,500
-
Risk & Compliance Committee (appointed 2 February 2017)
People & Remuneration Committee (appointed 1 January 2017)
69,427
13,500
Member of the Board
Committee
membership
Chair, Audit & Governance Committee (appointed 8 June 2017) 883 -
Digital Committee (appointed 1 January 2017)
Chair of the Board (appointed 6 February 2015 and ceased 31 December 2015) - 84,000
Member of the Board 64,615
Audit & Governance Committee (ceased 7 June 2017) 1,670
-
Chair, People and Remuneration Committee (ceased 31 December 2016) 3,635
45,231
Director
J Nesbitt
Chair, Digital Committee (ceased 31 March 2017) 10,385
686,834
$
People & Remuneration Committee (appointed 1 January 2017, ceased 31 March 2017)
76,817
G Weaven
Member of the Board (ceased 31 December 2016)
772,008
6,750
Member of the Board
J Milne
E Rubin
3,375
48,866 132,750
$
-
42,000
Page 56
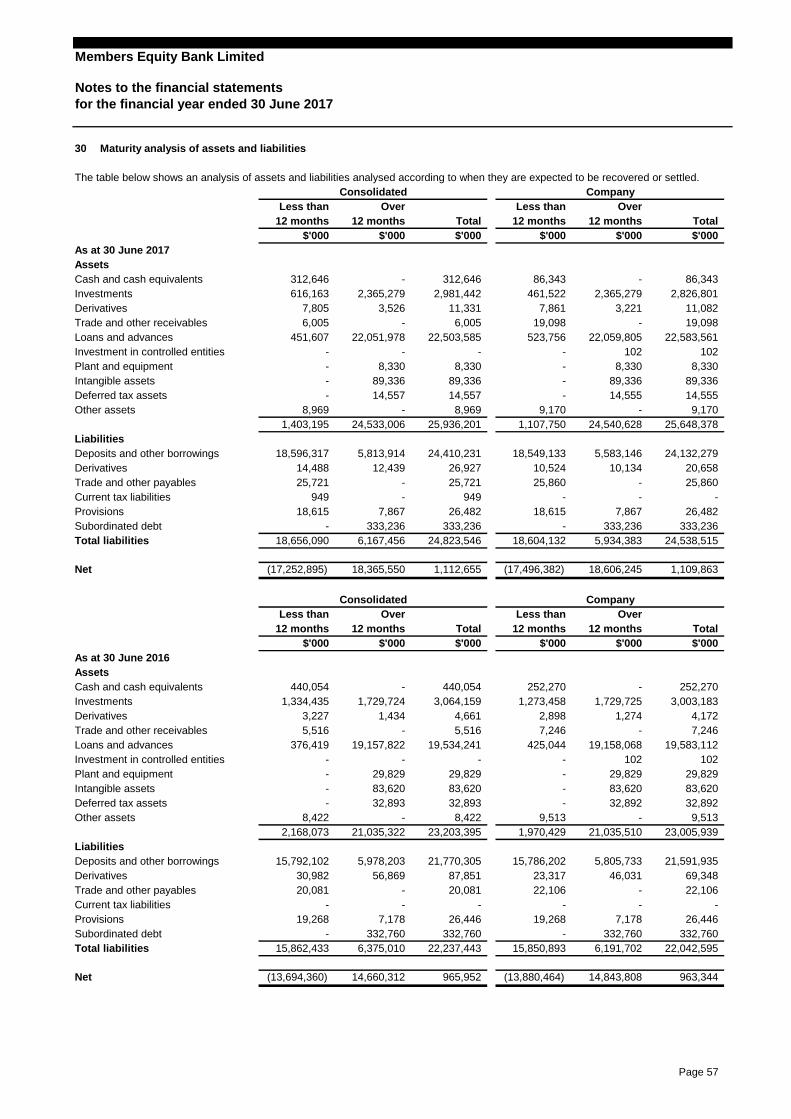
Members Equity Bank Limited
Notes to the financial statements
for the financial year ended 30 June 2017
30 Maturity analysis of assets and liabilities
The table below shows an analysis of assets and liabilities analysed according to when they are expected to be recovered or settled.
As at 30 June 2017
Assets
Cash and cash equivalents
Investments
Derivatives
Trade and other receivables
Loans and advances
Investment in controlled entities
Plant and equipment
Intangible assets
Deferred tax assets
Other assets
Liabilities
Deposits and other borrowings
Derivatives
Trade and other payables
Current tax liabilities
Provisions
Subordinated debt
Total liabilities
Net
As at 30 June 2016
Assets
Cash and cash equivalents
Investments
Derivatives
Trade and other receivables
Loans and advances
Investment in controlled entities
Plant and equipment
Intangible assets
Deferred tax assets
Other assets
Liabilities
Deposits and other borrowings
Derivatives
Trade and other payables
Current tax liabilities
Provisions
Subordinated debt
Total liabilities
Net
- 6,005
12 months
2,365,279
3,526
Consolidated
14,555 14,557
-
12 months
Over
18,365,550
-
89,336
1,403,195
18,615
18,656,090
10,134
-
Total
20,658
9,170
Less than Over
(17,496,382)
18,549,133
333,236
25,860
24,823,546
949 -
24,132,279
89,336
7,867
451,607
$'000
3,221 11,082
86,343
461,522
- 312,646
Total
22,051,978 523,756
4,172
12 months
-
2,826,801
8,330
102 102
19,098
8,330
18,596,317
-
25,721
14,488
949
14,557
5,813,914
-
1,434
1,729,724
8,330
22,042,595
8,422
440,054
9,513
19,534,241
$'000 $'000
26,446
20,081 22,106
19,583,112
332,760
83,620 -
965,952 (13,880,464) 14,843,808
1,274
6,167,456
-
-
12 months
29,829
18,604,132
5,978,203
963,344
22,237,443 15,850,893
7,246
1,109,863 18,606,245
252,270
Total
20,081
-
87,851
Less than
1,112,655
21,035,510 23,005,939
32,892
102
Consolidated Company
2,168,073
56,869
7,178
15,792,102
30,982
- -
1,334,435
440,054
5,516
$'000
-
102
83,620
$'000
-
-
26,446
-
19,158,068
5,805,733
7,246
4,661
6,191,702
-
7,178
69,348
21,591,935
6,375,010
21,035,322
-
332,760
14,660,312
(17,252,895)
3,227
376,419
19,268
23,203,395 1,970,429
15,862,433
-
19,268
332,760
5,516
23,317
32,893 32,892
- 29,829
(13,694,360)
29,829
83,620
-
-
22,106
332,760
21,770,305
-
46,031
15,786,202
83,620
$'000
3,003,183
-
-
5,934,383
-
12,439
-
-
8,422
- 32,893
19,157,822
-
-
25,648,378 24,533,006 24,540,628
14,555
25,936,201
-
- 9,170
89,336
9,513
-
2,898
-
333,236
3,064,159
-
1,273,458
252,270
333,236
1,729,725
29,829
25,721
$'000
-
24,538,515
-
5,583,146
7,867
26,927
26,482
-
8,969
24,410,231
18,615
425,044
-
-
333,236
22,059,805 22,583,561
8,330 -
19,098
$'000
12 months
6,005
Over Less than
-
12 months
25,860
1,107,750
-
- - -
26,482
10,524
$'000
11,331
8,969
89,336
22,503,585
7,805
312,646
7,861
2,365,279 2,981,442 616,163
86,343
12 months Total
$'000 $'000$'000
12 months
Over
Company
Less than
Page 57

Members Equity Bank Limited
Notes to the financial statements
for the financial year ended 30 June 2017
31 Remuneration of auditors
Audit and Review of Financial statements
Regulatory audits
Tax services
Other services
The auditor of the Group is Deloitte Touche Tohmatsu.
32 Subsequent events
There are no matters or circumstances occurring subsequent to the end of the financial year that have significantly affected, or
may significantly affect, the operations of the Group, the results of those operations, or the state of affairs of the Group in
future financial years.
418,500
2017
147,319 599,035 130,440 561,735
351,500
2016
108,000
2017
$ $ $$
1,097,819
2016
1,455,035
439,000 418,500
395,500
439,000
1,369,735
321,500
1,028,940
116,000
CompanyConsolidated
108,000
281,500
116,000
Page 58