membrane action of composite structures in case of fire
TRANSCRIPT
XV- 1410-12 Membrane action of composite structures in case of fire
19.06.2012
COMMISSION XV
DESIGN,
ANALYSIS AND
FABRICATION OF WELDED STRUCTURES
XV- 1410-12
MEMBRANE ACTION OF COMPOSITE STRUCTURES IN CASE
OF FIRE
Author(s) JÁRMAI, Károly, VASSART, Olivier, ZHAO, Bin
Abstract:
Large scale fire tests conducted in a number of countries and observations of actual building fires have shown
that the fire performance of composite steel framed buildings is much better than is indicated by fire resistance
tests on isolated elements. It is clear that there are large reserves of fire resistance in modern steel framed
buildings and that standard fire resistance tests on single unrestrained members do not provide a satisfactory
indicator of the performance of such structures. There have been two European projects on membrane action, the
FRACOF and the MACS+ projects. FRACOF concentrated on the theoretical background, simulations and
measurements. MACS+ main activity is the dissemination of this knowledge. In both projects the coordinator
was ArcelorMittal. This presentation is part of the dissemination project.
IIW Keywords:
fire safety, welded rebar mesh, composite structures, membrane action
Notes:[Notes]
Membrane action of composite structures in case of fire
Author(s) JÁRMAI, Károly, VASSART, Olivier,
ZHAO, Bin
Author information JÁRMAI, Károly, University of Miskolc, Hungary,
VASSART, Olivier, ArcelorMittal Esch, Research and Development,
Luxembourg, ZHAO, Bin, CTICM –Fire and Testing Division, France
ABSTRACT
Large scale fire tests conducted in a number of countries and observations of actual building fires have
shown that the fire performance of composite steel framed buildings is much better than is indicated by
fire resistance tests on isolated elements. It is clear that there are large reserves of fire resistance in
modern steel framed buildings and that standard fire resistance tests on single unrestrained members do
not provide a satisfactory indicator of the performance of such structures. There have been two European
projects on membrane action, the FRACOF and the MACS+ projects. FRACOF concentrated on the
theoretical background, simulations and measurements. MACS+ main activity is the dissemination of this
knowledge. In both projects the coordinator was ArcelorMittal. This presentation is part of the
dissemination project.
IIW-Thesaurus keywords fire safety, welded rebar mesh, composite structures, membrane action:
1. CARDINGTON FIRE TEST PROGRAM
1.1 Research programme
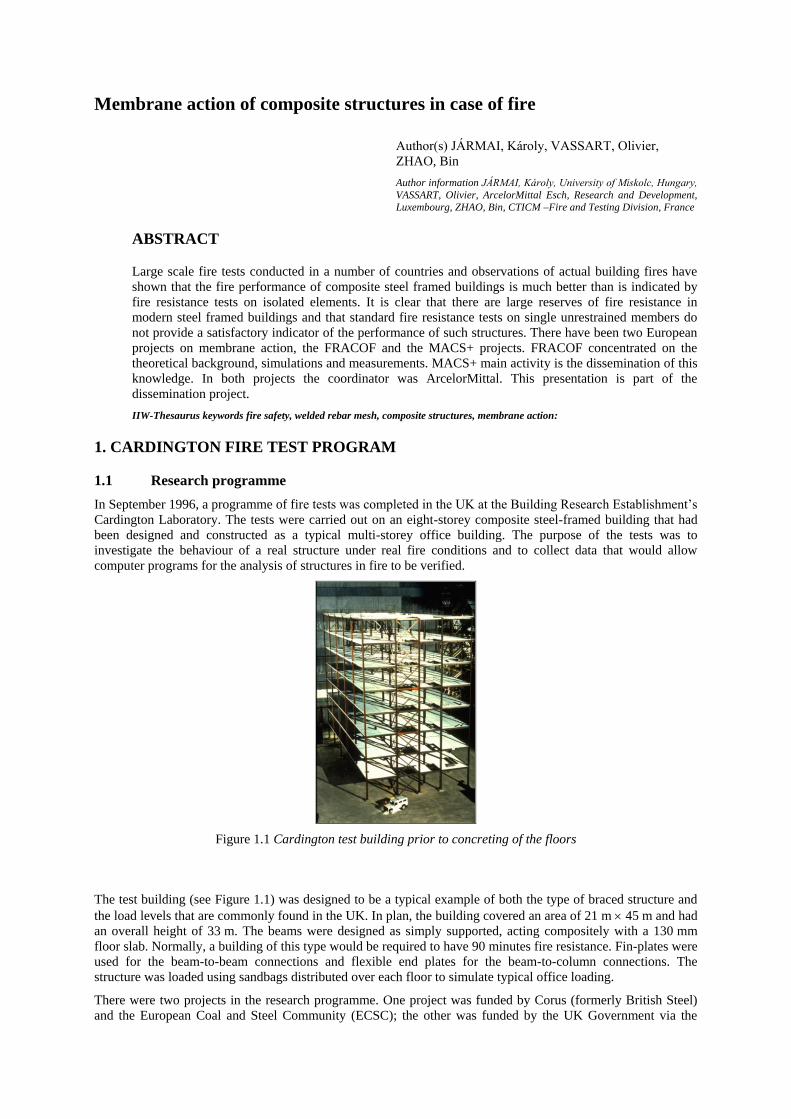
In September 1996, a programme of fire tests was completed in the UK at the Building Research Establishment’s
Cardington Laboratory. The tests were carried out on an eight-storey composite steel-framed building that had
been designed and constructed as a typical multi-storey office building. The purpose of the tests was to
investigate the behaviour of a real structure under real fire conditions and to collect data that would allow
computer programs for the analysis of structures in fire to be verified.
The test building (see Figure 1.1) was designed to be a typical example of both the type of braced structure and
the load levels that are commonly found in the UK. In plan, the building covered an area of 21 m 45 m and had
an overall height of 33 m. The beams were designed as simply supported, acting compositely with a 130 mm
floor slab. Normally, a building of this type would be required to have 90 minutes fire resistance. Fin-plates were
used for the beam-to-beam connections and flexible end plates for the beam-to-column connections. The
structure was loaded using sandbags distributed over each floor to simulate typical office loading.
There were two projects in the research programme. One project was funded by Corus (formerly British Steel)
and the European Coal and Steel Community (ECSC); the other was funded by the UK Government via the
Figure 1.1 Cardington test building prior to concreting of the floors
Building Research Establishment (BRE). Other organisations involved in the research programme included
Sheffield University, TNO (The Netherlands), CTICM (France) and The Steel Construction Institute. Fire tests
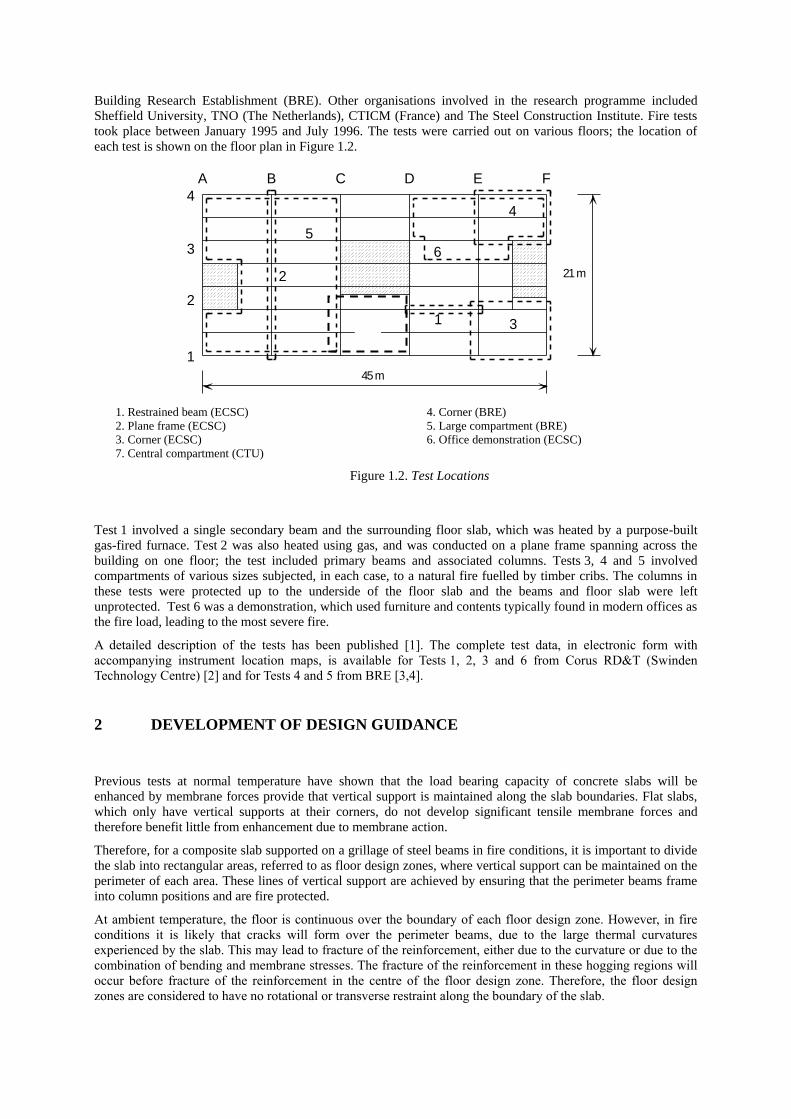
took place between January 1995 and July 1996. The tests were carried out on various floors; the location of
each test is shown on the floor plan in Figure 1.2.
1. Restrained beam (ECSC)
2. Plane frame (ECSC)
3. Corner (ECSC)
7. Central compartment (CTU)
4. Corner (BRE)
5. Large compartment (BRE)
6. Office demonstration (ECSC)
Figure 1.2. Test Locations
Test 1 involved a single secondary beam and the surrounding floor slab, which was heated by a purpose-built
gas-fired furnace. Test 2 was also heated using gas, and was conducted on a plane frame spanning across the
building on one floor; the test included primary beams and associated columns. Tests 3, 4 and 5 involved
compartments of various sizes subjected, in each case, to a natural fire fuelled by timber cribs. The columns in
these tests were protected up to the underside of the floor slab and the beams and floor slab were left
unprotected. Test 6 was a demonstration, which used furniture and contents typically found in modern offices as
the fire load, leading to the most severe fire.
A detailed description of the tests has been published [1]. The complete test data, in electronic form with
accompanying instrument location maps, is available for Tests 1, 2, 3 and 6 from Corus RD&T (Swinden
Technology Centre) [2] and for Tests 4 and 5 from BRE [3,4].
2 DEVELOPMENT OF DESIGN GUIDANCE
Previous tests at normal temperature have shown that the load bearing capacity of concrete slabs will be
enhanced by membrane forces provide that vertical support is maintained along the slab boundaries. Flat slabs,
which only have vertical supports at their corners, do not develop significant tensile membrane forces and
therefore benefit little from enhancement due to membrane action.
Therefore, for a composite slab supported on a grillage of steel beams in fire conditions, it is important to divide
the slab into rectangular areas, referred to as floor design zones, where vertical support can be maintained on the
perimeter of each area. These lines of vertical support are achieved by ensuring that the perimeter beams frame
into column positions and are fire protected.
At ambient temperature, the floor is continuous over the boundary of each floor design zone. However, in fire
conditions it is likely that cracks will form over the perimeter beams, due to the large thermal curvatures
experienced by the slab. This may lead to fracture of the reinforcement, either due to the curvature or due to the
combination of bending and membrane stresses. The fracture of the reinforcement in these hogging regions will
occur before fracture of the reinforcement in the centre of the floor design zone. Therefore, the floor design
zones are considered to have no rotational or transverse restraint along the boundary of the slab.
2
4
6
1 3
5
4
3
2
1
A B C D E F
21 m
45 m
7

2.1 Design assumptions
For a composite floor slab, the yield line pattern will depend on the behaviour of the unprotected composite
beams, which are continually losing strength as the temperature increases. Unlike ambient conditions the load
carrying mechanism of the floor changes with increasing temperature. Initially, the composite slab acts as a one-
way spanning element supported on the secondary beams. As these beams lose strength with increasing
temperature and the behaviour of the slab tends to the behaviour of a simple supported two-way spanning
element, resulting in the formation of the yield line pattern shown in Figure 2.1. By assuming that this ultimate
failure condition will occur when the beam strength is low relative to the slab, a conservative estimate of
capacity can be obtained relatively simply.
The load bearing capacity of the slab is calculated on the assumption that the composite beams have no strength
and is based on the yield line pattern which is compatible with the boundary conditions and which provides the
lowest load bearing capacity. This resistance is then enhanced by taking account of the tensile membrane effects
based on the estimated deflection of the slab and the modes of failure. The bending resistance of the composite
beams are added to this enhanced slab resistance in order to give the total load bearing capacity of the system.
Figure 2.2 Tensile failure of the slab due to fracture of the reinforcement
2.2 Failure criterion
Two modes of failure have been witnessed in room temperature and elevated temperature tests, depending on the
reinforcement ratio, slab aspect ratio and the reinforcement ductility. Fracture of the reinforcement across the
shorter span dominates the failure mode in most of the lightly reinforced slabs, whilst the heavily reinforced
slabs and slabs with highly ductile reinforcement may experience compressive failure at the corners of the slab.
Both modes of failure are considered by the simple design method.
Most tests conducted at elevated temperatures on simply supported concrete slabs have failed due to full depth
crack forming across the shorter span (l), as shown in Figure 2.2. The design method predicts the load bearing
Full depth crack Compression failure of concrete
Edge of slab moves towards centreof slab and 'relieves' the strains inthe reinforcement in the short span
Yield-line pattern
Reinforcement inlonger span fractures
Figure 2.1 Typical yield line pattern for a rectangular slab simply supported along four
edges
Yield lines
Simply supportedon 4 edges

capacity for a given deflection. This Chapter describes the development of an expression for estimating slab
deflection just prior to slab failure which is required to calculate the effect of membrane action.
2.2.1 Slab deflection
As the simple design method is based on plastic theory, deflection cannot be calculated using the method.
However, in order to calculate the membrane forces a value of deflection for the slab just prior to failure must be
estimated. This estimate of slab deflection will include thermal strains due to the slabs temperature gradient as
well as the mechanical strains in the reinforcement.
2.2.1.1 Thermal effects
Based on the previous investigations, when the maximum deflection of the slab is greater than almost 0.5 times
its depth and tensile forces start to build up at the slab centre, any in-plane restraint to the thermal expansion
would increase the vertical displacements (i.e. the slab is in the post-buckling phase) and therefore the tensile
membrane action. Conservatively, and in order to allow this approach to be used also for the edge slabs, this
beneficial effect is ignored and slab is assumed to be unrestrained.
The composite slab in the fire conditions would experience thermal curvature, which, for an unrestrained slab,
increases the vertical displacement without inducing any mechanical strains into the mesh reinforcement. If the
temperature distribution through the slab is assumed to be linear then the displacements caused by the thermal
deflection is calculated as:
h
TT
dx
wd )( 12
2
2
where
w =Vertical displacement
= Coefficient of thermal expansion
2T =Bottom temperature
1T = Top temperature
h = Depth of slab
The vertical displacement of the slab due to thermal curvature can be obtained by integrating the above
Equation, which gives:
h
lTTw
8
)( 212
where l is the length of the shorter span of the slab
This formulation is based on a constant atmospheric temperature throughout the fire compartment. To the
estimated displacement, allowing for real fire conditions where uniform heating is less likely, a reduction factor
of 2.0 is applied to the above expression. This results in the design value of vertical displacement due to the
thermal curvature given by:
h
lTTw
16
)( 212
2.2.1.2 Mechanical strains in the reinforcement
Assuming that the deflected shape of the slab due to transverse loading is parabolic, the length of the deflected
slab is given by the following formulation in which the longer span is (L).
.....
5
32
3
81
4
4
2
2
L
w
L
wLLc
where cL is the length of the curve, L is the length of longer span of slab at zero displacement, w is the vertical
displacement of the curve.
For flat curves,

2
2
3
81
L
wLLc
Hence, the strain in the mesh can be calculated by:
2
2
3
8
L
w
This equation assumes the strain is the same value along the length of the slab. In reality, the slab will experience
tension stiffening with strains being concentrated where cracks have occurred. The reinforcement across a crack
will also experience a significant increase in the strain, resulting in the eventual fracture of the reinforcement.
Therefore, to allow for tension stiffening the component of displacement due to strain in the reinforcement w is
based on a conservative value of average strain calculated at a stress equal to half the yield stress at room
temperature. The displacement is then given by:
8
35.0 2L
E
fw
s
sy
(1)
where Es is the room temperature elastic modulus of the reinforcement
fsy is the room temperature yield strength of the reinforcement
The displacements due to strain in the reinforcement calculated using Equation (1) have been compared to
maximum deflections measured in tests at room temperature. In all the cases considered, the displacement
predicted by Equation (1) was lower than the maximum displacement recorded in the test, as shown in Table 2.1.
Table 2.1 Comparison of allowable deflection from Equation (1) and maximum deflections measured in room
temperature tests.
Test Slab size
(m)
Effective
Depth
(mm)
Reinforcement
Diameter
(mm)
Bar
Spacing
(mm)
Steel
yield
strength
(N/mm2)
Max. test
deflection
(mm)
Allowable
deflection
Eqn. (1)
(mm)
BRE 9.56x6.46 66.0 6.0 200 580 223 216
Sawczuk &
Winnicki
1.6x1.1 26.0 3.0 30.0 263 127* 25
2.0x1.0 26.0 3.0 60.0 263 76* 31
Hayes &
Taylor
0.914x0.914 15.9 9.5 -† 505 50.8* 19.4
0.914x1.372 15.9 9.5 -† 505 50.8* 29.1
0.914x1.829 15.9 9.5 -† 505 50.8* 38.8
Taylor,
Maher &
Hayes
1.829x1.829 43.6 4.8 76.2 376 81 33.5
1.829x1.829 37.3 4.8 63.5 376 98 33.5
1.829x1.829 69.0 4.8 122 376 84 33.5
Brothie &
Holley
0.381x0.381 14.2 2.3 -† 414 11.6 7.32
0.381x0.381 31.0 3.4 -† 379 7.45 7.0
*test terminated before fracture of the reinforcement
† Data not reported
2.2.1.3 Calculation of slab deflection to allow the calculation of membrane forces
The tensile membrane action of the slab is then calculated based on a slab displacement estimated by combining
the components due to thermal curvature and strain in the reinforcement, resulting in:
8
35.0
16
2212 L
E
f
h
lTTw
s
sy
m
(2)
This equation results in a conservative estimate of load bearing capacity since:
the estimated vertical displacements due to thermal curvature are divided by two.
the thermal curvature is calculated based on the shorter span of the slab
any additional vertical displacements induced by the restrained thermal expansion when the slab is in a post
buckled state are ignored
any contribution from the steel decking is ignored
the increase of the mesh ductility with the temperature increase is ignored.
2.2.2 Calibration against Cardington fire tests
Bailey & Moore [5] demonstrated that the design method provided a reasonable prediction of floor slab capacity
when compared to the Cardington Fire Tests. As part on this project a further furnace based fire test has been
conducted.
The above expression for slab deflection was compared to the maximum deflections recorded during the
Cardington fire tests. The object was to ensure that the deflections estimated would be conservative when
compared to actual slab behaviour just prior to failure. The drawback in using these tests for this purpose was
that failure was not reached by the slabs tested therefore the maximum measured deflections do not correspond
to failure of the slab. However, it is known that the results of the comparison will be conservative but the degree
of conservatism cannot be quantified.
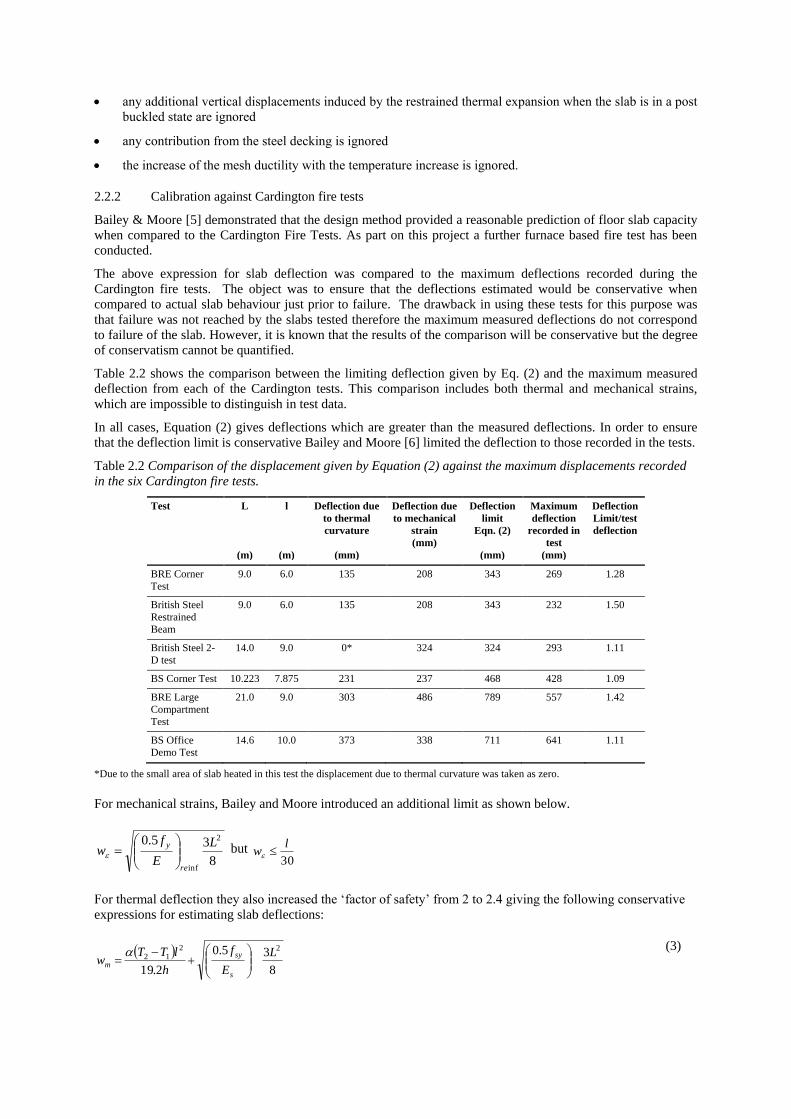
Table 2.2 shows the comparison between the limiting deflection given by Eq. (2) and the maximum measured
deflection from each of the Cardington tests. This comparison includes both thermal and mechanical strains,
which are impossible to distinguish in test data.
In all cases, Equation (2) gives deflections which are greater than the measured deflections. In order to ensure
that the deflection limit is conservative Bailey and Moore [6] limited the deflection to those recorded in the tests.
Table 2.2 Comparison of the displacement given by Equation (2) against the maximum displacements recorded
in the six Cardington fire tests.
Test L
(m)
l
(m)
Deflection due
to thermal
curvature
(mm)
Deflection due
to mechanical
strain
(mm)
Deflection
limit
Eqn. (2)
(mm)
Maximum
deflection
recorded in
test
(mm)
Deflection
Limit/test
deflection
BRE Corner
Test
9.0 6.0 135 208 343 269 1.28
British Steel
Restrained
Beam
9.0 6.0 135 208 343 232 1.50
British Steel 2-
D test
14.0 9.0 0* 324 324 293 1.11
BS Corner Test 10.223 7.875 231 237 468 428 1.09
BRE Large
Compartment
Test
21.0 9.0 303 486 789 557 1.42
BS Office
Demo Test
14.6 10.0 373 338 711 641 1.11
*Due to the small area of slab heated in this test the displacement due to thermal curvature was taken as zero.
For mechanical strains, Bailey and Moore introduced an additional limit as shown below.
8
35.0 2
inf
L
E
fw
re
y
but 30
lw
For thermal deflection they also increased the ‘factor of safety’ from 2 to 2.4 giving the following conservative
expressions for estimating slab deflections:
8
35.0
2.19
2212 L
E
f
h
lTTw
s
sy
m
(3)
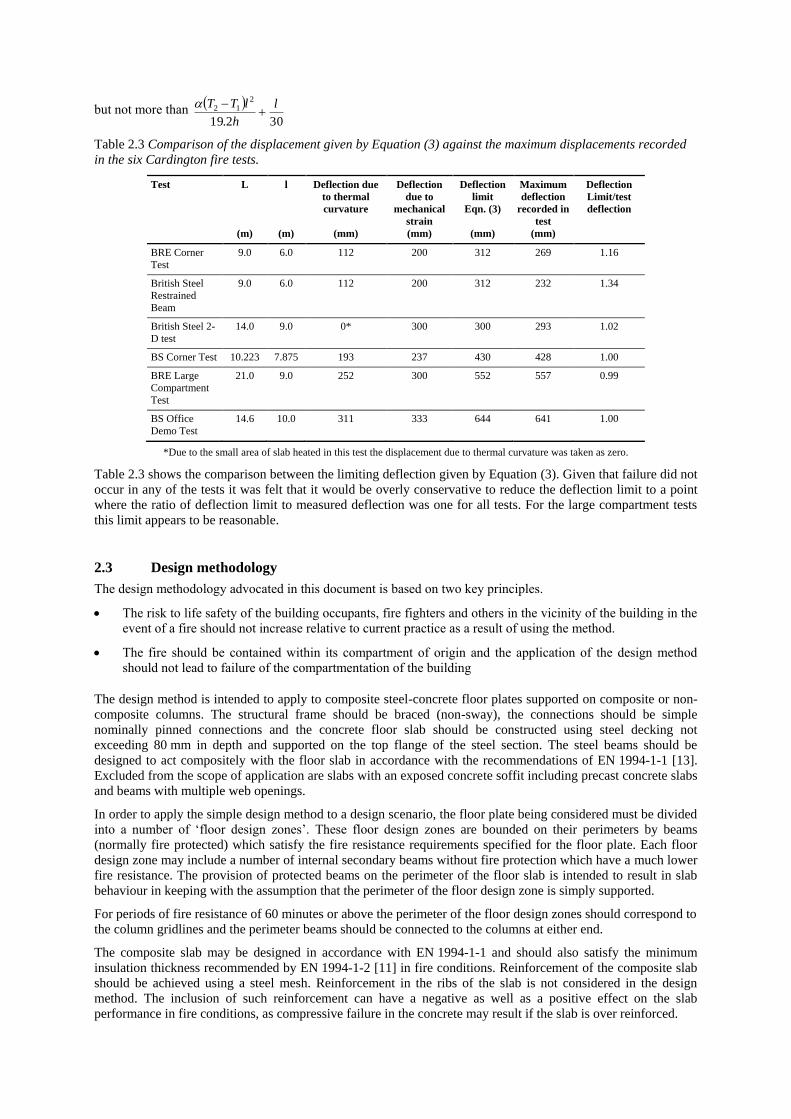
but not more than
302.19
212 l
h
lTT
Table 2.3 Comparison of the displacement given by Equation (3) against the maximum displacements recorded
in the six Cardington fire tests.
Test L
(m)
l
(m)
Deflection due
to thermal
curvature
(mm)
Deflection
due to
mechanical
strain
(mm)
Deflection
limit
Eqn. (3)
(mm)
Maximum
deflection
recorded in
test
(mm)
Deflection
Limit/test
deflection
BRE Corner
Test
9.0 6.0 112 200 312 269 1.16
British Steel
Restrained
Beam
9.0 6.0 112 200 312 232 1.34
British Steel 2-
D test
14.0 9.0 0* 300 300 293 1.02
BS Corner Test 10.223 7.875 193 237 430 428 1.00
BRE Large
Compartment
Test
21.0 9.0 252 300 552 557 0.99
BS Office
Demo Test
14.6 10.0 311 333 644 641 1.00
*Due to the small area of slab heated in this test the displacement due to thermal curvature was taken as zero.
Table 2.3 shows the comparison between the limiting deflection given by Equation (3). Given that failure did not
occur in any of the tests it was felt that it would be overly conservative to reduce the deflection limit to a point
where the ratio of deflection limit to measured deflection was one for all tests. For the large compartment tests
this limit appears to be reasonable.
2.3 Design methodology
The design methodology advocated in this document is based on two key principles.
The risk to life safety of the building occupants, fire fighters and others in the vicinity of the building in the
event of a fire should not increase relative to current practice as a result of using the method.
The fire should be contained within its compartment of origin and the application of the design method
should not lead to failure of the compartmentation of the building
The design method is intended to apply to composite steel-concrete floor plates supported on composite or non-
composite columns. The structural frame should be braced (non-sway), the connections should be simple
nominally pinned connections and the concrete floor slab should be constructed using steel decking not
exceeding 80 mm in depth and supported on the top flange of the steel section. The steel beams should be
designed to act compositely with the floor slab in accordance with the recommendations of EN 1994-1-1 [13].
Excluded from the scope of application are slabs with an exposed concrete soffit including precast concrete slabs
and beams with multiple web openings.
In order to apply the simple design method to a design scenario, the floor plate being considered must be divided
into a number of ‘floor design zones’. These floor design zones are bounded on their perimeters by beams
(normally fire protected) which satisfy the fire resistance requirements specified for the floor plate. Each floor
design zone may include a number of internal secondary beams without fire protection which have a much lower
fire resistance. The provision of protected beams on the perimeter of the floor slab is intended to result in slab
behaviour in keeping with the assumption that the perimeter of the floor design zone is simply supported.
For periods of fire resistance of 60 minutes or above the perimeter of the floor design zones should correspond to
the column gridlines and the perimeter beams should be connected to the columns at either end.
The composite slab may be designed in accordance with EN 1994-1-1 and should also satisfy the minimum
insulation thickness recommended by EN 1994-1-2 [11] in fire conditions. Reinforcement of the composite slab
should be achieved using a steel mesh. Reinforcement in the ribs of the slab is not considered in the design
method. The inclusion of such reinforcement can have a negative as well as a positive effect on the slab
performance in fire conditions, as compressive failure in the concrete may result if the slab is over reinforced.
2.3.1 Calculation of load bearing capacity for unprotected beams
In fire conditions, the unprotected beams within each floor design zone will add to the tensile resistance of the
slab via catenary action.
The temperature of the cross-section of the unprotected beams is calculated using the method given in EN 1994-
1-2, 4.3.4.2.2. The bottom flange, the web and the top flange of the steel profile are assumed to be at have each a
uniform temperature for the calculation of the moment resistance.
The calculation of the plastic moment resistance of the beams at elevated temperature follows the principles of
EN 1994-1-2, 4.3 taking account of the degree of shear connection between the steel section and the concrete.
The temperature of the slab is taken as 40 % of the temperature of the top flange
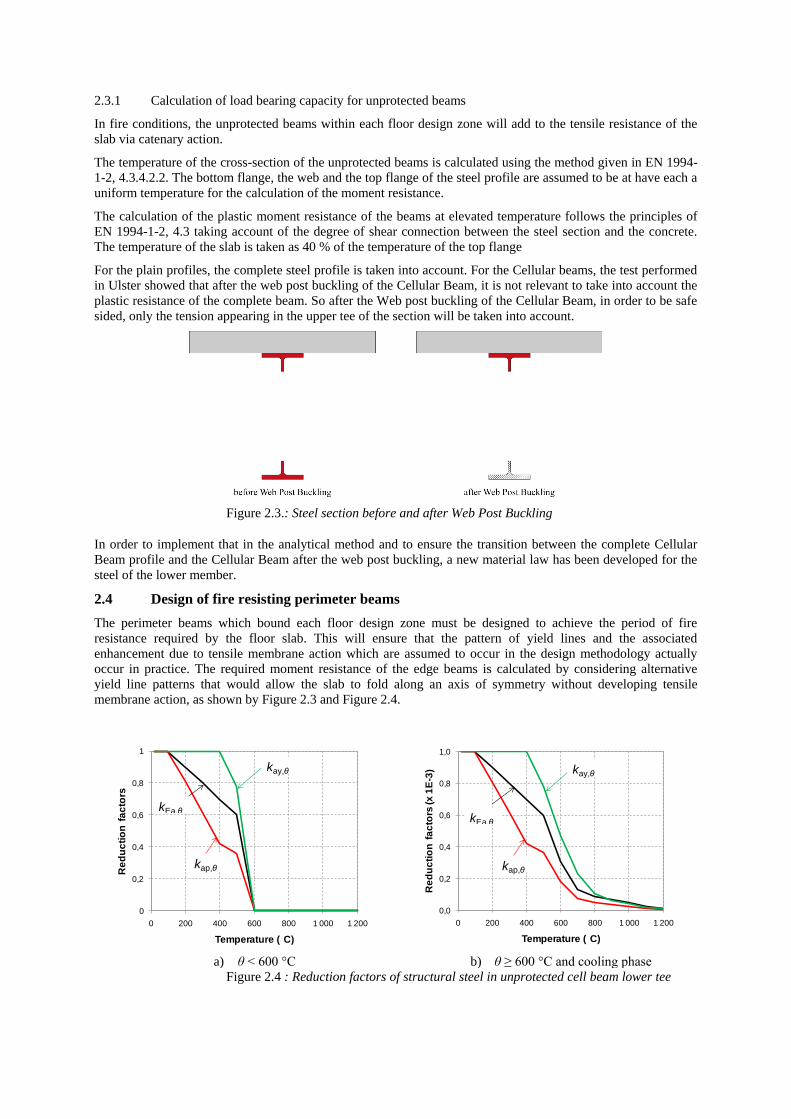
For the plain profiles, the complete steel profile is taken into account. For the Cellular beams, the test performed
in Ulster showed that after the web post buckling of the Cellular Beam, it is not relevant to take into account the
plastic resistance of the complete beam. So after the Web post buckling of the Cellular Beam, in order to be safe
sided, only the tension appearing in the upper tee of the section will be taken into account.
Figure 2.3.: Steel section before and after Web Post Buckling
In order to implement that in the analytical method and to ensure the transition between the complete Cellular
Beam profile and the Cellular Beam after the web post buckling, a new material law has been developed for the
steel of the lower member.
2.4 Design of fire resisting perimeter beams
The perimeter beams which bound each floor design zone must be designed to achieve the period of fire
resistance required by the floor slab. This will ensure that the pattern of yield lines and the associated
enhancement due to tensile membrane action which are assumed to occur in the design methodology actually
occur in practice. The required moment resistance of the edge beams is calculated by considering alternative
yield line patterns that would allow the slab to fold along an axis of symmetry without developing tensile
membrane action, as shown by Figure 2.3 and Figure 2.4.
a) θ < 600 °C b) θ ≥ 600 °C and cooling phase
Figure 2.4 : Reduction factors of structural steel in unprotected cell beam lower tee
0
0,2
0,4
0,6
0,8
1
0 200 400 600 800 1 000 1 200
Re
du
cti
on
fa
cto
rs
Temperature ( C)
kEa,θ
kap,θ
kay,θ
0,0
0,2
0,4
0,6
0,8
1,0
0 200 400 600 800 1 000 1 200
Re
du
cti
on
fa
cto
rs (x
1E
-3)
Temperature ( C)
kEa,θ
kap,θ
kay,θ
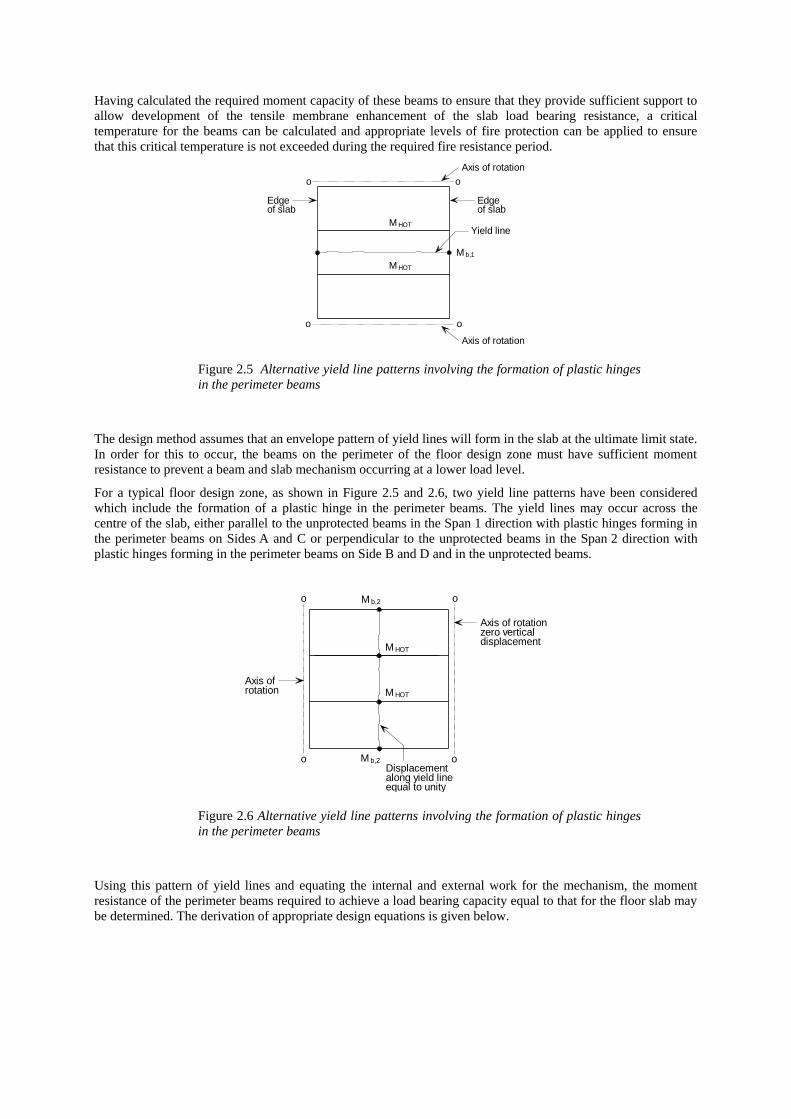
Having calculated the required moment capacity of these beams to ensure that they provide sufficient support to
allow development of the tensile membrane enhancement of the slab load bearing resistance, a critical
temperature for the beams can be calculated and appropriate levels of fire protection can be applied to ensure
that this critical temperature is not exceeded during the required fire resistance period.
Figure 2.5 Alternative yield line patterns involving the formation of plastic hinges
in the perimeter beams
The design method assumes that an envelope pattern of yield lines will form in the slab at the ultimate limit state.
In order for this to occur, the beams on the perimeter of the floor design zone must have sufficient moment
resistance to prevent a beam and slab mechanism occurring at a lower load level.
For a typical floor design zone, as shown in Figure 2.5 and 2.6, two yield line patterns have been considered
which include the formation of a plastic hinge in the perimeter beams. The yield lines may occur across the
centre of the slab, either parallel to the unprotected beams in the Span 1 direction with plastic hinges forming in
the perimeter beams on Sides A and C or perpendicular to the unprotected beams in the Span 2 direction with
plastic hinges forming in the perimeter beams on Side B and D and in the unprotected beams.
Figure 2.6 Alternative yield line patterns involving the formation of plastic hinges
in the perimeter beams
Using this pattern of yield lines and equating the internal and external work for the mechanism, the moment
resistance of the perimeter beams required to achieve a load bearing capacity equal to that for the floor slab may
be determined. The derivation of appropriate design equations is given below.
o
o
o
o
M
M
M
HOT
HOT
Edgeof slab
Edgeof slab
b,1
Yield line
Axis of rotation
Axis of rotation
o
o
o
oM
M
M
M
HOT
HOT
Axis of rotationzero verticaldisplacement
Axis ofrotation
Displacementalong yield lineequal to unity
b,2
b,2
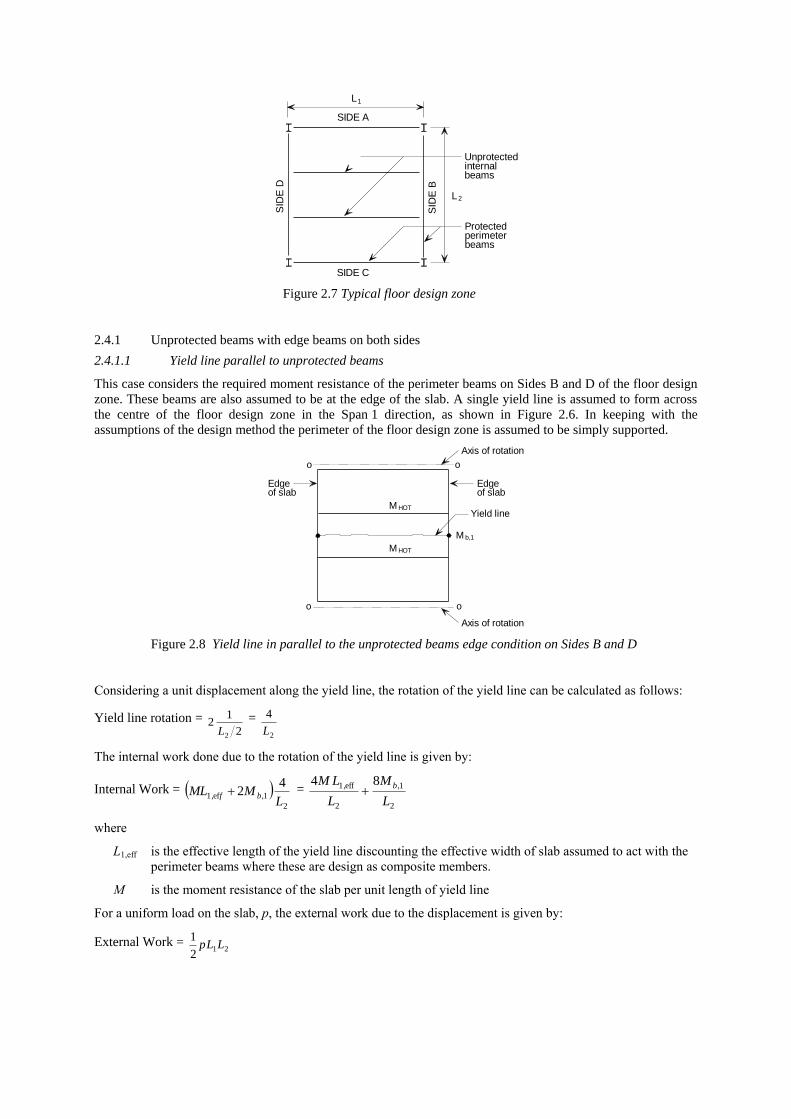
Figure 2.7 Typical floor design zone
2.4.1 Unprotected beams with edge beams on both sides
2.4.1.1 Yield line parallel to unprotected beams
This case considers the required moment resistance of the perimeter beams on Sides B and D of the floor design
zone. These beams are also assumed to be at the edge of the slab. A single yield line is assumed to form across
the centre of the floor design zone in the Span 1 direction, as shown in Figure 2.6. In keeping with the
assumptions of the design method the perimeter of the floor design zone is assumed to be simply supported.
Figure 2.8 Yield line in parallel to the unprotected beams edge condition on Sides B and D
Considering a unit displacement along the yield line, the rotation of the yield line can be calculated as follows:
Yield line rotation = 2
12
2L =
2
4
L
The internal work done due to the rotation of the yield line is given by:
Internal Work = 2
1,ef1,
42
LMML bf =
2
1,
2
eff1, 84
L
M
L
LM b
where
L1,eff is the effective length of the yield line discounting the effective width of slab assumed to act with the
perimeter beams where these are design as composite members.
M is the moment resistance of the slab per unit length of yield line
For a uniform load on the slab, p, the external work due to the displacement is given by:
External Work = 21
2
1LLp
SIDE A
SIDE CS
IDE
D
SID
E B
L
1L
2
Unprotectedinternalbeams
Protectedperimeterbeams
o
o
o
o
M
M
M
HOT
HOT
Edgeof slab
Edgeof slab
b,1
Yield line
Axis of rotation
Axis of rotation
Equating internal and external work gives:
2
b,1
2
eff1,
21
168
L
M
L
MLLLp
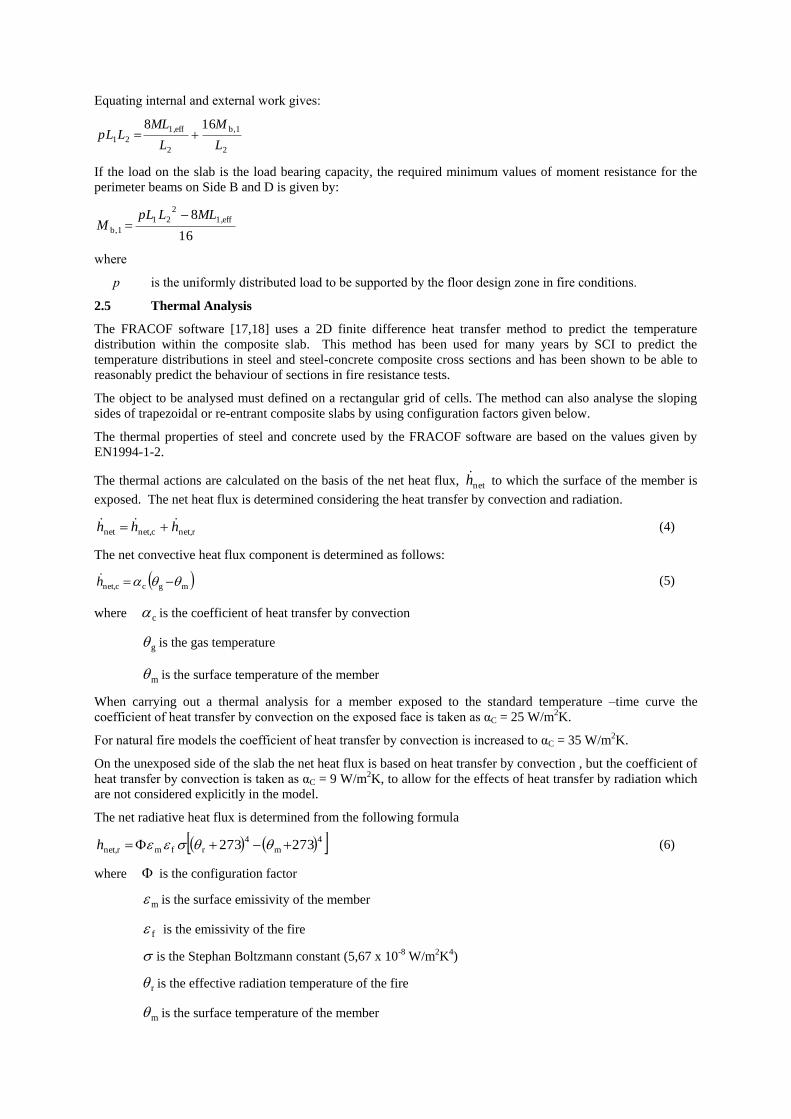
If the load on the slab is the load bearing capacity, the required minimum values of moment resistance for the
perimeter beams on Side B and D is given by:
16
8 eff1,
2
21
b,1
MLLpLM
where
p is the uniformly distributed load to be supported by the floor design zone in fire conditions.
2.5 Thermal Analysis
The FRACOF software [17,18] uses a 2D finite difference heat transfer method to predict the temperature
distribution within the composite slab. This method has been used for many years by SCI to predict the
temperature distributions in steel and steel-concrete composite cross sections and has been shown to be able to
reasonably predict the behaviour of sections in fire resistance tests.
The object to be analysed must defined on a rectangular grid of cells. The method can also analyse the sloping
sides of trapezoidal or re-entrant composite slabs by using configuration factors given below.
The thermal properties of steel and concrete used by the FRACOF software are based on the values given by
EN1994-1-2.
The thermal actions are calculated on the basis of the net heat flux, neth to which the surface of the member is
exposed. The net heat flux is determined considering the heat transfer by convection and radiation.
rnet,cnet,net hhh (4)
The net convective heat flux component is determined as follows:
mgccnet, h (5)
where c is the coefficient of heat transfer by convection
g is the gas temperature
m is the surface temperature of the member
When carrying out a thermal analysis for a member exposed to the standard temperature –time curve the
coefficient of heat transfer by convection on the exposed face is taken as αC = 25 W/m2K.
For natural fire models the coefficient of heat transfer by convection is increased to αC = 35 W/m2K.
On the unexposed side of the slab the net heat flux is based on heat transfer by convection , but the coefficient of
heat transfer by convection is taken as αC = 9 W/m2K, to allow for the effects of heat transfer by radiation which
are not considered explicitly in the model.
The net radiative heat flux is determined from the following formula
4
m
4
rfmrnet, 273273 h (6)
where is the configuration factor
m is the surface emissivity of the member
f is the emissivity of the fire
is the Stephan Boltzmann constant (5,67 x 10⁻⁸ W/m2K4)
r is the effective radiation temperature of the fire
m is the surface temperature of the member
The emissivity of the fire is taken as 0.1f in accordance with the recommended value in EN1994-1-2. The
emissivity of the member may be determined from 0.
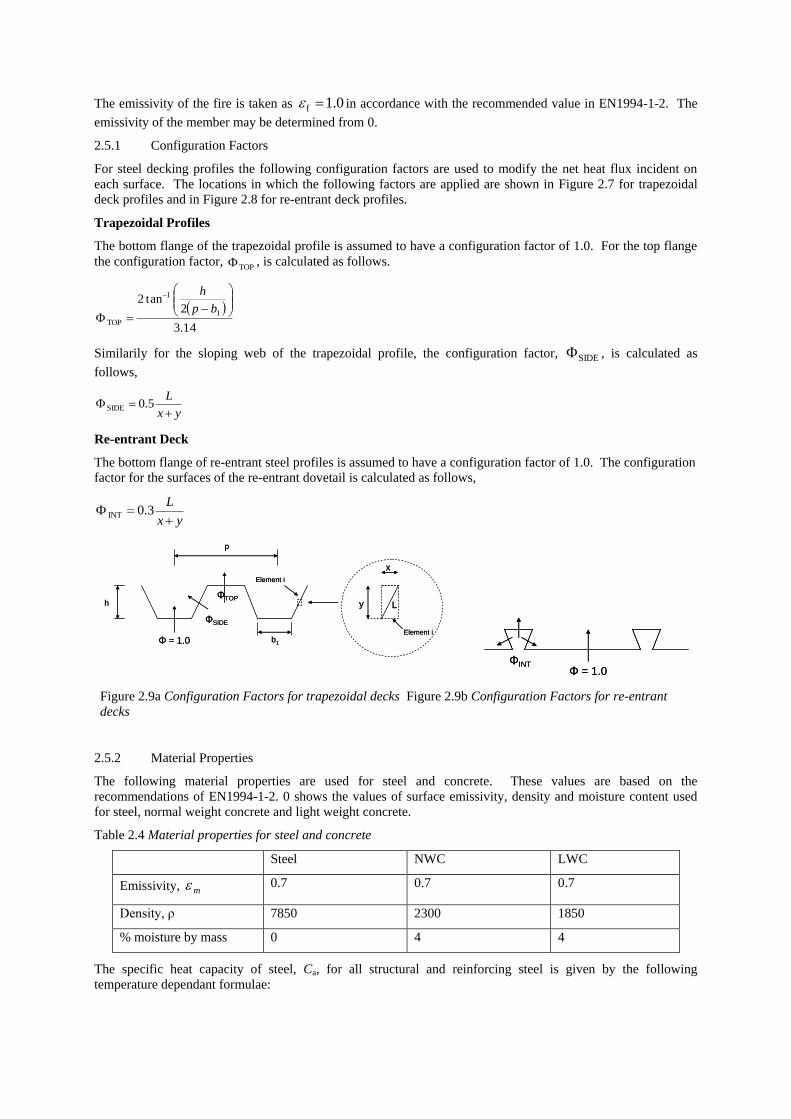
2.5.1 Configuration Factors
For steel decking profiles the following configuration factors are used to modify the net heat flux incident on
each surface. The locations in which the following factors are applied are shown in Figure 2.7 for trapezoidal
deck profiles and in Figure 2.8 for re-entrant deck profiles.
Trapezoidal Profiles
The bottom flange of the trapezoidal profile is assumed to have a configuration factor of 1.0. For the top flange
the configuration factor, TOP , is calculated as follows.
14.3
2tan2
1
1
TOP
bp
h
Similarily for the sloping web of the trapezoidal profile, the configuration factor, SIDE , is calculated as
follows,
yx
L
5.0SIDE
Re-entrant Deck
The bottom flange of re-entrant steel profiles is assumed to have a configuration factor of 1.0. The configuration
factor for the surfaces of the re-entrant dovetail is calculated as follows,
yx
L
3.0INT
Figure 2.9a Configuration Factors for trapezoidal decks Figure 2.9b Configuration Factors for re-entrant
decks
2.5.2 Material Properties
The following material properties are used for steel and concrete. These values are based on the
recommendations of EN1994-1-2. 0 shows the values of surface emissivity, density and moisture content used
for steel, normal weight concrete and light weight concrete.
Table 2.4 Material properties for steel and concrete
Steel NWC LWC
Emissivity, m 0.7 0.7 0.7
Density, ρ 7850 2300 1850
% moisture by mass 0 4 4
The specific heat capacity of steel, Ca, for all structural and reinforcing steel is given by the following
temperature dependant formulae:
ΦTOP
ΦSIDE
Φ = 1.0
Element i
h
p
b1
y L
x
Element i
ΦTOP
ΦSIDE
Φ = 1.0
Element i
h
p
b1
y L
x
Element i
ΦINTΦ = 1.0
ΦINTΦ = 1.0
32 00000222.000169.0773.0425 aC (J/kg K) for CC 60020
738
13002666
aC (J/kg K) for CC 735600
731
17820545
aC (J/kg K) for CC 900735
Ca = 650 (J/kg K) for CC 1200900
The following temperature dependant values of specific heat capacity, Cc, are used for normal weight dry
concrete with siliceous of calcareous aggregates.
Cc = 900 (J/kg K) for CC 10020
Cc = 900 + (θ – 100) (J/kg K) for CC 200100
Cc = 1000 + (θ – 200)/2 (J/kg K) for CC 400200
Cc = 1100 (J/kg K) for CC 1200400
As recommended by EN1994-1-2 the following temperature independent value of specific heat capacity is
assumed for lightweight concrete.
Cc = 840 (J/kg K) for all temperatures
The thermal conductivity of steel is defined using the following temperature dependent relationship.
20033.054 a but not less than 27.3 (W/mK)
For normal weight concrete the upper limit of thermal conductivity as defined by EN1994-1-2 has been used.
The thermal conductivity for normal weight concrete is determined from the following temperature dependent
relationship.
21000107.01002451.02 C (W/mK)
The thermal conductivity of lightweight concrete is also temperature dependent and is given by the following
formula.
16001 C but not less than 0.5 (W/mK)
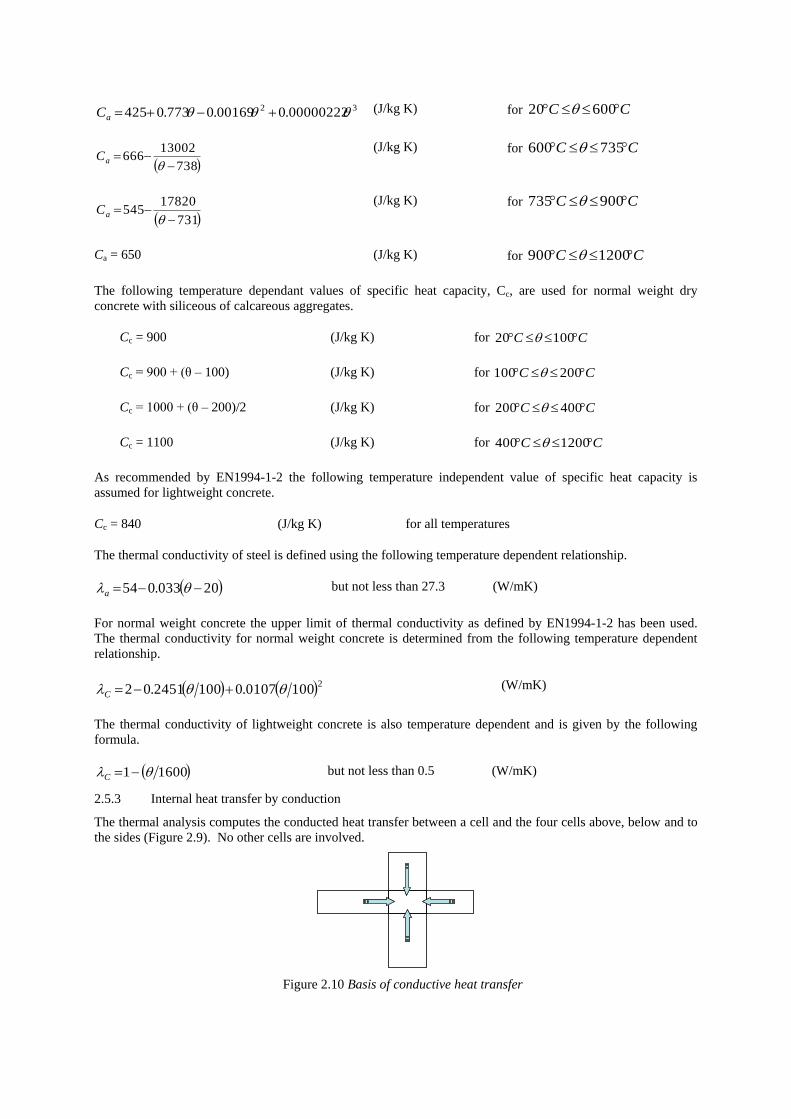
2.5.3 Internal heat transfer by conduction
The thermal analysis computes the conducted heat transfer between a cell and the four cells above, below and to
the sides (Figure 2.9). No other cells are involved.
Figure 2.10 Basis of conductive heat transfer
The heat transferred per unit time depends on the sizes of the cells, the temperature of each cells and the thermal
conductivity of each cell. Each pair of cells are considered in turn and the net heat transferred into or out of a
cell is computed. The basic conduction model is illustrated in Figure 2.10.
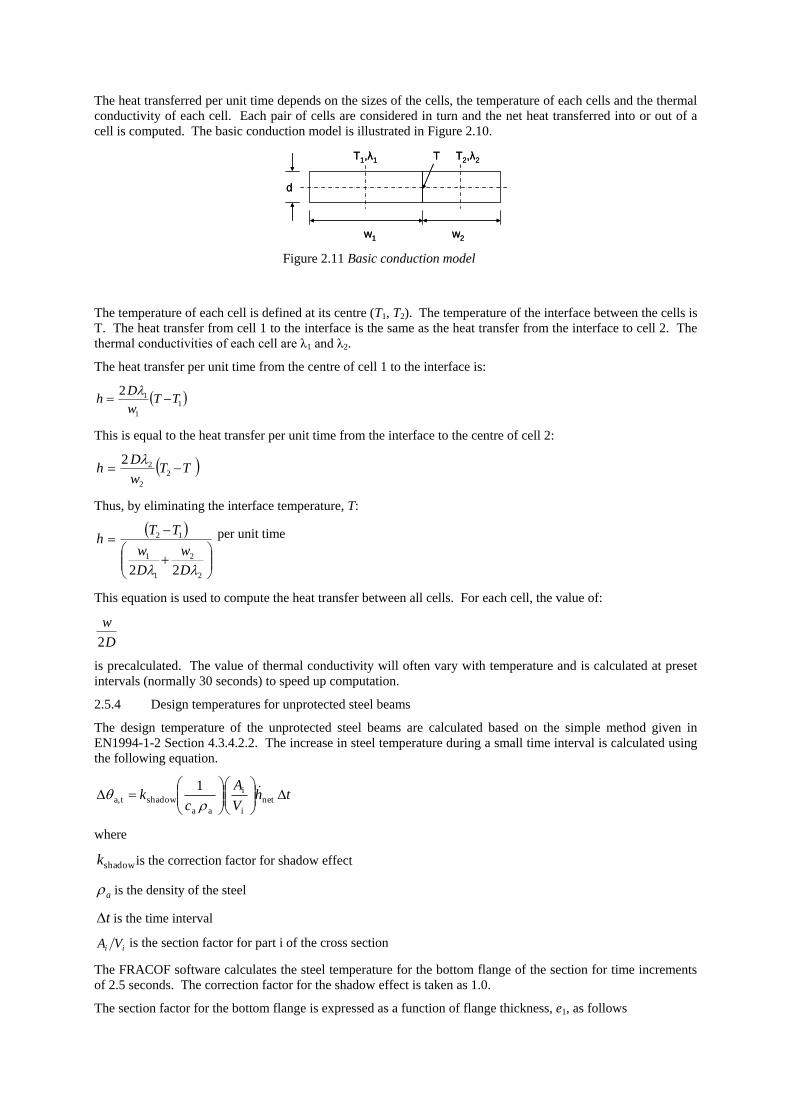
Figure 2.11 Basic conduction model
The temperature of each cell is defined at its centre (T1, T2). The temperature of the interface between the cells is
T. The heat transfer from cell 1 to the interface is the same as the heat transfer from the interface to cell 2. The
thermal conductivities of each cell are λ1 and λ2.
The heat transfer per unit time from the centre of cell 1 to the interface is:
1
1
12TT
w
Dh
This is equal to the heat transfer per unit time from the interface to the centre of cell 2:
TTw
Dh 2
2
22
Thus, by eliminating the interface temperature, T:
2
2
1
1
12
22 D
w
D
w
TTh per unit time
This equation is used to compute the heat transfer between all cells. For each cell, the value of:
D
w
2
is precalculated. The value of thermal conductivity will often vary with temperature and is calculated at preset
intervals (normally 30 seconds) to speed up computation.
2.5.4 Design temperatures for unprotected steel beams
The design temperature of the unprotected steel beams are calculated based on the simple method given in
EN1994-1-2 Section 4.3.4.2.2. The increase in steel temperature during a small time interval is calculated using
the following equation.
thV
A
ck
net
i
i
aa
shadowta,
1
where
shadowk is the correction factor for shadow effect
a is the density of the steel
t is the time interval
ii VA is the section factor for part i of the cross section
The FRACOF software calculates the steel temperature for the bottom flange of the section for time increments
of 2.5 seconds. The correction factor for the shadow effect is taken as 1.0.
The section factor for the bottom flange is expressed as a function of flange thickness, e1, as follows
d
w1 w2
T1,λ1 T2,λ2T
d
w1 w2
T1,λ1 T2,λ2T
1
2000
eVA ii
The net heat flux is calculated as shown in Equation (4), with the convective and radiative components
calculated as shown by Equations (5) and (6) respectively. When calculating the radiative heat flux using
Equation (6) the configuration factor should be taken as 1.0.
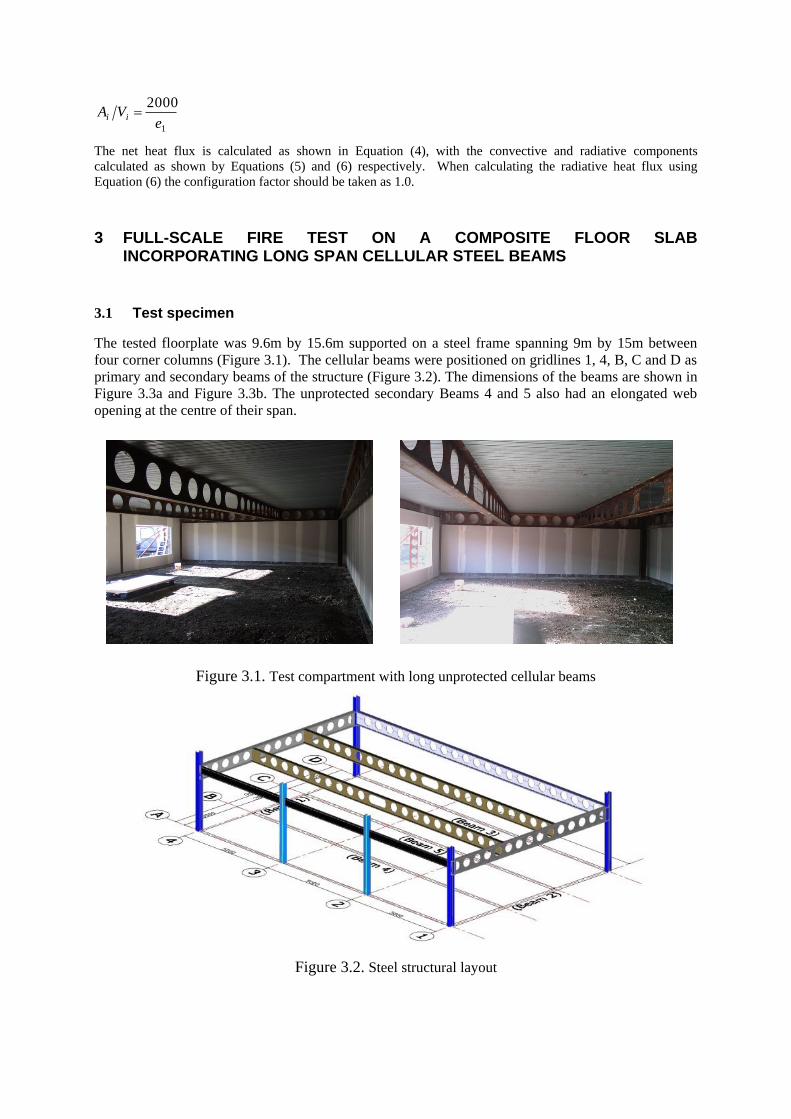
3 FULL-SCALE FIRE TEST ON A COMPOSITE FLOOR SLAB INCORPORATING LONG SPAN CELLULAR STEEL BEAMS
3.1 Test specimen
The tested floorplate was 9.6m by 15.6m supported on a steel frame spanning 9m by 15m between
four corner columns (Figure 3.1). The cellular beams were positioned on gridlines 1, 4, B, C and D as
primary and secondary beams of the structure (Figure 3.2). The dimensions of the beams are shown in
Figure 3.3a and Figure 3.3b. The unprotected secondary Beams 4 and 5 also had an elongated web
opening at the centre of their span.
Figure 3.1. Test compartment with long unprotected cellular beams
Figure 3.2. Steel structural layout
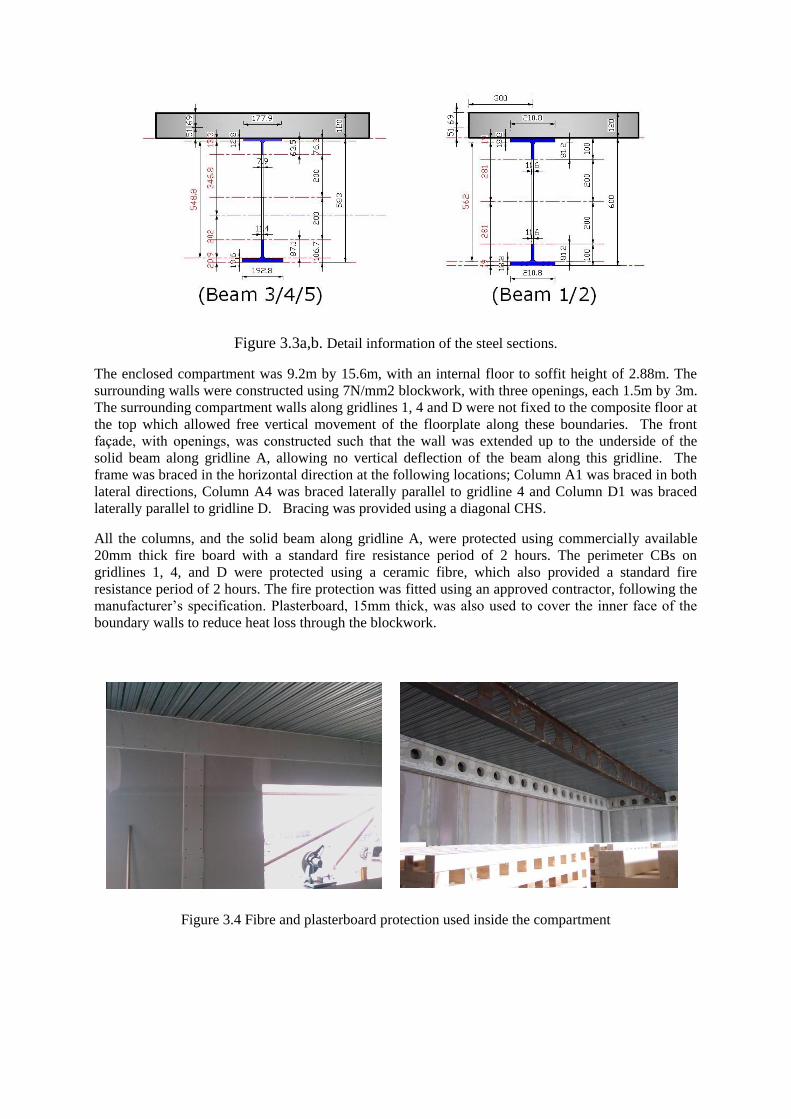
Figure 3.3a,b. Detail information of the steel sections.
The enclosed compartment was 9.2m by 15.6m, with an internal floor to soffit height of 2.88m. The
surrounding walls were constructed using 7N/mm2 blockwork, with three openings, each 1.5m by 3m.
The surrounding compartment walls along gridlines 1, 4 and D were not fixed to the composite floor at
the top which allowed free vertical movement of the floorplate along these boundaries. The front
façade, with openings, was constructed such that the wall was extended up to the underside of the
solid beam along gridline A, allowing no vertical deflection of the beam along this gridline. The
frame was braced in the horizontal direction at the following locations; Column A1 was braced in both
lateral directions, Column A4 was braced laterally parallel to gridline 4 and Column D1 was braced
laterally parallel to gridline D. Bracing was provided using a diagonal CHS.
All the columns, and the solid beam along gridline A, were protected using commercially available
20mm thick fire board with a standard fire resistance period of 2 hours. The perimeter CBs on
gridlines 1, 4, and D were protected using a ceramic fibre, which also provided a standard fire
resistance period of 2 hours. The fire protection was fitted using an approved contractor, following the
manufacturer’s specification. Plasterboard, 15mm thick, was also used to cover the inner face of the
boundary walls to reduce heat loss through the blockwork.
Figure 3.4 Fibre and plasterboard protection used inside the compartment
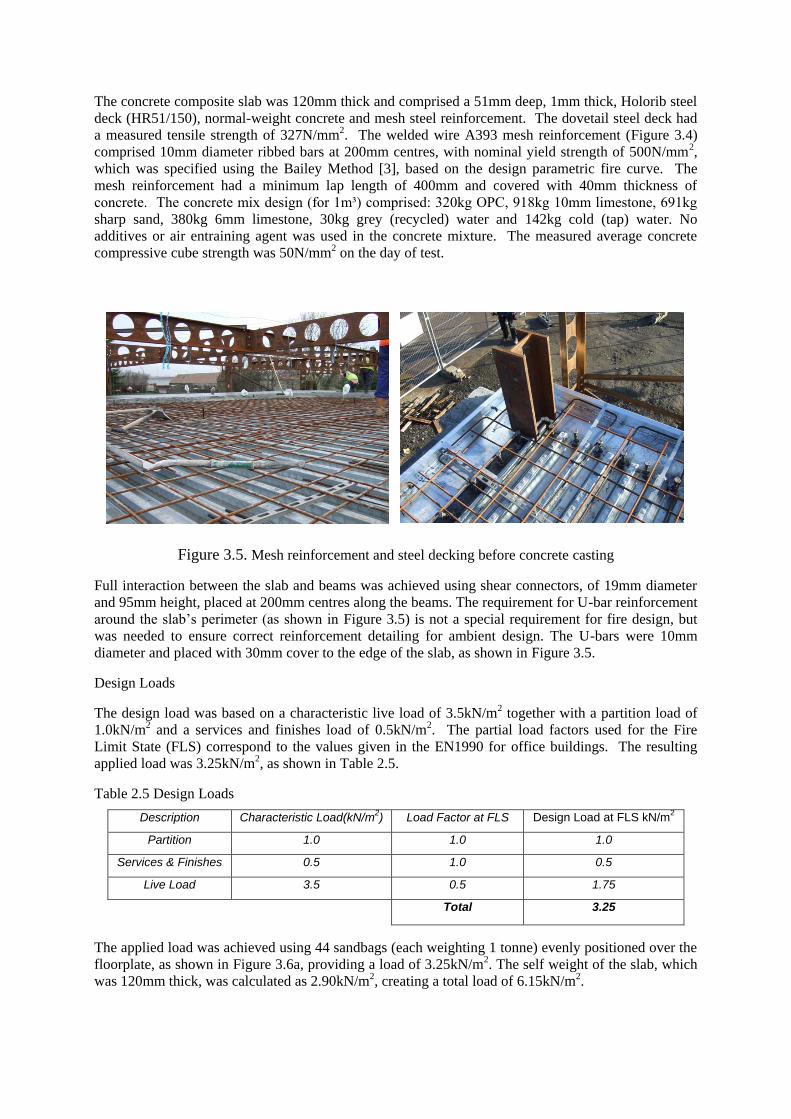
The concrete composite slab was 120mm thick and comprised a 51mm deep, 1mm thick, Holorib steel
deck (HR51/150), normal-weight concrete and mesh steel reinforcement. The dovetail steel deck had
a measured tensile strength of 327N/mm2. The welded wire A393 mesh reinforcement (Figure 3.4)
comprised 10mm diameter ribbed bars at 200mm centres, with nominal yield strength of 500N/mm2,
which was specified using the Bailey Method [3], based on the design parametric fire curve. The
mesh reinforcement had a minimum lap length of 400mm and covered with 40mm thickness of
concrete. The concrete mix design (for 1m³) comprised: 320kg OPC, 918kg 10mm limestone, 691kg
sharp sand, 380kg 6mm limestone, 30kg grey (recycled) water and 142kg cold (tap) water. No
additives or air entraining agent was used in the concrete mixture. The measured average concrete
compressive cube strength was 50N/mm2 on the day of test.
Figure 3.5. Mesh reinforcement and steel decking before concrete casting
Full interaction between the slab and beams was achieved using shear connectors, of 19mm diameter
and 95mm height, placed at 200mm centres along the beams. The requirement for U-bar reinforcement
around the slab’s perimeter (as shown in Figure 3.5) is not a special requirement for fire design, but
was needed to ensure correct reinforcement detailing for ambient design. The U-bars were 10mm
diameter and placed with 30mm cover to the edge of the slab, as shown in Figure 3.5.
Design Loads
The design load was based on a characteristic live load of 3.5kN/m2 together with a partition load of
1.0kN/m2 and a services and finishes load of 0.5kN/m2. The partial load factors used for the Fire
Limit State (FLS) correspond to the values given in the EN1990 for office buildings. The resulting
applied load was 3.25kN/m2, as shown in Table 2.5.
Table 2.5 Design Loads
Description Characteristic Load(kN/m2) Load Factor at FLS Design Load at FLS kN/m
2
Partition 1.0 1.0 1.0
Services & Finishes 0.5 1.0 0.5
Live Load 3.5 0.5 1.75
Total 3.25
The applied load was achieved using 44 sandbags (each weighting 1 tonne) evenly positioned over the
floorplate, as shown in Figure 3.6a, providing a load of 3.25kN/m2. The self weight of the slab, which
was 120mm thick, was calculated as 2.90kN/m2, creating a total load of 6.15kN/m2.

Figure 3.6: (a)Vertical static load, (b)Wooden cribs used for the fire load
Figure 3.7: Locations of measurement positions for deflections and temperatures throughout the slab.
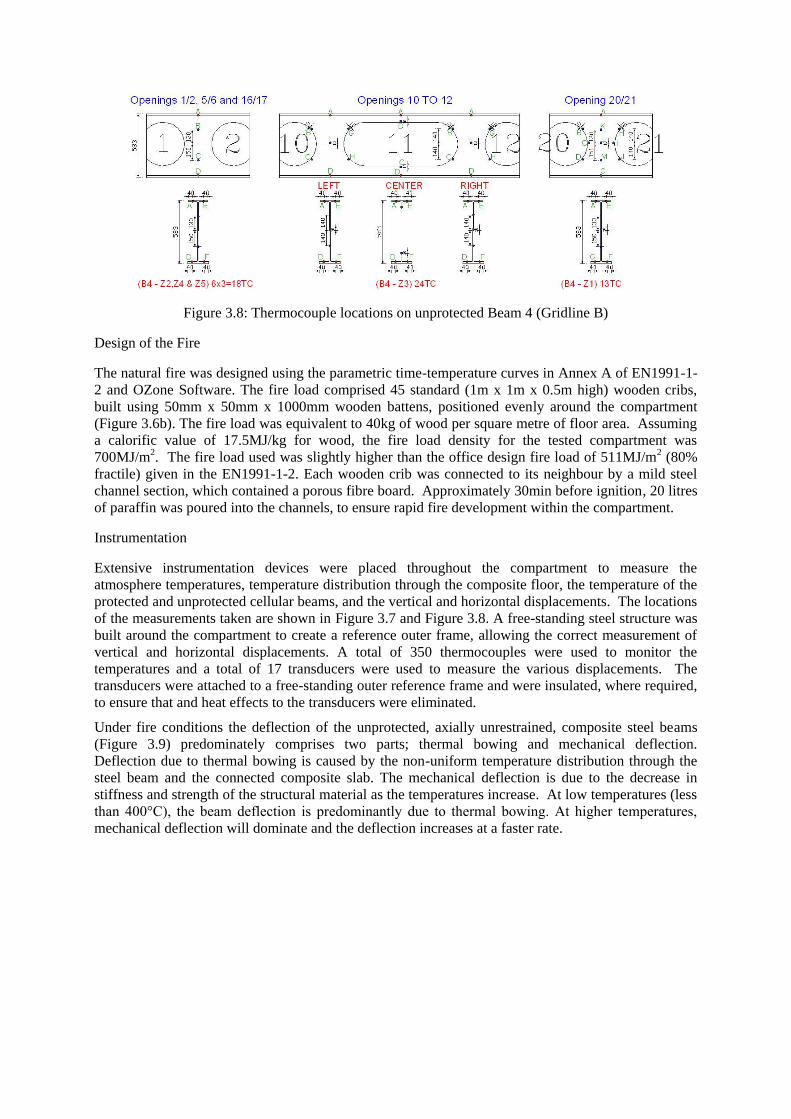
Figure 3.8: Thermocouple locations on unprotected Beam 4 (Gridline B)
Design of the Fire
The natural fire was designed using the parametric time-temperature curves in Annex A of EN1991-1-
2 and OZone Software. The fire load comprised 45 standard (1m x 1m x 0.5m high) wooden cribs,
built using 50mm x 50mm x 1000mm wooden battens, positioned evenly around the compartment
(Figure 3.6b). The fire load was equivalent to 40kg of wood per square metre of floor area. Assuming
a calorific value of 17.5MJ/kg for wood, the fire load density for the tested compartment was
700MJ/m2. The fire load used was slightly higher than the office design fire load of 511MJ/m2 (80%
fractile) given in the EN1991-1-2. Each wooden crib was connected to its neighbour by a mild steel
channel section, which contained a porous fibre board. Approximately 30min before ignition, 20 litres
of paraffin was poured into the channels, to ensure rapid fire development within the compartment.
Instrumentation
Extensive instrumentation devices were placed throughout the compartment to measure the
atmosphere temperatures, temperature distribution through the composite floor, the temperature of the
protected and unprotected cellular beams, and the vertical and horizontal displacements. The locations
of the measurements taken are shown in Figure 3.7 and Figure 3.8. A free-standing steel structure was
built around the compartment to create a reference outer frame, allowing the correct measurement of
vertical and horizontal displacements. A total of 350 thermocouples were used to monitor the
temperatures and a total of 17 transducers were used to measure the various displacements. The
transducers were attached to a free-standing outer reference frame and were insulated, where required,
to ensure that and heat effects to the transducers were eliminated.
Under fire conditions the deflection of the unprotected, axially unrestrained, composite steel beams
(Figure 3.9) predominately comprises two parts; thermal bowing and mechanical deflection.
Deflection due to thermal bowing is caused by the non-uniform temperature distribution through the
steel beam and the connected composite slab. The mechanical deflection is due to the decrease in
stiffness and strength of the structural material as the temperatures increase. At low temperatures (less
than 400°C), the beam deflection is predominantly due to thermal bowing. At higher temperatures,
mechanical deflection will dominate and the deflection increases at a faster rate.

Beam/Slab Deflection
Figure 3.9: Developed compartment fire
Figure 3.10: Deflection of the slab/unprotected beam following the fire.
The maximum recorded steel temperature of 1053°C occurred after 77 minutes at the centre span of
Beams 4 and 5 (Figure 3.11). The maximum temperature occurred on the bottom flange below the
elongated opening. Figure 3.11 shows the temperature distribution at the critical part of the
unprotected CBs. It is worth noting that the temperatures are non-uniform across the web despite the
beams being unprotected and the long duration of the fire. The temperature of the top flange of the
beams is lower, as expected, due to the heat sink effect of the supporting concrete slab. At a
maximum temperature of 1053°C the steel has lost 97% of its strength and stiffness and is contributing
little to the load bearing capacity of the floor system.

Figure 3.11: Recorded temperatures at mid-span of the unprotected beams
Figure 3.12: Recorded maximum temperatures in the unprotected beams.
With increasing temperatures on the unprotected CBs (Figure 3.12), it was observed that post web
buckling occurred initially. The composite action between the CBs and slab prevented twisting of the
beam as a whole. The tendency for the bottom flange to displace laterally caused bending of the
beam’s web leading to overall distortional buckling, as shown in Figure 3.12. At this stage the
unprotected steel temperatures were approximately 800°C and only the top flange was considered to
be providing support to the slab by acting as a catenary. The temperature of the mesh reinforcement,
above the beams reached a maximum of 375°C at 95 minutes, as shown in Figure 3.13 which was well
into the cooling stages of the fire. Figure 3.14 shows the maximum recorded temperature of the mesh
reinforcement between the beams, where again the maximum temperature occurred during the cooling
stages of the fire. The temperature in the concrete slab continues to rise after the maximum
atmosphere temperature, which occurred at 75 mins. The recorded temperatures of the shear studs are
shown in Figure 3.15, where the maximum temperature reached 585°C. Although the shear stud
temperature is high the amount of horizontal shear required reduces as the unprotected beams increase
in temperature and lose strength and stiffness. There was no sign of loss of composite action of the
beams suggesting that the shear studs performed adequately and maintained composite action between
the slab and beams during the full duration of the test.
Beam 4 Zone 3 Centre
0
200
400
600
800
1000
1200
0 20 40 60 80 100 120 140 160
Time (min)
Tem
pe
ratu
re (°C
)A B C D E F
Beam 5 Zone 3 Centre
0
200
400
600
800
1000
1200
0 20 40 60 80 100 120 140 160
Time (min)
Tem
pe
ratu
re (°C
)
A B C D E F
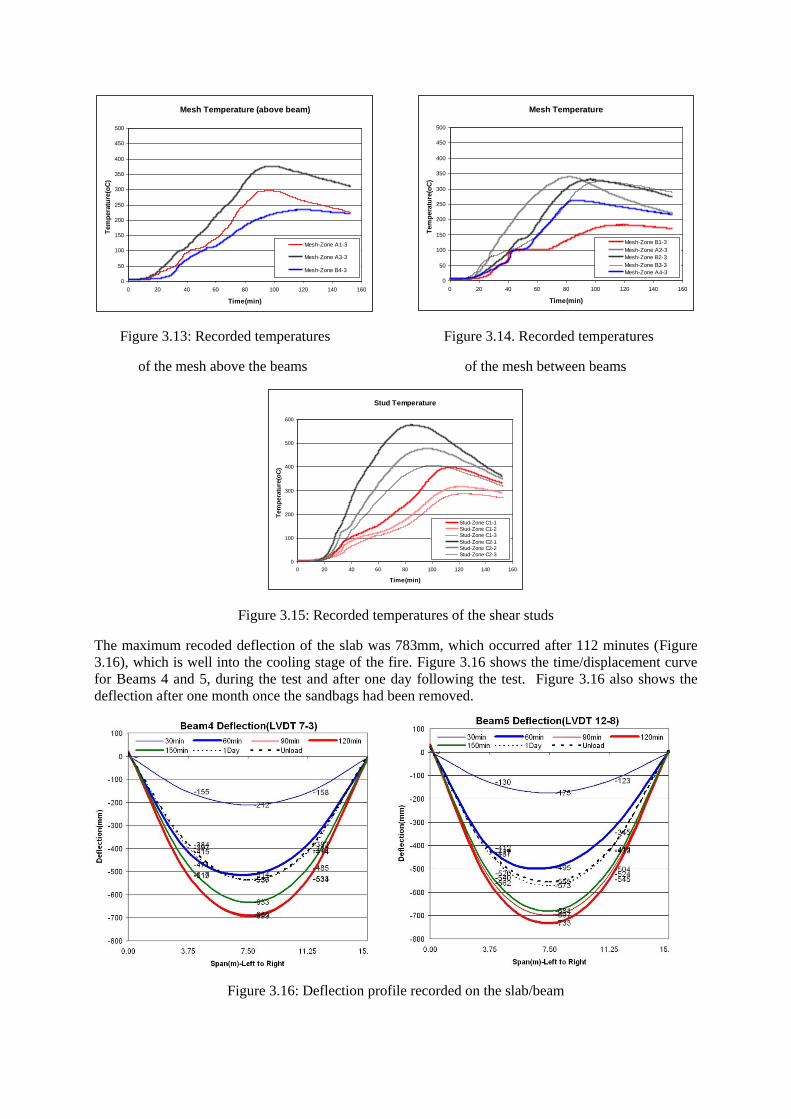
Figure 3.13: Recorded temperatures Figure 3.14. Recorded temperatures
of the mesh above the beams of the mesh between beams
Figure 3.15: Recorded temperatures of the shear studs
The maximum recoded deflection of the slab was 783mm, which occurred after 112 minutes (Figure
3.16), which is well into the cooling stage of the fire. Figure 3.16 shows the time/displacement curve
for Beams 4 and 5, during the test and after one day following the test. Figure 3.16 also shows the
deflection after one month once the sandbags had been removed.
Figure 3.16: Deflection profile recorded on the slab/beam
Mesh Temperature (above beam)
0
50
100
150
200
250
300
350
400
450
500
0 20 40 60 80 100 120 140 160
Time(min)
Tem
pera
ture
(oC
)
Mesh-Zone A1-3
Mesh-Zone A3-3
Mesh-Zone B4-3
Mesh Temperature
0
50
100
150
200
250
300
350
400
450
500
0 20 40 60 80 100 120 140 160
Time(min)
Tem
pera
ture
(oC
)
Mesh-Zone B1-3
Mesh-Zone A2-3
Mesh-Zone B2-3
Mesh-Zone B3-3
Mesh-Zone A4-3
Stud Temperature
0
100
200
300
400
500
600
0 20 40 60 80 100 120 140 160
Time(min)
Tem
pera
ture
(oC
)
Stud-Zone C1-1
Stud-Zone C1-2
Stud-Zone C1-3
Stud-Zone C2-1
Stud-Zone C2-2
Stud-Zone C2-3

The deflection profile of the floor slab, coupled with the composite action between the beams and slab,
caused rotation of the top flange of the steel beam. This induced a secondary moment into the beam
section, together with vertical shear force, leading to distortional buckling of the CBs driving the
lower tee laterally out of its original plane. At this stage the load was predominately supported by
membrane action of the floor slab, corresponding to fundamental principles outlined in the Bailey
design method.
It can be seen that the unprotected cellular beams effectively went into catenary action, with only the
top tee contributing to supporting the load. Web post buckling, which is commonly observed in
isolated small-scale fire tests, occurred around the first opening in the beam where the overall
displacements are restricted.
Membrane Action in Floor Slabs
The steel deck reached temperatures in excess of 900°C and was observed to have de-bonded from the
concrete in most areas. At a temperature of 900°C the steel deck had lost 94% of its strength and
therefore, coupled with de-bonding, did not significantly contributed to the overall strength of the
floorplate at the point of maximum fire severity. This corresponds to the design assumption by Bailey
where the contribution from the steel deck is ignored in the calculation of the load capacity of the slab.
However, it is worth noting that the steel deck does have the beneficial effect of reducing the
consequence of any spalling since it ensures that any spalled/cracked concrete stays in place, provided
that the deck does not significantly debond and creates a large gap between the deck and concrete. In
the test a large crack occurred across the short span of the floor slab (Figure 3.17) corresponding to the
previous test observations of membrane action.
Figure 3.17. Cracking pattern highlighting behaviour of the slab
The supported concrete slab was not horizontally restrained around its perimeter and the supporting
protected perimeter beams maintained their load carrying capacity and were subjected to small vertical
displacements. This allowed membrane action to develop with the in-plane forces in the central region
of the slab going into tension and in-plane equilibrium compressive forces forming in the slab around
its perimeter (Figure 3.17). This behaviour is analogous to a bicycle wheel; the spokes representing
tensile membrane action, and the rim representing compressive membrane action.
Tension
Zone
Compression zone (ring)

Conclusions
The floorplate performed extremely well supporting the applied load for the duration of the test and
highlighted the inherent strength in the system due to membrane action of the floor plate. Based on the
measured data it was shown that the reinforcement in the central region of the slab was under tensile
force forming an elliptical parabolic tensile mesh anchored by a concrete compressive ring forming
around the perimeter of the slab. Due to membrane action, the existence of secondary beams to
support the slab is not necessary in the fire condition and these beams can be left unprotected.
Acknowledgements
The support of the RFCS project No. RFS2-CT -2011-00025 entitled MACS+ Membrane Action in fire design of
Composite Slab with solid and cellular steel beams is gratefully acknowledged. This presentation is part of the
dissemination project.
The research was supported by the Hungarian Scientific Research Fund OTKA T 75678 and by the TÁMOP
4.2.1.B-10/2/KONV-2010–0001 entitled Increasing the quality of higher education through the development of
research - development and innovation program at the University of Miskolc.
About the authors JÁRMAI, Károly, University of
Miskolc, Hungary, VASSART, Olivier, ArcelorMittal
Esch, Research and Development, Luxembourg, ZHAO,
Bin, CTICM –Fire and Testing Division, France
3 REFERENCES
1. ‘Fire Safe Design: A new approach to multi-storey steel framed buildings’ P288, The Steel Construction
Institute, 2006.
2. ‘The behaviour of Multi-storey steel framed buildings in fire’, A European joint research programme,
British Steel Swinden Technology Centre, 1999
3. Lennon, T., ‘Cardington fire tests: instrumentation locations for large compartment fire test.’, Building
Research Establishment Report N100/98, June 1996.
4. Lennon, T., ‘Cardington fire tests: instrumentation locations for corner fire test.’, Building Research
Establishment Report N152/95, June 1996
5. Bailey C.G. and Moore D.B., The structural behaviour of steel frames with composite floor slabs subjected
to fire: Part 1: Theory
6. Bailey C.G. and Moore D.B., The structural behaviour of steel frames with composite floor slabs subjected
to fire: Part 2: Design
7. Hayes B. and Taylor R. Load-Testing RC slabs. The Consulting Engineer. Nov. 1969. pp 46-47
8. Taylor R., Maher D.R.H. and Hayes B. Effect of arrangement of reinforcement on the behaviour of the
reinforce concrete slabs. Magazine of concrete research Vol 18 No. 55. June 1966. pp 85-94
9. Bailey CG, Membrane action of slab/beam composite floor systems in fire. Engineering Structures 26
2004:1691-1703.
10. Sawczuk A. and Winniki L. Plastic behaviour of simply supported reinforced concrete plated are
moderately large deflections. Int J. Solids Structures Vol 1 1965 pp. 97 to 111.
11. EN 1992-1-2, Eurocode 2, Design of concrete structures. Part 1.2: General rules. Structural fire design,
CEN
12. EN 1994-1-2, Eurocode 2, Design of composite steel and concrete structures. Part 1.2: General rules.
Structural fire design, CEN
13. EN 1994-1-1, Eurocode 4 Design of composite steel and concrete structures – Part 1-1: General rules and
rules for buildings, CEN
14. EN 1993-1-8, Eurocode 3 Design of steel structures – Part 1-8: Design of joints, CEN
15. EN 1992-1-1, Eurocode 2 Design of Concrete Structures – Part 1-1: General rules and rules for buildings,
CEN
16. EN 1991-1-2 - Eurocode 1 " Actions on structures. General actions. " – Part 1-2: Actions on structures
exposed to fire, CEN.
17. Vassart, O. and Zhao, B. “Fire Resistance Assessment of Partially Protected Composite Floors (FRACOF)
Design guide”, Leonardo Da Vinci European Program,2009.
18. Vassart, O. and Zhao, B. “Fire Resistance Assessment of Partially Protected Composite Floors (FRACOF)
Engineering Background”, Leonardo Da Vinci European Program, 2009.