membrane interactions of lipopeptides and saponins, two ... · pdf filelipopeptides and...
TRANSCRIPT
Membrane interactions of lipopeptides and saponins, two
groups of natural
amphiphilesJ. Lorent
(public defence)
Main supervisor
: M-P. Mingeot-Leclercq (FACM)Co-supervisor
: J. Quetin-Leclercq (GNOS)
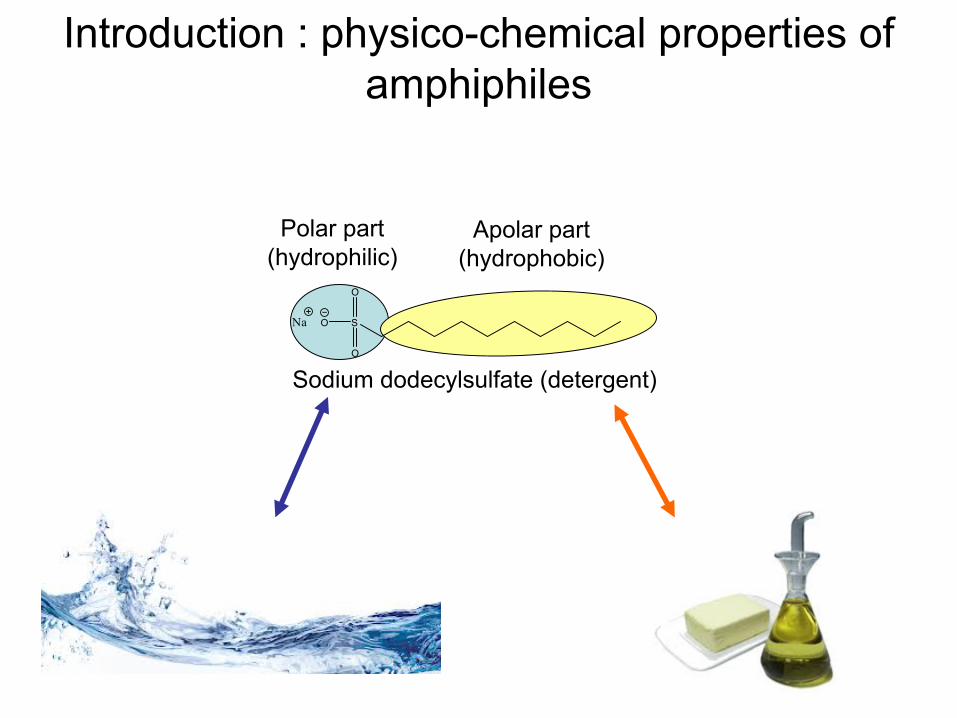
Introduction : physico-chemical
properties
of amphiphiles
Polar part(hydrophilic)
Apolar
part(hydrophobic)
S
O
O
ONa
Sodium dodecylsulfate
(detergent)
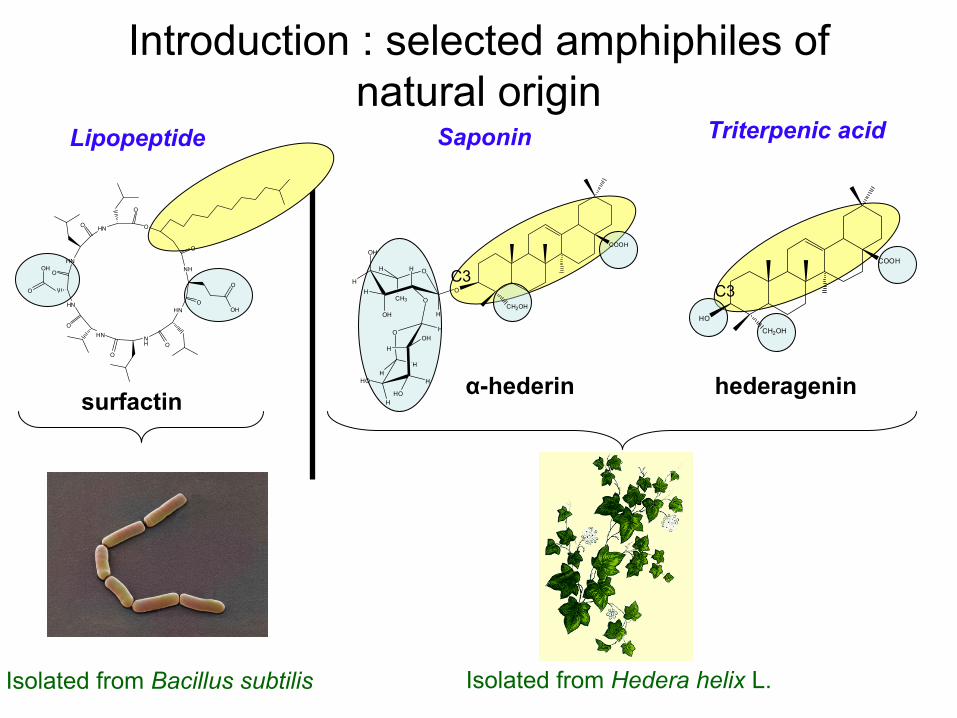
Introduction : selected
amphiphiles of natural
origin
surfactin hederagenin
Saponin Triterpenic
acidLipopeptide
α-hederin
C3C3
HN
HN
O
O
NH
HN
OOH
O
O
HN
HNO
O
NH
O
O
O
OH
O
CH2OH
COOH
O
HO
H
H
HO
HOH
HH
O
OH
H
OH
H
H
H
OCH3
H
O
H
CH2OH
COOH
HO
Isolated
from
Hedera helix
L. Isolated
from
Bacillus
subtilis
HHO H
HO H
HO H
HO H
HO
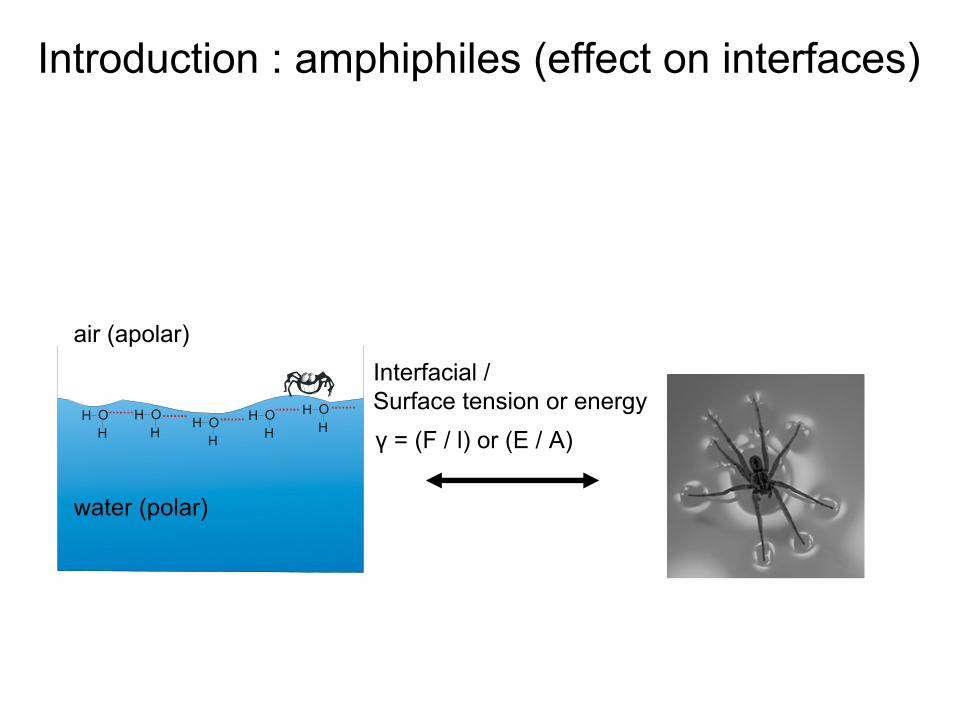
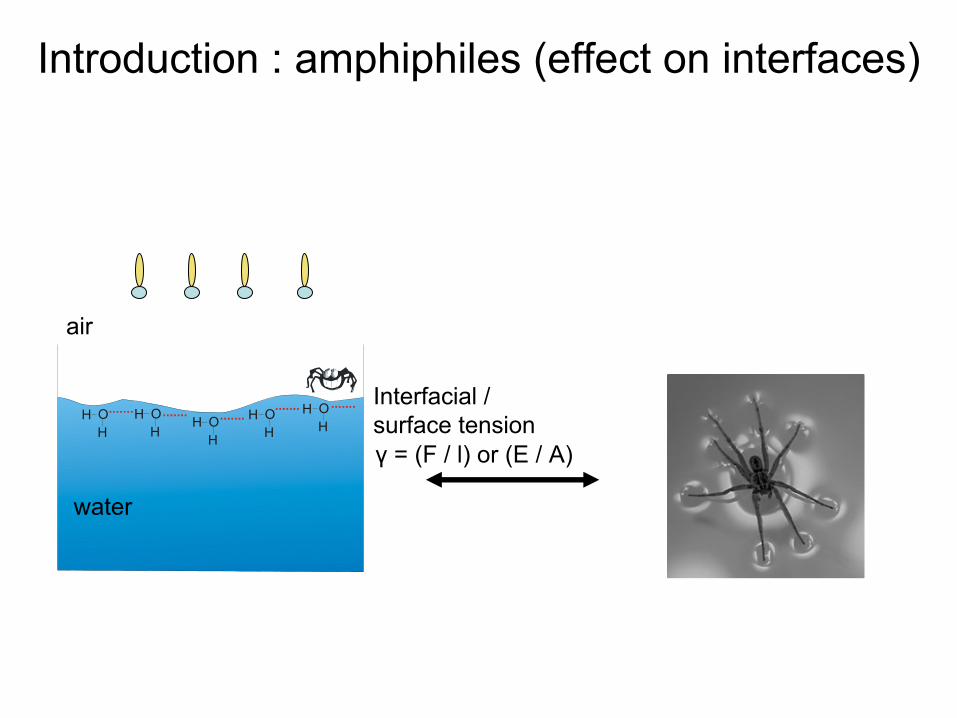
water (polar)
air (apolar)Interfacial
/ Surface tension or energyγ
= (F / l) or (E / A)
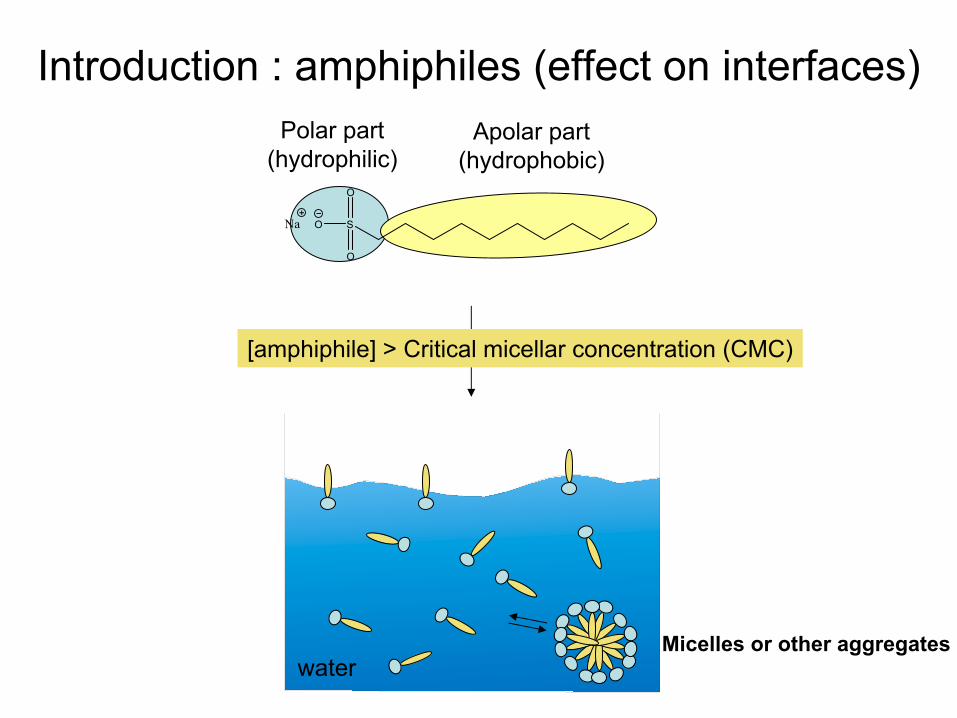
Introduction : amphiphiles (effect
on interfaces)
HHO H
HO H
HO H
HO H
HO
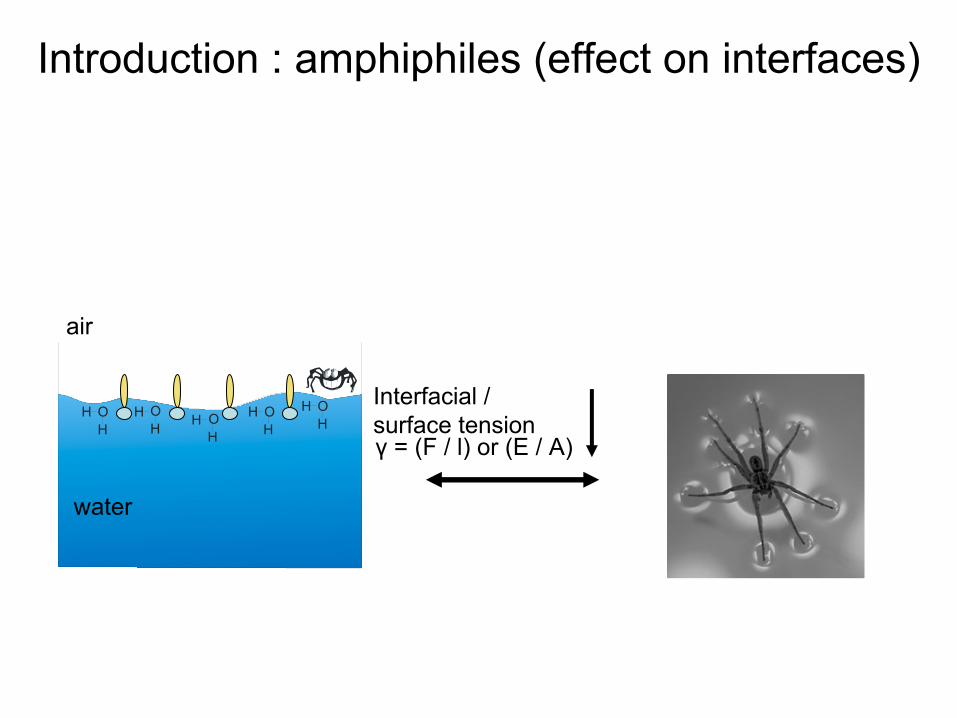
water
air
Interfacial
/surface tensionγ
= (F / l) or (E / A)
Introduction : amphiphiles (effect
on interfaces)
HHO H
HO H
HO H
HO H
HO
water
air
Interfacial
/surface tensionγ
= (F / l) or (E / A)
Introduction : amphiphiles (effect
on interfaces)
HHO H
HO H
HO H
HO H
HO
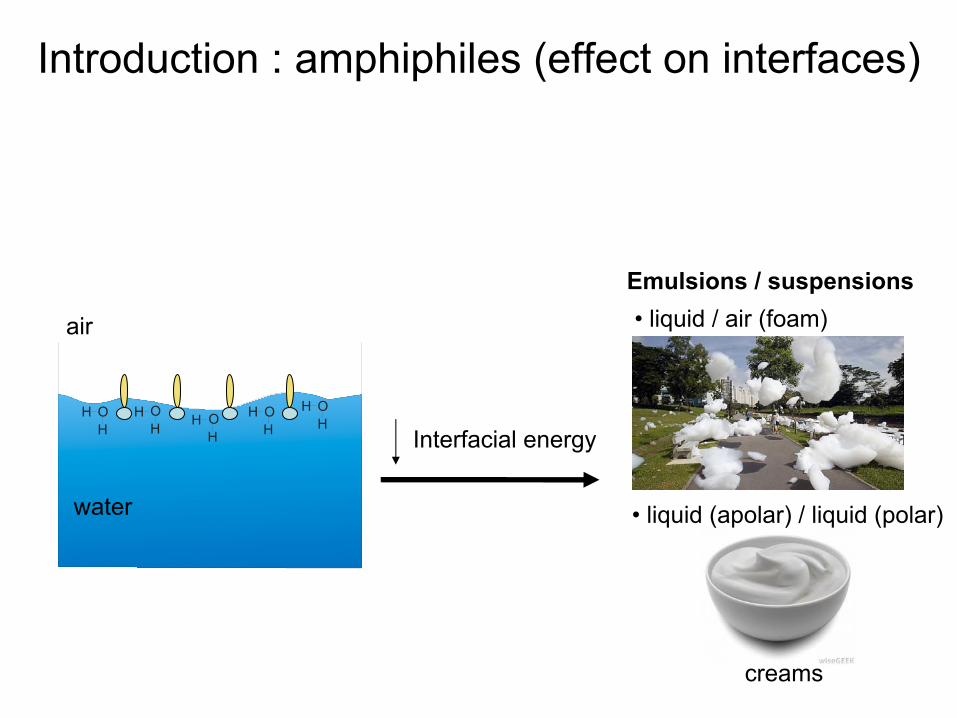
water
Interfacial
energy
air
Emulsions / suspensions
Introduction : amphiphiles (effect
on interfaces)
• liquid
/ air (foam)
• liquid
(apolar) / liquid
(polar)
creams

Introduction : amphiphiles (self-aggregation)Polar part
(hydrophilic)Apolar
part(hydrophobic)
S
O
O
ONa
water
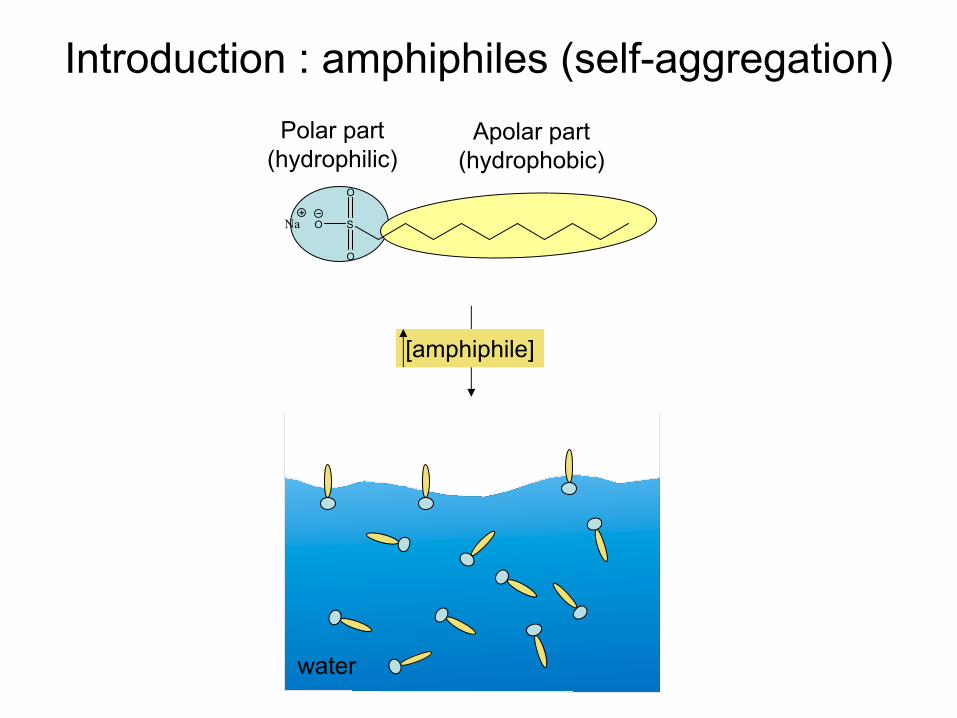
Polar part(hydrophilic)
Apolar
part(hydrophobic)
S
O
O
ONa
[amphiphile]
Introduction : amphiphiles (self-aggregation)
water
S
O
O
ONa
Polar part(hydrophilic)
Apolar
part(hydrophobic)
[amphiphile] > Critical
micellar
concentration (CMC)
Micelles or other
aggregates
Introduction : amphiphiles (effect
on interfaces)
water

O
H
OH
H
H
O
H
P OO
O
R
O
HS OO
ONa
Introduction : amphiphiles (self-aggregation, intrinsic
curvature
and polymorphism)
Normal hexagonal HI MicellesCone
shape Cubic
(CI
)
ς
> 0Intrinsic
molecular
curvature
Detergents Lysophospholipids
OH
H
HH
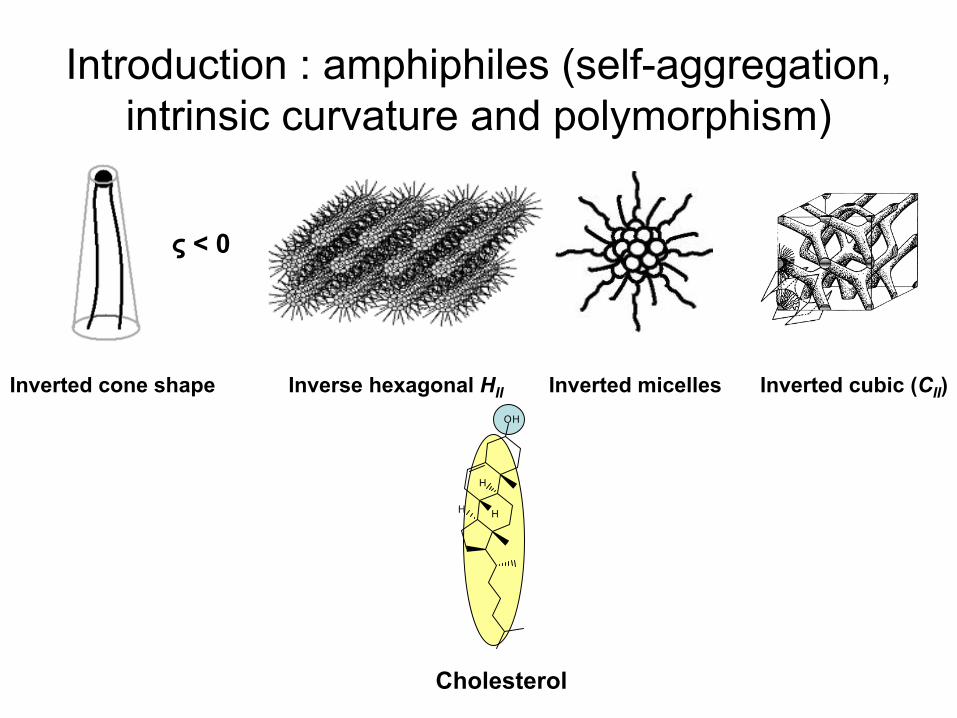
Introduction : amphiphiles (self-aggregation, intrinsic
curvature
and polymorphism)
Inverse hexagonal HII Inverted
micellesInverted
cone
shape Inverted
cubic
(CII
)
ς
< 0
Cholesterol

O
H
O
HH
O
H
P OOO
OO
H
N
OH
NH
H
H
O
H
P OO
OR
O
H
Introduction : amphiphiles (self-aggregation, intrinsic
curvature
and polymorphism)
Lamellar
Lα
, Lβ
, Lo (bilayers
or lipid
membranes) Cylinder
shape
ς
= 0
Phosphatidylcholines Sphingomyelins
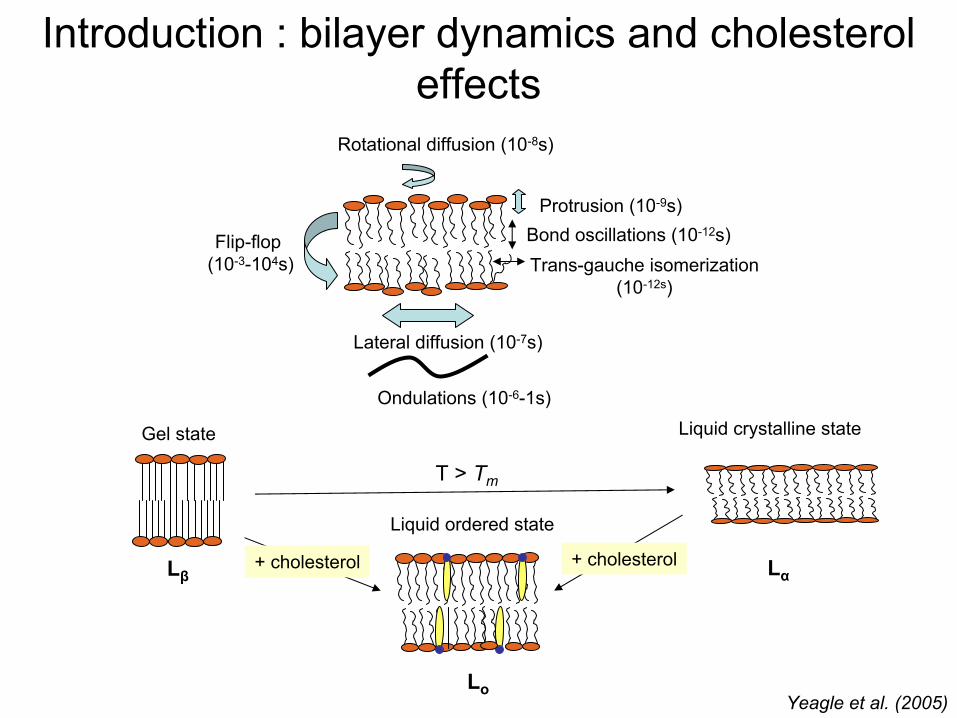
Introduction : bilayer
dynamics
and cholesterol effects
Lateral
diffusion (10-7s)
Protrusion
(10-9s)
Flip-flop (10-3-104s)
Rotational
diffusion (10-8s)
Trans-gauche isomerization(10-12s)
Bond oscillations (10-12s)
Ondulations (10-6-1s)
Yeagle
et al. (2005)
Gel state Liquid
crystalline
state
Liquid
ordered
state
T
> Tm
Lβ Lα
Lo
+ cholesterol + cholesterol
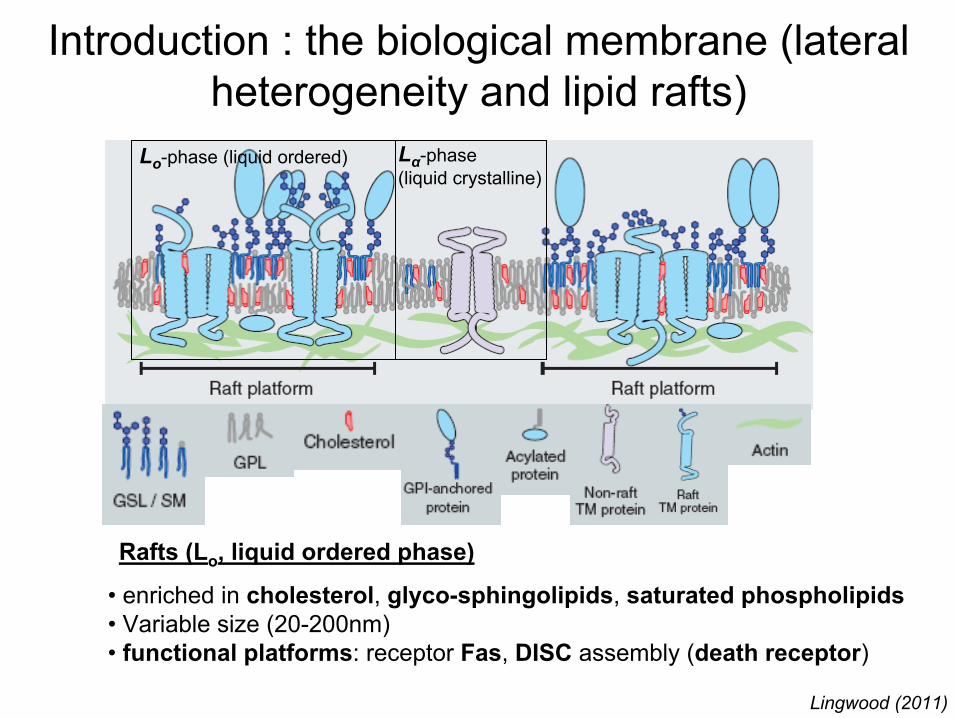
Introduction : the biological
membrane (lateral heterogeneity
and lipid
rafts)
• enriched
in cholesterol, glyco-sphingolipids, saturated
phospholipids• Variable size (20-200nm)• functional
platforms: receptor
Fas, DISC
assembly
(death
receptor)
Lingwood
(2011)
Lo-phase (liquid
ordered) Lα-phase(liquid
crystalline)
Rafts (Lo
, liquid
ordered
phase)
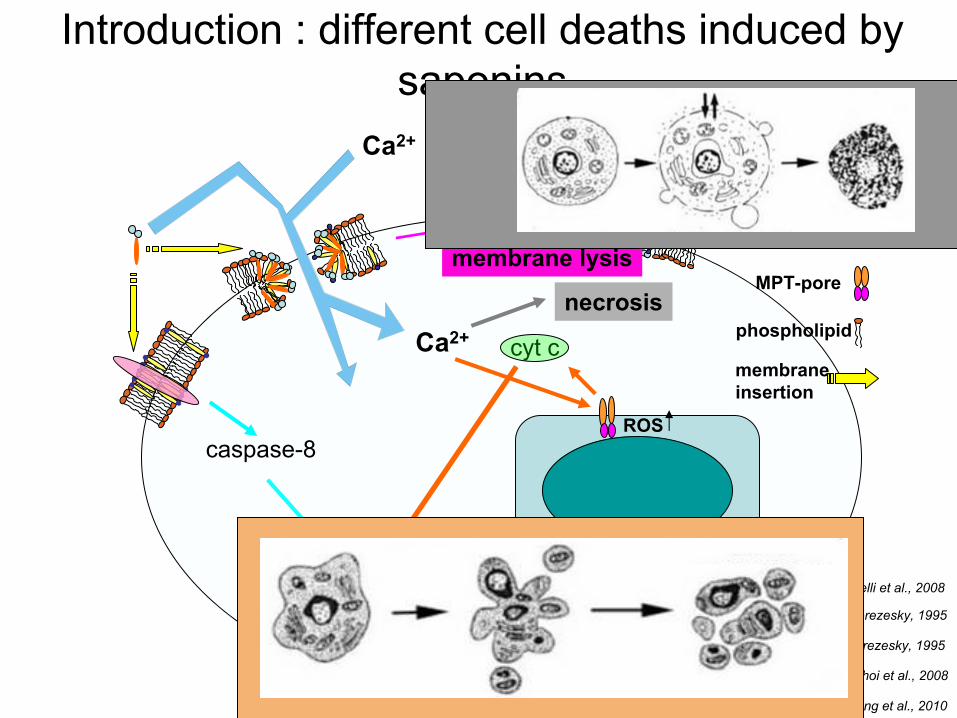
Introduction : different
cell
deaths
induced
by saponins
cholesterol
mitochondriacaspase-3
condensation, fragmentation nuclei
death
receptor
MPT-pore
cytoplasm
necrosis
caspase-8
saponin
phospholipid
Ca2+
membraneinsertion
Apoptosis
membrane lysis
Ca2+
ROS
cyt
c
Mazzucchelli
et al., 2008
Trump
and Berezesky, 1995
Trump
and Berezesky, 1995
Choi et al., 2008
Jiang et al., 2010

Aim
of the study
HN
HN
O
O
NH
HN
OOH
O
O
HN
HNO
O
NH
O
O
O
OH
O
CH2OH
COOH
O
HO
H
H
HO
HOH
HH
O
OH
H
OH
H
H
H
OCH3
H
O
H CH2OH
COOH
HO
? Raft located
death
receptor
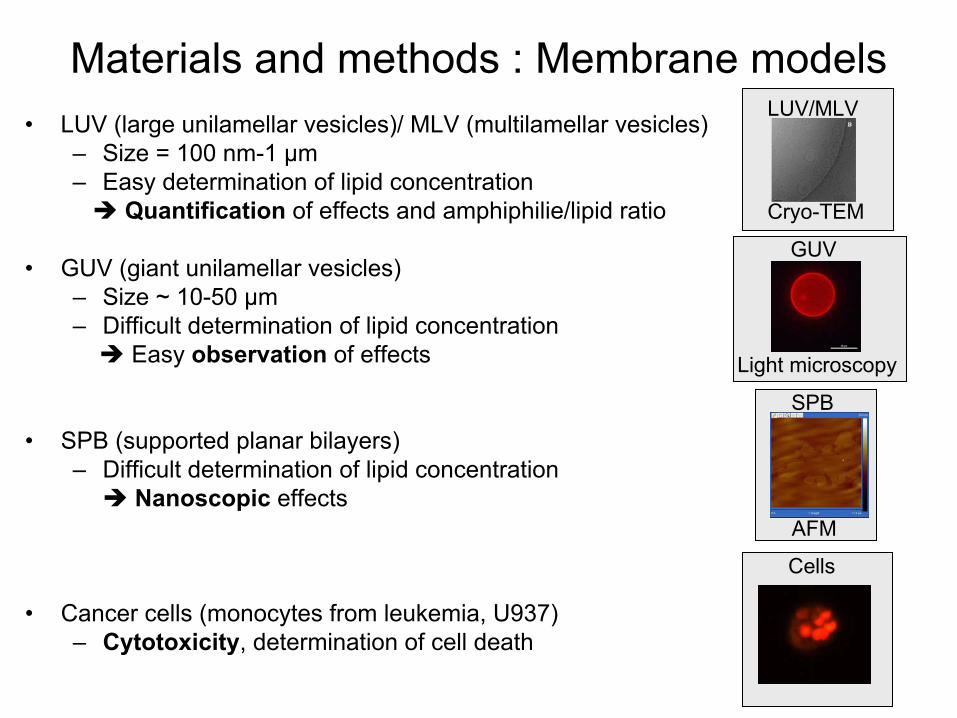
Materials
and methods
: Membrane models•
LUV (large unilamellar
vesicles)/ MLV (multilamellar
vesicles)–
Size = 100 nm-1 µm –
Easy
determination
of lipid
concentration Quantification
of effects
and amphiphilie/lipid
ratio
•
GUV (giant
unilamellar
vesicles)–
Size ~ 10-50 µm–
Difficult
determination
of lipid
concentration Easy
observation
of effects
•
SPB (supported
planar
bilayers)–
Difficult
determination
of lipid
concentration Nanoscopic
effects
•
Cancer cells
(monocytes from
leukemia, U937)–
Cytotoxicity, determination
of cell
death
Light microscopy
GUV
Cryo-TEM
LUV/MLV
AFM
SPB
Cells
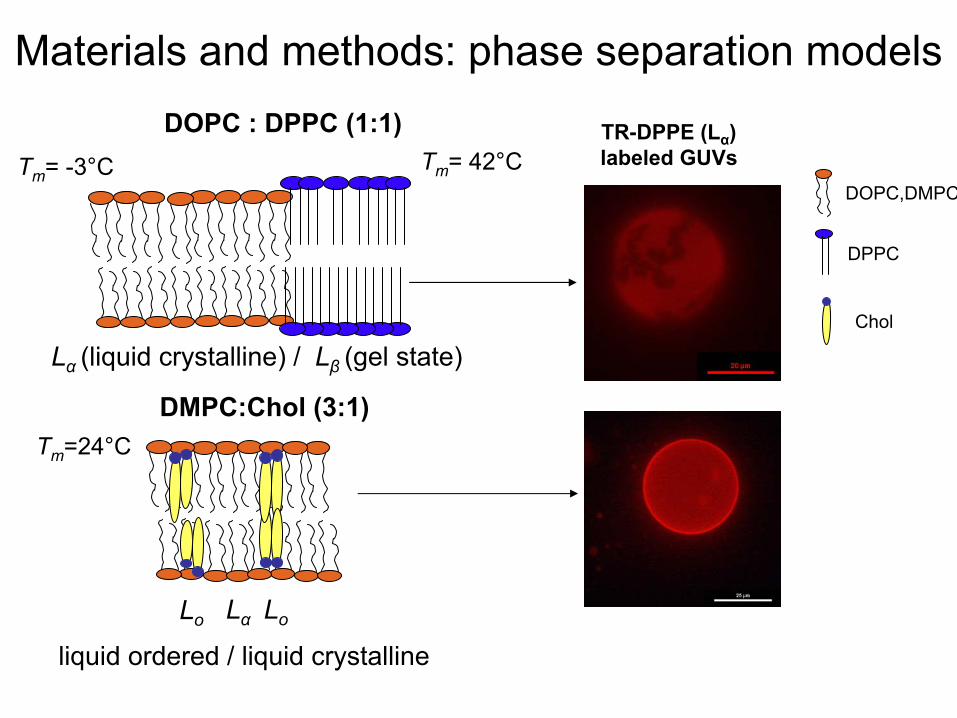
Materials
and methods: phase separation
modelsDOPC : DPPC (1:1)
Lα
(liquid
crystalline) / Lβ
(gel state)
Tm
= -3°C Tm
= 42°CTR-DPPE (Lα
)labeled
GUVsDOPC,DMPC
DPPC
Chol
DMPC:Chol
(3:1)Tm
=24°C
Lo Lα Lo
liquid
ordered
/ liquid
crystalline
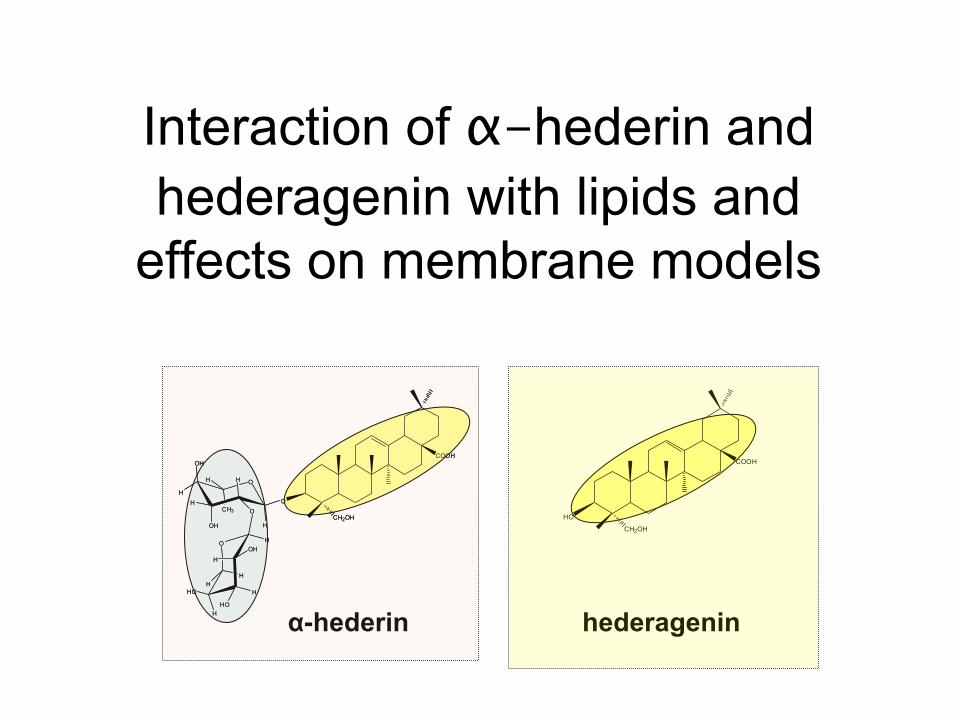
Interaction of α-hederin
and hederagenin
with
lipids
and
effects
on membrane models
CH2OH
COOH
O
HO
H
H
HO
HOH
HH
O
OH
H
OH
H
H
H
OCH3
H
O
H
CH2OH
COOH
HO
α-hederin hederagenin
CH2OH
COOH
O
HO
H
H
HO
HOH
HH
O
OH
H
OH
H
H
H
OCH3
H
O
H

Induction of Highly
Curved
Structures in Relation to Membrane Permeabilization
and Budding
by the Triterpenoid
Saponins, α-
and δ-
hederin
Joseph Lorent1,2, Cécile S. Le Duff3, Joelle
Quetin-Leclercq2
and Marie-Paule Mingeot-Leclercq1*
1Université
catholique de Louvain, Louvain Drug Research
Institute, Cellular and Molecular
Pharmacology, Avenue E. Mounier 73, UCL B1.73.05, B-1200 Bruxelles, Belgium.
2Université
catholique de Louvain, Louvain Drug Research
Institute, Pharmacognosy, Avenue E. Mounier 73, UCL B1.72.03, B-1200 Bruxelles, Belgium.
3Université
catholique de Louvain, -
Institute of Condensed
Matter
and Nanosciences, Molecules, Solids
and Reactivity, Place Louis Pasteur 1, UCL L4.01.04, B-1348 Louvain-la-Neuve, Belgium.
Journal of Biological
Chemistry
2013, 288, pp. 14000-14017
Phase separation
and permeabilization
induced
by the saponin
α-hederin
and its
aglycone hederagenin
in a raft mimicking
bilayer
Langmuir, submitted
Joseph Lorent1,4, Laurence Lins2, Domenech
Òscar3, Joelle Quetin-Leclercq4, Robert Brasseur2
and Marie-Paule
Mingeot-Leclercq1
1Université
catholique
de Louvain, Louvain Drug Research Institute, Cellular and Molecular Pharmacology, UCL B1.73.05, Avenue E. Mounier
73, B-1200 Brussels, Belgium.
2ULg, Centre de Biophysique Moléculaire Numérique, Agro-BioTech
Gembloux, Passage des Déportés, 2, B-
5030 Gembloux, Belgium.
3University of Barcelona, Departament
de Fisicoquímica, Facultat
de Farmacia, UB and Institut de Nanocie ncia
i Nanotecnologia
IN, 08028 Barcelona, Spain.
4Université
catholique de Louvain, Louvain Drug Research
Institute, Pharmacognosy, B1.72.03, Avenue E. Mounier 72, B-1200 Brussels, Belgium.
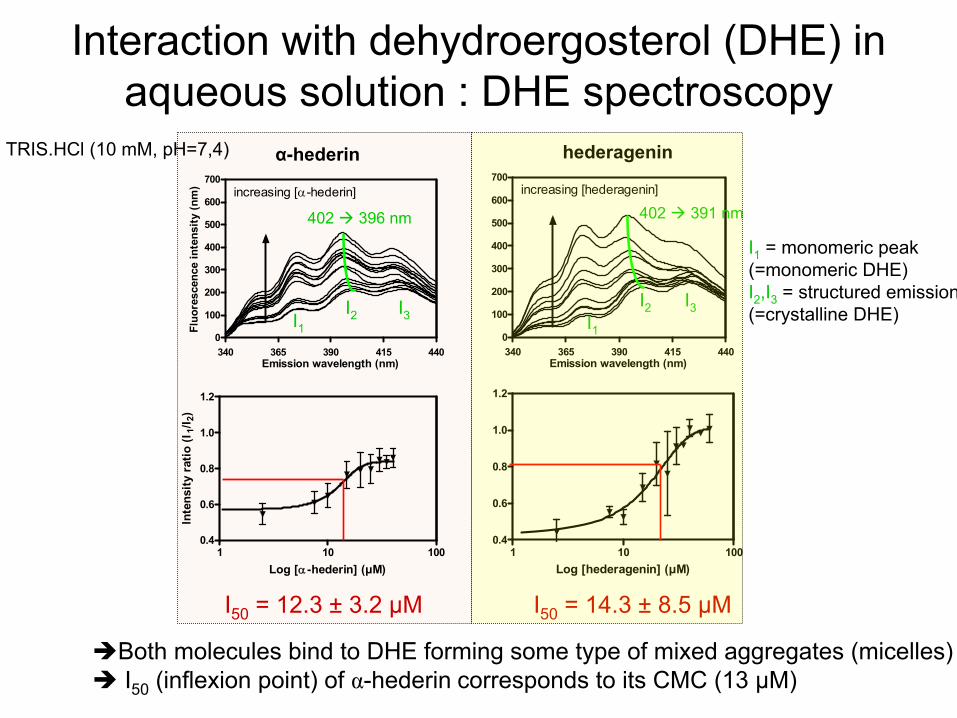
Interaction with
dehydroergosterol
(DHE) in aqueous
solution : DHE spectroscopy
Both
molecules
bind
to DHE forming
some
type of mixed aggregates
(micelles) I50
(inflexion point) of α-hederin
corresponds to its
CMC (13 µM)
I1
= monomeric
peak(=monomeric
DHE)I2
,I3
= structured
emission(=crystalline
DHE)
340 365 390 415 4400
100
200
300
400
500
600
700increasing [-hederin]
Emission wavelength (nm)
Fluo
resc
ence
inte
nsity
(nm
)
1 10 1000.4
0.6
0.8
1.0
1.2
Log [-hederin] (µM)
Inte
nsity
rat
io (I
1/I 2
)
1 10 1000.4
0.6
0.8
1.0
1.2
Log [hederagenin] (µM)
340 365 390 415 4400
100
200
300
400
500
600
700increasing [hederagenin]
Emission wavelength (nm)
α-hederin hederagenin
I50
= 12.3 ±
3.2
µM I50
= 14.3 ±
8.5 µM
402 396 nm 402 391 nm
I1I2
I2I1
I3I3
TRIS.HCl
(10 mM, pH=7,4)
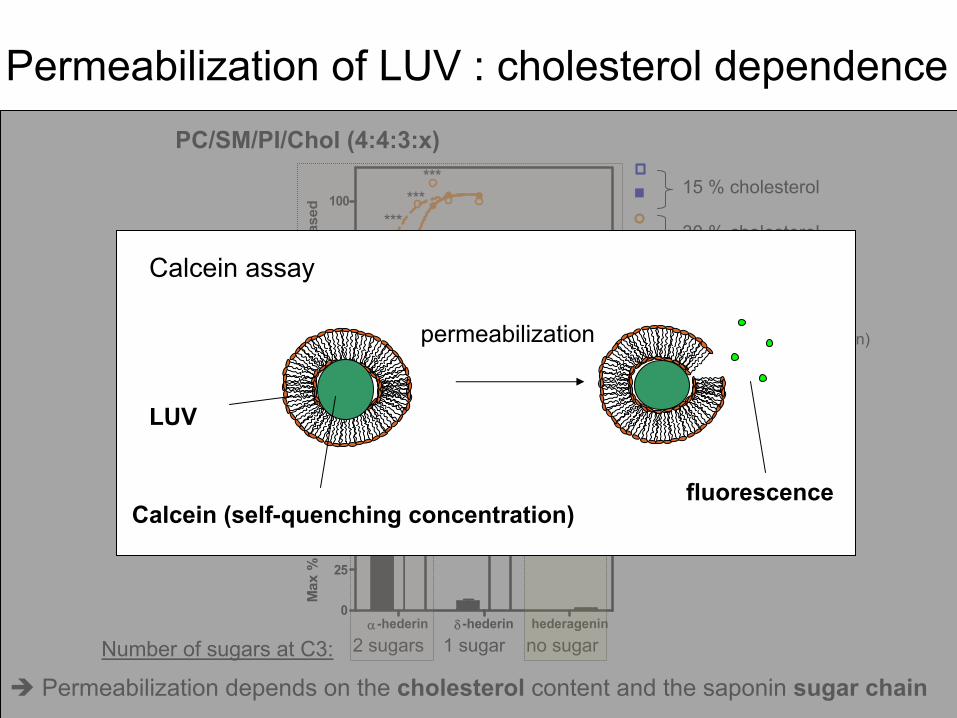
Permeabilization
of LUV :
cholesterol
dependencePC/SM/PI/Chol
(4:4:3:x)
15 % cholesterol
30 % cholesterol
18h30min
p<0.05, ** p<0.01, *** p<0.001 two-way
ANOVA (18h vs 30min)
-hederin -hederin hederagenin0
25
50
75
100 4
Max
% c
alce
in r
elea
sed
0 10 20 30 40 50
0
25
50
75
100***
***
***
***
**
[-hederin]:[cholesterol]
% c
alce
in r
elea
sed
Permeabilization
depends
on the cholesterol
content and the saponin
sugar
chain
DMPC/Chol
(3:1) [compound] / [lipid] ratio
2 sugars 1 sugar no sugarNumber
of sugars
at
C3:
Calcein
(self-quenching
concentration)
Calcein
assay
LUV
fluorescence
permeabilization

Permeabilization
of LUV :
cholesterol
dependencePC/SM/PI/Chol
(4:4:3:x)
15 % cholesterol
30 % cholesterol
18h30min
p<0.05, ** p<0.01, *** p<0.001 two-way
ANOVA (18h vs 30min)
-hederin -hederin hederagenin0
25
50
75
100 4
Max
% c
alce
in r
elea
sed
0 10 20 30 40 50
0
25
50
75
100***
***
***
***
**
[-hederin]:[cholesterol]
% c
alce
in r
elea
sed
Permeabilization
depends
on the cholesterol
content and the saponin
sugar
chain
DMPC/Chol
(3:1) [compound] / [lipid] ratio
2 sugars 1 sugar no sugarNumber
of sugars
at
C3:
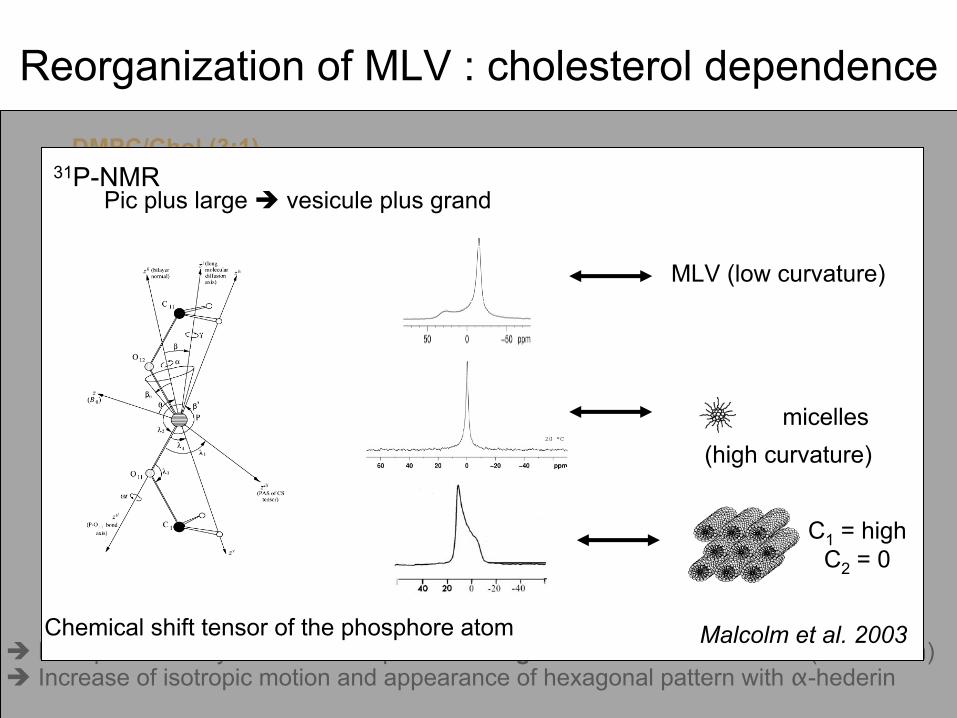
Reorganization
of MLV : cholesterol
dependence
Control
Disruption of bilayer
structure depends
on sugar
chain
and cholesterol
(not shown) Increase
of isotropic
motion and appearance
of hexagonal pattern with
α-hederin
10% α-hederin
20% α-hederin
DMPC/Chol
(3:1)
and macroscopic
phase separation
Malcolm et al. 2003Chemical
shift tensor
of the phosphore atom
31P-NMRPic plus large vesicule
plus grand
micelles
MLV (low
curvature)
(high
curvature)
C1
= highC2
= 0

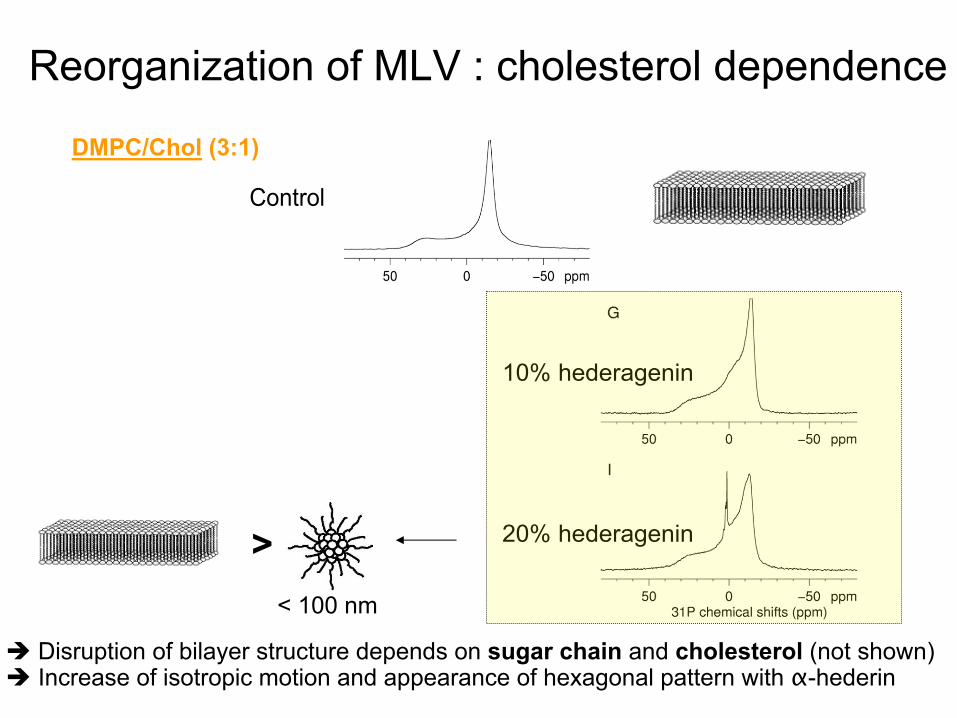
Reorganization
of MLV : cholesterol
dependence
Disruption of bilayer
structure depends
on sugar
chain
and cholesterol
(not shown) Increase
of isotropic
motion and appearance
of hexagonal pattern with
α-hederin
10% α-hederin
20% α-hederin
Control
DMPC/Chol
(3:1)
+
Reorganization
of MLV : cholesterol
dependence
Disruption of bilayer
structure depends
on sugar
chain
and cholesterol
(not shown) Increase
of isotropic
motion and appearance
of hexagonal pattern with
α-hederin
10% hederagenin
20% hederagenin
Control
DMPC/Chol
(3:1)
>< 100 nm

Sterol/phospholipid
phase separation
in MLV
Decrease
of FRET efficiency
is
significant
only
with
α-hederin
at
high
compound/lipid
ratios
D
0 0.2 0.6 0.8 1.2
F
1
2
3
**
C
I 430/I
371
0 0.25 0.6 0.8 1.21
2
3
*
E
I 430/I
371
0 2500 5000 7500 100001
2
3A
time (s)
I 430/I
371
0 2500 5000 7500 10000
B Control0.250.60.81.2
time (s)
-hederin hederagenin
3h
24h
-hederin/lipids hederagenin/lipids
*p < 0.05, one-way
ANOVA (vs. Control)
[compound]/[lipids]DMPC/Chol
(3:1)
Low
energy
transfert
High energy
transfert
OH
OH
Förster
energy
resonance
transfert (FRET)
DHEDPH-PC
High FRET ratio
Low
FRET ratio

Sterol/phospholipid
phase separation
in MLV
Decrease
of FRET efficiency
is
significant
only
with
α-hederin
at
high
compound/lipid
ratios
D
0 0.2 0.6 0.8 1.2
F
1
2
3
**
C
I 430/I
371
0 0.25 0.6 0.8 1.21
2
3
*
E
I 430/I
371
0 2500 5000 7500 100001
2
3A
time (s)
I 430/I
371
0 2500 5000 7500 10000
B Control0.250.60.81.2
time (s)
-hederin hederagenin
3h
24h
-hederin/lipids hederagenin/lipids
*p < 0.05, one-way
ANOVA (vs. Control)
[compound]/[lipids]
DMPC/Chol
(3:1)

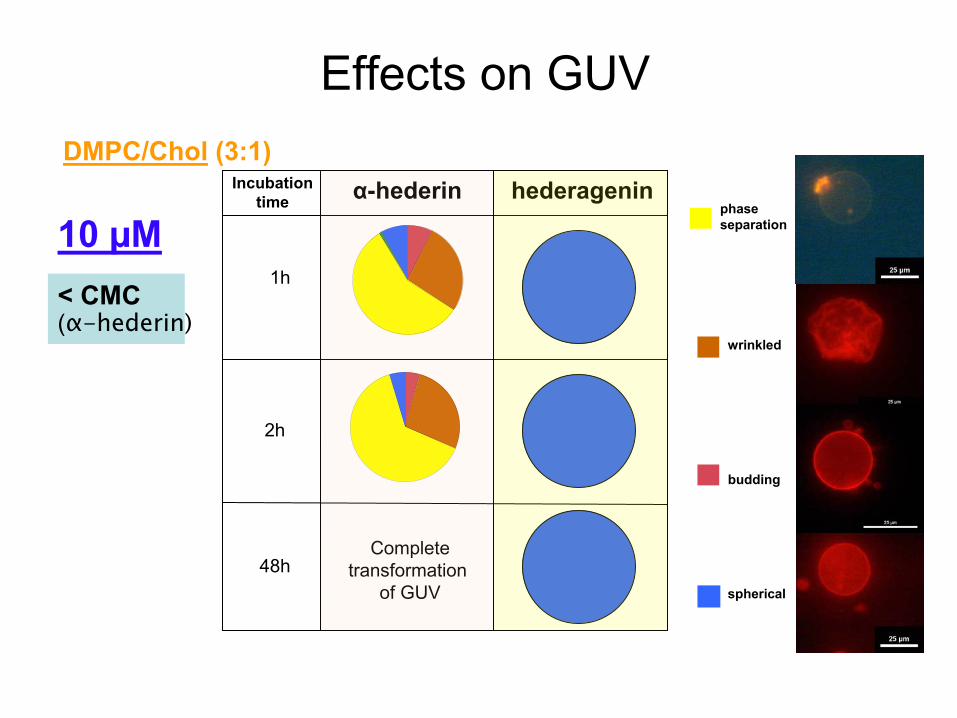
α-hederin hederagenin
10 µM
budding
wrinkled
phase separation
spherical
Incubationtime
Effects
on GUV
< CMC(α-hederin)
2h
48hComplete
transformation of GUV
DMPC/Chol
(3:1)
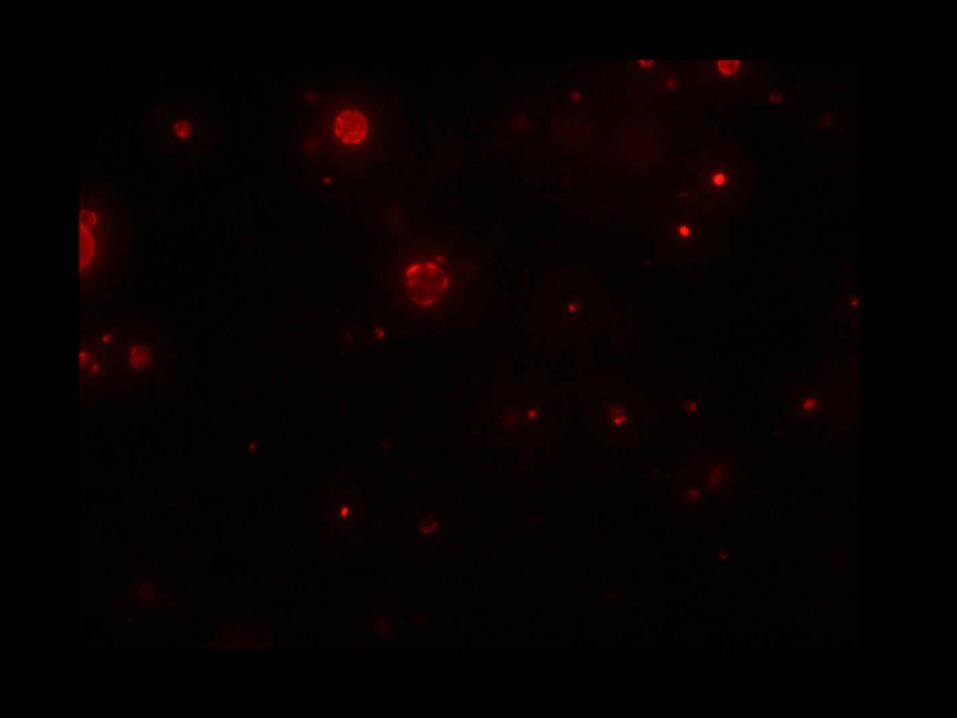
1hTR-DPPE NBD-DPPE
Fluorescence microscopy
α-hederin hederagenin
10 µM
budding
wrinkled
phase separation
spherical
Incubationtime
Effects
on GUV
< CMC(α-hederin)
1h
2h
48hComplete
transformation of GUV
DMPC/Chol
(3:1)
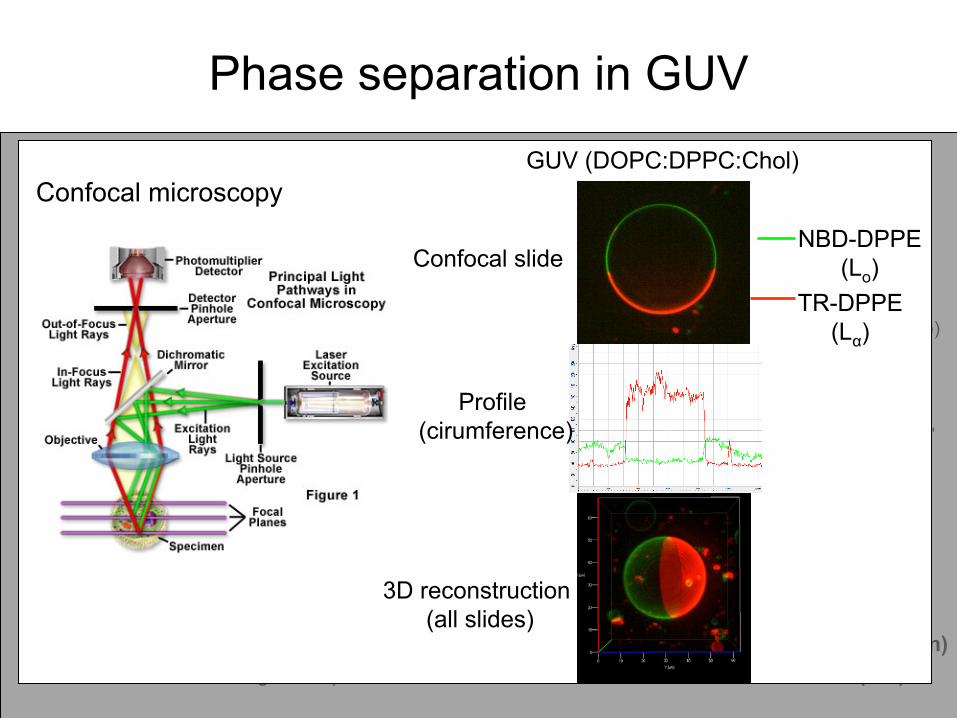
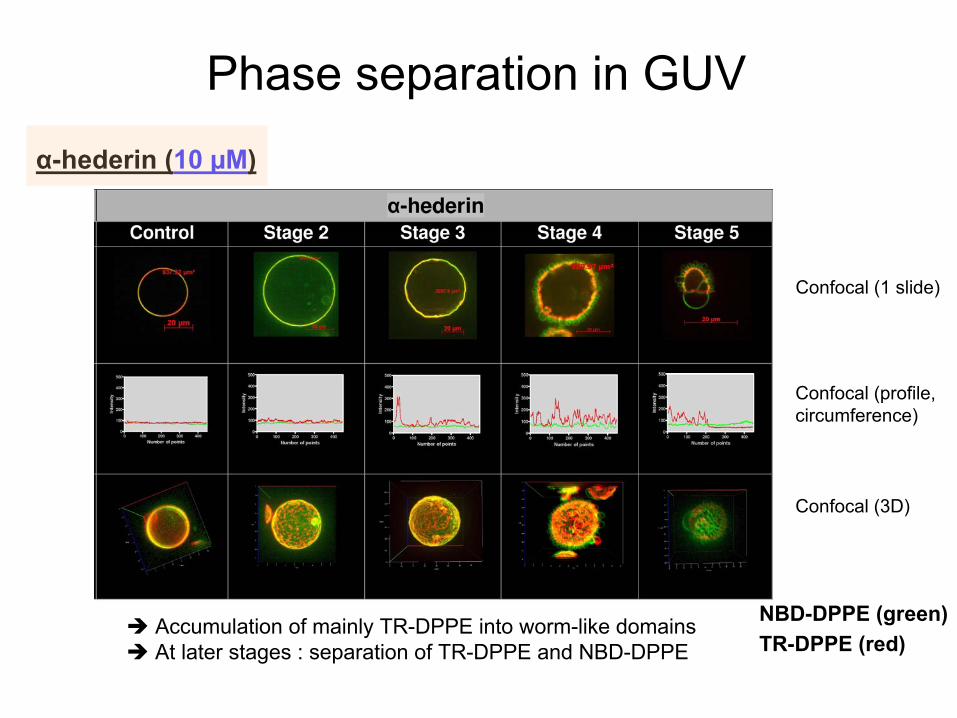
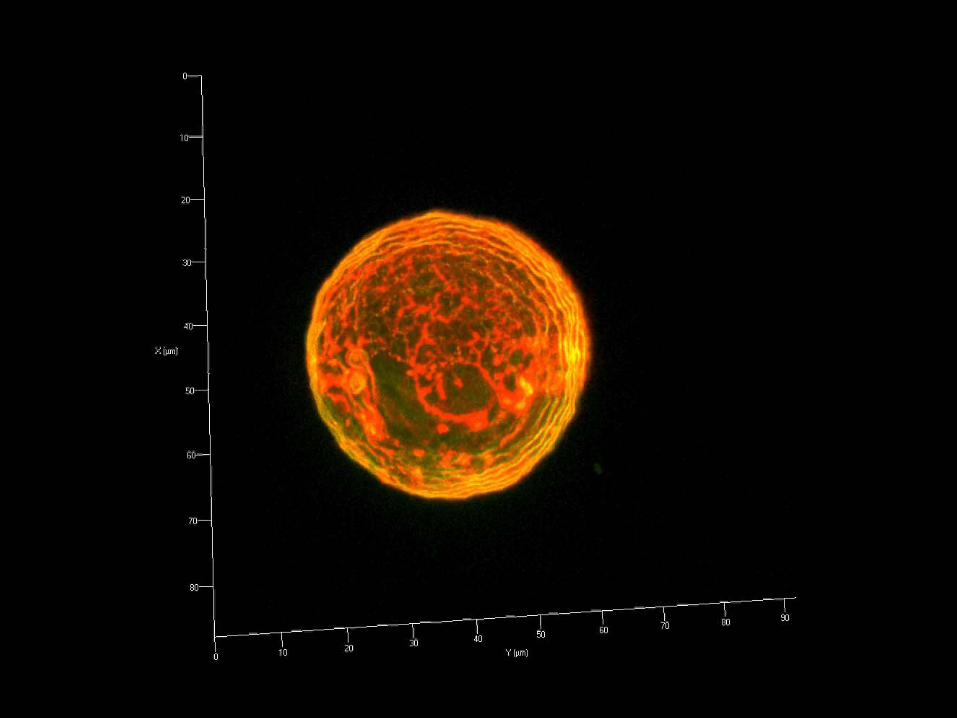
Phase separation
in GUV
NBD-DPPE (green)TR-DPPE (red)
Confocal
(1 slide)
Confocal
(profile, circumference)
Confocal
(3D)
α-hederin
(10 µM)
Accumulation of mainly
TR-DPPE into
worm-like
domains At
later
stages : separation
of TR-DPPE and NBD-DPPE
TR-DPPE(Lα
)
NBD-DPPE(Lo
)Confocal
slide
Profile (cirumference)
3D reconstruction (all slides)
Confocal
microscopyGUV (DOPC:DPPC:Chol)
Phase separation
in GUV
NBD-DPPE (green)TR-DPPE (red)
Confocal
(1 slide)
Confocal
(profile, circumference)
Confocal
(3D)
α-hederin
(10 µM)
Accumulation of mainly
TR-DPPE into
worm-like
domains At
later
stages : separation
of TR-DPPE and NBD-DPPE
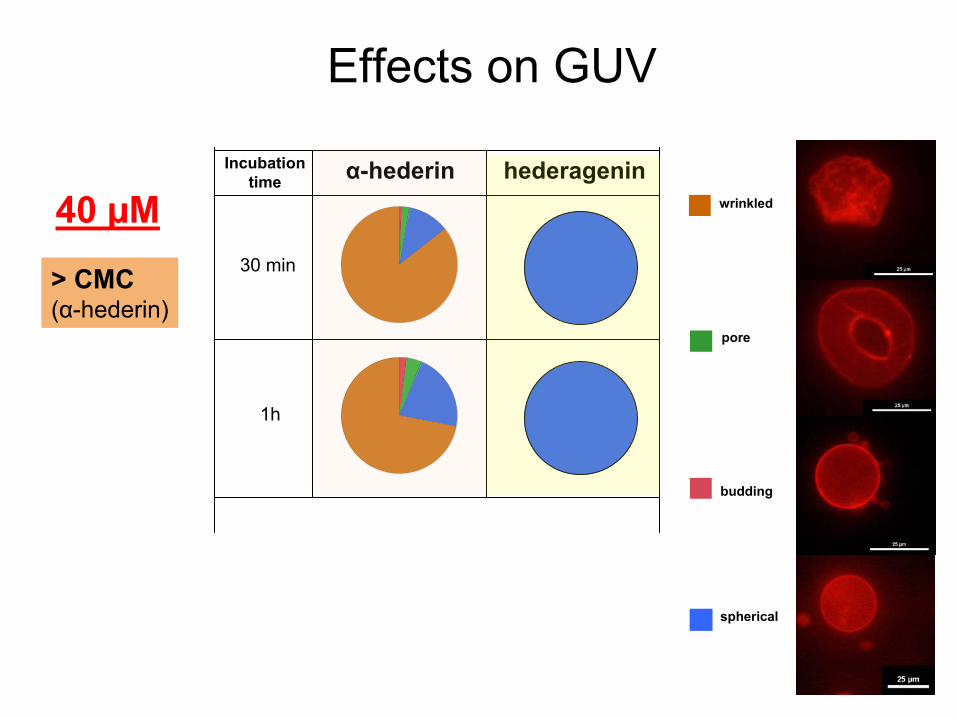
α-hederin hederagenin
40 µM30 min
1h
budding
wrinkled
pore
Incubationtime
> CMC(α-hederin)
spherical
Effects
on GUV
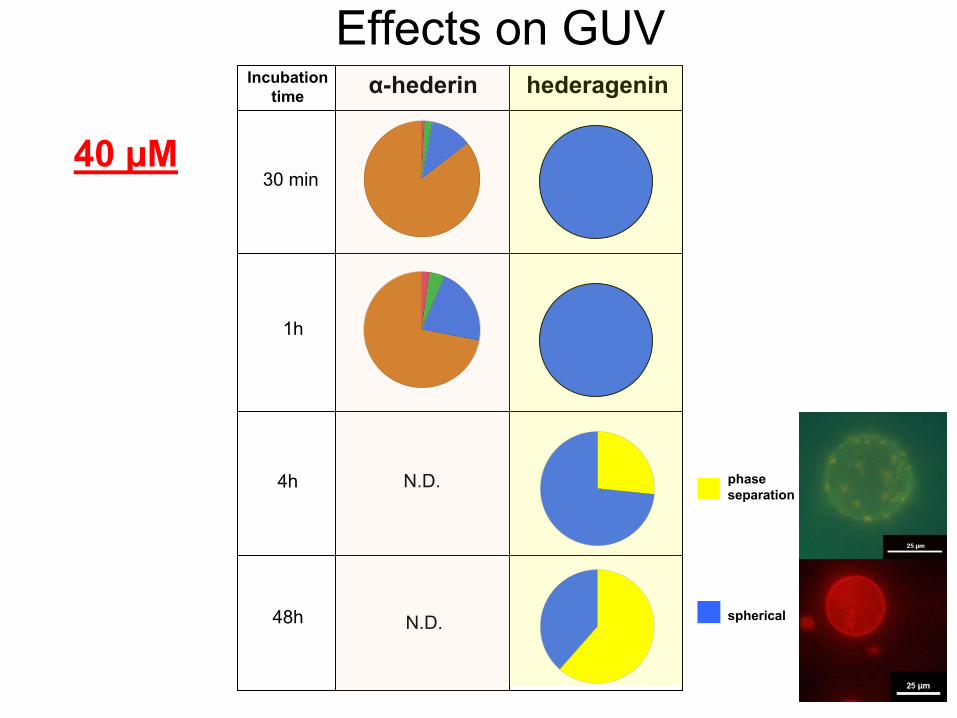
Effects
on GUVα-hederin hederagenin
40 µM30 min
1h
4h
48h
N.D.
N.D.
phase separation
spherical
Incubationtime
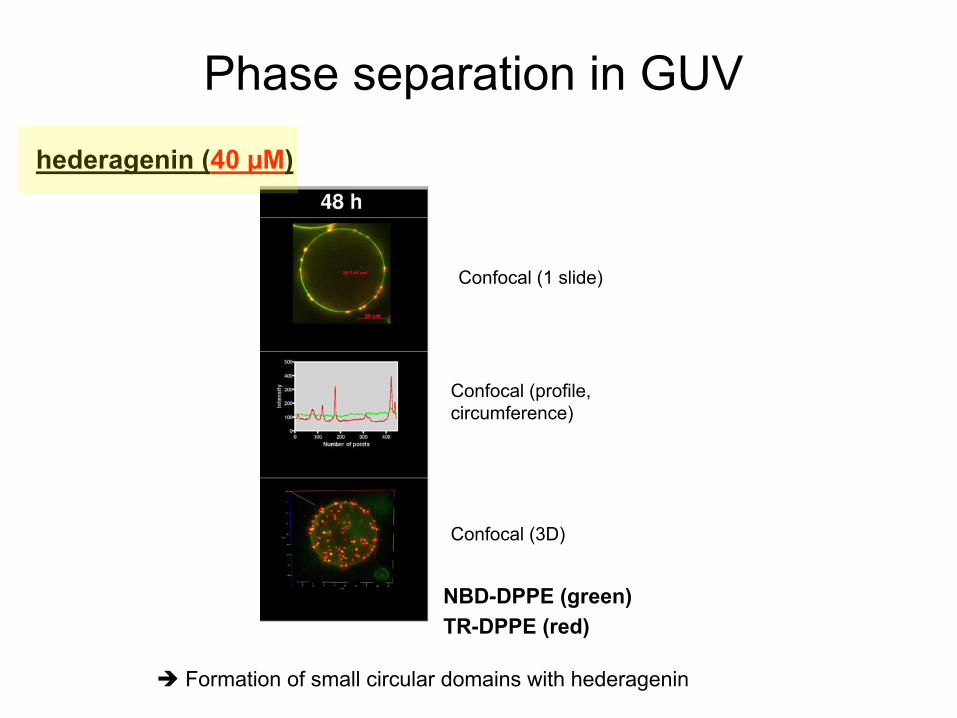
Phase separation
in GUV
NBD-DPPE (green)TR-DPPE (red)
Confocal
(1 slide)
Confocal
(profile, circumference)
Confocal
(3D)
Formation of small
circular
domains
with
hederagenin
hederagenin
(40 µM)
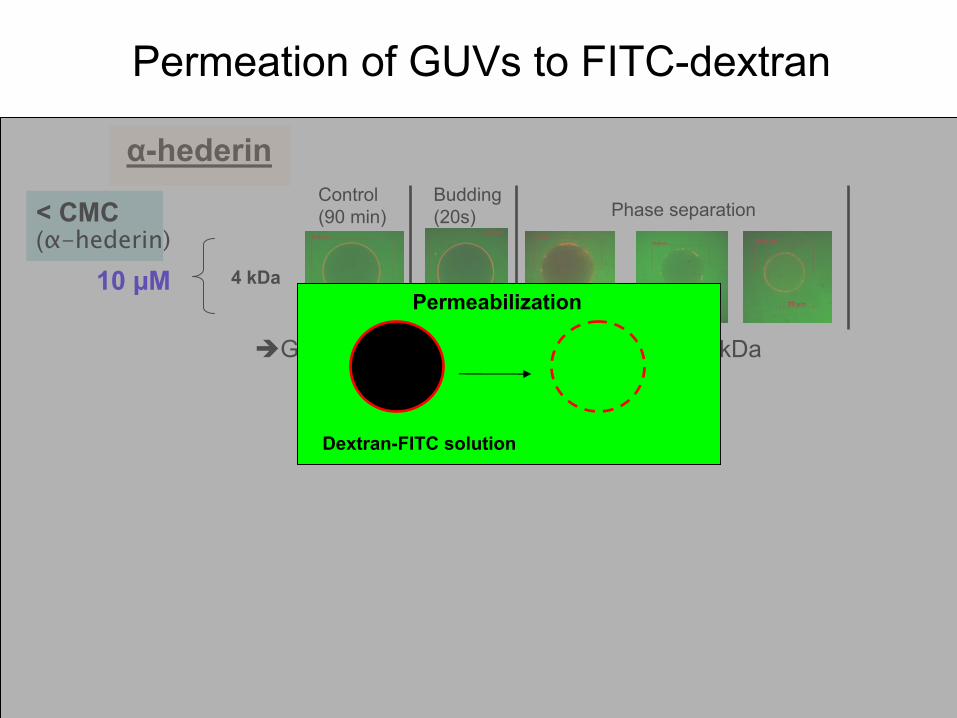
Permeation
of GUVs
to FITC-dextran
α-hederin
4 kDa10 µM
Budding(20s)
Gradual
permeation
to FITC-dextran
of 4 kDa
Phase separationControl (90 min)< CMC
(α-hederin)
Dextran-FITC solution
Permeabilization

Permeation
of GUVs
to FITC-dextran
α-hederin
4 kDa10 µM
Budding(20s)
Gradual
permeation
to FITC-dextran
of 4 kDa
Phase separation
(30, 60, 90 min)Control (90 min)< CMC
(α-hederin)

Permeation
of GUVs
to FITC-dextranα-hederin
Immediate
permeation
to FITC-dextran
of 4 kDa
4 kDa
4 kDa
40 µM
10 µM
Budding(20s)
Gradual
permeation
to FITC-dextran
of 4 kDa
Phase separation
No wrinkling(20s) Increasing
wrinkling
Control (90 min)
Control (90 min)> CMC
(α-hederin)
< CMC(α-hederin)
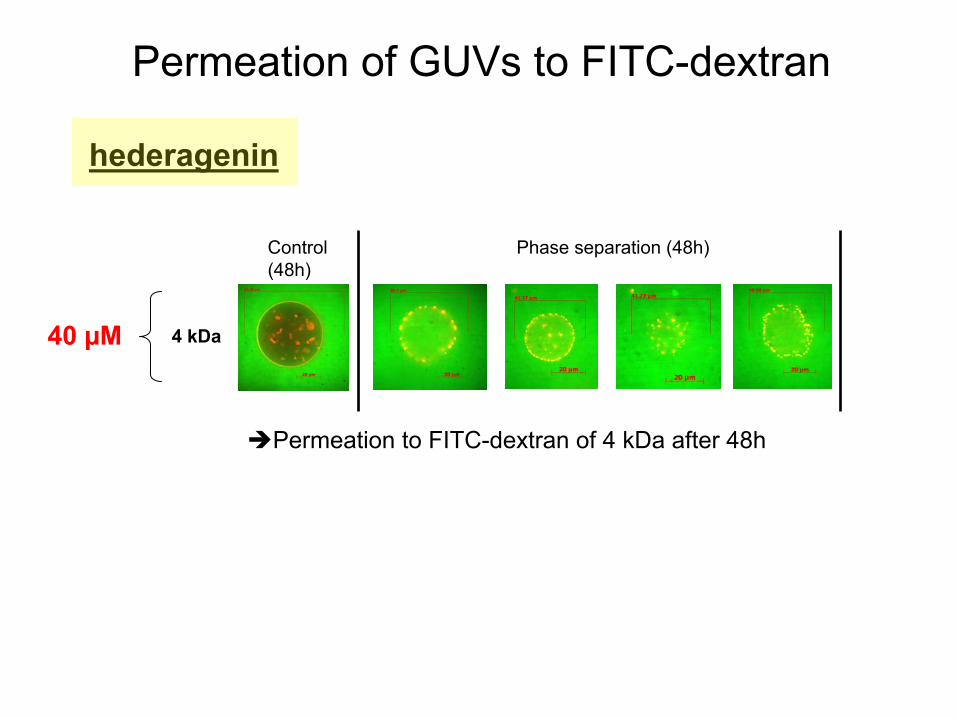
hederagenin
Permeation
of GUVs
to FITC-dextran
Control (48h)
4 kDa40 µM
Permeation
to FITC-dextran
of 4 kDa
after
48h
Phase separation
(48h)
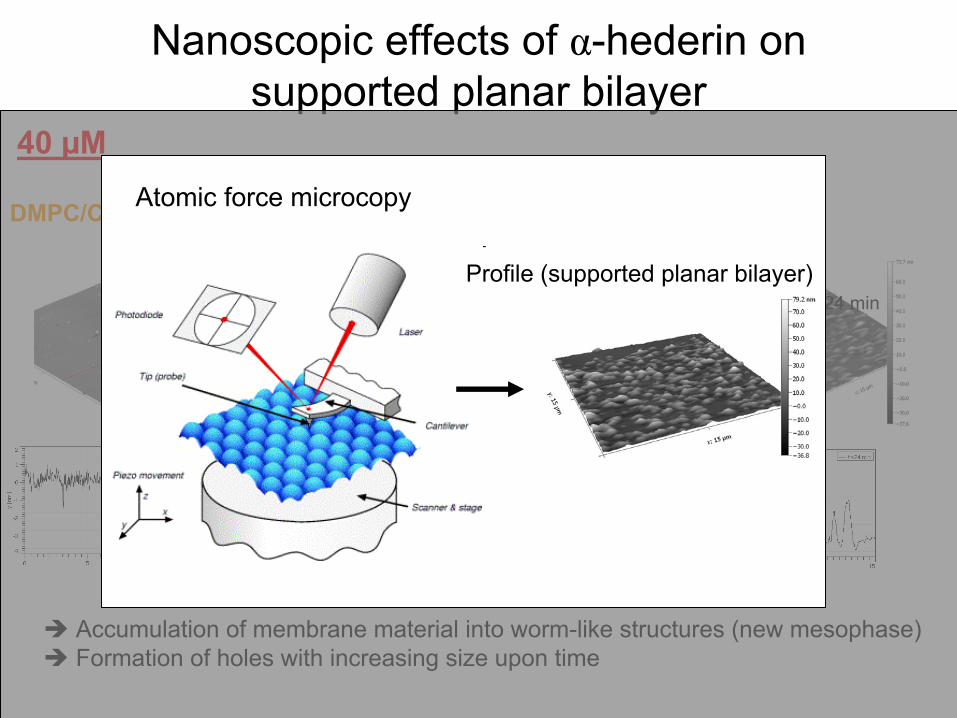
Nanoscopic
effects
of α-hederin
on supported
planar
bilayer
Accumulation of membrane material
into
worm-like
structures (new mesophase) Formation of holes
with
increasing
size upon
time
t = 0 t = 6 min t = 15 min t = 24 min
40 µM
DMPC/Chol
(3:1)α-hederinAtomic
force microcopy
Profile (supported
planar
bilayer)
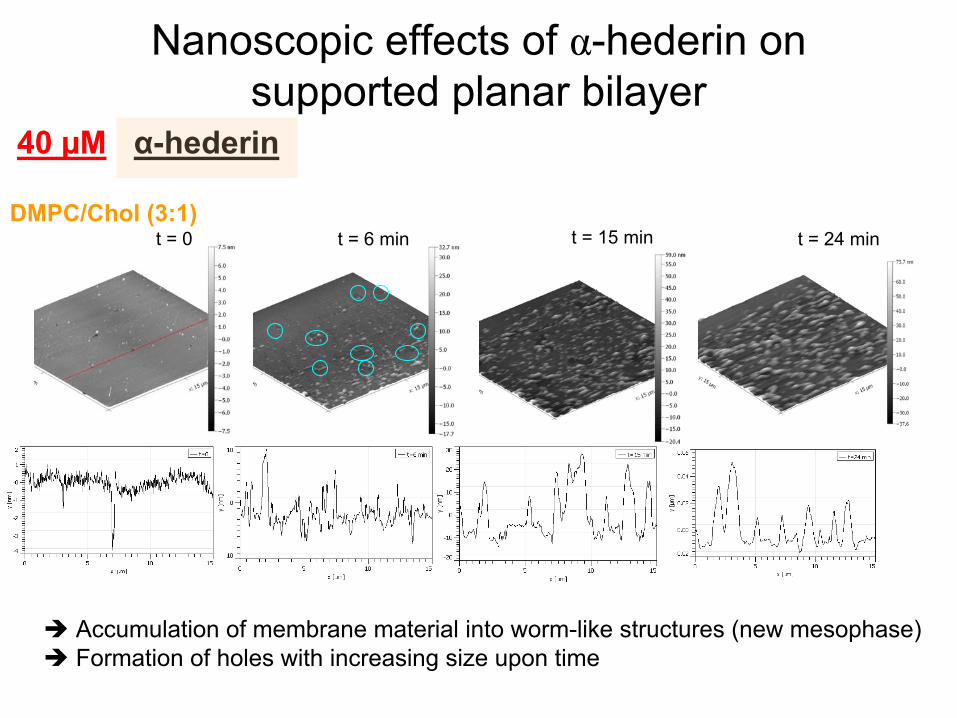
Nanoscopic
effects
of α-hederin
on supported
planar
bilayer
Accumulation of membrane material
into
worm-like
structures (new mesophase) Formation of holes
with
increasing
size upon
time
t = 0 t = 6 min t = 15 min t = 24 min
40 µM
DMPC/Chol
(3:1)
α-hederin

Conclusions : Membrane interactions of α-hederin
Internal
leaflet
External
leaflet
10 µM < CMC
Budding
Phase separation Transformation intoanother
mesophase
Positive curvature
Hydrophilic
sugar-sugar
interactions
Monomers
Pore formation ?
Transient
defects
?
DMPC
Cholesterol
immediate
later

Internal
leaflet
External
leaflet
40 µM
> CMC
toroidal
macroscopic
pore
immediate
permeabilization
without
transformationinto
new mesophase
(at
least at
short incubation periods)
Conclusions: Membrane interactions of α-hederin
Aggregates
and monomers
DMPC
Cholesterol
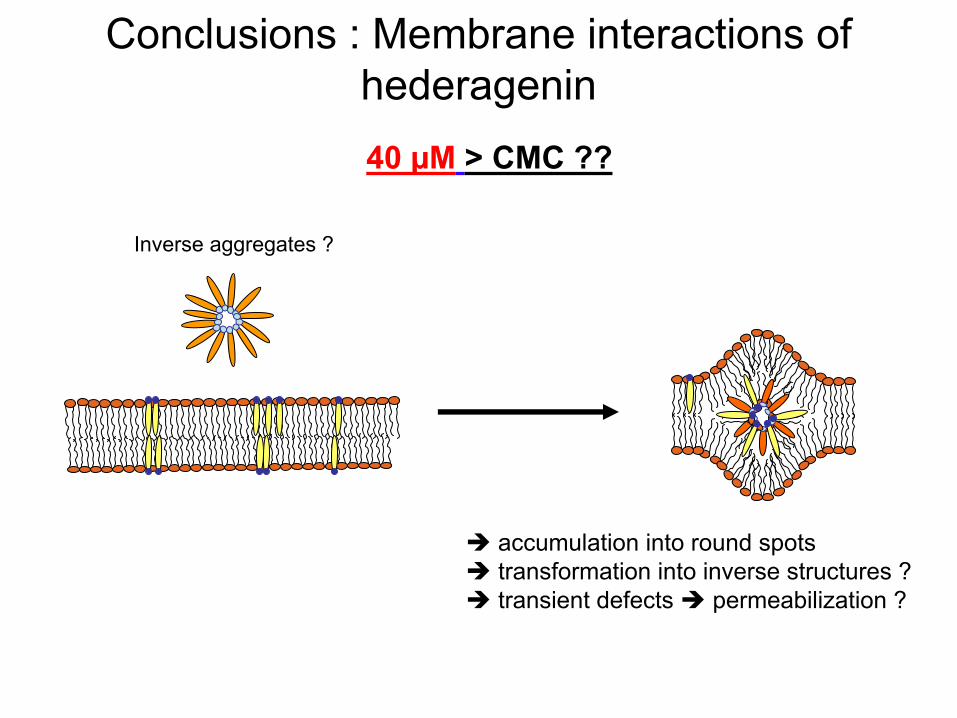
Conclusions : Membrane interactions of hederagenin40 µM
> CMC ??
accumulation into
round spots transformation into
inverse structures ? transient
defects
permeabilization
?
Inverse aggregates
?

Investigations on cellsα-hederin
and hederagenin
induce apoptosis and
non-apoptotic cell death in U937 and THP-1 cells in a cholesterol-dependent manner
Joseph Lorent1,2, Joelle Quetin-Leclercq2
and Marie-Paule
Mingeot-Leclercq1*
1Université
catholique
de Louvain, Louvain Drug Research Institute, Cellular and Molecular Pharmacology, UCL B1.73.05, avenue E. Mounier
73, B-1200 Bruxelles, Belgium.2Université
catholique de Louvain, Louvain Drug Research
Institute, Pharmacognosy, UCL B1.72.03, avenue E. Mounier 73, B-1200 Bruxelles, Belgium.
0 20 40 600
25
50
75
100C
time (h)
% c
ell d
eath
0
10
20
30
40A
% fr
agm
ente
d nu
clei
0 20 40 60
D
time (h)
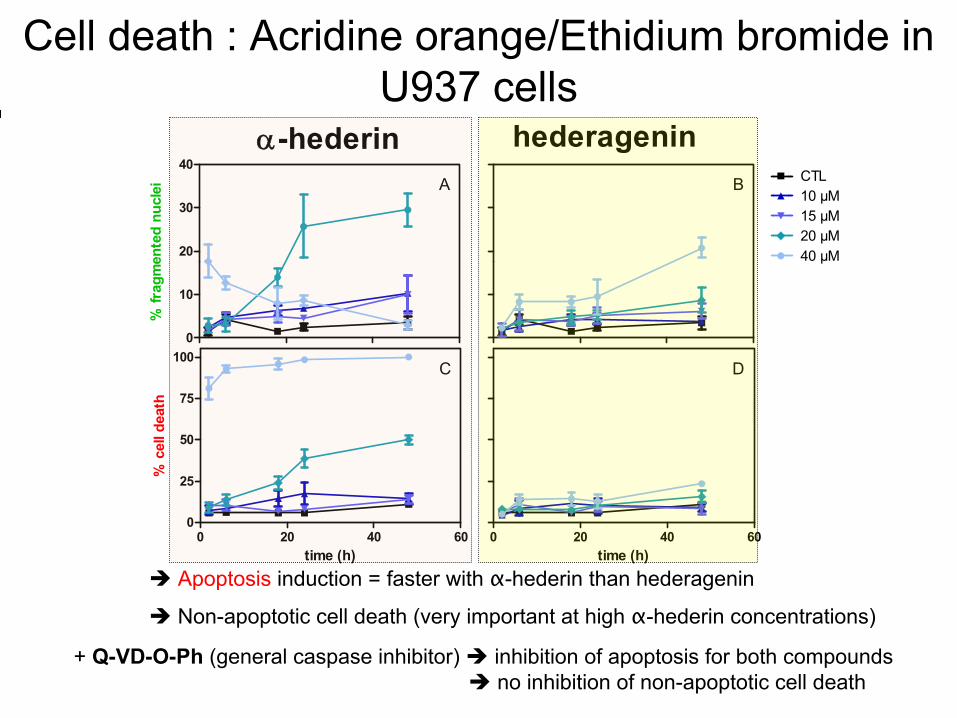
B CTL10 µM15 µM20 µM40 µM
-hederin hederagenin
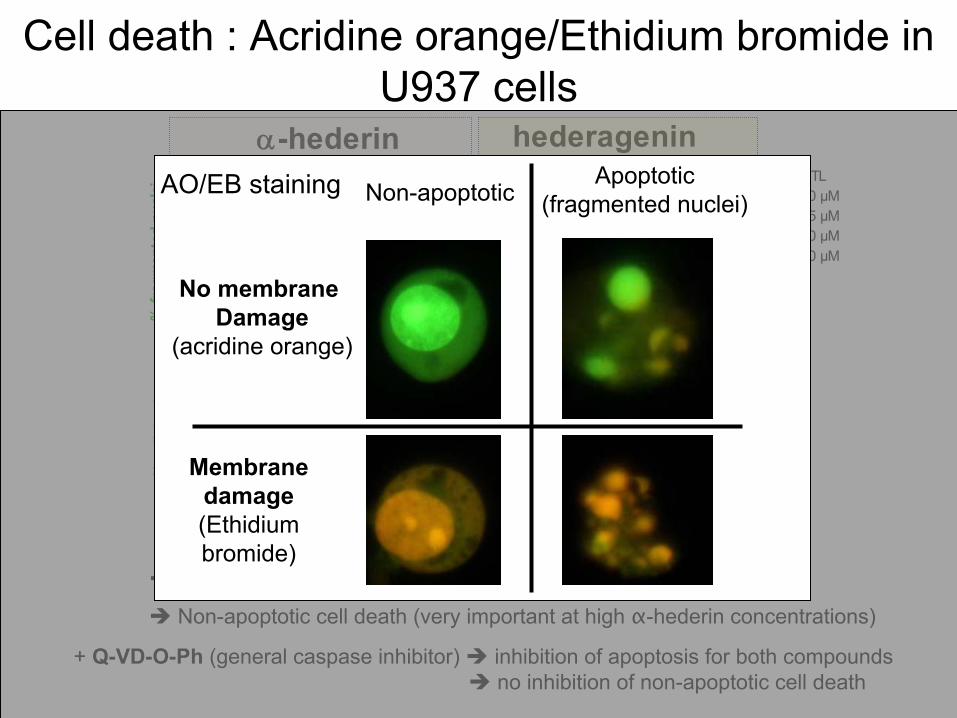
Cell
death
: Acridine orange/Ethidium
bromide
in U937 cells
Apoptosis
induction = faster
with
α-hederin
than
hederagenin
+ Q-VD-O-Ph
(general
caspase
inhibitor) inhibition of apoptosis
for both
compounds no inhibition of non-apoptotic
cell
death
Non-apoptotic
cell
death
(very
important at
high
α-hederin
concentrations)
Apoptotic(fragmented
nuclei)
Membrane
damage(Ethidium
bromide)
No membrane Damage
(acridine orange)
Non-apoptoticAO/EB staining
0 20 40 600
25
50
75
100C
time (h)
% c
ell d
eath
0
10
20
30
40A
% fr
agm
ente
d nu
clei
0 20 40 60
D
time (h)
B CTL10 µM15 µM20 µM40 µM
-hederin hederagenin
Cell
death
: Acridine orange/Ethidium
bromide
in U937 cells
Apoptosis
induction = faster
with
α-hederin
than
hederagenin
+ Q-VD-O-Ph
(general
caspase
inhibitor) inhibition of apoptosis
for both
compounds no inhibition of non-apoptotic
cell
death
Non-apoptotic
cell
death
(very
important at
high
α-hederin
concentrations)

0 5 7.5 10 12.5 15 17.5 200
10
20
30
***
***
% f
ragm
ente
d nu
clei
0.0 5.0 7.5 10.0 12.5 15.0 17.5 20.0
* *** ******
******
**
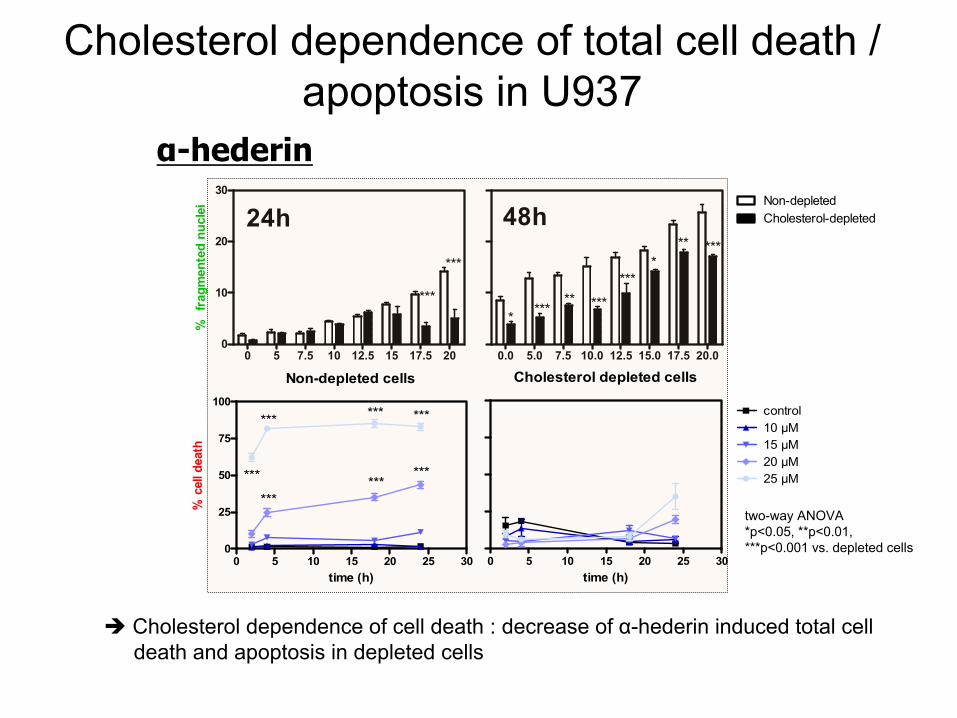
Non-depletedCholesterol-depleted24h 48h
Cholesterol
dependence
of total cell
death
/ apoptosis
in U937
Cholesterol
dependence
of cell
death
: decrease
of α-hederin
induced
total celldeath
and apoptosis
in depleted
cells
α-hederin
Non-depleted cells
0 5 10 15 20 25 300
25
50
75
100
******
******
*** *** ***
time (h)
% c
ell d
eath
Cholesterol depleted cells
0 5 10 15 20 25 30
control10 µM15 µM20 µM25 µM
time (h)
two-way
ANOVA*p<0.05, **p<0.01, ***p<0.001vs. depleted
cells
Trypan
blue
staining
(cell
death
assay)
Microscopedeath
cell
Fluorescent DNA intercalator
DAPI (apoptosis
assay)
apoptoticnormal
Cell
nuclei
(fluorescence microscopy)
accumulates
only
in death
cells
0 5 7.5 10 12.5 15 17.5 200
10
20
30
***
***
% f
ragm
ente
d nu
clei
0.0 5.0 7.5 10.0 12.5 15.0 17.5 20.0
* *** ******
******
**
Non-depletedCholesterol-depleted24h 48h
Cholesterol
dependence
of total cell
death
/ apoptosis
in U937
Cholesterol
dependence
of cell
death
: decrease
of α-hederin
induced
total celldeath
and apoptosis
in depleted
cells
α-hederin
Non-depleted cells
0 5 10 15 20 25 300
25
50
75
100
******
******
*** *** ***
time (h)
% c
ell d
eath
Cholesterol depleted cells
0 5 10 15 20 25 30
control10 µM15 µM20 µM25 µM
time (h)
two-way
ANOVA*p<0.05, **p<0.01, ***p<0.001 vs. depleted
cells

Conclusions : Potential
interactions
α-hédcholestérol
mitochondria
cyt
c
Caspase-3
apoptosisDR
MPT
cellnecrosis
Ca2+(*)
*Choi, J.H. et al. 2008**Swamy
and Huat
2003
Caspase-8(*)
membrane lysis
(*)
(*,**)
(*)
Effect of surfactin
on membrane models displaying lipid phase separation
Magali Deleu1°*, Joseph Lorent2°, Laurence Lins3, Robert Brasseur3, Nathalie Braun4, Karim El Kirat4, Tommy Nylander5, Yves F. Dufrêne4
and Marie-
Paule Mingeot-Leclercq2
1Université
de Liège Gembloux Agro-Bio Tech, Unité
de Chimie Biologique Industrielle, Passage des Déportés, 2, B-5030 Gembloux, Belgium
2Université
catholique de Louvain, Louvain Drug Research
Institute, Cellular and Molecular
Pharmacology, Avenue E. Mounier 73, B1.73.05, B-1200, Brussels, Belgium
3Université
de Liège Gembloux Agro-Bio Tech, Centre de Biophysique Moléculaire Numérique, Passage des Déportés, 2, B-5030 Gembloux, Belgium
4Université
catholique de Louvain, Institute of Condensed
Matter
and Nanosciences, Bio and Soft Matter, Croix du Sud 1, L7.04.01, B-1348 Louvain-la-
Neuve, Belgium
5Lund University, Center
for Chemistry and Chemical Engineering, Physical Chemistry, 1S-221 00 Lund, Sweden°Equal First author
BBA, Biomembranes, 2013, 1828, pp. 801-815
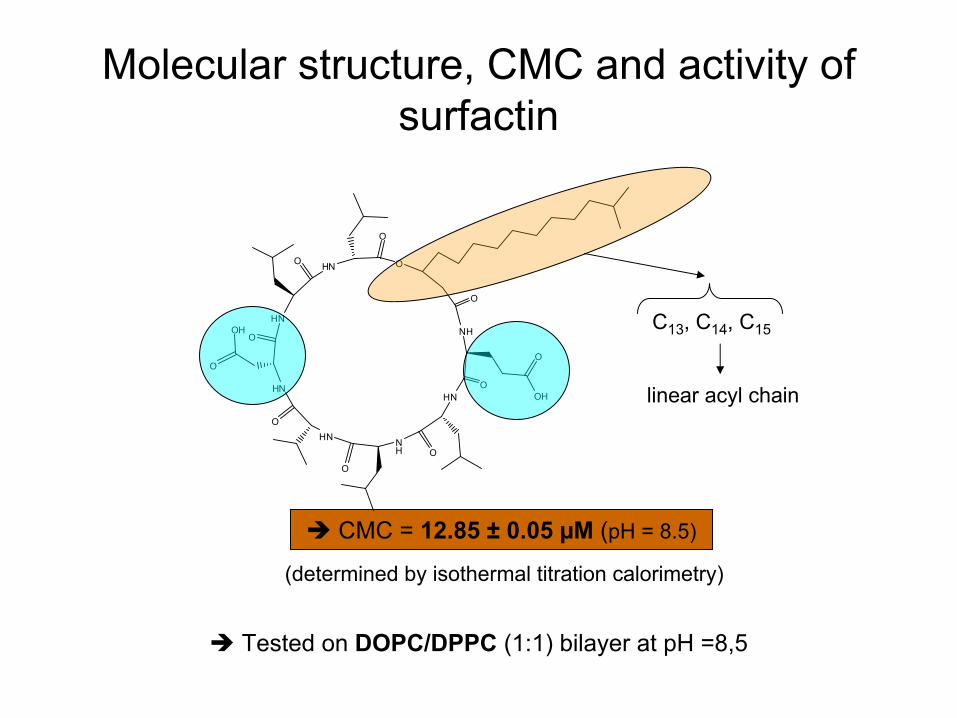
Molecular
structure, CMC and activity
of surfactin
CMC = 12.85 ±
0.05 µM
(pH = 8.5)
HN
HN
O
O
NH
HN
OOH
O
O
HN
HNO
O
NH
O
O
O
OH
O
(determined
by isothermal
titration
calorimetry)
C13
, C14
, C15
linear
acyl
chain
Tested
on DOPC/DPPC
(1:1) bilayer
at
pH =8,5

0 min 22 min 28 min
42 min 68 min
3µM
180 min
120 min
60 min20 min0 min
15µM
0 min 12 min 31 min 60 min 120 min
1mM
15 x 15 µm 20 x 20 µm
z-range10 nm
Integrity
of SPB : AFMSupported
planar
bilayer
: DOPC/DPPC (1:1) (25°C)
~ CMC
> CMC
< CMC
DPPC
DOPC
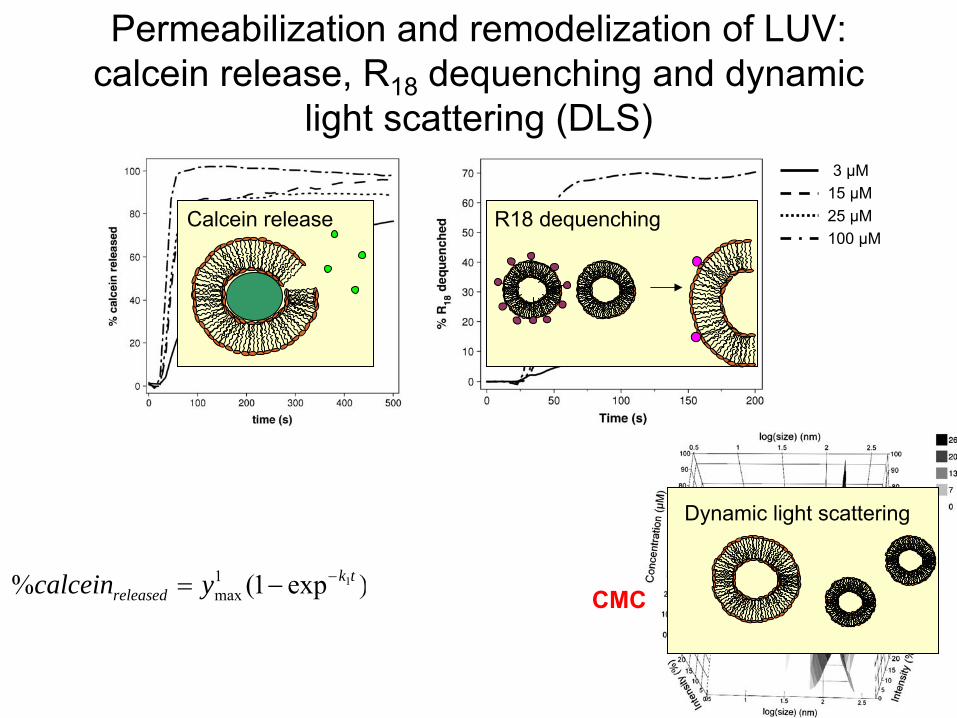
Permeabilization
and remodelization
of LUV: calcein
release, R18
dequenching
and dynamic light scattering
(DLS)
3 µM15 µM25 µM100 µM
)exp1()exp1(% 21 2max
1max
tktkreleased yycalcein CMC
Calcein
release R18 dequenching
Dynamic
light scattering
Permeabilization
and remodelization
of LUV: calcein
release, R18
dequenching
and dynamic light scattering
(DLS)
3 µM15 µM25 µM100 µM
)exp1()exp1(% 21 2max
1max
tktkreleased yycalcein
< CMC
CMC
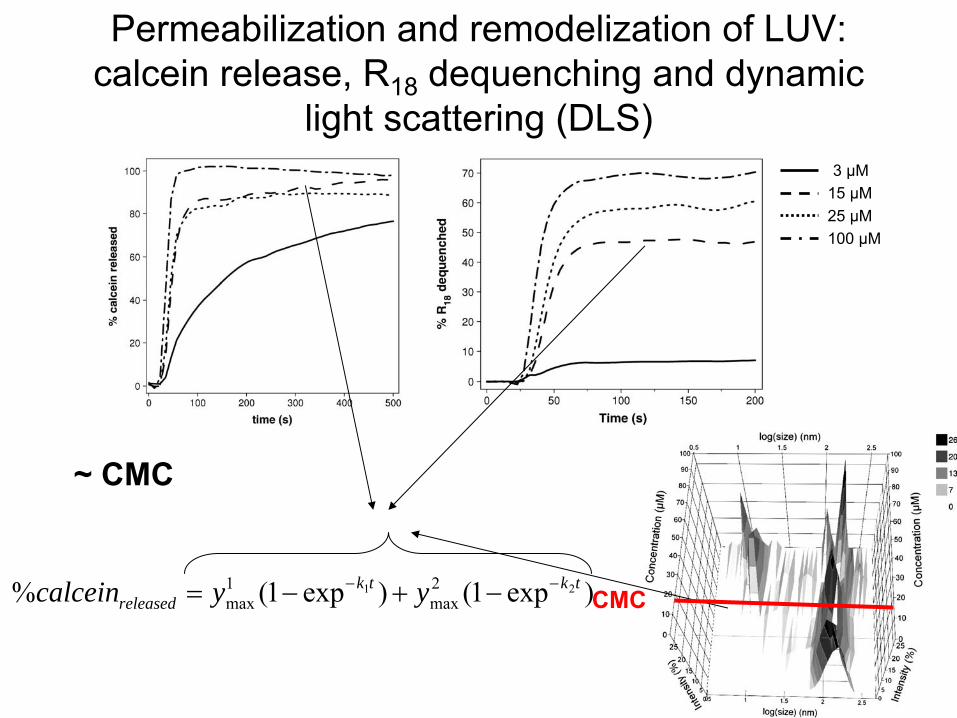
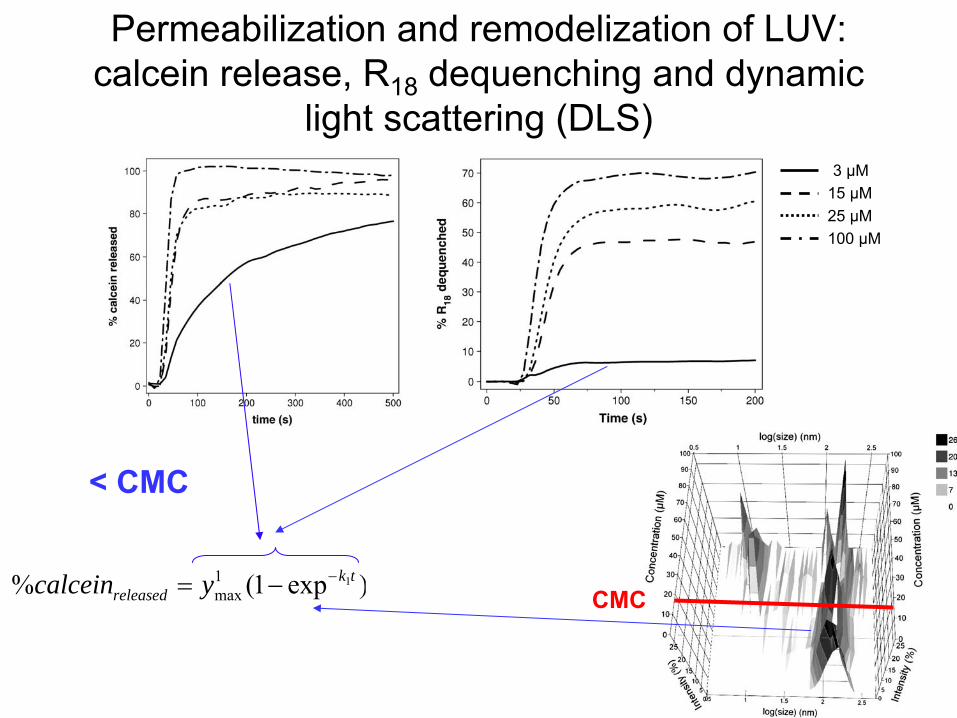
Permeabilization
and remodelization
of LUV: calcein
release, R18
dequenching
and dynamic light scattering
(DLS)
3 µM15 µM25 µM100 µM
)exp1()exp1(% 21 2max
1max
tktkreleased yycalcein
~ CMC
CMC
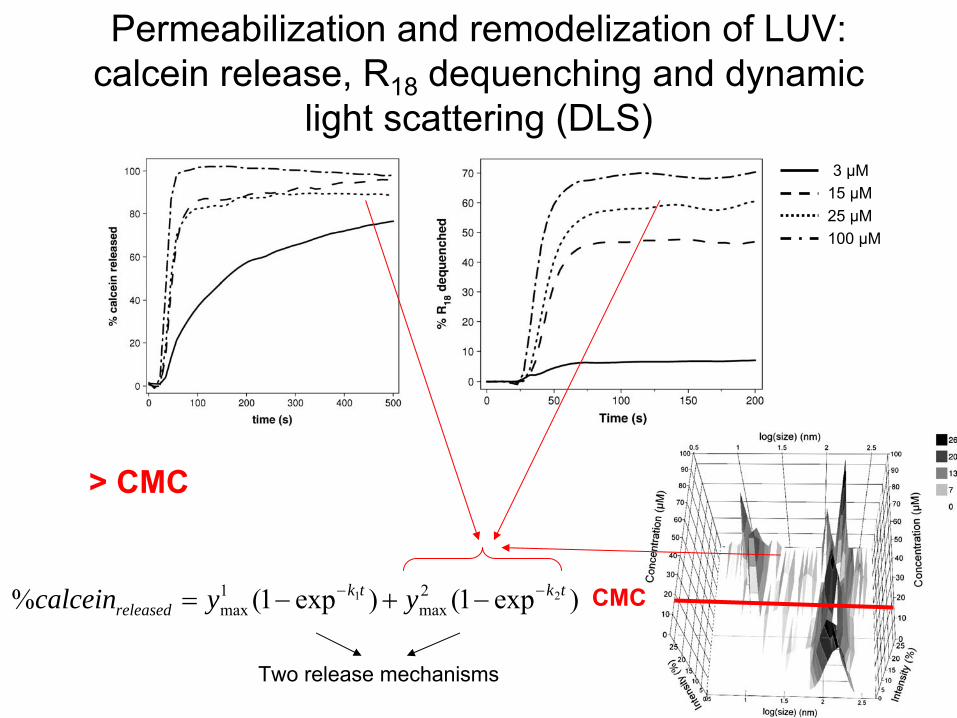
Permeabilization
and remodelization
of LUV: calcein
release, R18
dequenching
and dynamic light scattering
(DLS)
3 µM15 µM25 µM100 µM
)exp1()exp1(% 21 2max
1max
tktkreleased yycalcein
Two
release mechanisms
> CMC
CMC
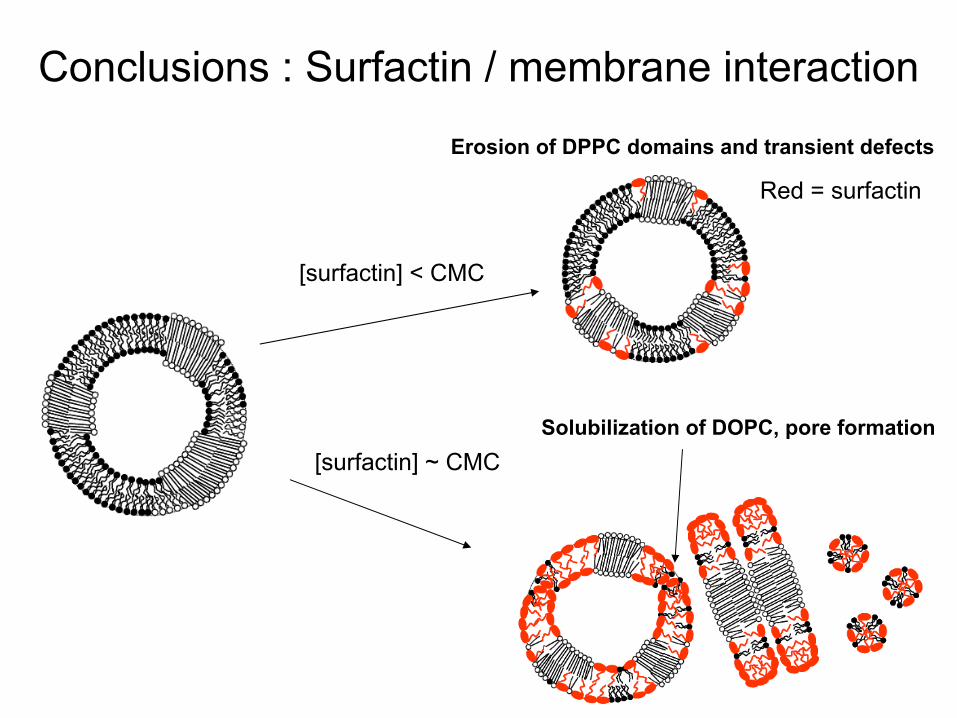
Conclusions : Surfactin
/ membrane interaction
[surfactin] < CMC
[surfactin] ~ CMCSolubilization
of DOPC, pore formation
Erosion of DPPC domains
and transient
defects
Red
= surfactin
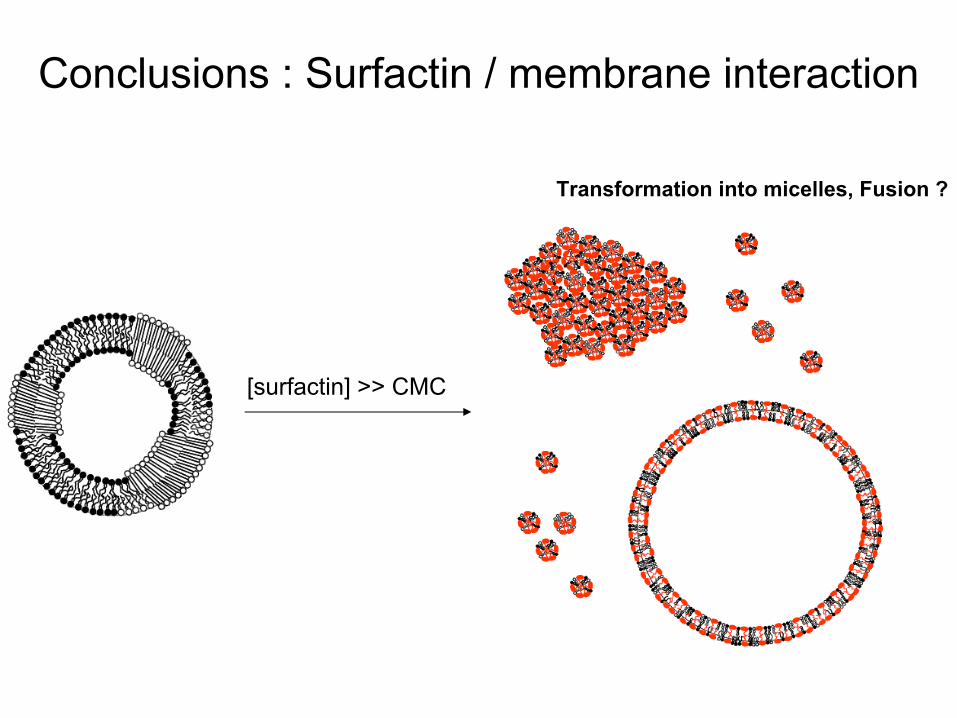
[surfactin] >> CMC
Transformation into
micelles, Fusion ?
Conclusions : Surfactin
/ membrane interaction
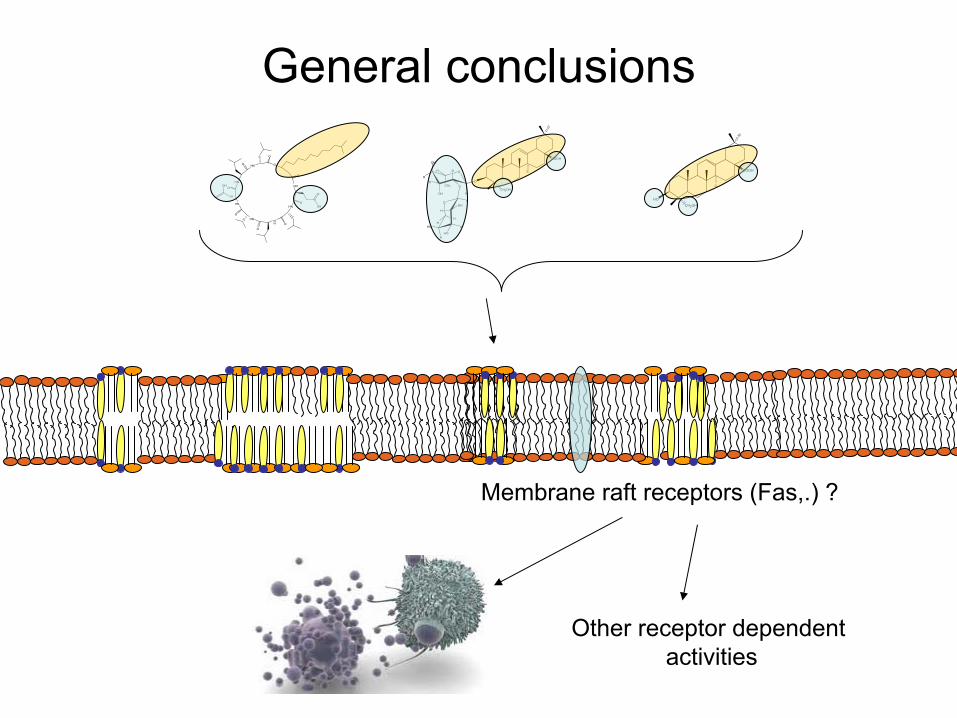
General conclusions
HN
HN
O
O
NH
HN
OOH
O
O
HN
HNO
O
NH
O
O
O
OH
OCH2OH
COOH
O
HO
H
H
HO
HOH
HH
O
OH
H
OH
H
H
H
OCH3
H
O
HCH2OH
COOH
HO
Membrane raft receptors
(Fas,.) ?
Other
receptor
dependentactivities

General conclusions
HN
HN
O
O
NH
HN
OOH
O
O
HN
HNO
O
NH
O
O
O
OH
OCH2OH
COOH
O
HO
H
H
HO
HOH
HH
O
OH
H
OH
H
H
H
OCH3
H
O
HCH2OH
COOH
HO

Perspectives
Short term-perspectives
Cell
staining
(McIntosh 2008, Garvik
2009)GUV : DOPC:DPPC:DHE (1:1:1)
Biphoton
microscopy
of DHE
Tof-SIMS
SPB (Lorent)Cells(Mazzucchelli
2008)
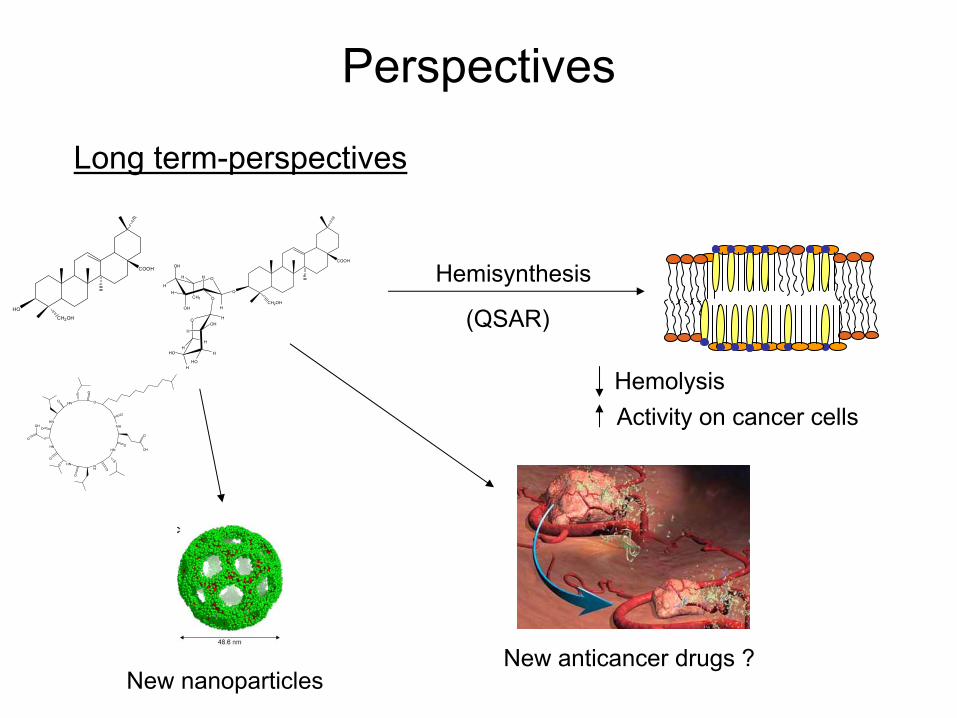
Perspectives
Long term-perspectives
CH2OH
COOH
O
HO
H
H
HO
HOH
HH
O
OH
H
OH
H
H
H
OCH3
H
O
H
Hemisynthesis
HemolysisActivity
on cancer cells
New anticancer
drugs
?
HN
HN
O
O
NH
HN
OOH
O
O
HN
HNO
O
NH
O
O
O
OH
O
CH2OH
COOH
HO (QSAR)
New nanoparticles