memorandum - mdta.maryland.govmdta.maryland.gov/.../i95_etl_tr_update_2015_final_2016_0208.pdfjune...
TRANSCRIPT
Memorandum 2705 Bee Cave Road, Suite 300 Austin, Texas 78746-5688 United States T +1.512.314.3100 F +1.512.314.3135 www.jacobs.com
Jacobs Engineering Group Inc. V1
Date February 8, 2016
To Dennis Simpson
From Phil Eshelman
Subject I-95 ETL T&R Update
Jacobs was retained to conduct an update to the traffic and toll revenue estimates for Interstate 95 Express Toll Lanes (ETLs) operated and maintained by the Maryland Transportation Authority (MDTA).
Jacobs conducted and developed the original forecast of traffic and toll revenue for the I-95 ETLs in 2013 in anticipation of the opening in late 2014. The original analysis is documented in the report titled “I-95 Express Toll Lanes Comprehensive Traffic and Toll Revenue Study” dated December 2013. The majority of the analysis was conducted in the spring of 2013 with finalization of the report at the end of the year.
Since opening in mid-December 2014, actual traffic and toll revenue results have outpaced forecasts. The cause of this is reviewed and how it is incorporated into the revised forecast is identified within this memorandum.
This memo is structured to review the existing conditions, specifically against the previous forecast, a brief review of changing economic conditions and revised estimates of traffic and toll revenue for the facility. Thus the sections are as follows:
1. Project Description
2. Data Collection, Summary and Actual vs. Forecast
3. Brief Economic Review; and
4. Revised Traffic and Toll Revenue Forecasts

Memorandum I-95 ETL T&R Update
V1 2
1. Project Description
The I-95 ETLs are two lanes in each direction running parallel to the I-95 general purpose lanes for approximately 7.5 miles north of Baltimore from north of White Marsh Boulevard (MD 43) to the split of I-95/I-895 about 4 miles north of the Baltimore Harbor. Figure 1-1 and Figure 1-2 provide the project location and the details as to access to the ETLs from the GP lanes, respectively.
Figure 1-1: I-95 ETL Project Location Map

Memorandum I-95 ETL T&R Update
V1 3
Figure 1-2: I-95 ETL Stick Diagram
The facility offers faster travel speeds as compared to the general purpose lanes during congested times of the day. Key to the forecast of traffic and toll revenue on these ETLs is the determination of the levels of congestion on the GP lanes into the future and the propensity for motorists to pay a toll to avoid such congestion.

Memorandum I-95 ETL T&R Update
V1 4
The toll schedule for the I-95 ETLs is by time of day, specific by direction and day of the week. The toll rates were lowered in FY16. The passenger car toll rates and time period for the toll rates are shown in the following tables.
Table 1-1: I-95 ETL Passenger Car Toll Rates
Table 1-2: I-95 ETL Toll Schedule Time Periods
Time Period FY 15 Rates FY16 RatesPeak $1.75 $1.54Off-Peak $1.40 $1.19Night $0.70 $0.49

Memorandum I-95 ETL T&R Update
V1 5
2. Data Collection/Summary and Actual vs. Forecast
As was stated in the introduction, actual traffic and toll revenue has exceeded forecast. For FY2015, which was from opening of the roadway on December 14, 2014 until the end of the fiscal year on June 30, 2015, actual traffic and toll revenue were approximately twice the forecasts. The original forecast estimated 1.8M transaction producing $3.1M in toll revenue. Actual traffic and revenue was approximately 3.9 transactions producing $6.1M in toll revenue. In this section the details of this over performance are analyzed and determination of inclusion in on-going forecasts is discussed.
First the data that was collected for this analysis is presented and then the results of analysis are reviewed.
2.1 Data Collected
For this analysis the following data were collected from the MDTA:
1. Traffic Data
a. Hourly ETL traffic by payment type
b. Every transaction by payment type and zip code
c. SHA traffic counts
d. Speed data from INRIX on the GP lanes and MDTA readers on the ETLs and GP lanes separately
2. Revenue Data
a. Monthly E-ZPass toll revenue by vehicle class
b. Monthly paid video revenue
3. Other data
a. Signage schematic
b. CHARTS incident data in the corridor
In addition to the data collected above specifically for this analysis, our databases and experience with existing managed lane systems and usage were used as is typical on these projects.
2.2 Actual Traffic versus Forecast by Time Period
The first step of the analysis is to compare the actual results on the ETL for the last 6.5 months of FY15 (December 14, 2014 to June 2015) and the first 3.5 months of FY16 (July 1, 2015 to October 14, 2015) to the forecast. The following graphs and tables show the actual to forecast by direction, day of the week and hour. The table provides detail for peak, off-peak and night time traffic by direction and month. The

Memorandum I-95 ETL T&R Update
V1 6
table is followed by graphs showing how the forecast in the different time periods fared. This is first provided for an average weekday, then for the weekend.
The overwhelming takeaway is that forecast is closest to actual during weekday peak. The table shows that actual traffic is 4.3 percent above forecast during the peak period for both directions. Outside of the peak period, actual traffic is much higher than forecast. With travel time savings largely in the peak period, it is difficult to ascertain the reasons for the high usage of the ETLs during off-peak and night. Subsequent analysis provided in this document attempts to reveal various reasons for this and evaluate the need to incorporate into on-going forecasts.
Figure 2-1: ETL SB Traffic, Actual vs. Forecast – FY15
Figure 2-2: ETL NB Traffic, Actual vs. Forecast – FY15
I-95 Express Toll LanesSouthbound Traffic, Actual vs. Forecast 12-14-2014 to 06-30-2015
0
200
400
600
800
1,000
1,200
1,400
1,600Monday
MondayForecast
0
200
400
600
800
1,000
1,200
1,400
1,600Tuesday
Tuesday Forecast
0
200
400
600
800
1,000
1,200
1,400
1,600Wednesday
Wednesday Forecast
0
200
400
600
800
1,000
1,200
1,400
1,600Thursday
Thursday Forecast
0
200
400
600
800
1,000
1,200
1,400
1,600Friday
Friday Forecast
0
200
400
600
800
1,000
1,200
1,400
1,600Saturday
Saturday Forecast
0
200
400
600
800
1,000
1,200
1,400
1,600Sunday
Sunday Forecast
0
1,000
2,000
3,000
4,000
5,000
6,000
7,000Total
Weekly Forecast
Northbound Traffic, Actual vs. Forecast 12-14-2014 to 06-30-2015
0
200
400
600
800
1,000
1,200
1,400
1,600Monday
Monday Forecast
0
200
400
600
800
1,000
1,200
1,400
1,600Tuesday
Tuesday Forecast
0
200
400
600
800
1,000
1,200
1,400
1,600Wednesday
Wednesday Forecast
0
200
400
600
800
1,000
1,200
1,400Thursday
Thursday Forecast
0
200
400
600
800
1,000
1,200
1,400
1,600Friday
Friday Forecast
0
200
400
600
800
1,000
1,200
1,400
1,600Saturday
Saturday Forecast
0
200
400
600
800
1,000
1,200
1,400
1,600Sunday
Sunday Forecast
0
1,000
2,000
3,000
4,000
5,000
6,000
7,000
8,000
9,000Total
Weekly Forecast

Memorandum I-95 ETL T&R Update
V1 7
Figure 2-3: ETL Weekly Traffic, Actual vs. Forecast – FY15 (Both Directions)
Figure 2-4: ETL SB Traffic, Actual vs. Forecast – FY16
Figure 2-5: ETL NB Traffic, Actual vs. Forecast – FY16
I-95 Express Toll LanesSouthbound Traffic, Actual vs. Forecast 07-01-2015 to 10-14-2015
0
200
400
600
800
1,000
1,200
1,400
1,600
1,800
2,000Monday
MondayForecast
0
200
400
600
800
1,000
1,200
1,400
1,600
1,800
2,000Tuesday
Tuesday Forecast
0
200
400
600
800
1,000
1,200
1,400
1,600
1,800
2,000Wednesday
Wednesday Forecast
0
200
400
600
800
1,000
1,200
1,400
1,600
1,800
2,000Thursday
Thursday Forecast
0
200
400
600
800
1,000
1,200
1,400
1,600Friday
Friday Forecast
0
200
400
600
800
1,000
1,200
1,400
1,600Saturday
Saturday Forecast
0
200
400
600
800
1,000
1,200
1,400
1,600Sunday
Sunday Forecast
0
1,000
2,000
3,000
4,000
5,000
6,000
7,000
8,000
9,000Total
Weekly Forecast
Northbound Traffic, Actual vs. Forecast 07-01-2015 to 10-14-2015
0
200
400
600
800
1,000
1,200
1,400
1,600
1,800
2,000Monday
Monday Forecast
0
200
400
600
800
1,000
1,200
1,400
1,600
1,800
2,000Tuesday
Tuesday Forecast
0
200
400
600
800
1,000
1,200
1,400
1,600
1,800
2,000Wednesday
Wednesday Forecast
0
200
400
600
800
1,000
1,200
1,400
1,600
1,800
2,000Thursday
Thursday Forecast
0
200
400
600
800
1,000
1,200
1,400
1,600
1,800
2,000Friday
Friday Forecast
0
200
400
600
800
1,000
1,200
1,400
1,600Saturday
Saturday Forecast
0
200
400
600
800
1,000
1,200
1,400
1,600Sunday
Sunday Forecast
0
2,000
4,000
6,000
8,000
10,000
12,000Total
Weekly Forecast

Memorandum I-95 ETL T&R Update
V1 8
Figure 2-6: ETL Weekly Traffic, Actual vs. Forecast – FY16 (Both Directions)
Table 2-1: ETL Weekday Traffic, Actual vs. Forecast by Time Period
Absolute Percent Absolute Percent Absolute Percent Absolute PercentJan 9,796 14,318 4,522 46.2% 6,551 4,881 -1,670 -25.5% 2,930 8,539 5,609 191.4% 315 898 583 184.9%Feb 9,796 15,814 6,017 61.4% 6,551 5,625 -926 -14.1% 2,930 9,082 6,152 209.9% 315 1,107 792 251.2%Mar 9,796 17,535 7,739 79.0% 6,551 6,620 69 1.1% 2,930 9,609 6,679 227.9% 315 1,306 990 314.2%Apr 9,796 23,025 13,228 135.0% 6,551 7,838 1,287 19.6% 2,930 13,337 10,406 355.1% 315 1,851 1,535 487.1%May 9,796 23,889 14,093 143.9% 6,551 7,640 1,089 16.6% 2,930 14,212 11,282 385.0% 315 2,037 1,722 546.1%Jun 9,796 23,547 13,751 140.4% 6,551 7,784 1,233 18.8% 2,930 13,873 10,943 373.5% 315 1,890 1,575 499.6%Jul 12,021 25,914 13,893 115.6% 8,104 8,010 -94 -1.2% 3,541 15,424 11,883 335.6% 376 2,480 2,104 559.4%Aug 12,021 26,296 14,276 118.8% 8,104 8,562 458 5.7% 3,541 15,405 11,864 335.1% 376 2,330 1,953 519.5%Sep 12,021 22,058 10,038 83.5% 8,104 8,334 230 2.8% 3,541 11,977 8,436 238.2% 376 1,747 1,371 364.6%Oct 12,021 24,502 12,481 103.8% 8,104 9,502 1,398 17.3% 3,541 13,100 9,559 269.9% 376 1,901 1,524 405.4%Average 10,686 21,690 11,004 103.0% 7,172 7,480 308 4.3% 3,175 12,456 9,281 292.4% 340 1,755 1,415 416.7%
Jan 4,247 8,437 4,190 98.7% 2,616 2,407 -209 -8.0% 1,480 5,500 4,020 271.7% 152 530 378 249.7%Feb 4,247 8,720 4,473 105.3% 2,616 2,508 -108 -4.1% 1,480 5,523 4,043 273.2% 152 689 538 354.9%Mar 4,247 9,710 5,463 128.6% 2,616 2,956 340 13.0% 1,480 5,961 4,481 302.9% 152 794 642 423.8%Apr 4,247 12,799 8,552 201.4% 2,616 3,427 811 31.0% 1,480 8,181 6,701 452.9% 152 1,191 1,040 686.3%May 4,247 12,626 8,379 197.3% 2,616 3,345 729 27.9% 1,480 8,093 6,613 447.0% 152 1,188 1,037 684.2%Jun 4,247 11,966 7,719 181.8% 2,616 3,380 764 29.2% 1,480 7,607 6,128 414.1% 152 979 827 546.1%Jul 5,143 13,888 8,744 170.0% 3,182 3,320 138 4.4% 1,782 9,120 7,338 411.9% 180 1,448 1,268 702.8%Aug 5,143 14,143 9,000 175.0% 3,182 3,504 322 10.1% 1,782 9,235 7,453 418.4% 180 1,405 1,225 679.2%Sep 5,143 11,671 6,527 126.9% 3,182 3,529 347 10.9% 1,782 7,128 5,347 300.1% 180 1,014 833 462.0%Oct 5,143 12,869 7,726 150.2% 3,182 3,989 808 25.4% 1,782 7,714 5,933 333.0% 180 1,166 985 546.2%Average 4,606 11,683 7,077 153.7% 2,842 3,237 394 13.9% 1,600 7,406 5,806 362.8% 163 1,040 877 538.1%
Jan 5,549 5,881 332 6.0% 3,935 2,474 -1,461 -37.1% 1,451 3,039 1,588 109.5% 164 368 204 124.9%Feb 5,549 7,094 1,544 27.8% 3,935 3,116 -819 -20.8% 1,451 3,559 2,109 145.4% 164 418 254 155.3%Mar 5,549 7,825 2,275 41.0% 3,935 3,664 -271 -6.9% 1,451 3,648 2,198 151.5% 164 512 348 212.7%Apr 5,549 10,225 4,676 84.3% 3,935 4,411 476 12.1% 1,451 5,156 3,705 255.4% 164 659 496 302.7%May 5,549 11,263 5,714 103.0% 3,935 4,295 360 9.1% 1,451 6,120 4,669 321.8% 164 849 685 418.3%Jun 5,549 11,581 6,031 108.7% 3,935 4,404 468 11.9% 1,451 6,266 4,816 332.0% 164 911 747 456.5%Jul 6,877 12,026 5,149 74.9% 4,922 4,690 -232 -4.7% 1,759 6,304 4,545 258.3% 196 1,032 836 427.3%Aug 6,877 12,153 5,276 76.7% 4,922 5,058 136 2.8% 1,759 6,170 4,411 250.7% 196 924 729 372.3%Sep 6,877 10,388 3,510 51.0% 4,922 4,805 -117 -2.4% 1,759 4,849 3,089 175.6% 196 734 538 274.9%Oct 6,877 11,633 4,756 69.2% 4,922 5,513 591 12.0% 1,759 5,385 3,626 206.1% 196 735 539 275.6%Average 6,081 10,007 3,926 64.6% 4,330 4,243 -87 -2.0% 1,574 5,050 3,476 220.8% 177 714 538 304.6%
Southbound
Northbound
I-95 ETL T&R 2015
Month
Night
Forecast ActualDifference
Average Weekday TrafficPeak
ForecastDifference
Off-Peak
Forecast ActualDifferenceDifference
Forecast Actual
Total
Actual

Memorandum I-95 ETL T&R Update
V1 9
Figure 2-7: ETL Weekday Traffic, Actual vs. Forecast, Total and Peak Period Traffic
(Forecast is represented by dotted line)
Nor
thbo
und
Tota
l
Total Peak
Sout
hbou
nd
0
5,000
10,000
15,000
20,000
25,000
30,000
Jan Feb Mar Apr May Jun Jul Aug Sep Oct
0
2,000
4,000
6,000
8,000
10,000
12,000
14,000
16,000
Jan Feb Mar Apr May Jun Jul Aug Sep Oct
0
2,000
4,000
6,000
8,000
10,000
12,000
14,000
Jan Feb Mar Apr May Jun Jul Aug Sep Oct
0
1,000
2,000
3,000
4,000
5,000
6,000
7,000
8,000
9,000
10,000
Jan Feb Mar Apr May Jun Jul Aug Sep Oct
0
500
1,000
1,500
2,000
2,500
3,000
3,500
4,000
4,500
Jan Feb Mar Apr May Jun Jul Aug Sep Oct
0
1,000
2,000
3,000
4,000
5,000
6,000
Jan Feb Mar Apr May Jun Jul Aug Sep Oct

Memorandum I-95 ETL T&R Update
V1 10
Figure 2-8: ETL Weekday Traffic, Actual vs. Forecast, Off-Peak and Night Period Traffic
(Forecast is represented by dotted line)
Off-Peak Night
Tota
lSo
uthb
ound
Nor
thbo
und
0
2,000
4,000
6,000
8,000
10,000
12,000
14,000
16,000
18,000
Jan Feb Mar Apr May Jun Jul Aug Sep Oct
0
1,000
2,000
3,000
4,000
5,000
6,000
7,000
8,000
9,000
10,000
Jan Feb Mar Apr May Jun Jul Aug Sep Oct
0
1,000
2,000
3,000
4,000
5,000
6,000
7,000
Jan Feb Mar Apr May Jun Jul Aug Sep Oct
0
500
1,000
1,500
2,000
2,500
3,000
Jan Feb Mar Apr May Jun Jul Aug Sep Oct
0
200
400
600
800
1,000
1,200
1,400
1,600
Jan Feb Mar Apr May Jun Jul Aug Sep Oct
0
200
400
600
800
1,000
1,200
Jan Feb Mar Apr May Jun Jul Aug Sep Oct

Memorandum I-95 ETL T&R Update
V1 11
Table 2-2: ETL Weekend Traffic, Actual vs. Forecast by Time Period
Absolute Percent Absolute Percent Absolute Percent Absolute PercentJan 5,453 14,909 9,456 173.4% 2,594 6,641 4,047 156.0% 2,422 7,244 4,822 199.1% 438 1,025 587 134.1%Feb 5,453 13,672 8,218 150.7% 2,594 5,813 3,218 124.1% 2,422 6,837 4,416 182.4% 438 1,022 584 133.4%Mar 5,453 18,208 12,754 233.9% 2,594 7,691 5,097 196.5% 2,422 8,941 6,519 269.2% 438 1,576 1,138 260.0%Apr 5,453 26,709 21,256 389.8% 2,594 10,979 8,385 323.2% 2,422 13,296 10,874 449.0% 438 2,435 1,997 456.2%May 5,453 21,690 16,236 297.7% 2,594 8,731 6,137 236.6% 2,422 11,042 8,620 356.0% 438 1,917 1,479 337.9%Jun 5,453 26,446 20,992 384.9% 2,594 10,618 8,024 309.3% 2,422 13,096 10,675 440.8% 438 2,731 2,294 523.9%Jul 6,642 28,374 21,732 327.2% 3,210 10,723 7,512 234.0% 2,951 14,324 11,373 385.4% 481 3,328 2,846 591.6%Aug 6,642 30,897 24,254 365.1% 3,210 11,466 8,256 257.2% 2,951 15,576 12,625 427.8% 481 3,854 3,373 701.0%Sep 6,642 20,664 14,021 211.1% 3,210 8,066 4,856 151.3% 2,951 10,486 7,535 255.3% 481 2,112 1,630 338.9%Oct 6,642 23,131 16,489 248.2% 3,210 9,270 6,059 188.7% 2,951 11,725 8,774 297.3% 481 2,137 1,656 344.2%Average 5,929 22,470 16,541 279.0% 2,841 9,000 6,159 216.8% 2,633 11,257 8,623 327.5% 455 2,214 1,758 386.4%
Jan 2,660 8,584 5,924 222.6% 1,189 3,701 2,512 211.2% 1,246 4,180 2,935 235.6% 225 703 477 211.6%Feb 2,660 7,910 5,249 197.3% 1,189 3,206 2,016 169.5% 1,246 3,955 2,710 217.5% 225 749 523 232.1%Mar 2,660 10,057 7,396 278.0% 1,189 4,129 2,940 247.2% 1,246 4,980 3,735 299.8% 225 947 722 320.1%Apr 2,660 14,493 11,833 444.8% 1,189 5,652 4,462 375.2% 1,246 7,180 5,935 476.4% 225 1,662 1,436 637.0%May 2,660 12,654 9,993 375.6% 1,189 4,907 3,718 312.6% 1,246 6,426 5,180 415.9% 225 1,320 1,095 485.6%Jun 2,660 14,902 12,241 460.1% 1,189 5,712 4,522 380.2% 1,246 7,428 6,183 496.4% 225 1,762 1,537 681.5%Jul 3,249 15,872 12,623 388.5% 1,501 5,851 4,350 289.8% 1,523 8,035 6,512 427.7% 225 1,986 1,761 780.9%Aug 3,249 17,220 13,971 430.0% 1,501 6,263 4,762 317.2% 1,523 8,627 7,104 466.5% 225 2,331 2,105 933.7%Sep 3,249 11,192 7,943 244.5% 1,501 4,335 2,834 188.8% 1,523 5,583 4,060 266.6% 225 1,274 1,049 465.2%Oct 3,249 12,180 8,930 274.8% 1,501 4,883 3,382 225.3% 1,523 6,030 4,507 296.0% 225 1,267 1,042 462.0%Average 2,896 12,506 9,610 331.9% 1,314 4,864 3,550 270.1% 1,356 6,242 4,886 360.2% 225 1,400 1,175 521.0%
Jan 2,793 6,325 3,533 126.5% 1,405 2,940 1,535 109.3% 1,176 3,063 1,887 160.5% 212 322 110 51.8%Feb 2,793 5,762 2,969 106.3% 1,405 2,607 1,202 85.6% 1,176 2,882 1,706 145.1% 212 273 61 28.6%Mar 2,793 8,151 5,358 191.8% 1,405 3,562 2,157 153.6% 1,176 3,960 2,784 236.8% 212 629 416 196.1%Apr 2,793 12,216 9,423 337.4% 1,405 5,327 3,923 279.3% 1,176 6,115 4,939 420.0% 212 773 561 264.2%May 2,793 9,036 6,243 223.5% 1,405 3,824 2,419 172.2% 1,176 4,616 3,440 292.5% 212 596 384 180.9%Jun 2,793 11,544 8,751 313.3% 1,405 4,907 3,502 249.3% 1,176 5,668 4,492 382.0% 212 969 757 356.6%Jul 3,393 12,502 9,109 268.5% 1,709 4,872 3,162 185.0% 1,428 6,289 4,861 340.4% 256 1,341 1,086 424.6%Aug 3,393 13,676 10,283 303.1% 1,709 5,204 3,494 204.4% 1,428 6,950 5,521 386.6% 256 1,523 1,268 495.9%Sep 3,393 9,471 6,078 179.1% 1,709 3,731 2,022 118.3% 1,428 4,903 3,475 243.3% 256 837 581 227.4%Oct 3,393 10,952 7,558 222.8% 1,709 4,387 2,677 156.6% 1,428 5,695 4,267 298.8% 256 870 614 240.2%Average 3,033 9,964 6,931 228.5% 1,526 4,136 2,609 170.9% 1,277 5,014 3,737 292.7% 230 813 584 254.2%
Northbound
Southbound
Month
I-95 ETL T&R 2015
Peak Off-Peak Night
Forecast ActualDifference
Forecast ActualDifference
Forecast Actual
Average Weekend TrafficTotal
DifferenceForecast Actual
Difference
Memorandum I-95 ETL T&R Update
V1 12
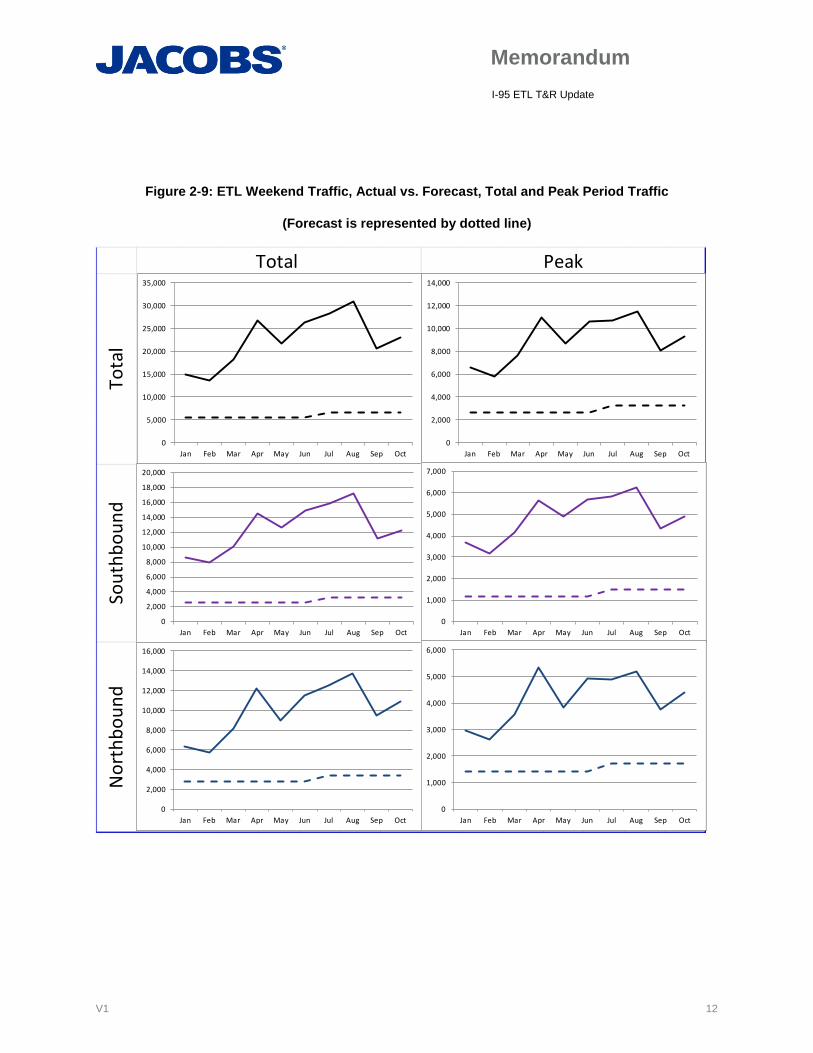
Figure 2-9: ETL Weekend Traffic, Actual vs. Forecast, Total and Peak Period Traffic
(Forecast is represented by dotted line)
Sout
hbou
ndN
orth
boun
d
Total Peak
Tota
l
0
5,000
10,000
15,000
20,000
25,000
30,000
35,000
Jan Feb Mar Apr May Jun Jul Aug Sep Oct
0
2,000
4,000
6,000
8,000
10,000
12,000
14,000
16,000
18,000
20,000
Jan Feb Mar Apr May Jun Jul Aug Sep Oct
0
2,000
4,000
6,000
8,000
10,000
12,000
14,000
16,000
Jan Feb Mar Apr May Jun Jul Aug Sep Oct
0
2,000
4,000
6,000
8,000
10,000
12,000
14,000
Jan Feb Mar Apr May Jun Jul Aug Sep Oct
0
1,000
2,000
3,000
4,000
5,000
6,000
7,000
Jan Feb Mar Apr May Jun Jul Aug Sep Oct
0
1,000
2,000
3,000
4,000
5,000
6,000
Jan Feb Mar Apr May Jun Jul Aug Sep Oct

Memorandum I-95 ETL T&R Update
V1 13
Figure 2-10: ETL Weekend Traffic, Actual vs. Forecast, Off-Peak and Night Period Traffic
(Forecast is represented by dotted line)
Sout
hbou
ndN
orth
boun
d
Off-Peak Night
Tota
l
0
2,000
4,000
6,000
8,000
10,000
12,000
14,000
16,000
18,000
Jan Feb Mar Apr May Jun Jul Aug Sep Oct
0
1,000
2,000
3,000
4,000
5,000
6,000
7,000
8,000
9,000
10,000
Jan Feb Mar Apr May Jun Jul Aug Sep Oct
0
1,000
2,000
3,000
4,000
5,000
6,000
7,000
8,000
Jan Feb Mar Apr May Jun Jul Aug Sep Oct
0
500
1,000
1,500
2,000
2,500
3,000
3,500
4,000
4,500
Jan Feb Mar Apr May Jun Jul Aug Sep Oct
0
500
1,000
1,500
2,000
2,500
Jan Feb Mar Apr May Jun Jul Aug Sep Oct
0
200
400
600
800
1,000
1,200
1,400
1,600
Jan Feb Mar Apr May Jun Jul Aug Sep Oct

Memorandum I-95 ETL T&R Update
V1 14
2.3 Estimated ETL Capture Rates
The capture rates of the ETLs show the estimated percentage of vehicles that are taking the ETLs as compared to the general purpose lanes. For this analysis general purpose lane traffic counts were not available so an estimate of general purpose lane traffic was used derived from previous analysis. With these counts the overall capture rate for the forecast and the actual traffic on the ETL was calculated. The following graphs present those capture rates by direction, day of week and hour. The results are very similar to the previous review of forecast to actual traffic with peak periods showing fairly close capture rates to forecast and off peak, quite a bit higher.
Figure 2-11: Southbound ETL Percent Share – Weekday FY15
Figure 2-12: Southbound ETL Percent Share – Weekend FY15

Memorandum I-95 ETL T&R Update
V1 15
Figure 2-13: Northbound ETL Percent Share – Weekday FY15
Figure 2-14: Northbound ETL Percent Share – Weekend FY15

Memorandum I-95 ETL T&R Update
V1 16
2.4 Speed Review
As was shown in the previous sections, the actual traffic in the ETLs exceeded forecasts. Since the forecasting models rely heavily on the relationship between the speeds on the ETLs and the GP lanes, a review was undertaken to compare the actual speeds to previously estimated speeds. The following figures show the forecasted speeds on the GP lanes by day of the week and hour of the day followed by the actual average speeds on those same days. The actual data includes data from January 2015 to June 2015. The ETL speeds were reviewed as well, showing speeds of 65 miles per hour (mph) or above at almost all times.
As can be seen from the graphs, actual speeds in the GP lanes were actually higher than forecasted. In the southbound direction, it was forecasted that speeds would be between 47 and 50 mph during the weekday AM peak. In reality those speeds were above 55 mph at all times. In the northbound direction forecasted speeds were in the same range, 47 to 50 mph, during the PM peak. Again, with the exception of Friday, the speeds were all well above 60 mph.
The actual speeds shown for FY15 are averages for each respective day. The distribution of those speeds were also reviewed to understand if motorists could expect to see excessive slowdowns every few days and thus plan for a travel time in the general purpose lane that was longer than actual results. Again, with the exception of the Friday northbound PM peak, the distributions were very tight around the average with very few exceptions. It is apparent that travel time savings is limited at this point. Even the possibility of delay appears to be rather limited based on the data reviewed.
Figure 2-15: Southbound General Purpose Lane Speeds – Forecasted

Memorandum I-95 ETL T&R Update
V1 17
Figure 2-16: Southbound General Purpose Lane Speeds – Actual
Figure 2-17: Northbound General Purpose Lane Speeds - Forecasted

Memorandum I-95 ETL T&R Update
V1 18
Figure 2-18: Northbound General Purpose Lane Speeds - Actual

Memorandum I-95 ETL T&R Update
V1 19
2.5 Frequency of Use
While the forecast had no explicit frequency of use assumed, this metric was reviewed to understand the potential sustainability of usage of the ETLs as motorists become more familiar with the relative benefits. For this analysis the frequency of usage was calculated for the full 9 months of data (January 2015 to September 2015) and then expanded based upon the preceding to an estimate full year frequency. Then the frequency data for the Baltimore Harbor Tunnel, Fort McHenry Tunnel and JFK Memorial highway were reviewed to understand the total number of unique people/motorists in the corridor. With this knowledge, the estimated number of unique motorists each year on I-95 adjacent to the ETLs can be estimated to be included in the analysis of when motorists in the corridor will become familiar with ETLs (i.e. encounter the ETLs for the second or more time) and therefore make decisions based on time savings and not unfamiliarity.
The following figures and tables present the estimated frequency of use for 9 months and then for one year with the extrapolation process.
Figure 2-19: ETL Frequency of Use - People – 9 Months

Memorandum I-95 ETL T&R Update
V1 20
Figure 2-20: ETL Frequency of Use - Trips – 9 Months
Table 2-3: ETL Frequency of Use – 9 Months
Frequency People Trips People Trips4+ times per week 1,836 371,901 0.1% 7.3%2-4x per week 10,271 670,690 0.5% 13.1%1x per week 4,735 144,585 0.2% 2.8%2-3x per month 41,216 609,192 2.2% 11.9%1x per month 773,914 2,261,100 40.7% 44.1%1 time per year 1,068,664 1,068,664 56.2% 20.8%Total 1,900,636 5,126,132 100.0% 100.0%

Memorandum I-95 ETL T&R Update
V1 21
Figure 2-21: ETL Frequency of Use - People – Estimated Annually
Figure 2-22: ETL Frequency of Use – Trips – Estimated Annually

Memorandum I-95 ETL T&R Update
V1 22
Table 2-4: ETL Frequency of Use – Estimated Annually
As shown, the vast majority of people using the ETLs and even trips on the ETL are from motorists who use it one time or less per month. It is estimated that some 97 percent of the people using the ETLs use it once a month or less. These motorists make up about 58 percent of the trips. It may be unwise to assume that these very occasional users would continue to use the facility as they become more familiar with the corridor. Furthermore, the remaining 88,000 motorists (frequent users) that make up the remaining 42 percent of trips, are estimated to be 1.5 percent of the total people in the corridor. The inability to predict the decisions of a very small selection of the population (frequent users) coupled with large usage of the facility by non-repeat customers (infrequent users) provides reasons for conservatism in the forecast going forward.
With these data and previous frequency data for the BHT, FMT and JFK motorists, it is estimated that the total number of unique motorists in the I-95 corridor each year adjacent to the ETLs is approximately 4 million. It is estimated that during the first year of operation the ETLs will encounter approximately 2M unique users. Each year, new users will of course enter the corridor; therefore the forecast extends the time for removal of unfamiliar motorists from the ETLs and keeps a portion of the lanes filled with those motorists who choose the lanes for a number of reasons that are outside of time savings. A more detailed list of these reasons and the cause for such decision making is provided in a subsequent section of this documentation.
Frequency People Trips People Trips4+ times per week 3,545 718,164 0.2% 10.0%2-4x per week 18,346 1,234,307 0.9% 17.2%1x per week 6,273 191,209 0.3% 2.7%2-3x per month 60,180 878,937 2.8% 12.3%1x per month 1,001,161 3,093,208 46.8% 43.2%1 time per year 1,050,494 1,050,494 49.1% 14.7%Total 2,140,000 7,166,319 100.0% 100.0%

Memorandum I-95 ETL T&R Update
V1 23
2.6 Possible Reasons for ETL Usage Apart from Time Savings
During the course of the analysis we reviewed potential reasons for high ETL usage in the face of limited time savings so as to mitigate these during the modeling effort if necessary. The high level of one time users points to a potential correction of behavior after taking it once or twice. The following table provides a description of potential reasons and the resulting action taken for the modeling process. Generally, it is estimated that over time, usage of the ETLs will be fully dependent upon travel time savings and not curiosity, unfamiliarity or the like.
Table 2-5: Possible Reasons for ETL Usage
Potential Reason Analysis Modeling MitigationConstruction on General Purpose Lanes causing restrictions
No known construction on GP lanes that would encourage ETL usage
None
Spot congestion at entry points
No known spot congestion at entries
None
Confusion over signage The signs show that E-ZPass should use the left lanes as motorists approach the entries to the ETLs. This signage is similar to signage at the tunnels and JFK Memorial where E-ZPass uses the leftmost lanes. It is possible that motorists with E-ZPass simply follow the signs.
Phase out one time users
Navigation directions pushing motorists into ETLs
Apple Maps, Yahoo Maps and Tom Tom provided guidance to use the ETLs; Google Maps, Mapquest and Bing Maps directs motorists to GP Lanes
Users will use navigation advice once or twice before making decision to take GP Lanes
Perceived value of lanes because of pricing
Possibly a Veblen Good - provides status of relatively low cost
Continue some usage regardless of future time savings
"Tourist" usage - i.e. trying something once to see how it works
Frequency data seems to suggest that this may be the case
Removal of one time users over the years as motorists become familiar with the corridor
Fear of potential slowdown in GP lanes with value seen in the reliability and percived safety/comfort of the ETLs
This is a reason for managed lane usage across the nation and appears to be applicable to this facility
Continue some usage regardless of future time savings

Memorandum I-95 ETL T&R Update
V1 24
3. Economic Review
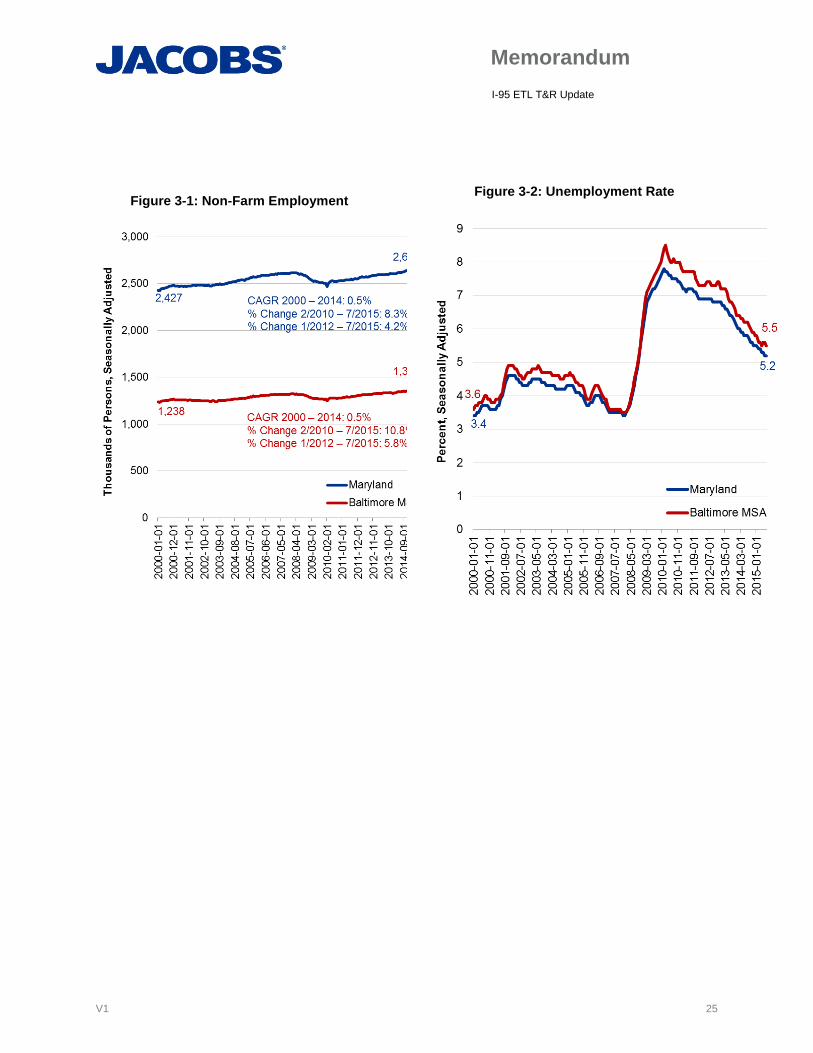
In this section major economic factors that drive traffic growth in the corridor are reviewed, specifically with regard to how these metrics have changed since the original forecast was developed in 2013. The purpose for this review is to understand if there were any sizable shifts in growth that we did not account for in the original forecast. It appears that through the various metrics of population, employment, unemployment rate, and output, the region is growing but not substantially different than it was assumed for the original analysis.
Table 3-1: Maryland Population Projections
Source: Maryland Department of Planning, Planning Data Services, March 2012 and July 2014
Table 3-2: Baltimore Region Population Projections
Source: Maryland Department of Planning, Planning Data Services, March 2012 and January 2015
Memorandum I-95 ETL T&R Update
V1 25
Figure 3-1: Non-Farm Employment
Figure 3-2: Unemployment Rate

Memorandum I-95 ETL T&R Update
V1 26
Figure 3-3: Real Maryland GDP
Figure 3-4: Real Delaware GDP
Memorandum I-95 ETL T&R Update
V1 27
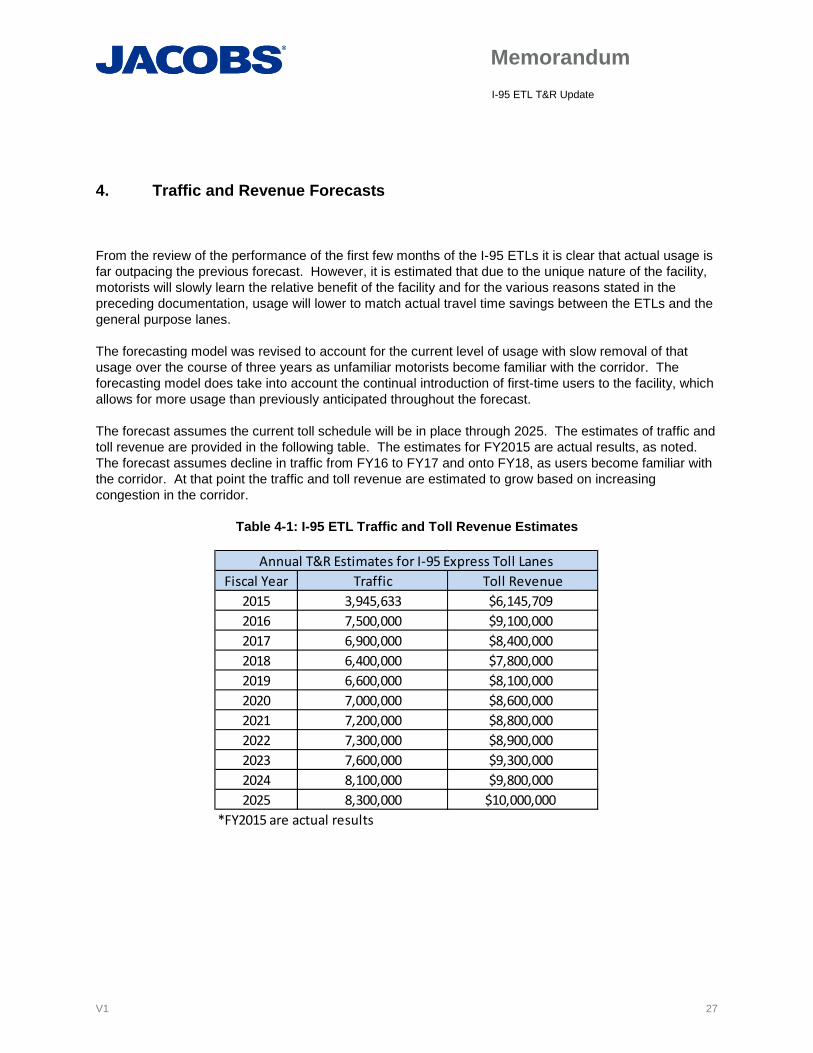
4. Traffic and Revenue Forecasts
From the review of the performance of the first few months of the I-95 ETLs it is clear that actual usage is far outpacing the previous forecast. However, it is estimated that due to the unique nature of the facility, motorists will slowly learn the relative benefit of the facility and for the various reasons stated in the preceding documentation, usage will lower to match actual travel time savings between the ETLs and the general purpose lanes.
The forecasting model was revised to account for the current level of usage with slow removal of that usage over the course of three years as unfamiliar motorists become familiar with the corridor. The forecasting model does take into account the continual introduction of first-time users to the facility, which allows for more usage than previously anticipated throughout the forecast.
The forecast assumes the current toll schedule will be in place through 2025. The estimates of traffic and toll revenue are provided in the following table. The estimates for FY2015 are actual results, as noted. The forecast assumes decline in traffic from FY16 to FY17 and onto FY18, as users become familiar with the corridor. At that point the traffic and toll revenue are estimated to grow based on increasing congestion in the corridor.
Table 4-1: I-95 ETL Traffic and Toll Revenue Estimates
Fiscal Year Traffic Toll Revenue2015 3,945,633 $6,145,7092016 7,500,000 $9,100,0002017 6,900,000 $8,400,0002018 6,400,000 $7,800,0002019 6,600,000 $8,100,0002020 7,000,000 $8,600,0002021 7,200,000 $8,800,0002022 7,300,000 $8,900,0002023 7,600,000 $9,300,0002024 8,100,000 $9,800,0002025 8,300,000 $10,000,000
*FY2015 are actual results
Annual T&R Estimates for I-95 Express Toll Lanes

Memorandum I-95 ETL T&R Update
V1 28
5. Limits and Disclaimers It is Jacobs’ opinion that the traffic and toll revenue estimates provided herein are reasonable and that they have been prepared in accordance with accepted industry-wide practice. However, given the uncertainties within the current economic climate, it is important to note the following assumptions which, in our opinion, are reasonable:
This limited synopsis presents the highlighted results of Jacobs’ consideration of the information available as of the date hereof and the application of our experience and professional judgment to that information. It is not a guarantee of any future events or trends.
The traffic and toll revenue estimates will be subject to future economic and social conditions, demographic developments and regional transportation construction activities that cannot be predicted with certainty.
The estimates contained in this report, while presented with numeric specificity, are based on a number of estimates and assumptions which, though considered reasonable to us, are inherently subject to economic and competitive uncertainties and contingencies, most of which are beyond the control of the MDTA and cannot be predicted with certainty. In many instances, a broad range of alternative assumptions could be considered reasonable. Changes in the assumptions used could result in material differences in estimated outcomes.
Jacobs’ traffic and toll revenue estimations only represent our best judgment and we do not warrant or represent that the actual toll revenues will not vary from our estimates.
We do not express any opinion on the following items: socioeconomic and demographic forecasts, proposed land use development projects and potential improvements to the regional transportation network.
The standards of operation and maintenance on all of the system will be maintained as planned within the business rules and practices.
The general configuration and location of the system and its interchanges will remain as discussed in this report.
Access to and from the system will remain as discussed in this report.
No other competing highway projects, tolled or non-tolled are assumed to be constructed or significantly improved in the project corridor during the project period, except those identified within this report.
Major highway improvements that are currently underway or fully funded will be completed as planned.
The system will be well maintained, efficiently operated, and effectively signed to encourage maximum usage.
No reduced growth initiatives or related controls that would significantly inhibit normal development patterns will be introduced during the estimate period.

Memorandum I-95 ETL T&R Update
V1 29
There will be no future serious protracted recession during the estimate period.
There will be no protracted fuel shortage during the estimate period.
No local, regional, or national emergency will arise that will abnormally restrict the use of motor vehicles.
In Jacobs' opinion, the assumptions underlying the projections provide a reasonable basis for the revenue projections and operating expenses. However, any financial projection is subject to uncertainties. Inevitably, some assumptions used to develop the projections will not be realized, and unanticipated events and circumstances may occur. There are likely to be differences between the projections and actual results, and those differences may be material. Because of these uncertainties, Jacobs makes no guaranty or warranty with respect to the projections disclosed in this Study
This document, and the opinions, analysis, evaluations, or recommendations contained herein are for the sole use and benefit of the contracting parties. There are no intended third party beneficiaries, and Jacobs Engineering Group, (and its affiliates) shall have no liability whatsoever to any third parties for any defect, deficiency, error, omission in any statement contained in or in any way related to this document or the services provided.
Neither this document nor any information contained therein or otherwise supplied by Jacobs Civil Consultants Inc. in connection with the study and the services provided to our client shall be used in connection with any financing solicitation, proxy, and proxy statement, proxy soliciting materials, prospectus, Securities Registration Statement or similar document without the express written consent of Jacobs Engineering Group.