memorandum - nasa key john boggess david taylor fred dolan ronald p. harris lockheed members...
TRANSCRIPT

NASA TECHNICAL
MEMORANDUM
NASA TM X-64772
APOLLO 17 HEAT FLOW AND CONVECTION EXPERIMENTS
F INAL DATA ANALYSES RESULTS
By T.C. Bannister, P.G. Grodzka, L.W. Spradley, S. V. Bourgeois, R. 0, Hedden, and B. R. Facemire Space Sciences Laboratory
July 16, 1973
C A S E F ILE C O P Y
NASA
George C. Mdrshall Space Flight Center Mdrshdll Space Flight Center, Alabama
MSPC - Form 3190 (Rev June 1971)
https://ntrs.nasa.gov/search.jsp?R=19730023108 2018-07-04T00:04:14+00:00Z

TECHNICAL R E P O R T S T A N D A R D TITLE P A G E
I Apollo I7 Heat Flow and Convection Experiments
1 George C. Marshall Space Flight Center
112. SPONSORING AGENCY NAME AND ADDRESS I : I Technical Memorandum I i National Aeronautics and Space Administration
Washington, D. C. 20546 i
14. SPONSORING AGENCY CODE
15. SUPPLEMENTARY NOTES
Prepared by Space Sciences Laboratory, Science and Engineering
"Lockheed Missiles and Sgace Co. . Inc. 18. ABSTRACT
i I
A group of experiments called the Apollo 17 Heat Flow and Convection (HFC) Experiments was conducted by Astronaut Ron Evans on December 8, 1972, aboard the Apollo 17 spacecraft while in translunar coast on the way to the moon. These experiments together with the HFC I experiments flown on Apollo 14 demonstrated and provided data on two types of low-g natural I convection: cellular, surface tension-driven convection and convection in confined fluids caused by spacecraft and astronaut movements. Observed convection onset times show that surface i
I
tension-driven convection occurs a t lower temperature gradients in low-g than in one-g environ- ments. Data on heat flow in confined fluids show that spacecraft and astronaut movements can cause significant degrees of convection.
i EDITOR'S NOTE
Use of trade names o r names of manufacturers in this report does not constitute an official endorsement of such products o r manufacturers, either express o r implied, by the National Aeronautics and Space Administration o r any other agency of the United States government.
Unclassified - Unlimited
L MSFG - Form 3 2 9 2 (Rev December 1 9 5 5 ) For reie by Netionai Techfiicel InfoaMstlon Service, Springfield, virginis 22 1 5 1

The Apollo 17 Heat Flow and Convection team wishes to express its thanlts to Astronauts Ronald E. Evans and Stuart A. Roosa. Their enthu- s iast ic interest and careful performance of the Heat Flow and Convection (HFC) Experiments were in large measure responsible for the successes achieved.
The indispensable guidance, suggestions, and management skills of Dr. James H. Bredt, NASA Headquarters, and Mr. Brian 0. Montgomery, George C. Marshall Space Flight Center (MSFC), a s well a s the assistance of a number of individuals a t the Johnson Space Center and the Kennedy Space Center a r e also acknowledged.
The successful outcome of the Apollo 17 HFC experiments also is undoubtedly the result of the outstanding team spir i t which pervaded the entire project. The NASA-Lockheed team worked together on the apparatus design, research and development, fabrication, and data analysis with an enthusiasm and dedication that inspired each member anew. The following people com- prised the Apollo 17 MSFC-Lockheed team:
MSFC Members
Tommy C. Bannister Bernie S. Blake Barbara Facemire Larry W. Russell James Parker Robert L. Holland Luke Ginn Frank Key John Boggess David Taylor Fred Dolan Ronald P. Harr is
Lockheed Members
Philomena G. Grodzka Paul T. Johnson John Benefield Lawrence Spradley Sidney Bourgeois Ray Hedden Paul Biscenius Kip Heimendinger Robert A. Wyman Robert L. Chaney Gus Marino Billie Joe Osmer
A number of people assisted with certain phases of the apparatus design and the data analysis. These include:
Fred Rodrigue (NASA) Ronald Graham (NASA) Robert L, Holland (NASA) Dick Saybor ( ~ o m p u t e r Sciences Corporation) E, L, Kosc"nmieder ( ~ n i v e r s ity of Texas }

Astronaut Ron Evans performing the Apollo 17 Heat Flow and Convection Experiments. (Apparatus is a t left
of picture. )
iii

FOREWORD
On December 8, 1972, while the Apollo 17 spacecraft was 145 178 n. nii. from the earth and traveling a t the speed of 3543 ft/sec, Astronaut Ronald E. Evans performed a series of experiments called the Apollo 17 Heat Flow and Convection Experiments. The Apollo 17 experiments expand and complement similar experiments conducted aboard the Apollo 14 spacecraft by Astronaut Stuart A. Roosa on February 7, 1971, during the lunar flyback. This report describes the results of an analysis of the Apollo 17 Heat Flow and Convection Experiments data.

TABLE OF CONTENTS
Page
SUMMARY . . . . . . . . . . . . . . . . . . . . . . . . . . . . . . . . . . . . . . . . 1
I . INTRODUCTION . . . . . . . . . . . . . . . . . . . . . . . . . . . . . . . . . 3
I1 . EXPERIMENTAL APPARATUS. CONDITIONS. AND . . . . . . . . . . . . . . . . . . . . . . . . . . . . . . . . . . PROCEDURES
I11 . FLIGHT RESULTS . . . . . . . . . . . . . . . . . . . . . . . . . . . . . . . 20
A . Flow Pat tern Experiment . . . . . . . . . . . . . . . . . . . . . . . . 20 B . Radial and Lineal Heating
. . . . . . . . . . . . . . . . . . . . . . . . . . . . . . . . . Experiments 32
IV . INTERPRETATIONS . . . . . . . . . . . . . . . . . . . . . . . . . . . . . . 40
A . S~tmnlary of Interpretations . . . . . . . . . . . . . . . . . . . . . . 40 B . Flow Pat tern Experiment . . . . . . . . . . . . . . . . . . . . . . . . 40 C . Radial and Lineal Heating
Experiments . . . . . . . . . . . . . . . . . . . . . . . . . . . . . . . . 51
V . IMPLICATIONS FOR SPACE PROCESSING . . . . . . . . . . . . . . . 69
APPENDIX A . APOLLO 17 LIQUID CRYSTAL CALIBRATION . . . . . . . . . . . . . . . . . . . . . . . . . . . . . STUDIES 72
. . . . . . . . . . . . . . . . . . . . . . . . . . . . Ins t run~ent E r ro r s . . . . . . . . . . . . . . . . . . . . . . . . . . . . . . . . . . . . . Aging
Dynamic versus Isothermal . . . . . . . . . . . . . . . . . . . . . . Different Observers ' Sensitivity and Observation Techniques . . . . . . . . . . . . . . . . . . . . . . . . . . . . . . . . .
. . . . . . . . . . . . . . . Initial Temperature and Heating Rates . . . . . . . . . . . . . . . . . . . . . . . . . Heating versus Cooling
. . . . . . . . . . . . . . . . . . . . . . . Previous Thermal His tory Lighting . . . . . . . . . . . . . . . . . . . . . . . . . . . . . . . . . . .
. . . . . . . . . . . . . . . . . . . . . . . . . . . . . Angle of Viewing . . . . . . . . . . . . . . . . . . . . . P r e s s u r e and Gravity Effects . . . . . . . . . . . . . . . . . . . . . . . Assignment of E r r o r Bands
. . . . . . . . . . . Final Values of Color versus Temperature

TABLE OF CONTENTS (Con~;(uCfed)
Page
APPENDIX B . UTILITY AND DEFINITION OF PERTINENT DIMENSIONLESS NUMBERS . . . . . . . . . . . . . . . . 87
APPENDIX C . ERROR ANALYSES FOR RADIAL AND LINEAL EXPERIMENTS . . . . . . . . . . . . . . . . . . . . . . . . . 92
A . Liquid Crys ta l Calibration E r r o r s . . . . . . . . . . . . . . . . . . 92 B . Power Fluctuations . . . . . . . . . . . . . . . . . . . . . . . . . . . . 93
APPENDIX D -- CONDUCTION-RADIATION THERMAL MODELS 96
A . Thermal Analysis . . . . . . . . . . . . . . . . . . . . . . . . . . . . . 97 B . Therma l Models . . . . . . . . . . . . . . . . . . . . . . . . . . . . . . 98 C . Radial Heating Temperature-Time Curves . . . . . . . . . . . . 105 D . Lineal Heating Temperature-Time Curves . . . . . . . . . . . . 117 E . Flow Pat te rn Tempera ture Profile Curves . . . . . . . . . . . . 129
APPENDIX E . LOCKHEED GENERAL CONVECTION . . . . . . . . . . . . . . . . . . . . . . . . . . . . PROGRAM 138
APPENDIX F . REVIEW OF GEBHART'S THEORY OF RANDOM CONVECTION . . . . . . . . . . . . . . . . . . . . . . . . . . 142
REFERENCES . . . . . . . . . . . . . . . . . . . . . . . . . . . . . . . . . . . . . . 145

L IST OF ILLUSTRATIONS
Figure
1.
Title Page
Apparatus configuration for the Heat Flow and Convection Demonstration for Apollo 17, . . . . . . . . . . . . . . . . . . . . . . 7
Panel face of Apollo 17 Heat Flow and Convection apparatus . . . . . . . . . . . . . . . . . . . . . . . . . . . . . . . . . . . 8
Details of the Apollo 17 Heat Flow and Convection Experiments . . . . . . . . . . . . . . . . . . . . . . . . . . . . . . . . . 9
Gravity level in z direction of the HFC appara tus . . . . . . . . . . . . . . . . . . . . . . . . . . . . . . . . . . . 12
Gravity level in x direction of the HFC appara tus . . . . . . . . . . . . . . . . . . . . , . . . . . . . . . . , . . . 13
Gravity level in y direction of the HFC appara tus . . . . . . . . . . . . . . . . . . . , . . . . . . . . . . . . . . . 14
Illustration of color bands in a liquid crystal tape . . . . . . . . 15
Location of liquid crystals on Apollo 17 HFC. . . . . . . . . . . . 16
Convection cells obtained in 2-mm deep oil during Apollo 17 f l igh t . . . . . . . . . . . . . . . . . . . . . . . . . . . . . . . . . . . . . . 22
Convection cells obtained in 4-mm deep oil during Apollo 17 flight . . . . . . . . . . . . . . . . . . . . . . . . . . . . . . . . . . . . . . 23
Convection cells obtained in 2-mm deep oil in ground test . . . 24
Convection cells obtained in 4-mm deep oil in ground test . . . 25
Convection cells obtained in Apollo 14 HFC Experiment . . . . 26
Computed thermal profile through 2-mm Krytox layer 18 sec after application of heat. . . . . . . . . . . . . . . . . . . . . . . . . . 27

LIST OF ILLUSTRATIONS (Continued)
Figure
13.
Title Page
Computed thermal profile through 4-mm Krytox layer 48 s ec after application of heat. . . . . . . . . . . . . . . . . . . . . 28
Computed thermal profile through 2-mm Krytox layer 2 min after application of heat . . . . . . . . . . . . . . . . . . . . . 29
Computed thermal profile through 4-mm Icrytox layer 2 nlin after application of heat . . . . . . . . . . . . . . . . . . . . , 30
Temperature-time curve a t 0.50 cm from Radial heater post . . . . . . . . . . . . . . . . . . . . . . . . . . . . . . . . . . . . . . . 33
Temperature-time curve at 0.7'5 cm from Radial heater post. . . . . . . . . . . . . . . . . . . . . . . . . . . . . . . . . . . . . . . 34
Temperature-time curve at 0.635 cm from Apollo 14 Radial heater post, heating rate = 5.73 W. . . . . . . . . . . . . . 35
Temperature-time curve a t 0.9 cm from Apollo 17 Lineal heater, heating rate = 18.0 W . . . . . . . . . . . . . . . . . 37
Temperature-time curve at 1.1 cm from Apollo 17 Lineal heater, heating rate = 18.0 W . . . . . . . . . . . . . . . . . 38
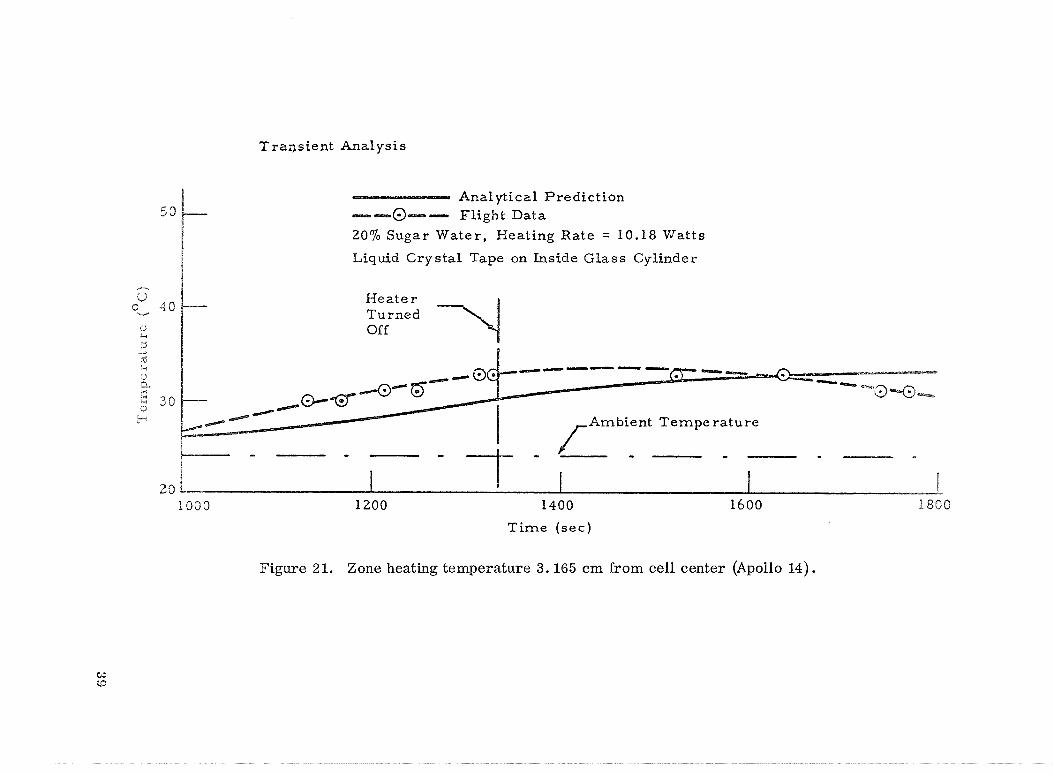
Zone heating temperature 3.165 cm from cell center (APo~~o 14) . . . . . . . . . . . . .'. . . . . . . . . . . . . . . . . . . . . 39
Temperature versus time a t r = 0. 6 cm in the Radial cell for varying gravity levels . . . . . . . . . . . . . . . . . . . . . . . . 55
Theoretical isotherm maps at t = 600 sec in the Apollo 17 HFC Radial cel l . . . . . . . . . . . . . . . . . . . . . . . . . . . . . . . 56
Theoretical velocity contour maps at t = 600 sec in Apollo 17 HFC Radial cel l . . . . . . . . . . . . . . . . . . , . . . . . . . . . . . . 57
Bubble displacement in Apollo 14 Zone Heating Cell versus time, . . . . . . , . . . . . . . . . . . . . . . , . . . . . , . . . . 61
viii

Title Page
Con~parison of calculated curves assullliilg various g-levels with Apollo 14 Radial cell data . . . . . . . . . . . . . . . (54
Isotherm plots for a cylinder problenl demonstrating the coupling of gravity and thermal expansion co~lvection . . . . . . 65
Attenuation of the effect of vibration with increasing values of Ra . . . . . . . . . . . . . . . . . . . . . . . . . . . . . . . . . . . . . . 67
Illustration of basic isotherlllal and dynamic concepts . . . . . . 73
. . . . . . . . . . . . . . Schelllatic of basic calil-ration apparatus 75
Diagranl of the two clynamic test apparatuses used . . . . . . . . 76
RiIethod of thermocouple attachnlellt . . . . . . . . . . . . . . . . . . 77
Isothermal apparatus. Tes ts I and I1 . . . . . . . . . . . . . . . . . 79
. . . . . . . . . . . . . . . . Isothermal apparatus. Tes t s III and IV 79
Illustration of effect of initial temperature . . . . . . . . . . . . . 83
Voltages a t the tiune of Raciial/Lh~eal run 1 . . . . . . . . . . . . . 94
Voltages a t the t ime of Radial/Lineal run 2 . . . . . . . . . . . . . 95
Nodal network for conc l i~c t io~~ / rad ia t io~~ thermal ~noclel of Apollo 17 HFC R:~clial cell . . . . . . . . . . . . . . . . . . . . . . . . 99
Nodal lletworli for concluction thermal model of Apollo 17 . . . . . . . . . . . . . . . . . . . . . . . . . . . . . . . HFC Lineal cell 100
One-d i l~~ens io~la l nodal net\vorl; for co~~cluct io~~/racl iat ioi~ . . . . . . . . thermal model of Apollo 17 I-IFC Flow Pattern cell 101
Radial heating tempeuature-time curve (r = 0 . 5. run 1) . . . . 106

Figure
D-5 . D- 6 . D-7 . D- 8 . D-9 . D- 10 .
D-11 . D- 12 .
D- 13 . D- 14 . D- 15 . D- 16 . D- 17 . D- 18 . D- 19 . D-20 . D-21 .
D-22 . D- 23 .
Title Page
Radial heating temperature-time curve (r = 0.6. run 1) . . . . . 107
Radial heating temperature-time curve (r = 0.75. run 1) . . . . 108
Radial heating temperature-time curve (r = 0.9. run 1) . . . . . 109
Radial heating temperature-time curve (r = 1.2. run 1) . . . . . 110
Radial heating temperature-time curve (r = 0.5. run 2) . . . . . 111
Radial heating temperature-time curve (r = 0.6. run 2) . . . . . 112
Radial heating temperature-time curve (r = 0.75. run 2) . . . . 113
Radial heating temperature-time curve (r = 0.9. run 2) . . . . . 114
Radial heating temperature-time curve (r = 1.2. run 2) . . . . . 115
Lineal heating temperature-time curve (X = 0.7. run 1) . . . . . 118
Lineal heating temperature-time curve (X = 0.9. run 1) . . . . . 119
Lineal heating temperature-time curve (X = 1.1. run 1) . . . . . 120
Lineal heating temperature-time curve (X = 1.2. run 1) . . . . . 121
Lineal heating temperature-time curve (X = 1.5. run 1) . . . . . 122
Lineal heating temperature-time curve (X = 0.6. run 2) . . . . . 123
Lineal heating temperature-time curve (X = 0.8. run 2) . . . . . 124
Lineal heating temperature-time curve (X = 1 . I. run 2) . . . . . 125
Lineal heating temperature-time c u v e (X = 1.5. run 2) . . . . . 126
Lineal heating temperature-time curve (X = 1.9. run 2) . . . . . 12'7

L I S T OF ILLUSTRATIONS (Concluded)
Figure
D- 24.
Title Page
Flow pattern tel~lperature profile curve . . . . . . . . . . . . . . (Q = 7. 56, t = 18, T = 25" * Y l l l
= 1 . 8 9 ) . 130 a
Flow pattern temperature profile curve (Q = 7. 56, t = 18, T = 25" , y n l = 2 . 0 ) . . . . . . . . . . . . . . . . 131
a
Flow pattern temperature profile curve (Q = 5. 18, t = 48, T = 25", ym = 3.73) . . . . . . . . . . . . . . . 132
a
Flow pattern temperature profile curve . . . . . . . . . . . . . . . (Q = 5. 18, t = 48, T = 25"
Ylll = 4 . 0 ) . 133
a
Flow pattern temperature profile curve . . . . . . . . . . . . . (Q = 7. 56, t = 18, T = 18.3"
* ylll = 1.89) 134
a
Flow pattern temperature profile curve ( Q = 7 . 5 6 , t = 1 8 , T = 1 8 . 3 " , y = 2 . 0 ) . . . . . . . . . . . . . . 135
a 1n
Flow pattern tenlperature profile curve . . . . . . . . . . . . . (Q = 5. 18, t = 48, T = 18.3", y = 3.73) 136
a 111
Flow pattern temperature profile curve . . . . . . . . . . . . . . (Q = 5. 18, t = 48, T = 18.3" ' ylll
= 4 . 0 ) 137 a
. . . . . . . . . . . . . . . Effect of clisturbances on heat transfer. 143

LIST OF TABLES
Table
1 . 2 .
Title Page
. . . . . . . . . . Physical Properties of Apollo 17 and 14 Fluids 1 0
Apollo 17 HFC Demonstration Experiment . Flight Boundary Conditions . . . . . . . . . . . . . . . . . . . . . . . . . . . . 11
Values of Liquid Crystal Dynanzic and Isothermal Temperatures . . . . . . . . . . . . . . . . . . . . . . . . . . . . . . . . 17
Measured Liquid Levels in Flow Pattern Cell . . . . . . . . . . . 18
Flow Pattern Convection Onset Tinzes for Apollo 17 and Ground Cases . . . . . . . . . . . . . . . . . . . . . . . . . . . . . . . . 26
Marangoni and Rayleigh Numbers at Flow Pattern Convection Onset . . . . . . . . . . . . . . . . . . . . . . . . . . . . . . 3 1
Apollo 17 Convection Cell Areas and Diameters . . . . . . . . . . 3 1
. . . . . . . . . Apollo 17: Manner of Cellular Convection Onset 32
Summary of Theoretical Predictions of Cellular Convection . . . . . . . . . . . . . . . . . . . . . . . . . . . . . . . . . . 42
Comparison of Apollo 17 Flow Pattern Results with Pearson's Theory . . . . . . . . . . . . . . . . . . . . . . . . . . . . . . 43
Flow Pattern Convection Onset Times and Corresponding . . . . . . . . . . . . . . . . . . . Marangoni and Rayleigh Numbers 44
Apollo 17 Convection Dimensionless Parameters for Flow . . . . . . . . . . . . . . . . . . . . . . . . . . . . . . . . . Pattern Unit 45
Summary of Literature Conclusions Regarding Nonlinear Temperature Profiles . . . . . . . . . . . . . . . . . . . . . . . . . . . 47
Sumlnary of Assumptions Regarding Surface Deformability . . . . . . . . . . . . . . . . . . . . . . . . . . . . . . . . 49
Thermal and Fluid Properties . . . . . . . . . . . . . . . . . . . . . 102

NQMENCLATU RE (Appendix D Not Included)
dimensionless wave number
dimensionless vibratory acceleration
Biot number
Bond number
constant
specific heat a t constant pressure
Crispation number
depth of fluid layer
dilllensionless vibration Fourier number
gravity acceleration
gravity acceleration at the earth's surface (9. 80 m/sec2)
convective heat transfer coefficient
height of container
thermal conductivity
diameter of convection cell
length of container
Marangoni number
critical Marangoni number
Nusselt number without vibration

NOMENCLATURE (ConcI sdded)
average Nusselt number
Nusselt number with vibration
Prandtl number
heating ra te
radius
Rayleigh number
critical Rayleigh number
Reynolds number
significant dimension
time
temperature
velocity
thermal diffus ivity
dV coefficient of volume expansion V ( E ) ~
absolute viscosity
kinematic viscosity
dimensionless frequency
density
surface tension
period of vibration
xiv

TECI-INlCAL MEMORANDUM X- 64772
APOLbO 17 HEAT FLOW AND CONVECTION EXPERIMENTS
FINAL DATA ANALYSES RESULTS
SUMMARY
A group of experiments called the Apollo 17 Heat Flow and Convection (HFC) Experiments was conducted by Astronaut Ron Evans on December 8 , 1972, aboard the Apollo 17 spacecraft while in t ranslunar coast on the way to the moon. Three experiments were conducted. In the Flow Pat tern Experi- ment, cellular convection which developed a s the 'esult of heating an open pan of oil was observed. In the Radial Heating Experiment, a closed dish of argon gas was heated by means of a center post heater , and the resultant temperature changes were tracked by means of liquid crystals . The Flow Pat tern and Radial Heating Experiments were improved tes t cells of experiments conducted by Astronaut Stuart Roosa aboard Apollo 14. The third Apollo 17 HFL" Exper- iment called the Lineal Heating Experiment consisted of heating a cylinder of oil f rom one end. Fluid motion and temperature changes were tracked by means of suspended magnesium particles and liquid c rys t a l s , respectively. Observational and tracking data were recorded on motion picture film.
Results of data analyses show ( re ferences a r e given in the text) :
Flow Pat tern Experiment
e The s i ze s of the observed surface tension-driven convection cel ls agree fairly well with those predicted by lineal- analysis of surface tension- driven, cellular convection.
e Convection occurred a t lower temperature gradients in low-g than in one-g. Surface tension and gravity, therefore, apparently do not reinforce each other in a manner predicted by one analysis of cel lular convection.
e The Flow Pat tern Experiment data substantiate in principle the postulate that gravity modulates cellular convection onset.

e The onset of a eot~eentr ie side roll and center polygonal cells in the Flow Pat tern Experiment nccut-red a t about the same time. The occurrence of a roll is contrary to expectations based on latest l i terature. The observed onset pattern tends to confirm an ea r l i e r view that rolls a r e side wall effects and a r e not particularly character is t ic of the driving mechanism.
Radial and Lineal Heating Experiments
e No significant convection was observed in the Radial o r Lineal Heat- ing Experiments. The data , however, validate the accuracy of the measuring technique and allow the conclusion that:
e The convection observed in the Apollo 14 Radial and Zone cel ls was probably caused by HFC unit and spacecraft vibrations.

The exploitation of space for the benefit of mankind is rapidly evolving in several areas such as transcontinental TV comniunications , astronomy , weather satellites, earth resources, and space processing. Space processing [I-3) is being developed to exploit the unique environment of a space laboratory to research, develop, and finally manufacture products having improvements over those made on earth. Several exarnples have often been cited: better seniiconductor crystals for use in solid-state electronic devices, puri- fication of organic and biological materials for use in biochemistry and vac- cines, developlnent of new metal alloys, and better lens glass materials [41 . Fundamental to all these processes is the use of low-gravity to reduce unwanted fluid niotions and settling of heavier materials while the product i s being pro- duced froni the molten o r gaseous state. Fluid mechanics (or convection) in space with varying boundary conditions of temperature, time, pressure, and artificial gravity levels, therefore, is a major concern. he tern1 convection is used herein in the sense of any perturbating force that can cause a contained fluid in low gravity to be nonstatic. )
One of the chief foreseen advantages of conducting manufacturing proc- esses in space is the reduction in vigor of gravity-driven, natural convection, Gravity-driven, natural convection occurs spontaneously when certain condi- tions of container geometry, heating rates, solute concentration gradients, etc., a re right. The result of convection is a st irr ing action which is dele- terious to many processes because the stirring perturbs internal temperature and concentration gradients. The onset and vigor of gravity-driven, natural convection a re very difficult to predict and, therefore, to control. In the low- or zero-g environments of orbiting spacecraft, gravity-driven convection will be much less of a problem. Gravity, however, is not the only driving force for fluid flow. A number of previous studies [5-71 have identified and cliscussed such nongravity forces as surface tension, interfacial tensions, thermal volu- metric expansions, phase-change occasioned volun~e changes, electric and magnetic fields, rotation accelerations, and linear accelerations. Many of these nongravity types of convection often a r e not considered on earth because the gravity force is s o i~iuch stronger and, thus, predominates. A s a result, little is linown about the nongravity forces. In low-g environments the non- gravity forces will be of comparable magnitude to the low-g force. It is thus essential to lmow for control purposes the characteristics of convection caused by these nongravity forces and how they may couple with low gravity fields.

Conveetioa~ studies in space a re essential, therefore, to spaee process- ing, not to prove whether the various endeavors will work, but rather to estab- lisb the degree of suppression of thermal convection and to study previously niaslted forms of low-level eonveetion, Such studies will provide criteria for future space processing activities.
To obtain information on the nature and magnitude of natural convection in low-g environments, two sets of experiments were conducted in the low-g environments encountered in space flight. The f i rs t se t was conducted aboard the Apollo 14 flight by Astronaut Stewart Roosa on February 7, 1971. Results of the Apollo 14 Heat Flow and Convection Demonstration Experinzents a r e given in References 8, 9, and 10. The Apollo 17 HFC Experiments were con- ducted on December 8, 1972, by Astronaut Ron Evans. A preliminary report of the results of the Apollo 17 HFC Experiments is given in Reference 11, and the present report presents the final results of an extensive data analyses study.
In the Apollo 14 HFC, three experimental tests were conducted. Cell- ular motion, which developed as the result of heating an open pan of oil, was observed in the Flow Pattern Experiment. Fine aluininunl flakes suspended in the oil rendered the flow pattern visible. In the Radial Heating Experiment, a closed dish of carbon dioxide gas was heated by means of a center gost heater, and the resultant temperature changes were tracked. The third test consisted of zone-heating cylindrical containers of pure water and 20-percent sugar solution and tracking the resultant temperature changes. Liquid crystal tapes which respond to temperature changes by changing color were the temperature detectors. The results of the experiments showed significant convection caused by nongravity motive forces. The Flow Pattern Experiment showed visible surface tension-driven cellular convection. The Radial Experiment showed two different ltinds of low-g convection: a sustained mode, called first-order, and an oscillatory mode, called second-order. The magnitude of the first-order convective heat transfer was estimated (very approximately) to be on the order of from 10 to 30 percent above that of pure conduction and radiation prediction. The aniount of first-order convective heat transfer observed in the two zone-heating experiments was lower, and it was therefore not meaningful to give a reliable estimate of its magnitude. Second-order con- vection was also noted in the zone-heating experiments.
In the Apollo 17 HFC, two of the experiments, the Flow Pattern Exper- iment and the Radial Heating Experinient, were repeated in cells of improved design, The Apollo 17 Radial Heating Experiment also utilized a different gas (argon). The third experiment, replacing the Apollo 14 Zone Heating

Experiment, was the Lineal Heating Experiment, In this latter experirnenta cylinder of oil was heated from one end. Suspended magnesium particles and an internal grid of liquid crystals were the fluid flow and temperature sensors, respectively. The results of the Apollo 17 HFC Experiments were listed pre- viously in the Summary.
In the following discussions the details of experiment construction, results, and interpretations a r e given. Implications of the results of the H F C experiments for space processing operations a r e also considered.

I I. EXPERIMENTAL APPARAII IS, CONDITIONS, AND PROCEDURES
The apparatus used in the Apollo 17 HFC Experiments i s shown in Figure 1. A schematic identifying the various experiments is shown in Figure 2. More detailed drawings of the tes t cells a r e shown in Figure 3 . Hardware, design, and operating details can be found in Reference 12. Table 1 summa- r izes the physical propert ies of the fluids involved, and Table 2 gives most of the flight boundary conditions a t the t ime th8 experiments were performed. Data on the magnitude of the acceleration levels and the variation of the g-vector with t ime were obtained f rom magnetic tape gyroscope data. These data were analyzed via a computer program, and plots of each g-component versus t ime were obtained for a t ime interval (a meaningful visual sca le was used) during the performance of the HFC Experiments, The data included not only the rol l ra te of the spacecraft but the variation of roll ra te with tiiiie. The data, there- fore , consist of oscillatory profiles of g versus t ime, talten a t 2-sec intervals. A sample of this information is shown in Figures 4a through 4c. The g-level is seen to oscillate (g- j i t ter) about "zerot t with an amplitude of about ge and
with the frequency somewhat random. Careful examination reveals a mean mag- nitude of about ge during the HFC Experiments. (A pre l iminwy analysis
shows that the probable e r r o r of the g-calculations is approximately 1 x ge. The accuracy will be fur ther detailed in a forthcoming repor t by Holland e t a l . ) The s a m e type of data fo r the Apollo 14 flight was taken a t 30-sec intervals. An accurate determination of the variation in roll ra te , therefore, was not possible and, a s a resul t , the g-ji t ter i s not a s accurately defined a s in the Apollo 17 case. The magnitude of the mean gravity level experienced during the Apollo 14 HFC was about the same a s in the Apollo 17 flight; I. e. , a mean magnitude of about
ge with an occasional spike into the ge range [13]. Although a mean
g-ji t ter level fo r the Apollo 14 case was indicated to be about ge by the
da ta , this value is questionable because of the previously mentioned lack of knowledge concerning the roll ra te variation. Additional evidence from traclt- ing bubble movement in the Apollo 14 Zone Heating cell indicates that the vibration level a t the location of the Apollo 14 HFC unit was of the o rde r of
to 10-* gee (See Section W . C. 3. )
As mentioned in the introduction, liquid crystal tapes were used a s temperature sensors in the Radial and Lineal cells. 1,iquid crystal tapes were also used to obtain temperatures of the apparatus box and the ambient cabin t en~pe ra tu re fo r each test. Liquid c rys ta l s a r e a c lass of organic com- pounds which have tile proper ty of selectively scatter ing ligh"Lfrequei~cies as a function of temperature, M ' l ~ e n ;rpplied r r r a thin layer to a btaetc background,

Figure 1. Apparatus configuration for the Heat Flow and Convection Den~onstration for Apollo 17.
these liquid crystals a re transparent below their response range so that an observer sees the black background. As the temperature increases, light is scattered so that an observer sees various colors in the order of amber to green to blue. Anlber corresponds to the lower temperature and blue to the higher temperature. Liquid crystals which have been made into tapes a r e available commercially. These tapes consist of a thin, black Mylar sheet


Baffles
H e a t e r
a . F low P a t t e r n Cel l D iag ram (Side Cutaway)
Liquid c r y s t a l t apes
Insulat ion
15 p s i Argon g a s
H e a t e r post (0.635 cm d i a m e t t r )
b. Radial Heating Cel l D i a g r a m (Side Cutaway)
Figure 3 , Details of the
Magnes ium Chips 7
Teflon cove re
Krytox 143AA
I 3.81 crn +/ c. Linea l Unit D i a g r a m
Apollo 17 Heat Flow and Convection Experiments,
9

TABLE 1. PHYSICAL PROPERTIES OF APOLLO 17 AND 14 FLUIDS
Water
a. Krytox 143AZ and 143AA are DuPont trade names for a series of perfluoroalkylpolyester oils. These oils were chosen because they met flight safety requirements.
b. The actual fluid used in the Apollo 14 and 17 Flow Pattern Experiments consisted of the following mixture: Krytox 143AZ plus 0.15 percent by weight fine aluminum powder (Alcoa grade 422) and 1/600 by volume Krytox 157 (a surfactant to keep the aluminum particles suspended).
Notes: T - temperature p - density p - coefficient of viscosity v - kinematic viscosity k - thermal conductivity
a - thermal diffusivity p - volumetric expansion coefficient C - specific heat
P
P r - Prandtl number (= X)

dm
0
0
OF
: n]
C?. *cy
O,
m
$2
2 2

(43 :0 1 :32 GET) TIME IN S E C O N C S Z Direction
Figure 4a. Gravity level in z direction of the HFC apparatus.

(45:01:32 GET) TIRE IH SECONCJ X Direction
Figure 4b. Gravity level in x direction of the HFC apparatus.

TIHE I N SECONCS
Figure 4c. Gravity level in y direction of the HFC apparatus,
Y Direction

coated with liquid crystal material and covered with clear plastic. An adhesive is coated on the back of these tapes so that they can easily be applied to a aur - face for temperature measurement. By varying the composition of the rom- pounds used in the tapes, different temperature response ranges can be achieved. The temperature response of the tapes i s unaffected by small pres- sure variations and low-g environments (see Appendix A ) .
Each identifiable color actually represents a segment of the total response range of the crystal. For instance, if a liquid crystal tape has a range of 30 to 36" C, then amber might represent 30 to 33"C, green 33 to 35'C, and blue 35 to 36" C. By using the leading edge of a color band as a reference point, temperatures can be determined with a good degree of precision. This is illustrated in Figure 5.
Movement of Color Bands
Heat -
Figure 5. Illustration of color bands in a liquid crystal tape.
The liquid crystal tapes used on the Apollo HFC were obtained from Hoffmann LaRoche Company. The crystal tape designation and the manufac- turer 's nominal temperature ranges a r e shown in the following table. Figure 6 shows the locations of these tapes on the HFC unit, and Table 3 gives precise calibrated temperature values.
Data from the experinlent were in the form of a 16-mni filni taken at 1 frame/sec. From this film, color position versus time could be obtained for each crystal in the cells. Also the initial colors of each crystal at the

( L i n e a l Cel l )
( U n i t T e m p e r a t u
( R a d i a l Cel.1)
Figure 6. Location of liquid crystals on Apollo 17 HFC.
beginning of each run were determined, thus giving initial and ambient tem- peratures within the test cells.
The theory of utilizing liquid crystal tapes to determine the tempera- ture of a surface was considered in the Apollo 14 HFC research and development work. Both isothermal (the case of a surface which is slowly heated o r cooled over its entire area) and dynamic (the case of a surface being heated o r cooled such that a temperature gradient exists in the surface) studies were made [9], and a technique for calibrating liquid crystal tapes for the application of map- ping convective heat transfer was developed. In the present study, more extensive calibration studies were conducted. The details of these studies a r e given in Appendix A. Table 3 presents both the isothermal and dynamic tem- perature values fo r the Apollo 17 liquid crystal tapes obtained in the calibration studies. The accuracy of the calculated theoretical curves se t the accuracy re- quirement of the liquid crystal tapes approximately a t rt lo C. Assuming the precision e r r o r reflects the accuracy e r ro r of the liquid crystal tapes, it can be seen from Table 3 that the accuracy of the liquid crystal tapes falls well within the required limit.
A number of ground tests were conducted to ascertain the e r r o r associ- ated with liquid level height in the Flow Pattern Experiment. The procedure followed to determine the e r r o r consisted of measuring the height of the liquid

T A B L E 3 , VALUES OF LIQUID CRYSTAL DYNAMIC A N D I S m H E R M A L TEMPERATURES
Isothermal Temperatures
Yellow Green

introduced into the Flow Pattern pan with a microheight gauge to wh ich a needle was attached, The needle gauge facilitated locating the f r e e liquid s u r - I-ace. Liquid was introduced into the Flow Pat tern cell according to directions given in the Operating Procedures document [12]. These directions a re : Rotate FLUID INJECT CW evenly and slowly until liquid Is just sighted en ter - ing the pan. Slowly continue rotation exactly four revolutions CW. The HFC apparatus was designed s o that four revolutions CW would resul t in a nominal liquid layer depth of 2 mm. The measurement obtained by four different observers is shown in Table 4.
TABLE 4. MEASURED LIQUID LEVELS IN FLOW PATTERN CELL
Root Mean Square E r r o r : * 0. 09
The Radial and Lineal Heating Experiments were run concurrently, The astronaut, a f te r tight setup and camera start, si1111)l.y turned the operc?- tions swi t e l~ to start the heat, Heating co~~tintlecl for 10 min du r i l~g whieh t ime

the color changes on the l iwid crystal tapes and any r~iagnesiuni particle rnove- nlents in the Lineal cell were photographed by the motion picture camera, Photography of the color changes on cooldown continued for 2 min after the heat was stopped.
Upon completion of the Radial-Lineal run, the cover on the Flow Pat- tern unit was opened. The flow valve was then opened and the fluid inject lmob was turned slowly four complete revolutions. Four turns of the knob allowed sufficient Krytox oil to flow into the pan to give a 2-nim deep layer of oil over the bottom of the pan. The bottom of the pan was constructed of aluminum which is wet by the oil. Spreading of the oil when f i rs t injected into the pan in zero-g was caused by adhesion forces. The oil layer was constrained to maintain an approximately flat surface in zero-g by small side baffles (pig. 2). After the oil was injected, a waiting period of 2 niin was allowed to permit fluid motion introduced by pumping to damp out. After this period, the heat was turned on and subsequent motions were recorded on film. The experiment ran 1 5 min. A total of 2 nlin of ccoldown time was also photographed.
The complete sequence of experiments was repeated at a later time. The only difference between the two sequences was that a layer 4 mm deep rather than 2 mm deep was heated in the Flow Pattern Experiment.

I t I, FI - iGHP RESULTS
A. Flow Pattern Experiment
Cellular convection was observed in both the 2-mm and 4-mm deep layers . Before the photographs of these figures a r e contemplated, however, it i s well to keep in mind that the layers of fluid in which the convection devel- oped were not perfectly flat. In filling the pan p r io r to the performance of the flight tes t , it was discovered that sizeable a i r bubbles somehow had been intro- duced into the tes t fluid. The cause of the bubbles is not known. No trouble with s izeable a i r bubbles had been encountered in the Apollo 14 HFC test. Because of the bubbles the designated number of turns of the fluid inject knob failed to completely cover the bottom of the pan. Astronaut Ron Evans, a f t e r conferring with the Principal Investigators on the ground, then injected m o r e fluid until the bottom of the pan was completely covered. In doing so, he probably injected more fluid than the baffle could constrain to a reasonably f la t surface. Astronaut Evans reported that the layer of heated oil was convex in shape a s shown in the sketch below. He estimated that the thickness in the center was twice the baffle height.
Bottom of Pan
Some difficulties resulted in a convex shaped layer in the 4-mm case also. Exact fluid depths in the Flow Pat tern tes t s a r e , therefore, not linown.
1. While discussing the bubble problenls with the Principle Investigators on the ground, two nlethods of circumventing the difficulty were conceived and attempted. P r i o r to the 2-mm run, Astronaut Evans attempted to puncture the bubbles with his pen. The bubbles moved to one s ide o r the other, resulting in no bubbles being eliminated. The second method was attempted between the 2-mm and 4-mm runs. In this approach, the fluid was pumped back into the reservoi r and the bubbles tended to remain in the dish, Astronaut Evans wiped the dish clean a t a point when about 80 percent of the fluid had been returned, Thus, only a few bubbles remained in the 4-mm run and a r e believed by the authors to be the origin of the two regions of s lnal ler &nard cells in the 4-mm run, hbpollo I4 k t r o n a u t Stuar"coosa was in the control room during this time period on ApoiXo 17 and proved to be an invaluable asset an running th r s experiment,

Figures '7 and 8 show the types of convective cells observed in the Apollo 17 Flow Pat tern Experiinent. Figures 9 and 10 show the types of cells obtained in ground tes t s , F o r comparison the type of convection cell obtained in the Apollo 14 NFC Flow Pat tern Experiment is shown in Figure 11,
The t ime intervals between when the heat was f i r s t turned on and when convection was f i r s t noted a r e tabulated in Table 5.
Conduction temperature profiles a t the t ime of convection onset were calculated by means of a computer f o r various cases . (see Appendix B fo r details of the modeling. ) Figures 12 through 15 a r e typical of the types of temperature profiles obtained. I t can be seen that the temperature profiles a r e somewhat curved (nonlinear) instead of being s t raight l ines (l inear). F r o m these curves i t i s possible to determine a n overall temperature drop through the layers; i. e . ,
Knowing the AT then enables calculation of appropriate dimensionless numbers. (see Appendix B fo r definitions and discuss ions of various dimensionless num- be r s used in the present study.) The relevant numbers of interest he re a r e the Marangoni number, Ma, and the Rayleigh number, Ra. These numbers for the various cases of interest a r e given in Table 6 (for a flight nominal gravity level of 10-' g ) .
e
Average cell s i ze s were obtained by determining f rom a photograph, with a planometer, the a r e a of each cell. The a r e a s were then averaged and an average diameter was determined f rom the average a r e a , assuming the cells were c i rcu lar in shape. The a r e a s and cell diameters determined in this way a r e given in Table 7.
The manner in which cellular convection developed i s summarized in Table 8. The data presented indicate that the side baffles fo r retaining the 2-mm oil layer did not exer t any appreciable effect on the observed convection in the 4-mm layer ,
The presence of bubbles in the tes t fluid apparently influenced the manner in which cellular convection began. Although it was not evident f rom the film record , Astronaut Evans reported that in the 2-mm case each bubble looked like the locus o r the s t a r t of a cell. In the 4-mm case , only a few bubbles were visible and these did not seem to exer t any appreciable influer~ce

Figure 7. Convection cells obtained in 2-mm deep oil during Apollo 17 flight (14 nlin 19 s e c after convection onset,
9,s-Vii heating rate) .

Figure 8. Convection cells obtained in 4-nim deep oil dur ing Apollo I7 fiight ( L O min 55 sec af ter convection onset,
5-VtT healing mte) .

Figure 9. Convection cells obtained in 2-mm deep oil in ground test (14 niin 20 see after convection onset,
7. 5-%I heating ra t e ) .

Figure 10. Convection cells obtained in 4-mm deep oil in ground test (10 min 43 see after convection onset,
5-W heating rate) .

Figure 11. Convection cells obtained in Apollo 14 HFC Experiment (7.4-W heating rate, liquid volume sufficient to give 2-mm layer on ground).
TABLE 5. FLOW PATTERN CONVECTION ONSET TIMES FOR APOLLO 17 AND GROUND CASES
Onset Times
48-60 sec
Ground Tests


I _- 0 0.8 1.5 2.4 3 . L 4.0
Depth . ); (12111-L)
Figure 13. Computed thermal profile through 4-mm Krytox layer 48 sec after application of heat.


Q = 5.18 wat t s
y = 4.0mm
To - Tarnb = 2 0 . 5 ~ ~
t = 2 rnin.
Depth, y (rnm)
Figure 15. Computed thermal profile through 4-mm Krytox layer 2 min after application of heat.

TABLE 6, MPaWNGOISI AND RAUEEIGW NUMBERS AT FLOW PATTERN CONVECTION ONSET
2-mm Case 4-mm Case
Ground Test 2-mm Case
TABLE 7. APOLIAO 17 CONVECTION CELL AREAS AND DIAMETERS
2-mm Case 4-mm Case
Ground Tes t 2-mm Case 4-mm Case
upon the observed convection. However, Astronaut Evans reported that when upon completion of the test he pumped oil out of the pan he noticed two bubbles attached to the surface of the pan.
In view of these observations concerning bubbles, a ground tes t was conducted in which a pan of fluid, of the same composition a s used in the flight test, was put in a vacuum chamber. The chamber was evacuated and pumping was continued until no evidence of dissolved a i r remained. The fluid was then heated from below. No differences in convection onset times o r manner of convection onset, a s compared to aerated fluid, were noted. It may, thus, be concluded that although the bubbles influenced convection onset t imes and onset manner somewhat, there was no major effect,

TABLE 8, APOLIJO 1'7: MANNER OF CELLULAR C ONVE CTlON ONSErY
Apollo 17 2-nzm Case 7. 5-W e Polygonal cells s t a r t in center of pan f irs t .
Heating Side roll about a second later. Cells invade side roll about 3 min 28 s e c later,
4-nim Case 5-W e Large circular cells which subdivide into Heating smaller cells.
ta Side rolls and center polygonal cells form a t the same time.
e Cells eventually fill entire pan.
Ground Tests 2-mm Case 4-mm Case
7 . 5-W a About same size cells a s a t low heating ra te Heating Flows a r e faster, however.
Rings f irs t form around edge which then break down into cells. Cells appear in center last.
Apollo 14 Case Fluid volume Polygonal cells form in 8 min in thin center sufficient to layer. Cells toward edge of pan form about form 2-mm 23 sec later. layer on ground. Fluid depth in center of pan about 0. 25 mnz.
B. Radial and Lineal Heating Experiments
Figures 16 and 17 a r e typical of the curves obtained from the motion picture film of the Apollo 17 Radial Heating Experiment, The solid theoretical curves were calculated by conzputer assuming that conduction and radiation a r e the only forms of heat transfer present. A discussion and evaluation of possible e r r o r s associated with the experimental curves a r e given in Appendix C. Details of the thermal modeling and a full s e t of teniperature-time curves a r e given in Appendix D. For comparison a siniilar typical curve obtained from Apollo 14 H F C is shown in Figure 18,


Figures 19 and 20 a r e typical of the curves obtairned from the Apollo 17 H F G motion picture film of the Lineal Heating Experirnent. A s in the Radial Heating Experiment, the solid theoretical curves a r e the theoretical conduetion- radiation curves. Details of the thermal modeling of the Lineal cell a r e given in Appendix D along with a full s e t of flight curves. F o r comparison, a s imilar typical curve obtained from the Apollo 14 Zone Heating Experiment i s shown in Figure 21.


V INTERPRETATIONS
A. Summary of Interpretations
Flow Pat tern Experiment
e The s i ze s of the observed surface tension-driven convection cel ls agree fairly well with those predicted by linear analysis of surface tension- driven, cellular convection.
e Convection occurred a t lower temperature gradients in low-g than in one-g. Surface tension and gravity, therefore, apparently do not reinforce each other in a manner predicted by one analysis of cel lular convection.
e The Flow Pat te rn Experiment data substantiate in principle the postulate that gravity modulates cel lular convection onset.
e The onset of a concentric side roll and center polygonal cells in the Flow Pat te rn Experiment occurred a t about the same time. The occurrence of a roll is contrary to expectations based on latest l i terature. The observed onset pattern tends to confirm an e a r l i e r view that rol ls a r e side wall effects and a r e not particularly character is t ic of the driving mechanism.
Radial and Lineal Heating Experiments
e No significant convection was observed in the Radial o r Lineal Heat- ing Experiments. The data , however, validate the accuracy of the measuring technique and allow the conclusion that:
e The convection observed in the Apollo 14 Radial and Zone ce l l s was probably caused by HFC unit and spacecraft vibrations.
B. Flow Pat tern Experiment
Briefly, the Apollo 14 Flow Pat tern Experiment showed 1101 :
e Surface tension alone can drive cellular convective flow of visible magnitude.
e A cri t ical temperature gradient i s required f o r surface tension- dr iven cel lular convection.

e A polygonal eellubar pattern is preferred for surface tens ion-dr iven convection in a thin liquid layer of u~liform thicltness.
e A low-g, edge type, surface tension-driven eonvection is caused by a radial temperature gradient.
Because the Apollo 17 experiment produced more quantitative data, more rigorous comparisons with theory a r e therefore possible. In the fol- lowing discussions the Apollo 17 data a r e compared to the predictions of a number of theories. It is found that the size of the observed Apollo 17 convec- tion cells a re in fair agreement with the predictions of Pearson's theory [I41 . The observed Apollo 17 convection onset times, however, indicate that, con- t r a ry to Nield's theory [I51 , gravity and surface tension a r e not coupled in a manner that would result in strong reinforcement a t all convective wavelengths; i. e . , if the cells caused by gravity and by surface tension tend to be the same size, then they tend to annul fluid motion. If the cell sizes tend to be consid- erably different, however, then gravity and surface tension tend to reinforce motion. Although the determinants of possible cell size at present a r e not well understood, the dimensions of the container and the fluid depth a r e prob- ably two of the most important. The latter interpretation derives from the theories of Scriven and Sternling [I61 and of Sniith [I71 which take into account possible surface deformations.
Before comparisons with theory a r e discussed, it may be well to men- tion that the mean lo-' g gravity level obtained during performance of the
e Apollo 17 HFC Flow Pattern Experiment was much too low to have caused the cellular convection observed. The value of the critical Rayleigh number, which must be exceeded for gravity-driven cellular convection to occur in a layer of fluid heated from below, is on the order of 513. (See Appendix B for a discussion of diniensionless numbers. ) In the Apollo 17 case, the Rayleigh number at the time convection was seen to occur was on the order of lo-'. Thus, the Apollo 17 cellular convection was driven by surface tension alone. The Apollo 17 data, therefore, can serve to yield information not only on the nature of pure surface tension-driven convection but also on the manner in which surface tension couples with gravity on earth.
1. . We consider here Pearson's and Nield's theories of cellular convection. Pearson's theory deals with cell- ular convection driven by surface tension alone. Nield's theory takes into account surface tension and gravity. Both theories quire that the tempera- ture gradient through the liquid be linear at the onset of convection, as shown in the following sketch.

l inear t empera tu re gradient
non-linear t empera tu re gradient
To achieve linear temperature profiles in actual practice, very slow heating rates a r e used. In the Apollo 14 and 17 Flow Pattern Experiments fairly substantial heating rates were used. Pearson's and Nield's theories also assume a rigid nondeformable liquid surface. This assumption is usually not realistic. The surface of a convecting layer of Icrytox oil does show con- siderable deformation [ 5 ] . A further assumption of both theories is that the layer of fluid being heated is infinite in extent. The theories of Pearson and Nield, therefore, a re not strictly applicable. They do serve, however, as points of comparison. The effects of side walls, temperature nonlinearity, and surface nondeformability on the predictions of Pearson's and Nield's theo- ries a re considered subsequently.
The theoretical predictions of Pearson's and Nield's theories are pre- sented in Table 9 in summary form.
A comparison of Pearson's prediction of the values of the critical Marangoni number and the cell size for the conditions of this experiment t o the Apollo 17 results is presented in Table 10.
It can be seen that the observed cell sizes compare quite well with those predicted by Pearson's theory. The observed values of the critical Marangoni number, however, a re higher. The given observed values, how- ever, should really not be compared to Pearson's predicted value because the observed values were calculated from nonlinear temperature profiles as dis- cussed in Section 111.
Nield's theory would lead to the expectation that the onset of convection would occur later (at larger temperature differentials) in the zero-g case than in the one-g case. According to Nieldts theory the convective driving forces of surface tension and gravity reinforce each other. Actual data showed just the reverse trend. Table 11 summarizes the actual comparisons.
The Apollo 17 data indicate that surface tension and gravity do not rein- force each other, Surface tension and gravity apparently work against each other , Before any conclusions can be reached r e g a r d h g Nield's theory, a nurnber of other considerations need to be discussed because Nield's theory has received experimental verification [ l 8 j in one-g conditions when very slow

TABLE 9, SIJMMARY OF THEORETICAL, PREDICTIONS OF CELLULAR CONVECTION
e Value of critical Marangoni Number ( ~ a ) 80.
o For a given temperature gradient a critical liquid depth exists.
4 nd o Diameter of convecting cell, Q X 1.732)
o Presence o r absence of convection depends on direction of temperature gradient.
Nield's Theory
Gravity and surface tension couple in a manner such that convection is easier to initiate when coupling is present than when it is not.
e Presence of convection possible when heating from above o r below.
TABLE 10. COMPARISON OF APOLLO 17 FLOW PATTERN RESULTS WITH PEARSON'S THEORY
Critical Marangoni Number
Diameter of Convecting Cells


beating rates were employed. The Apolto 1'7 data, therefore, can only mean that nonlinear o r boundary effeets not included in Nieldfs theory a r e responsible fo r the observed nonreinforcement of gravity and surface tension.
In the following paragraphs some possible influences which could mod- ify the conclusions of Nield's theory a r e considered.
realistic boundary conditions and of fluid properties on the values of the criti- cal Rayleigh and Marangoni numbers. The effects of quantities such as the Prandtl number, Biot number, aspect ratio, heater versus fluid thermal con- ductivity, and sidewall conditions have been considered in varying detail. Table 12 gives values of various dimensionless parameters for the Apollo 17 case. Assuming that a linear temperature profile exists in the fluid layer,
TABLE 12. APOLLO 17 CONVECTION DIMENSIONLESS
Biot Number
Crispation Number
a. See Appendix B for definitions of the various dimensionless parameters.
b. Fluid consists of Krytox 143AZ oil a t a depth of 2 mm. Physical properties evaluated a t 38°C (100°F).
e , The symbol li represents thermal conductivity, The heater material is aluminum,

the preceding parameters and tlte Apollo 17 lso~rndary conclitions result in a critical Marangoni n~xmlser of 115 [17, 191 and a mitical Rayleigh nul1il3er of 513 /20] . With the exception of Bentwich [19] , no theoretical o r e ~ p e ~ i n i e n t a l studies were found in the literature regarding the edge effects (aspect ratio and sidewall thermal conditions) on cellular niotion induced by surface tension forces. Thus, the preceding value of the Marangoni number does not include possible edge effects. (See Appendix B for a further discussion of these effects on criticality conditions. )
Although the critical Marangoni nuillber is raised from 80 to 115 when more realistic fluid properties and boundary conditions a r e considered, the observed flight values of 400 (2-mm layer) and 1320 (4-mm layer) and ground values of 787 (2-mn~ layer) and 2341 (4-mn~ layer) a r e still quite a bit higher. Existing theories of fluid property and boundary condition corrections, there- fore, cannot account for the discrepancies.
One other possible explanat.ion for the increased AT required on the flight test is the unsteady gravity level or g-jitter which existed. Previous investigations of heating-from-below problems have shown that time-varying gravity increases the critical Rayleigh number [21, 221 .
3. To assess the effect of tem- perature nonlinearity on the predictions of Pearson's and Nield's theories, the conclusions of a number of papers dealing with this topic were considered. A summary of these conclusions is presented in Table 13.
An examination of the various conclusions presented in Table 13 indi- cates that the theoretical situation is contradictory and unsettled. On the basis of the experimental papers, however, it can be concluded that a finite heating rate sufficient to cause a nonlinear temperature profile prior to the onset of convection probably would cause both the critical Marangoni and Rayleigh numbers to be larger than predicted by linear theory. The larger critical Marangoni numbers (compared to Pearson's prediction) obtained in the Apollo 17 Flow Pattern Experiment are , therefore, explainable on this basis. An exact analysis does not exist, unfortunately, for the case of surface tension- driven convection caused by relatively fast heating from below. Quantitative comparisons, therefore, cannot be made at present.
Temperature nonlinearity, on the other hand, does not seen1 a likely explanation for why the data of Table 11 are not in accord with expectations derived from Nield's theory. Experimental data indicate fast heating increases the critical Rayleigh and Marangoni numbers, Thus, if surface tension and

TABLE 13. SUMMARY OF LITERATURE CONCLUSIONS REGARDING NONLINEAR TEMPERATURE PROFTT,FIS
Berg et al., 1966 [25]
Debler and Wolf, 1970 [261
Sparrow, Goldstein, and Jonsson, 1964 [20]
Soberman, 1959 1271
Davenport and King, 1973~
Experimental
Theoretical
Experimental
Theoretical
Theoretical
Experimental
Experimental
l a. Davenport, I. F. ; and King, C. J. : An Experimental
Submitted to J. Fluid Mechanics, September 1972.
Assumptions or Boundary Conditions
Surface tension only driving force
Nondeformable surface Infiiite layer Cooling from above Evaporative cooling
I Gravity only driving force Heating from below Infinite layer Two rigid bounding surfaces
Evaporative cooling
Surface tension and gravity driving forces
Heating from center Nondeformable surface
Gravity only driving force Free upper surface Rigid upper surface also
considered Heating from center
Rigid upper and lower surfaces Heating from below
Surface tension and gravity No meniscus effects Cooling from above
I Study of Convection Initiation in Deep Pools.
Conclusions
Nonlinearity increases critical Marangoni number over that obtained in linear case
Temperature nonlinearity increases critical Rayleigh number
Nonlinearity increases critical Marangoni number
Nonlinearity decreases both critical Rayleigh and Marangoninumbers
Nonlinearity decreases critical Rayleigh number Rapid heating decreases critical Rayleigh number
Faster heating increases critical Rayleigh number
Nonlinearity increases critical Marangoni number to infinity

gravity reinforce each other, as Nield would have it, convection in the zero-g ease should have started later, not sooner, than in the one-g case,
4, Effect of Surface Deformations. Two theoretical papers [16, 171 have investigated the consequences of Pearson's and NieldPs assumption of a nondeformable liquid-gas interface. A summary of the conclusions of these papers is given in Table 14.
The matter of the influence of surface deformation on the stability of a heated layer was considered briefly in still another study [51. In that study i t was pointed out in Nield's result that surface tension and gravity reinforcing one another appears reasonable in light of the assumption made by Nield that the surface is nondeformable. When the surface deflections resulting from surface tension and from gravity- driven flows a re considered, however, Nield's conclusion seems contrary to expectation. For example, a represen- tation of the flows as viewed from t.he side and occasioned by gravity and by surface tension is shown in the following sketch [281.
Cold Cold u ,t
S u r f a c e T e n s i o n - D r i v e n F l o w s G r a v i t y - D r i v e n F l o w s
As can be seen the deformations in the hot areas and the deformations in the cold areas a r e exactly opposite. A nulling action rather than a reinforcing action would thus be expected. The matter of possible cell size, however, was not considered in the cited study.
In the papers of Scriven and Sternling and of Smith the matter of possi- ble cell s ize is considered. The manner in which cell sizes a r e discussed in these two papers, however, is in terms of fluid stability to disturbances of a certain wave number. A footnote in the Scriven and Sternling paper notes that [ 161

TABLE 14. SUMMARY OF ASSUMPTIONS REGARDING SURFACE DEFORMABILITY
Assumptions
o Nondeformable surface o Infinite layer
o Nondeformable surface o Infinite layer
o Deformable surface e Infinite layer
e Deformable surface o Infinite layer o Effect of gravity on
surface deformation cons idered
C onclus ions
Critical Ma needed for convection onset
o +g reinforce each other
No critical Ma needed for convection onset
Critical Ma needed for convection ons et

"for ordkalry liq~licfs in Izorizo~ital layers 1 rnrn or more deep the action of gravity becollies significant for wavelengths exceeding about 5 rnm and could very well stabilize disturbances of longer wavelen@h if the free h terface is on top* l t
The quote is translated to mean that if cells of more than 5-mm diameter tried to form, gravity would damp them out. In a zero-g condition, however, form- ation of larger size cells would meet with no interference from gravity. Smithts analysis confirmed Scriven and Sternlingts expectation that gravity would stabilize a system with a free upper surface.
The observed easier onset of convection in the Apollo 17 case a s com- pared t o ground tests is, therefore, in general accord with Scriven altd Sternling's and Smith's analyses. The fact that a finite time was taken for convection onset means that a critical Marangoni number still exists. The existence of a critical Marangoni number in the flight case is probably the result of the fact that the layers in the flight case were not infinite in extent so they, therefore, could only accommodate convection cells of certain large sizes. These sizes, however, would have been damped out in one-g conditions. In a recent telephone conversation, Dr. Scriven expressed agreement with this interpretation.
The fact that Nieldts theory, as has been mentioned previously, has been experimentally verified under one-g conditions must mean that gravity and surface tension reinforce each other when the possible gravity cells a r e much larger than the possible surface tension cells. The reinforcement must operate somewhat in the manner shown below.
Cold H o t Cold
S i d e C e n t e r Side
If both the gravity and surface tension cells were the same size, they would cancel flow.
5. The manner of convection onset is summarized in Table 8. One of the most notable features

of the onset noted in the Apolko 17 ease was the forniation of both rolls and polygonal cells, A number of papers have appeared whieli deal with the subject of what determines the shape of the convection cells. Ln a circular pan such as was used. in the Apollo 14 and 17 experiments, only two types of cells need concern us: concentric roll cells and polygonal -- tending toward the hexag- onal - cells. The situation regarding the determinates of cell shape is rather confused because linear theories do not predict cell shapes and nonlinear theories a r e fraught with difficulties. The general consensus in the literature is that rolls a r e associated with buoyancy-driven convection and polygons pri- marily with surface tension [29]. Koschmieder [30] contends that the rolls a r e caused by the lateral wall and a r e not particularly determined by the driving force. Koschmieder further holds that if the temperature were carefully con- trolled above the oil-air interface, polygonal cells would not form immediately. Rolls would first develop which would then break down into polygonal cells. The topic is of enormous importance to the theory of cellular convection. It would therefore, be extremely worthwhile to repeat the Flow Pattern Experi- ment under carefully controlled conditions at the upper free surface to see whether convection f i rs t begins with a pattern of rolls and then breaks down into polygons. Such conditions probably will exist on the proposed Space Shuttle.
The fact that cellular convection started in the cell center as well a s in the rolls after a short period of time is in accordance with the Apollo 14 HFC observations. In the case of the Apollo 14 HFC, however, such a large menis- cus was present, a s shown by the sketch, that the observed edge convection was probably not related to the observed center cellular convection.
H e a t e r
Shape of Apollo 14 Flow P a t t e r n Oil L a y e r
C. Radial Heating Experiment
The fact that the form of Apollo 14 temperature-time curves differed from those of Apollo 17 can be attributed to the presence of convection on Apollo 14 and the lack of convection on Apollo 17. A number of causes for the observed Apollo 14 convection a r e possible. These are:

e Gravity (buoyancg~ convection).
@ Fluid thermal expansions (thermoacoustic convection).
ea N F C unit and spacecraft vibrations (random convection).
e Coupled forces.
In the following discussions the experimental conditions for the Apollo 17 and 14 cases a re compared to provide evidence for identifying the probable con- vective force. The comparisons indicate that greater spacecraft vibrations on Apollo 14 than on Apollo 17 a r e the most probable explanation for the observed data.
1. Buoyancy Convection. With regard to gravity-driven convection, the Radial unit is a "heating from the side" problem. A s described in Appen- dix B, there is no critical Rayleigh number ( ~ a = 0) so far a s fluid motion is
C
concerned. There remains, however, a critical Rayleigh number above which heat transfer rate increases appreciably. There is also a critical Rayleigh number above which small vortices occur in the corners of the container. This effect, however, does not alter the heat transfer rate appreciably as com- pared with conduction 1311 . Marangoni criteria for this experiment a r e irrel- evant because no fluid-fluid interface exists for surface tension to become a significant driving force.
Experiments have been conducted on the ground for a gas confined in a rectangular container having isothermal vertical walls a t different temperatures and insulated top and bottom plates [321 . The critical Rayleigh number was found to be
where H is the height and L is the length of the container. This result agrees with the theoretical prediction of Batchelor [311. The preceding rela- tion can be used to estimate the degree of buoyant thermal convection occurring in this experiment. This estimation must be considered an order-of-magnitude analysis, however, because the system investigated and the fluid a re not quite the same. A comparison of the theoretical critical and existing Rayleigh num- bers for the flight experiment is, assuming a nominal gravity level of 10-' g.
e 9 as foI10ws:

Ra of Apollo 17 Raclial Celk During Flight Experiment 32 X
R a Theoretical 400 C
These numbers were based on the radius of the cell. The average properties of argon for the temperature range of interest and the maximum temperature gradient possible in the cell were utilized. The .maximum possible tempera- ture gradiepts were generated using the conductionlradiation thermal model., (see Appendix D. )
It is evident that
which means the likelihood of buoyant thermal convection was negligible in the flight test even when the temperature gradient was at a maximum. Further- more, the theoretical critical number indicates that a gravity level of a t least
g for the calculated temperature gradient is required to induce manifest e buoyant, thermal convection. Thus, i t may be concluded that sustained con- vection in the radial heating unit caused by gravity alone is unliltely, beczuse the maximum g-level never exceeded low6 g .
e
Convection sensitivity cri teria for the Apollo 14 Radial cell flight test indicate that Ra/Ra 2 2 X For the Apollo 14 unit, the properties of
C
C 0 2 were used and a nominal gravity level of lo-' g . Thus, it can be con- e
cluded that although buoyant thermal convection was more probable in the Radial unit of Apollo 14 than Apollo 17, the possibility of such convection in either case is negligible.
The preceding analysis is based on the use of dimensionless numbers and can only indicate order of magnitude. More precise information is obtained from computer calculations. In the course of other studies a general computer program was developed which allows calculation of convective effects caused by gravity and thermal volume expansions. This program is called the Lockheed General Convection Program (LGCP) . Details of the convection modeling used in this program a r e given in Appendix E. A convection analysis, using the computer program, was performed on the Apollo 14 and 17 Radial

cells in an attempt to explain the different behavior of the two flight experi- ments. The following paragraphs present the results of the computer analysis,
Runs were made for both the Apollo 14 and 17 cells with a constant g as a parameter. In addition, gravity oscillations o r g-jitter effects were exam- ined by inputting the actual time-varying gravity components into the computer program. The effects of thermal expansion convection alone were analyzed by using g = 0 . (see Section IV. C. 2 for an explanation of thermal expansion o r thermoacoustic convection. ) The results of these and other parametric studies a r e summarized in the following paragraphs.
The f irst cases studied consist of the Apollo 14 and 17 geometries and fluids at g = 0 . These cases were run to determine the magnitude and influ- ence of thermal expansion-driven convection in the absence of gravity. The results for both the Apollo 14 and 17 cells indicate very little increased heat transfer due to "thermoacoustic effects. " The average increase in the tern- perature at the liquid crystal s t r ip at t = 600 sec is of the order of 0.5 percent for the Apollo 17 cell and 1 percent for the Apollo 14 cell. This small differ- ence between the pure conduction values and the thermoacoustic convection values i s well into the noise level of any flight data talien. It can thus be con- cluded that thermal expansion convection alone contributed very little to the heat transfer in the Radial Cell Experiment.
The next cases analyzed consist of a simulation of the Apollo 17 H F C Radial cell at a constant level, g = los6 . Thus, both thermoacoustic and gravity-driven convection a r e possible. In addition, parametric cases were run with g = and g = 1 to determine the trends and magnitude of the effects of gravity on the Radial cell, The results a r e summarized in Figure 22. The temperature-time history of the crystal s tr ip a t r = 0.6 cm from the heater post is shown in Figure 22. The solid line is the pure conduction curve, and the circles a r e the actual HFC flight data. The g case, which is also shown a s the solid line, provided less than 1-percent change over the pure conduction curve. This reinforces the conclusion that no significant convec- tion occurred in the Apollo 17 Radial Cell Experiment.
The g = los3 and g = 1 cases show significant increases in the tempera- ture profile over that predicted by a pure conduction analysis. This increase in the temperature of the liquid crystal strips is a result of gravity-induced buoyant forces causing fluid circulation, thus transferring more heat per unit time to the "top" of the cell. It is interesting to note that the convection curves do not bend over with time, but appear to be continually rising at t = 600 sec. This is verified by examining the heater post temperature-time

Apollo 1 7 HFC - Radial Argon
1- 7 0.6 cn l
Convect ion / . = I
/ /
/ /-
/ '" Convect ion 3
/ / Conduct ion / m - ~ l s o
C o n v t c t ion
g = 10 - 6
Figure 22. Temperature versus time at r = 0.6 crn in the Radial cell for varying gravity levels.
profile which has also not flattened out at t = 600, but is still supplying heat input to the gas. It thus appears that a steady state was not approached during the Apollo 17 H F C Radial Cell Experiment.

The computer program provides contour maps of the thermal and flow fields at selected time points. Figures 23 and 24 are shown for the Apollo 17 Radial cell at t = 600 sec. Figure 23 is an isotherm map showing bands of constant temperature in the r-z plane. The interesting feature of this map is the effects of the heater post geometry. The cylindrical post does not reach the crystal membrane, thus leaving a "gas-gap" above the post. This is illus- trated by the contour map as the gas above the post is cooler than the post itself. Figure 24 is a contour map of the velocity field in the Apollo 17 Radial cell. Bands of constant velocity a re shown in the r-z plane. These contours do indicate that a recirculating flow was set up in this cell. The magnitude of the velocities, however, is of the order of 0.6 X cm/sec maximum. These a re not large enough to affect the heat transfer significantly.
0 nn nmnn nnnnn- nnnnnn
~ n n n n n n nnnnnn n~~~~~ nn nnnn nnnnnn nnnnnn nnnnnnn 00 nnne,n no nnnnn *In nnnn* nnnnnnn no nnnnn nn nnnnn nnnn*nn nnnnn-n nn nnnnn n* nnnnn nnnnnnn nn nnnnn on n n n n ~ nn n n n ~ n
*I nnnnnn n nnnnnn n "I nnnnn nnnnnnc: n nnnnnn nnnn"O0 n nnnnnn OOnnnnn n nnnnnn
nnnnen nnnnnn nnnnnn nnnnnn nnnnnn nnmnnn nnnnnn nnnnnn nnnnnn nnnnnn nnnnnn ~ ~ ~ C I ~ n nnnnnn nnnnnn nnnnnn
nnnnn nnnnn nnnnn n n n ~ ~ l nnnnn nnnnn nnnnn nnnnn nnnnn nnnnn nnnc.0 nnnn." nnnnn nnnnn nnnnn nnnnn nnnnn nnnnn nnnnn nnnnn nnnnn nnnnn nnn n n nnnnn nn0nn
0
- of Cell
L h
C h L L C h h
C L h L h L L h h C
C L C h C L
C C C C C L C L C C L L C L
C C C C C C
C L C C L C C L L Lht.
h L C L 0. L I. C r. C I. C L C C C C 0. L C C C L C C C L C C C h h
C C L C I- L C C C r- L C C C C C h C 0. L L C h C
0
Heater Post
Bottom -- of C e l l
Figure 23. Theoretical isotherm maps at t = 600 sec in the Apollo 17 HFC Radial cell
(1 indicates the lowest temperature, 9 the highest).

Heater Pos t
e ) m P I F I ~ ln00s - i
SiRCir i .I- 0 *
* M M L n m m U )
lll* M
m m Ut bl bl m M C
mm nr- U) L C C m hhr-
C C C
C C C C C F\ C C C
C C . h C * C * L Pt. c r e e A P C € =
P0P 0 0 -
e e Q - e o 0 0 * *
06-Q 0 ) P t . -e P O e *
P0P t.re e e e C 0 * 0 ) 0 Pee t.*e r e ) 000. Q C P 0 D t. 0 , - -6-r
P e - 0 oee-0 . * O D e * c e e o e e * e * . c e t . e * e e e
PD**e ***me OPt.
C C C C C C h C ,.C h,.CC,.C C C C C C C
n n n n n - n n n n
of Cell
Bottom
of Cell
Figure 24. Theoretical velocity contour maps a t t = 600 s ec in Apollo 17 HFC Radial cell
(1 indicates the lowest velocity, 9 the highest).
The same parametric cases were run for the Apollo 14 Radial cell with C02 a s the gas. The magnitude and trends of the thermal and flow behavior were very similar to the Apollo 17 case. Again, no significant gravity convec- tion occurred at the constant g level. The larger gravity levels also pro- duced similar curves to those shown in Figure 22. The convection curves, even a t g = 1, do not bend over as indicated by the Apollo 14 HFC flight data. The primary conclusion which must be reached from this analysis is that gravity at the g level, alone o r even coupled with thermal volumetric e expansion forces, could not have caused the type of behavior demonstrated by the Apollo 14 Radial cell data.

The effects of the g-jittcr were exar~zined by using n gravitg-versus- time curve in the computci. progr:ln>. An oscillatory profile, with varying aniplitude and frequency, was input and the case was run to t = 600 sec , For a nlaxinlunl ainplitudc of lo-" I?;, the oscillations made essentially no differ- ences in the prcdictccl tcmpcratiwc profiles. At this absolute g-level, the effects of varying fi*cqucncy wcrc 111so very negligible. This is not surprising since the constant g - lo-'' case also shows no gravity-driven convection. It can be concluded that the observed fluctuations in the gravity level did not affect the heat t ransfer processes on the Apollo 17 HFC Radial cell. (See Section IV. C. 3 for fui-thcr consideration of vibration effects. )
2. Thermoacoustic Convection. Convection caused by thermal volu- metric expansion forces has been referred to previously. Because this type of convection is generally unfamiliar, a short discussion of its origins and characteristics is given here.
In the absence of gravity, a mechanism for convection can consist of the following. A suddenly heated wall causes adjacent fluid to expand. This sudden expansion se ts up an acoustic wave which propagates into the fluid. Given a sufficient heat rate, container dimensions, and dissipative mecha- nisms, a thermoacoustic vibration can be sustained a s long as the appropriate boundary conditions a r e maintained. The conversion of heat energy into acoustic energy was discovered and defined by Sondhauss in 1850. The phe- noinenon of the conversion of thermal energy into acoustic energy is now called the Sondhauss effect. The effect may be simply demonstrated by the following a rrangeil~ent.
The end of the tube is open to the atmosphere. If the bulb i s heated with a bunsen burner, the tube will emit an audible sound; i. e . , i t sings. In open o r closed containers thermoacoustic waves can convect considerable heat from the heated site. The possibility was suggested that this type of convection might have been responsible for the form of the Radial and Zone curves

obtahed in the Apollo 14 HFC Experiments [bO] . Tl~ermoacorxstie convection has since been considered in some detail in a recent study [ 3 3 ] , In the eited study a computer program was written which allowed computation of the magni- tude of heat transfer by thernioacoustic convection. Calculations made with the computer prograin have been discussed in the previous section. The results of the calculations showed, as nientioned previously, that although the Apollo 14 case showed more thermoacoustic convection than the Apollo 17 case, both a r e almost negligible. Apparently, the heating rates used on Apollo 14 and 17 were not high enough to generate significant thermoacoustic convection.
3. Random Convection (spacecraft Vibrations). The possibility that spacecraft maneuvers, onboard machinery, and astronaut movement can cause convection in confined fluids was recognized [ 51 , but a method of approximat- ing the magnitude of onboard vibrations and of evaluating the subsequent effect on heat transfer was lacking at the time of the Apollo 14 data analyses. Recently, however, a paper by B. Gebhart was discovered 1341 that provides a theoretical basis for estimating how spacecraft vibrations may affect heat transfer. In Appendix F a brief review of this paper is given. In the following, the implications of the paper with regard to the present study a r e considered.
Fi rs t , to be able to make any sor t of judgment on the extent of random vibration, some indication of the frequency and amplitude of vibrations is required. Data on g-levels were obtained from the gyroscope rate data for Apollo 14 and Apollo 17. (see Section 11. ) From these data the frequency and amplitude of the smaller, regular oscillations were determined. These a r e approximately as follows.
Approximate
Apollo 17 20 sec 2 x los7 g e
Apollo 14' 200 sec 5 x lo-$ g e
The preceding data would lead to the expectation that vibrations were greater on Apollo 17 than on Apollo 14. Yet, time-temperature curves indicate
2. i s previously discussed, the calculated g-jitter on Apollo 14 did not include roll-rate contributions and was calculated from 30-sec time intervals a s com- pared to 2-see time intervals on Apollo 17,

that convection oeertrred on Apollo 14 and not on Apollo 17, It must, therefore, be concluded that g-data, as calculated from rate gyros, do not sufficiently indicate actual vibration levels at the location of the experimental apparatus. One reason for this is the relatively long integration time interval required to obtain a g-data point and the subsequent fact that variation of roll rates was not included in Apollo 14 g-data. On Apollo 14, however, a couple of a i r bub- bles were trapped in the Zone cell. By following the movement of these bub- bles it was possible to obtain more accurate information on the frequency and amplitude of the vibrations a t the location of the HFC unit. Figure 25 shows a typical curve of bubble displacement versus time. A g-jitter level sufficient to cause this displacement is estimated to be on the order of l o m 3 to l o w 4 g .
e From such curves it is estimated that the frequency of random vibrations dur- ing the Apollo 14 HFC Experiments was about 0.5 per sec with an amplitude of about 0.04 cm. According to Gebhart, the importance of random convection may be estimated by comparing the value of
with 1.0 (the pure conduction effect). The t e rm F is given by m
where a! is the thermal diffusivity, 7- is the period of the disturbance, and C
s is a significant dimension; C is a constant. Substituting the following n
values into the preceding formulas,
a! (for carbon dioxide) = 0.18 cm2/sec
1- = 2 sec C

Figure 25. Bubble displacement in Apollo 14 Zone Heating Cell versus time.
s (height of heater post in Radial cell) = 1. 8 cm
C (after Gebhart) = 1 . 0 6 1 n
gives

This number indicates that the heat transfer caused by random convection is some 3.2 times greater than that caused by pure conduction. The actual amount of convection heat which was estimated from the Apollo 14 data was between 10 and 30 percent over the pure conduction case. The preceding cal- culation is , of course, very approximate a s it is based on a very approximate estimate of the average disturbance period. The calculation does indicate, however, that even relatively long period disturbances can increase the heat transfer rate significantly. It, therefore, appears probable that the increased heat tra.nsfer observed in the Apollo 14 data was caused by HFC unit and spacecraft vibrations.
In contrast to the Apollo 14 case, very little vibration appears to have occurred during the Apollo 17 experiments. Movement of the magnesium par- ticles in the Lineal cell was tracked for selected periods of time. The mag- nesium particles showed much less variation in position than did the bubble in the Apollo 14 Zone cell. The magnesium particles, of course, were suspended in a moderately viscous fluid so they may not have responded to vibrations as easily as the bubble which was suspended in water. There are, however, several reasons for believing that the vibration levels were higher on Apollo 14 than on Apollo 17. Fi rs t , astronaut movement was much more apparent during the Apollo 14 tests than during the Apollo 17 tests. Secondly, the Apollo 17 experiments were done while the craft was on its way to the moon; the Apollo 14 experiments were done on the way back from the moon. The masses of the two spacecrafts at the time of the HFC Experiments a r e as follows: Apollo 14, 12 091 kg (without LEM); Apollo 17, 46 587 kg (with LEM). Vibrations on Apollo 14, therefore, were much more easily transmitted than on Apollo 17. Also, the Apollo 17 data were obtained immediately after a spacecraft stabilization correction, whereas Apollo 14 data were obtained a t a random time and during Apollo 14 it is suspected that the spacecraft was rolling and precessing.
From the computer program, a time-temperature curve was calculated assuming a g-jitter of ge. This curve along with the Apollo 14 flight

curve and curves calculated on the assuliiption of a eozastant g - loa3 g and e
g = 0 a r e shown in Figure 26. It can be seen that the g-jitter curve falls somewhat below the constant g-curve, bringing it closer to the flight curve. The shape of the curve, however, still does not bend as the flight curves a r e observed to bend. An interesting aspect of the g-jitter curve, however, is that the curve is not actually as straight as is presented in Figure 26. A def- inite undulatory character is just becoming evident. One of the most striking features of the Apollo 14 data was the presence of long period oscillations in the time-temperature curves. It is concluded, therefore, that the observed convection in the Apollo 14 Radial Heating Experiment was caused by random spacecraft vibration. It is most probable that if precise vibration data, including not only g-jitter but also apparatus rotation oscillations, were available, a calculated time-temperature curve could duplicate the observed Apollo 14 curves.
4. . The possibility that two o r more forces can couple and therefore can either reinforce or annul convection was considered in the Flow Pattern Experiment. In that case the relevant driving forces for convection a r e surface tension and gravity. In the case of the Radial and Lineal cells, the following combinations a r e relevant:
e Gravity and thermal volumetric expansions.
e Gravity and random impulses.
a. Gravity and Thermal Volumetric Expansions. A computer analysis of the Apollo 14 case showed no significant convection as the result of coupled gravity and thermoacoustic forces as mentioned previously. With the aid of the computer program, however, it was possible to do a parametric study to find the g-level a t which significant coupling would occur between gravity and thermal volumetric expansion forces. Figure 27 illustrates the results for a sample problem. Figure 27a shows the distance an isotherm would travel in 1 sec if the only form of heat transfer possible were conduction. Figure 27b shows the isotherms at 1 sec, assuming only thermoacoustic con- vection. In one-g, gravity forces a r e stronger and gravity completely deter- mines the convective pattern (Fig. 27c). At ge, gravity and thermo-
acoustic forces a r e comparable in magnitude, and it is at this g-level that coupling effects will be important for the conditions of heating, dimensions, and fluid properties used in the sample problem (Fig, 27d). It can be seen in Figure 27d that the coupling has the effect of bending the isotherms in such a manner as to increase the rate of advance at the top surface and decrease it at the bottom surface,


Values of dimensionless temperature
0 0.5 1.0 r
Conduction Only Solution
0 0.5 1.0
r
Solution with g = 1.0 ( g ' s )
Solution with g = 0
63
0 0.5 1.0
r
Solution with g = (g's)
Figure 27. Isotherm plots for a cylinder problem demonstrating the coupking of gravity and thermal expansion convection,

b. Gravity and Rand0111 I~ i~pulses . The effechof steady niechanical vibrations for various frequencies and amplitudes on heal transfer in confined fluids was studied by Pali et al. [35] . Based on experimental data, the follow- ing correlation was developed:
where
Nu = Nusselt number with vibration
Nuo = Nusselt number witl-lout vibration
Re = Reynolds number based on motion of liquid relative to the surface
Ac = dimensionless vibratory acceleration
Ra = Rayleigh number
L? = dimensionless frequency .
A plot of this relation versus Rayleigh number at a frequency of 120 Hz and a parameter of G = 5 is extrapolated to very low g-level Rayleigh numbers and is presented in Figure 28. The parameter G relates the amplitude and frequency of vibration of the base of the fluid container to the g-level of the environment. For the geometry of the container used by Pali et al. , the fluid is water, the container base vibrates with a frequency of 120 Hz and an ampli- tude of l o m 6 cm, the horizontal (to the g-direction) temperature gradient is 100" C , and g-level is lo-* . Figure 28 predicts an increase in heat transfer of 460 percent over vibrationless heat transfer. These results indicate the gravity and vibration forces couple in an anulling manner; i. e. , more heat is transferred by vibrations in the uncoupled case than in the coupled case,
The preceding discussion highlights the point that very little is linown about coupling effects. In the case of vibrations, gravity apparently has a damping effect on vibration effects. h a low-g environment, therefore, vibra- tions will be much more of a problem than they are on earth,


The agreement of the observed curves with the theoreti.ca1 conduction- radiation curves shows that no significant convection occurred in the Lineal cell, The Apollo 17 Lineal Heating Experinlent bears much the same relation to the Apollo 14 Zone Heating Experiment as the Apollo 17 Radial Heating Experiment does to the Apollo 14 Radial Heating Experiment. The conclusions regarding the observed Apollo 14 convection in the Zone cell, therefore, a r e the same as presented for the convection observed in the Apollo 14 Radial cell. (see Section IV. C. )

BMPLBCATIONS FOR SPACE PROCESSING
A s previously pointed out in the Introduction, convection studies in space a r e essential to establish the kinds and magnitudes of various forms of convection. Many types of convection have not been previously studied without the masking influence of ter res t r ia l gravity forces. Also, the sensitivity of processes to convection in space will vary according to the boundary condition of each process during the fluid state. It is a well published fact (by Boger and Westwater and others) that small amounts of flow rapidly increase heat and mass transfer. In fact, in most instances the relationship is a power function. In any given process: (1) convection may be totally eliminated, (2) convection may be suppressed to a given degree, o r (3) convection may be more control- lable in space (some processes will actually utilize convection in space). The Apollo 17 Heat Flow and Convection Demonstration, along with the Apollo 14 Heat Flow and Convection Demonstration, has served as a f i rs t step toward generating previously nonexisting data necessary in defining the effects of convection in certain typical space processing type applications. The basic implications of the Heat Flow and Convection Demonstration Experiments for space processing a r e as follows:
1. Free surface experiments a r e highly susceptible to Marangoni convection.
2. Generally gravity-induced convection in confined fluids having low viscosity, low thermal gradients (less than about 10" C/cm) , and 2- to 3-in. size containers is suppressed at g o r lower levels.
e
3. Gravity- induced convection in confined higher viscosity fluids is suppressed a t gravity levels somewhat higher than lo-' g (w l o w 3 ge) .
e
4. Gravity-induced convection is suppressed a t gravity levels of about g in systems having larger thermal gradients (greater than about 10" C/ e
cm) and/or having larger containers.
5. Low-gravity may lower the critical values for other types of con- vection; i. e. , fluids in low-gravity will react more easily to surface tension forces and vibration forces.
6, In most cases, convection will be suppressed to some degree - an advantage for space processing,

7. Some space processes require laininar convection, and low-gravity may be used to reduce irregular or turbulent convection,
8, The effects of constant gravity levels and vibration (g-jitter) each affect fluids in space in a different manner.
9. More research is required on convection phenomena in space in support of the Space Processing Applications Program, especially in the areas of vibration, surface tension, thermosolutal convection, solidification, and electrohydrodynamic.
To elaborate further on each of the above, perhaps the most surprising discovery of the Apollo 17 Heat Flow and Convection Demonstration Experiment was the 18-sec onset time from initial heating for the Marangoni flow to occur in the Flow Pattern test. A s previously discussed, this result was not expected. Theoretical work in this area led to the expectation that the onset times would be longer in space than on earth. The results, however, showed that vigorous convection appeared very quicltly a t only a few " C/cm (less than 10) in low-gravity. Many of the processes being planned for the Shuttle will employ f ree surfaces at elevated temperatures, meaning that even for da/dt's that a r e an order of magnitude lower than Krytox, Marangoni convection can still be anticipated.
An interesting point brought out by Astronaut Ron Evans on the Flow Pattern test was that the visible surface remained "as smooth as a perfect lens" during the entire length of the test. With respect to space processing, this astute observation by Astronaut Evans is significant because it means that deformations of the free liquid surface large enough to be visible can apparently be avoided even though the fluid is undergoing vigorous thermal convection and contains a number of bubbles, The actual amount of microscopic surface deformation accompanying the observed convection remains to be defined in future studies. The formation of a spherical segment having a "nearly perfect shape" in zero gravity is very interesting, and possible applications have often been mentioned by others.
Concerning the second implication, the observed convection in the Apollo 14 Radial cell and lack thereof in the Apollo 17 Radial cell is attributed to vibrations in the spacecraft whose equivalent g-jitter level is on the order of loe3 to lo"* g . Theoretical calculations show that significant convection
e occurs at these levels under the Apollo 14 and 17 boundary conditions whether o r not the g is a constant steady value o r a g-jitter,

'fhe third implication follows directly from the above; i, e , , more vis- cous fluids will raise tine gravity level that can be tolerated without inducing convection, From dinlensionless theory, the convection relationships to grav- ity (with all other factors constant) should be linear, Similarly, the fourth iniplication also connes from dimensionless analysis, as it can be shown that increasing the volume (same geometry) and/or increasing the thermal gradi- ents will increase the requirements for lower gravity levels to suppress gravity-induced thermal convection.
The fifth implication is a very serious one because, at low-gravity levels, normally observed thresholds for convections may change because of other forces. This makes predicting convections caused by other forces very difficult, The evidence for this effect is indicated in the Flow Pattern results. Effects similar to this in other areas of convective coupling could play havoc to some space processing endeavors. Despite the importance of this fact, this is one area of convection where theory is sadly lacking and where there is a near dearth of knowledge on the new forms of convection that can occur in low-gravity. The situation here is quite serious.
On the brighter side, the point is made in the sixth implication that even though the convection situation is not perfect, it can generally be expected that thermal convection will be reduced in space, bringing an advantage to most processes. It is a fallacy to assume generally, however, that zero con- vection conditions will exist.
On the seventh iniplication, a fact that is often overloolied is that con- vection is necessary in many manufacturing processes on earth. This does not mean that none of them a r e candidates for space processing. In space it is very conceivable that convection can be much better controlled than it is on earth because undesirable coupling effects with gravity-induced convection can be eliminated. Forced convection processes in space appear to the authors to be an untapped area for study in space processing.
The eighth implication i s a serious one. Vibrations drastically affect fluids. Some study has been made on the ground but extrapolation to low- gravity conditions is risky. More work is needed.
The ninth implication sums up the above to the conclusion that much more work is needed both on the ground and in space to develop a sufficient base of lcnowledge to elucidate the myriad of convection problems in space. A s one can see, very serious problems exist in the area of convection, as shown in the subject experiments. Secondly, there a r e whole areas of convec- tion yet unstudied in space, These iirclude therrrrosolukl, electrobjrdrody - namie, interfacial, coupling wi th solidification, coupling with nucleatlola, and a host of other GaeLors,

APPENDIX A
Temperature data from the Apollo 17 HFC were obtained by using liquid crystal tapes. The tapes used and the general method of obtaining tem- peratures from the tapes have been discussed in the body of this report, This appendix will describe the techniques used to calibrate the liquid crystal tapes and discuss in some detail parameters which affect their color/temperature response.
Two types of flight data were obtained: dynamic and isothermal. In the calibration procedures an additional type was obtained. This has been called equilibrium gradient data. These three types a re defined as follows:
Dynamic
Isothermal
- A color band moves indicating a moving temperature isotherm.
- The entire liquid crystal tape is at a uniform temperature and therefore a uniform color.
Equilibrium Gradient - A color band is stationary indicating a sta- tionary temperature isotherm.
It is essential to distinguish between the three because of the difference in an observer's ability to determine colors in each case, the difference in the number of distinguishable colors in each mode, and the varying degree each is affected by the parameters to be discussed in this appendix.
The liquid crystal tapes were calibrated according to the procedures described in Reference 9, Briefly, these procedures involved two basic types of ~pparatuses: one type used for isothermal tests and the other for dynamic and equilibrium gradient tests. The essential difference between the two is the positioning of the liquid crystal tape with respect to the heater. In the isothermal tests the tape was placed directly over the heater to give uniform heating; in the dynamic tests the tape was placed to one side of the heater to give a gradient in the crystal tape. This is illustrated in Figure A-1.
The procedure followed in both the isothermal and dynamic calibrations consisted of turning on the heater and observing the temperature of color changes both directly and with motion pictures.

crys ta l tape
heated plate
h ea Thermocouple Thermocouples
I so thermal Dynamic
Figure A- 1. Illustration of basic isothermal and dynamic concepts.
In all calibrations the following sources of e r ror were evaluated:
e Instrument Errors Thermocouple Attachment and Insulation Thermocouple Errors e eat Loss, Time ~ a g s ) Reference Junction Voltmeter Heater Configuration and Insulation
e Aging ( ~ i g h t , Air, Time)
Dynamic versus Isothermal
e Different Observers' Sensitivity
e Observation Technique ( ~ i l m e d versus Direct)
e Initial Temperatures
e Heating Rates
ta Heating versus Cooling
eb Previous Thermal History
~ B D Lighting
es Angle of Viewing
e Pressure and Gravity Effects
Instrument e r rors were found to be most significant.

Seven liquid crystal ranges were calibrated both dynalnieally and in an equilibriuni gradient. The final temperature values assigned t o the various colors a r e given below.
The results of the isothermal tests for the crystal tapes used to deter- mine initial and ambient temperatures for the HFC experiments a r e as follows:

In the following, the nieans of ascertaining the magnitudes of the vari- ous e r rors and the means used to correct for them are discussed.
A. I nstrument Errors
The basic components used in all the tests a re shown in Figure A-2.
Thermocouples
Vol tmete r
T e s t Apparatus Thermocouple Camera P l u s Reference
(Fi lmed dynamic Liquid Crys ta l Junction t e s t s ) Tape
Figure A-2. Schematic of basic calibration apparatus.
For each test apparatus using different therniocouples, the entire setup was calibrated by inserting the thermocouples into an ice bath made with dis- tilled water. At 0" C the greatest overall systematic e r ro r was 0. G o C. How- ever, this e r ro r was easily corrected.
The isothermal tests performed on two different apparatuses a r e in agreement. However, the two apparatuses used for the equilibrium gradient tests consistently gave differing results indicating an unknown source of sys- tematic error. Figures A-3a and A-3b show a diagram of the two equilibrium gradient test setups. The first is the same apparatus as used in the Apollo 14 calibrations and the second is called the Apollo 17 setup. The Apollo 17 appa- ratus was also used for the dynamic calibrations.
The sanie reference junction and voltmeter were used in each case. In both apparatuses iron/constantan thermocouples were used. However, these were attached to the heater plate differently ( ~ i g . A-4).

SIDE VIEW -- r Liquid G r y s taP
i ./ Plexiglas s Cover
\ Heater \ / Thermocouples
Insulation \ Y
Thermocouples
Plexiglas s Thermocouples Cover 7 /
Insulation -P
T O P VIEW
Insulation
a. Apollo 14 apparatus.
SIDE VIEW
Heated --1 Pla te
TOP VIEW
Thermocouples
Liquid sd Crys ta l s \ ~ e a t e d Plate
b. Apollo 17 apparatus.
Figure A-3. Diagram of the two dynamic test apparatuses used,

A p o l l o 14 A p p a r a t u s Apol lo 1 7 A p p a r a t u s
Figure A-4. Method of thermocouple attachment.
A test was conducted to determine the magnitude of any e r ro r produced using these different techniques of thermocouple attachment. The results indi- cate that the two techniques give the same color/temperature response.
Using Crystal H
The effect of insulation was checked by operating the Apollo 1 7 appara- tus with and without insulating material. Again, this factor showed little, if any, effect.
Using Crystal G
With Insulation
Yet the two sets of equilibrium gradient test data from the two appara- tuses do not agree in two cases. This is illustrated in the following table.

Using Crystal J
It is concluded that some undetermined systematic e r ro r is involved. An average of these two tests is used for the final values of the crystal's color/temperature response.
B. Aging
Aging of liquid crystals has the effect of slightly shifting the tempera- ture range of the crystal. For instance, a crystal tape which initially changes from amber to blue in the range of 30 to 35" C may shift to a range of 28 to 33" C because of aging. During Apollo 14 studies, several factors were con- sidered, and'the aging was attributed to light exposure. On Apollo 17 proce- dures to prevent excessive exposure to light were carried out. In order to determine the correct color/temperature response of the Apollo 17 H F C liquid crystals at the time of the flight, a series of aging studies was conducted. These studies were isothermal tests.
The method used for the tests was basically very simple. Samples of each liquid crystal were heated uniformly on a plate. A s color changes were noted, the temperature of the plate was recorded.
In October 1972 (Test I ) , each crystal tape was calibrated. In April 1973 (Test 11), these same tapes were recalibrated having been kept in the lab- oratory in a sealed container. Additionally, two tabs containing segments of the same liquid crystals were mounted in the flight experiment. One of these (the ATP Tab) was removed before launch and the other (the Flight Tab) was returned by the astronauts in a sealed envelope after performing the experi- ment. These two tabs were also calibrated (ATP Tab, Test 111; Flight Tab, Test IV). By comparing results from these tests, the condition of the crystals a t the time of operation could be determined.
Two different apparatuses were used: one for the laboratory samples and another for the ATP and Flight Tabs. The two setups were essentially the sa-me except for the size of the heater plate, A la rger plate was needed to aeeomn~odate the tabs. Figures A-5 and A-6 show the two setups,

Side View
~ i i q u i d c r y s t a l C U / C O ~ thermocouple
P e l t i e r hea te r /coo le r -Heat sink
Top View
,!heated pla te r heat sin
Con
c rY
The
pstal
Figure A-5. Isothermal apparatus, Tests I and II.
Side View
~ e / C o n Thermocouple
Top View
~ e / C o n T h e r m o - couple
Figure A-6. Isothermal apparatus, Tests 111 and IV.
Although the heating method and type of thermocouples were different between the two ser ies of tests, the technique used was the same: the thermo- couples were calibrated, the liquid crystals were cooled to a point below their indicating range, heat was applied so that the crystals slowly changed colors,

and the teniperatures at which these colors appeared were recorded, Each crystal strip was obsewed several tinies to get an indication of the precision of the determination, For the laboratory str ips only one thermocouple was used, However, the ATP and Flight Tabs consisted of crystal strips sand- wiched between two thin (2.0 mil) Teflon films, so that one thermocouple was placed under the tab and another on top of the tab and an average was used to indicate the temperature of the liquid crystal inside the "sandwich. "
The apparatus shown in Figure A- 5 was used in October 1972 on samn- ples of crystals from which the flight crystals were talien and again in April 1973 on the same crystal str ips which had not been exposed to light. The results of the two tests indicate slight, if any, change because of aging (not associated with light). Therefore, these two sets of data were treated as one to give values for the isothermal testing on the control samples.
The results for the ATP Tab give values for the crystals prior to launch, and the Flight Tab gives results for the time at which the experiment was performed. (when each of these tabs was removed from the unit, it was kept sealed to assure that no light degradation could take place. Since the October/April tests show no other aging effect, any differences between the tabs and the control samples would be because of a difference in exposure to light. )
A number of tests were conducted on each crystal with the conclusion that no significant aging effects occurred by flight time. The following table shows the results of these tests for Crystal K.
Yellow Green
Dark Blue Green
It can be seen that within the e r ro r bands of each test, the values a r e in good agreement,

C. Dynamic versus Isothermal
As was mentioned previously, two types of liquid crystal data were obtained from the Heat Flow and Convection Experiment. These have been called "dynamic" and "isothermal. " The difference between the two does not result in an actual shift in temperature range of the liquid crystal as with aging, but it may influence the observed color for a given temperature. In the isothermal case, a.s many as eight changes in color can be seen; however, in the dynamic or gradient case only three distinct color bands can be seen accurately, and it is not always possible to make a direct relationship between the two cases. That is , what is called green in a dynamic situation may cor- respond to the color called yellow-green in an isothermal situation, o r it may correspond to green o r blue-green. The following table lists the colors observed for dynamic and isothermal cases and also indicates which liquid crystals were used in the HFC Experiment in each case.
Yellow Green
Dark Blue Green
Although there is a subjective difference in the colors seen in each mode, any given reader is relatively consistent in determining a color change in either case. Because of this subjective distinguishing of colors in the two different modes of operation, the crystals were calibrated both isothermally and dynamically,
Results from the isothermal tests were used to give initial tempera- tures for each run of the HFC Experiment; and the results of the dynamic tests were used for the data obtained during each run.

B. Different Observers' Sensitivity and Observation Techniques
A human observer was used rather than an instrument, such as an optical densitometer, to determine colors in the liquid crystals because such imtrumenbtion is costly and time consuming to operate considering the number of data points to be observed. However, response to color changes is not neces- sarily the same from individual to individual. What one person calls green, another might call yellow-green. Therefore, the individual who determines color position must either be the same for all tests o r another person must be "calibratedt' against the first. Since the person who read the data (color posi- tion versus time) from the flight film was not available for the entire liquid crystal calibration procedures, a method to correlate other readersf results was developed. Additionally, this technique assured that there was no color bias because of filmed versus direct (observed in the laboratory) data.
A ser ies of 16-mm movie films was made showing temperature versus color response of the seven liquid c:rystals used for the dynamic flight data. The apparatus shown in Figure A-3b p pol lo 17 apparatus) was used for making these films. The general procedure was basically as follows. Heat was applied to one end of the crystal s t r ip and 16-mm movies were made as the color bands moved across the strip. The temperature was recorded as each color band crossed each of seven thermocouples. Thus, a temperature for the leading edge of each color was determined. These data were obtained from the films by Reader I (the individual who read the flight data film). The same tes t apparatus and procedure was used and read directly by Reader I1 in the laboratory. Thus, a baseline for comparison of the data as obtained by the two readers was established. Any further tests read by Reader I1 could then be correlated to what Reader I would have observed.
E. I n i t i a l Temperature and Heating Rates
It was found that initial temperature has a slight effect on the color response of the liquid ciystals. A crystal tape which was heated from room temperature through its temperature range gave the following results: amber =
40.2" C; green = 41.6" C; and blue = 44. 5" C. The same crystal heated from 38" C gave: amber = 39.5" C; green = 40.5" C ; and blue = 43.9" C. This effect appears to be most pronounced when results of tests which s ta r t well below the response range a r e compared with ones starting approximately 1 to 2" C below the response range. This is illustrated in Figure A-7. When the color bands a r e allowed to come to equilibrium (as in the equilibrium gradient t e s t s ) , this effect is not noticeable,
In the dynamic tests the rate of heating (or more correctly the rate of color band movement) has ail effect on the obsevved temperature response,

* i n i t i a l t e l ~ l p e r d t u l - e 1
a nlbe r 2
g r e e n
Figure A- 7. Illustration of effect of initial temperature.
Whether this is the result of the thermal response of the thermocouples, the apparatus, o r the liquid crystals themselves was not determined. However, a higher heating rate gives an apparent lower temperature for any color. Tests were made using a high heating rate (5.4 W) , a low heating rate (1.9 W) , and an ecluilibriuin gradient (in other a o r d s , the color bands were stationary, or there was a 'lzero-velocity gradiec.tl') .
Both the high and low heating rate tests were perfornled using the Apollo 17 apparatus shown in Figure A-3b. The liquid crystal tapes were attached to a 0.08-cm stainless s teel plate which was heated by a thermofoil heater. The plate was instrumented with therinocouples which were along the axis and to the side of the crystal tape. The entire apparatus was completely insulated with a sillall cutout s o that the liquid clystal and thermocouples were visible. A piece of plexiglas was clamped over this cutout to reduce heat losses. The temperature at the thermocouple was recorded a s the color bands were observed to pass the thermocouple position. The average of a s nlany a s 1 6 data points was used for each color on each clystal. Values were obtained for the two heating rates (which gave different color band velocities).
It was necessary to obtain a set of equilibrium gradient calibrations for the liquid crystal tapes used in space, since the velocity of the color bands was considerably fas ter in the dynamic calibrations than in the flight test unit. The calibra.ti~r: technique used in this study consisted of recording, by nleans of color photographs, the color changes of liquid clystal tapes attached to an instruillented nietal plate heated a t one end. The schematic shown in Figure A-3a gives the general features of the calibration apparatus. (~qu i l ib r ium gradient tests made using the apparatus in Figure A-3b were for investigating instrument e r r o r s only. Any results reported as "Ecluilibriunz Gradient" were made using the Apollo 14 apparatus. ) The nzetal plate to which the liquid clys- tals were attached was a s t r ip of 0.08-cin thicli stainless steel with 10 thermo- couples welded at the indicated locations. A snlall thermofoil heater was

attached to supply heat to the left edge of the liquid crysiaf tapes which were talien from the same lot as the flight tapes, The nietal plate was then com- pletely insulated to rninin~ize heat losses, The a rea where the liquid crystals and tliermocouples were located was cut away, and a transparent plastic view- ing port was installed permittbig both visual and photographic olsservation,
Photography of the color changes was acconiplished using a 35-mnl camera under lighting conditions which simulated the lighting during flight. With the described calibration apparatus, temperature profiles along the plate were plotted for each photograph (set of data points). A s many as 12 sets of data points were taken a t 6 different power settings for tapes C, D, E, and F; and as many as 8 se ts of data points were taken a t 5 different power settings for tapes G, H, I, and J.
The final values given for each crystal take these results into account and a r e given for a color band velocity approaching that experienced by the tapes in the flight experiment.
The following table shows the results of these tests for Clystal H.
F. Heating versus Cooling
This effect is similar to that of initial temperature. On heating, the temperature values of amber, green, and blue do not always agree with those observed on cooling. Although this effect is not a factor in the Apollo 17 flight data since only heating data were used in the analysis, results of the equilib- rium gradient tests performed for both heating and cooling indicate that no apparent hysteresis i s involved when equilibrium is reached.
G. Previous Thermal History
AlLhough this effect has been reporkd by some investigators, no evi- dence was found in these calibration studies dtz indicate that th is factor irflueneed the crystabs used, The tapes appeared to give consistent results a l t e r as many as 10 beatbg and cooling cycles,

H. Lighting
Ijccb:tusc the co!or o!,scrvcd i s a resu l t ::f s c ~ t t e r i n w t7 of inci6ent light, ligljting <::In be n strong influence. F o r instance, as an extreme case , i f no green light were pt-csent in the incident light, no green would he seen in the licluid crystnls . Ilowever, tlic s ame type lighting ( a known combination of inc~:indcscent plus fluorcscent) was used f o r a l l t es t s s o that this effect was g:'l'i~:~tl.y minimized, if not eliminated.
I. Angle of Viewing
Again, in the extreme, this effect can be an influence on the observed colors. Ilowever, a n angle of approximately 30 deg i s needed before any noticeable difference in color i s observed [ 361. All tes ts were conducted a t a m;tximum 15-deg viewing angle, and generally it was much less . Thus, this source of e r r o r was eliminated.
J. Pressure and Gravity Effects
Although there a r e liquid c rys ta l s which a r e pressure sensitive (nematic liquid c r y s t a l s ) , the cholesteric type used f o r these experiments a r e not sensi- tive to pressure changes. The possibility of a d i rec t gravity effect on the color/ temperature response was investigated. The tapes were tested in a KC-135 a i r - c ra f t flight, and no effects of the varying g-levels experienced were observable.
K. Assignment of E r r o r Bands
The standard deviation was calculated f o r each s e r i e s of tes ts . As many a s 70 points were used to obtain this measure of precision of the data. Thus, each data point is the average of severa l , and an e r r o r band, associated with reader e r r o r and other random e r r o r s , is calculated fo r each a s follows:
E ( x - x ) 2 avg
C = t n - 1
.
The e r r o r bands assigned to each value in the tables a r e a measure of the precision fo r the data. Because of the influences of possible unaccountable effects such as initial temperature, instrument e r r o r s , resolution of the film used f o r the flight data, and other parameters a s have been discussed previ- ously, id w a s not possible to a s s i e a final e r r o r band fo r the accuracy,

However, since an average of two separate tests was used for the final values, these a re more accurate than any individual test.
L. Final Values of Color versus Temperature
The following table gives the temperature values and precision values for a given color for each crystal used dynamically for the flight data, The first column gives data, corrected for reader differences, for heating rates higher than those on flight and a different initial temperature. The second column gives similar data for the equilibrium gradient tests which a re not dependent on initial temperature or heating rate. The third column is an average of the two and represents the final values of temperature and preci- sion assigned to the colors of the crystals.
1 color
Amber Green Blue
Amber Green Blue
Amber Green Blue
Amber Green Blue
Amber Green Blue
Amber Green Blue
Amber Green Blue
1 3 ( ~ i n a l Values)

APPENDIX B
UiILIm AND DEFINITION OF PFREPINFNT DIMENSIONLESS NUMBERS " ' - * = '
In the context of this report , dimensionless parameters , such a s the Hayleigh and Marangoni numbers, may be thought of a s ratios of physical forces. Thus when a particular ratio i s >> 1, the force associated with the numerator dominates that of the denominator, and vice versa when the ratio i s << 1. In certain well studied problems, critical values exist for these dinlensionless parameters (ratios) such that a change of s tate occurs as the critical value i s exceeded and one force overcomes the other.
The likelihood of natural convection arising in a fluid and its order of magnitude if it does occur can be estimated for buoyancy (gravity) induced conditions by examining a dimensionless parameter called the Rayleigh num- ber ( ~ a ) . A similar analysis can be applied for surface tension-induced motion in fluids with f r e e surfaces by examining a dimensionless parameter termed the Marangoni number ( ~ a ) . These numbers a r e defined by
Ra = va!
where
gravity thermal expansion coefficient temperature difference across the fluid depth o r width of the fluid surface tens ion absolute viscosity kinematic viscosity thermal diffus ivity

The Rayleigh number is, therefore, the weighted ratio of the buoyancy force to the viscous force, whereas the Marangoni number is the corresponding ratio of surface teiisiiiii to viscous force, In each nu-iiiber, the iiixmeratiir car;- tains the driving force with the denominator representing the restraining force. Thus the tendency for achieving sustained convective motion is greater as the numbers increase. As they surpass their critical values, the driving forces overcome viscous restraining forces and a change in flow occurs; i. e. , a transition from no-flow to laminar convection o r from laminar to turbulent convection occurs.
The ratio of Ra and Ma to their respective critical values (Ra and C
Ma ) , which a r e determined by geometry, type of containment and direction C
of heating, determines the onset and magnitude of fluid flow. If either Ra/Ra C
o r Ma/Ma exceed unity, flow will occur and heat transfer through the fluid C
increases because the convective heating is superposed to the conductive and radiative modes existing before flow initiates. A s these ratios increase, the magnitude (velocity) of flow increases until turbulence finally occurs and the amount of convective heat transfer also increases. Normally this relation is linear on a log-log plot in a given regime. When heating from the side in a gravity field, for example, the critical Rayleigh number is shown to be zero from theoretical considerations [31] . Experimental results have shown, how- ever, that a certain finite critical condition must be exceeded before heat transfer is increased over that of conduction and radiation [321 . Upon heating from below, the liquid layer remains stable to fluid flow as well a s convective heat transfer until a relatively large critical condition is exceeded. For a liquid layer bounded on bottom with a solid wall (heating element) and on top with a f ree surface, Ra is approximately 1100 [ 201.
C
The preceding quantities, Ma and Ra , a r e dependent on such proper- C C
ties of the fluid and container as the Prandtl number, Biot number, aspect ratio, heater versus fluid thermal conductivity, sidewall thermal conditions, and surface deformability (crispation and Bond numbers). The Prandtl, Biot, and Bond numbers a r e dimensionless ratios which often appear in many other engineering problems. The aspect ratio is a measure of the geometrical sym- metry of the fluid container, and as such it also appears frequently in many engineering problems. The crispation group appears less frequently and is utilized in the study of capillary waves. The definition and utility of each of these dimensionless numbers a re discussed below.

The 13r.andt! nun~ber represents the ratio of a fluid" s o n i e n t u ~ n dif- i 'usivity LO its tberinal diffusivity and is defined by
where
li = thermal conductivity Pr = Prandtl number C = heat capacity at constant p resswe .
P
Thus, fluids with a very large Prandtl number ( ~ r >> I ) , such as Krytox oils, dissipate heat much slower than momentum. In determining the value of the critical Rayleigh number, the Prandtl number has little o r no effect unless P r 5 1 in which case Ra increases a s P r decreases [37] .
C
The Bond nuniber is utilized often in such problems as capillary flow, sloshing, and rippling. It compares the relative magnitudes of gravitational and capillary forces and is defined a s
where
Bo = Bond number
P~ = liquid density
P~ = vapor density
V = liyuid velocity.
It is the pertinent parameter delineating capillary-dominated and gravity- dominated surface waves. At very low Bond numbers, "gravity" waves a r e relatively unimportant. The presence of such "gravity" waves at a f r ee sur- face tends to stabilize surface tension-driven convection [ I T ] . F o r the Apollo IS Flow Pattern Experiment, Bo < and one can safely neglect the effect of gravity waves on convection onset,

The Biot number can be considered as the ratio of the heat transferred to the surroundings at the vapor-liquid interface over the heat transported l;g7 condiucltion within the Iiqiiid. It is giver, by the fo?lowt_n_g relation,
where
Bi = Biot number h = convective heat transfer coefficient.
In natural convection studies involving a free surface, the Biot number indi- cates whether the vapor surrounding the liquid of interest is thermally insulat- ing o r conducting. An insulating vapor decreases stability; i. e. , Ra and Ma
C C a r e lower for smaller Biot numbers [20, 14, 15, 381.
The crispation number was introduced by Scriven and Sternling [16] in their study of surface tension-driven convection of liquid layers and i s given by
where
C r = Crispation number p = absolute viscosity.
Using linear theory, Smith [17] showed that surface deformations due to flow perturbations have negligible effects on convection onset and cell size if C r < low3. This condition was satisfied for Apollo 17 as Cr 2 4 X
Although not formally considered to be a "nondimensional number, " the aspect ratio is certainly dimensionless and arises often in studies in which geometrical similitude is important. It is also an important parameter in nat- ural convection studies, both gravity and surface tension driven. The aspect ratio can be defined as the container width divided by the container height [19] . The critical Marangoni and Rayleigh numbers usually increase as the aspect ratio decreases (narrower containers).

A s mentioned earlier, the dimensionless ratios of thermal conduetivi- ties (sidewall to fluid and heater to fluid) a r e also iniportant parameters in convection problems, Insulating container walls (and heaters) a r e more unstable than conducting ones, In other words, sidewalls and/or heaters which a r e better conductors than the fluid layer enhance stability (they ra ise Ra ) , while materials of lower conductivity lower the criticality conditions
C
The preceding discussions have demonstrated the utility of dimension- less numbers fo r describing certain fluid flow phenomena. I t was noted that these numbers a r e extremely useful in well studied problems where ranges in their values have been identified with flow regimes. In other less studied problems, the state of the a r t of nondimensional numbers i s a t a very primitive stage and their use is of limited value. Such a case is well represented by thermoacous tic convection. This problem will not yield a pertinent dimension- less parameter from inspection of the equations a s in other problems [ 39, 401. Thus, the pertinent dimensionless parameter can only be determined by mathe- matical modeling (numerical solution) o r experimental studies. Furthermore a criticality condition will be even more difficult to define since the wavelike phenomena a r e present, although negligible, a t even the slightest heating rates .3
In conclusion9 nondimensional numbers can be used as a powerful tool in the scientific analysis of most buoyancy-driven, natural convection prob- lems (with constant g-levels) and in simple cases of surface tension-driven natural convection. It is also very helpful when these two forces a r e coupled. Their use in such problems as thermoacoustic, g-jitter, vibrational, electro- hydrodynamic, and solidification-induced natural convection is very limited even when one of these is coupled with gravity o r Marangoni convection. Only more basic research and experimental studies made without the encumbrance of ter res t r ia l gravity can alleviate this situation.
3 , Private Commtknication with S, W, Churchill on April. 26, 1943,

APPEND i X C r p l A1 ERROR ANAL'YSES FOR RAu i p - \ ~ AND
LINEAL EXPER !MERITS
A. Liquid Crystal Cal ibrat ion Er ro rs
The technique of thermally mapping convective heat flow with liquid crystals was f i rs t explored in the Apollo 14 Heat Flow and Convection Demon- stration Experiments 191 . Because the technique is new, however, the ques- tion is raised in the present study of whether all sources of systematic e r r o r were truly eliminated in the calibration runs of both the Apollo 14 and Apollo 17 liquid crystals. To account for the differences observed in the data of Apollo 14 and Apollo 17 on the basis of calibration e r ro r , four possibilities need to be considered:
1. Calibration e r ro r s were insignificant for the Apollo 14 data.
2, Calibration e r ro rs were significant for the Apollo 14 data.
3. Calibration e r ro r s were insignificant for the Apollo 17 data.
4. Calibration e r ro rs were significant for the Apollo 17 data.
Combining these possibilities leads to four further possibilities: 1-3, 1-4, 2-3, and .2-4, of which only 1-4 and 2-3 should concern us here. The condi- tion 1-3 means, of course, that the data presented in Figures 16 and 17 and 19 and 20 a r e accurate to within the precision limits indicated. The condition 2-4 could only mean that convection did not occur during the Apollo 14 flight test and did occur during the Apollo 17 flight test. Such a situation would mean that the calibration e r ro rs made in the Apollo 14 study were opposite in direc- tion to those made during the Apollo 17 study, a very unlikely situation.
If the case 1-4 obtains, then convection must have occurred during the Apollo 17 flight test as well a s during the Apollo 14 flight test, The calibration data for the Apollo 17 crystals, therefore, must have been in e r r o r in such a manner a s to make the temperatures obtained from the lower temperature tapes appear lower than they actually were and the temperatures obtained from the higher temperature tapes appear higher than they actually were. In the event that case 2-3 obtains, then convection was not present during either the Apollo 14 o r 17 flight tests. In such a case the Apollo 14 calibration e r ro rs must

have been such as to make the temperatures obtained from the lower tempera- ture tapes higher than they achally were and those obtained from the higher temperature tapes lower than they actually were. Thus, if either of the latter two cases (i, e, , 1-4 o r 2-3) obtains, then the calibration e r ro r s had opposite directions in the lower and higher temperature ranges.
Rather extensive calibration studies were conducted during the Apollo 17 data analyses, and these a r e detailed in Appendix A. In these more exten- sive studies, no source of e r ro r could be located that raised o r lowered the temperatures from the low temperature tapes while lowering o r raising at the same time the temperatures from the higher temperature tapes. All the e r ro r s that were located had the effect of lowering o r raising the temperatures on all of the tapes. It is concluded, therefore, that the form of the Apollo 14 and 17 data cannot be accounted for in terms of calibration e r ro rs .
Power Fluctuations
The possibility that power fluctuations account for the form of the observed data was considered previously in the Apollo 14 data analyses and found unlikely [9] . In the case of the Apollo 17 data, power fluctuations as an explanation for the form of the observed data a re even less likely. Figures C-1 and C-2 show the voltage values obtained from Mission Control for the Radial/Lineal Experiment, runs 1 and 2. Figures C-1 and C-2 show very dif- ferent patterns of voltage variation. The curves of distance versus time for runs 1 and 2, however, duplicate each other quite well. It can be concluded, therefore, that the magnitudes of the power fluctuations were insufficient to have expected any sizeable influence on the form of the color distance versus time curves. Incidentally, the increase of 0.7 V observed a t the time interval between about 170 and 230 sec in Figure C-1 did not result in any sharp increase in distance on any of the color versus time curves for that period of time. This latter observation reinforces the conclusion arrived a t in the Apollo 14 data analyses that the second-order oscillations observed in the Apollo 14 data for the Radial and Zone cells were not the result of power fluctuations.


d c V o l t s 0 60 120 180 240 300 360 420 480 540 600 sec
Figure C-2. Voltages at the time of Radial/~ineal run 2.
29.4
29.3
29.2
28.6
28.5
28.4
28.3
28.2
I I I I I I I I I I
-
-
-
-
-
-
-0 0 0 0
-
I I I I 1 I I I I I I I
4 5 ~ 3 0 :31 :32 :33 ~ 3 4 :35 :36 :37 :38 :39 :40 :41 :42 *%in
G E T Time

APPENDIX la
CONDUCTION-RAD IATIOtJ THERMAL MODELS
A conduction-radiation model of the heat transfer processes in a fluid is constructed by neglecting the effects of fluid motion on the heat transfer. This assumption uncouples the conservation equations and allows an analysis of only the conduction and radiation portion of the energy equation:
This type model is useful because:
e Solutions a re easily obtained using existing computer programs.
e Convection solutions can be compared to conduction-only solutions to determine the impact of convection on the fluid behavior.
The conduction-radiation model computer programs which were used to analyze the HFC are ( I ) VUFACT [41] (calculates radiation view factors) and (2) Thermal analyzer [42] (uses VUFACT inputs and calculates tempera- tures). The VUFACT program calculates the radiation interchange factors f necessary to compute the radiation heat flux term:
These coefficients f a r e calculated for arbitrary geometries using the mater- ial surface properties, emissivity, absorbtivity, and reflectivity.
The Thermal Analyzer program utilizes a numerical finite-difference method to solve equation (D-1). Both steady-state and transient temperature histories a r e plotted at user specified node points in the fluid and/or solid boundaries. Temperature-dependent thermal properties and time^ varying boundary conditions are easily implemented.

A. Thermal Analysis
Thermal analyses were performed on the Radial, Lineal and Flow Pattern heating units for accurately predicting temperature profiles for eom- parison with flight data. In the thermal analyses, each heating unit was divided into incremental volumes and a set of generalized differential energy transfer equations was established. Considering an incremental volume in terms of its heat capacity and its radiative, conductive, and convective energy transfer gives the following total energy balance for an arbitrary volume j :
N - K A dT. / d ~
n n J-n j-n n= 1
+ Qj 9
where
p.V.C dT./dO is the rate of change of sensible heat due to energy l J P j 1 transfer to or from element j
hc Ac (Tf - Tj) is the energy rate gained or lost because of con- j j vective exchange between element j and the
internal fluid
h' A ' (Tj - Tf) is the energy rate gained or lost because of con- vective exchange between element j and the external fluid
crA. S (T! - T . ~ ) is the energy rate gained or lost because of radiant j j - i j J.
exchange between element j and element i

oA!S (TIT! - T 4, is the energy rate gained o r lost because of radialaG J j-a J a exchange between element j and the ambient "air"
K A dT /dX is the energy rate conducted to or from j along n n j-n j-11 path n due to adjoining elements
'j is the internal heat generation.
In the above equation, it is assumed that the element under consideration has a uniform temperature T = T over its volume.
j
The generalized differential energy transfer equations were solved mathematically by the Lockheed-Huntsville Thermal Analyzer Computer Pro- gram [42] using the following finite difference form of the equation:
where
6 and $+A6 = times R . . = the thermal resistance from node i to node j
1J
C = the thermal capacitance of node i i
Qi = an arbitrary heat input to node i
T. and T = temperatures of the subscripted nodes. 1 j
B. Thermal Models
Thermal models for the Radial, Lineal and Flow Pattern heating units were developed to calculate the transient temperature distributions for com- parison with the Apollo 17 flight data. Heat transfer paths were defined including all important locations at which changes occur affecting the thermal parameters (such as material, area, mode of heat transfer, joints, etc.) . Locations at which the temperatures were calculated (referred to as nodes) were selected along the various heat paths based on the symmetry of the struc- ture and the areas of major interest.

The nodal net.works for the thermal models which were used are shown in Fi-res D-1, D-2, and &3. The Radial heathg unit thermal model ( ~ i g , -1)
I AQ Aluminum
TFE Teflon
RTV RTV Rubber
@ Node Point
Figwre D- 1. Nodal network for eonduction/radiation thermal model of Apollo 17 HFC Radial cell,


A l u m i n u m
Kapton FEP
S i l i cone G l a s s
Figure D-3. One-dimensional nodal network for conduction/radiation thermal model
of Apollo 17 HFC Flow Pattern cell.
includes conduction, radiation, and external convection. The Linear and Flow Pattern heating unit thermal models ( ~ i g s . D-2 and D-3, respectively) include conduction and external convection. A list of the thermal properties used in the development of the thermal models is given in Table D-1.
The computational e r ro r associated with thermal modeling and the finite difference method of solution depends on the construction of the thermal model (i. e. , how the physical geometry is divided into nodes) and the thermal prop- erties of the material. Past experience with the thermal analyzer program indicates that the accuracy is well within the limits of the properties data. Therefore, the properties data become the controlling factor in determining the accuracy of the thermal model. A summary of the errors expected in the Radial heating unit model is presented in the following.

TABLE D- 1. THERMAL AND FLUID PROPERTIES
Density Dynamic Viscosity
Kinematic Viscosity
Thermal Conductivity
~ t u / k r - f t - " ~ (cal/sec-cm-"C)
I
Thermal I Diffusivity
Coefficient of Expansion
Specific Heat
Prandtl Number Temperature
I L , lbm/ft-sec
(poise)
v, ft2/sec (stoke) Fluid
Water 1 150
Argon 300
Icrytox I43AA
Krytox l43AZ

Heater Power
Finite Difference
A weighted average of these errors gives an accumulated er ror of approxi- &10 percent of the temperature difference (T - T ) for the Radial
x, t initial heating unit model. Since the thermal properties of the Lineal and Flow Pat- tern heating units are better known and no significant internal radiation exists, it is expected that the e r ror for these models will be approximately half of the Radial model error.
A s an example of this error, consider a typical point on the Radial cell curves. The temperature rise is from 25°C to 35" C, resulting in AT = lo0, which gives an error of lo C.


C. Radial Heating Temperature-Time Curves (Precision and Error Bands Indicated
by Vertical and Dashed Lines)


Run I
0 Fl igh t Data
- Theory
Figure D-7. Radial heating temperature-time curve ( r = 0.9, run 1).


.sr-'Ln
' O
NN


D. Lineal Heating Temperatu re-Time Curves (Precision and Error Bands l ndicated
by Vertical and Dashed Lines)


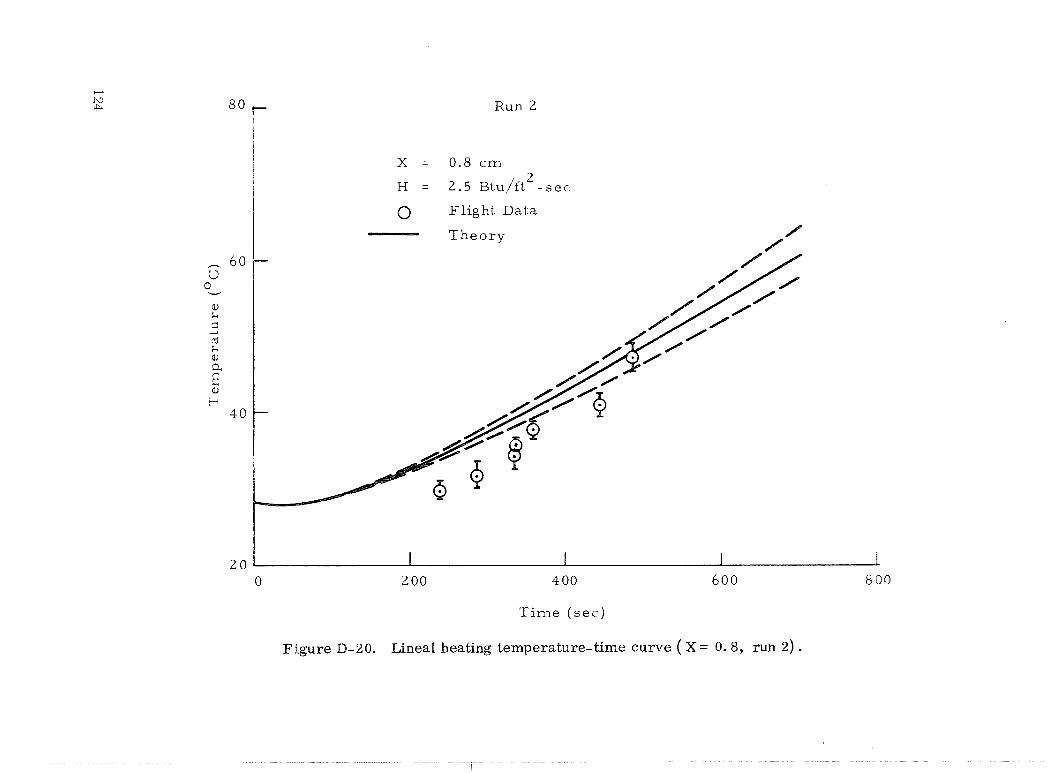
R u n 2
X = 0.8 cm 2 H = 2.5 ~ t u / f t - s e c
0 Fl igh t Data
Theo ry
Time ( s e c )
Figure D- 2 0. Lineal heating temperature- time curve ( X = 0.8, run 2) .

0 Flight Data
Theory
20 I I I L 0 2 00 400 600 8 00
T i m e ( sec )
Figure D-2 1. Lineal heating tempe'rature-time curve ( X = 1.1, run 2) .


Run 2
0 Fl igh tDa ta
Theory
Time ( sec )
Figure D-23. Lineal heating temperature-time curve ( X = 1.9, run 2) .


E. Flow Pattern Temperature Profile Cu rves

A
C",
03
vi II E h
.. 0
LrJ h7
II
bC
d
- CO rl
II u
CD
LrJ
r-' II @
w


0
1 amb
= 1 8 . 3 ~ ~
t = 18 s e c
2 4 I I 0 0.4 0.8 1.2 1.6 2.0
Depth, y (mm)
Figure D-29. Flow pattern temperature profile curve ( Q = 7.56, t = 18, Ta = 18.3', ym = 2. 0) .


LOCKHEED GENERAL CONWCTlON PROGRAM i i G C PI
Convection modeling consists of analyzing the fluid flow and heat trans- f e r simultaneously. These mechanisms a r e coupled since the heat t ransfer affects the flow velocity and likewise the fluid convection influences the heat transfer. This appendix briefly describes a computer model of convection phenomena which was applied t o the Apollo 17 HFC demonstration require- ments.
The convection model [33] consists of a numerical solution t o the full Navier-Stokes equations for a compressible, viscous, heat conducting fluid. The computer program can currently solve problems for two-dimensional flow in a rectangle and axisymmetric flow between concentric cylinders. The HFC Radial cell configuration consists of the concentric cylinder arrangement.
The model contains two possible driving forces for fluid convection. The gravity-induced convection caused by buoyant forces and the thermally- induced expansion convection a r e included with the gravity vector. The LGCP currently utilizes the following assumptions and simplifications t o the Navier- Stokes equations.
o Newtonian fluid obeying Stokes viscosity law.
Constant thermal properties k, C p , y. v'
e No radiation o r internal heat sources.
o No viscous dissipation of energy.
e Ideal gas equation of s tate (P = ~ R T ) . The current convection model does not make the classical Boussinesq
approximation which neglects the effects of pressure on the density profile. Most models reported in the literature make this assumption resulting in a quasi-incompressible approach. The model used here considers the equations of compressible flow with variable density in all terms.
The geometry and coordinate system used in the convection computer model a r e shown in the following schematic. This configuration allows the

radial eel1 e ~ e r i m e n t t o be simulated analy1;icaIly with both heat eon&etion and convection Included.
The Navier-Stokes equations for the Radial cell a r e derived by invoking the conservation laws for mass, momentum, and energy. Written in axisym- metric cylindrical coordinates, these governing equations take the following form:
Mass

Radial Momendurn
a 3 a a at. ( P ' u ' ) +-par ' ( r r p c u t 2 ) + - a Z' (p lu ' v9 ) =
Axial Momentum
a 1 a a ( p v + - - (r' p' u' v') + -7 (p' v'2) =
r1 a r t az
State Eauation
These equations, with properly prescribed boundary conditions, describe the flow and thermal behavior of the gas in the Radial cell.
The thermal boundary conditions consist of specified values of tem- perature o r heat flux at the heater post, cylinder wall, base insulation layer, and liquid crystal strip. These velocity boundary values consist of a no-slip

(V = 0 ) condition a t the solid interface and a symmetric condition (av/aar = 0) at the "top" of the heater post. The boundary values for the solid surfaces were calculated f irst using the pure conduction assumption and then corrected for convection heat transfer into the argon gas.
The thermal convection computer program utilizes a finite-difference numerical solution to the full Navier- Stokes equations. The program allows the direction and magnitude of the acceleration vector to be arbitrary. A unique capability of the program is the coupling of gravity convection and thermoacoustic convection. This capability is necessary for analyzing the HFC Radial cell since both types of convection could occur in this cell.
The same basic nodal breakdown used in the conduction model (Fig. D-1) was also used for the convection model. However, the number of node points was doubled to insure accuracy in the fluid-flow calculations. An e r ro r analy- sis of this type of model consists of essentially the same e r ror bands as the thermal models discussed previously. The primary purpose of this type of modeling is to determine if convection occurred in the flight experiment and to estimate the magnitude of the increased heat transfer. In addition, this type of modeling allowed the Apollo 14 and Apollo 17 data to be compared to simi- larities and differences in convection aspects.

APPENDIX F PIC T t f in\/ R E H E W OF GEBHARI 2 I ~ E V R I
OF RANDOM CONVECTION
The paper by Gebhart [34] deals directly with convection caused by random disturbances likely to prevail in spacecraft. Sources for these bumps o r impulses in the spacecraft include motion of the occupants, attitude control measures, particle impacts, and internal mechanical events. The effect of the fluctuations on a contained fluid were considered to be transferred t o the fluid by normal and shear s t resses . The former a r e associated with velocity fluctuations, whereas the latter a r e attributed to orientation changes caused by relative motion between boundary surfaces and the enclosed fluid. Assuming that shear s t r e s ses account for most of the convection, Gebhart obtained a relation between Nusselt number (comparison of randoni convection and pure conduction) and elapsed time between impulses. This relation is shown in Figure F- 1 for various container geometries. Time intervals between bumps a r e proportional t o F which i s a mean disturbance Fourier number. The
m9 disturbance Fourier number, F , i s defined by the following relationship:
where
a, = thermal diffusivity T = time between disturbances
C
s = significant dimension . The equations which relate the average Nusselt number to the disturbance Fourier number are:
Plane, One- Dimensional Case

4 t e a d y Sta te Values
3
2 J Spher ica l Region, n = 1 BCyl indr ica l Region, n = 1
1 P l a n e Region, n = cc
0
Figure F-1. Effect of disturbances on heat transfer [34].
Spherical Regions
Cylindrical Regions
The C t e rm is an n-dependent constant where n i s an integer in the proba- n
bility distribution used and (n + 1) corresponds to the number of independent variables causing the vibration. Values of C for various values of n a r e
n given a s follows:

The analysis treats only small amplitude vibrations, It does not take into account substantial fluid flow that would result froni large amplitude dfs- turbances. However, the analysis should give order of magnitude effects. An increase in heat transfer bebeen 300 to 400 percent is predicted during fre- quent impulses of small amplitude.

REFERENCES
Von Braun, W. : Factories in Space. Popular Science, December 1969.
Yaffee, M. L. : Space Factory Planned for 1 9 7 0 ~ ~ Av. Week Space Tech., November 10, 1969, pp. 61-71.
Wuenscher, Hans F. : Exploiting Gravity Fields Less than 1G: Manu- facturing in Space. Astronautics and Aeronautics, vol. 10, no. 9, September 1972, pp. 42-54.
Space Processing and Manufacturing Meeting. Oct. 21 and 22, 1969, Marshall Space Flight Center, Huntsville, Alabama; NASA TM X- 53993, February 5, 1970.
Grodzka, P. G. : Types of Natural Convection in Space Manufacturing Processes: Summary Report. Lockheed Missiles and Space Co, , Huntsville Research and Engineering Center, LMSC-HREC-TR D306350, January 1973.
Grodzka, P. G. ; and Fan, C. : Natural Convection in Space Manufactur- ing Processes: Interim Report. Lockheed Missiles and Space Co., Huntsville Research and Engineering Center, LMSC-HREC D162926, July 1971.
Grodzka, P. G. : Zero-Gravity Solidification. Lockheed Missiles and Space Co., Huntsville Research and Engineering Center, LMSC-HREC D148619-A, March 1970.
Bannister, T. C. : Heat Flow and Convection Demonstration (Apollo 14). NASA TM X-64735, March 29, 1973.
Grodzka, P. G. ; Fan, C. ; and Hedden, R. 0. : The Apollo 14 Heat Flow and Convection Demonstration Experiments: Final Results of Data Analyses. Lockheed Missiles and Space Company, Huntsville Research and Engineering Center, LMSC-HREC D225333, September 197 1.
Grodzka, P. G. ; and Bannister, T. C. : Heat Flow and Convection Demonstration Experiments Aboard Apollo 14. Science, vol. 176, May 1972, pp. 506-508.

REFERENCES (Continued)
Bannister, T. C, : Heat Flow and Convection Demonstration Experi- ments Aboard Apollo 17 ( ~ a r l y Results). Marshall Space Flight Center, MSFC Research and Technology Review, February 22-23, 1973. ( ~ v a i l a b l e from Author).
Johnson, P. T. : Apollo 17 Heat Flow and Convection Demonstration: Description and Experimental Operating Procedures. Lockheed Missiles and Space Co., Huntsville Research and Engineering Center, LMSC-HREC D225415-B, October 1971.
Gatewood, E. ; Morris, M, G. ; and Holland, R. L. : Acceleration Levels on the Heat Flow and Convection Demonstration. NASA TM X-64644, February 11, 1972.
Pearson, J. R.A. : On Convection Cells Induced by Surface Tension. J. Fluid Mech., vol. 4, 1958, pp. 489-500.
Nield, D. A. : Surface Tension and Buoyancy Effects in Cellular Convection. J. Fluid Mech., vol. 19, 1974, pp. 341-352.
Scriven, L. E. ; and Sternling, C. V. : On Cellular Convection Driven by Surface-Tension Gradients: Effects of Mean Surface Tension and Surface Viscosity. J. Fluid Mech, , vol. 19, 1969, pp. 321-340.
Smith, K. A. : On Convective Instability Induced by Surface-Tension Gradients. J. Fluid Mech., vol. 24, 1965, pp. 401-414.
Palmer, H. J. ; and Berg, J. C. : Convective Instability in Liquid Pools Heated from Below. J. Fluid Mech., vol. 47, 1971, pp. 779-787.
Bentwich, M. : Buoyancy and Surface-Tension Induced Instabilities of Fluid in Open and Closed Vertical Cylindrical Containers. Appl. Sci. Res . , vol. 24, July 1971, pp. 305-328.
Sparrow, E. M. ; Goldstein, R. J. ; and Jonsson, V. K. : Thermal Insta- bility in a Horizontal Fluid Layer: Effect of Boundary Conditions and Non-Linear Temperature Profile. J. Fluid Mech., vol. 18, 1963, p. 513.

REFERENCES (Continued)
Gershuni, 6, Z. ; Zhushovitskii, E, M. ; and lurkov, I. S. : On Convec- tive Stability in the Presence of Periodically Varying Parameter. PMM, vol. 34, no. 3, 1970, pp. 470-480.
Gresho, P. M. ; and Sani, R. L. : The Effect of Gravity Modulation on the Stability of Heated Fluid Layer. J. Fluid Mech. , vol. 40, 1970, pp. 783-806.
Vidal, A. ; and Acrivos, A. : Effect of Nonlinear Temperature Profiles on the Onset of Convection Driven by Surface Tension Gradients. I&EC Fundamentals, vol. 7, February 1968, pp. 53-58.
Currie, I. G. : The Effect of Heating Rate on the Stability of Stationary Fluids. J. Fluid Mech., vol. 29, 1967, pp. 337-347.
Berg, J, C. ; Acrivos, A. ; and Boudart, M. : Evaporative Convection. Advanc. Chem. Eng., vol. 6, 1966, p. 102.
Debler, W. R. ; and Wolf, L. W. : The Effects of Gravity and Surface Tension Gradients on Cellular Convection in Fluid Layers with Para- bolic Temperature Profiles. J. Heat Transfer, Trans. ASME, August 1970, pp. 351-358.
Soberman, R. K. : Onset of Convection in Liquids Subjected to Tran- sient Heating from Below. Physics of Fluids, vol. 2, 1959, pp. 131-138.
Jeffereys, H.: The Surface Elevation in Cellular Convection. Quart. J . Mech. and Appl. Math, vol. 4, pt. 3, 1951, pp. 283-288.
Hoard, C. Q. ; Robertson, C. R. ; and Acrivos, A , : Experiments on the Cellular Structure in ~ 6 n a r d Convection. Int. J. Heat Mass Transfer, vol. 13, 1970, pp. 849-856.
Koschmieder, E. L. : On convection under an Air Surface. J. Fluid Mech., vol. 30, 1967, pp. 9-15.
Batchelor, 6. K. : Heat Transfer by Free Convection Across a Closed Cavity Between Vertical Boundaries at Different Temperatures. Quart. Appl, Math, vol. 12, October 1954, p. 214,

REFERENCES (Concluded)
32. Eckert, E. R. G . ; and Carlson, We Dm : Natural Convection in an Air Layer Enclosed between Two Vertical Plates with Different Tempera- tures. Int. J. Heat Mass Transfer, vol. 2, 1961, pp. 106-120,
33. Spradley, L. We ; Bourgeois, S. V. ; Fan, C. ; and Grodzka, P. G.: A Numerical Solution for Thermoacoustic Convection of Fluids in Low Gravity: Summary Report. NASA CR-2269, May 1973.
34. Gebhart, B. : Random Convection Under Conditions of Weightlessness. AIAA J. , vol. 1, 1973, pp. 380-383.
35. Pak, H. Y. ; Winter, E. R. F. ; and Schoenals, R. J. : ,Convection Heat Transfer in Contained Fluid Subjected to Vibration. In Augmentation of Convective Heat and Mass Transfer, A. E. Bergles and A. L. Webb, eds., ASME, N.Y., 1970, p. 148.
37. Spiegel, E. A. : Convection in Stars. I. Annual Review of Astronomy and Astrophysics, vol. 9, 1971, pp. 323-352.
38. Takashima, M.: Thermal Instability of Fluid Layer Bounded Below by Solid of Finite Conductivity. J. Phys. Soc. Japan, vol. 31, no. 1, July 1971, pp. 283-292.
39. Ostrach, S.: Role of Analysis in the Solution of Complex Physical Problems. Third Intl. Heat Trans. Conf. , Chicago, August 1966.
40. Churchill, S. ; and Hellums , J. D. : Dimensional Analysis of Natural Convection. Chem. Engr. Prog. Symp. Ser., vole 57, 1964, p. 75.
41. Lovin, J, K. ; and Spradley, L, MI. : User's Manual, Lockheed Orbital Heat Rate Package. LMSC-HREC D162218, Lockheed Missiles and Space Company, Inc., April 1970.
42, Lovin, J. K. : Lockheed-Huntsville Thermal Analyzer. TM 54/20-338, LMSC-HREC D225095, Lockheed Missiles and Space Company, Inc. , Huntsville, Ala. , July 1972.

APPROVAL
APQLIQ 17 HEAT FLOW A N D CONVECTION EXPERIMENTS
F INAL DATA ANALYSES RESULTS
By T. C . Bannister, P. G. Grodzka, L. W. Spradley S. V. Bourgeois, R. 0. Hedden, and B. R. Facemire
The information in this report has been reviewed for security classifi- cation. Review of any information concerning Department of Defense or Atomic Energy Commission programs has been made by the MSFC Security Classification Officer. This report, in its entirety, has been determined to be unclassified.
This document has also been reviewed and approved for technical accuracy.
WILLIAM C. SNODDY fl Chief, Electromagnetic. and Solid State
Physics Division
Director, Space Sciences Laboratory

Internal External
S&E-ASTN-MEV Mr. R. Ruff Ms. M. Johnston
S&E-AERGY Mr. W. Vaughan
DIR Dr. R. Petrone
Natimal Aeronautics and Space Administration
Washington, D. C. 20546 Attn: E/Dr. C. Mathews
ES/Mr. F. Willlams Mr. J. Bredt (5)
M/G. D. Myers MA/Mr. C. Lee MAE/Mr. L. Casey MTX/Mr. W. Armstrong RS/Mr. D. Novik RW/Mr. G. Deutsch RRT/Dr. R. Nash SL/Mr. W. Keller SM/Dr. R. Allenby
Col. D. Senich
Howard University Washington, D. C. 20001 Attn: Dr. A. Ukanwa
Lockheed Missiles and Space Co. Research Pa rk Huntsville. Alabama 35807 Attn: Mr. J. F a r r i o r
Mr. G. Reny Mr. J. Benefield Dr. P. Grodzka (5) Mr. R. Hedden Dr. S. Bourgeois Mr. L. Spradley Mr. P. Johnston Mr. P. Biscenius Mr. K. Heimendinger Mr. R. Wyman Mr. R. Chaney Mr. A. Marino Mr. R. Oemer
DEP Dr. W. Lucas Mr. J. Shepherd
S&E-AERGYE Mr. 0. Vaughan SW-ASTN-MT
Mr. A. Krupnick Dr. R. Snyder Dr. R. Allen
Rensselaer Polytechnic Institute Troy. N. Y. 12181 Attn: Professor H. Wiedemeyer S&E-SSL-DIR
Dr. C. Lundquist Mr. R. Hembree AD-S
Dr. E. Stuhlinger Dr. G. Bucher Mr. M. Kent
University of Southern California Los Angeles, California 90007 Attn: Professor W. Wilcox
S&E-COMP-DIR Dr. H. Hoelzer S&E-SSL-X
Dr. J. Dozier S&E-COMP-RRF
Mr. I?. Rcdrigue Mr. R. Graham
Case Western Reserve University Cleveland, Ohio 44106 A*: Professor S. Ostrach
SBaE-DIR Dr. H. Weidner Mr. L. %chard Dr. W. Haeussermann Mr. B. Montgomery
S&E-SSL-S Dr. W. Sieber Mr. B. Blake (5) Mr. L. Russell S&E-PE-DIR
Dr. M. Siebel Mr. H. Wuenscher
Lehigh University Bethlehem. Pa. 18016 Attn: Professor H. Leidheiser
NASA, Johnson Space Center Houston, Texas 77058 Attn: AA/Dr. C. Kraft
CB/Col. Stuart A. R w s a Cmdr. Ronald E. Evans
CD2/Ms. J. Lee CD12/Mr. C. Perner ED2/Mr. E. Weeks EP5/Mr. R. Rice FC4/Mr. L. Hirsh PD9/Mr. G. Mulraney PG/Mr. P. Jaschke
Mr. J. DeLeonardis Mr. F. Laurentz
PH/Mr. N. Stewart SN/Mr. B. Miller
S&E-SSLT Mr. W. Snoddy Mr. T. Bannister (30) Mr. G. Arnett Mr. E. Miller Mr. B. Jones
Dr. J. R. A. Pearson Department of Chemical Engineering University of Cambridge Cambridge, England
SAT-MGR Mr. R Smith S&E-PE-A
Mr. B. Yates Mr. R. Berge
University of Pennsylvania Philadelphia. Pa. 19104 Attn: Professor S. Churchill SAT- E
Mr. L. Ginn (5) Dr. D.A. Nield Department of Mathematics University of Auckland Auckland, New Zealand
S&E-PE-M Mr. J. Williams
University of Illinois Urbana, I l l i n ~ i s 61801 Attn: Professor S. Soo
Professor J. Westwater
PD-MP-P Mr. H. Dudley Mr. K. Hudson Mr. T. Carey Mr. K. Taylor
S&E-SSL-TR All Members (25)
S&E- PE-MW Mr. G. Parks Mr. V. Yost Mr. E. Hasemeyer
s&E-SSL-P Dr. R. Naumann
Professor B. Gebhart College of Engineering Upson Hall Cornell University Ithaca, N.Y. 14850
Massachusetts Institute of Technology
Charles Stark Draper Laboratories 68 Albany Street Cambridge, Massachusetts 02139 Attn: Dr. H. Gatos
Dr. A. Witt Dr. J. Melcher
S&E-R-DIR Dr. W. Johnson
S&E-SSL-PM Mr. R. Holland Mr. 5. Pa rke r
S&E-PE-MX Mr. P. Schuerer Mr. R. Nichols Mr. G. Adams
S&E-ASTN-DIR Mr. K. Heimburg Mr. J. Kingsbury
Director NASA, Langley Research Center Langley Station Hampton, Virginia 23365
Dr. Peter D. Richardson Division of Engineering Brown University Providence. Rhode Island 02912
S&E-SSL-N Dr. R. Decher
S&E-QUALDIR Mr. D. Grau SI-ASTN-P
Mr. H. Paul S&E-SSL-C
Reserve (5) Scientific and Technicah
Information Facility (25) P. 0. Box 33 College Park. Maryland 20740 Athc NASA Representative
(S-AWRKT)
J e t Propulsion Laboratory, 180-302 California Institute of Technology 4800 Oak Grove Drive P a s a d e b , California 91103 Attn. Mr. E. Christensen
Dr. John Carru thers Bell Research Labs Murray Hill, New Je r s ey 07974
S&E-QUAL-EX Mr. J. Boggess S&E-ASTN-M
Mr. R Schwinghamer Mr. E. Cataldo
A&PS-PAT Mr. L. Wofford
Dr. John Be rg University of Washington Seattle, Washlngtm 98105
SgUGQUAL-ATE Mr. D. Taylor
S&E-ASTN-MM Mr. E. McKsnaan Mr. R. H. Poorman
The University of Texas Austin, Texas 78712 Attn: Dr. L. Koschrneider
S&E-QUAL-YA Mr. F. Dotan Hayes International Corp.
P. 0. Box 1568 Huntsville, Alabama 35807 Attn: W. T. Weissinger