memorandum of understanding for the …€¦ · for the construction and revitalization of...
TRANSCRIPT

MEMORANDUM OF UNDERSTANDING FOR THE CONSTRUCTION AND REVITALIZATION OF
BALTIMORE CITY PUBLIC SCHOOLS
Annual Report on the Progress of Replacements, Renovations, and Maintenance of Baltimore City Public School Facilities
October 1, 2014
Submitted to the Governor, Board of Public Works, and Legislative Committees
The MOU Executive Committee:Mr. Michael J. Frenz, Maryland Stadium Authority, ChairDr. Gregory Thorton, Chief Executive Officer, Baltimore City Public SchoolsThe Honorable Stephanie Rawlings-Blake, City of BaltimoreDr. David Lever, Executive Director, Interagency Committee on School Construction
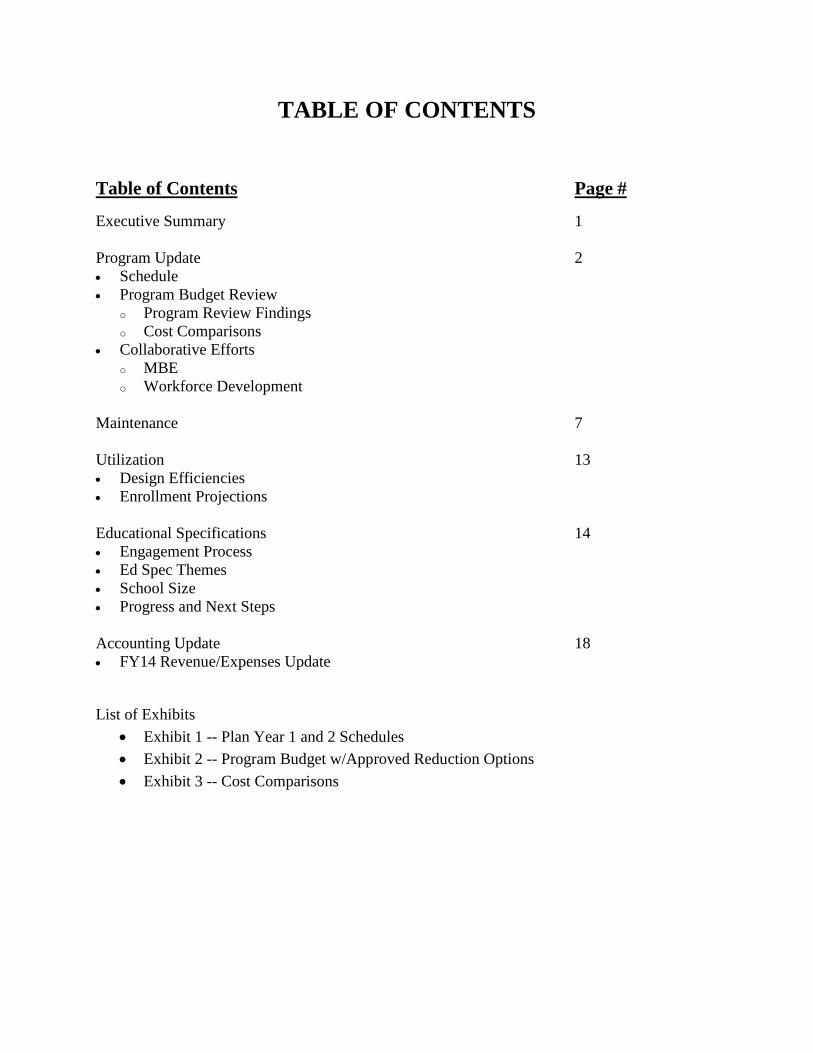
TABLE OF CONTENTS
Table of Contents Page #
Executive Summary 1 Program Update 2 • Schedule • Program Budget Review
o Program Review Findings o Cost Comparisons
• Collaborative Efforts o MBE o Workforce Development
Maintenance 7 Utilization 13 • Design Efficiencies • Enrollment Projections
Educational Specifications 14 • Engagement Process • Ed Spec Themes • School Size • Progress and Next Steps
Accounting Update 18 • FY14 Revenue/Expenses Update
List of Exhibits • Exhibit 1 -- Plan Year 1 and 2 Schedules • Exhibit 2 -- Program Budget w/Approved Reduction Options • Exhibit 3 -- Cost Comparisons

EXECUTIVE SUMMARY
The first year of the Baltimore City School Revitalization Program (BCSRP) has seen much progress while encountering some challenges along the way. Successes in the first year include Baltimore City Board of School Commissioners (BOC) adoption of amendments to the 21st Century Buildings Plan (the Plan) and commitment to an 86% district-wide utilization rate by the 2019-20 school year in December, 2013. The amendments identified a net of one additional school facility that will be surplussed and approved the closure of eight additional school programs. Additionally, City Schools surplussed two buildings in January, 2014. The Interagency Committee on School Construction (IAC) approved the utilization rate targets in February of 2014. In May 2014, the MD Stadium Authority (MSA) engaged a Program Manager, City Schools Partners (CSP), who is staffed with personnel experienced with large school programs. Also that month, the IAC approved the first two schools; the renovation of Frederick Elementary School and the replacement of Ft. Worthington Elementary. MSA and City Schools selected architects for those projects in August, with design beginning in late September. Also in September, the IAC approved the Comprehensive Maintenance Plan (CMP), a selected number of maintenance performance metrics and City Schools’ utilization plan.
The biggest challenge encountered this year was meeting the preliminary 30-35 school prediction established last summer. That initial range was established prior to the feasibility study phase using limited information on each school. This preliminary information included the name of the school and square foot assumptions. Assumptions were also made as to whether the school would be a replacement or a renovation. The costs for the new schools were estimated by MSA and the renovations were estimated by the Jacobs Group. When the feasibility studies of the Plan Year 1 schools were completed with updated estimates this spring based on detailed information from each building, it became clear to the MSA that if our direction did not change the program would only be able to support 19-22 schools. The original estimates supplied by the Jacobs Group were noticeably lower than the current estimates. City Schools and MSA jointly decided to engage CSP to perform a program-wide review and to supply options to increase the number of schools impacted by the program.
The following recommendations were accepted by City Schools:
• Increase the target utilization rate for the new and renovated schools from 86% to 90%, where feasible.
• Increase the building efficiency factor through design efforts. • Increase use of existing structures for renovation projects.
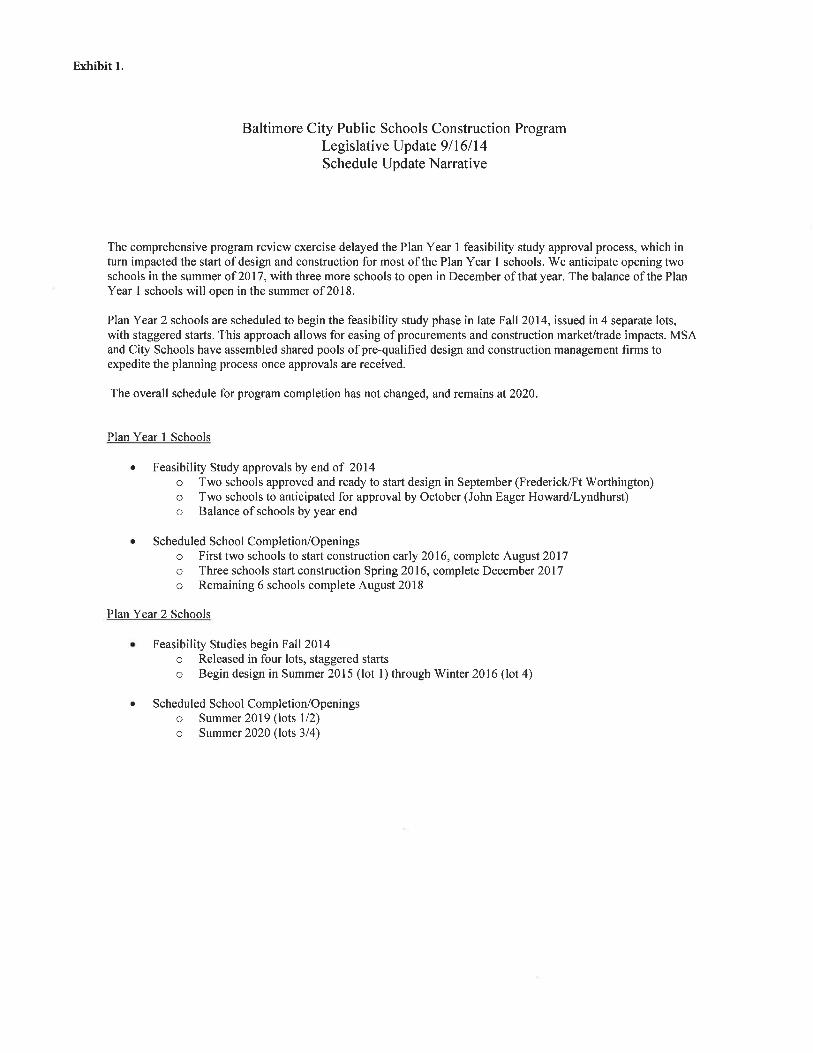
City Schools is also contemplating deferring two high schools and changing one elementary/middle school to an elementary school. These changes will have to be made through the Plan’s annual review and amendment process. With these accepted recommendations we believe the program will support between 23-28 schools. The comprehensive review of options for reducing costs and expanding the reach of the program to more schools delayed the majority of the Plan Year 1 feasibility study approval process, and therefore, the Plan Year 1 school opening schedules for most of the schools. We anticipate opening two schools in the summer of 2017, with three more schools to open in December of that year. The balance of the Plan Year 1
Page 1

schools will open in the summer of 2018. The schedule for program completion has not changed and remains at 2020.
MSA, City Schools, Baltimore City and the IAC have an excellent working relationship which will be required to endure the many unknown challenges in the years ahead. We all endeavor to maximize the use of these funds for the benefit of Baltimore City students and residents.
PROGRAM UPDATE
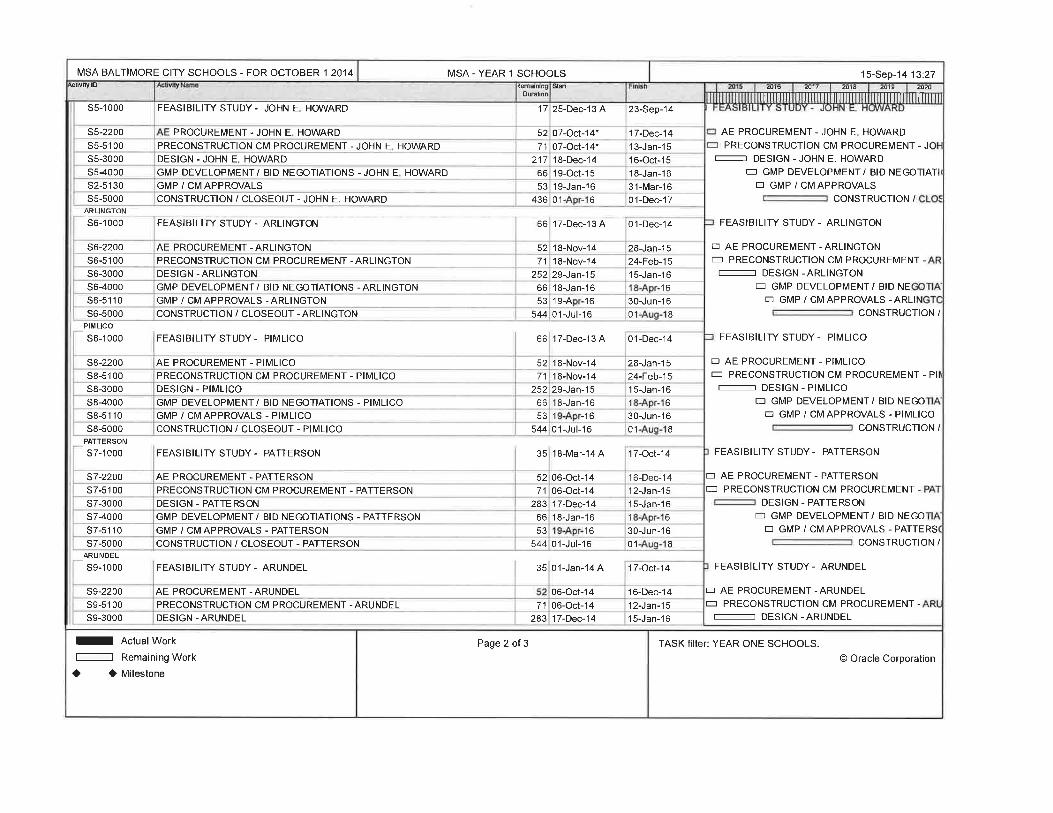
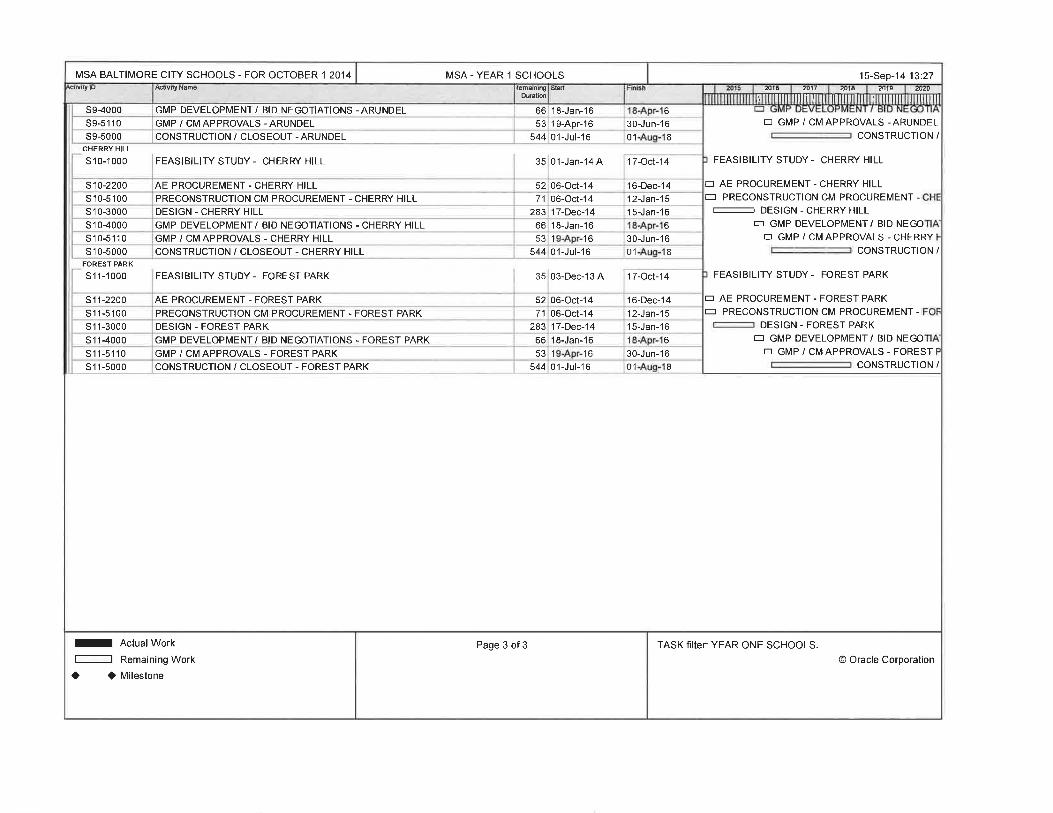
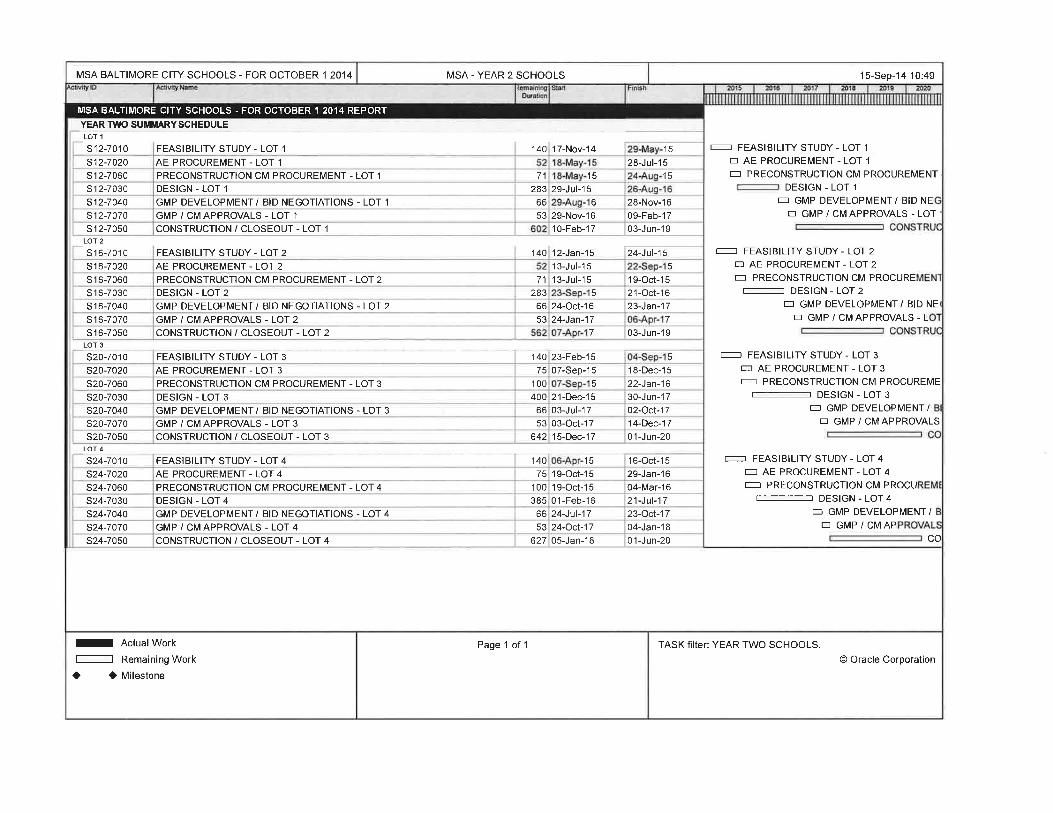
• Schedule
The schedule attached as “Exhibit 1” has been sequenced with the following phases of work: Feasibility Study, AE and CM Procurements, Design, Bid Negotiations/Approvals, and Construction/Closeout. Selection from the pre-established pool of Architects, Engineers and Construction Managers allows for the start of the design process. Development of the Guaranteed Maximum Price (GMP) and bid negotiations begins during the design. Once the design is completed and the GMP is finalized, then construction can begin.
Feasibility Studies have been started for all Plan Year One Schools. Two schools, Frederick Elementary and Ft. Worthington 1-8, have been approved to proceed to design. Feasibility studies for Lyndhurst and John Eager Howard are slated for approval by the BOC by the beginning of October, and Robert Poole is slated for approval later this year. Revised enrollment projections received on August 26, 2014 have caused revisions to the Arundel and Cherry Hill Elementary School feasibility studies, which were nearly complete. The education specifications for Forest Park High have been finalized and City Schools is working on a case study for Patterson High. City Schools has also advised that projected enrollment increases are expected for Patterson High and Claremont Special Education High. The feasibility studies for Cherry Hill, Arundel, Patterson and Forest Park should be approved by the BOC in October 2014. Arlington and Pimlico require changes to the Plan and will be addressed through the annual review and amendment process. These feasibility studies should be approved by the end of the year.
• Program Budget Review
In the spring of 2013, City Schools procured design services in order to conduct feasibility studies for Plan Year 1 schools based on educational specifications and stakeholder engagement, along with input and direction from City Schools. Independent cost estimates were performed as the studies were completed. This data was analyzed and extrapolated on a cost per square foot basis for the balance of schools identified in the program. As a result of this exercise, it became apparent in the spring of 2014 that the program would have challenges meeting the preliminary prediction of 30-35 schools. The MSA and City Schools then requested that CSP develop independent cost estimates and analyses of the schools included in the Plan Year 1 and Plan Year 2 schools.
Additionally, an analysis was performed to see if the current program square foot cost was within the range of other local jurisdictions. This review included the following jurisdictions: Baltimore City Public Schools, Baltimore County Public Schools, Prince George’s
Page 2

County Public Schools, Montgomery County Public Schools, Saint Mary’s County Public Schools, Anne Arundel County Public Schools and District of Columbia Public Schools.
o PROGRAM REVIEW FINDINGS
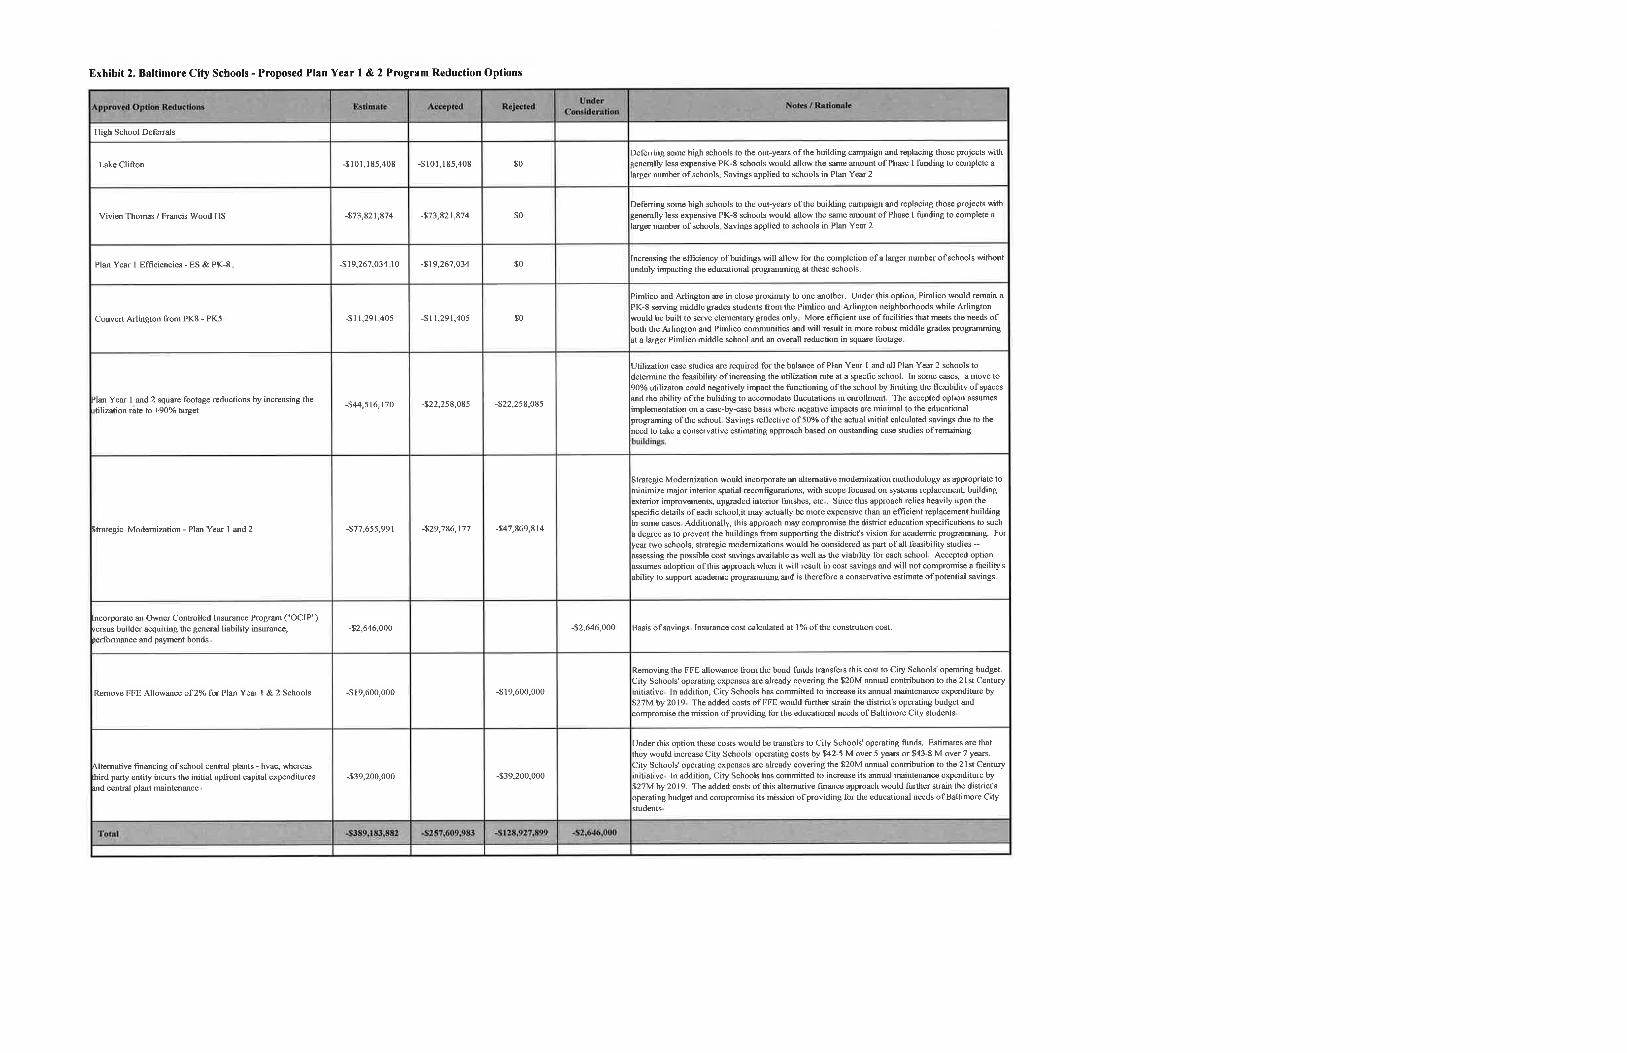
The BCSRP estimated program budget of $977M is based on expected bond proceeds from the annual $60 million of revenues over a 30 year period. The original projection of this budget was to fund 30-35 schools. Based on the estimates received in the spring, the budget would have only funded the design and construction of 19-22 schools. In order to maximize the number of schools to be included in Plan Year 1 and Plan Year 2 Budgets, the MSA, Baltimore City Schools and the program management team collaborated on cost reduction options. The following is the complete list of identified options:
- Defer two (2) high schools slated in Years 1 & 2 of the plan. - Identify additional program efficiencies in PK-8 schools by reducing square footage in
shared spaces (i.e., collaborative and teacher preparation spaces that minimize impacts on academics.)
- Consolidation and economies in the Career and Technical (“CTE”) program at high schools by reducing and/or sharing spaces for program offerings.
- Consider a strategic modernization approach for some schools, minimizing major interior spatial reconfigurations.
- Consider increasing the Plan Year 1 & 2 target utilization rates from 86% to 90%. - Seek alternative financing of school central plants - HVAC, where third party entity
incurs the initial upfront capital expenditures and central plant maintenance for long-term lease commitment from City Schools.
- Owner Controlled Insurance Program (OCIP) versus each builder providing insurance on a project by project basis.
After reviewing each of the aforementioned, the MSA and City Schools elected to incorporate the following cost reduction options:
- Deferral of two (2) Plan Year 1 & 2 high schools; Lake Clifton HS, and Vivien T. Thomas/Francis Wood Building. Deferrals will result in additional schools to be planned and constructed in Plan Year 2.1
- Reduce overall Program square footage: Pre-K/Elementary School – create additional program design efficiency by applying reductions in the size of commons for Pre-K/ Elementary, Pre-K/Middle, and High School
- Increasing the Plan Year 1 & 2 target utilization rates for each school from 86% to 90%, as a goal. (Note: the system-wide Utilization Rate target for the 2019-2020 school year remains 86%.)
- Incorporate strategic modernization methodology as appropriate at some schools to minimize major interior spatial reconfigurations, with scope focused on systems replacement, building exterior improvements, upgraded interior finishes and selected site improvements.
1 This recommendation requires action by the Baltimore City Board of School Commissioners. It will be voted on in December, 2014 as part of the annual amendments to the 21st Century Buildings Initiative.
Page 3

- Convert Arlington from an elementary/middle to an elementary school, resulting in a reduction in square footage.2
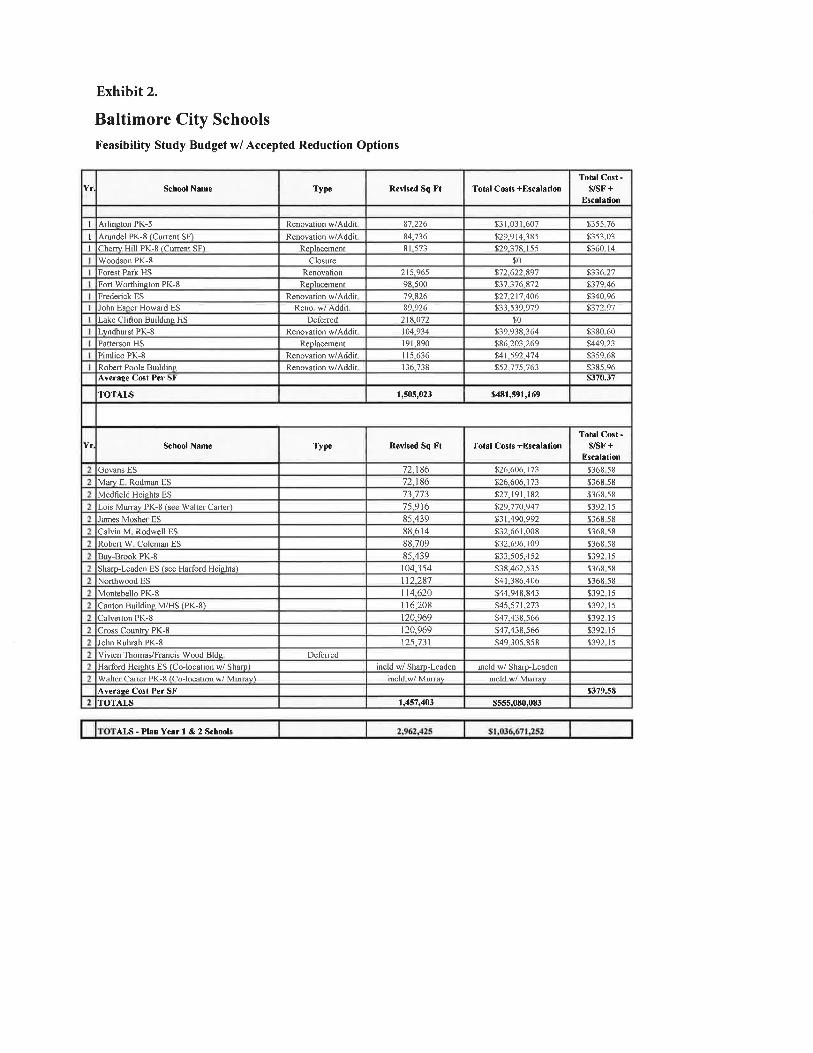
The MSA, City Schools and CSP shall continue to review additional efficiencies during design and will update the budget at every major milestone of the program. Attached as “Exhibit 2”, is the updated budget currently projecting 23-28 schools, reflective of the estimated cost reductions for Plan Year 1 & 2 schools. The updated budget includes the school name, plan year, type of construction known or assumed, revised square footage representative of elected reduction options, the total cost escalated up until the mid-point of construction and total cost per square foot.
o COST COMPARISONS
CSP collected bid results referenced in “Exhibit 2” from the following jurisdictions: Baltimore City Public Schools, Baltimore County Public Schools, Prince George’s County Public Schools, Alexandria City Public Schools, Montgomery County Public Schools, Saint Mary’s County Public Schools, Anne Arundel County Public Schools and District of Columbia Public Schools.
To compare the bid costs (represented as “construction costs” (which exclude costs such as design fees, FFE, 3rd party inspections, commissioning, etc.), each bid from the various jurisdictions was escalated three percent (3%) per year from the bid/award date to current market period. Likewise, the developed construction cost budget is inclusive of escalations, to the midpoint of construction, that had to be reduced to reflect a representative comparative analysis:
DC Public Schools $352 per sf Prince George’s County Public Schools $328 per sf Alexandria City Public Schools $321 per sf St. Mary’s County Public Schools $317 per sf Anne Arundel County Public Schools $288 per sf Montgomery County Public Schools $282 per sf Baltimore County Public Schools $259 per sf Average Construction Cost $307 per sf
Baltimore City Schools Average $309 per sf
• Collaborative Efforts
Pursuant to the Memorandum of Understanding (MOU) for the Construction and Revitalization of Baltimore City Public Schools, Sections II-B and C were adopted regarding workforce development and minority business participation as denoted below:
1. Minority Business Enterprises - Section II-C: The Collaborative and the Mayor’s Office of Minority and Women-Owned Business Development (“MWBD”) will
2 This recommendation requires action by the Baltimore City Board of School Commissioners. It will be voted on in December, 2014 as part of the annual amendments to the 21st Century Buildings Initiative.
Page 4
work to maximize the utilization of State-certified locally based minority and women-owned businesses.
2. Workforce Development - Section II-B: The City, the School Board, and the Authority agreed to establish and participate in a collaborative group (The “Collaborative”) to work together to maximize the opportunities for the City Schools’ students and City residents to be informed about, prepared for and connected to work-based learning and employment opportunities created by the Plan.
o MINORITY BUSINESS ENTERPRISES
In accordance with the MOU for the Construction and Revitalization of Baltimore City Public Schools, The Collaborative and MWBD will develop an outreach and inclusion plan, in compliance with Maryland State procurement guidelines, to be administered by MSA in partnership with MWBD for Funded 10-Year Plan Projects, and to make recommendations to the Executive Committee to implement this goal.
A Supplier Diversity subgroup, chaired by MWBD, was formed to create the outreach and inclusion plan with the goal of maximizing opportunities for local Minority Business Enterprises (MBEs). The Supplier Diversity subgroup is comprised of leaders from the region’s MBE advocacy organizations. The MSA, MWBD and City Schools Collaborative Sub-group developed a draft MBE Outreach and Inclusion Plan last spring. The plan is being finalized and will be presented for stakeholder input and review before the end of October, 2014. The goal is to share the plan and its progress regularly with community stakeholders and to leverage the subgroup members' organizations as primary communication channels.
Specifically, the MBE Outreach and Inclusion Plan's broad approach towards MBE inclusion highlights awareness, education and outreach to both MBEs and non-MBE contractors. The Plan also addresses review of requests for proposals and partnering with state and local technical assistance agencies to increase opportunities for MBEs.
- Awareness, Outreach and Intake
Develop a pipeline of the largest possible pool of certified small businesses. It is necessary to identify as many firms as possible through all information distribution channels available on a regular basis. This includes all media communication channels, professional business group lists (email included), churches, community organizations, cities, states, etc., who have established lists that include businesses and incorporate an “intake” process to capture the needed information for effective use.
- Outreach Process
1. Continue to hold awareness outreach sessions in three categories: General Outreach, Partnership Outreach Workshops and Government Program Outreach.
2. General Outreach Sessions: Created to announce the construction projects, their project scope and schedule and to provide knowledge on prime and subcontracting opportunities.
Page 5

3. Partnership Outreach Workshops: Participate in efforts created by community and industry organizations.
4. Government Program Outreach: Leverage the use of existing Baltimore City and County government programs available throughout Baltimore and the surrounding area.
It is imperative to the success of the program to fill the pipeline with qualified, prepared contractors with the capacity to perform contract responsibilities. The goal of the intake process is to efficiently and effectively evaluate the capacity of small business vendors in a structured approach to ensure maximum participation and building capacity for small businesses.
The MBE Collaborative’s next steps are to:
1. Finalize the M/WBE Participation and Inclusion Plan 2. Continue Awareness and Outreach Sessions Aligned with Future Procurements 3. Develop Program Wide Reporting
o WORKFORCE DEVELOPMENT
In accordance with the MOU, The Mayor’s Office of Employment Development (MOED) is charged with developing a comprehensive local hiring plan to support the goals of the Collaborative. This plan will leverage the resources of MOED’s One Stop Career Center Network and work collaboratively with a broad range of City educational, workforce/training, faith-based and community organizations to assist in the training and preparation of City residents for employment opportunities created by the BCSRP.
A Workforce Opportunities/Work Based Learning subgroup, chaired by MOED, has been formed to ensure that the local hiring plan maximizes opportunities to prepare and connect both City residents and City Schools’ CTE program students to employment opportunities, while streamlining the hiring process for employers. The subgroup typically meets on a monthly basis and collectively supports and promotes the key components of the local hiring plan that meets the job seeker’s and the employer’s needs and includes a broad based outreach and communications effort. MOED, along with the Workforce Opportunities/Work Based Learning subgroup is developing a draft Local Hiring Plan that is scheduled to be finalized in October of this year.
In addition to drafting of the Local Hiring Plan, several supporting documents have been drafted to support the implementation of this initiative:
- A draft visual graphic that aligns with the local hiring plan. - A list of frequently asked questions to support consistency in messaging. - A draft communications plan and RFP language for the Construction Managers
that received review and comment from the subgroup.
The next steps for the Work-Based Learning Local Hiring Collaborative Sub-Committee are as follows:
Page 6

- Finalize CM RFP Language and develop forms to be completed by the CM’s and their respective subcontractors.
- Finalize the Local Hiring Plan for Partners and Stakeholder review. - Coordinate and manage logistics for implementation with all organizations that
will support the implementation (Training organizations, Community Based Organization, etc.).
- Finalize Communication Plan and begin implementation - Integrate aforementioned information into the website.
MAINTENANCE
A. The Comprehensive Maintenance Plan
General
On September 11, 2014, the IAC approved the CMP, with comments as shown below. Per the MOU, the CMP is to include specific content areas and is to be tied to certain Maintenance Performance Metrics (the Metrics) that will be used by the IAC to determine if progress is made in the improvement of maintenance when evaluating projects in the annual Capital Improvement Program (CIP) and the BCSRP. While certain required elements of the CMP and the Metrics cannot be completed at this time, pending full implementation of the Computerized Maintenance Management System (CMMS), the asset inventory, and completion of the template Building Maintenance Plan (BMP), all of which have begun, the IAC recognizes that the CMP meets the overall intent of MOU Section 11.B. The CMP details specific changes to staffing, budget, and organization and provides for a level of measurable accountability.
While progress has been made in City Schools maintenance since the mid-2000's, certain areas of maintenance need to continue to be developed to ensure projects funded through the Plan, as well as other State and local investments, will meet the needs of students for years to come. These include:
• Coordination among all the facility branches of City Schools, between the facility department and school-based administrations, and between City Schools and private and City of Baltimore entities that operate educational and recreational programs in City Schools’ facilities.
• Appropriate staffing for the number and age of City Schools’ facilities, including not only adequate numbers of staff members, but also with appropriate qualifications, accountability measures, and training.
• Efficient organizational structure with leadership coordinating all facility management functions with effective intermediate levels of management and oversight, and full accountability and integration of school-based personnel with central office operations and management.
The approved CMP and the specific Metrics represent a very important step toward achievement of these broad goals.
Page 7
I. Background of the CMP
The Baltimore City Public Schools Construction and Revitalization Act of 2013 mandates that the MOU shall require:
“[a] plan developed by the Baltimore City Board of School Commissioners and approved by the Interagency Committee on School Construction for preventative and ongoing maintenance for existing, new, and renovated Baltimore City public school facilities, including funding sufficient to implement the plan.” §10-646(E)(11).
II. Requirements of the MOU
Building Maintenance Plan (Section C) The CMP “shall contain a template or templates for the building Maintenance Plan (“BMP”) of individual new, renovated, and existing School Buildings.” The BMP will be “supplemental to and complementary to” the usual Operations and Maintenance (O&M) manuals that are provided at the end of construction projects. The longer-term goal is to extend the practice of developing BMP’s to include all school buildings in the City Schools system.
Maintenance Performance Metrics (Sections D and E) Following approval of the CMP, City Schools will have six months to develop maintenance Metrics to be approved by the IAC. The MOU requires that the annual budget of City Schools “include funds sufficient to achieve progress toward the attainment of the Metrics.” Progress toward achievement of these Metrics will be one of the factors that the IAC will examine in considering future project approvals, beginning in the fall of 2015.
Release of Construction Funding (Section F) The release of construction funds by the Maryland Stadium Authority will be predicated on two conditions:
a. The BMP for the subject school must be approved by the IAC with comment by the Authority; and
b. the maintenance Metrics, as reported annually by City Schools (Section D.5), must “demonstrate progress acceptable to the IAC with comment by the Authority.”
III. The Comprehensive Maintenance Plan
Brief History On December 17, 2013, the BOC approved the CMP. In response to comments provided to City Schools in February 2014, City Schools submitted a revised CMP. Beginning in May 2014, staff of the IAC and City Schools met weekly to discuss the revision as well as the metrics required under the MOU. The BOC approved a final CMP on August 12, 2014, which the IAC approved on September 11, 2014, with comments by MSA.
IAC Approval of the CMP: The CMP meets the basic intent of the MOU If the CMP is supported with adequate resources over a sustained period, it will lead to an increase of staffing and an organizational restructuring that will generate significant improvement in the management of City Schools’ maintenance:
Page 8

• The CMP establishes a clear linkage between the maintenance of facilities and the historic opportunity presented by the Act. The document addresses not only the future maintenance of the projects that will be constructed using MSA bond proceeds, but also the approximately 100 school buildings that will remain following the closure of the 26 facilities listed in Exhibit 6 of the MOU. It introduces a high level of accountability into the overall progress of school maintenance.
• The CMP provides year-by-year measures of budgetary increases, staffing increases and organizational restructuring:
An increase of funding of $3 million per year for FY 2015 through FY 2023, which will lead to an increase in the total budget for Maintenance and Repairs from the current FY 2014 figure of $15.5 million to $31.3 million in FY 2019. On a per-square foot basis, this means an increase from the current $0.89/sf/year to $1.98/sf/year. While this annual increase represents a significant commitment, the IAC notes that it would be preferable if the annual increase were cost adjusted per the CPI or another measure and that there are numerous opportunities for efficiencies in facility management (e.g. energy conservation) that can substantially supplement the proposed annual increase.
An increase of staff for the Department of Facilities, Maintenance and Operations (FM&O) over the next five (5) years from the current 98 to a total of 182 (with a concurrent reduction of square footage per FTE from the current 177,348 sf/FTE to 86,885 sf/FTE). This will align City Schools with other Local Education Authorities (LEAs) of comparable size.
Incorporation of the facility component of the School Network into FM&O, and an increase of the number of regional maintenance teams from three (3) to 10. The Educational Building Supervisors (EBS) will report to the Chief Operational Officer rather than to the Chief Academic Officer, and the EBSs will lead the 10 regional teams.
Implementation of both a facility inventory and a Computerized Maintenance Management System (CMMS), currently under procurement through City Schools, with participation by the Maryland Stadium Authority. The inventory has been started using City Schools staff, and will be augmented by a consultant.
A list of Maintenance Performance Metrics, as required by MOU Sections 11.D and 11.E. Further development of the Metrics depends on: a) implementation of the CMMS system and b) development of the full asset inventory.
IAC Comments:
The MOU elements that are not addressed within the CMP are expected to be corrected or completed within a reasonable timeframe:
1. Exhibit 7 Omissions. Section 11.B of the MOU specifies that the “content of the CMP shall be as provided in Exhibit 7.” The submitted CMP includes most, but not all, of the elements specified in Exhibit 7. Specific elements that are missing include:
Page 9
a) Comparable Urban School Districts (MOU Exhibit 7 Sections 5.d and 5.e, “Budget” and 6.b, “Staffing parameters”). City Schools has examined the maintenance budgets and staffing of two major school systems, Montgomery County Public Schools in Maryland and Chicago Public Schools in Illinois, and one mid-size district, Frederick County Public Schools in Maryland. It also examined a number of industry standards. City Schools should study Baltimore County and Anne Arundel County Public Schools for valuable information on executive and technical staffing, organizational structure, coordination of activities, and methods for addressing vandalism and other community impacts.
b) Computerized Maintenance Management System (CMMS) (MOU Exhibit 7 Section 7.b, “Procedures”). The CMP does not include procedures for the CMMS because procurement of the system is now in process, with a vendor scheduled to be selected by the end of the calendar year.
c) Departmental and divisional action plans for upcoming fiscal year (MOU Exhibit 7 Section 9). Although the CMP lacks specific action plans, the overall chart showing the increase of staffing and budget will provide guidance for actions in FY 2015.
d) Templates for Building Maintenance Plan (MOU Exhibit 7 Section 10.h). The BMP template is under development, using the recently opened Waverly PK-8 School as a pilot.
e) Prioritized list of maintenance and capital replacement projects to be accomplished in the budget year and future fiscal years (MOU Exhibit 7 Section 10.j). The CMMS system will provide the platform for establishing the asset inventory, leading to the complete annual list of prioritized projects.
2. Maintenance Performance Metrics. City Schools has developed a separate Metrics document (see below).
3. October 2014 CMP Submission. The MOU requires that “the CMP shall be updated annually in accordance with the BPW Regulations (COMAR 23.03.02) and shall be submitted annually by October 15 of each year.” Section 11.A.5. The October 2014 CMP submission should discuss the status of:
a) The elements noted in Item 1 (above) that are listed in Exhibit 7 but are not included in the CMP of August 12, 2014.
b) Detailed discussion of the status of the Metrics and their application, including the status of Metrics that remain to be developed.
c) Submission of the BMP template, based on the pilot BMP currently under development.
d) Correction of relatively minor inconsistencies in budgetary and staffing figures.
Page 10
e) Expansion of the peer comparisons to include Anne Arundel County Public Schools and Baltimore County Public Schools, and possibly Prince George’s County Public Schools as well.
B. Maintenance Performance Metrics
I. General
In accordance with the MOU, the IAC approved 13 Maintenance Performance Metrics on September 11, 2014. In order for IAC to be able to review one year of Metrics when it evaluates projects submitted in the fall of 2015, City Schools and IAC staff worked cooperatively over the summer to develop Metrics that could reasonably be populated with existing information. As the City Schools inventory of assets is completed in the coming years and as the new CMMS system is implemented in 2015, the roster of Metrics will be expanded and the current approved Metrics will be made more complete and more accurate.
IAC Approval of the Maintenance Metrics The Metrics approved by the IAC cover the four areas required by the MOU:
1. Staffing parameters (Staffing Domain, SD):
a. Metric SD 1: Fill 20 FM&O vacant positions (existing and newly funded) by June 30, 2015.
b. Metric SD 2: Reduce the square footage per FTE to 157,617 square feet in FY 2015, a 13% improvement in this critical factor. The long-term goal is a reduction of square footage per FTE by 52 %.(86,885 sf/FTE).
c. Metric SD 3: Implement training program and plan evaluation system for Fiscal 2016 implementation, with a budget target of $10,000 FY 2015.
2. Work order parameters. These are divided into two domains, Preventive Maintenance (PM) and Repair Work Orders (RM).
a. Metric PM 1: Establish six (6) staff positions whose primary work is preventive maintenance. “Primary work” is measured as 75% of working time.
b. Metric PM 2: Effectively schedule time for preventive maintenance activities, with the actual hours expended on PM matching the scheduled hours.
c. Metric PM 3: Plan and direct contractor resources to preventive maintenance activities, with the actual contractor costs for PM matching the scheduled costs.
Metric PM 4: Decrease the number of unscheduled and emergency work orders, measured as a percentage of the total work orders accomplished, indicating movement toward a proactive maintenance program. With the implementation of the new CMMS system, the completion of the asset inventory, and other reforms, a new baseline for work orders will be established in the fall of 2015.
Page 11
d. Metric RM 1: Improve the average hours to complete emergency and repair work orders.
e. Metric RM 2: Improve response time to complete emergency and repair work orders.
f. Metric RM 3: Reduce the percentage of open emergency and repair work orders.
g. Metric RM 4: Reduce the average age in days of open emergency and repair work orders.
3. Inspection parameters (Inspections Domain, ID):
a. Metric ID 4: Complete City, State and Federal mandated inspections. The number and accuracy of the inspections will increase with the implementation of the new CMMS and the completion of the asset inventory.
4. Computerized Maintenance Management System (CMMS Domain, CMMS):
a. Metric CMMS 2: Initiate activities to inventory physical plant assets in buildings that will not be commissioned through the 21st Century Buildings Plan financing. This activity has begun.
The following Metrics required under MOU Section 11.E are not available at this time:
Metric 2. Work order parameters
b. Number of outstanding work orders permissible at any time.
Metric 3. Inspection parameters:
a. Routine scheduled tours of all School Buildings by maintenance teams. The routine tours will change with the proposed increase from three maintenance regions to ten.
Metric 4. Implementation of a CMMS system:
d. Percentage of major building systems operating within industry age standards. This Metric cannot be carried out until the building inventory is at least partially complete.
e. Deferred maintenance backlog (as percentage of total building plant value). The deferred maintenance backlog of $976 million is at present based on the parametric model method. A far more accurate figure will be obtained when the asset inventory is complete.
The balance of the Metrics required under the MOU are: a) in development, to be submitted for IAC approval and MSA comment within the next year; b) dependent on implementation of the CMMS system, which is now in procurement with the participation and approval of MSA; or c) dependent on the development of a thorough building inventory, a multi-year task that will be completed in conjunction with the implementation of the CMMS.
Page 12

UTILIZATION
At the completion of the Plan, the updated goal is to have an efficient inventory of schools operating, on average, at or above 86% utilization. Utilization is the result of the September 30th student enrollment projections divided by the Maryland State Rated Capacity (SRC), approved annually by May 1. Initially, each project in Year 1 was defined so that the projected enrollment would be approximately 86% of the proposed capacity. CSP recommended to MSA and City Schools that all the school capacities be revised before the next phase of the design process and, to ensure building and space efficiencies, that the school specific capacities will use a target of 90% utilization where feasible.
• Design Efficiencies
The Maryland Public School Construction Program establishes a state funded maximum gross area allowance that is on a sliding scale based on school size. The one currently on line is dated September 2011 and gives the following ranges:
Elementary 104-118 SF per student Middle 130-145 SF per student High 145-170 SF per student Special Education 180-200 SF per student CTE 210 SF per student
This maximum allowance standard is low based on regional data on median square footage per student. According to the most recent School Planning and Management Construction Report (2/2014), the median square feet per student in new schools regionally was:
Elementary 148 SF per student Middle 186 SF per student High 200 SF per student
City Schools’ building specific education specifications are comparable to regional median square foot per student. Throughout the development of site specific educational specifications, City Schools and CSP staff has identified possible areas for increased efficiencies and will work to incorporate these cost-saving alterations where feasible. City Schools’ staff has indicated that they will continue to review efficiency options and make the final determination on how additional efficiencies can be achieved, based on each individual school, and the ability to meet the targets without compromising academic spaces and needs of students and staff.
• Enrollment Projections
Enrollment projections are prepared by City Schools’ staff using a modified cohort model that tracks historic trends (Grade progression ratio). A full description of the methodology and the resulting forecast is in Chapter 3 of the Comprehensive Facilities Master Plan SY2014 (CFMP). This methodology is consistent with the State of Maryland Planning methodology in most ways. The most notable difference being in the way City Schools projects kindergarten using historic trends vs. using a cohort model with birth data. The current forecast is within 5% of the state provided forecast.
Page 13
The challenge for City Schools is projecting student enrollment at the individual school level. These projections are used to determine the design capacity of schools in Plan Year 1 and 2. As noted in Chapter 3 of the CFMP, “Enrollment projections in Baltimore present many nuances and difficulties with 30% students out of zone at the elementary level, and Choice options, which allow middle and high school students to select from schools within their middle grade quadrant or from all high schools within City Schools.” Additionally, historic trends are not as accurate where there are consolidations, grade reorganizations and facilities changes. With the commitment to a specific utilization target and scrutiny of the project scopes, City Schools wants to minimize the volatility of the enrollment projections from year to year and increase the accuracy.
Currently, CSP is conducting interviews with other school districts with similar characteristics to Baltimore to determine if there are alternative and/or supplemental methodologies that would create more reliable and consistent projections for facilities planning purposes. City Schools has also formed an internal cross-departmental working group to explore alternative methodologies presented by CSP and other urban jurisdictions. The district is also exploring methodology to improve assumptions related to middle and high school demand for schools through the choice process. At the end of September, City Schools will issue a request for proposals to solicit a consultant to develop a demand modeling analysis to inform the enrollment projections analysis for middle and high school choice.
EDUCATIONAL SPECIFICATIONS
There is significant ongoing research regarding the impact that design of school facilities has on student success. Much of this recent research supports the fact that spaces designed appropriately based on the educational philosophy of the school enhance the success of the program and also improve student outcomes. With that in mind, the spaces and priorities included in the Educational Specification Standards (Ed Specs) for Baltimore City Schools are intended to support engaging, interactive education that will allow students the opportunity to practice and perfect the skills essential to achieving success in the 21st Century learning environment and workplace. Creating educational environments that inspire and nurture critical and creative thinking, communication and the ability to express ideas, personal initiative, responsibility and a student’s ability to impact their learning experience in a personalized way is the goal of City Schools. Providing the opportunity for students to not only be taught, but to learn and practice these skills and many more is at the heart of these Ed Spec Standards. Below is a summary of the process used to develop the basis of the Educational Specification, the Ed Spec themes that support core spaces included in the District Ed Specs and the discussion of school sizes as it pertains to building efficiencies.
• Engagement Process
The development of the current Ed Specs for City Schools began in March of 2013. Over a period of five months, the interdisciplinary team facilitated and engaged in an intensive collaborative effort with stakeholders throughout the district. This collaboration included the following steps: 1) A series of sessions with a designated core committee that continued throughout the process, 2) Nine days of educator workshops with sessions focused on individual disciplines and building functions, 3) Two full days of workshops with many community groups
Page 14

represented, 4) A two day interdisciplinary retreat with City Schools’ personnel and directors, and 5) Several community question and answer sessions open to all stakeholders. This information gathering culminated in a draft document that was posted on the City Schools’ website in summer of 2013 for community comment and review. This intensive effort to involve and seek input in such an inclusive manner helped to ensure that the Ed Specs reflected both the needs and the vision of the communities, while also aligning with the educational goals of City Schools in a comprehensive way.
• Ed Spec Themes
Several themes arose repeatedly amongst the discussions with educators and community stakeholders, revolving around employing the latest thinking in educational trends in the development of school facilities. The general narrative in Part 1 of the Ed Specs, as well as the specific space descriptions in the prototype Ed Spec, reflect these ideas. The most impactful area of focus throughout the development of the Ed Specs was the goal for all facilities to support 21st Century Education. Three core concepts define the unique elements surrounding 21st Century Education have had the most impact on the design process. These concepts are:
1. Clusters 2. Smaller learning communities within a larger school setting, appropriate for each school
program 3. Create neighborhoods of students and teams of teachers 4. Planning areas and resource rooms to support each cluster 5. Collaboration 6. Learner-focused space to allow all students the opportunity to participate in student
focused, hands on, interactive learning experiences 7. Allow students to create choices about where and how they learn while supporting
teachers as learning facilitators 8. Flexible to suit each schools unique environment 9. Support teacher collaboration to provide a comprehensive individualized education for
each student. 10. Community Use 11. Unique to accommodate the needs for each community 12. Multifunctional shared space used for the community after school hours
These concepts are believed to be essential components in the process for achieving student success and the mission of City Schools, as well as reflect proven educational trends which are recognized regionally as well as globally.
• School Size
In the past five to ten years, total school sizes have nationally and regionally tended to trend upward in square footage per student. The component of this trend related to an increased building area is due in part to the emerging requirement for facilities to provide program areas which include more flexible, interactive student centered spaces.
In general, it should be noted that because many of the required support spaces and circulation spaces cannot change proportionally with school size, the smaller the school
Page 15

population the larger the square footage per student will be. This applies in reverse as well. Per School Planning and Management’s 19th Annual School Construction Report3, square footages for schools built in our region average 148 square feet per student for elementary schools, 186 square feet per student for middle schools and 200 square feet per student for high schools. The square feet per student reflected in City Schools’ Ed Specs is comparable to these regional trends. At the crux of the issue is the desire to preserve teaching and learning environments that support high quality instruction while achieving building efficiency and maximizing tax-payer investment. For example:
1. Incorporate open dining to allow dining, media, and collaborative spaces to integrate, reducing the need for individual program space.
2. Use the media commons area in conjunction with the collaborative space to allow for multi functioning spaces.
3. Allow teachers to move between classrooms and share spaces as needed. 4. Allow the collaborative spaces to function as the media centers, robotics labs, reading
centers, green houses, etc., depending on the needs and the educational vision of the school.
• Progress and Next Steps
During the development of the Site Specific Ed Specs, slight deviations were added to the district-wide prototype to address school-specific programmatic needs and community space allowances of up to 3,000 square feet. During the development of Year 1 Ed Specs, due to limited internal staff capacity, City Schools utilized architect consultants from different firms to develop the Ed Specs. This created a lack of consistency in methodology based on the varied levels of expertise of the firm selected to develop the specs. Since the initial development of Year 1 Ed Specs, the site specific Ed Specs are being refined with the assistance of CSP and new educational planners hired by City Schools’ planning department, resulting in consistent methodology and outcomes. CSP and City Schools are paying closer attention to school size as it relates to building efficiencies and utilization. In addition, we are clearly defining the community space needs rather than retaining an open-ended allowance in the Ed Specs with the support of partner organizations.
For example, in review of the high schools, CSP served as a great resource, assisting City Schools in the review of the inclusion of Career Technology Education (CTE) spaces in the Ed Specs. As CTE spaces were not defined in the District-wide prototype, City Schools’ staff also worked with the State representative at MSDE division of Career and College Readiness to assess how other Maryland jurisdictions allocate CTE spaces. City Schools’ staff worked in conjunction with CSP and an internal consultant from Grimm and Parker to identify ways to increase sharing of CTE labs and teaching stations better optimize space and align the CTE seats with the planned student population. These collaborative efforts helped City Schools’ staff revise
3 School Planning and Management, (2014). 19th Annual School Construction Report. School Planning and Management 53, 2, p. 16-29.
Page 16

the Ed Specs to gain significant efficiencies among CTE spaces, which significantly improved the utilization in the high schools.
The extensive amount of collaboration with CSP, Grimm and Parker, and MSDE staff has been a valuable resource for City Schools’ staff to further refine the site specific Ed Specs. This work will continue to progress with City Schools understanding of building efficiency concerns, in-house educational planners, and external work with partners, such as the Family League, to better define community space needs.
In conclusion, the comparison of City Schools’ Ed Specs to regional data, as well as the research undertaken as part of the Ed Spec process, depicts that these standards are in keeping with educational trends both nationally and regionally. These standards show a slightly conservative approach to overall school size. City schools, the MSA, and CSP will continue to analyze site specific Ed Specs and designs to ensure that appropriate efficiencies, utilization rates, and flexibility are incorporated in all designs.
Page 17
ACCOUNTING UPDATE
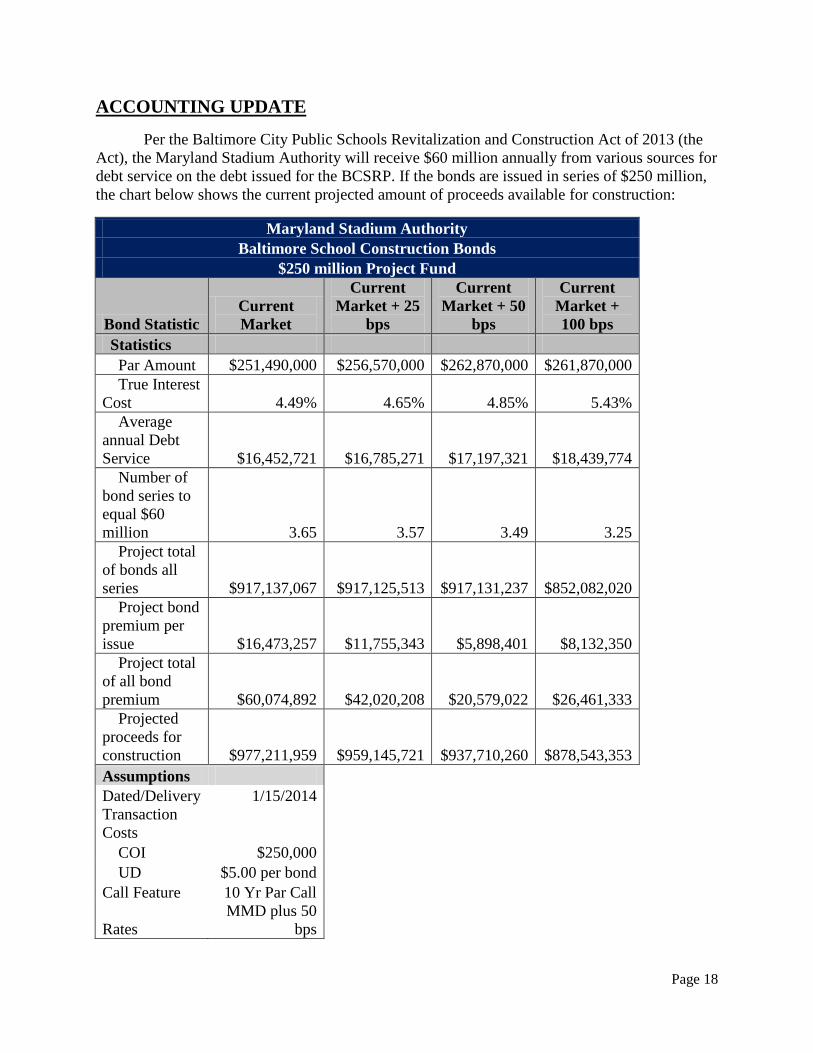
Per the Baltimore City Public Schools Revitalization and Construction Act of 2013 (the Act), the Maryland Stadium Authority will receive $60 million annually from various sources for debt service on the debt issued for the BCSRP. If the bonds are issued in series of $250 million, the chart below shows the current projected amount of proceeds available for construction:
Maryland Stadium Authority Baltimore School Construction Bonds
$250 million Project Fund
Bond Statistic Current Market
Current Market + 25
bps
Current Market + 50
bps
Current Market + 100 bps
Statistics Par Amount $251,490,000 $256,570,000 $262,870,000 $261,870,000 True Interest
Cost 4.49% 4.65% 4.85% 5.43% Average
annual Debt Service $16,452,721 $16,785,271 $17,197,321 $18,439,774
Number of bond series to equal $60 million 3.65 3.57 3.49 3.25
Project total of bonds all series $917,137,067 $917,125,513 $917,131,237 $852,082,020
Project bond premium per issue $16,473,257 $11,755,343 $5,898,401 $8,132,350
Project total of all bond premium $60,074,892 $42,020,208 $20,579,022 $26,461,333
Projected proceeds for construction $977,211,959 $959,145,721 $937,710,260 $878,543,353 Assumptions
Dated/Delivery 1/15/2014 Transaction
Costs COI $250,000 UD $5.00 per bond Call Feature 10 Yr Par Call
Rates MMD plus 50
bps
Page 18

The following is the information for the fiscal year ending June 30, 2014:
REVENUES
The MSA received $18.0 million from Baltimore City, which includes $8.0 million in bottle tax revenues and $10.0 million generated through the Guaranteed Tax Base component of the Bridge to Excellence formula by the agreement between the City, State and City Schools to include Retiree Healthcare Payments as part of the City maintenance of effort funding.
EXPENSES
The MSA incurred $1.0 million in expenses for the fiscal year. The following report identifies the expense categories and the amount spent on each. Below is an explanation of what is included in each of the categories:
- Salaries, Wages & Fringe Benefits: The total spent for the fiscal year is $563,938. This is for MSA personnel that spent time working on the BCSRP. There are full time positions (4) and positions allocated (11) based on the amount of time dedicated to the program. There are currently vacant positions (4). Benefits include FICA, insurance, retiree’s insurance, pension, and unemployment. These items are approximately thirty-five percent (35%) of the amount in this category.
- Communications: The total spent for the year is $1,833. This is for landline service and cell phone service.
- Travel: The total spent for the fiscal year is $2,253. This is for travel to and from meetings plus attendance at MBE functions.
- Other Contractual Services: The total spent for the fiscal year is $319,177. This included estimating, software, office staff support, equipment leases, printing and duplicating, legal, program management services, and overhead.
- Supplies and Materials: The total spent for the fiscal year is $32,173. This included supplies to open the new offices for the Capital Projects Development Group.
- Furniture and Equipment: The total spent for the fiscal year is $31,967. This was for office furniture and equipment for the new offices for the Capital Projects Development Group.
- Fixed Charges: The total spent for the fiscal year is $63,317. This is primarily office rent of $10,200 a month starting in January 2014. Also included are dues and subscriptions for about $2,100.
At the end of the fiscal year, there is $16.9 million cash remaining. A third party accounting firm performed a review of this information and copy of the report is available upon request.
Page 19

Maryland Stadium Authority Pgm 56 & 57 - Baltimore City Public Schools
Statement of Revenues and Expenses 12 Periods Ended 6/30/2014
CURRENT BUDGET
YTD YTD
REVENUES: Total Revenues $18,000,000 $18,000,000
EXPENSES: Subtotal-Salaries, Wages & Fringe Benefits
(Object .01) $563,938 $1,770,709
Subtotal-Technical and Special Fees (Object .02) $0 $0
Subtotal-Communications (Object .03) $3,601 $22,000
Subtotal-Travel (Object .04) $3,563 $27,040
Subtotal-Contractual Services (Object .08) $319,177 $3,024,000
Subtotal-Supplies and Materials (Object .09) $32,173 $12,000
Subtotal-Equipment Additional (Object .11) $31,967 $402,500
Subtotal-Fixed Charges (Object .13) $63,317 $164,000
Subtotal-Land and Structures (Object .14) $0 $0
Total Expenses $1,017,736 $5,422,249
End of Report
Page 20

EXHIBITS