memorandum - sec.gov · 3 tests find that, compared to the control sample, inclusion in the pilot...
TRANSCRIPT

MEMORANDUM
TO: FILE
FROM: DIVISION OF ECONOMIC AND RISK ANALYSIS1
SUBJECT: CORNERSTONE ANALYIS OF THE IMPACT OF THE OPTION PENNY PILOT PROGRAM ON MARKET QUALITY
DATE: DECEMBER 18, 2017
The Division of Economic and Risk Analysis contracted with Cornerstone Research (“Cornerstone”), an economic and financial consulting firm, to conduct analyses related to investigating the effects on market quality of the continuing pilot program that allows certain exchange-traded options to be quoted in reduced price increments2 (“Option Penny Pilot” or “Pilot”). Cornerstone’s analysis uses quoted and effective spreads as measures of market quality.3 Effective and quoted spreads are frequently used as measures of trading costs and are especially useful in assessing overall market quality for retail investors.4 The Division believes that the methodology employed by Cornerstone in the analysis is appropriate to address the questions presented and agrees with the conclusions drawn by Cornerstone based on that analysis.
Main Finding: The Cornerstone analysis finds that inclusion in the Pilot is associated with a statistically significant decrease in effective and quoted spreads for the most liquid options - those with trading volume in the top five percent of the universe of all listed option classes.5 However, for less liquid options, the results do not suggest that inclusion in the Pilot has a significant effect on
1 This is a memorandum by the Staff of the Division of Economic and Risk Analysis of the U.S. Securities and Exchange Commission. The Commission has expressed no view regarding the analysis, findings or conclusions contained herein.
2 More specifically, the Pilot specifies that options trading at less than $3.00 have trading increments of one cent, while those trading at $3.00 or more have trading increments of five cents. Options not in the Pilot have corresponding minimum price increments of $0.05 for options trading below $3.00 and $0.10 for options above $3.00. The Pilot makes an exception for options on the QQQQ, IMW and SPY which trade at or above one cent increments, regardless of price level.
3 In Cornerstone’s analysis, spreads are volume-weighted across different trades in an option series, and then equally weighted across option series, in order to obtain spreads for the option-class day. Those spreads are then equally weighted across different days in the pre-event month and the post-event month, respectively, in order to obtain option-class month observations.
4 “Decimal Pricing Has Contributed to Lower Trading Costs and a More Challenging Trading Environment,” GAO report, May 2005, at 3 (available at http://www.gao.gov/new.items/d05535.pdf).
5 Note that Cornerstone’s analysis on option classes on common stock incorporates data on 3,833 option classes and 1,331,185 class-day observations.

2
market quality. Cornerstone reports that the option classes added to the Pilot were mostly chosen from the most liquid and heavily traded option classes.6
Comparison to Analyses of Self-Regulatory Organizations: Several Self-Regulatory Organizations (SROs) conducted analyses of the effects of the Options Penny Pilot. The SROs made these analyses available on their websites.7 The reports of the SROs focus on the activity on their own exchanges; none of the reports takes a holistic view of the Pilot on all exchanges. Also, their analyses typically did not use control samples. Finally, the most recent of the publicly available reports from an SRO dates from 2013, and thus the Cornerstone analysis covers more recent time periods.8 However, the SRO analyses generally agree with the conclusions drawn from Cornerstone’s analysis that the Pilot was associated with a narrowing of spreads. Analysis: Cornerstone’s analysis uses quoted and effective spreads as a measure of market quality, and it employs two methodologies. The first methodology uses a univariate “difference-in-differences” approach, in which the changes in quoted and effective spreads during the Pilot for options classes included in the Pilot are compared to contemporaneous changes in spreads for a control sample of option classes that were not included in the pilot. Options classes included in the control sample were matched on option class volume and underlying market capitalization. This sample was referred to as the “matched sample”. The second methodology uses multivariate regression models to explain variation in the quoted and effective spreads before and after option classes were added to the Pilot. These models include independent variables to control for other factors that can impact spreads, including option volume, underlying stock volume, and underlying stock volatility. Using data on options on common stocks added to the Pilot between January 26, 2007 and January 5, 2016,9 both methodologies have similar findings. The “difference-in-differences”
6 Although some of the original thirteen options were not among the most liquid, most heavily traded options, the order approving the commencement of the penny pilot program describes the selection of the initial option classes as follows; “The Commission believes that the thirteen options classes to be included in the penny pilot program represent a diverse group of options classes with varied trading characteristics. This diversity should facilitate analyses by the Commission, the options exchanges and others.” See Securities Exchange Act Release No. 55156 (January 23, 2007), 72 FR 4759, 4760 (February 1, 2007) (SR-NYSEArca-2006-73) (Order approving a penny pilot program on NYSE Arca).
7 These data and analyses are available online at https://www.nyse.com/markets/amex-options/reports , http://www.ise.com/options-penny-pilot , https://www.cboe.org/general-info/pdfframed?content=/hybrid/cboepennypilotreport03042008.pdf§ion=SEC_HYBRID_HOME&title=CBOE%20Penny%20Pilot%20Report and http://boxoptions.com/regulatory/pilot-reports/
8 http://www.ise.com/assets/files/investors/Topaz_Penny_Pilot_Report_15.pdf 9 Results for 693 option classes on ETFs were generally similar to option classes on common equity.

3
tests find that, compared to the control sample, inclusion in the Pilot is associated with a decrease in effective spreads of 3.5 cents and a decrease in quoted spreads of 5.1 cents. Similarly, using the same matched sample, the regression model finds that the Pilot is associated with a decrease in effective spreads of 3.6 cents and a decrease in quoted spreads of 5.2 cents. These results are statistically significant. Cornerstone reports results separately for sub-periods 2007-2009, 2010-2011, and 2012-2015. The results are generally weaker in both statistical significance and in economic magnitude for the period 2012-2015. One potential explanation advanced by Cornerstone for the smaller decrease in spreads for later additions to the Pilot is that the benefits of the Pilot are most pronounced for options on larger stocks or for option classes with the highest trading volume, and to the extent that the later additions to the Pilot tend to be smaller stocks with lower-volume options, there would be smaller declines in spreads for the later additions. Also, the 2012–2015 results are based on a relatively small sample of options. One caveat to the results of the analysis that Cornerstone emphasizes is that the option exchanges have a different fee structure for classes within and outside the Pilot. Cornerstone’s analysis does not try to examine whether the improvements in market quality could be attributed only to the Pilot, or also to the differing fee structures. However, Cornerstone also notes that the average declines in execution costs for the most liquid option classes appear to be substantially higher than the potential impact of any fee adjustments.
As option classes added to the Pilot were mostly the most liquid and heavily traded, Cornerstone also includes analysis specifically aimed at testing whether the Pilot contributed to improved market quality for less liquid option classes. The analysis uses more recent data, from February 2016, in order to allow the testing of the impact of the Pilot on option classes that may have been more liquid when they were originally added to the Pilot, but that over time became less liquid. Due to the low liquidity of these option classes, had the inclusion decision been made in February 2016, they may have not been selected for inclusion in the Pilot.
However, Cornerstone’s analysis is neither consistent nor inconsistent with the proposition that additional low volume option classes would benefit from pilot inclusion.10 Compared to samples of non-Pilot options matched on option class volume, underlying market capitalization, and underlying price, the results indicate evidence of statistically significant reductions in quoted and effective spreads for the top two quartiles, by trading volume, of option classes included in the Pilot. These option classes have trading volume in the top 5% of the universe of all listed option classes. While Cornerstone also finds reductions in spreads for the bottom two
10 Also, there exist some option classes with liquidity equal to that of those in the Pilot, but they are not in the Pilot because they did not meet the Pilot requirements at the time a replacement class was being added to the Pilot. Some of these are included in the controls used for the Third and Fourth Quartile in Table 22 of Cornerstone’s research, described as “Number of Clusters for Matching with Replacement”.

4
quartiles of option classes included in the pilot, these reductions are generally not statistically significant. Conclusion: The evidence Cornerstone presents suggests that the existing Pilot program has resulted in improvements in market quality (as measured by quoted and effective spreads) for the Pilot option classes. Cornerstone’s research does not provide any clear evidence that expanding the Pilot to include lower-volume options would result in similar benefits. While noting that the analysis does not control for different fee structures that apply to option classes included and excluded from the Pilot, Cornerstone asserts that the estimated reduction in execution costs for option classes within the pilot appear to be substantially larger than the potential impact of fee differentials.

MEMORANDUM
DATE: July 3, 2017
TO: Division of Economic and Risk Analysis
FROM: Stewart Mayhew, Cornerstone Research
RE: Analysis of the Impact of the Option Penny Pilot Program on Market Quality
Executive Summary
This memo summarizes research requested by the staff of the Commission’s Division of
Economic and Risk Analysis (DERA) under the terms of contract SECHQ1-16-C0024 with
Cornerstone Research.1 This research relates to an ongoing pilot program that, since 2007, has
allowed certain exchange-traded options to be quoted in reduced price increments (“Option
Penny Pilot” or “Pilot”). DERA staff requested an analysis of the impact of the Option Penny
Pilot on market quality, as part of an effort to evaluate the efficacy of the program. The current
memo summarizes our research investigating the extent to which inclusion in the Pilot impacts
measures of market quality. The results of this research should aid the staff of the Commission
as it seeks to evaluate the overall impact of the Pilot, and as it makes decisions regarding whether
1 The analysis summarized in this memo was undertaken by a team of researchers under the direction of Dr. Stewart Mayhew at Cornerstone Research. The team also included Dr. Amber Anand of Syracuse University, Dr. D. Timothy McCormick, and the staff of Cornerstone Research. The findings presented herein are results of analysis performed by the research team in response to specific requests and questions from DERA staff. This memo does not seek to offer any policy recommendations, and should not be construed as an endorsement by the authors or by Cornerstone Research of any particular policy alternative. Any views and interpretations expressed in this memo are solely those of Dr. Mayhew, Dr. Anand, and Dr. McCormick, who are responsible for the content, and do not necessarily represent the views of Cornerstone Research.

2
the program should be made permanent and/or whether the program covers the appropriate
number of option classes.
The research summarized herein encompasses the addition of option classes to the Pilot
over an eight-year period between January 26, 2007 and January 5, 2016. It analyzes the impact
of addition to the Pilot on quoted and effective spreads, while attempting to control for other
factors that influence spreads and for any selection bias that may influence the addition of certain
option classes to the program.
Section I of this memo provides a brief overview of the background of the Pilot,
including the timing of when new option classes were added. Section II describes the data used
for the analysis.
Section III reports summary statistics for option class volume, underlying stock volume,
and underlying market capitalization for option classes already in the Pilot, new classes selected
for inclusion in the Pilot, and option classes not in the Pilot, as of each addition date (“event
date”). The option classes in the Pilot and those selected for inclusion tend to have significantly
higher trading volume and tend to be on underlying stocks with higher market capitalization
compared to classes not participating in the Pilot.
Section IV provides additional detail regarding the construction of control samples and
reports summary statistics for the control samples.
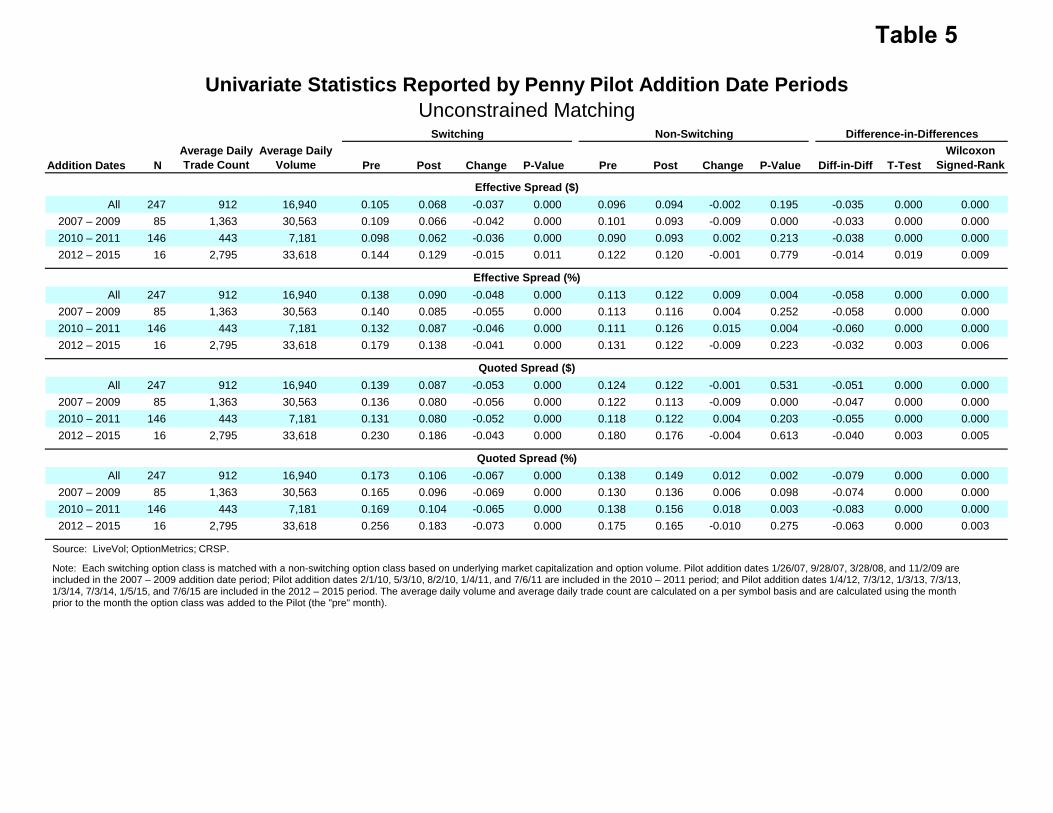
Section V presents results of univariate “difference-in-differences” tests, which compare
changes in quoted and effective spreads after option classes are added to the Pilot to
contemporaneous changes in spreads for a control sample of non-switching option classes
(matched on option class volume and underlying market capitalization). The difference-in-
differences results (presented in Table 5) indicate that inclusion in the Pilot is associated with a

3
decrease in dollar effective spreads of 3.5 cents and a decrease in dollar quoted spreads of 5.1
cents. These decreases were found to be statistically significant at the 1% confidence level, and
similar results were found for relative spreads. Results are also reported separately for
subperiods 2007–2009, 2010–2011, and 2012–2015. The average decline in spreads was smaller
for the most recent additions to the Pilot in 2012–2015, although this group has relatively few
observations. The decline in spreads is found to be robust for option classes with different levels
of underlying market capitalization (Table 6) and option class trading volume (Table 7).
Section VI analyzes additions to the Pilot using a multivariate regression approach
designed to control for other factors that can impact spreads, including option volume,
underlying stock volume, and stock volatility. This analysis confirms that inclusion in the Pilot
is associated with a statistically significant decline in effective spreads and quoted spreads,
although the estimated magnitude of the effect varies somewhat, depending on how the model is
implemented. When the regression model is estimated on the entire universe of listed options,
the results indicate that inclusion in the Pilot is associated with a decrease in effective spreads of
8.8 cents (Table 13) and a decrease in quoted spreads of 16.1 cents (Table 14). When the model
is estimated only on the matched sample described in Section IV, the Pilot is associated with a
decrease in dollar effective spreads of 3.6 cents (Table 15) and a decrease in dollar quoted
spreads of 5.2 cents (Table 16). Similar results are found for percentage spreads. The decline in
effective spreads is found to be largest in the 2010–2011 subperiod, and smallest for the most
recent additions in 2012–2015. In some specifications, the effect of the Pilot program is found to
be close to zero and not statistically significant for the 2012–2015 subperiod. We reiterate the
caveat for the 2012–2015 results that they are based on a relatively small sample of switching
options.

4
Section VII explores further whether the Pilot is contributing to an improvement in
market quality for the least liquid option classes, a question that is significant if the Commission
staff wishes to consider whether penny quoting should be expanded to a larger set of option
classes or constricted to a smaller set. This question presents empirical challenges because the
option classes added to the Pilot are generally the most liquid, thus making it difficult to
extrapolate the benefits of the Pilot to less liquid option classes. We address this by examining
market quality for Penny Pilot option classes using a more recent period of February 2016. The
examination of a recent period allows us to study Penny Pilot option classes that may have been
more liquid when they were originally added to the Pilot but with the passage of time became
less liquid. The analysis compares spreads between Pilot options and a control sample of (non-
Pilot) options, matched on option volume, underlying market capitalization, and underlying
price. Results are reported by option volume quartiles to examine whether the benefits of
inclusion in the Pilot taper off at a particular threshold (Table 23). The results indicate evidence
of significant benefits of inclusion in the Pilot for the top two quartiles, corresponding to the
option classes with trading volume in the top 5% of the universe of all listed option classes. For
the bottom two quartiles of Pilot options, most of the results are not statistically significant,
suggesting that the benefits of the Pilot decline as option liquidity declines.
I. Background: Option Penny Pilot Program
On Friday, January 26, 2007, the options exchanges commenced the Pilot program to
quote and trade options on 13 stocks and ETFs in one-cent increments. The Pilot specified that
options trading at less than $3.00 would have trading increments of one cent, while those trading

5
at $3.00 or more would have trading increments of five cents, with the exception of options on
the QQQQ which would trade at one cent increments, regardless of price level. The change
represents a reduction relative to options not in the Pilot, which have corresponding minimum
price increments of five cents for options trading below $3.00 and ten cents for options trading
above $3.00.
As summarized in Table 1, the Pilot was subsequently expanded to include additional
option classes. Most notably, the Pilot was expanded by an additional 22 option classes on
September 28, 2007 and 28 option classes on March 28, 2008. The Pilot was subsequently
expanded to include the next 300 most actively traded, multiply-listed options classes that were
not yet included in the Pilot, excluding options with high premiums. These option classes were
added in groups of 75 on each of November 2, 2009, February 1, 2010, May 3, 2010, and August
2, 2010. Further, SPX and IWM began trading in one-cent increments regardless of the price
level on February 1, 2010. Since 2011, additions have occurred at the beginning of January and
July each year, when a handful of options (less than 10) have been added to the Pilot to replace
options that no longer exist.2 This analysis encompasses the addition to the Pilot of options on
common equity and ETFs, commencing on January 26, 2007 and concluding on January 5, 2016.
II. Data and Sample
Options Price Reporting Authority (OPRA) data were obtained from CBOE LiveVol,
which contains options trades, along with contemporaneous quotes from each exchange, as well
as the National Best Bid and Offer (NBBO). For each of the event dates listed in Table 1
2 See https://www.ise.com/options/regulatory-and-fees/options-penny-pilot/.

6
beginning in January 2007 and ending with the addition in January 2016, OPRA data were
obtained for the full calendar month prior to the event date (“pre-event month”) and for the full
calendar month subsequent to the event date (“post-event month”). For example, for the event
date on January 26, 2007, data were obtained for the calendar months of December 2006 and
February 2007.
The OPRA data were supplemented with data from the Center for Research in Security
Prices (CRSP) and OptionMetrics. CRSP data were used to obtain characteristics of the
underlying equity instrument, including market capitalization, average daily trading volume, and
prices. Daily OptionMetrics data were used to obtain additional characteristics of the traded
option series and to provide a mapping between the OPRA and CRSP data.
The analysis is focused on options on common stock and ETFs, with results reported
separately for common stock and ETFs.3 Option classes for which the underlying stock or ETF
traded below $1 or above $1,000 on any day during the pre-event month or the post-event month
of any addition date are excluded, as are option series with non-standard settlements. Outlier
spreads (effective or quoted) which are greater than $5 when the option price is less than $100,
or are greater than $10, are excluded from the analysis. The sample for option classes on
common stock incorporates data on 3,833 option classes and 1,331,185 class-day observations.
The sample for option classes on ETFs incorporates data on 693 option classes and 194,694
class-day observations.
3 The analyses reported in the body of this memo are based on a database of regular option trades (trades involving only one leg). An analysis of complex trades shows similar results and is reported in the Appendix.

7
III. Characteristics of Options Added to the Pilot
Table 2 contains summary statistics for option class volume, underlying volume, and
underlying market capitalization for option classes not in the Pilot, classes being added to the
Pilot, and classes already in the Pilot, computed during the pre-event month. Switching option
classes generally have a higher average daily option volume, higher average daily underlying
stock volume, and higher underlying market capitalization vis-à-vis option classes outside the
Pilot. This is not surprising and simply reflects the fact that more actively traded options on
more actively traded and larger stocks tend to be selected for inclusion in the Pilot. Note that the
volume and market cap metrics for switching options decreased substantially between 2007 and
2010, indicating that option classes with higher volume and market cap were added to the Pilot
prior to option classes with lower volume and market cap.
Since the large number of illiquid options may unduly influence the average for volume
and underlying market capitalization for options outside the Pilot, it is worth examining the
distribution of these characteristics across all option classes. Figure 1 shows a scatterplot of
option classes on common stock based on average daily option volume and underlying market
capitalization, while Figure 2 plots option classes on common stock based on average daily
underlying volume and underlying market capitalization. Figures 3 and 4 show analogous plots
for option classes on ETFs. All figures plot the data as of February 2016. The distributions
confirm that options in the Pilot have higher trading volume and larger underlying market
capitalizations vis-à-vis the overall population of traded options.

8
IV. Control Sample
The primary goal of this research is to assess the degree to which including an option
class in the Pilot resulted in narrower quoted and effective spreads. Quoted and effective spreads
are frequently used as measures of trading costs and, more generally, to assess market quality.
Even though the analysis focuses on relatively short windows of one month before and one
month after each addition date, it is possible that other market-wide factors influencing option
spreads might have changed systematically between the pre-event and post-event months. The
difference-in-differences methodology recognizes this possibility and controls for any such
market-wide factors by comparing changes in market quality for the added option classes with
contemporaneous changes in a control sample of option classes that were not added.
Control samples are constructed by matching switching options with non-switching
options on the basis of option class volume and underlying market capitalization. Specifically,
each switching option was matched with a control option by rank ordering the entire universe of
traded options on option class volume and underlying market capitalization in the pre-event
month, and then minimizing the difference in ranks between the switching option and the control
option. Matching was completed without replacement, that is, each control option class is
matched with exactly one switching option class for each event date. The results are similar
across two different sets of matched controls: an “unconstrained” set, where the matched option
is any non-switching option regardless of whether it is in the Pilot, and a “constrained” set,
where the control option must be outside the Pilot. In later years, when most of the highest
option volume options are in the Pilot, the unconstrained sample is likely to provide a closer
match for the volume of the switching option. Table 3 contains summary statistics for the

9
control samples for option classes on common stock during the pre-event month. Table 4
contains the same summary statistics for option classes on ETFs.
V. Impact of the Pilot on Quoted and Effective Spreads
Figures 5–8 graphically illustrate the impact on spreads for the switching options after
being added to the Pilot vis-à-vis the control sample. Figure 5 depicts the average dollar
effective spreads during the pre-event month and the post-event month across the different
addition dates. As can be seen in Figure 5, dollar effective spreads for switching options are
substantially lower in the post-event month as compared to the pre-event month. No
corresponding decline in effective spreads occurs for the control sample. A similar pattern is
observed for relative effective spreads (Figure 6), dollar quoted spreads (Figure 7), and relative
quoted spreads (Figure 8). Figures 9–12 show a similar pattern for option classes on ETFs.
These figures suggest that inclusion in the Pilot is associated with substantially lower quoted and
effective spreads.4
Tables 5–12 present changes in effective and quoted spreads for options that are
switching into the Pilot,5 as compared to a control group of non-switching options. Spreads are
volume-weighted across different trades in an option series and then equally weighted across
option series, in order to obtain spreads for the option-class day. Those spreads are then equally
weighted across different days in the pre-event month and the post-event month, respectively, in
4 The graphs shown in Figures 5–8 are based on event-time data aggregated across all event dates. Similar graphs could be made for any individual event date. For example, a graph showing the evolution of spreads surrounding August 2, 2010 is provided in the Appendix. 5 The addition dates in January 2010 and July 2010 are the pre-event months for the additions in February 2010 and August 2010, respectively and, hence, are excluded as addition dates from the analysis to ensure that event windows do not overlap.

10
order to obtain option-class month observations. A similar methodology is adopted for
computing spreads for the control sample, and the results of a difference-in-differences
specification are reported. P-values are computed using a paired t-test and the Wilcoxon Signed-
Rank test.
As shown in the first panel in Table 5, average dollar effective spreads declined from
10.5 cents in the pre-event month to 6.8 cents in the post-event month for the switching options
in the overall sample, a decrease of 3.7 cents, while effective spreads in the control sample
decreased by 0.2 cents. Relative to the control sample, effective spreads declined by 3.5 cents,
as reported in the column labeled “diff-in-diff.” This decline is statistically significant (at the 1%
level). Table 5 also reports results for the different subperiods. As indicated in the table,
inclusion in the Pilot is associated with a decrease in effective spreads of 3.3 cents for classes
added between 2007 and 2009, 3.8 cents for classes added between 2010 and 2011, and 1.4 cents
for classes added between 2012 and 2015. The second panel of Table 5 reports analogous results
based on percentage effective spreads.
Similarly, as shown in the third panel of Table 5, average dollar quoted spreads declined
from 13.9 cents in the pre-event month to 8.7 cents in the post-event month for the switching
options in the overall sample, while quoted spreads for the control sample decreased from 12.4 to
12.2 cents. Based on the difference-in-differences, inclusion in the Pilot is associated with a
decline in quoted spreads of 5.1 cents, which is statistically significant at the 1% level.
One potential explanation for the smaller decrease in spreads for later additions to the
Pilot is that the benefits of the Pilot are most pronounced for options on larger stocks or for
option classes with the highest trading volume, and to the extent that recent additions to the Pilot

11
tend to be smaller stocks with lower-volume options, there would be smaller declines in spreads
in recent years.
To examine this, Table 6 decomposes the sample into categories based on the underlying
market capitalization, using breakpoints calculated from NYSE stocks. Because most options
being added are in the largest market capitalization quartile, they are decomposed into more
granular categories. The difference-in-differences spreads are negative and statistically
significant for all categories, with the Wilcoxon Signed-Rank test significant at the 1% level.
Average dollar effective spreads declined by 3.5 cents for the largest quartile, by 3.6 cents for the
third quartile, and by 2.9 cents for options below the 50th percentile, vis-à-vis the changes in the
control group. Thus, the spread declines for Pilot stocks are consistent across all market cap
categories. In addition, all four spread measures show similar results.
Table 7 decomposes the sample based on the percentile of the option volume in the pre-
event month. Because almost the entire population of the switching options is in the top 10% by
volume, they are decomposed into more granular categories. The difference-in-differences
spreads are negative and statistically significant for all categories, with the Wilcoxon Signed-
Rank test significant at the 1% level. Relative effective spreads declined by 4.4% for the top two
percentiles, by 6% for the 95th to 97th percentile, by 5.5% for the 90th to 94th percentile, and by
7.2% for options below the 90th percentile, vis-à-vis changes in the control groups. The spread
declines for Pilot option classes are consistent across all volume categories for all four spread
measures.
Table 8 decomposes the sample based on the quoted price for an option. The difference-
in-differences spreads are negative and statistically significant for all categories, with the
Wilcoxon Signed-Rank test significant at the 1% level. Average dollar effective spreads

12
declined by 2.7 cents for options priced below $1.00, by 2.9 cents for options priced between
$1.00 and $3.00, by 4.2 cents for options priced between $3.00 and $5.00, and by 4.6 cents for
options priced over $5.00, vis-à-vis the changes in the control group. The spread declines for
Pilot option classes are consistent across all price categories for all four spread measures.
Table 9 decomposes the sample based on the time to expiration for an option. The
difference-in-differences spreads are negative and statistically significant for all categories, with
the Wilcoxon Signed-Rank test significant at the 1% level. Average dollar effective spreads
declined by 3.4 cents for options expiring within a week, by 3 cents for options expiring between
one and four weeks, and by 3.6 cents for options expiring in more than four weeks, vis-à-vis the
changes in the control group. The spread declines for Pilot option classes are consistent across
all expiration categories for all four spread measures.
Tables 10–12 show results for option classes on ETFs decomposed by addition year,
underlying market capitalization (as measured by price multiplied by shares outstanding), and
option volume. Overall, average dollar effective spreads declined by 5 cents and average dollar
quoted spreads declined by 6.8 cents. When decomposed by the market capitalization of the
underlying ETF or by option trading volume, all difference-in-differences spreads are negative
and statistically significant at the 1% level for the Wilcoxon Signed-Rank test.
The difference-in-differences analysis described above has focused on examining the
impact of the Pilot on effective spreads and quoted spreads. The same technique can also be
applied to examine other market characteristics. For example, analysis showing the impact on
average daily trading volume, average trade size, and quoted depth at the NBBO is presented in
the Appendix.

13
VI. Regression Analysis
The difference-in-differences analysis reported in the previous section used a control-
sample methodology to control for any market-wide difference in factors that might have
affected spreads between the pre-event and post-event months. This section presents further
results based on a multivariate regression methodology that further controls for changes in other
factors that might affect spreads, including option volume, stock volume, and equity volatility.
A. Baseline Regression Specification (Contains All Options)
The baseline multivariate regression approach is estimated at the class-day level for
periods covering a calendar month prior to, and a calendar month subsequent to, each date of
addition to the Pilot and contains all traded option classes:
, , , , , ,
where , is a measure of quoted or effective spreads for a particular option class on a
particular day; , is the binary variable of interest, taking a value of 1 in the post-switch
period for options switching to the Pilot; , is the log of underlying stock volume on the
day; , is the log of option class volume; , is the underlying stock volatility
calculated as the difference between the high and low prices of the day divided by the closing
price; is an option class fixed effect; and is a date fixed effect.
The variable of interest , is the interaction term between indicator variables for the
switching options and the post-switch period. The specification does not include individual

14
(main effect) indicator variables for switching options and the post-switch period because these
are subsumed by the option class and date fixed effects. The model is estimated on observations
at the class/day level, and the dependent variable is constructed by aggregating spread measures
across the option series within the same class. The spreads are first volume-weighted across
trades within each option series-day and then equally weighted across option series to obtain
option class-day spreads. Hence, this specification incorporates all option series within the
option classes with positive trading volume. The model is estimated on a sample including all
option class/day measures for the calendar month prior to, and the calendar month after, each
date of addition to the Pilot for all options. Standard errors are clustered on option class and
date.
B. Matched Sample Regression Specification (Contains Only Matched Sample)
We also estimate an alternative specification, which has three key differences with the
baseline specification. First, the alternate specification contains only the matched sample for
each event, where an event constitutes a pre-event and post-event month for an addition.
Second, the variable of interest is a switching indicator (which takes on a value of 1) only in the
post-event month for the switching options. This indicator is zero for the control options,
regardless of whether they are in the Pilot or not. Third, the option class fixed effect is replaced
with an option class event fixed effect, since the same control option may be outside the Pilot for
a particular event and may be in the Pilot for another event.

15
C. Findings
Table 13 reports results for effective spreads using the baseline specification estimated
over the pre-event month and post-event month for the full sample, as well as for the different
time periods. The indicator variable of interest is negative and statistically significant (at the 1%
level) for effective spreads (for the full sample and for all time periods, except for the most
recent additions in 2012–2015), showing a decline in trading costs for options being added to the
Pilot. Dollar effective spreads declined by an average of 8.8 cents after addition to the Pilot for
the full sample. Comparing the different subperiods separately, the maximum decline in spreads
is for the additions in the 2010–2011 period (8 cents). The indicator is not statistically
significant for the most recent additions from 2012–2015, with a coefficient close to zero.
Similarly, Table 14 reports results for quoted spreads using the baseline multivariate
regression framework. Dollar quoted spreads declined by 16.1 cents for the entire sample, which
is statistically significant. Comparing the subperiods individually, the decline is strongest in the
2010–2011 subperiod (12.2 cents), and is not statistically significant for additions made in the
2012–2015 subperiod.
Table 15 reports regression results for effective spreads using the matched sample
approach, for the complete time period as well as for different subperiods. Dollar effective
spreads declined by 3.6 cents for the full sample, which is statistically significant at the 1% level.
The coefficient of interest (i.e., switching indicator) is statistically significant and negative across
all specifications, including the 2012–2015 subperiod. Similar results are reported in Table 16
for quoted spreads, with dollar quoted spreads declining by 5.2 cents for the full sample, which is
statistically significant at the 1% level.

16
Table 17 reports regression results for effective spreads using the matched sample
approach, decomposed into different market capitalization categories. The coefficient of interest
(i.e., switching indicator) is statistically significant and negative across all categories. Similar
results are reported in Table 18 for quoted spreads.
Table 19 reports regression results for effective spreads using the matched sample
approach, decomposed into different categories based on option volume. The coefficient of
interest (i.e., switching indicator) is statistically significant and negative across all categories.
Similar results are reported in Table 20 for quoted spreads.
Table 21 reports regression results for option classes on ETFs using the full sample and
matched sample approach. Similar to the common stock sample, the results show that switching
to the Penny Pilot has a significant (at the 5% level) negative effect on quoted spreads. For
effective spreads, we find similar negative effects (significant at the 1% level), with the
exception of the effective dollar specification for the full ETF sample.
VII. Impact of Pilot on the Least Liquid Option Classes
Based on the results reported above, we observe a decline in spreads for option classes in
the Pilot vis-à-vis the control options, which is robust across different spread measures, as well
as different partitions based on market capitalization, option volume, etc. This does not
necessarily imply that all option classes would benefit from inclusion in the Pilot because, as
noted above, the Pilot option classes are not representative of the overall population of option
classes, but tend to be the most liquid. Many option classes currently not in the Pilot have lower

17
trading volume than those currently in the Pilot. It is not clear the extent to which similar
benefits might be realized should penny quoting be expanded to include such option classes.
With the passage of time, some Pilot option classes (which may have had high trading
volume at the time of inclusion) may have become less active, to the point that they would no
longer be selected for the Pilot if the decision were made today. Among the Pilot option classes,
those with the lowest current volume and market capitalization are the most similar to the
options outside the Pilot. Analysis of these options could provide insight into the benefits that
might be experienced by less liquid options upon inclusion.
Table 22 provides characteristics of Pilot option classes as well as matched control
options as of February 2016. Control samples were constructed by matching Pilot options with
non-Pilot options on the basis of option class volume, underlying market capitalization, and
underlying price.6 To ensure robustness, control samples were designed so that the matching
was completed with replacement (i.e., an out-of-Pilot option class can match with any number of
in-Pilot option classes), as well as without replacement (i.e., an out-of-Pilot option class can
match with only one in-Pilot option class). Even with the passage of time, Pilot options are more
liquid than the overall option universe, with the top quartile of Pilot options by option volume in
the top three percentiles of the overall universe. Moreover, even the smallest Pilot option classes
have option volumes greater than the volume of the 40th percentile in the overall option class
6 Each Pilot option class was matched with a control option outside the Pilot by rank ordering the entire universe of traded options on option class volume, underlying market capitalization, and underlying price as of February 2016, and then minimizing the difference in ranks between the Pilot option and the control option.

18
universe; hence, the identification of the impact of inclusion of option classes below the 40th
percentile is not possible using this sample.
Table 23 analyzes the difference in spreads between the Pilot option classes and the
control options as of February 2016.7 Results are reported by option volume quartiles to analyze
if there is a discontinuity at which point the benefits of being in the Pilot taper off. Analyzing
the results across the different quartiles, the difference in spreads is negative and mostly
statistically significant for the top two quartiles. Hence, consistent with the difference-in-
differences analysis, the Pilot appears to be beneficial for the top two quartiles of Pilot options.
The top two quartiles are in the 95th percentile of the overall option universe. Thus, these results
show that the penny tick size is associated with the benefit of narrower spreads for option classes
in the top 5% of option volume.8 Analyzing the difference in spreads for the bottom two
quartiles, the test statistics are negative, but most are not statistically significant, suggesting that
the benefits of the Pilot decline as option liquidity declines. However, the absence of evidence
that market quality has deteriorated suggests that inclusion of lower-volume option classes may
not be not harmful.
VIII. Conclusion
This research has examined data covering the entire history of the Option Penny Pilot
from its inception and has analyzed how inclusion in the Pilot has impacted effective spreads and
7 Note that this is a difference in spreads specification, rather than the difference-in-differences specification used previously. 8 We note two limitations of our analysis–one, the control sample of options have significantly lower volume than the Penny Pilot options since most of the high volume options are in the Pilot, and two, that our analysis is limited to liquidity metrics that can be calculated using available data. For example, we are unable to comment on the impact of the Pilot on overall trading costs faced by institutions with large orders.

19
quoted spreads for option classes added to the Pilot through January 2016. The results indicate
that inclusion in the Pilot is associated with a statistically significant decline in effective spreads
and quoted spreads. This result is found to hold across all subperiods, but the magnitude of the
effect appears to be smaller for additions after 2012. Results are presented for options with
varying levels of trading volume and underlying market capitalization and appear to be robust
across categories. The results presented above focus on options on common stock, although
similar results are found for ETF options as discussed above. Similar results are found for
complex trades and are presented in the Appendix. The impact of inclusion in the Pilot on other
dimensions of market quality, such as quoted depth, are also presented in the Appendix.
This research further seeks to provide evidence to assist the staff in evaluating whether
the program should be expanded (or contracted) by examining the spreads of Pilot option classes
vis-à-vis matched controls as of February 2016. The results show a benefit of narrower spreads
for option classes in the top 5% of the universe. However, there is less less evidence of benefit
for lower-volume option classes. We find no evidence of a harmful increase in spreads for any
category of option classes.
In summary, the evidence suggests that the existing Pilot program has resulted in
improvements in market quality (as measured by quoted and effective spreads) for the Pilot
option classes. This research does not provide any clear evidence that expanding the Pilot to
include lower-volume stocks would result in similar benefits.
It is worth noting that this research does not account for the different fee structure option
exchanges have for classes within and outside the Pilot. It is common among exchanges to have
separate fee structures for Penny Pilot options. The research summarized herein does not
attempt to disentangle whether the observed improvements in market quality can be attributed to

20
the Pilot alone, or if they may also be influenced by the differential fee structure. The average
declines in execution costs for the most liquid option classes appear to be substantially higher
than the potential impact of any fee adjustments.

-2
-1
0
1
2
3
4
5
6
7 7.5 8 8.5 9 9.5 10 10.5 11 11.5 12
Not in Pilot
In Pilot
Source: LiveVol; OptionMetrics; CRSP.
Note: Includes all option classes on common stock for which LiveVol has data in February 2016. Share codes 10 and 11 are used to identify common stock inthe CRSP data.
Average Daily Option Class Volume vs. Market CapitalizationFebruary 2016
Log10 Average Option Class Volume
Log10 Market Capitalization
Figure 1

3
3.5
4
4.5
5
5.5
6
6.5
7
7.5
8
8.5
7 7.5 8 8.5 9 9.5 10 10.5 11 11.5 12
Not in Pilot
In Pilot
Source: LiveVol; OptionMetrics; CRSP.
Note: Includes all option classes on common stock for which LiveVol has data in February 2016. Share codes 10 and 11 are used to identify common stock inthe CRSP data.
Average Daily Underlying Volume vs. Market CapitalizationFebruary 2016
Log10 Average Underlying Volume
Log10 Market Capitalization
Figure 2

0
1
2
3
4
5
6
7
8
6 7 8 9 10 11 12
Not in Pilot
In Pilot
Source: LiveVol; OptionMetrics; CRSP.
Note: Includes all option classes on ETFs for which LiveVol has data in February 2016. Share code 73 is used to identify ETFs in the CRSP data.
Average Daily Option Class Volume vs. Market CapitalizationOption Classes on ETFs
February 2016Log10 Average
Option Class Volume
Log10 Market Capitalization
Figure 3

3
4
5
6
7
8
9
10
6 7 8 9 10 11 12
Not in Pilot
In Pilot
Source: LiveVol; OptionMetrics; CRSP.
Note: Includes all option classes on ETFs for which LiveVol has data in February 2016. Share code 73 is used to identify ETFs in the CRSP data.
Average Daily Underlying Volume vs. Market CapitalizationOption Classes on ETFs
February 2016Log10 Average
Underlying Volume
Log10 Market Capitalization
Figure 4

$0.00
$0.02
$0.04
$0.06
$0.08
$0.10
$0.12
$0.14
Switching
Control
Effective Spread
Impact of Addition to the Penny Pilot on Effective Spreads ($)
Source: LiveVol; OptionMetrics, CRSP.
Note: Includes 235 option classes on common stock that were added to the Penny Pilot between January 26, 2007 and July 6, 2015 for which LiveVol has data. 12 option classes were removed because the switching option class or the control option class was missing data on an option class-day in the pre-addition or post-addition month. Each switching option class is matched with a non-switching option class outside the Pilot based on underlying market capitalization and option volume. Effective spreads for the switching and control samples are averaged across each trading day.
Post-Addition MonthPre-Addition Month
Penny Pilot Addition
Figure 5

0%
4%
8%
12%
16%
20%
Switching
Control
Effective Spread
Impact of Addition to the Penny Pilot on Effective Spreads (%)
Source: LiveVol; OptionMetrics, CRSP.
Note: Includes 235 option classes on common stock that were added to the Penny Pilot between January 26, 2007 and July 6, 2015 for which LiveVol has data. 12 option classes were removed because the switching option class or the control option class was missing data on an option class-day in the pre-addition or post-addition month. Each switching option class is matched with a non-switching option class outside the Pilot based on underlying market capitalization and option volume. Effective spreads for the switching and control samples are averaged across each trading day.
Post-Addition MonthPre-Addition Month
Penny Pilot Addition
Figure 6

$0.00
$0.03
$0.06
$0.09
$0.12
$0.15
$0.18
Switching
Control
Quoted Spread
Impact of Addition to the Penny Pilot on Quoted Spreads ($)
Source: LiveVol; OptionMetrics, CRSP.
Note: Includes 235 option classes on common stock that were added to the Penny Pilot between January 26, 2007 and July 6, 2015 for which LiveVol has data. 12 option classes were removed because the switching option class or the control option class was missing data on an option class-day in the pre-addition or post-addition month. Each switching option class is matched with a non-switching option class outside the Pilot based on underlying market capitalization and option volume. Quoted spreads for the switching and control samples are averaged across each trading day.
Post-Addition MonthPre-Addition Month
Penny Pilot Addition
Figure 7

0%
3%
6%
9%
12%
15%
18%
21%
Switching
Control
Quoted Spread
Impact of Addition to the Penny Pilot on Quoted Spreads (%)
Source: LiveVol; OptionMetrics, CRSP.
Note: Includes 235 option classes on common stock that were added to the Penny Pilot between January 26, 2007 and July 6, 2015 for which LiveVol has data. 12 option classes were removed because the switching option class or the control option class was missing data on an option class-day in the pre-addition or post-addition month. Each switching option class is matched with a non-switching option class outside the Pilot based on underlying market capitalization and option volume. Quoted spreads for the switching and control samples are averaged across each trading day.
Post-Addition MonthPre-Addition Month
Penny Pilot Addition
Figure 8

$0.00
$0.02
$0.04
$0.06
$0.08
$0.10
$0.12
$0.14
$0.16
Switching
Control
Effective Spread
Impact of Addition to the Penny Pilot on Effective Spreads ($)Option Classes on ETFs
Source: LiveVol; OptionMetrics, CRSP.
Note: Includes 53 option classes on ETFs that were added to the Penny Pilot between January 26, 2007 and January 5, 2016 for which LiveVol has data. Two option classes were removed because the switching option class or the control option class was missing data on an option class-day in the pre-addition or post-addition month. Each switching option class is matched with a non-switching option class outside the Pilot based on underlying market capitalization and option volume. Effective spreads for the switching and control samples are averaged across each trading day.
Post-Addition MonthPre-Addition Month
Penny Pilot Addition
Figure 9

0%
4%
8%
12%
16%
20%
Switching
Control
Effective Spread
Impact of Addition to the Penny Pilot on Effective Spreads (%)Option Classes on ETFs
Source: LiveVol; OptionMetrics, CRSP.
Note: Includes 53 option classes on ETFs that were added to the Penny Pilot between January 26, 2007 and January 5, 2016 for which LiveVol has data. Two option classes were removed because the switching option class or the control option class was missing data on an option class-day in the pre-addition or post-addition month. Each switching option class is matched with a non-switching option class outside the Pilot based on underlying market capitalization and option volume. Effective spreads for the switching and control samples are averaged across each trading day.
Post-Addition MonthPre-Addition Month
Penny Pilot Addition
Figure 10

$0.00
$0.03
$0.06
$0.09
$0.12
$0.15
$0.18
$0.21
$0.24
Switching
Control
Quoted Spread
Impact of Addition to the Penny Pilot on Quoted Spreads ($)Option Classes on ETFs
Source: LiveVol; OptionMetrics, CRSP.
Note: Includes 53 option classes on ETFs that were added to the Penny Pilot between January 26, 2007 and January 5, 2016 for which LiveVol has data. Two option classes were removed because the switching option class or the control option class was missing data on an option class-day in the pre-addition or post-addition month. Each switching option class is matched with a non-switching option class outside the Pilot based on underlying market capitalization and option volume. Quoted spreads for the switching and control samples are averaged across each trading day.
Post-Addition MonthPre-Addition Month
Penny Pilot Addition
Figure 11

0%
3%
6%
9%
12%
15%
18%
21%
24%
Switching
Control
Quoted Spread
Impact of Addition to the Penny Pilot on Quoted Spreads (%)Option Classes on ETFs
Source: LiveVol; OptionMetrics, CRSP.
Note: Includes 53 option classes on ETFs that were added to the Penny Pilot between January 26, 2007 and January 5, 2016 for which LiveVol has data. Two option classes were removed because the switching option class or the control option class was missing data on an option class-day in the pre-addition or post-addition month. Each switching option class is matched with a non-switching option class outside the Pilot based on underlying market capitalization and option volume. Quoted spreads for the switching and control samples are averaged across each trading day.
Post-Addition MonthPre-Addition Month
Penny Pilot Addition
Figure 12

Date New Option Classes Added (%)
1/26/2007 13 3.19%9/28/2007 22 5.39%3/28/2008 23 5.64%11/2/2009 75 18.38%1/5/2010 4 0.98%2/1/2010 75 18.38%5/3/2010 75 18.38%7/6/2010 3 0.74%8/2/2010 75 18.38%1/4/2011 2 0.49%7/6/2011 4 0.98%1/4/2012 3 0.74%7/3/2012 2 0.49%1/3/2013 9 2.21%7/3/2013 2 0.49%1/3/2014 7 1.72%7/3/2014 4 0.98%1/5/2015 2 0.49%7/6/2015 6 1.47%1/5/2016 2 0.49%7/6/2016 7 1.69%
Total 415 100.00%
Option Classes Added to Penny Pilot Since Inception
Source: ISE Penny Pilot Addition Dates.
Table 1

Liquidity Metrics for Penny Pilot Addition DatesOption Classes on Common Stock
Number of Option ClassesDaily Volume of Option Class
(Contracts)Daily Volume of Underlying Stock
(Thousands)Market Cap of Underlying Stock
($Millions)
Month Not in Pilot Switching In Pilot Not in Pilot Switching In Pilot Not in Pilot Switching In Pilot Not in Pilot Switching In Pilot
Dec-06 2,030 9 0 1,636 32,572 – 1,390 26,137 – 6,920 102,942 –
Aug-07 2,011 15 9 1,843 51,330 29,632 1,983 22,195 35,759 6,341 94,746 106,900
Feb-08 2,001 20 25 1,481 30,794 48,095 1,684 21,527 30,027 4,951 88,186 80,364
Oct-09 1,890 41 43 1,177 22,411 65,407 1,596 17,257 39,943 3,144 43,505 68,857
Dec-09 1,950 3 85 755 10,000 33,977 1,205 11,925 23,211 3,365 23,018 60,045
Jan-10 1,823 50 87 866 9,080 44,974 1,260 8,250 30,600 2,719 22,664 57,192
Apr-10 1,839 49 140 652 7,528 35,862 1,281 6,237 23,736 2,881 10,254 49,019
Jul-10 1,767 46 180 457 3,807 20,062 1,042 5,379 15,530 2,361 13,425 36,905
Dec-10 1,790 1 224 477 4,869 18,171 838 8,813 10,840 2,763 209 36,900
Jun-11 1,824 3 225 502 15,136 15,679 960 7,886 10,004 2,902 20,199 38,065
Dec-11 1,888 1 233 381 11,989 14,393 878 4,695 9,122 2,637 5,077 35,131
Jun-12 1,899 2 233 502 15,814 15,015 976 18,695 9,575 2,781 9,861 38,136
Dec-12 1,885 5 225 378 40,885 16,414 764 16,823 8,422 2,892 12,502 40,393
Jun-13 1,989 1 233 486 64,427 15,264 865 9,097 9,000 3,276 13,037 43,755
Dec-13 2,047 3 226 567 16,306 16,847 773 5,198 7,072 3,809 6,630 50,908
Jun-14 2,144 1 227 505 123,725 15,879 803 31,263 6,311 3,951 24,170 52,975
Dec-14 2,187 1 229 437 8,256 16,487 821 5,921 7,014 4,003 26,587 55,218
Jun-15 2,206 2 227 391 18,684 13,805 830 7,078 6,817 4,035 6,374 55,257
Source: CRSP; OptionMetrics; LiveVol.
Note: Liquidity metrics are shown for the month prior to each addition date. The liquidity metrics includes all option classes on common stock for which LiveVol has data. Share codes 10 and 11 are used to identify common stock in the CRSP data. The sample excludes option classes for which the underlying stock traded below $1 or above $1,000 on any day on which an average spread is calculated during the December 2006 through February 2016 period. Data for the July 2010 and January 2016 additions is not shown above because none of the option classes that switched on those dates are in the sample of option classes on common stock.
Table 2

Liquidity Metrics for Penny Pilot Addition DatesMatched Pairs Sample
Daily Volume of Option Class (Contracts) Daily Volume of Underlying Stock (Thousands) Market Cap of Underlying Stock ($Millions)
MonthNumber of Option
Classes Switching Unconstrained Constrained Switching Unconstrained Constrained Switching Unconstrained Constrained
Dec-06 9 32,572 27,896 27,896 26,137 18,426 18,426 102,942 76,960 76,960
Aug-07 15 51,330 36,314 36,353 22,195 27,659 18,002 94,746 101,936 85,218
Feb-08 20 30,794 44,490 22,451 21,527 31,756 16,848 88,186 85,362 65,385
Oct-09 41 22,411 23,793 11,851 17,257 17,117 9,666 43,505 37,261 25,440
Jan-10 50 9,080 9,246 6,915 8,250 7,668 5,598 22,664 18,788 14,558
Apr-10 46 7,990 9,654 5,705 6,271 7,387 7,463 10,010 10,163 9,934
Jul-10 46 3,807 3,853 3,241 5,379 5,516 3,930 13,425 13,119 11,582
Dec-10 1 4,869 1,793 1,793 8,813 1,993 1,993 209 259 259
Jun-11 3 15,136 14,755 8,719 7,886 12,246 2,248 20,199 20,167 11,981
Dec-11 1 11,989 15,117 6,524 4,695 11,795 3,703 5,077 5,099 4,783
Jun-12 2 15,814 11,767 11,767 18,695 6,119 6,119 9,861 9,777 9,777
Dec-12 5 40,885 37,142 8,880 16,823 17,370 4,000 12,502 13,173 10,139
Jun-13 1 64,427 37,025 9,730 9,097 3,079 2,784 13,037 12,438 9,251
Dec-13 3 16,306 15,206 9,946 5,198 4,131 4,420 6,630 6,930 7,677
Jun-14 1 123,725 59,340 26,590 31,263 2,402 9,795 24,170 26,476 33,033
Dec-14 1 8,256 8,265 7,583 5,921 8,410 8,833 26,587 29,393 28,724
Jun-15 2 18,684 25,054 8,856 7,078 13,617 23,484 6,374 6,202 6,616
Source: CRSP; OptionMetrics; LiveVol.
Note: Liquidity metrics are shown for the month prior to each addition date. The matched pairs sample is constructed from the universe of option classes on common stock for which LiveVol has data. Each switching option class is matched with a non-switching option class based on underlying market capitalization and option volume. For “constrained” matching, the non-switching class must be outside of the Pilot. Data for the January 2010 and July 2010 additions are not shown above because the post-month for these two addition dates overlapped with the February 1, 2010 and August 2, 2010 additions respectively. Data for the January 2016 additions is not shown above because none of the option classes that switched on that date are in the sample of option classes on common stock.
Table 3

Liquidity Metrics for Penny Pilot Addition DatesMatched Pairs Sample: Option Classes on ETFs
Daily Volume of Option Class (Contracts) Daily Volume of Underlying Stock (Thousands) Market Cap of Underlying Stock ($Millions)
MonthNumber of Option
Classes Switching Unconstrained Constrained Switching Unconstrained Constrained Switching Unconstrained Constrained
Dec-06 3 140,034 77,111 63,380 50,208 22,732 21,345 10,224 23,872 24,586
Aug-07 4 230,200 208,085 208,085 101,194 49,351 49,351 22,471 9,615 9,615
Feb-08 1 43,739 584,226 584,226 22,226 151,137 151,137 25,362 16,420 16,420
Oct-09 19 27,803 90,613 6,741 24,030 32,762 8,190 6,404 8,236 2,567
Jan-10 6 10,953 9,705 8,186 17,443 9,969 5,050 1,811 2,324 2,473
Apr-10 7 5,283 6,152 2,920 7,414 7,624 3,770 2,368 2,462 2,083
Jul-10 6 1,727 2,390 1,696 3,552 3,273 2,817 1,190 1,123 1,047
Dec-10 0 – – – – – – – – –
Jun-11 0 – – – – – – – – –
Dec-11 0 – – – – – – – – –
Jun-12 0 – – – – – – – – –
Dec-12 1 15,267 6,892 6,685 7,671 3,712 1,399 726 763 767
Jun-13 0 – – – – – – – – –
Dec-13 2 16,713 10,133 7,237 7,116 3,259 2,045 6,446 6,666 7,653
Jun-14 0 – – – – – – – – –
Dec-14 0 – – – – – – – – –
Jun-15 3 10,538 12,301 11,827 7,536 5,672 3,882 5,606 5,249 7,690
Dec-15 1 8,011 12,763 4,426 1,600 834 3,386 400 340 464
Source: CRSP; OptionMetrics; LiveVol.
Note: Liquidity metrics are shown for the month prior to each addition date. The matched pairs sample is constructed from the universe of ETFs for which LiveVol has data. Each switching option class is matched with a non-switching option class based on underlying market capitalization and option volume. For “constrained” matching, the non-switching class must be outside of the Pilot. Data for the January 2010 and July 2010 additions are not shown above because the post-month for these two addition dates overlapped with the February 1, 2010 and August 2, 2010 additions respectively.
Table 4
Univariate Statistics Reported by Penny Pilot Addition Date PeriodsUnconstrained Matching
Switching Non-Switching Difference-in-Differences
Addition Dates NAverage Daily Trade Count
Average Daily Volume Pre Post Change P-Value Pre Post Change P-Value Diff-in-Diff T-Test
Wilcoxon Signed-Rank
Effective Spread ($)
All 247 912 16,940 0.105 0.068 -0.037 0.000 0.096 0.094 -0.002 0.195 -0.035 0.000 0.000
2007 – 2009 85 1,363 30,563 0.109 0.066 -0.042 0.000 0.101 0.093 -0.009 0.000 -0.033 0.000 0.000
2010 – 2011 146 443 7,181 0.098 0.062 -0.036 0.000 0.090 0.093 0.002 0.213 -0.038 0.000 0.000
2012 – 2015 16 2,795 33,618 0.144 0.129 -0.015 0.011 0.122 0.120 -0.001 0.779 -0.014 0.019 0.009
Effective Spread (%)
All 247 912 16,940 0.138 0.090 -0.048 0.000 0.113 0.122 0.009 0.004 -0.058 0.000 0.000
2007 – 2009 85 1,363 30,563 0.140 0.085 -0.055 0.000 0.113 0.116 0.004 0.252 -0.058 0.000 0.000
2010 – 2011 146 443 7,181 0.132 0.087 -0.046 0.000 0.111 0.126 0.015 0.004 -0.060 0.000 0.000
2012 – 2015 16 2,795 33,618 0.179 0.138 -0.041 0.000 0.131 0.122 -0.009 0.223 -0.032 0.003 0.006
Quoted Spread ($)
All 247 912 16,940 0.139 0.087 -0.053 0.000 0.124 0.122 -0.001 0.531 -0.051 0.000 0.000
2007 – 2009 85 1,363 30,563 0.136 0.080 -0.056 0.000 0.122 0.113 -0.009 0.000 -0.047 0.000 0.000
2010 – 2011 146 443 7,181 0.131 0.080 -0.052 0.000 0.118 0.122 0.004 0.203 -0.055 0.000 0.000
2012 – 2015 16 2,795 33,618 0.230 0.186 -0.043 0.000 0.180 0.176 -0.004 0.613 -0.040 0.003 0.005
Quoted Spread (%)
All 247 912 16,940 0.173 0.106 -0.067 0.000 0.138 0.149 0.012 0.002 -0.079 0.000 0.000
2007 – 2009 85 1,363 30,563 0.165 0.096 -0.069 0.000 0.130 0.136 0.006 0.098 -0.074 0.000 0.000
2010 – 2011 146 443 7,181 0.169 0.104 -0.065 0.000 0.138 0.156 0.018 0.003 -0.083 0.000 0.000
2012 – 2015 16 2,795 33,618 0.256 0.183 -0.073 0.000 0.175 0.165 -0.010 0.275 -0.063 0.000 0.003
Source: LiveVol; OptionMetrics; CRSP.
Note: Each switching option class is matched with a non-switching option class based on underlying market capitalization and option volume. Pilot addition dates 1/26/07, 9/28/07, 3/28/08, and 11/2/09 are included in the 2007 – 2009 addition date period; Pilot addition dates 2/1/10, 5/3/10, 8/2/10, 1/4/11, and 7/6/11 are included in the 2010 – 2011 period; and Pilot addition dates 1/4/12, 7/3/12, 1/3/13, 7/3/13, 1/3/14, 7/3/14, 1/5/15, and 7/6/15 are included in the 2012 – 2015 period. The average daily volume and average daily trade count are calculated on a per symbol basis and are calculated using the month prior to the month the option class was added to the Pilot (the "pre" month).
Table 5

Univariate Statistics Reported by Underlying Market CapitalizationUnconstrained Matching
Switching Non-Switching Difference-in-Differences
Market CapPercentile N
Average Daily Trade Count
Average Daily Volume Pre Post Change P-Value Pre Post Change P-Value Diff-in-Diff T-Test
Wilcoxon Signed-Rank
Effective Spread ($)
95th + 69 1,279 30,296 0.102 0.061 -0.041 0.000 0.085 0.079 -0.006 0.012 -0.035 0.000 0.000
75th – 94th 123 811 12,444 0.107 0.071 -0.036 0.000 0.106 0.106 0.000 0.954 -0.035 0.000 0.000
50th – 74th 38 780 11,117 0.106 0.069 -0.037 0.000 0.085 0.084 -0.001 0.874 -0.036 0.000 0.000
Below 50th 17 449 8,279 0.095 0.066 -0.029 0.001 0.093 0.093 0.000 0.941 -0.029 0.003 0.004
Effective Spread (%)
95th + 69 1,279 30,296 0.132 0.075 -0.057 0.000 0.098 0.101 0.003 0.281 -0.060 0.000 0.000
75th – 94th 123 811 12,444 0.128 0.084 -0.045 0.000 0.109 0.111 0.002 0.504 -0.047 0.000 0.000
50th – 74th 38 780 11,117 0.163 0.112 -0.051 0.000 0.132 0.158 0.026 0.040 -0.077 0.000 0.000
Below 50th 17 449 8,279 0.176 0.142 -0.035 0.020 0.160 0.214 0.054 0.083 -0.088 0.011 0.001
Quoted Spread ($)
95th + 69 1,279 30,296 0.130 0.074 -0.056 0.000 0.104 0.099 -0.005 0.059 -0.050 0.000 0.000
75th – 94th 123 811 12,444 0.143 0.092 -0.051 0.000 0.137 0.139 0.002 0.479 -0.053 0.000 0.000
50th – 74th 38 780 11,117 0.151 0.094 -0.057 0.000 0.116 0.113 -0.003 0.655 -0.053 0.000 0.000
Below 50th 17 449 8,279 0.130 0.086 -0.043 0.000 0.124 0.122 -0.003 0.586 -0.041 0.001 0.002
Quoted Spread (%)
95th + 69 1,279 30,296 0.158 0.085 -0.073 0.000 0.114 0.119 0.005 0.103 -0.078 0.000 0.000
75th – 94th 123 811 12,444 0.162 0.099 -0.063 0.000 0.133 0.136 0.003 0.284 -0.067 0.000 0.000
50th – 74th 38 780 11,117 0.211 0.136 -0.074 0.000 0.167 0.197 0.029 0.048 -0.104 0.000 0.000
Below 50th 17 449 8,279 0.226 0.176 -0.050 0.011 0.200 0.263 0.062 0.085 -0.112 0.009 0.001
Source: LiveVol; OptionMetrics; CRSP.
Note: Each switching option class is matched with a non-switching option class based on underlying market capitalization and option volume. Matched pairs of switching and non-switching option classes are categorized into market capitalization percentiles using the underlying market capitalization of the switching option class at the end of the month prior to the addition date. Market capitalization percentiles are defined using the stocks listed on the NYSE. The average daily volume and average daily trade count are calculated on a per symbol basis and are calculated using the month prior to the month the option class was added to the Pilot (the "pre" month).
Table 6

Univariate Statistics Reported by Option Class VolumeUnconstrained Matching
Switching Non-Switching Difference-in-Differences
Option VolumePercentile N
Average Daily Trade Count
Average Daily Volume Pre Post Change P-Value Pre Post Change P-Value Diff-in-Diff T-Test
Wilcoxon Signed-Rank
Effective Spread ($)
98th+ 49 2,461 48,820 0.129 0.089 -0.041 0.000 0.102 0.093 -0.009 0.002 -0.032 0.000 0.000
95th – 97th 77 869 15,309 0.105 0.064 -0.041 0.000 0.082 0.077 -0.005 0.011 -0.037 0.000 0.000
90th – 94th 73 411 6,691 0.098 0.064 -0.034 0.000 0.101 0.105 0.004 0.178 -0.037 0.000 0.000
Below 90th 48 162 2,600 0.088 0.058 -0.030 0.000 0.106 0.108 0.002 0.620 -0.032 0.000 0.000
Effective Spread (%)
98th+ 49 2,461 48,820 0.136 0.092 -0.044 0.000 0.108 0.108 0.000 0.989 -0.044 0.000 0.000
95th – 97th 77 869 15,309 0.135 0.086 -0.049 0.000 0.111 0.122 0.011 0.138 -0.060 0.000 0.000
90th – 94th 73 411 6,691 0.138 0.090 -0.048 0.000 0.100 0.107 0.008 0.021 -0.055 0.000 0.000
Below 90th 48 162 2,600 0.144 0.092 -0.052 0.000 0.142 0.162 0.020 0.067 -0.072 0.000 0.000
Quoted Spread ($)
98th+ 49 2,461 48,820 0.165 0.109 -0.057 0.000 0.124 0.115 -0.009 0.007 -0.047 0.000 0.000
95th – 97th 77 869 15,309 0.142 0.082 -0.060 0.000 0.105 0.100 -0.005 0.018 -0.055 0.000 0.000
90th – 94th 73 411 6,691 0.134 0.085 -0.049 0.000 0.134 0.139 0.006 0.160 -0.055 0.000 0.000
Below 90th 48 162 2,600 0.117 0.074 -0.042 0.000 0.138 0.139 0.002 0.748 -0.044 0.000 0.000
Quoted Spread (%)
98th+ 49 2,461 48,820 0.163 0.105 -0.058 0.000 0.124 0.125 0.001 0.774 -0.059 0.000 0.000
95th – 97th 77 869 15,309 0.171 0.101 -0.069 0.000 0.135 0.149 0.014 0.096 -0.083 0.000 0.000
90th – 94th 73 411 6,691 0.176 0.109 -0.067 0.000 0.126 0.135 0.009 0.013 -0.075 0.000 0.000
Below 90th 48 162 2,600 0.182 0.110 -0.072 0.000 0.174 0.197 0.024 0.056 -0.096 0.000 0.000
Source: LiveVol; OptionMetrics; CRSP.
Note: Each switching option class is matched with a non-switching option class based on underlying market capitalization and option volume. Matched pairs of switching and non-switching option classes are categorized into option class volume percentiles using the option class volume of the switching option class during the month prior to the addition date. Option class percentiles are defined using the universe of option classes on common stock in the LiveVol data. The average daily volume and average daily trade count are calculated on a per symbol basis and are calculated using the month prior to the month the option class was added to the Pilot (the "pre" month).
Table 7

Univariate Statistics Reported by Quoted PriceUnconstrained Matching
Switching Non-Switching Difference-in-Differences
Quoted Price NAverage Daily Trade Count
Average Daily Volume Pre Post Change P-Value Pre Post Change P-Value Diff-in-Diff T-Test
Wilcoxon Signed-Rank
Effective Spread ($)
< $1 247 322 7,690 0.054 0.027 -0.027 0.000 0.044 0.044 0.000 0.761 -0.027 0.000 0.000
$1 – $3 247 307 5,496 0.075 0.046 -0.029 0.000 0.066 0.066 0.000 0.809 -0.029 0.000 0.000
$3 – $5 245 102 1,447 0.122 0.084 -0.039 0.000 0.112 0.115 0.004 0.099 -0.042 0.000 0.000
> $5 234 148 1,720 0.195 0.145 -0.050 0.000 0.189 0.185 -0.004 0.291 -0.046 0.000 0.000
Effective Spread (%)
< $1 247 322 7,690 0.324 0.195 -0.129 0.000 0.259 0.265 0.006 0.252 -0.135 0.000 0.000
$1 – $3 247 307 5,496 0.044 0.027 -0.018 0.000 0.038 0.038 0.000 0.899 -0.018 0.000 0.000
$3 – $5 245 102 1,447 0.033 0.022 -0.010 0.000 0.030 0.031 0.001 0.105 -0.011 0.000 0.000
> $5 234 148 1,720 0.022 0.016 -0.006 0.000 0.021 0.021 -0.001 0.261 -0.006 0.000 0.000
Quoted Spread ($)
< $1 247 322 7,690 0.071 0.032 -0.039 0.000 0.055 0.055 0.000 0.789 -0.039 0.000 0.000
$1 – $3 247 307 5,496 0.098 0.056 -0.042 0.000 0.082 0.083 0.001 0.454 -0.043 0.000 0.000
$3 – $5 245 102 1,447 0.166 0.111 -0.055 0.000 0.147 0.151 0.004 0.034 -0.060 0.000 0.000
> $5 234 148 1,720 0.264 0.195 -0.069 0.000 0.247 0.249 0.002 0.742 -0.070 0.000 0.000
Quoted Spread (%)
< $1 247 322 7,690 0.401 0.228 -0.173 0.000 0.312 0.318 0.006 0.272 -0.179 0.000 0.000
$1 – $3 247 307 5,496 0.058 0.033 -0.025 0.000 0.048 0.049 0.001 0.206 -0.026 0.000 0.000
$3 – $5 245 102 1,447 0.044 0.029 -0.015 0.000 0.039 0.040 0.001 0.041 -0.016 0.000 0.000
> $5 234 148 1,720 0.031 0.022 -0.009 0.000 0.028 0.028 0.000 0.846 -0.009 0.000 0.000
Source: LiveVol; OptionMetrics; CRSP.
Note: Each switching option class is matched with a non-switching option class based on underlying market capitalization and option volume. Trades for a given option-class are grouped according to the bid and ask price. Instances in which the bid and ask fall into separate groups are excluded from the calculation (2.8% of trades). The average daily volume and average daily trade count are calculated on a per symbol basis and are calculated using the month prior to the month the option class was added to the Pilot (the "pre" month).
Table 8

Univariate Statistics Reported by Expiration DateUnconstrained Matching
Switching Non-Switching Difference-in-Differences
Expiration Date NAverage Daily Trade Count
Average Daily Volume Pre Post Change P-Value Pre Post Change P-Value Diff-in-Diff T-Test
Wilcoxon Signed-Rank
Effective Spread ($)
< 1 week 247 133 2,242 0.090 0.056 -0.034 0.000 0.082 0.083 0.001 0.838 -0.034 0.000 0.000
1 – 2 weeks 246 98 1,751 0.080 0.048 -0.031 0.000 0.073 0.071 -0.002 0.377 -0.030 0.000 0.000
2 – 4 weeks 247 146 2,541 0.078 0.047 -0.031 0.000 0.072 0.071 -0.001 0.627 -0.030 0.000 0.000
+4 weeks 247 535 10,412 0.110 0.074 -0.036 0.000 0.101 0.101 0.000 0.938 -0.036 0.000 0.000
Effective Spread (%)
< 1 week 247 133 2,242 0.413 0.303 -0.110 0.000 0.357 0.364 0.007 0.487 -0.117 0.000 0.000
1 – 2 weeks 246 98 1,751 0.330 0.205 -0.125 0.000 0.260 0.264 0.005 0.594 -0.130 0.000 0.000
2 – 4 weeks 247 146 2,541 0.246 0.147 -0.100 0.000 0.191 0.204 0.014 0.038 -0.113 0.000 0.000
+4 weeks 247 535 10,412 0.102 0.061 -0.041 0.000 0.083 0.087 0.004 0.215 -0.045 0.000 0.000
Quoted Spread ($)
< 1 week 247 133 2,242 0.118 0.071 -0.047 0.000 0.104 0.107 0.003 0.414 -0.049 0.000 0.000
1 – 2 weeks 246 98 1,751 0.104 0.060 -0.045 0.000 0.092 0.092 0.000 0.958 -0.045 0.000 0.000
2 – 4 weeks 247 146 2,541 0.104 0.059 -0.045 0.000 0.093 0.091 -0.001 0.512 -0.044 0.000 0.000
+4 weeks 247 535 10,412 0.148 0.095 -0.052 0.000 0.130 0.131 0.001 0.728 -0.053 0.000 0.000
Quoted Spread (%)
< 1 week 247 133 2,242 0.475 0.344 -0.131 0.000 0.401 0.422 0.021 0.054 -0.152 0.000 0.000
1 – 2 weeks 246 98 1,751 0.388 0.237 -0.150 0.000 0.300 0.313 0.013 0.166 -0.164 0.000 0.000
2 – 4 weeks 247 146 2,541 0.299 0.171 -0.128 0.000 0.230 0.243 0.013 0.059 -0.141 0.000 0.000
+4 weeks 247 535 10,412 0.131 0.073 -0.058 0.000 0.104 0.109 0.005 0.190 -0.063 0.000 0.000
Source: LiveVol; OptionMetrics; CRSP.
Note: Each switching option class is matched with a non-switching option class based on underlying market capitalization and option volume. Trades for a given option-class are grouped according to the time to an option series' expiration. The average daily volume and average daily trade count are calculated on a per symbol basis and are calculated using the month prior to the month the option class was added to the Pilot (the "pre" month).
Table 9

Univariate Statistics Reported by Penny Pilot Addition Date PeriodsUnconstrained MatchingOption Classes on ETFs
Switching Non-Switching Difference-in-Differences
Addition Dates NAverage Daily Trade Count
Average Daily Volume Pre Post Change P-Value Pre Post Change P-Value Diff-in-Diff T-Test
Wilcoxon Signed-Rank
Effective Spread ($)
All 53 1,149 39,965 0.115 0.077 -0.037 0.000 0.095 0.107 0.012 0.041 -0.050 0.000 0.000
2007 – 2009 27 1,889 70,848 0.123 0.073 -0.050 0.000 0.099 0.105 0.006 0.420 -0.056 0.000 0.000
2010 – 2011 19 239 5,950 0.105 0.061 -0.043 0.000 0.096 0.111 0.016 0.199 -0.059 0.000 0.000
2012 – 2015 7 766 13,169 0.111 0.138 0.027 0.455 0.078 0.106 0.028 0.079 -0.001 0.983 0.297
Effective Spread (%)
All 53 1,149 39,965 0.136 0.099 -0.037 0.000 0.117 0.130 0.013 0.002 -0.050 0.000 0.000
2007 – 2009 27 1,889 70,848 0.120 0.088 -0.032 0.000 0.115 0.132 0.017 0.003 -0.049 0.000 0.000
2010 – 2011 19 239 5,950 0.146 0.101 -0.045 0.000 0.118 0.132 0.014 0.080 -0.059 0.000 0.000
2012 – 2015 7 766 13,169 0.175 0.138 -0.037 0.000 0.121 0.119 -0.002 0.858 -0.035 0.006 0.031
Quoted Spread ($)
All 53 1,149 39,965 0.154 0.102 -0.052 0.000 0.124 0.139 0.016 0.032 -0.068 0.000 0.000
2007 – 2009 27 1,889 70,848 0.156 0.092 -0.064 0.000 0.124 0.133 0.008 0.369 -0.072 0.000 0.000
2010 – 2011 19 239 5,950 0.140 0.078 -0.062 0.000 0.127 0.146 0.020 0.173 -0.082 0.000 0.000
2012 – 2015 7 766 13,169 0.183 0.204 0.022 0.684 0.112 0.145 0.033 0.087 -0.012 0.830 0.297
Quoted Spread (%)
All 53 1,149 39,965 0.183 0.125 -0.058 0.000 0.152 0.166 0.014 0.005 -0.072 0.000 0.000
2007 – 2009 27 1,889 70,848 0.151 0.104 -0.046 0.000 0.145 0.162 0.017 0.004 -0.064 0.000 0.000
2010 – 2011 19 239 5,950 0.192 0.126 -0.067 0.000 0.154 0.171 0.016 0.085 -0.083 0.000 0.000
2012 – 2015 7 766 13,169 0.281 0.201 -0.080 0.000 0.173 0.168 -0.005 0.762 -0.075 0.009 0.031
Source: LiveVol; OptionMetrics; CRSP.
Note: Each switching option class is matched with a non-switching option class based on underlying market capitalization and option volume. Pilot addition dates 1/26/07, 9/28/07, 3/28/08, and 11/2/09 are included in the 2007 – 2009 addition date period; Pilot addition dates 2/1/10, 5/3/10, 8/2/10, 1/4/11, and 7/6/11 are included in the 2010 – 2011 period; and Pilot addition dates 1/4/12, 7/3/12, 1/3/13, 7/3/13, 1/3/14, 7/3/14, 1/5/15, and 7/6/15 are included in the 2012 – 2015 period. The average daily volume and average daily trade count are calculated on a per symbol basis and are calculated using the month prior to the month the option class was added to the Pilot (the "pre" month).
Table 10

Univariate Statistics Reported by Underlying Market CapitalizationUnconstrained MatchingOption Classes on ETFs
Switching Non-Switching Difference-in-Differences
Market CapPercentile N
Average Daily Trade Count
Average Daily Volume Pre Post Change P-Value Pre Post Change P-Value Diff-in-Diff T-Test
Wilcoxon Signed-Rank
Effective Spread ($)
75th+ 14 2,213 103,814 0.125 0.077 -0.049 0.028 0.081 0.085 0.004 0.519 -0.053 0.016 0.000
50th – 74th 17 947 24,294 0.102 0.061 -0.042 0.000 0.093 0.110 0.017 0.170 -0.058 0.001 0.000
Below 50th 22 628 11,443 0.118 0.091 -0.027 0.070 0.105 0.120 0.015 0.185 -0.042 0.017 0.000
Effective Spread (%)
75th+ 14 2,213 103,814 0.126 0.086 -0.040 0.000 0.095 0.108 0.012 0.044 -0.052 0.000 0.000
50th – 74th 17 947 24,294 0.128 0.095 -0.033 0.000 0.117 0.135 0.019 0.035 -0.052 0.000 0.000
Below 50th 22 628 11,443 0.149 0.110 -0.039 0.000 0.131 0.141 0.009 0.176 -0.048 0.000 0.000
Quoted Spread ($)
75th+ 14 2,213 103,814 0.158 0.096 -0.062 0.009 0.104 0.105 0.001 0.888 -0.063 0.007 0.000
50th – 74th 17 947 24,294 0.135 0.078 -0.057 0.000 0.120 0.143 0.023 0.110 -0.080 0.000 0.000
Below 50th 22 628 11,443 0.166 0.124 -0.042 0.040 0.138 0.158 0.019 0.147 -0.061 0.009 0.000
Quoted Spread (%)
75th+ 14 2,213 103,814 0.165 0.107 -0.057 0.000 0.119 0.131 0.012 0.056 -0.069 0.000 0.000
50th – 74th 17 947 24,294 0.168 0.115 -0.053 0.000 0.151 0.172 0.021 0.025 -0.075 0.000 0.000
Below 50th 22 628 11,443 0.206 0.144 -0.063 0.000 0.173 0.183 0.010 0.283 -0.072 0.000 0.000
Source: LiveVol; OptionMetrics; CRSP.
Note: Each switching option class is matched with a non-switching option class based on underlying market capitalization and option volume. Matched pairs of switching and non-switching option classes are categorized into market capitalization percentiles using the underlying market capitalization of the switching option class at the end of the month prior to the addition date. Market capitalization percentiles are defined using the stocks listed on the NYSE. The average daily volume and average daily trade count are calculated on a per symbol basis and are calculated using the month prior to the month the option class was added to the Pilot (the "pre" month).
Table 11

Univariate Statistics Reported by Option Class VolumeUnconstrained MatchingOption Classes on ETFs
Switching Non-Switching Difference-in-Differences
Option VolumePercentile N
Average Daily Trade Count
Average Daily Volume Pre Post Change P-Value Pre Post Change P-Value Diff-in-Diff T-Test
Wilcoxon Signed-Rank
Effective Spread ($)
95th+ 15 2,350 111,135 0.128 0.091 -0.036 0.173 0.107 0.126 0.018 0.185 -0.055 0.076 0.005
90th – 94th 19 1,118 18,709 0.114 0.079 -0.035 0.001 0.075 0.081 0.006 0.361 -0.040 0.000 0.000
Below 90th 19 233 5,034 0.106 0.065 -0.041 0.000 0.105 0.119 0.015 0.228 -0.056 0.000 0.000
Effective Spread (%)
95th+ 15 2,350 111,135 0.115 0.078 -0.037 0.000 0.104 0.116 0.012 0.076 -0.048 0.000 0.000
90th – 94th 19 1,118 18,709 0.141 0.111 -0.030 0.000 0.121 0.136 0.015 0.038 -0.045 0.000 0.000
Below 90th 19 233 5,034 0.149 0.103 -0.046 0.000 0.124 0.136 0.012 0.138 -0.058 0.000 0.000
Quoted Spread ($)
95th+ 15 2,350 111,135 0.159 0.119 -0.040 0.215 0.133 0.155 0.022 0.200 -0.062 0.096 0.007
90th – 94th 19 1,118 18,709 0.162 0.108 -0.055 0.000 0.102 0.108 0.006 0.454 -0.060 0.000 0.000
Below 90th 19 233 5,034 0.141 0.083 -0.059 0.000 0.137 0.158 0.021 0.138 -0.080 0.000 0.000
Quoted Spread (%)
95th+ 15 2,350 111,135 0.148 0.097 -0.051 0.000 0.131 0.143 0.012 0.087 -0.063 0.000 0.000
90th – 94th 19 1,118 18,709 0.197 0.143 -0.054 0.000 0.158 0.170 0.012 0.142 -0.067 0.000 0.000
Below 90th 19 233 5,034 0.196 0.128 -0.067 0.000 0.162 0.180 0.017 0.094 -0.085 0.000 0.000
Source: LiveVol; OptionMetrics; CRSP.
Note: Each switching option class is matched with a non-switching option class based on underlying market capitalization and option volume. Matched pairs of switching and non-switching option classes are categorized into option class volume percentiles using the option class volume of the switching option class during the month prior to the addition date. Option class percentiles are defined using the universe of option classes on common stock in the LiveVol data. The average daily volume and average daily trade count are calculated on a per symbol basis and are calculated using the month prior to the month the option class was added to the Pilot (the "pre" month).
Table 12

Penny Pilot Regression Results[1]
Impact on Effective SpreadsOption Classes on Common Stock
Full Sample[2] Dec. 2006 – Dec. 2009[3] Jan. 2010 – Aug. 2011[4] Dec. 2011 – Feb. 2016[5]
Parameter Dollar Percent Dollar Percent Dollar Percent Dollar Percent
(1) (2) (3) (4) (5) (6) (7) (8)
Post-Addition Indicator[6] -0.088** -0.074** -0.034** -0.062** -0.080** -0.084** -0.005 -0.006 (0.000) (0.000) (0.000) (0.000) (0.000) (0.000) (0.821) (0.434)
Equity Volatility[7] 0.831** 0.587** 0.410** 0.286** 0.737** 0.305** 0.958** 0.630**(0.000) (0.000) (0.000) (0.000) (0.000) (0.000) (0.000) (0.000)
Log of Option Volume[8] -0.015** -0.012** -0.006** -0.005** -0.010** -0.006** -0.019** -0.011**(0.000) (0.000) (0.000) (0.000) (0.000) (0.000) (0.000) (0.000)
Log of Underlying Volume[9] 0.004* -0.005** 0.007** -0.002 0.010** 0.005** 0.007** -0.003* (0.011) (0.000) (0.000) (0.222) (0.000) (0.009) (0.001) (0.033)
Number of Class/Days 1,331,185 1,331,185 292,670 292,670 411,698 411,698 626,768 626,768
Number of Classes 3,833 3,833 2,625 2,625 2,358 2,358 3,078 3,078
Sources: LiveVol; CRSP; OptionMetrics; ISE Penny Pilot Addition Dates.
[1] This table reports results from a panel regression estimating the effects of switching to trading in pennies on effective spreads in the options market. The sample includes data for all options on common stock that traded in the calendar month before and calendar month after the Penny Pilot addition dates. The dependent variable is the average effective spread. The average spread is calculated by (1) calculating the volume weighted spread for an option series-day and then (2) equally weighting across option series to calculate the average spread for an option class-day. Canceled trades and trades that were executed during a locked or crossed market are excluded. Options with non-standard settlement types are excluded. Only trades with a condition code in 0, 18, 95, and 106 are included. Condition codes 0, 18, 95, and 106 correspond to regular trades and intermarket sweep orders. Effective spreads that are greater than $5 when the price is less than $100 and effective spreads that are greater than $10 otherwise are excluded from the average effective spread calculation. If the underlying stocks traded below $1 or above $1,000 on any day for which an average effective spread is calculated, the entire option class is removed from the sample. Date and option class fixed effects are used. Standard errors are estimated by clustering on option class and date. The "Permno" in CRSP is used to identify option classes over time. P-values are reported in parentheses below the coefficient estimates. Coefficient estimates that are statistically different from zero at the 5% significance level are marked with one asterisk and those that are statistically different from zero at the 1% significance level are marked with two asterisks.[2] The model is estimated over the time period from December 1, 2006 to February 29, 2016. The sample includes 38 calendar months of data.[3] Pilot addition dates 1/26/07, 9/28/07, 3/28/08, and 11/2/09 are included in the December 2006 – December 2009 period.[4] Pilot addition dates 2/1/10, 5/3/10, 8/2/10, 1/4/11, and 7/6/11 are included in the January 2010 – August 2011 period. [5] Pilot addition dates 1/4/12, 7/3/12, 1/3/13, 7/3/13, 1/3/14, 7/3/14, 1/5/15, and 7/6/15 are included in the December 2011 – February 2016 period. [6] An indicator variable that equals one in the post-addition period and zero otherwise.[7] The underlying stock volatility as measured by the high price minus the low price divided by the closing price.[8] The natural log of the option class volume. The option class volume excludes canceled trades and only includes trades with a condition code in 0, 18, 95, and 106.[9] The natural log of the volume for the underlying stock.
Table 13
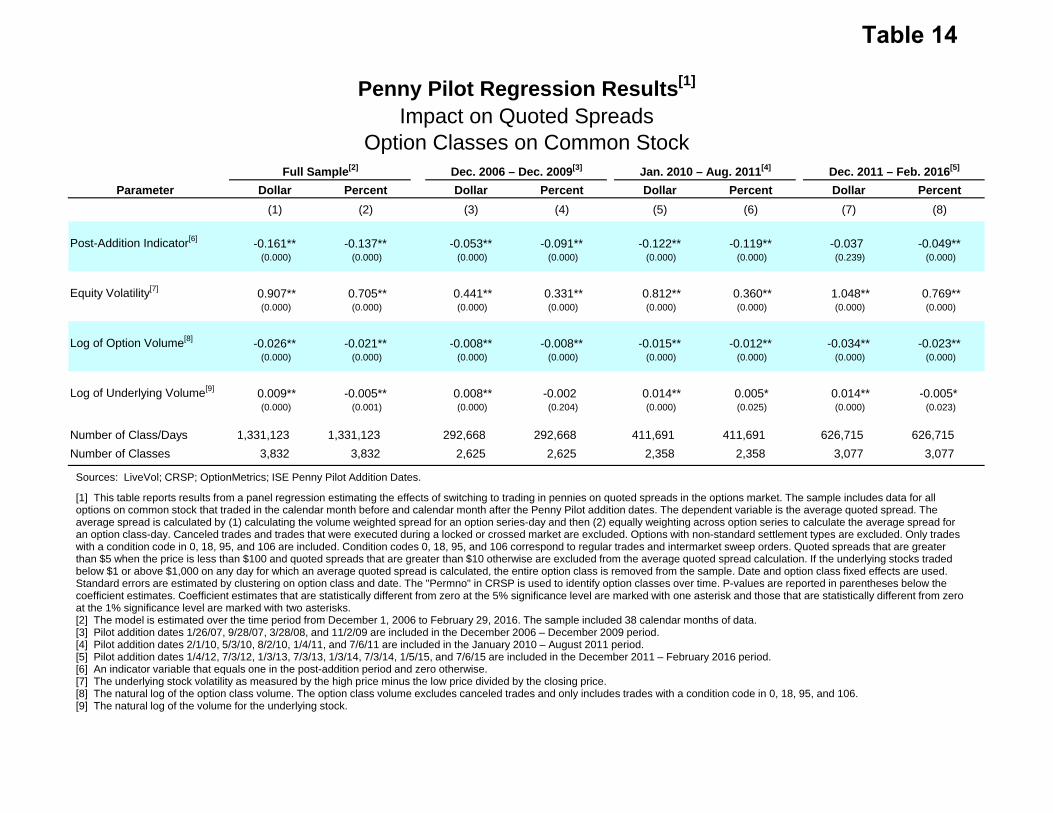
Penny Pilot Regression Results[1]
Impact on Quoted SpreadsOption Classes on Common Stock
Full Sample[2] Dec. 2006 – Dec. 2009[3] Jan. 2010 – Aug. 2011[4] Dec. 2011 – Feb. 2016[5]
Parameter Dollar Percent Dollar Percent Dollar Percent Dollar Percent
(1) (2) (3) (4) (5) (6) (7) (8)
Post-Addition Indicator[6] -0.161** -0.137** -0.053** -0.091** -0.122** -0.119** -0.037 -0.049**(0.000) (0.000) (0.000) (0.000) (0.000) (0.000) (0.239) (0.000)
Equity Volatility[7] 0.907** 0.705** 0.441** 0.331** 0.812** 0.360** 1.048** 0.769**(0.000) (0.000) (0.000) (0.000) (0.000) (0.000) (0.000) (0.000)
Log of Option Volume[8] -0.026** -0.021** -0.008** -0.008** -0.015** -0.012** -0.034** -0.023**(0.000) (0.000) (0.000) (0.000) (0.000) (0.000) (0.000) (0.000)
Log of Underlying Volume[9] 0.009** -0.005** 0.008** -0.002 0.014** 0.005* 0.014** -0.005* (0.000) (0.001) (0.000) (0.204) (0.000) (0.025) (0.000) (0.023)
Number of Class/Days 1,331,123 1,331,123 292,668 292,668 411,691 411,691 626,715 626,715
Number of Classes 3,832 3,832 2,625 2,625 2,358 2,358 3,077 3,077
Sources: LiveVol; CRSP; OptionMetrics; ISE Penny Pilot Addition Dates.
[1] This table reports results from a panel regression estimating the effects of switching to trading in pennies on quoted spreads in the options market. The sample includes data for all options on common stock that traded in the calendar month before and calendar month after the Penny Pilot addition dates. The dependent variable is the average quoted spread. The average spread is calculated by (1) calculating the volume weighted spread for an option series-day and then (2) equally weighting across option series to calculate the average spread for an option class-day. Canceled trades and trades that were executed during a locked or crossed market are excluded. Options with non-standard settlement types are excluded. Only trades with a condition code in 0, 18, 95, and 106 are included. Condition codes 0, 18, 95, and 106 correspond to regular trades and intermarket sweep orders. Quoted spreads that are greater than $5 when the price is less than $100 and quoted spreads that are greater than $10 otherwise are excluded from the average quoted spread calculation. If the underlying stocks traded below $1 or above $1,000 on any day for which an average quoted spread is calculated, the entire option class is removed from the sample. Date and option class fixed effects are used. Standard errors are estimated by clustering on option class and date. The "Permno" in CRSP is used to identify option classes over time. P-values are reported in parentheses below the coefficient estimates. Coefficient estimates that are statistically different from zero at the 5% significance level are marked with one asterisk and those that are statistically different from zero at the 1% significance level are marked with two asterisks.[2] The model is estimated over the time period from December 1, 2006 to February 29, 2016. The sample included 38 calendar months of data.[3] Pilot addition dates 1/26/07, 9/28/07, 3/28/08, and 11/2/09 are included in the December 2006 – December 2009 period.[4] Pilot addition dates 2/1/10, 5/3/10, 8/2/10, 1/4/11, and 7/6/11 are included in the January 2010 – August 2011 period. [5] Pilot addition dates 1/4/12, 7/3/12, 1/3/13, 7/3/13, 1/3/14, 7/3/14, 1/5/15, and 7/6/15 are included in the December 2011 – February 2016 period. [6] An indicator variable that equals one in the post-addition period and zero otherwise.[7] The underlying stock volatility as measured by the high price minus the low price divided by the closing price.[8] The natural log of the option class volume. The option class volume excludes canceled trades and only includes trades with a condition code in 0, 18, 95, and 106.[9] The natural log of the volume for the underlying stock.
Table 14

Penny Pilot Regression Results[1]
Impact on Effective SpreadsUnconstrained Matching[2]
Full Sample[3] Dec. 2006 – Dec. 2009[4] Jan. 2010 – Aug. 2011[5] Dec. 2011 – Aug. 2015[6]
Parameter Dollar Percent Dollar Percent Dollar Percent Dollar Percent
(1) (2) (3) (4) (5) (6) (7) (8)
Post-Switch Indicator[7] -0.036** -0.058** -0.034** -0.059** -0.040** -0.060** -0.011* -0.032**(0.000) (0.000) (0.000) (0.000) (0.000) (0.000) (0.036) (0.001)
Equity Volatility[8] 0.360** -0.200 0.286** -0.194** 0.391** -0.251 0.362** 0.158 (0.000) (0.110) (0.000) (0.009) (0.000) (0.196) (0.002) (0.206)
Log of Option Volume[9] 0.002** -0.001 0.002** 0.000 0.002* -0.002 0.001 0.016**(0.004) (0.439) (0.008) (0.959) (0.022) (0.234) (0.653) (0.005)
Log of Underlying Volume[10] 0.008** 0.009 0.010** 0.009* 0.006** 0.010 0.018** -0.018 (0.000) (0.074) (0.000) (0.027) (0.001) (0.148) (0.001) (0.236)
Number of Class/Days 21,025 21,025 7,368 7,368 12,369 12,369 1,288 1,288
Number of Classes 494 494 170 170 292 292 32 32
Sources: LiveVol; CRSP; OptionMetrics; ISE Penny Pilot Addition Dates.
[1] This table reports results from a panel regression estimating the effects of switching to trading in pennies on effective spreads in the options market. The sample includes data for options on common stock that traded in the calendar month before and calendar month after the Penny Pilot addition dates. The dependent variable is the average effective spread. The average spread is calculated by (1) calculating the volume weighted spread for an option series-day and then (2) equally weighting across option series to calculate the average spread for an option class-day. Canceled trades and trades that were executed during a locked or crossed market are excluded. Option classes on common stock are identified using share code 10 and 11 in the CRSP data. Options with non-standard settlement types are excluded. Only trades with a condition code in 0, 18, 95, and 106 are included. Condition codes 0, 18, 95, and 106 correspond to regular trades and intermarket sweep orders. Effective spreads that are greater than $5 when the price is less than $100 and effective spreads that are greater than $10 otherwise are excluded from the average effective spread calculation. If the underlying stocks traded below $1 or above $1,000 on any day for which an average effective spread is calculated, the entire option class is removed from the sample. Date and option event fixed effects are used. Standard errors are estimated by clustering on option class-event and date. The "Permno" in CRSP is used to identify option classes over time. P-values are reported in parentheses below the coefficient estimates. Coefficient estimates that are statistically different from zero at the 5% significance level are marked with one asterisk and those that are statistically different from zero at the 1% significance level are marked with two asterisks.[2] Each switching option class is matched with a non-switching option class based on underlying market capitalization and option volume. [3] The model is estimated over the time period from December 1, 2006 to August 31, 2015. [3] Pilot addition dates 1/26/07, 9/28/07, 3/28/08, and 11/2/09 are included in the December 2006 – December 2009 period.[4] Pilot addition dates 2/1/10, 5/3/10, 8/2/10, 1/4/11, and 7/6/11 are included in the January 2010 – August 2011 period. [5] Pilot addition dates 1/4/12, 7/3/12, 1/3/13, 7/3/13, 1/3/14, 7/3/14, 1/5/15, and 7/6/15 are included in the December 2011 – August 2015 period. [7] An indicator variable that equals one in the post-switch period and zero otherwise.[8] The underlying stock volatility as measured by the high price minus the low price divided by the closing price.[9] The natural log of the option class volume. The option class volume excludes canceled trades and only includes trades with a condition code in 0, 18, 95, and 106.[10] The natural log of the volume for the underlying stock.
Table 15

Penny Pilot Regression Results[1]
Impact on Quoted SpreadsUnconstrained Matching[2]
Full Sample[3] Dec. 2006 – Dec. 2009[4] Jan. 2010 – Aug. 2011[5] Dec. 2011 – Feb. 2015[6]
Parameter Dollar Percent Dollar Percent Dollar Percent Dollar Percent
(1) (2) (3) (4) (5) (6) (7) (8)
Post-Switch Indicator[7] -0.052** -0.078** -0.048** -0.075** -0.056** -0.082** -0.036** -0.062**(0.000) (0.000) (0.000) (0.000) (0.000) (0.000) (0.000) (0.000)
Equity Volatility[8] 0.393** -0.195 0.274** -0.228** 0.439** -0.247 0.405* 0.313* (0.000) (0.161) (0.002) (0.003) (0.000) (0.253) (0.011) (0.021)
Log of Option Volume[9] 0.000 -0.004* 0.001 -0.001 0.000 -0.004* -0.002 0.003 (0.698) (0.019) (0.256) (0.452) (0.795) (0.023) (0.759) (0.600)
Log of Underlying Volume[10] 0.011** 0.011* 0.014** 0.011** 0.008** 0.012 0.029** -0.009 (0.000) (0.032) (0.000) (0.009) (0.000) (0.105) (0.000) (0.321)
Number of Class/Days 21,025 21,025 7,368 7,368 12,369 12,369 1,288 1,288
Number of Classes 494 494 170 170 292 292 32 32
Sources: LiveVol; CRSP; OptionMetrics; ISE Penny Pilot Addition Dates.
[1] This table reports results from a panel regression estimating the effects of switching to trading in pennies on quoted spreads in the options market. The sample includes data for options on common stock that traded in the calendar month before and calendar month after the Penny Pilot addition dates. The dependent variable is the average quoted spread. The average spread is calculated by (1) calculating the volume weighted spread for an option series-day and then (2) equally weighting across option series to calculate the average spread for an option class-day. Canceled trades and trades that were executed during a locked or crossed market are excluded. Option classes on common stock are identified using share code 10 and 11 in the CRSP data. Options with non-standard settlement types are excluded. Only trades with a condition code in 0, 18, 95, and 106 are included. Condition codes 0, 18, 95, and 106 correspond to regular trades and intermarket sweep orders. Quoted spreads that are greater than $5 when the price is less than $100 and quoted spreads that are greater than $10 otherwise are excluded from the average quoted spread calculation. If the underlying stocks traded below $1 or above $1,000 on any day for which an average quoted spread is calculated, the entire option class is removed from the sample. Date and option event fixed effects are used. Standard errors are estimated by clustering on option class-event and date. The "Permno" in CRSP is used to identify option classes over time. P-values are reported in parentheses below the coefficient estimates. Coefficient estimates that are statistically different from zero at the 5% significance level are marked with one asterisk and those that are statistically different from zero at the 1% significance level are marked with two asterisks.[2] Each switching option class is matched with a non-switching option class based on underlying market capitalization and option volume. [3] The model is estimated over the time period from December 1, 2006 to August 31, 2015. [3] Pilot addition dates 1/26/07, 9/28/07, 3/28/08, and 11/2/09 are included in the December 2006 – December 2009 period.[4] Pilot addition dates 2/1/10, 5/3/10, 8/2/10, 1/4/11, and 7/6/11 are included in the January 2010 – August 2011 period. [5] Pilot addition dates 1/4/12, 7/3/12, 1/3/13, 7/3/13, 1/3/14, 7/3/14, 1/5/15, and 7/6/15 are included in the December 2011 – August 2015 period. [7] An indicator variable that equals one in the post-switch period and zero otherwise.[8] The underlying stock volatility as measured by the high price minus the low price divided by the closing price.[9] The natural log of the option class volume. The option class volume excludes canceled trades and only includes trades with a condition code in 0, 18, 95, and 106.[10] The natural log of the volume for the underlying stock.
Table 16

Penny Pilot Regression Results[1]
Impact on Effective SpreadsUnconstrained Matching[2]
Market Capitalization Percentile[3]
95th and Above 75th – 94th 50th – 74th Below 50th
Parameter Dollar Percent Dollar Percent Dollar Percent Dollar Percent
(1) (2) (3) (4) (5) (6) (7) (8)
Post-Switch Indicator[4] -0.035** -0.060** -0.036** -0.047** -0.037** -0.076** -0.032** -0.087**(0.000) (0.000) (0.000) (0.000) (0.000) (0.000) (0.000) (0.000)
Equity Volatility[5] 0.602** -0.083 0.407** -0.056 0.334** -0.536 0.286** -0.097 (0.000) (0.378) (0.000) (0.300) (0.000) (0.085) (0.000) (0.781)
Log of Option Volume[6] 0.002** 0.001 0.002* -0.001 0.001 0.000 0.001 -0.015 (0.009) (0.439) (0.013) (0.542) (0.799) (0.959) (0.568) (0.150)
Log of Underlying Volume[7] 0.009** 0.007** 0.010** 0.007* 0.007 0.034* 0.001 -0.005 (0.000) (0.004) (0.000) (0.010) (0.104) (0.027) (0.792) (0.664)
Number of Class/Days 5,923 5,923 10,465 10,465 3,198 3,198 1,439 1,439
Number of Classes 138 138 246 246 76 76 34 34
Sources: LiveVol; CRSP; OptionMetrics; ISE Penny Pilot Addition Dates.
[1] This table reports results from a panel regression estimating the effects of switching to trading in pennies on effective spreads in the options market. The sample includes data for options on common stock that traded in the calendar month before and calendar month after the Penny Pilot addition dates. The dependent variable is the average effective spread. The average spread is calculated by (1) calculating the volume weighted spread for an option series-day and then (2) equally weighting across option series to calculate the average spread for an option class-day. Canceled trades and trades that were executed during a locked or crossed market are excluded. Options with non-standard settlement types are excluded. Only trades with a condition code in 0, 18, 95, and 106 are included. Condition codes 0, 18, 95, and 106 correspond to regular trades and intermarket sweep orders. Effective spreads that are greater than $5 when the price is less than $100 and effective spreads that are greater than $10 otherwise are excluded from the average effective spread calculation. If the underlying stocks traded below $1 or above $1,000 on any day for which an average effective spread is calculated, the entire option class is removed from the sample. Date and option event fixed effects are used. Standard errors are estimated by clustering on option class-event and date. The "Permno" in CRSP is used to identify option classes over time. P-values are reported in parentheses below the coefficient estimates. Coefficient estimates that are statistically different from zero at the 5% significance level are marked with one asterisk and those that are statistically different from zero at the 1% significance level are marked with two asterisks.[2] Each switching option class is matched with a non-switching option class based on underlying market capitalization and option volume. [3] Matched pairs of switching and non-switching option classes are categorized into market capitalization percentiles using the underlying market capitalization of the switching option class at the end of the month prior to the addition date. Market capitalization percentiles are defined using the stocks listed on the NYSE.[4] An indicator variable that equals one in the post-switch period and zero otherwise.[5] The underlying stock volatility as measured by the high price minus the low price divided by the closing price.[6] The natural log of the option class volume. The option class volume excludes canceled trades and only includes trades with a condition code in 0, 18, 95, and 106.[7] The natural log of the volume for the underlying stock.
Table 17

Penny Pilot Regression Results[1]
Impact on Quoted SpreadsUnconstrained Matching[2]
Market Capitalization Percentile[3]
95th and Above 75th – 94th 50th – 74th Below 50th
Parameter Dollar Percent Dollar Percent Dollar Percent Dollar Percent
(1) (2) (3) (4) (5) (6) (7) (8)
Post-Switch Indicator[4] -0.050** -0.078** -0.054** -0.066** -0.053** -0.101** -0.044** -0.112**(0.000) (0.000) (0.000) (0.000) (0.000) (0.000) (0.000) (0.000)
Equity Volatility[5] 0.626** -0.116 0.414** -0.048 0.454** -0.457 0.338** -0.150 (0.000) (0.224) (0.000) (0.452) (0.000) (0.167) (0.000) (0.712)
Log of Option Volume[6] 0.001 0.000 0.001 -0.002 -0.001 -0.004 -0.001 -0.022* (0.222) (0.993) (0.642) (0.105) (0.656) (0.446) (0.713) (0.048)
Log of Underlying Volume[7] 0.012** 0.009** 0.014** 0.008** 0.008 0.035* 0.001 0.002 (0.000) (0.000) (0.000) (0.010) (0.098) (0.019) (0.811) (0.891)
Number of Class/Days 5,923 5,923 10,465 10,465 3,198 3,198 1,439 1,439
Number of Classes 138 138 246 246 76 76 34 34
Sources: LiveVol; CRSP; OptionMetrics; ISE Penny Pilot Addition Dates.
[1] This table reports results from a panel regression estimating the effects of switching to trading in pennies on quoted spreads in the options market. The sample includes data for options on common stock that traded in the calendar month before and calendar month after the Penny Pilot addition dates. The dependent variable is the average quoted spread. The average spread is calculated by (1) calculating the volume weighted spread for an option series-day and then (2) equally weighting across option series to calculate the average spread for an option class-day. Canceled trades and trades that were executed during a locked or crossed market are excluded. Options with non-standard settlement types are excluded. Only trades with a condition code in 0, 18, 95, and 106 are included. Condition codes 0, 18, 95, and 106 correspond to regular trades and intermarket sweep orders. Quoted spreads that are greater than $5 when the price is less than $100 and quoted spreads that are greater than $10 otherwise are excluded from the average quoted spread calculation. If the underlying stocks traded below $1 or above $1,000 on any day for which an average quoted spread is calculated, the entire option class is removed from the sample. Date and option class-event fixed effects are used. Standard errors are estimated by clustering on option class-event and date. The "Permno" in CRSP is used to identify option classes over time. P-values are reported in parentheses below the coefficient estimates. Coefficient estimates that are statistically different from zero at the 5% significance level are marked with one asterisk and those that are statistically different from zero at the 1% significance level are marked with two asterisks.[2] Each switching option class is matched with a non-switching option class based on underlying market capitalization and option volume. [3] Matched pairs of switching and non-switching option classes are categorized into market capitalization percentiles using the underlying market capitalization of the switching option class at the end of the month prior to the addition date. Market capitalization percentiles are defined using the stocks listed on the NYSE.[4] An indicator variable that equals one in the post-switch period and zero otherwise.[5] The underlying stock volatility as measured by the high price minus the low price divided by the closing price.[6] The natural log of the option class volume. The option class volume excludes canceled trades and only includes trades with a condition code in 0, 18, 95, and 106.[7] The natural log of the volume for the underlying stock.
Table 18

Penny Pilot Regression Results[1]
Impact on Effective SpreadsUnconstrained Matching[2]
Option Volume Percentile[3]
98th and Above 95th – 97th 90th – 94th Below 90th
Parameter Dollar Percent Dollar Percent Dollar Percent Dollar Percent
(1) (2) (3) (4) (5) (6) (7) (8)
Post-Switch Indicator[4] -0.033** -0.045** -0.038** -0.061** -0.037** -0.055** -0.034** -0.070**(0.000) (0.000) (0.000) (0.000) (0.000) (0.000) (0.000) (0.000)
Equity Volatility[5] 0.374** -0.054 0.277** -0.307 0.422** 0.051 0.368** -0.423 (0.000) (0.502) (0.000) (0.129) (0.000) (0.443) (0.000) (0.273)
Log of Option Volume[6] 0.003* 0.001 0.003** 0.001 0.003* 0.002 -0.001 -0.005 (0.039) (0.511) (0.002) (0.575) (0.026) (0.241) (0.599) (0.106)
Log of Underlying Volume[7] 0.012** 0.005 0.006* 0.002 0.007** 0.003 0.006 0.023 (0.000) (0.236) (0.047) (0.620) (0.000) (0.470) (0.093) (0.120)
Number of Class/Days 4,208 4,208 6,609 6,609 6,156 6,156 4,052 4,052
Number of Classes 98 98 154 154 146 146 96 96
Sources: LiveVol; CRSP; OptionMetrics; ISE Penny Pilot Addition Dates.
[1] This table reports results from a panel regression estimating the effects of switching to trading in pennies on effective spreads in the options market. The sample includes data for options on common stock that traded in the calendar month before and calendar month after the Penny Pilot addition dates. The dependent variable is the average effective spread. The average spread is calculated by (1) calculating the volume weighted spread for an option series-day and then (2) equally weighting across option series to calculate the average spread for an option class-day. Canceled trades and trades that were executed during a locked or crossed market are excluded. Options with non-standard settlement types are excluded. Only trades with a condition code in 0, 18, 95, and 106 are included. Condition codes 0, 18, 95, and 106 correspond to regular trades and intermarket sweep orders. Effective spreads that are greater than $5 when the price is less than $100 and effective spreads that are greater than $10 otherwise are excluded from the average effective spread calculation. If the underlying stocks traded below $1 or above $1,000 on any day for which an average effective spread is calculated, the entire option class is removed from the sample. Date and option class-event fixed effects are used. Standard errors are estimated by clustering on option class-event and date. The "Permno" in CRSP is used to identify option classes over time. P-values are reported in parentheses below the coefficient estimates. Coefficient estimates that are statistically different from zero at the 5% significance level are marked with one asterisk and those that are statistically different from zero at the 1% significance level are marked with two asterisks.[2] Each switching option class is matched with a non-switching option class based on underlying market capitalization and option volume. [3] Matched pairs of switching and non-switching option classes are categorized into option class volume percentiles using the option class volume of the switching option class during the month prior to the addition date. Option class percentiles are defined using the universe of option classes on common stock in the LiveVol data.[4] An indicator variable that equals one in the post-switch period and zero otherwise.[5] The underlying stock volatility as measured by the high price minus the low price divided by the closing price.[6] The natural log of the option class volume. The option class volume excludes canceled trades and only includes trades with a condition code in 0, 18, 95, and 106.[7] The natural log of the volume for the underlying stock.
Table 19

Penny Pilot Regression Results[1]
Impact on Quoted SpreadsUnconstrained Matching[2]
Option Volume Percentile[3]
98th and Above 95th – 97th 90th – 94th Below 90th
Parameter Dollar Percent Dollar Percent Dollar Percent Dollar Percent
(1) (2) (3) (4) (5) (6) (7) (8)
Post-Switch Indicator[4] -0.048** -0.059** -0.056** -0.084** -0.055** -0.075** -0.045** -0.092**(0.000) (0.000) (0.000) (0.000) (0.000) (0.000) (0.000) (0.000)
Equity Volatility[5] 0.415** -0.025 0.266** -0.365 0.487** 0.090 0.421** -0.368 (0.000) (0.762) (0.001) (0.123) (0.000) (0.281) (0.001) (0.362)
Log of Option Volume[6] 0.002 0.000 0.002 0.000 0.001 -0.001 -0.003 -0.008**(0.156) (0.928) (0.083) (0.920) (0.559) (0.722) (0.115) (0.009)
Log of Underlying Volume[7] 0.015** 0.006 0.010** 0.003 0.010** 0.006 0.008* 0.026 (0.000) (0.148) (0.009) (0.529) (0.000) (0.186) (0.049) (0.094)
Number of Class/Days 4,208 4,208 6,609 6,609 6,156 6,156 4,052 4,052
Number of Classes 98 98 154 154 146 146 96 96
Sources: LiveVol; CRSP; OptionMetrics; ISE Penny Pilot Addition Dates.
[1] This table reports results from a panel regression estimating the effects of switching to trading in pennies on quoted spreads in the options market. The sample includes data for options on common stock that traded in the calendar month before and calendar month after the Penny Pilot addition dates. The dependent variable is the average quoted spread. The average spread is calculated by (1) calculating the volume weighted spread for an option series-day and then (2) equally weighting across option series to calculate the average spread for an option class-day. Canceled trades and trades that were executed during a locked or crossed market are excluded. Options with non-standard settlement types are excluded. Only trades with a condition code in 0, 18, 95, and 106 are included. Condition codes 0, 18, 95, and 106 correspond to regular trades and intermarket sweep orders. Quoted spreads that are greater than $5 when the price is less than $100 and quoted spreads that are greater than $10 otherwise are excluded from the average quoted spread calculation. If the underlying stocks traded below $1 or above $1,000 on any day for which an average quoted spread is calculated, the entire option class is removed from the sample. Date and option class-event fixed effects are used. Standard errors are estimated by clustering on option class-event and date. The "Permno" in CRSP is used to identify option classes over time. P-values are reported in parentheses below the coefficient estimates. Coefficient estimates that are statistically different from zero at the 5% significance level are marked with one asterisk and those that are statistically different from zero at the 1% significance level are marked with two asterisks.[2] Each switching option class is matched with a non-switching option class based on underlying market capitalization and option volume. [3] Matched pairs of switching and non-switching option classes are categorized into option class volume percentiles using the option class volume of the switching option class during the month prior to the addition date. Option class percentiles are defined using the universe of option classes on common stock in the LiveVol data.[4] An indicator variable that equals one in the post-switch period and zero otherwise.[5] The underlying stock volatility as measured by the high price minus the low price divided by the closing price.[6] The natural log of the option class volume. The option class volume excludes canceled trades and only includes trades with a condition code in 0, 18, 95, and 106.[7] The natural log of the volume for the underlying stock.
Table 20

Penny Pilot Regression Results[1]
Option Classes on ETFs
Full Sample[2] Unconstrained Matching[3]
Effective Spread Quoted Spread Effective Spread Quoted SpreadParameter Dollar Percent Dollar Percent Dollar Percent Dollar Percent
(1) (2) (3) (4) (5) (6) (7) (8)
Post-Switch Indicator[4] 0.008 -0.032** -0.045* -0.093** -0.049** -0.050** -0.066** -0.072**(0.664) (0.000) (0.034) (0.000) (0.000) (0.000) (0.000) (0.000)
Equity Volatility[5] 2.293** 0.149 2.331** -0.055 1.067** 0.190 1.304** 0.097 (0.000) (0.144) (0.000) (0.682) (0.000) (0.120) (0.000) (0.501)
Log of Option Volume[6] -0.023** -0.014** -0.031** -0.021** 0.001 0.001 0.001 -0.001 (0.000) (0.000) (0.000) (0.000) (0.399) (0.782) (0.729) (0.659)
Log of Underlying Volume[7] -0.029** -0.010** -0.040** -0.011** 0.003 -0.008** 0.001 -0.011**(0.000) (0.000) (0.000) (0.000) (0.602) (0.001) (0.860) (0.000)
Number of Class/Days 194,694 194,694 194,659 194,659 4,537 4,537 4,537 4,537
Number of Classes 693 693 693 693 106 106 106 106
Sources: LiveVol; CRSP; OptionMetrics; ISE Penny Pilot Addition Dates.
[1] This table reports results from a panel regression estimating the effects of switching to trading in pennies on quoted and effective spreads in the options market. The sample includes data for all options on ETFs that traded in the calendar month before and calendar month after the Penny Pilot addition dates. The dependent variable is the average quoted or average effective spread. The average spread is calculated by (1) calculating the volume weighted spread for an option series-day and then (2) equally weighting across option series to calculate the average spread for an option class-day. Canceled trades and trades that were executed during a locked or crossed market are excluded. Only trades with a condition code in 0, 18, 95, and 106 are included. Condition codes 0, 18, 95, and 106 correspond to regular trades and intermarket sweep orders. Quoted spreads that are greater than $5 when the price is less than $100 and quoted spreads that are greater than $10 otherwise are excluded from the average quoted spread calculation. The same restrictions are used to calculate average effective spreads. If the underlying ETF traded below $1 or above $1,000 on any day for which an average quoted spread or effective spread is calculated, the entire option class is removed from the sample. The "Permno" in CRSP is used to identify option classes over time. P-values are reported in parentheses below the coefficient estimates. Coefficient estimates that are statistically different from zero at the 5% significance level are marked with one asterisk and those that are statistically different from zero at the 1% significance level are marked with two asterisks.[2] All option classes on common stock for which LiveVol has data are included. Date and option class fixed effects are used. Standard errors are estimated by clustering on option class and date. [3] Each switching option class is matched with a non-switching option class based on underlying market capitalization and option volume. Date and option class-event fixed effects are used. Standard errors are estimated by clustering on option class-event and date. [4] An indicator variable that equals one in the post-switch period and zero otherwise. Note that under unconstrained matching, a switching option class may match with an option class that is already in the Pilot, in which case the option class that is already in the Pilot, acting as the control option class, has a value of zero in the pre-switch and post-switch period.[5] The underlying stock volatility as measured by the high price minus the low price divided by the closing price.[6] The natural log of the option class volume. The option class volume excludes canceled trades and only includes trades with a condition code in 0, 18, 95, and 106.[7] The natural log of the volume for the underlying stock.
Table 21

Liquidity Metrics for In-Pilot Option Classes and Control SamplesFebruary 2016
Daily Volume of Option Class (Contracts) Market Cap of Underlying Stock (Millions)
Option Volume Quartile for In-Pilot
Option Classes
Percentile Range in Universe of
Option Classes
Number of Option Classes
Number of Clusters for Matching with
Replacement[1] In-Pilot
With
Replacement[2]
Without
Replacement[3] In-Pilot
With
Replacement[2]
Without
Replacement[3]
First Quartile 41.4% - 88.3% 56 53 1,044 1,053 825 10,963 10,434 8,789
Second Quartile 88.4% - 95.0% 57 41 3,906 3,734 2,122 27,821 21,220 14,311
Third Quartile 95.0% - 97.7% 57 25 10,005 6,208 2,841 50,927 37,125 19,441
Fourth Quartile 97.7% - 100.0% 56 23 53,504 10,977 4,990 107,613 71,809 24,334
Sources: LiveVol; CRSP; OptionMetrics; ISE Penny Pilot Addition Dates.
[1] The number of unique control option classes in matching with replacement. In matching with replacement, an in-Pilot option class can match with any number of switching option classes.[2] Each in-Pilot option class is matched to an out-of-Pilot option classes based on underlying market capitalization, underlying price, and option volume. Matching is completed with replacement, i.e. an out-of-Pilot option class can match with any number of in-Pilot option classes.[3] Each in-Pilot option class is matched to an out-of-Pilot option classes based on underlying market capitalization, underlying price, and option volume. Matching is completed withoutreplacement, i.e. an out-of-Pilot option class can match with only one in-Pilot option class.
Table 22

Penny Pilot Impact on Quoted and Effective Spreads[1]
February 2016
Matching without Replacement[2] Matching with Replacement[3]
Quoted Spread Effective Spread Quoted Spread Effective Spread
Option Volume Quartile Dollar Percent Dollar Percent Dollar Percent Dollar Percent
(1) (2) (3) (4) (5) (6) (5) (6)
First Quartile -0.014 -0.044 -0.015 -0.030 0.000 -0.055* -0.004 -0.037*(0.730) (0.066) (0.536) (0.061) (0.995) (0.035) (0.852) (0.043)
Second Quartile -0.124* -0.052 -0.075* -0.021 -0.078 -0.015 -0.052 0.002 (0.012) (0.093) (0.016) (0.321) (0.119) (0.605) (0.103) (0.917)
Third Quartile -0.195** -0.074** -0.117** -0.033** -0.096** -0.071** -0.056** -0.032**(0.000) (0.000) (0.000) (0.001) (0.000) (0.000) (0.001) (0.007)
Fourth Quartile -0.200** -0.075** -0.124** -0.031** -0.218 -0.072** -0.150 -0.031**(0.000) (0.000) (0.000) (0.000) (0.084) (0.001) (0.122) (0.005)
Sources: LiveVol; CRSP; OptionMetrics; ISE Penny Pilot Addition Dates.
[1] This table reports results from a paired t-test that estimates the difference in spreads for options in the Penny Pilot versus options outside the Penny Pilot as of February 2016. The variable of interest is theaverage spread. The average spread is calculated by (1) calculating the volume weighted spread for an option series-day and then (2) equally weighting across option series to calculate the average spread for anoption class-day. Canceled trades and trades that were executed during a locked or crossed market are excluded. Options with non-standard settlement types are excluded. Only trades with a condition code in 0, 18,95, and 106 (i.e. trades corresponding to regular trades and intermarket sweep orders) are included. Spreads that are greater than $5 when the price is less than $100 and spreads that are greater than $10 otherwiseare excluded from the average spread calculation. The "Permno" in CRSP is used to identify option classes over time. P-values are reported in parentheses below the coefficient estimates. Coefficient estimates thatare statistically different from zero at the 5% significance level are marked with one asterisk and those that are statistically different from zero at the 1% significance level are marked with two asterisks.[2] Each in-Pilot option class is matched to an out-of-Pilot option classes based on underlying market capitalization, underlying price, and option volume. Matching is completed without replacement, i.e. an out-of-Pilotoption class can match with only one in-Pilot option class.[3] Each in-Pilot option class is matched to an out-of-Pilot option classes based on underlying market capitalization, underlying price, and option volume. Matching is completed with replacement, i.e. an out-of-Pilotoption class can match with any number of in-Pilot option classes. Standard errors are clustered on the out-of-Pilot option class.
Table 23

Table of Contents
Appendix A: Impact of the Penny Pilot on Complex Trades
Appendix B: Impact of the Penny Pilot on Volume, Trade Size, and NBBO Size
Appendix C: Case Study: Impact of Addition to the Penny Pilot on August 2, 2010
Appendix D: Univariate Statistics by Addition Date for Option Classes on CommonStock under Unconstrained Matching
Appendix E: Univariate Statistics by Addition Date for Option Classes on ETFsunder Unconstrained Matching
Appendix F: Univariate Statistics for Option Classes on Common Stock underConstrained Matching
Appendix G: Univariate Statistics for Option Classes on ETFs under ConstrainedMatching

Univariate Statistics Reported by Underlying Market CapitalizationComplex Options: Option Spread Trades
Switching Non-Switching Difference-in-DifferencesMarket CapPercentile N
Average Daily Trade Count
Average Daily Volume Pre Post Change P-Value Pre Post Change P-Value Diff-in-Diff T-Test
Wilcoxon Signed-Rank
Effective Spread ($)
95th + 69 47 1,161 0.071 0.048 -0.023 0.000 0.061 0.062 0.000 0.870 -0.023 0.000 0.000
75th – 94th 123 38 633 0.076 0.057 -0.019 0.000 0.076 0.077 0.001 0.662 -0.020 0.000 0.000
50th – 74th 38 43 686 0.083 0.059 -0.023 0.001 0.078 0.074 -0.004 0.687 -0.020 0.122 0.000
Below 50th 16 13 325 0.084 0.061 -0.023 0.025 0.078 0.083 0.005 0.387 -0.028 0.013 0.018
Quoted Spread ($)
95th + 69 47 1,161 0.224 0.110 -0.114 0.000 0.164 0.166 0.002 0.723 -0.116 0.000 0.000
75th – 94th 123 38 633 0.270 0.144 -0.126 0.000 0.244 0.248 0.004 0.552 -0.129 0.000 0.000
50th – 74th 38 43 686 0.278 0.164 -0.114 0.000 0.247 0.241 -0.006 0.716 -0.108 0.000 0.000
Below 50th 16 13 325 0.259 0.162 -0.097 0.000 0.267 0.343 0.076 0.024 -0.174 0.000 0.000
Source: LiveVol; OptionMetrics; CRSP.
Note: Spread trades are identified by filtering to instances in which two calls or puts were traded in the same second, both of which had a trade condition id designating a spread (35). The best bid, best ask, and trade price for the trade were calculated by taking the difference between the best bid from leg one and the best ask from leg two, the difference between the best ask from leg one and the best bid from leg two, and the difference between the trade price across the two legs. Each switching option class is matched with a non-switching option class based on underlying market capitalization and option volume. Matched pairs of switching and non-switching option classes are categorized into market capitalization percentiles using the underlying market capitalization of the switching option class at the end of the month prior to the addition date. Percentiles are defined using the stocks listed on the NYSE. The average daily volume and average daily trade count are calculated on a per symbol basis and are calculated using the month prior to the month the option class was added to the Pilot (the "pre" month).
Appendix A

Univariate Statistics Reported by Option Class VolumeComplex Options: Option Spread Trades
Switching Non-Switching Difference-in-Differences
Option VolumePercentile N
Average Daily Trade Count
Average Daily Volume Pre Post Change P-Value Pre Post Change P-Value Diff-in-Diff T-Test
Wilcoxon Signed-Rank
Effective Spread ($)
98th+ 49 111 1,964 0.083 0.058 -0.024 0.000 0.070 0.061 -0.008 0.002 -0.016 0.000 0.000
95th – 97th 77 36 853 0.071 0.048 -0.023 0.000 0.058 0.060 0.001 0.437 -0.024 0.000 0.000
90th – 94th 73 17 295 0.076 0.053 -0.023 0.000 0.073 0.076 0.003 0.108 -0.026 0.000 0.000
Below 90th 47 6 125 0.079 0.066 -0.013 0.006 0.098 0.101 0.003 0.703 -0.016 0.138 0.001
Quoted Spread ($)
98th+ 49 111 1,964 0.258 0.143 -0.115 0.000 0.177 0.166 -0.011 0.083 -0.104 0.000 0.000
95th – 97th 77 36 853 0.246 0.123 -0.123 0.000 0.173 0.171 -0.002 0.685 -0.121 0.000 0.000
90th – 94th 73 17 295 0.256 0.142 -0.114 0.000 0.240 0.257 0.017 0.012 -0.130 0.000 0.000
Below 90th 47 6 125 0.279 0.155 -0.124 0.000 0.330 0.353 0.023 0.271 -0.147 0.000 0.000
Source: LiveVol; OptionMetrics; CRSP.
Note: Spread trades are identified by filtering to instances in which two calls or puts were traded in the same second, both of which had a trade condition id designating a spread (35). The best bid, best ask, and trade price for the trade were calculated by taking the difference between the best bid from leg one and the best ask from leg two, the difference between the best ask from leg one and the best bid from leg two, and the difference between the trade price across the two legs. Each switching option class is matched with a non-switching option class based on underlying market capitalization and option volume. Matched pairs of switching and non-switching option classes are categorized into option class volume percentiles using the option class volume of the switching option class during the month prior to the addition date. Percentiles are defined using the universe of option classes on common stock in the LiveVol data. The average daily volume and average daily trade count are calculated on a per symbol basis and are calculated using the month prior to the month the option class was added to the Pilot (the "pre" month).
Appendix A

Univariate Statistics Reported by Penny Pilot Addition Date PeriodsComplex Options: Option Spread Trades
Average Trade Size (Contracts)Switching Non-Switching Difference-in-Differences
NAverage Daily Trade Count
Average Daily Volume Pre Post Change P-Value Pre Post Change P-Value Diff-in-Diff T-Test
Wilcoxon Signed-Rank
Addition Date Periods
All 246 39 770 31 26 -5.577 0.037 29 32 2.466 0.538 -8.043 0.084 0.202
2007 – 2009 85 46 1,173 37 27 -9.943 0.011 38 34 -3.619 0.542 -6.324 0.379 0.265
2010 – 2011 145 19 400 30 26 -3.238 0.406 25 32 6.342 0.277 -9.580 0.152 0.564
2012 – 2015 16 184 1,979 18 15 -3.579 0.308 19 19 -0.330 0.926 -3.249 0.504 0.433
Market Capitalization Percentiles
95th + 69 47 1,161 32 27 -4.096 0.068 32 35 3.125 0.643 -7.221 0.324 0.062
75th – 94th 123 38 633 33 25 -7.710 0.112 28 28 -0.581 0.899 -7.129 0.280 0.567
50th – 74th 38 43 686 26 23 -3.076 0.602 32 44 12.199 0.490 -15.275 0.365 0.983
Below 50th 16 13 325 28 26 -1.509 0.775 21 21 -0.066 0.982 -1.443 0.782 0.744
Option Volume Percentiles
98th+ 49 111 1,964 32 28 -4.202 0.086 37 32 -5.025 0.172 0.823 0.864 0.495
95th – 97th 77 36 853 39 26 -13.506 0.016 33 34 0.857 0.898 -14.363 0.093 0.174
90th – 94th 73 17 295 27 27 -0.024 0.997 24 25 0.879 0.880 -0.903 0.913 0.665
Below 90th 47 6 125 25 22 -2.648 0.567 24 39 15.377 0.309 -18.024 0.218 0.950
Source: LiveVol; OptionMetrics; CRSP.
Note: Spread trades are identified by filtering to instances in which two calls or two puts were traded in the same second, both of which had a trade condition id designating a spread (35). Each switching option class is matched with a non-switching option class based on underlying market capitalization and option volume. Pilot addition dates 1/26/07, 9/28/07, 3/28/08, and 11/2/09 are included in the 2007 –2009 addition date period; Pilot addition dates 2/1/10, 5/3/10, 8/2/10, 1/4/11, and 7/6/11 are included in the 2010 – 2011 period; and Pilot addition dates 1/4/12, 7/3/12, 1/3/13, 7/3/13, 1/3/14, 7/3/14, 1/5/15, and 7/6/15 are included in the 2012 – 2015 period. Matched pairs of switching and non-switching option classes are categorized into market capitalization percentiles using the underlying market capitalization of the switching option class at the end of the month prior to the addition date. Market capitalization percentiles are defined using the stocks listed on the NYSE. Matched pairs of switching and non-switching option classes are categorized into option class volume percentiles using the option class volume of the switching option class during the month prior to the addition date. Option class percentiles are defined using the universe of option classes on common stock in the LiveVol data. The average daily volume and average daily trade count are calculated on a per symbol basis and are calculated using the month prior to the month the option class was added to the Pilot (the "pre" month).
Appendix A

Univariate Statistics Reported by Penny Pilot Addition Date PeriodsComplex Options: Option Spread TradesLog Average Daily Volume (Contracts)
Switching Non-Switching Difference-in-Differences
NAverage Daily Trade Count
Average Daily Volume Pre Post Change P-Value Pre Post Change P-Value Diff-in-Diff T-Test
Wilcoxon Signed-Rank
Addition Date Periods
All 246 39 770 5.94 5.87 -0.07 0.312 5.83 5.62 -0.21 0.004 0.14 0.136 0.056
2007 – 2009 85 46 1,173 6.61 6.51 -0.11 0.303 6.64 6.43 -0.21 0.038 0.10 0.462 0.172
2010 – 2011 145 19 400 5.44 5.39 -0.06 0.555 5.24 5.00 -0.25 0.023 0.19 0.164 0.130
2012 – 2015 16 184 1,979 6.92 6.93 0.01 0.975 6.89 6.99 0.10 0.536 -0.09 0.737 0.900
Market Capitalization Percentiles
95th + 69 47 1,161 6.50 6.37 -0.12 0.091 6.49 6.48 -0.02 0.896 -0.11 0.421 0.617
75th – 94th 123 38 633 5.77 5.81 0.04 0.738 5.63 5.46 -0.17 0.078 0.21 0.123 0.065
50th – 74th 38 43 686 5.80 5.61 -0.19 0.382 5.70 5.28 -0.41 0.062 0.22 0.484 0.198
Below 50th 16 13 325 5.20 4.85 -0.35 0.154 4.83 3.95 -0.89 0.045 0.54 0.278 0.404
Option Volume Percentiles
98th+ 49 111 1,964 7.21 7.17 -0.03 0.743 7.21 7.06 -0.15 0.168 0.12 0.419 0.096
95th – 97th 77 36 853 6.48 6.18 -0.30 0.003 6.31 6.02 -0.29 0.035 -0.01 0.934 0.982
90th – 94th 73 17 295 5.49 5.50 0.00 0.979 5.48 5.37 -0.11 0.400 0.11 0.540 0.457
Below 90th 47 6 125 4.44 4.60 0.16 0.326 4.17 3.86 -0.31 0.161 0.47 0.103 0.068
Source: LiveVol; OptionMetrics; CRSP.
Note: Spread trades are identified by filtering to instances in which two calls or two puts were traded in the same second, both of which had a trade condition id designating a spread (35). Each switching option class is matched with a non-switching option class based on underlying market capitalization and option volume. Pilot addition dates 1/26/07, 9/28/07, 3/28/08, and 11/2/09 are included in the 2007 –2009 addition date period; Pilot addition dates 2/1/10, 5/3/10, 8/2/10, 1/4/11, and 7/6/11 are included in the 2010 – 2011 period; and Pilot addition dates 1/4/12, 7/3/12, 1/3/13, 7/3/13, 1/3/14, 7/3/14, 1/5/15, and 7/6/15 are included in the 2012 – 2015 period. Matched pairs of switching and non-switching option classes are categorized into market capitalization percentiles using the underlying market capitalization of the switching option class at the end of the month prior to the addition date. Market capitalization percentiles are defined using the stocks listed on the NYSE. Matched pairs of switching and non-switching option classes are categorized into option class volume percentiles using the option class volume of the switching option class during the month prior to the addition date. Option class percentiles are defined using the universe of option classes on common stock in the LiveVol data. The average daily volume and average daily trade count are calculated on a per symbol basis and are calculated using the month prior to the month the option class was added to the Pilot (the "pre" month).
Appendix A

Univariate Statistics Reported by Underlying Market CapitalizationComplex Options: Option Straddle Trades
Switching Non-Switching Difference-in-Differences
Market CapPercentile N
Average Daily Trade Count
Average Daily Volume Pre Post Change P-Value Pre Post Change P-Value Diff-in-Diff T-Test
Wilcoxon Signed-Rank
Effective Spread ($)
95th + 69 9 429 0.090 0.061 -0.029 0.000 0.084 0.075 -0.009 0.041 -0.020 0.000 0.000
75th – 94th 123 7 169 0.088 0.070 -0.017 0.000 0.095 0.096 0.001 0.791 -0.019 0.001 0.000
50th – 74th 36 5 111 0.090 0.063 -0.027 0.000 0.072 0.079 0.007 0.367 -0.034 0.000 0.000
Below 50th 14 6 113 0.088 0.063 -0.025 0.028 0.080 0.080 0.000 0.985 -0.026 0.246 0.326
Effective Spread (%)
95th + 69 9 429 0.032 0.022 -0.010 0.000 0.028 0.028 0.000 0.931 -0.010 0.000 0.000
75th – 94th 123 7 169 0.034 0.026 -0.009 0.000 0.035 0.039 0.004 0.240 -0.013 0.001 0.000
50th – 74th 36 5 111 0.048 0.041 -0.006 0.452 0.041 0.055 0.013 0.121 -0.020 0.125 0.009
Below 50th 14 6 113 0.070 0.038 -0.031 0.027 0.049 0.107 0.058 0.249 -0.089 0.092 0.030
Quoted Spread ($)
95th + 69 9 429 0.233 0.112 -0.121 0.000 0.187 0.170 -0.017 0.115 -0.104 0.000 0.000
75th – 94th 123 7 169 0.259 0.138 -0.121 0.000 0.239 0.251 0.012 0.118 -0.132 0.000 0.000
50th – 74th 36 5 111 0.267 0.148 -0.120 0.000 0.215 0.220 0.005 0.781 -0.125 0.000 0.000
Below 50th 14 6 113 0.236 0.131 -0.105 0.000 0.224 0.257 0.033 0.092 -0.138 0.000 0.000
Quoted Spread (%)
95th + 69 9 429 0.092 0.036 -0.057 0.000 0.056 0.057 0.001 0.788 -0.058 0.000 0.000
75th – 94th 123 7 169 0.107 0.044 -0.063 0.000 0.087 0.100 0.014 0.041 -0.077 0.000 0.000
50th – 74th 36 5 111 0.149 0.123 -0.026 0.634 0.121 0.159 0.038 0.089 -0.064 0.295 0.000
Below 50th 14 6 113 0.172 0.075 -0.097 0.000 0.127 0.221 0.093 0.122 -0.190 0.006 0.002
Source: LiveVol; OptionMetrics; CRSP.
Note: Straddle trades are identified by filtering to instances in which a call and a put were traded in the same second, both of which had a trade condition id designating a straddle (36). The best bid, best ask, and trade price for the trade were calculated by summing the best bid, best ask, and trade price across the two legs. Each switching option class is matched with a non-switching option class based on underlying market capitalization and option volume. Matched pairs of switching and non-switching option classes are categorized into market capitalization percentiles using the underlying market capitalization of the switching option class at the end of the month prior to the addition date. Market capitalization percentiles are defined using the stocks listed on the NYSE. The average daily volume and average daily trade count are calculated on a per symbol basis and are calculated using the month prior to the month the option class was added to the Pilot (the "pre" month).
Appendix A

Univariate Statistics Reported by Option Class VolumeComplex Options: Option Straddle Trades
Switching Non-Switching Difference-in-Differences
Option VolumePercentile N
Average Daily Trade Count
Average Daily Volume Pre Post Change P-Value Pre Post Change P-Value Diff-in-Diff T-Test
Wilcoxon Signed-Rank
Effective Spread ($)
98th+ 49 12 506 0.108 0.072 -0.036 0.000 0.098 0.079 -0.019 0.004 -0.017 0.011 0.003
95th – 97th 77 8 246 0.081 0.057 -0.023 0.000 0.073 0.073 -0.001 0.769 -0.023 0.000 0.000
90th – 94th 72 6 134 0.088 0.074 -0.014 0.012 0.088 0.096 0.007 0.236 -0.022 0.009 0.000
Below 90th 44 3 59 0.084 0.064 -0.020 0.000 0.099 0.104 0.005 0.542 -0.025 0.011 0.013
Effective Spread (%)
98th+ 49 12 506 0.037 0.026 -0.011 0.000 0.032 0.032 0.000 0.984 -0.011 0.002 0.001
95th – 97th 77 8 246 0.035 0.026 -0.009 0.000 0.033 0.050 0.017 0.067 -0.026 0.009 0.000
90th – 94th 72 6 134 0.037 0.026 -0.011 0.001 0.034 0.035 0.002 0.732 -0.013 0.031 0.022
Below 90th 44 3 59 0.043 0.034 -0.009 0.184 0.042 0.050 0.008 0.277 -0.017 0.110 0.007
Quoted Spread ($)
98th+ 49 12 506 0.261 0.138 -0.123 0.000 0.203 0.165 -0.038 0.007 -0.085 0.000 0.000
95th – 97th 77 8 246 0.245 0.117 -0.128 0.000 0.173 0.173 0.000 0.987 -0.128 0.000 0.000
90th – 94th 72 6 134 0.252 0.142 -0.111 0.000 0.234 0.263 0.029 0.006 -0.139 0.000 0.000
Below 90th 44 3 59 0.251 0.134 -0.116 0.000 0.298 0.315 0.017 0.338 -0.133 0.000 0.000
Quoted Spread (%)
98th+ 49 12 506 0.100 0.040 -0.060 0.000 0.060 0.063 0.003 0.539 -0.064 0.000 0.000
95th – 97th 77 8 246 0.109 0.045 -0.064 0.000 0.072 0.107 0.035 0.017 -0.099 0.000 0.000
90th – 94th 72 6 134 0.115 0.048 -0.067 0.000 0.085 0.088 0.003 0.724 -0.070 0.000 0.000
Below 90th 44 3 59 0.131 0.101 -0.030 0.502 0.136 0.167 0.031 0.030 -0.061 0.213 0.000
Source: LiveVol; OptionMetrics; CRSP.
Note: Straddle trades are identified by filtering to instances in which a call and a put were traded in the same second, both of which had a trade condition id designating a straddle (36). The best bid, best ask, and trade price for the trade were calculated by summing the best bid, best ask, and trade price across the two legs. Each switching option class is matched with a non-switching option class based on underlying market capitalization and option volume. Matched pairs of switching and non-switching option classes are categorized into option class volume percentiles using the option class volume of the switching option class during the month prior to the addition date. Option class percentiles are defined using the universe of option classes on common stock in the LiveVol data. The average daily volume and average daily trade count are calculated on a per symbol basis and are calculated using the month prior to the month the option class was added to the Pilot (the "pre" month).
Appendix A

Univariate Statistics Reported by Penny Pilot Addition Date PeriodsComplex Options: Option Straddle Trades
Average Trade Size (Contracts)Switching Non-Switching Difference-in-Differences
NAverage Daily Trade Count
Average Daily Volume Pre Post Change P-Value Pre Post Change P-Value Diff-in-Diff T-Test
Wilcoxon Signed-Rank
Addition Date Periods
All 242 7 231 36 30 -5.745 0.060 34 32 -2.087 0.452 -3.657 0.396 0.038
2007 – 2009 85 9 406 53 42 -11.011 0.130 54 51 -3.508 0.647 -7.503 0.503 0.240
2010 – 2011 141 6 138 27 24 -2.841 0.324 24 22 -1.530 0.205 -1.312 0.668 0.103
2012 – 2015 16 10 123 18 15 -3.352 0.206 15 16 0.548 0.885 -3.900 0.403 0.528
Market Capitalization Percentiles
95th + 69 9 429 56 42 -14.550 0.089 54 48 -5.746 0.515 -8.803 0.499 0.119
75th – 94th 123 7 169 29 27 -1.852 0.601 27 27 -0.282 0.898 -1.570 0.711 0.162
50th – 74th 36 5 111 24 22 -2.241 0.378 21 23 2.485 0.339 -4.726 0.205 0.271
Below 50th 14 6 113 22 16 -5.554 0.066 29 17 -11.670 0.003 6.116 0.201 0.268
Option Volume Percentiles
98th+ 49 12 506 59 45 -13.071 0.278 64 54 -10.099 0.427 -2.973 0.873 0.743
95th – 97th 77 8 246 34 29 -5.083 0.076 33 35 1.401 0.628 -6.484 0.113 0.047
90th – 94th 72 6 134 27 20 -7.349 0.005 23 20 -2.881 0.053 -4.468 0.156 0.193
Below 90th 44 3 59 26 30 3.882 0.625 20 22 2.029 0.375 1.853 0.824 0.147
Source: LiveVol; OptionMetrics; CRSP.
Note: Straddle trades are identified by filtering to instances in which a call and a put were traded in the same second, both of which had a trade condition id designating a straddle (36). Each switching option class is matched with a non-switching option class based on underlying market capitalization and option volume. Pilot addition dates 1/26/07, 9/28/07, 3/28/08, and 11/2/09 are included in the 2007 –2009 addition date period; Pilot addition dates 2/1/10, 5/3/10, 8/2/10, 1/4/11, and 7/6/11 are included in the 2010 – 2011 period; and Pilot addition dates 1/4/12, 7/3/12, 1/3/13, 7/3/13, 1/3/14, 7/3/14, 1/5/15, and 7/6/15 are included in the 2012 – 2015 period. Matched pairs of switching and non-switching option classes are categorized into market capitalization percentiles using the underlying market capitalization of the switching option class at the end of the month prior to the addition date. Market capitalization percentiles are defined using the stocks listed on the NYSE. Matched pairs of switching and non-switching option classes are categorized into option class volume percentiles using the option class volume of the switching option class during the month prior to the addition date. Option class percentiles are defined using the universe of option classes on common stock in the LiveVol data. The average daily volume and average daily trade count are calculated on a per symbol basis and are calculated using the month prior to the month the option class was added to the Pilot (the "pre" month).
Appendix A

Univariate Statistics Reported by Penny Pilot Addition Date PeriodsComplex Options: Option Straddle Trades
Log Average Daily Volume (Contracts)Switching Non-Switching Difference-in-Differences
NAverage Daily Trade Count
Average Daily Volume Pre Post Change P-Value Pre Post Change P-Value Diff-in-Diff T-Test
Wilcoxon Signed-Rank
Addition Date Periods
All 242 7 231 4.83 4.67 -0.16 0.025 4.87 4.48 -0.39 0.000 0.22 0.041 0.044
2007 – 2009 85 9 406 5.51 5.43 -0.08 0.459 5.62 5.39 -0.23 0.032 0.15 0.370 0.378
2010 – 2011 141 6 138 4.51 4.26 -0.25 0.007 4.49 3.93 -0.56 0.000 0.31 0.048 0.032
2012 – 2015 16 10 123 4.08 4.34 0.25 0.498 4.24 4.59 0.36 0.233 -0.10 0.784 0.706
Market Capitalization Percentiles
95th + 69 9 429 5.59 5.42 -0.17 0.121 5.71 5.41 -0.31 0.009 0.14 0.439 0.544
75th – 94th 123 7 169 4.70 4.53 -0.16 0.131 4.64 4.32 -0.33 0.010 0.17 0.311 0.246
50th – 74th 36 5 111 4.17 4.18 0.01 0.956 4.19 4.08 -0.11 0.491 0.12 0.611 0.468
Below 50th 14 6 113 4.05 3.50 -0.55 0.183 4.39 2.40 -1.99 0.000 1.44 0.032 0.058
Option Volume Percentiles
98th+ 49 12 506 5.71 5.75 0.03 0.825 5.93 5.78 -0.15 0.259 0.18 0.418 0.489
95th – 97th 77 8 246 5.22 4.94 -0.28 0.009 5.17 4.83 -0.34 0.012 0.06 0.722 0.958
90th – 94th 72 6 134 4.50 4.31 -0.19 0.180 4.58 4.06 -0.52 0.005 0.33 0.134 0.102
Below 90th 44 3 59 3.72 3.61 -0.11 0.576 3.63 3.12 -0.51 0.021 0.39 0.221 0.134
Source: LiveVol; OptionMetrics; CRSP.
Note: Straddle trades are identified by filtering to instances in which a call and a put were traded in the same second, both of which had a trade condition id designating a straddle (36). Each switching option class is matched with a non-switching option class based on underlying market capitalization and option volume. Pilot addition dates 1/26/07, 9/28/07, 3/28/08, and 11/2/09 are included in the 2007 –2009 addition date period; Pilot addition dates 2/1/10, 5/3/10, 8/2/10, 1/4/11, and 7/6/11 are included in the 2010 – 2011 period; and Pilot addition dates 1/4/12, 7/3/12, 1/3/13, 7/3/13, 1/3/14, 7/3/14, 1/5/15, and 7/6/15 are included in the 2012 – 2015 period. Matched pairs of switching and non-switching option classes are categorized into market capitalization percentiles using the underlying market capitalization of the switching option class at the end of the month prior to the addition date. Market capitalization percentiles are defined using the stocks listed on the NYSE. Matched pairs of switching and non-switching option classes are categorized into option class volume percentiles using the option class volume of the switching option class during the month prior to the addition date. Option class percentiles are defined using the universe of option classes on common stock in the LiveVol data. The average daily volume and average daily trade count are calculated on a per symbol basis and are calculated using the month prior to the month the option class was added to the Pilot (the "pre" month).
Appendix A

Univariate Statistics Reported by Penny Pilot Addition Date PeriodsUnconstrained Matching
Average Trade Size (Contracts)Switching Non-Switching Difference-in-Differences
NAverage Daily Trade Count
Average Daily Volume Pre Post Change P-Value Pre Post Change P-Value Diff-in-Diff T-Test
Wilcoxon Signed-Rank
Addition Date Periods
All 247 912 16,940 21 16 -5.089 0.000 20 19 -0.757 0.031 -4.332 0.000 0.000
2007 – 2009 85 1,363 30,563 27 20 -6.429 0.000 24 24 -0.371 0.557 -6.057 0.000 0.000
2010 – 2011 146 443 7,181 19 14 -4.415 0.000 18 17 -0.870 0.055 -3.545 0.000 0.000
2012 – 2015 16 2,795 33,618 15 11 -4.120 0.031 16 14 -1.775 0.086 -2.345 0.308 0.323
Market Capitalization Percentiles
95th + 69 1,279 30,296 26 19 -6.858 0.000 22 22 -0.218 0.699 -6.640 0.000 0.000
75th – 94th 123 811 12,444 20 15 -4.589 0.000 19 17 -1.283 0.010 -3.307 0.000 0.000
50th – 74th 38 780 11,117 19 15 -3.386 0.000 20 18 -1.410 0.073 -1.976 0.087 0.059
Below 50th 17 449 8,279 20 14 -5.326 0.004 19 22 2.322 0.299 -7.647 0.014 0.023
Option Volume Percentiles
98th+ 49 2,461 48,820 28 21 -6.752 0.000 25 25 -0.800 0.342 -5.951 0.000 0.000
95th – 97th 77 869 15,309 21 16 -5.214 0.000 21 21 -0.386 0.591 -4.828 0.000 0.000
90th – 94th 73 411 6,691 20 15 -4.956 0.000 16 15 -0.757 0.089 -4.199 0.000 0.000
Below 90th 48 162 2,600 17 14 -3.391 0.000 18 17 -1.308 0.139 -2.083 0.033 0.041
Source: LiveVol; OptionMetrics; CRSP.
Note: Each switching option class is matched with a non-switching option class based on underlying market capitalization and option volume. Pilot addition dates 1/26/07, 9/28/07, 3/28/08, and 11/2/09 are included in the 2007 – 2009 addition date period; Pilot addition dates 2/1/10, 5/3/10, 8/2/10, 1/4/11, and 7/6/11 are included in the 2010 – 2011 period; and Pilot addition dates 1/4/12, 7/3/12, 1/3/13, 7/3/13, 1/3/14, 7/3/14, 1/5/15, and 7/6/15 are included in the 2012 – 2015 period. Matched pairs of switching and non-switching option classes are categorized into market capitalization percentiles using the underlying market capitalization of the switching option class at the end of the month prior to the addition date. Market capitalization percentiles are defined using the stocks listed on the NYSE. Matched pairs of switching and non-switching option classes are categorized into option class volume percentiles using the option class volume of the switching option class during the month prior to the addition date. Option class percentiles are defined using the universe of option classes on common stock in the LiveVol data. The average daily volume and average daily trade count are calculated on a per symbol basis and are calculated using the month prior to the month the option class was added to the Pilot (the "pre" month).
Appendix B

Penny Pilot Regression Results[1]
Impact on Average Trade SizeOption Classes on Common Stock
Full Sample[2] Unconstrained Matching[3]
Parameter 12/06 – 2/16[4] 12/06 – 12/09[5] 1/10 – 8/11[6] 12/11 – 2/16[7] 12/06 – 2/16[4] 12/06 – 12/09[5] 1/10 – 8/11[6] 12/11 – 2/16[7]
(1) (2) (3) (4) (5) (6) (7) (8)
Post-Switch Indicator[8] -7.521** -11.895** -4.556** -3.873* -6.305** -8.368** -5.682** -2.294 (0.000) (0.000) (0.000) (0.032) (0.000) (0.000) (0.000) (0.092)
Equity Volatility[9] -37.177** -52.963** -53.406** -40.350** -102.146** -163.175** -81.018** -84.556 (0.000) (0.000) (0.000) (0.000) (0.000) (0.000) (0.000) (0.166)
Log of Option Volume[10] 5.524** 6.906** 6.246** 5.552** 10.475** 15.720** 8.959** 10.372**(0.000) (0.000) (0.000) (0.000) (0.000) (0.000) (0.000) (0.000)
Log of Underlying Volume[11] -3.425** -4.269** -3.335** -3.502** -6.990** -10.934** -5.964** -6.307**(0.000) (0.000) (0.000) (0.000) (0.000) (0.000) (0.000) (0.000)
Number of Class/Days 1,331,188 292,671 411,698 626,770 21,025 7,368 12,369 1,288
Number of Classes 3,833 2,625 2,358 3,078 494 170 292 32
Sources: LiveVol; CRSP; OptionMetrics; ISE Penny Pilot Addition Dates.
[1] This table reports results from a panel regression estimating the effects of switching to trading in pennies on average trade size in the options market. The sample includes data for all options on common stock that traded in the calendar month before and calendar month after the Penny Pilot addition dates. The dependent variable is the average trade size. The average trade size is calculated as the total volume divided by the total trade count for a given option class-day. Canceled trades are excluded. Options with non-standard settlement types are excluded. Only trades with a condition code in 0, 18, 95, and 106 are included. Condition codes 0, 18, 95, and 106 correspond to regular trades and intermarket sweep orders. If the underlying stocks traded below $1 or above $1,000 on any day for which an average trade size is calculated, the entire option class is removed from the sample. The "Permno" in CRSP is used to identify option classes over time. P-values are reported in parentheses below the coefficient estimates. Coefficient estimates that are statistically different from zero at the 5% significance level are marked with one asterisk and those that are statistically different from zero at the 1% significance level are marked with two asterisks.[2] All option classes on common stock for which LiveVol has data are included. Date and option class fixed effects are used. Standard errors are estimated by clustering on option class and date. [3] Each switching option class is matched with a non-switching option class based on underlying market capitalization and option volume. [4] The model is estimated over the time period from December 1, 2006 to February 29, 2016. [5] Pilot addition dates 1/26/07, 9/28/07, 3/28/08, and 11/2/09 are included in the December 2006 – December 2009 period[6] Pilot addition dates 1/5/10, 2/1/10, 5/3/10, 8/2/10, 1/4/11, and 7/6/11 are included in the January 2010 – August 2011 period. [7] Pilot addition dates 1/4/12, 7/3/12, 1/3/13, 7/3/13, 1/3/14, 7/3/14, 1/5/15, and 7/6/15 are included in the December 2011 – February 2016 period. [8] An indicator variable that equals one in the post-switch period and zero otherwise. Note that under unconstrained matching, a switching option class may match with an option class that is already in the pilot, in which case the option class that is already in the pilot, acting as the control option class, has a value of zero in the pre-switch and post-switch period.[9] The underlying stock volatility as measured by the high price minus the low price divided by the closing price.[10] The natural log of the option class volume. The option class volume excludes canceled trades and only includes trades with a condition code in 0, 18, 95, and 106.[11] The natural log of the volume for the underlying stock.
Appendix B
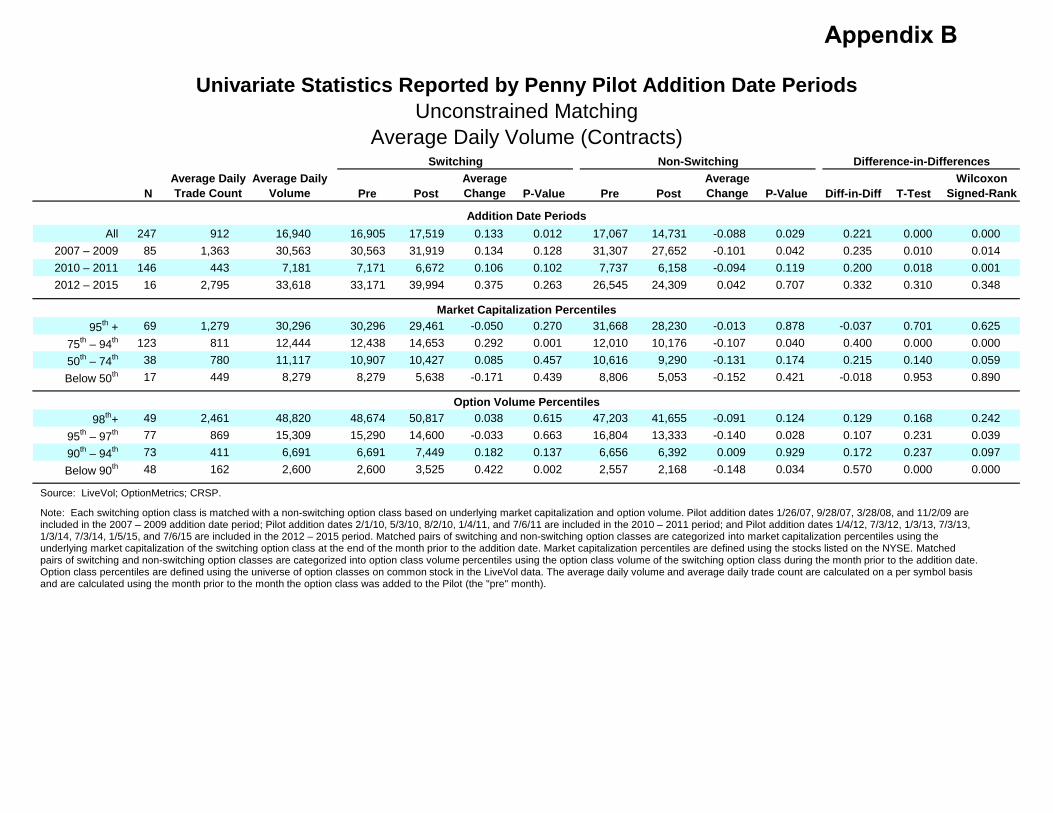
Univariate Statistics Reported by Penny Pilot Addition Date PeriodsUnconstrained Matching
Average Daily Volume (Contracts)Switching Non-Switching Difference-in-Differences
NAverage Daily Trade Count
Average Daily Volume Pre Post
Average Change P-Value Pre Post
Average Change P-Value Diff-in-Diff T-Test
Wilcoxon Signed-Rank
Addition Date Periods
All 247 912 16,940 16,905 17,519 0.133 0.012 17,067 14,731 -0.088 0.029 0.221 0.000 0.000
2007 – 2009 85 1,363 30,563 30,563 31,919 0.134 0.128 31,307 27,652 -0.101 0.042 0.235 0.010 0.014
2010 – 2011 146 443 7,181 7,171 6,672 0.106 0.102 7,737 6,158 -0.094 0.119 0.200 0.018 0.001
2012 – 2015 16 2,795 33,618 33,171 39,994 0.375 0.263 26,545 24,309 0.042 0.707 0.332 0.310 0.348
Market Capitalization Percentiles
95th + 69 1,279 30,296 30,296 29,461 -0.050 0.270 31,668 28,230 -0.013 0.878 -0.037 0.701 0.625
75th – 94th 123 811 12,444 12,438 14,653 0.292 0.001 12,010 10,176 -0.107 0.040 0.400 0.000 0.000
50th – 74th 38 780 11,117 10,907 10,427 0.085 0.457 10,616 9,290 -0.131 0.174 0.215 0.140 0.059
Below 50th 17 449 8,279 8,279 5,638 -0.171 0.439 8,806 5,053 -0.152 0.421 -0.018 0.953 0.890
Option Volume Percentiles
98th+ 49 2,461 48,820 48,674 50,817 0.038 0.615 47,203 41,655 -0.091 0.124 0.129 0.168 0.242
95th – 97th 77 869 15,309 15,290 14,600 -0.033 0.663 16,804 13,333 -0.140 0.028 0.107 0.231 0.039
90th – 94th 73 411 6,691 6,691 7,449 0.182 0.137 6,656 6,392 0.009 0.929 0.172 0.237 0.097
Below 90th 48 162 2,600 2,600 3,525 0.422 0.002 2,557 2,168 -0.148 0.034 0.570 0.000 0.000
Source: LiveVol; OptionMetrics; CRSP.
Note: Each switching option class is matched with a non-switching option class based on underlying market capitalization and option volume. Pilot addition dates 1/26/07, 9/28/07, 3/28/08, and 11/2/09 are included in the 2007 – 2009 addition date period; Pilot addition dates 2/1/10, 5/3/10, 8/2/10, 1/4/11, and 7/6/11 are included in the 2010 – 2011 period; and Pilot addition dates 1/4/12, 7/3/12, 1/3/13, 7/3/13, 1/3/14, 7/3/14, 1/5/15, and 7/6/15 are included in the 2012 – 2015 period. Matched pairs of switching and non-switching option classes are categorized into market capitalization percentiles using the underlying market capitalization of the switching option class at the end of the month prior to the addition date. Market capitalization percentiles are defined using the stocks listed on the NYSE. Matched pairs of switching and non-switching option classes are categorized into option class volume percentiles using the option class volume of the switching option class during the month prior to the addition date. Option class percentiles are defined using the universe of option classes on common stock in the LiveVol data. The average daily volume and average daily trade count are calculated on a per symbol basis and are calculated using the month prior to the month the option class was added to the Pilot (the "pre" month).
Appendix B

Univariate Statistics Reported by Penny Pilot Addition Date PeriodsUnconstrained MatchingOption Classes on ETFs
Average Daily Volume (Contracts)Switching Non-Switching Difference-in-Differences
NAverage Daily Trade Count
Average Daily Volume Pre Post
Average Change P-Value Pre Post
Average Change P-Value Diff-in-Diff T-Test
Wilcoxon Signed-Rank
Addition Date Periods
All 53 1,149 39,965 39,892 42,336 0.043 0.498 67,208 59,770 -0.175 0.004 0.219 0.019 0.018
2007 – 2009 27 1,889 70,848 70,848 75,242 -0.032 0.717 124,798 110,451 -0.193 0.016 0.161 0.183 0.168
2010 – 2011 19 239 5,950 5,950 6,113 0.098 0.394 6,086 4,990 -0.241 0.005 0.339 0.061 0.087
2012 – 2015 7 766 13,169 12,617 13,736 0.186 0.302 10,975 12,972 0.072 0.788 0.114 0.647 0.578
Market Capitalization Percentiles
75th+ 14 2,213 103,814 103,612 121,414 0.169 0.167 217,704 199,024 -0.070 0.555 0.239 0.153 0.135
50th – 74th 17 947 24,294 24,294 19,023 -0.022 0.854 20,232 12,777 -0.295 0.009 0.274 0.123 0.174
Below 50th 22 628 11,443 11,396 10,029 0.013 0.898 7,736 7,466 -0.150 0.106 0.163 0.280 0.184
Option Volume Percentiles
95th+ 15 2,350 111,135 110,877 123,701 0.125 0.313 193,553 179,344 -0.081 0.503 0.206 0.214 0.252
90th – 94th 19 1,118 18,709 18,709 14,227 -0.164 0.084 30,190 22,165 -0.095 0.348 -0.068 0.552 0.891
Below 90th 19 233 5,034 5,034 6,210 0.186 0.106 4,478 2,974 -0.330 0.001 0.515 0.006 0.008
Source: LiveVol; OptionMetrics; CRSP.
Note: Each switching option class is matched with a non-switching option class based on underlying market capitalization and option volume. Pilot addition dates 1/26/07, 9/28/07, 3/28/08, and 11/2/09 are included in the 2007 – 2009 addition date period; Pilot addition dates 2/1/10, 5/3/10, 8/2/10, 1/4/11, and 7/6/11 are included in the 2010 – 2011 period; and Pilot addition dates 1/4/12, 7/3/12, 1/3/13, 7/3/13, 1/3/14, 7/3/14, 1/5/15, and 7/6/15 are included in the 2012 – 2015 period. Matched pairs of switching and non-switching option classes are categorized into market capitalization percentiles using the underlying market capitalization of the switching option class at the end of the month prior to the addition date. Market capitalization percentiles are defined using the stocks listed on the NYSE. Matched pairs of switching and non-switching option classes are categorized into option class volume percentiles using the option class volume of the switching option class during the month prior to the addition date. Option class percentiles are defined using the universe of option classes on common stock in the LiveVol data. The average daily volume and average daily trade count are calculated on a per symbol basis and are calculated using the month prior to the month the option class was added to the Pilot (the "pre" month).
Appendix B

Univariate Statistics Reported by Penny Pilot Addition Date PeriodsUnconstrained MatchingNBBO Size (Contracts)
Switching Non-Switching Difference-in-Differences
NAverage Daily Trade Count
Average Daily Volume Pre Post Change P-Value Pre Post Change P-Value Diff-in-Diff T-Test
Wilcoxon Signed-Rank
Addition Date Periods
All 247 912 16,940 4,516 1,021 -3495 0.000 2,297 2,417 120 0.045 -3616 0.000 0.000
2007 – 2009 85 1,363 30,563 6,635 1,612 -5023 0.000 3,497 3,798 301 0.021 -5324 0.000 0.000
2010 – 2011 146 443 7,181 3,333 678 -2655 0.000 1,649 1,677 29 0.645 -2683 0.000 0.000
2012 – 2015 16 2,795 33,618 4,061 1,014 -3047 0.005 1,829 1,830 1 0.998 -3048 0.001 0.000
Market Capitalization Percentiles
95th + 69 1,279 30,296 6,475 1,579 -4896 0.000 2,980 3,260 280 0.031 -5176 0.000 0.000
75th – 94th 123 811 12,444 4,061 864 -3197 0.000 2,074 2,212 137 0.067 -3335 0.000 0.000
50th – 74th 38 780 11,117 3,375 703 -2672 0.000 2,133 1,954 -179 0.306 -2493 0.000 0.000
Below 50th 17 449 8,279 2,413 608 -1805 0.000 1,500 1,520 20 0.924 -1825 0.001 0.000
Option Volume Percentiles
98th+ 49 2,461 48,820 6,629 1,881 -4748 0.000 3,127 3,755 629 0.003 -5377 0.000 0.000
95th – 97th 77 869 15,309 5,219 1,043 -4176 0.000 2,695 2,580 -115 0.312 -4061 0.000 0.000
90th – 94th 73 411 6,691 3,576 745 -2831 0.000 1,786 1,934 148 0.016 -2979 0.000 0.000
Below 90th 48 162 2,600 2,663 528 -2135 0.000 1,588 1,525 -63 0.346 -2072 0.000 0.000
Source: LiveVol; OptionMetrics; CRSP.
Note: The total size reflects the total size offered and the national best bid and national best offer across all exchanges. The total size is winsorized at the 99th percentile to control for outliers. Instances in which the spread was locked or cross and instances in which the best bid (ask) size was zero, but the best bid (ask) price was non-zero, were removed. Each switching option class is matched with a non-switching option class based on underlying market capitalization and option volume. Pilot addition dates 1/26/07, 9/28/07, 3/28/08, and 11/2/09 are included in the 2007 – 2009 addition date period; Pilot addition dates 2/1/10, 5/3/10, 8/2/10, 1/4/11, and 7/6/11 are included in the 2010 – 2011 period; and Pilot addition dates 1/4/12, 7/3/12, 1/3/13, 7/3/13, 1/3/14, 7/3/14, 1/5/15, and 7/6/15 are included in the 2012 – 2015 period. Matched pairs of switching and non-switching option classes are categorized into market capitalization percentiles using the underlying market capitalization of the switching option class at the end of the month prior to the addition date. Market capitalization percentiles are defined using the stocks listed on the NYSE. Matched pairs of switching and non-switching option classes are categorized into option class volume percentiles using the option class volume of the switching option class during the month prior to the addition date. Option class percentiles are defined using the universe of option classes on common stock in the LiveVol data. The average daily volume and average daily trade count are calculated on a per symbol basis and are calculated using the month prior to the month the option class was added to the Pilot (the "pre" month).
Appendix B

$0.00
$0.03
$0.06
$0.09
$0.12
$0.15
7/1/10 7/9/10 7/17/10 7/25/10 8/2/10 8/10/10 8/18/10 8/26/10 9/3/10
Switching
Control
Effective Spread
Impact of Addition to the Penny Pilot on Effective Spreads ($)Addition Date: August 2, 2010
Source: LiveVol; OptionMetrics, CRSP.
Note: Includes 46 option classes on common stock that were added to the Penny Pilot on August 2, 2010 for which LiveVol has data. Each switching option class is matched with a non-switching option class outside the Pilot based on underlying market capitalization and option volume.Effective spreads for the switching and control samples are averaged across each date.
Penny Pilot Addition Date
Appendix C

0%
4%
8%
12%
16%
20%
7/1/10 7/9/10 7/17/10 7/25/10 8/2/10 8/10/10 8/18/10 8/26/10 9/3/10
Switching
Control
Effective Spread
Impact of Addition to the Penny Pilot on Effective Spreads (%)Addition Date: August 2, 2010
Source: LiveVol; OptionMetrics, CRSP.
Note: Includes 46 option classes on common stock that were added to the Penny Pilot on August 2, 2010 for which LiveVol has data. Each switching option class is matched with a non-switching option class outside the Pilot based on underlying market capitalization and option volume.Effective spreads for the switching and control samples are averaged across each date.
Penny Pilot Addition Date
Appendix C

$0.00
$0.04
$0.08
$0.12
$0.16
$0.20
7/1/10 7/9/10 7/17/10 7/25/10 8/2/10 8/10/10 8/18/10 8/26/10 9/3/10
Switching
Control
Quoted Spread
Impact of Addition to the Penny Pilot on Quoted Spreads ($)Addition Date: August 2, 2010
Source: LiveVol; OptionMetrics, CRSP.
Note: Includes 46 option classes on common stock that were added to the Penny Pilot on August 2, 2010 for which LiveVol has data. Each switching option class is matched with a non-switching option class outside the Pilot based on underlying market capitalization and option volume.Quoted spreads for the switching and control samples are averaged across each date.
Penny Pilot Addition Date
Appendix C

0%
4%
8%
12%
16%
20%
24%
7/1/10 7/9/10 7/17/10 7/25/10 8/2/10 8/10/10 8/18/10 8/26/10 9/3/10
Switching
Control
Quoted Spread
Impact of Addition to the Penny Pilot on Quoted Spreads (%)Addition Date: August 2, 2010
Source: LiveVol; OptionMetrics, CRSP.
Note: Includes 46 option classes on common stock that were added to the Penny Pilot on August 2, 2010 for which LiveVol has data. Each switching option class is matched with a non-switching option class outside the Pilot based on underlying market capitalization and option volume.Quoted spreads for the switching and control samples are averaged across each date.
Penny Pilot Addition Date
Appendix C

Univariate Statistics Reported by Addition DateUnconstrained Matching
Switching Non-Switching Difference-in-Differences
Addition Date N Pre Post Change P-Value Pre Post Change P-Value Diff-in-Diff T-TestWilcoxon
Signed-Rank
Effective Spread ($)
1/26/2007 9 0.078 0.052 -0.026 0.000 0.104 0.095 -0.009 0.032 -0.017 0.000 0.004
9/28/2007 15 0.147 0.100 -0.047 0.000 0.137 0.117 -0.020 0.006 -0.027 0.001 0.002
3/28/2008 20 0.108 0.072 -0.036 0.000 0.118 0.115 -0.003 0.575 -0.034 0.000 0.000
11/2/2009 41 0.102 0.055 -0.047 0.000 0.080 0.072 -0.008 0.005 -0.039 0.000 0.000
2/1/2010 50 0.089 0.053 -0.036 0.000 0.089 0.087 -0.002 0.333 -0.034 0.000 0.000
5/3/2010 46 0.107 0.066 -0.042 0.000 0.099 0.104 0.005 0.273 -0.047 0.000 0.000
8/2/2010 46 0.097 0.065 -0.032 0.000 0.081 0.085 0.004 0.159 -0.036 0.000 0.000
1/4/2011 1 0.076 0.039 -0.036 – 0.081 0.077 -0.004 – -0.032 – –
7/6/2011 3 0.125 0.102 -0.022 – 0.126 0.130 0.004 – -0.026 – –
1/4/2012 1 0.134 0.141 0.007 – 0.031 0.054 0.023 – -0.016 – –
7/3/2012 2 0.084 0.054 -0.030 – 0.090 0.078 -0.012 – -0.018 – –
1/3/2013 5 0.100 0.090 -0.010 – 0.101 0.094 -0.007 – -0.003 – –
7/3/2013 1 0.254 0.245 -0.009 – 0.212 0.198 -0.014 – 0.005 – –
1/3/2014 3 0.188 0.179 -0.008 – 0.102 0.106 0.004 – -0.012 – –
7/3/2014 1 0.133 0.092 -0.041 – 0.493 0.492 -0.001 – -0.040 – –
1/5/2015 1 0.176 0.120 -0.056 – 0.075 0.051 -0.024 – -0.033 – –
7/6/2015 2 0.186 0.183 -0.002 – 0.071 0.093 0.023 – -0.025 – –
1/5/2016 – – – – – – – – – – – –
Appendix D

Univariate Statistics Reported by Addition DateUnconstrained Matching
Switching Non-Switching Difference-in-Differences
Addition Date N Pre Post Change P-Value Pre Post Change P-Value Diff-in-Diff T-TestWilcoxon
Signed-Rank
Effective Spread (%)
1/26/2007 9 0.171 0.107 -0.064 0.001 0.153 0.149 -0.004 0.814 -0.059 0.063 0.027
9/28/2007 15 0.136 0.071 -0.065 0.000 0.123 0.113 -0.010 0.087 -0.055 0.000 0.000
3/28/2008 20 0.140 0.085 -0.055 0.000 0.099 0.100 0.000 0.970 -0.056 0.000 0.000
11/2/2009 41 0.134 0.085 -0.049 0.000 0.106 0.118 0.012 0.006 -0.061 0.000 0.000
2/1/2010 50 0.126 0.071 -0.055 0.000 0.107 0.109 0.002 0.486 -0.057 0.000 0.000
5/3/2010 46 0.124 0.100 -0.024 0.000 0.105 0.141 0.035 0.003 -0.059 0.000 0.000
8/2/2010 46 0.143 0.086 -0.056 0.000 0.120 0.129 0.009 0.385 -0.066 0.000 0.000
1/4/2011 1 0.387 0.213 -0.173 – 0.222 0.240 0.018 – -0.192 – –
7/6/2011 3 0.129 0.124 -0.006 – 0.119 0.116 -0.003 – -0.003 – –
1/4/2012 1 0.145 0.086 -0.058 – 0.162 0.101 -0.060 – 0.002 – –
7/3/2012 2 0.245 0.168 -0.077 – 0.141 0.141 0.000 – -0.077 – –
1/3/2013 5 0.219 0.167 -0.052 – 0.156 0.136 -0.020 – -0.031 – –
7/3/2013 1 0.105 0.103 -0.002 – 0.089 0.078 -0.011 – 0.009 – –
1/3/2014 3 0.140 0.113 -0.027 – 0.098 0.099 0.001 – -0.028 – –
7/3/2014 1 0.135 0.096 -0.039 – 0.104 0.102 -0.002 – -0.036 – –
1/5/2015 1 0.201 0.159 -0.041 – 0.142 0.096 -0.046 – 0.005 – –
7/6/2015 2 0.134 0.123 -0.012 – 0.122 0.158 0.037 – -0.049 – –
1/5/2016 – – – – – – – – – – – –
Appendix D

Univariate Statistics Reported by Addition DateUnconstrained Matching
Switching Non-Switching Difference-in-Differences
Addition Date N Pre Post Change P-Value Pre Post Change P-Value Diff-in-Diff T-TestWilcoxon
Signed-Rank
Quoted Spread ($)
1/26/2007 9 0.089 0.058 -0.031 0.000 0.115 0.106 -0.009 0.033 -0.022 0.000 0.004
9/28/2007 15 0.168 0.110 -0.058 0.000 0.161 0.136 -0.026 0.002 -0.032 0.001 0.003
3/28/2008 20 0.123 0.081 -0.042 0.000 0.134 0.132 -0.002 0.670 -0.041 0.000 0.000
11/2/2009 41 0.140 0.073 -0.068 0.000 0.104 0.098 -0.006 0.082 -0.062 0.000 0.000
2/1/2010 50 0.125 0.070 -0.055 0.000 0.120 0.118 -0.002 0.414 -0.053 0.000 0.000
5/3/2010 46 0.146 0.085 -0.061 0.000 0.132 0.135 0.003 0.708 -0.064 0.000 0.000
8/2/2010 46 0.122 0.083 -0.039 0.000 0.099 0.110 0.010 0.018 -0.050 0.000 0.000
1/4/2011 1 0.097 0.050 -0.048 – 0.107 0.107 -0.001 – -0.047 – –
7/6/2011 3 0.161 0.132 -0.028 – 0.163 0.169 0.006 – -0.034 – –
1/4/2012 1 0.197 0.198 0.001 – 0.038 0.072 0.034 – -0.033 – –
7/3/2012 2 0.130 0.079 -0.051 – 0.142 0.119 -0.023 – -0.028 – –
1/3/2013 5 0.158 0.133 -0.025 – 0.158 0.140 -0.018 – -0.007 – –
7/3/2013 1 0.389 0.366 -0.023 – 0.271 0.261 -0.010 – -0.013 – –
1/3/2014 3 0.297 0.252 -0.046 – 0.158 0.152 -0.007 – -0.039 – –
7/3/2014 1 0.208 0.129 -0.078 – 0.693 0.721 0.028 – -0.106 – –
1/5/2015 1 0.279 0.186 -0.093 – 0.111 0.090 -0.022 – -0.071 – –
7/6/2015 2 0.331 0.262 -0.069 – 0.107 0.142 0.036 – -0.105 – –
1/5/2016 – – – – – – – – – – – –
Appendix D

Univariate Statistics Reported by Addition DateUnconstrained Matching
Switching Non-Switching Difference-in-Differences
Addition Date N Pre Post Change P-Value Pre Post Change P-Value Diff-in-Diff T-TestWilcoxon
Signed-Rank
Quoted Spread (%)
1/26/2007 9 0.188 0.115 -0.073 0.000 0.169 0.162 -0.008 0.663 -0.066 0.036 0.020
9/28/2007 15 0.152 0.077 -0.075 0.000 0.139 0.127 -0.012 0.088 -0.063 0.000 0.000
3/28/2008 20 0.153 0.088 -0.065 0.000 0.106 0.108 0.001 0.789 -0.066 0.000 0.000
11/2/2009 41 0.170 0.103 -0.067 0.000 0.130 0.147 0.017 0.000 -0.085 0.000 0.000
2/1/2010 50 0.168 0.085 -0.082 0.000 0.137 0.139 0.002 0.602 -0.084 0.000 0.000
5/3/2010 46 0.159 0.120 -0.040 0.000 0.133 0.170 0.037 0.009 -0.076 0.000 0.000
8/2/2010 46 0.173 0.101 -0.072 0.000 0.139 0.157 0.017 0.150 -0.089 0.000 0.000
1/4/2011 1 0.476 0.254 -0.221 – 0.291 0.325 0.034 – -0.255 – –
7/6/2011 3 0.154 0.145 -0.009 – 0.146 0.142 -0.003 – -0.005 – –
1/4/2012 1 0.191 0.111 -0.080 – 0.175 0.109 -0.066 – -0.014 – –
7/3/2012 2 0.305 0.223 -0.083 – 0.197 0.180 -0.017 – -0.065 – –
1/3/2013 5 0.284 0.214 -0.069 – 0.191 0.167 -0.024 – -0.045 – –
7/3/2013 1 0.154 0.145 -0.010 – 0.108 0.104 -0.005 – -0.005 – –
1/3/2014 3 0.223 0.155 -0.067 – 0.143 0.140 -0.004 – -0.064 – –
7/3/2014 1 0.208 0.122 -0.086 – 0.143 0.150 0.007 – -0.093 – –
1/5/2015 1 0.338 0.214 -0.124 – 0.200 0.158 -0.042 – -0.083 – –
7/6/2015 2 0.253 0.177 -0.076 – 0.199 0.252 0.053 – -0.129 – –
1/5/2016 – – – – – – – – – – – –
Source: LiveVol; OptionMetrics; CRSP.
Note: Each switching option class is matched with a non-switching option class based on underlying market capitalization and option volume. P-values are not reported for sample sizes smaller than six.
Appendix D

Univariate Statistics Reported by Addition DateUnconstrained MatchingOption Classes on ETFs
Switching Non-Switching Difference-in-Differences
Addition Date N Pre Post Change P-Value Pre Post Change P-Value Diff-in-Diff T-TestWilcoxon
Signed-Rank
Effective Spread ($)
1/26/2007 3 0.076 0.049 -0.028 – 0.092 0.092 0.000 – -0.028 – –
9/28/2007 4 0.138 0.076 -0.062 – 0.198 0.257 0.060 – -0.122 – –
3/28/2008 1 0.422 0.130 -0.292 – 0.040 0.043 0.003 – -0.295 – –
11/2/2009 19 0.112 0.073 -0.038 0.000 0.082 0.078 -0.004 0.325 -0.034 0.000 0.000
2/1/2010 6 0.086 0.056 -0.030 0.011 0.097 0.089 -0.008 0.369 -0.022 0.096 0.094
5/3/2010 7 0.073 0.047 -0.026 0.000 0.084 0.136 0.052 0.070 -0.078 0.014 0.016
8/2/2010 6 0.159 0.083 -0.077 0.002 0.109 0.106 -0.003 0.874 -0.074 0.004 0.031
1/4/2011 0 – – – – – – – – – – –
7/6/2011 0 – – – – – – – – – – –
1/4/2012 0 – – – – – – – – – – –
7/3/2012 0 – – – – – – – – – – –
1/3/2013 1 0.152 0.111 -0.041 – 0.065 0.055 -0.010 – -0.031 – –
7/3/2013 0 – – – – – – – – – – –
1/3/2014 2 0.101 0.192 0.091 – 0.063 0.069 0.006 – 0.084 – –
7/3/2014 0 – – – – – – – – – – –
1/5/2015 0 – – – – – – – – – – –
7/6/2015 3 0.082 0.116 0.034 – 0.104 0.169 0.065 – -0.031 – –
1/5/2016 1 0.173 0.123 -0.050 – 0.044 0.044 0.000 – -0.050 – –
Appendix E

Univariate Statistics Reported by Addition DateUnconstrained MatchingOption Classes on ETFs
Switching Non-Switching Difference-in-Differences
Addition Date N Pre Post Change P-Value Pre Post Change P-Value Diff-in-Diff T-TestWilcoxon
Signed-Rank
Effective Spread (%)
1/26/2007 3 0.126 0.082 -0.044 – 0.111 0.129 0.018 – -0.062 – –
9/28/2007 4 0.091 0.054 -0.037 – 0.093 0.088 -0.005 – -0.032 – –
3/28/2008 1 0.102 0.076 -0.026 – 0.108 0.099 -0.009 – -0.017 – –
11/2/2009 19 0.125 0.096 -0.029 0.000 0.121 0.143 0.023 0.002 -0.052 0.000 0.000
2/1/2010 6 0.157 0.107 -0.050 0.010 0.106 0.102 -0.004 0.482 -0.046 0.028 0.031
5/3/2010 7 0.143 0.101 -0.042 0.015 0.113 0.154 0.041 0.013 -0.083 0.002 0.016
8/2/2010 6 0.137 0.094 -0.044 0.012 0.137 0.136 0.000 0.968 -0.043 0.012 0.063
1/4/2011 0 – – – – – – – – – – –
7/6/2011 0 – – – – – – – – – – –
1/4/2012 0 – – – – – – – – – – –
7/3/2012 0 – – – – – – – – – – –
1/3/2013 1 0.130 0.071 -0.060 – 0.097 0.071 -0.027 – -0.033 – –
7/3/2013 0 – – – – – – – – – – –
1/3/2014 2 0.128 0.098 -0.030 – 0.124 0.136 0.012 – -0.042 – –
7/3/2014 0 – – – – – – – – – – –
1/5/2015 0 – – – – – – – – – – –
7/6/2015 3 0.192 0.160 -0.032 – 0.126 0.137 0.011 – -0.044 – –
1/5/2016 1 0.263 0.221 -0.043 – 0.127 0.082 -0.045 – 0.003 – –
Appendix E

Univariate Statistics Reported by Addition DateUnconstrained MatchingOption Classes on ETFs
Switching Non-Switching Difference-in-Differences
Addition Date N Pre Post Change P-Value Pre Post Change P-Value Diff-in-Diff T-TestWilcoxon
Signed-Rank
Quoted Spread ($)
1/26/2007 3 0.089 0.054 -0.035 – 0.106 0.104 -0.002 – -0.033 – –
9/28/2007 4 0.163 0.089 -0.074 – 0.232 0.305 0.073 – -0.147 – –
3/28/2008 1 0.447 0.141 -0.306 – 0.043 0.047 0.004 – -0.310 – –
11/2/2009 19 0.150 0.096 -0.054 0.000 0.109 0.105 -0.004 0.364 -0.050 0.000 0.000
2/1/2010 6 0.122 0.072 -0.050 0.004 0.132 0.116 -0.017 0.125 -0.034 0.069 0.094
5/3/2010 7 0.102 0.058 -0.044 0.000 0.113 0.176 0.063 0.057 -0.107 0.007 0.016
8/2/2010 6 0.203 0.107 -0.096 0.002 0.136 0.142 0.005 0.793 -0.101 0.001 0.031
1/4/2011 0 – – – – – – – – – – –
7/6/2011 0 – – – – – – – – – – –
1/4/2012 0 – – – – – – – – – – –
7/3/2012 0 – – – – – – – – – – –
1/3/2013 1 0.256 0.172 -0.083 – 0.095 0.079 -0.016 – -0.067 – –
7/3/2013 0 – – – – – – – – – – –
1/3/2014 2 0.166 0.285 0.119 – 0.088 0.099 0.011 – 0.108 – –
7/3/2014 0 – – – – – – – – – – –
1/5/2015 0 – – – – – – – – – – –
7/6/2015 3 0.144 0.161 0.017 – 0.151 0.229 0.078 – -0.061 – –
1/5/2016 1 0.261 0.206 -0.054 – 0.064 0.057 -0.007 – -0.047 – –
Appendix E

Univariate Statistics Reported by Addition DateUnconstrained MatchingOption Classes on ETFs
Switching Non-Switching Difference-in-Differences
Addition Date N Pre Post Change P-Value Pre Post Change P-Value Diff-in-Diff T-TestWilcoxon
Signed-Rank
Quoted Spread (%)
1/26/2007 3 0.146 0.089 -0.057 – 0.127 0.143 0.016 – -0.073 – –
9/28/2007 4 0.106 0.060 -0.045 – 0.107 0.104 -0.003 – -0.042 – –
3/28/2008 1 0.110 0.080 -0.030 – 0.110 0.097 -0.013 – -0.017 – –
11/2/2009 19 0.163 0.117 -0.046 0.000 0.157 0.181 0.023 0.004 -0.069 0.000 0.000
2/1/2010 6 0.206 0.133 -0.073 0.004 0.144 0.133 -0.011 0.211 -0.062 0.024 0.031
5/3/2010 7 0.194 0.123 -0.071 0.001 0.150 0.194 0.044 0.017 -0.115 0.000 0.016
8/2/2010 6 0.177 0.122 -0.056 0.016 0.169 0.181 0.012 0.519 -0.067 0.015 0.063
1/4/2011 0 – – – – – – – – – – –
7/6/2011 0 – – – – – – – – – – –
1/4/2012 0 – – – – – – – – – – –
7/3/2012 0 – – – – – – – – – – –
1/3/2013 1 0.188 0.095 -0.094 – 0.139 0.104 -0.034 – -0.059 – –
7/3/2013 0 – – – – – – – – – – –
1/3/2014 2 0.215 0.141 -0.073 – 0.169 0.189 0.020 – -0.093 – –
7/3/2014 0 – – – – – – – – – – –
1/5/2015 0 – – – – – – – – – – –
7/6/2015 3 0.325 0.237 -0.088 – 0.185 0.195 0.010 – -0.099 – –
1/5/2016 1 0.375 0.318 -0.056 – 0.179 0.105 -0.074 – 0.018 – –
Source: LiveVol; OptionMetrics; CRSP.
Note: Each switching option class is matched with a non-switching option class based on underlying market capitalization and option volume. P-values are not reported for sample sizes smaller than six.
Appendix E

Univariate Statistics Reported by Penny Pilot Addition Date PeriodsConstrained Matching
Switching Non-Switching Difference-in-Differences
Addition Dates N Pre Post Change P-Value Pre Post Change P-Value Diff-in-Diff T-TestWilcoxon
Signed-Rank
Effective Spread ($)
All 247 0.105 0.068 -0.037 0.000 0.122 0.120 -0.003 0.178 -0.034 0.000 0.000
2007 – 2009 85 0.109 0.066 -0.042 0.000 0.125 0.116 -0.010 0.000 -0.032 0.000 0.000
2010 – 2011 146 0.098 0.062 -0.036 0.000 0.120 0.122 0.002 0.441 -0.038 0.000 0.000
2012 – 2015 16 0.144 0.129 -0.015 0.011 0.130 0.123 -0.006 0.370 -0.008 0.344 0.433
Effective Spread (%)
All 247 0.138 0.090 -0.048 0.000 0.129 0.144 0.015 0.003 -0.063 0.000 0.000
2007 – 2009 85 0.140 0.085 -0.055 0.000 0.126 0.131 0.006 0.083 -0.060 0.000 0.000
2010 – 2011 146 0.132 0.087 -0.046 0.000 0.127 0.149 0.022 0.006 -0.068 0.000 0.000
2012 – 2015 16 0.179 0.138 -0.041 0.000 0.166 0.157 -0.009 0.299 -0.032 0.008 0.008
Quoted Spread ($)
All 247 0.139 0.087 -0.053 0.000 0.160 0.157 -0.002 0.366 -0.050 0.000 0.000
2007 – 2009 85 0.136 0.080 -0.056 0.000 0.154 0.144 -0.009 0.001 -0.047 0.000 0.000
2010 – 2011 146 0.131 0.080 -0.052 0.000 0.158 0.161 0.003 0.458 -0.054 0.000 0.000
2012 – 2015 16 0.230 0.186 -0.043 0.000 0.205 0.193 -0.012 0.181 -0.031 0.013 0.018
Quoted Spread (%)
All 247 0.173 0.106 -0.067 0.000 0.163 0.180 0.017 0.001 -0.084 0.000 0.000
2007 – 2009 85 0.165 0.096 -0.069 0.000 0.150 0.157 0.007 0.031 -0.076 0.000 0.000
2010 – 2011 146 0.169 0.104 -0.065 0.000 0.161 0.186 0.025 0.003 -0.090 0.000 0.000
2012 – 2015 16 0.256 0.183 -0.073 0.000 0.246 0.238 -0.007 0.458 -0.065 0.001 0.001
Source: LiveVol; OptionMetrics; CRSP.
Note: Each switching option class is matched with a non-switching option class based on underlying market capitalization and option volume. For “constrained” matching, the non-switching class must be outside of the Pilot. Pilot addition dates 1/26/07, 9/28/07, 3/28/08, and 11/2/09 are included in the 2007 – 2009 addition date period; Pilot addition dates 2/1/10, 5/3/10, 8/2/10, 1/4/11, and 7/6/11 are included in the 2010 – 2011 period; and Pilot addition dates 1/4/12, 7/3/12, 1/3/13, 7/3/13, 1/3/14, 7/3/14, 1/5/15, and 7/6/15 are included in the 2012 – 2015 period.
Appendix F

Univariate Statistics Reported by Underlying Market CapitalizationConstrained Matching
Switching Non-Switching Difference-in-Differences
Market CapPercentile N Pre Post Change P-Value Pre Post Change P-Value Diff-in-Diff T-Test
Wilcoxon Signed-Rank
Effective Spread ($)
95th + 69 0.102 0.061 -0.041 0.000 0.125 0.120 -0.005 0.074 -0.036 0.000 0.000
75th – 94th 123 0.107 0.071 -0.036 0.000 0.131 0.130 0.000 0.876 -0.035 0.000 0.000
50th – 74th 38 0.106 0.069 -0.037 0.000 0.100 0.095 -0.005 0.255 -0.032 0.000 0.000
Below 50th 17 0.095 0.066 -0.029 0.001 0.101 0.100 -0.001 0.849 -0.028 0.005 0.007
Effective Spread (%)
95th + 69 0.132 0.075 -0.057 0.000 0.121 0.128 0.007 0.029 -0.064 0.000 0.000
75th – 94th 123 0.128 0.084 -0.045 0.000 0.121 0.123 0.002 0.408 -0.047 0.000 0.000
50th – 74th 38 0.163 0.112 -0.051 0.000 0.152 0.211 0.059 0.048 -0.111 0.001 0.000
Below 50th 17 0.176 0.142 -0.035 0.020 0.168 0.204 0.037 0.006 -0.071 0.000 0.000
Quoted Spread ($)
95th + 69 0.130 0.074 -0.056 0.000 0.157 0.153 -0.004 0.285 -0.052 0.000 0.000
75th – 94th 123 0.143 0.092 -0.051 0.000 0.170 0.172 0.002 0.703 -0.053 0.000 0.000
50th – 74th 38 0.151 0.094 -0.057 0.000 0.141 0.130 -0.011 0.131 -0.045 0.000 0.000
Below 50th 17 0.130 0.086 -0.043 0.000 0.137 0.132 -0.005 0.326 -0.038 0.002 0.003
Quoted Spread (%)
95th + 69 0.158 0.085 -0.073 0.000 0.147 0.156 0.009 0.015 -0.081 0.000 0.000
75th – 94th 123 0.162 0.099 -0.063 0.000 0.152 0.156 0.004 0.208 -0.067 0.000 0.000
50th – 74th 38 0.211 0.136 -0.074 0.000 0.202 0.266 0.064 0.036 -0.138 0.000 0.000
Below 50th 17 0.226 0.176 -0.050 0.011 0.213 0.254 0.041 0.006 -0.091 0.000 0.000
Source: LiveVol; OptionMetrics; CRSP.
Note: Each switching option class is matched with a non-switching option class based on underlying market capitalization and option volume. For “constrained” matching, the non-switching class must be outside of the Pilot. Matched pairs of switching and non-switching option classes are categorized into market capitalization percentiles using the underlying market capitalization of the switching option class at the end of the month prior to the addition date. Market capitalization percentiles are defined using the stocks listed on the NYSE.
Appendix F

Univariate Statistics Reported by Option Class VolumeConstrained Matching
Switching Non-Switching Difference-in-Differences
Option VolumePercentile N Pre Post Change P-Value Pre Post Change P-Value Diff-in-Diff T-Test
Wilcoxon Signed-Rank
Effective Spread ($)
98th+ 49 0.129 0.089 -0.041 0.000 0.126 0.114 -0.012 0.001 -0.028 0.000 0.000
95th – 97th 77 0.105 0.064 -0.041 0.000 0.113 0.113 0.000 0.947 -0.041 0.000 0.000
90th – 94th 73 0.098 0.064 -0.034 0.000 0.141 0.140 -0.001 0.794 -0.033 0.000 0.000
Below 90th 48 0.088 0.058 -0.030 0.000 0.104 0.105 0.001 0.759 -0.032 0.000 0.000
Effective Spread (%)
98th+ 49 0.136 0.092 -0.044 0.000 0.137 0.137 0.000 0.944 -0.044 0.000 0.000
95th – 97th 77 0.135 0.086 -0.049 0.000 0.125 0.137 0.012 0.004 -0.061 0.000 0.000
90th – 94th 73 0.138 0.090 -0.048 0.000 0.119 0.142 0.023 0.116 -0.071 0.000 0.000
Below 90th 48 0.144 0.092 -0.052 0.000 0.142 0.163 0.021 0.047 -0.074 0.000 0.000
Quoted Spread ($)
98th+ 49 0.165 0.109 -0.057 0.000 0.157 0.144 -0.013 0.003 -0.044 0.000 0.000
95th – 97th 77 0.142 0.082 -0.060 0.000 0.150 0.151 0.001 0.805 -0.061 0.000 0.000
90th – 94th 73 0.134 0.085 -0.049 0.000 0.188 0.187 -0.001 0.893 -0.048 0.000 0.000
Below 90th 48 0.117 0.074 -0.042 0.000 0.135 0.136 0.001 0.888 -0.043 0.000 0.000
Quoted Spread (%)
98th+ 49 0.163 0.105 -0.058 0.000 0.167 0.169 0.002 0.622 -0.060 0.000 0.000
95th – 97th 77 0.171 0.101 -0.069 0.000 0.161 0.176 0.015 0.001 -0.085 0.000 0.000
90th – 94th 73 0.176 0.109 -0.067 0.000 0.155 0.177 0.022 0.119 -0.089 0.000 0.000
Below 90th 48 0.182 0.110 -0.072 0.000 0.174 0.200 0.026 0.036 -0.098 0.000 0.000
Source: LiveVol; OptionMetrics; CRSP.
Note: Each switching option class is matched with a non-switching option class based on underlying market capitalization and option volume. For “constrained” matching, the non-switching class must be outside of the Pilot. Matched pairs of switching and non-switching option classes are categorized into option class volume percentiles using the option class volume of the switching option class during the month prior to the addition date. Option class percentiles are defined using the universe of option classes on common stock in the LiveVol data.
Appendix F

Univariate Statistics Reported by Quoted PriceConstrained Matching
Switching Non-Switching Difference-in-Differences
Quoted Price N Pre Post Change P-Value Pre Post Change P-Value Diff-in-Diff T-TestWilcoxon
Signed-Rank
Effective Spread ($)
< $1 247 0.054 0.027 -0.027 0.000 0.059 0.059 0.000 0.869 -0.027 0.000 0.000
$1 – $3 247 0.075 0.046 -0.029 0.000 0.083 0.083 0.000 0.883 -0.029 0.000 0.000
$3 – $5 243 0.122 0.084 -0.039 0.000 0.134 0.136 0.002 0.366 -0.041 0.000 0.000
> $5 235 0.196 0.145 -0.051 0.000 0.227 0.225 -0.002 0.716 -0.049 0.000 0.000
Effective Spread (%)
< $1 247 0.324 0.195 -0.129 0.000 0.310 0.321 0.010 0.132 -0.140 0.000 0.000
$1 – $3 247 0.044 0.027 -0.018 0.000 0.049 0.049 0.000 0.993 -0.018 0.000 0.000
$3 – $5 243 0.033 0.022 -0.010 0.000 0.036 0.036 0.000 0.357 -0.011 0.000 0.000
> $5 235 0.023 0.016 -0.006 0.000 0.025 0.025 0.000 0.468 -0.006 0.000 0.000
Quoted Spread ($)
< $1 247 0.071 0.032 -0.039 0.000 0.076 0.076 -0.001 0.244 -0.038 0.000 0.000
$1 – $3 247 0.098 0.056 -0.042 0.000 0.107 0.108 0.001 0.402 -0.043 0.000 0.000
$3 – $5 243 0.166 0.111 -0.056 0.000 0.179 0.183 0.003 0.130 -0.059 0.000 0.000
> $5 235 0.265 0.196 -0.069 0.000 0.297 0.301 0.004 0.521 -0.073 0.000 0.000
Quoted Spread (%)
< $1 247 0.401 0.228 -0.173 0.000 0.386 0.395 0.008 0.231 -0.182 0.000 0.000
$1 – $3 247 0.058 0.033 -0.025 0.000 0.062 0.063 0.001 0.275 -0.026 0.000 0.000
$3 – $5 243 0.044 0.029 -0.015 0.000 0.047 0.048 0.001 0.117 -0.016 0.000 0.000
> $5 235 0.031 0.022 -0.009 0.000 0.034 0.034 0.000 0.685 -0.009 0.000 0.000
Source: LiveVol; OptionMetrics; CRSP.
Note: Each switching option class is matched with a non-switching option class based on underlying market capitalization and option volume. For “constrained” matching, the non-switching class must be outside of the Pilot. Trades for a given option-class are grouped according to the bid and ask price. Instances in which the bid and ask fall into separate groups are excluded from the calculation. (2.8% of trades)
Appendix F

Univariate Statistics Reported by Expiration DateConstrained Matching
Switching Non-Switching Difference-in-Differences
Expiration Date N Pre Post Change P-Value Pre Post Change P-Value Diff-in-Diff T-TestWilcoxon
Signed-Rank
Effective Spread ($)
< 1 week 246 0.090 0.056 -0.034 0.000 0.108 0.109 0.001 0.690 -0.035 0.000 0.000
1 – 2 weeks 245 0.080 0.048 -0.031 0.000 0.095 0.094 -0.001 0.593 -0.030 0.000 0.000
2 – 4 weeks 247 0.078 0.047 -0.031 0.000 0.093 0.092 -0.001 0.477 -0.030 0.000 0.000
+4 weeks 247 0.110 0.074 -0.036 0.000 0.128 0.127 -0.001 0.690 -0.035 0.000 0.000
Effective Spread (%)
< 1 week 246 0.413 0.303 -0.110 0.000 0.390 0.401 0.012 0.267 -0.122 0.000 0.000
1 – 2 weeks 245 0.330 0.206 -0.124 0.000 0.296 0.301 0.005 0.615 -0.129 0.000 0.000
2 – 4 weeks 247 0.246 0.147 -0.100 0.000 0.223 0.243 0.020 0.011 -0.120 0.000 0.000
+4 weeks 247 0.102 0.061 -0.041 0.000 0.096 0.103 0.008 0.140 -0.049 0.000 0.000
Quoted Spread ($)
< 1 week 246 0.118 0.071 -0.047 0.000 0.140 0.142 0.003 0.441 -0.049 0.000 0.000
1 – 2 weeks 245 0.104 0.060 -0.045 0.000 0.122 0.124 0.002 0.524 -0.047 0.000 0.000
2 – 4 weeks 247 0.104 0.059 -0.045 0.000 0.122 0.120 -0.002 0.353 -0.043 0.000 0.000
+4 weeks 247 0.148 0.095 -0.052 0.000 0.168 0.167 0.000 0.910 -0.052 0.000 0.000
Quoted Spread (%)
< 1 week 246 0.475 0.344 -0.131 0.000 0.454 0.471 0.017 0.130 -0.149 0.000 0.000
1 – 2 weeks 245 0.387 0.238 -0.150 0.000 0.350 0.366 0.016 0.097 -0.166 0.000 0.000
2 – 4 weeks 247 0.299 0.171 -0.128 0.000 0.278 0.296 0.019 0.022 -0.146 0.000 0.000
+4 weeks 247 0.131 0.073 -0.058 0.000 0.124 0.132 0.008 0.131 -0.066 0.000 0.000
Source: LiveVol; OptionMetrics; CRSP.
Note: Each switching option class is matched with a non-switching option class based on underlying market capitalization and option volume. For “constrained” matching, the non-switching class must be outside of the Pilot. Trades for a given option-class are grouped according to the time to an option series' expiration.
Appendix F

Univariate Statistics Reported by Penny Pilot Addition Date PeriodsConstrained Matching
Average Trade Size (Contracts)Switching Non-Switching Difference-in-Differences
N Pre Post Change P-Value Pre Post Change P-Value Diff-in-Diff T-TestWilcoxon
Signed-Rank
Addition Date Periods
All 247 21 16 -5.089 0.000 21 20 -1.586 0.000 -3.503 0.000 0.000
2007 – 2009 85 27 20 -6.429 0.000 26 25 -1.484 0.035 -4.945 0.000 0.000
2010 – 2011 146 19 14 -4.415 0.000 19 17 -1.329 0.012 -3.086 0.000 0.000
2012 – 2015 16 15 11 -4.120 0.031 20 15 -4.475 0.022 0.355 0.904 0.706
Market Capitalization Percentiles
95th + 69 26 19 -6.858 0.000 24 22 -1.849 0.017 -5.009 0.000 0.000
75th – 94th 123 20 15 -4.589 0.000 20 18 -1.730 0.001 -2.860 0.000 0.000
50th – 74th 38 19 15 -3.386 0.000 22 21 -1.335 0.249 -2.050 0.126 0.091
Below 50th 17 20 14 -5.326 0.004 20 20 -0.042 0.985 -5.284 0.086 0.132
Option Volume Percentiles
98th+ 49 28 21 -6.752 0.000 30 27 -2.698 0.024 -4.054 0.015 0.005
95th – 97th 77 21 16 -5.214 0.000 22 20 -1.519 0.033 -3.696 0.000 0.000
90th – 94th 73 20 15 -4.956 0.000 17 16 -0.917 0.157 -4.040 0.000 0.000
Below 90th 48 17 14 -3.391 0.000 18 17 -1.577 0.086 -1.814 0.067 0.089
Source: LiveVol; OptionMetrics; CRSP.
Note: Each switching option class is matched with a non-switching option class based on underlying market capitalization and option volume. For “constrained” matching, the non-switching class must be outside of the Pilot. Pilot addition dates 1/26/07, 9/28/07, 3/28/08, and 11/2/09 are included in the 2007 – 2009 addition date period; Pilot addition dates 2/1/10, 5/3/10, 8/2/10, 1/4/11, and 7/6/11 are included in the 2010 – 2011 period; and Pilot addition dates 1/4/12, 7/3/12, 1/3/13, 7/3/13, 1/3/14, 7/3/14, 1/5/15, and 7/6/15 are included in the 2012 – 2015 period. Matched pairs of switching and non-switching option classes are categorized into market capitalization percentiles using the underlying market capitalization of the switching option class at the end of the month prior to the addition date. Market capitalization percentiles are defined using the stocks listed on the NYSE. Matched pairs of switching and non-switching option classes are categorized into option class volume percentiles using the option class volume of the switching option class during the month prior to the addition date. Option class percentiles are defined using the universe of option classes on common stock in the LiveVol data.
Appendix F

Univariate Statistics Reported by Penny Pilot Addition Date PeriodsConstrained Matching
Average Daily Volume (Contracts)Switching Non-Switching Difference-in-Differences
N Pre PostAverage Change P-Value Pre Post
Average Change P-Value Diff-in-Diff T-Test
Wilcoxon Signed-Rank
Addition Date Periods
All 247 16,905 17,519 0.133 0.012 10,860 8,700 -0.185 0.000 0.318 0.000 0.000
2007 – 2009 85 30,563 31,919 0.134 0.128 20,368 16,883 -0.169 0.001 0.303 0.001 0.000
2010 – 2011 146 7,171 6,672 0.106 0.102 5,378 4,077 -0.209 0.000 0.315 0.000 0.000
2012 – 2015 16 33,171 39,994 0.375 0.263 10,369 7,412 -0.052 0.743 0.426 0.198 0.159
Market Capitalization Percentiles
95th + 69 30,296 29,461 -0.050 0.270 17,576 14,750 -0.151 0.007 0.101 0.137 0.018
75th – 94th 123 12,438 14,653 0.292 0.001 8,679 6,819 -0.207 0.000 0.500 0.000 0.000
50th – 74th 38 10,907 10,427 0.085 0.457 8,203 5,607 -0.179 0.090 0.264 0.068 0.011
Below 50th 17 8,279 5,638 -0.171 0.439 5,322 4,670 -0.178 0.353 0.007 0.982 0.712
Option Volume Percentiles
98th+ 49 48,674 50,817 0.038 0.615 26,923 22,474 -0.139 0.051 0.177 0.085 0.030
95th – 97th 77 15,290 14,600 -0.033 0.663 10,736 8,059 -0.230 0.000 0.197 0.024 0.001
90th – 94th 73 6,691 7,449 0.182 0.137 5,706 4,559 -0.154 0.039 0.335 0.017 0.003
Below 90th 48 2,600 3,525 0.422 0.002 2,499 1,965 -0.208 0.003 0.630 0.000 0.000
Source: LiveVol; OptionMetrics; CRSP.
Note: Each switching option class is matched with a non-switching option class based on underlying market capitalization and option volume. For “constrained” matching, the non-switching class must be outside of the Pilot. Pilot addition dates 1/26/07, 9/28/07, 3/28/08, and 11/2/09 are included in the 2007 – 2009 addition date period; Pilot addition dates 2/1/10, 5/3/10, 8/2/10, 1/4/11, and 7/6/11 are included in the 2010 – 2011 period; and Pilot addition dates 1/4/12, 7/3/12, 1/3/13, 7/3/13, 1/3/14, 7/3/14, 1/5/15, and 7/6/15 are included in the 2012 – 2015 period. Matched pairs of switching and non-switching option classes are categorized into market capitalization percentiles using the underlying market capitalization of the switching option class at the end of the month prior to the addition date. Market capitalization percentiles are defined using the stocks listed on the NYSE. Matched pairs of switching and non-switching option classes are categorized into option class volume percentiles using the option class volume of the switching option class during the month prior to the addition date. Option class percentiles are defined using the universe of option classes on common stock in the LiveVol data.
Appendix F

Univariate Statistics Reported by Addition DateConstrained Matching
Switching Non-Switching Difference-in-Differences
Addition Date N Pre Post Change P-Value Pre Post Change P-Value Diff-in-Diff T-TestWilcoxon
Signed-Rank
Effective Spread ($)
1/26/2007 9 0.078 0.052 -0.026 0.000 0.104 0.095 -0.009 0.032 -0.017 0.000 0.004
9/28/2007 15 0.147 0.100 -0.047 0.000 0.167 0.142 -0.025 0.003 -0.022 0.015 0.018
3/28/2008 20 0.108 0.072 -0.036 0.000 0.137 0.133 -0.004 0.337 -0.032 0.000 0.000
11/2/2009 41 0.102 0.055 -0.047 0.000 0.109 0.102 -0.007 0.025 -0.039 0.000 0.000
2/1/2010 50 0.089 0.053 -0.036 0.000 0.108 0.108 -0.001 0.838 -0.035 0.000 0.000
5/3/2010 46 0.107 0.066 -0.042 0.000 0.119 0.122 0.002 0.605 -0.044 0.000 0.000
8/2/2010 46 0.097 0.065 -0.032 0.000 0.122 0.123 0.001 0.830 -0.033 0.000 0.000
1/4/2011 1 0.076 0.039 -0.036 – 0.081 0.077 -0.004 – -0.032 – –
7/6/2011 3 0.125 0.102 -0.022 – 0.294 0.353 0.060 – -0.082 – –
1/4/2012 1 0.134 0.141 0.007 – 0.092 0.078 -0.014 – 0.021 – –
7/3/2012 2 0.084 0.054 -0.030 – 0.090 0.078 -0.012 – -0.018 – –
1/3/2013 5 0.100 0.090 -0.010 – 0.149 0.151 0.002 – -0.012 – –
7/3/2013 1 0.254 0.245 -0.009 – 0.085 0.085 0.000 – -0.008 – –
1/3/2014 3 0.188 0.179 -0.008 – 0.108 0.114 0.006 – -0.015 – –
7/3/2014 1 0.133 0.092 -0.041 – 0.225 0.149 -0.076 – 0.035 – –
1/5/2015 1 0.176 0.120 -0.056 – 0.205 0.191 -0.015 – -0.042 – –
7/6/2015 2 0.186 0.183 -0.002 – 0.108 0.107 -0.001 – -0.001 – –
1/5/2016 – – – – – – – – – – – –
Appendix F

Univariate Statistics Reported by Addition DateConstrained Matching
Switching Non-Switching Difference-in-Differences
Addition Date N Pre Post Change P-Value Pre Post Change P-Value Diff-in-Diff T-TestWilcoxon
Signed-Rank
Effective Spread (%)
1/26/2007 9 0.171 0.107 -0.064 0.001 0.153 0.149 -0.004 0.814 -0.059 0.063 0.027
9/28/2007 15 0.136 0.071 -0.065 0.000 0.129 0.120 -0.009 0.108 -0.056 0.000 0.000
3/28/2008 20 0.140 0.085 -0.055 0.000 0.125 0.130 0.005 0.392 -0.060 0.000 0.000
11/2/2009 41 0.134 0.085 -0.049 0.000 0.118 0.132 0.013 0.002 -0.062 0.000 0.000
2/1/2010 50 0.126 0.071 -0.055 0.000 0.121 0.127 0.006 0.061 -0.061 0.000 0.000
5/3/2010 46 0.124 0.100 -0.024 0.000 0.127 0.180 0.053 0.023 -0.077 0.001 0.000
8/2/2010 46 0.143 0.086 -0.056 0.000 0.132 0.144 0.011 0.277 -0.068 0.000 0.000
1/4/2011 1 0.387 0.213 -0.173 – 0.222 0.240 0.018 – -0.192 – –
7/6/2011 3 0.129 0.124 -0.006 – 0.105 0.108 0.003 – -0.009 – –
1/4/2012 1 0.145 0.086 -0.058 – 0.216 0.174 -0.041 – -0.017 – –
7/3/2012 2 0.245 0.168 -0.077 – 0.141 0.141 0.000 – -0.077 – –
1/3/2013 5 0.219 0.167 -0.052 – 0.161 0.155 -0.006 – -0.046 – –
7/3/2013 1 0.105 0.103 -0.002 – 0.118 0.104 -0.014 – 0.012 – –
1/3/2014 3 0.140 0.113 -0.027 – 0.157 0.137 -0.020 – -0.007 – –
7/3/2014 1 0.135 0.096 -0.039 – 0.245 0.167 -0.078 – 0.039 – –
1/5/2015 1 0.201 0.159 -0.041 – 0.152 0.148 -0.005 – -0.036 – –
7/6/2015 2 0.134 0.123 -0.012 – 0.180 0.222 0.042 – -0.054 – –
1/5/2016 – – – – – – – – – – – –
Appendix F

Univariate Statistics Reported by Addition DateConstrained Matching
Switching Non-Switching Difference-in-Differences
Addition Date N Pre Post Change P-Value Pre Post Change P-Value Diff-in-Diff T-TestWilcoxon
Signed-Rank
Quoted Spread ($)
1/26/2007 9 0.089 0.058 -0.031 0.000 0.115 0.106 -0.009 0.033 -0.022 0.000 0.004
9/28/2007 15 0.168 0.110 -0.058 0.000 0.196 0.164 -0.032 0.002 -0.026 0.014 0.030
3/28/2008 20 0.123 0.081 -0.042 0.000 0.157 0.155 -0.001 0.711 -0.041 0.000 0.000
11/2/2009 41 0.140 0.073 -0.068 0.000 0.146 0.140 -0.005 0.165 -0.063 0.000 0.000
2/1/2010 50 0.125 0.070 -0.055 0.000 0.147 0.148 0.001 0.751 -0.056 0.000 0.000
5/3/2010 46 0.146 0.085 -0.061 0.000 0.161 0.158 -0.003 0.666 -0.058 0.000 0.000
8/2/2010 46 0.122 0.083 -0.039 0.000 0.154 0.160 0.006 0.444 -0.045 0.000 0.000
1/4/2011 1 0.097 0.050 -0.048 – 0.107 0.107 -0.001 – -0.047 – –
7/6/2011 3 0.161 0.132 -0.028 – 0.386 0.471 0.085 – -0.113 – –
1/4/2012 1 0.197 0.198 0.001 – 0.125 0.106 -0.019 – 0.020 – –
7/3/2012 2 0.130 0.079 -0.051 – 0.142 0.119 -0.023 – -0.028 – –
1/3/2013 5 0.158 0.133 -0.025 – 0.234 0.228 -0.006 – -0.019 – –
7/3/2013 1 0.389 0.366 -0.023 – 0.112 0.120 0.008 – -0.031 – –
1/3/2014 3 0.297 0.252 -0.046 – 0.187 0.187 0.000 – -0.046 – –
7/3/2014 1 0.208 0.129 -0.078 – 0.314 0.236 -0.078 – 0.000 – –
1/5/2015 1 0.279 0.186 -0.093 – 0.321 0.295 -0.026 – -0.066 – –
7/6/2015 2 0.331 0.262 -0.069 – 0.195 0.195 0.000 – -0.068 – –
1/5/2016 – – – – – – – – – – – –
Appendix F

Univariate Statistics Reported by Addition DateConstrained Matching
Switching Non-Switching Difference-in-Differences
Addition Date N Pre Post Change P-Value Pre Post Change P-Value Diff-in-Diff T-TestWilcoxon
Signed-Rank
Quoted Spread (%)
1/26/2007 9 0.188 0.115 -0.073 0.000 0.169 0.162 -0.008 0.663 -0.066 0.036 0.020
9/28/2007 15 0.152 0.077 -0.075 0.000 0.146 0.137 -0.009 0.130 -0.066 0.000 0.000
3/28/2008 20 0.153 0.088 -0.065 0.000 0.136 0.143 0.008 0.203 -0.072 0.000 0.000
11/2/2009 41 0.170 0.103 -0.067 0.000 0.154 0.170 0.017 0.001 -0.084 0.000 0.000
2/1/2010 50 0.168 0.085 -0.082 0.000 0.159 0.166 0.007 0.093 -0.089 0.000 0.000
5/3/2010 46 0.159 0.120 -0.040 0.000 0.165 0.217 0.052 0.025 -0.091 0.000 0.000
8/2/2010 46 0.173 0.101 -0.072 0.000 0.159 0.177 0.019 0.121 -0.091 0.000 0.000
1/4/2011 1 0.476 0.254 -0.221 – 0.291 0.325 0.034 – -0.255 – –
7/6/2011 3 0.154 0.145 -0.009 – 0.132 0.142 0.010 – -0.019 – –
1/4/2012 1 0.191 0.111 -0.080 – 0.293 0.233 -0.060 – -0.020 – –
7/3/2012 2 0.305 0.223 -0.083 – 0.197 0.180 -0.017 – -0.065 – –
1/3/2013 5 0.284 0.214 -0.069 – 0.222 0.214 -0.008 – -0.062 – –
7/3/2013 1 0.154 0.145 -0.010 – 0.147 0.148 0.001 – -0.011 – –
1/3/2014 3 0.223 0.155 -0.067 – 0.246 0.217 -0.028 – -0.039 – –
7/3/2014 1 0.208 0.122 -0.086 – 0.340 0.285 -0.055 – -0.031 – –
1/5/2015 1 0.338 0.214 -0.124 – 0.243 0.257 0.014 – -0.138 – –
7/6/2015 2 0.253 0.177 -0.076 – 0.334 0.404 0.070 – -0.146 – –
1/5/2016 – – – – – – – – – – – –
Source: LiveVol; OptionMetrics; CRSP.
Note: Each switching option class is matched with a non-switching option class based on underlying market capitalization and option volume. For “constrained” matching, the non-switching class must be outside of the Pilot. P-values are not reported for sample sizes smaller than six.
Appendix F

Univariate Statistics Reported by Penny Pilot Addition Date PeriodsConstrained Matching
Option Classes on ETFsSwitching Non-Switching Difference-in-Differences
Addition Dates N Pre Post Change P-Value Pre Post Change P-Value Diff-in-Diff T-TestWilcoxon
Signed-Rank
Effective Spread ($)
All 53 0.115 0.077 -0.037 0.000 0.122 0.130 0.008 0.175 -0.046 0.000 0.000
2007 – 2009 27 0.123 0.073 -0.050 0.000 0.121 0.126 0.005 0.518 -0.055 0.000 0.000
2010 – 2011 19 0.105 0.061 -0.043 0.000 0.114 0.130 0.016 0.190 -0.059 0.000 0.000
2012 – 2015 7 0.111 0.138 0.027 0.455 0.146 0.146 0.000 0.998 0.027 0.435 0.813
Effective Spread (%)
All 53 0.136 0.099 -0.037 0.000 0.136 0.154 0.019 0.000 -0.056 0.000 0.000
2007 – 2009 27 0.120 0.088 -0.032 0.000 0.130 0.148 0.019 0.003 -0.050 0.000 0.000
2010 – 2011 19 0.146 0.101 -0.045 0.000 0.130 0.147 0.017 0.027 -0.062 0.000 0.000
2012 – 2015 7 0.175 0.138 -0.037 0.000 0.174 0.198 0.024 0.142 -0.061 0.002 0.016
Quoted Spread ($)
All 53 0.154 0.102 -0.052 0.000 0.165 0.173 0.008 0.277 -0.060 0.000 0.000
2007 – 2009 27 0.156 0.092 -0.064 0.000 0.154 0.162 0.008 0.387 -0.072 0.000 0.000
2010 – 2011 19 0.140 0.078 -0.062 0.000 0.155 0.173 0.017 0.245 -0.080 0.000 0.000
2012 – 2015 7 0.183 0.204 0.022 0.684 0.234 0.217 -0.017 0.406 0.039 0.437 0.688
Quoted Spread (%)
All 53 0.183 0.125 -0.058 0.000 0.186 0.204 0.018 0.001 -0.077 0.000 0.000
2007 – 2009 27 0.151 0.104 -0.046 0.000 0.166 0.186 0.020 0.004 -0.067 0.000 0.000
2010 – 2011 19 0.192 0.126 -0.067 0.000 0.181 0.196 0.015 0.110 -0.082 0.000 0.000
2012 – 2015 7 0.281 0.201 -0.080 0.000 0.275 0.295 0.019 0.282 -0.100 0.001 0.016
Source: LiveVol; OptionMetrics; CRSP.
Note: Each switching option class is matched with a non-switching option class based on underlying market capitalization and option volume. For “constrained” matching, the non-switching class must be outside of the Pilot. Pilot addition dates 1/26/07, 9/28/07, 3/28/08, and 11/2/09 are included in the 2007 – 2009 addition date period; Pilot addition dates 2/1/10, 5/3/10, 8/2/10, 1/4/11, and 7/6/11 are included in the 2010 – 2011 period; and Pilot addition dates 1/4/12, 7/3/12, 1/3/13, 7/3/13, 1/3/14, 7/3/14, 1/5/15, and 7/6/15 are included in the 2012 – 2015 period.
Appendix G
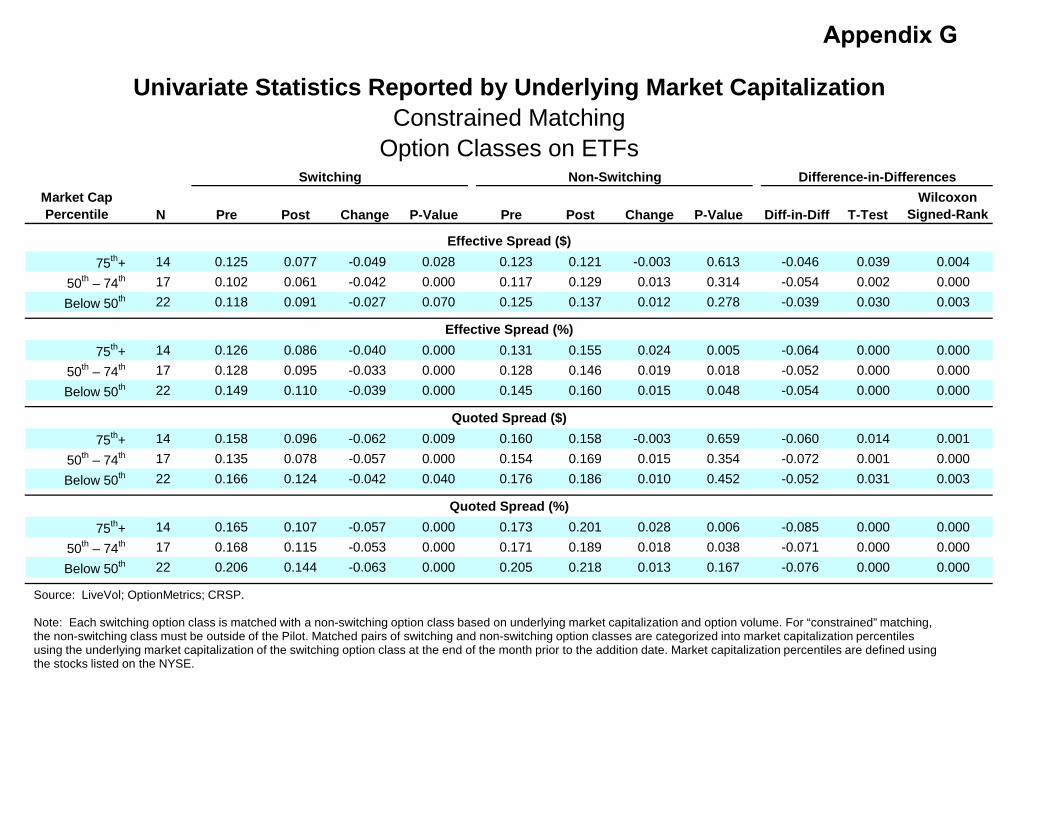
Univariate Statistics Reported by Underlying Market CapitalizationConstrained Matching
Option Classes on ETFsSwitching Non-Switching Difference-in-Differences
Market CapPercentile N Pre Post Change P-Value Pre Post Change P-Value Diff-in-Diff T-Test
Wilcoxon Signed-Rank
Effective Spread ($)
75th+ 14 0.125 0.077 -0.049 0.028 0.123 0.121 -0.003 0.613 -0.046 0.039 0.004
50th – 74th 17 0.102 0.061 -0.042 0.000 0.117 0.129 0.013 0.314 -0.054 0.002 0.000
Below 50th 22 0.118 0.091 -0.027 0.070 0.125 0.137 0.012 0.278 -0.039 0.030 0.003
Effective Spread (%)
75th+ 14 0.126 0.086 -0.040 0.000 0.131 0.155 0.024 0.005 -0.064 0.000 0.000
50th – 74th 17 0.128 0.095 -0.033 0.000 0.128 0.146 0.019 0.018 -0.052 0.000 0.000
Below 50th 22 0.149 0.110 -0.039 0.000 0.145 0.160 0.015 0.048 -0.054 0.000 0.000
Quoted Spread ($)
75th+ 14 0.158 0.096 -0.062 0.009 0.160 0.158 -0.003 0.659 -0.060 0.014 0.001
50th – 74th 17 0.135 0.078 -0.057 0.000 0.154 0.169 0.015 0.354 -0.072 0.001 0.000
Below 50th 22 0.166 0.124 -0.042 0.040 0.176 0.186 0.010 0.452 -0.052 0.031 0.003
Quoted Spread (%)
75th+ 14 0.165 0.107 -0.057 0.000 0.173 0.201 0.028 0.006 -0.085 0.000 0.000
50th – 74th 17 0.168 0.115 -0.053 0.000 0.171 0.189 0.018 0.038 -0.071 0.000 0.000
Below 50th 22 0.206 0.144 -0.063 0.000 0.205 0.218 0.013 0.167 -0.076 0.000 0.000
Source: LiveVol; OptionMetrics; CRSP.
Note: Each switching option class is matched with a non-switching option class based on underlying market capitalization and option volume. For “constrained” matching, the non-switching class must be outside of the Pilot. Matched pairs of switching and non-switching option classes are categorized into market capitalization percentiles using the underlying market capitalization of the switching option class at the end of the month prior to the addition date. Market capitalization percentiles are defined using the stocks listed on the NYSE.
Appendix G

Univariate Statistics Reported by Option Class VolumeConstrained Matching
Option Classes on ETFsSwitching Non-Switching Difference-in-Differences
Option VolumePercentile N Pre Post Change P-Value Pre Post Change P-Value Diff-in-Diff T-Test
Wilcoxon Signed-Rank
Effective Spread ($)
95th+ 15 0.128 0.091 -0.036 0.173 0.122 0.140 0.017 0.200 -0.054 0.085 0.010
90th – 94th 19 0.114 0.079 -0.035 0.001 0.121 0.119 -0.003 0.649 -0.032 0.003 0.001
Below 90th 19 0.106 0.065 -0.041 0.000 0.122 0.135 0.013 0.321 -0.054 0.000 0.000
Effective Spread (%)
95th+ 15 0.115 0.078 -0.037 0.000 0.118 0.138 0.019 0.031 -0.056 0.000 0.000
90th – 94th 19 0.141 0.111 -0.030 0.000 0.150 0.172 0.022 0.005 -0.052 0.000 0.000
Below 90th 19 0.149 0.103 -0.046 0.000 0.135 0.150 0.015 0.058 -0.060 0.000 0.000
Quoted Spread ($)
95th+ 15 0.159 0.119 -0.040 0.215 0.154 0.174 0.020 0.230 -0.061 0.108 0.015
90th – 94th 19 0.162 0.108 -0.055 0.000 0.175 0.167 -0.008 0.311 -0.047 0.002 0.001
Below 90th 19 0.141 0.083 -0.059 0.000 0.164 0.179 0.015 0.316 -0.074 0.000 0.000
Quoted Spread (%)
95th+ 15 0.148 0.097 -0.051 0.000 0.155 0.173 0.018 0.032 -0.069 0.000 0.000
90th – 94th 19 0.197 0.143 -0.054 0.000 0.210 0.233 0.022 0.025 -0.077 0.000 0.000
Below 90th 19 0.196 0.128 -0.067 0.000 0.185 0.200 0.015 0.122 -0.082 0.000 0.000
Source: LiveVol; OptionMetrics; CRSP.
Note: Each switching option class is matched with a non-switching option class based on underlying market capitalization and option volume. For “constrained” matching, the non-switching class must be outside of the Pilot. Matched pairs of switching and non-switching option classes are categorized into option class volume percentiles using the option class volume of the switching option class during the month prior to the addition date. Option class percentiles are defined using the universe of option classes on common stock in the LiveVol data.
Appendix G

Univariate Statistics Reported by Penny Pilot Addition Date PeriodsConstrained Matching
Option Classes on ETFsAverage Daily Volume (Contracts)
Switching Non-Switching Difference-in-Differences
N Pre PostAverage Change P-Value Pre Post
Average Change P-Value Diff-in-Diff T-Test
Wilcoxon Signed-Rank
Addition Date Periods
All 53 39,892 42,336 0.043 0.498 35,388 35,538 -0.216 0.001 0.260 0.003 0.001
2007 – 2009 27 70,848 75,242 -0.032 0.717 64,251 65,710 -0.216 0.015 0.184 0.150 0.209
2010 – 2011 19 5,950 6,113 0.098 0.394 4,196 2,542 -0.313 0.000 0.411 0.004 0.002
2012 – 2015 7 12,617 13,736 0.186 0.302 8,724 8,720 0.045 0.859 0.141 0.531 0.578
Market Capitalization Percentiles
75th+ 14 103,612 121,414 0.169 0.167 115,007 117,963 -0.137 0.337 0.307 0.099 0.135
50th – 74th 17 24,294 19,023 -0.022 0.854 5,965 4,889 -0.283 0.010 0.261 0.055 0.098
Below 50th 22 11,396 10,029 0.013 0.898 7,458 6,768 -0.215 0.023 0.229 0.115 0.033
Option Volume Percentiles
95th+ 15 110,877 123,701 0.125 0.313 110,426 112,718 -0.129 0.241 0.254 0.130 0.169
90th – 94th 19 18,709 14,227 -0.164 0.084 7,790 7,812 -0.171 0.172 0.008 0.949 0.418
Below 90th 19 5,034 6,210 0.186 0.106 3,746 2,331 -0.331 0.000 0.517 0.001 0.001
Source: LiveVol; OptionMetrics; CRSP.
Note: Each switching option class is matched with a non-switching option class based on underlying market capitalization and option volume. For “constrained” matching, the non-switching class must be outside of the Pilot. Pilot addition dates 1/26/07, 9/28/07, 3/28/08, and 11/2/09 are included in the 2007 – 2009 addition date period; Pilot addition dates 2/1/10, 5/3/10, 8/2/10, 1/4/11, and 7/6/11 are included in the 2010 – 2011 period; and Pilot addition dates 1/4/12, 7/3/12, 1/3/13, 7/3/13, 1/3/14, 7/3/14, 1/5/15, and 7/6/15 are included in the 2012 – 2015 period. Matched pairs of switching and non-switching option classes are categorized into market capitalization percentiles using the underlying market capitalization of the switching option class at the end of the month prior to the addition date. Market capitalization percentiles are defined using the stocks listed on the NYSE. Matched pairs of switching and non-switching option classes are categorized into option class volume percentiles using the option class volume of the switching option class during the month prior to the addition date. Option class percentiles are defined using the universe of option classes on common stock in the LiveVol data.
Appendix G

Univariate Statistics Reported by Addition DateConstrained Matching
Option Classes on ETFsSwitching Non-Switching Difference-in-Differences
Addition Date N Pre Post Change P-Value Pre Post Change P-Value Diff-in-Diff T-TestWilcoxon
Signed-Rank
Effective Spread ($)
1/26/2007 3 0.076 0.049 -0.028 – 0.114 0.099 -0.015 – -0.012 – –
9/28/2007 4 0.138 0.076 -0.062 – 0.198 0.257 0.060 – -0.122 – –
3/28/2008 1 0.422 0.130 -0.292 – 0.040 0.043 0.003 – -0.295 – –
11/2/2009 19 0.112 0.073 -0.038 0.000 0.111 0.108 -0.003 0.516 -0.035 0.000 0.000
2/1/2010 6 0.086 0.056 -0.030 0.011 0.102 0.104 0.002 0.707 -0.031 0.029 0.063
5/3/2010 7 0.073 0.047 -0.026 0.000 0.101 0.153 0.052 0.069 -0.078 0.015 0.016
8/2/2010 6 0.159 0.083 -0.077 0.002 0.141 0.130 -0.011 0.591 -0.066 0.024 0.063
1/4/2011 0 – – – – – – – – – – –
7/6/2011 0 – – – – – – – – – – –
1/4/2012 0 – – – – – – – – – – –
7/3/2012 0 – – – – – – – – – – –
1/3/2013 1 0.152 0.111 -0.041 – 0.151 0.114 -0.037 – -0.004 – –
7/3/2013 0 – – – – – – – – – – –
1/3/2014 2 0.101 0.192 0.091 – 0.089 0.087 -0.002 – 0.093 – –
7/3/2014 0 – – – – – – – – – – –
1/5/2015 0 – – – – – – – – – – –
7/6/2015 3 0.082 0.116 0.034 – 0.129 0.158 0.029 – 0.005 – –
1/5/2016 1 0.173 0.123 -0.050 – 0.306 0.259 -0.046 – -0.004 – –
Appendix G

Univariate Statistics Reported by Addition DateConstrained Matching
Option Classes on ETFsSwitching Non-Switching Difference-in-Differences
Addition Date N Pre Post Change P-Value Pre Post Change P-Value Diff-in-Diff T-TestWilcoxon
Signed-Rank
Effective Spread (%)
1/26/2007 3 0.126 0.082 -0.044 – 0.102 0.111 0.009 – -0.052 – –
9/28/2007 4 0.091 0.054 -0.037 – 0.093 0.088 -0.005 – -0.032 – –
3/28/2008 1 0.102 0.076 -0.026 – 0.108 0.099 -0.009 – -0.017 – –
11/2/2009 19 0.125 0.096 -0.029 0.000 0.143 0.169 0.027 0.001 -0.056 0.000 0.000
2/1/2010 6 0.157 0.107 -0.050 0.010 0.110 0.117 0.007 0.490 -0.057 0.017 0.031
5/3/2010 7 0.143 0.101 -0.042 0.015 0.130 0.167 0.037 0.014 -0.079 0.004 0.016
8/2/2010 6 0.137 0.094 -0.044 0.012 0.152 0.155 0.003 0.803 -0.047 0.012 0.063
1/4/2011 0 – – – – – – – – – – –
7/6/2011 0 – – – – – – – – – – –
1/4/2012 0 – – – – – – – – – – –
7/3/2012 0 – – – – – – – – – – –
1/3/2013 1 0.130 0.071 -0.060 – 0.149 0.121 -0.028 – -0.032 – –
7/3/2013 0 – – – – – – – – – – –
1/3/2014 2 0.128 0.098 -0.030 – 0.172 0.203 0.032 – -0.062 – –
7/3/2014 0 – – – – – – – – – – –
1/5/2015 0 – – – – – – – – – – –
7/6/2015 3 0.192 0.160 -0.032 – 0.149 0.203 0.054 – -0.087 – –
1/5/2016 1 0.263 0.221 -0.043 – 0.277 0.248 -0.029 – -0.014 – –
Appendix G

Univariate Statistics Reported by Addition DateConstrained Matching
Option Classes on ETFsSwitching Non-Switching Difference-in-Differences
Addition Date N Pre Post Change P-Value Pre Post Change P-Value Diff-in-Diff T-TestWilcoxon
Signed-Rank
Quoted Spread ($)
1/26/2007 3 0.089 0.054 -0.035 – 0.132 0.115 -0.017 – -0.018 – –
9/28/2007 4 0.163 0.089 -0.074 – 0.232 0.305 0.073 – -0.147 – –
3/28/2008 1 0.447 0.141 -0.306 – 0.043 0.047 0.004 – -0.310 – –
11/2/2009 19 0.150 0.096 -0.054 0.000 0.147 0.145 -0.001 0.814 -0.053 0.000 0.000
2/1/2010 6 0.122 0.072 -0.050 0.004 0.144 0.140 -0.004 0.514 -0.046 0.031 0.063
5/3/2010 7 0.102 0.058 -0.044 0.000 0.139 0.198 0.059 0.084 -0.102 0.011 0.016
8/2/2010 6 0.203 0.107 -0.096 0.002 0.185 0.176 -0.009 0.720 -0.087 0.021 0.063
1/4/2011 0 – – – – – – – – – – –
7/6/2011 0 – – – – – – – – – – –
1/4/2012 0 – – – – – – – – – – –
7/3/2012 0 – – – – – – – – – – –
1/3/2013 1 0.256 0.172 -0.083 – 0.244 0.166 -0.077 – -0.006 – –
7/3/2013 0 – – – – – – – – – – –
1/3/2014 2 0.166 0.285 0.119 – 0.119 0.129 0.010 – 0.109 – –
7/3/2014 0 – – – – – – – – – – –
1/5/2015 0 – – – – – – – – – – –
7/6/2015 3 0.144 0.161 0.017 – 0.236 0.242 0.006 – 0.011 – –
1/5/2016 1 0.261 0.206 -0.054 – 0.448 0.371 -0.078 – 0.024 – –
Appendix G

Univariate Statistics Reported by Addition DateConstrained Matching
Option Classes on ETFsSwitching Non-Switching Difference-in-Differences
Addition Date N Pre Post Change P-Value Pre Post Change P-Value Diff-in-Diff T-TestWilcoxon
Signed-Rank
Quoted Spread (%)
1/26/2007 3 0.146 0.089 -0.057 – 0.117 0.128 0.010 – -0.067 – –
9/28/2007 4 0.106 0.060 -0.045 – 0.107 0.104 -0.003 – -0.042 – –
3/28/2008 1 0.110 0.080 -0.030 – 0.110 0.097 -0.013 – -0.017 – –
11/2/2009 19 0.163 0.117 -0.046 0.000 0.189 0.217 0.029 0.003 -0.074 0.000 0.000
2/1/2010 6 0.206 0.133 -0.073 0.004 0.160 0.162 0.002 0.920 -0.075 0.029 0.031
5/3/2010 7 0.194 0.123 -0.071 0.001 0.180 0.212 0.032 0.053 -0.103 0.001 0.016
8/2/2010 6 0.177 0.122 -0.056 0.016 0.202 0.211 0.008 0.622 -0.064 0.015 0.063
1/4/2011 0 – – – – – – – – – – –
7/6/2011 0 – – – – – – – – – – –
1/4/2012 0 – – – – – – – – – – –
7/3/2012 0 – – – – – – – – – – –
1/3/2013 1 0.188 0.095 -0.094 – 0.218 0.173 -0.045 – -0.049 – –
7/3/2013 0 – – – – – – – – – – –
1/3/2014 2 0.215 0.141 -0.073 – 0.234 0.286 0.051 – -0.125 – –
7/3/2014 0 – – – – – – – – – – –
1/5/2015 0 – – – – – – – – – – –
7/6/2015 3 0.325 0.237 -0.088 – 0.278 0.316 0.037 – -0.126 – –
1/5/2016 1 0.375 0.318 -0.056 – 0.405 0.371 -0.034 – -0.022 – –
Source: LiveVol; OptionMetrics; CRSP.
Note: Each switching option class is matched with a non-switching option class based on underlying market capitalization and option volume. For “constrained” matching, the non-switching class must be outside of the Pilot. P-values are not reported for sample sizes smaller than six.
Appendix G