mena desalination projects april 2021 - {{company.name}}
TRANSCRIPT
MENA Desalination ProjectsApril 2021
2
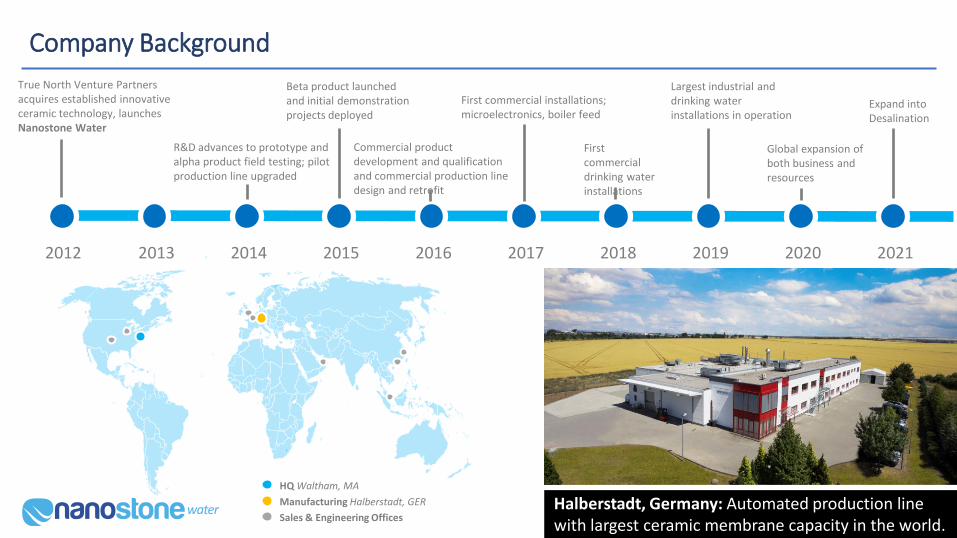
Company Background
Halberstadt, Germany: Automated production line with largest ceramic membrane capacity in the world.
HQ Waltham, MA
Manufacturing Halberstadt, GER
Sales & Engineering Offices
2012 2013 2014 2015 2016 2017 2018 2019 2020 2021
True North Venture Partners acquires established innovative ceramic technology, launches Nanostone Water
R&D advances to prototype and alpha product field testing; pilot production line upgraded
Commercial product development and qualification and commercial production line design and retrofit
Beta product launched and initial demonstration projects deployed
First commercial installations; microelectronics, boiler feed
First commercial drinking water installations
Largest industrial and drinking water installations in operation
Global expansion of both business and resources
Expand into Desalination
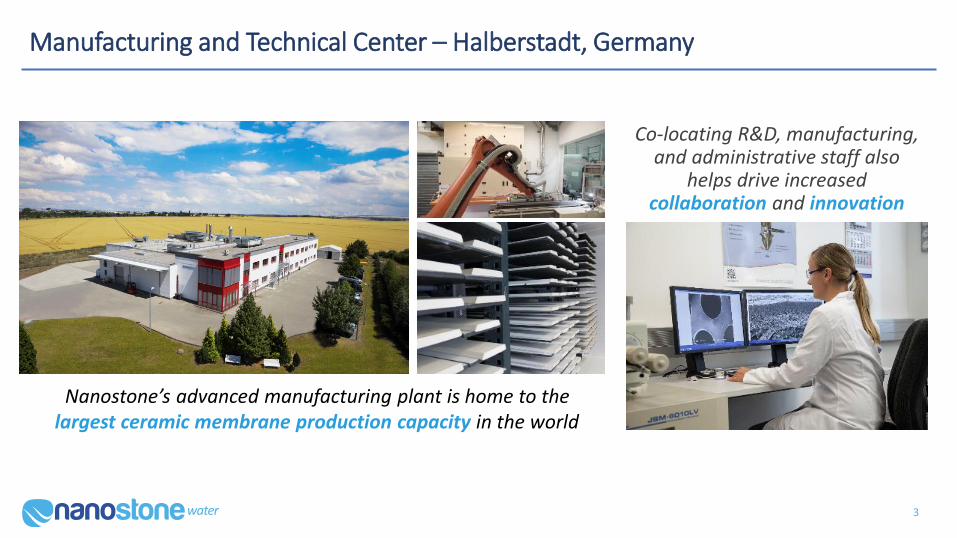
Manufacturing and Technical Center – Halberstadt, Germany
Co-locating R&D, manufacturing, and administrative staff also
helps drive increased collaboration and innovation
Nanostone’s advanced manufacturing plant is home to the largest ceramic membrane production capacity in the world
3
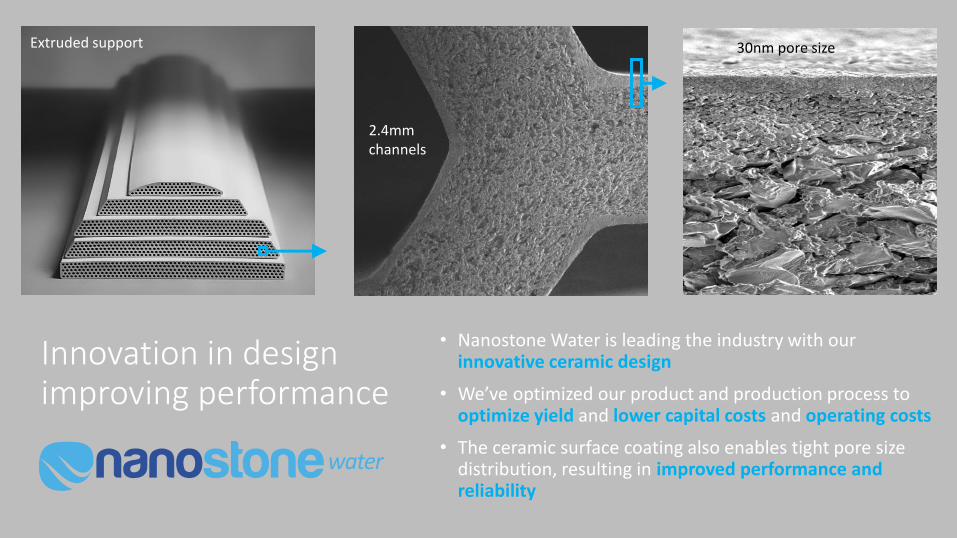
Innovation in design improving performance
• Nanostone Water is leading the industry with our innovative ceramic design
• We’ve optimized our product and production process to optimize yield and lower capital costs and operating costs
• The ceramic surface coating also enables tight pore size distribution, resulting in improved performance and reliability
Extruded support
2.4mmchannels
30nm pore size

Permeate / Backwash
Super Duplex 2507Permeate Port262 ft2/24.3 m2 area
α- Al2O3 ceramic membrane
7 Bar rated FRP vessel
Overall vessel height 75.5 in, Dia 9.8 in, Shipping weight 95 kg
Inside-Out FiltrationDead-end operation
Nanostone Module (Universal Design)
Feedhttps://www.youtube.com/watch?v=J7ZAiiMPoaU
Permeate
Feed flow
Reject
Nanostone Ceramic Membranes – Key Features and Benefits
• Operates at very high flux (3–6 times higher than PUF)
• Higher recovery than polymeric MF/UF
• Runs stably at high solids loading, especially inorganics
• Dosing of coagulant is well-tolerated and even improves performance
• Stable operation without pre-treatment (ceramic UF eliminates the need for clarifiers and multi-media filters which are often used before polymeric UF)
• CapEx-competitive on a system-to-system basis with compact footprint
• pH resistance from 1–13 in cleaning, 2–12 in operation
• Operational temperature 33 –113 °F (0.5 –45 °C)
• Depending on application, membranes may be guaranteed for up to 20 years
• Robust and reliable (no fibers to break or repair)
• Lower operational complexity and cost (no air scour required, fewer chemicals and electricity when removing treatment steps, higher water recovery)

Nanostone Ceramic Membranes Installed Capacity 2017-2021
• Total installed capacity since 2017 is 307 MLD
✓ Municipal: 85 MLD (all retrofits of the existing PUF membranes)
✓ Industrial: 222 MLD( majority greenfield, 30% retrofits)
• Biggest industrial plant 48 MLD (Inner Mongolia, China), coal mining
• Biggest municipal plant 54 MLD (Canyon Regional Water Authority, TX, US), drinking water
• Relatively rapid growth installed capacity mainly caused by:
✓ Failing polymeric membrane (integrity and fouling issues)
✓ Advantages of ceramic ultrafiltration membranes
✓ Same “simple” or standard infrastructure makes it easy to switch to ceramic UF membrane (or back)
• This polymeric retrofit capability makes the Nanostone ceramic ultrafiltration membrane unique in the market
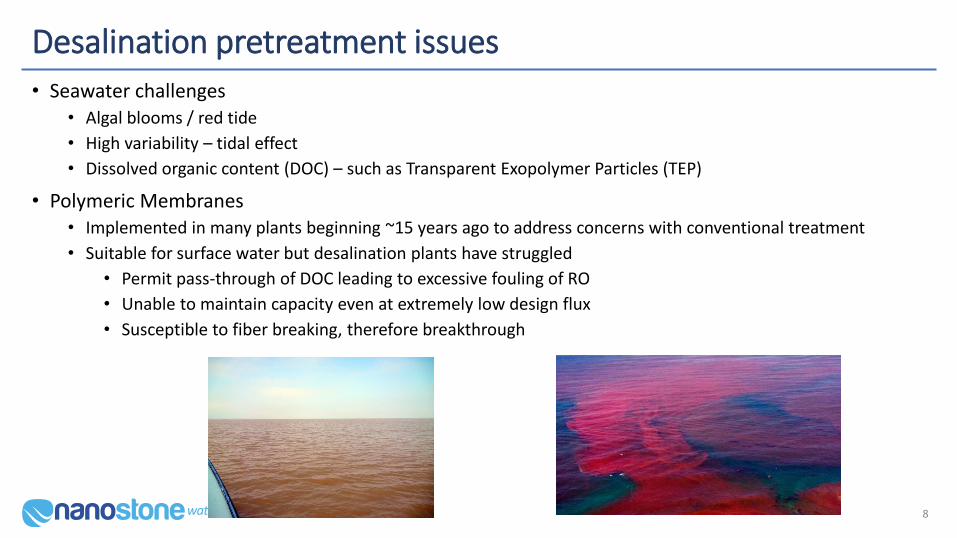
Desalination pretreatment issues• Seawater challenges
• Algal blooms / red tide
• High variability – tidal effect
• Dissolved organic content (DOC) – such as Transparent Exopolymer Particles (TEP)
• Polymeric Membranes• Implemented in many plants beginning ~15 years ago to address concerns with conventional treatment
• Suitable for surface water but desalination plants have struggled
• Permit pass-through of DOC leading to excessive fouling of RO
• Unable to maintain capacity even at extremely low design flux
• Susceptible to fiber breaking, therefore breakthrough
8
Desalination pretreatment today• Dissolved Air Flotation (DAF) now being added ahead of polymeric membranes
• Adds significant capital cost
• Requires large footprint
• High operating cost associated with chemical dosing and sludge removal
• “State-of-the-art today is DAF and multi-media filtration”• Leading seawater utility manager at Global Water Summit in April 2019
• Polymeric membranes have failed
• DAF + MMF have their own problems• Expensive
• Footprint
• Significant risk of solids carry-over
9
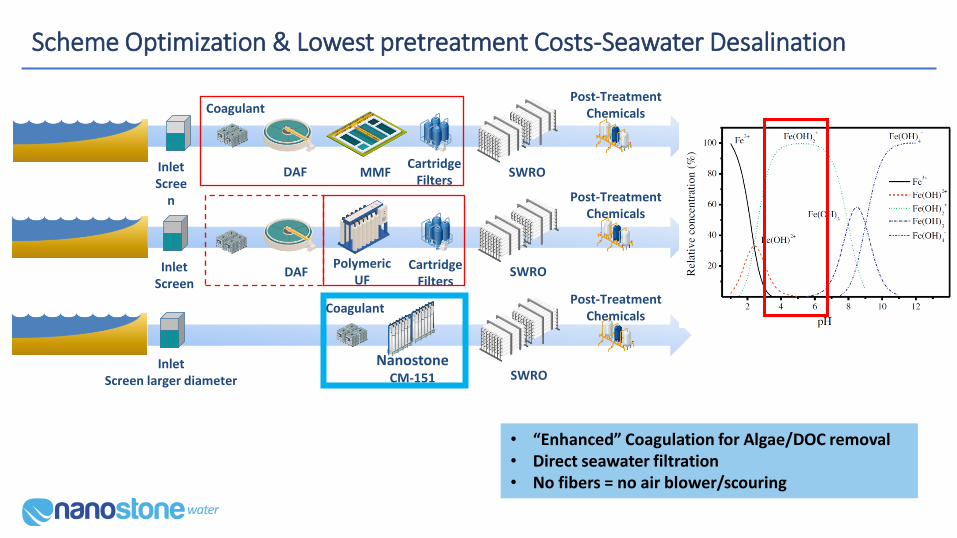
Scheme Optimization & Lowest pretreatment Costs-Seawater Desalination
DAF MMFCartridge
FiltersSWRO
Post-TreatmentChemicals
PolymericUF
CartridgeFilters
SWRO
Post-TreatmentChemicals
NanostoneCM-151 SWRO
Post-TreatmentChemicals
Coagulant
InletScree
n
InletScreen
InletScreen larger diameter
DAF
Coagulant
• “Enhanced” Coagulation for Algae/DOC removal• Direct seawater filtration• No fibers = no air blower/scouring

Nanostone’s ceramic membrane and module ideally suited for desalination pre-treatment
• Membrane and module are sea water resistant
• Large channels (2.4 mm) can hold a large amount of solids and algae
• Minimal pre-treatment (coagulation only) is necessary to function optimally• no need for Dissolved Air Floatation (DAF) or other forms of clarification,
• saving space and complexity while improving reliability
• Can operate optimally with coagulation removing organics significantly
improving downstream RO operations• many membrane systems avoid coagulation placing burden on downstream processes
• High fluxes (> 200 lmh) can be achieved reducing foot print• many desalination plants are located in urban areas land is a premium
• Rigorous cleaning can be achieved with high flow backwashing and chemicals
11
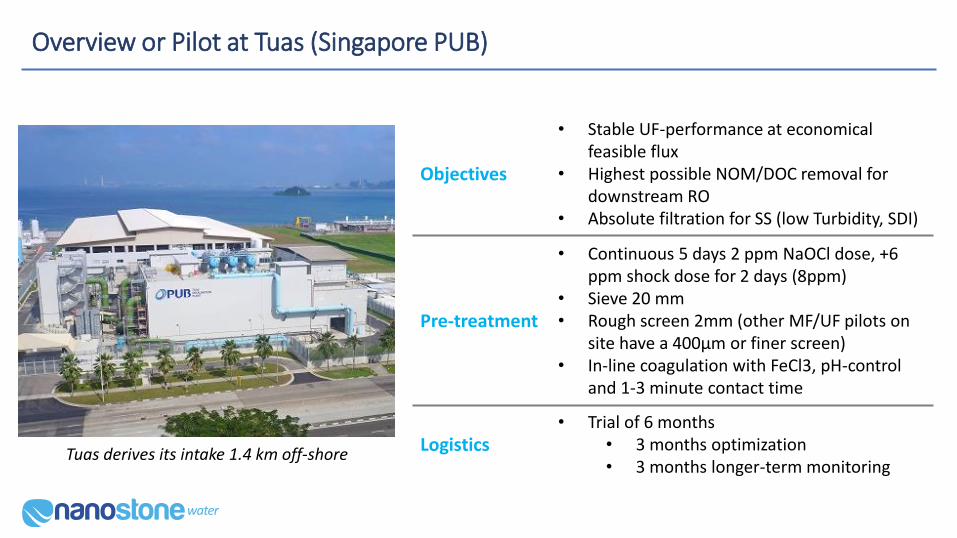
Overview or Pilot at Tuas (Singapore PUB)
Objectives
• Stable UF-performance at economical feasible flux
• Highest possible NOM/DOC removal for downstream RO
• Absolute filtration for SS (low Turbidity, SDI)
Pre-treatment
• Continuous 5 days 2 ppm NaOCl dose, +6 ppm shock dose for 2 days (8ppm)
• Sieve 20 mm• Rough screen 2mm (other MF/UF pilots on
site have a 400µm or finer screen)• In-line coagulation with FeCl3, pH-control
and 1-3 minute contact time
Logistics• Trial of 6 months
• 3 months optimization• 3 months longer-term monitoring
Tuas derives its intake 1.4 km off-shore
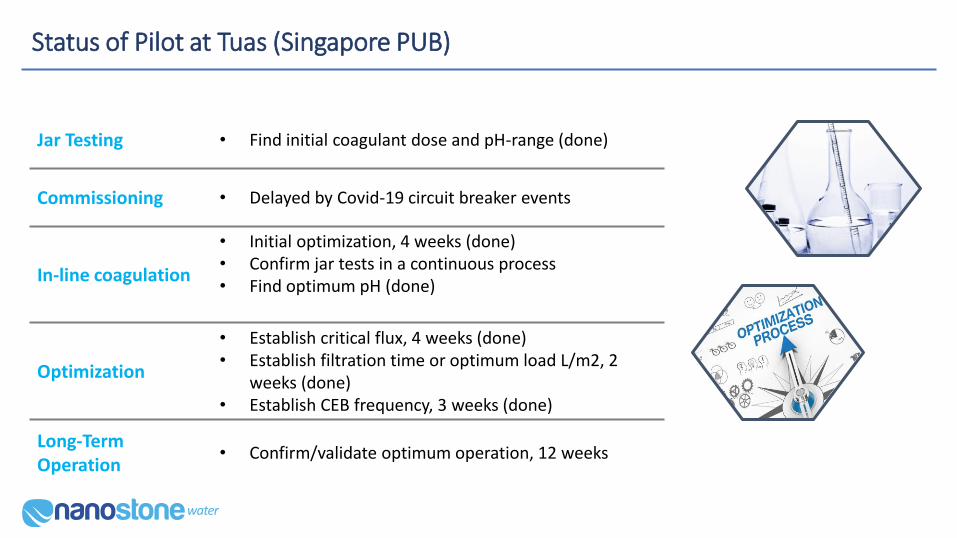
Status of Pilot at Tuas (Singapore PUB)
Jar Testing • Find initial coagulant dose and pH-range (done)
Commissioning • Delayed by Covid-19 circuit breaker events
In-line coagulation
• Initial optimization, 4 weeks (done)• Confirm jar tests in a continuous process• Find optimum pH (done)
Optimization
• Establish critical flux, 4 weeks (done)• Establish filtration time or optimum load L/m2, 2
weeks (done)• Establish CEB frequency, 3 weeks (done)
Long-Term Operation
• Confirm/validate optimum operation, 12 weeks
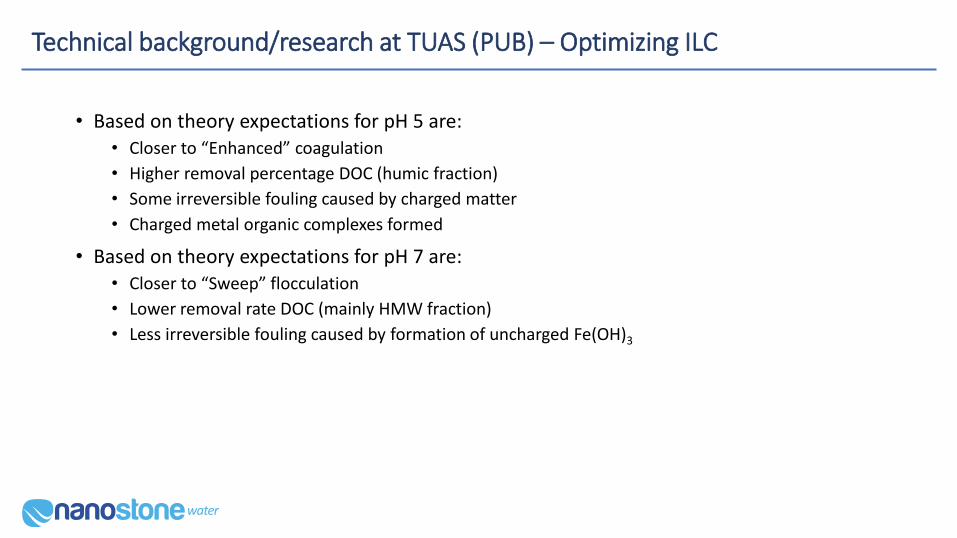
Technical background/research at TUAS (PUB) – Optimizing ILC
• Based on theory expectations for pH 5 are:• Closer to “Enhanced” coagulation
• Higher removal percentage DOC (humic fraction)
• Some irreversible fouling caused by charged matter
• Charged metal organic complexes formed
• Based on theory expectations for pH 7 are:• Closer to “Sweep” flocculation
• Lower removal rate DOC (mainly HMW fraction)
• Less irreversible fouling caused by formation of uncharged Fe(OH)3
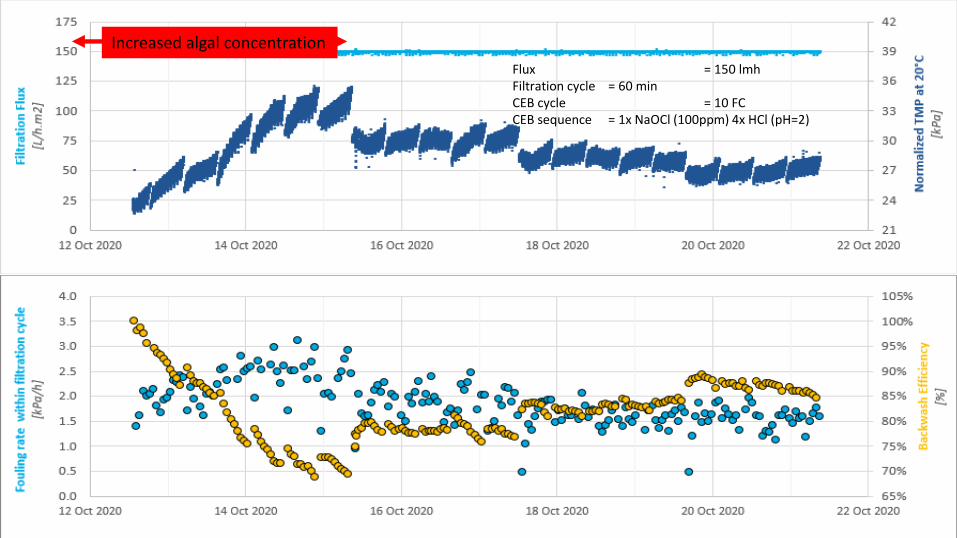
Increased algal concentration
Flux = 150 lmhFiltration cycle = 60 minCEB cycle = 10 FCCEB sequence = 1x NaOCl (100ppm) 4x HCl (pH=2)
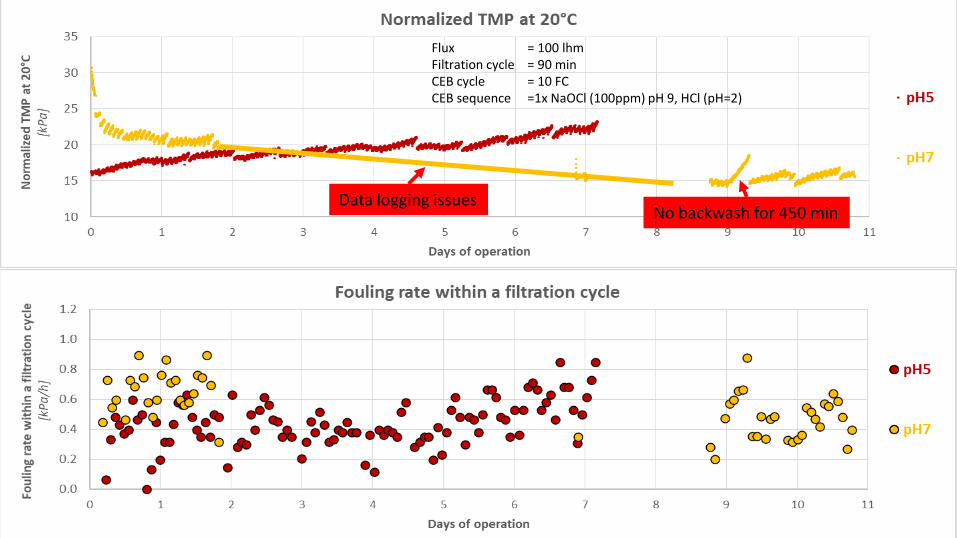
Update technical background/research at TUAS (PUB) – Optimizing ILCFlux = 100 lhmFiltration cycle = 90 minCEB cycle = 10 FCCEB sequence =1x NaOCl (100ppm) pH 9, HCl (pH=2)
No backwash for 450 minData logging issues
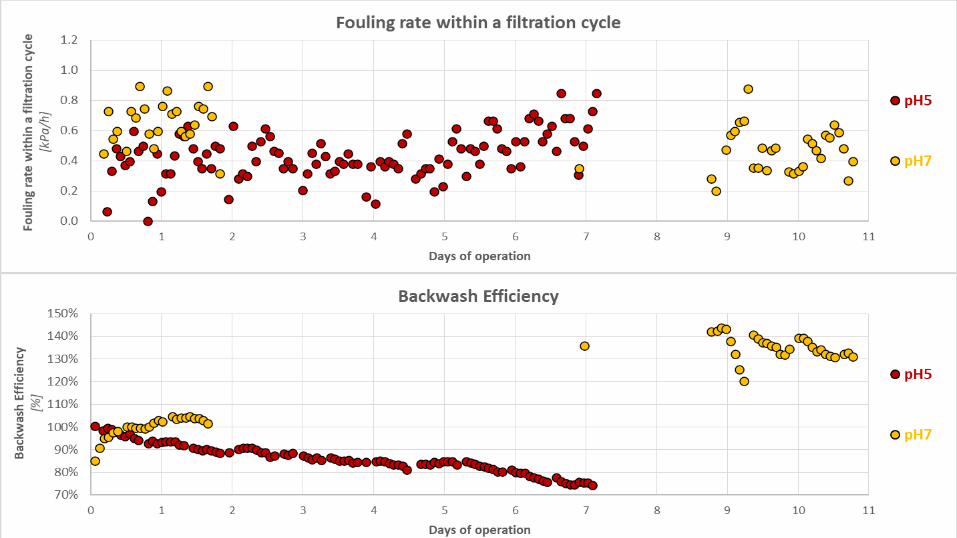
Update technical background/research at TUAS (PUB) – Optimizing ILC
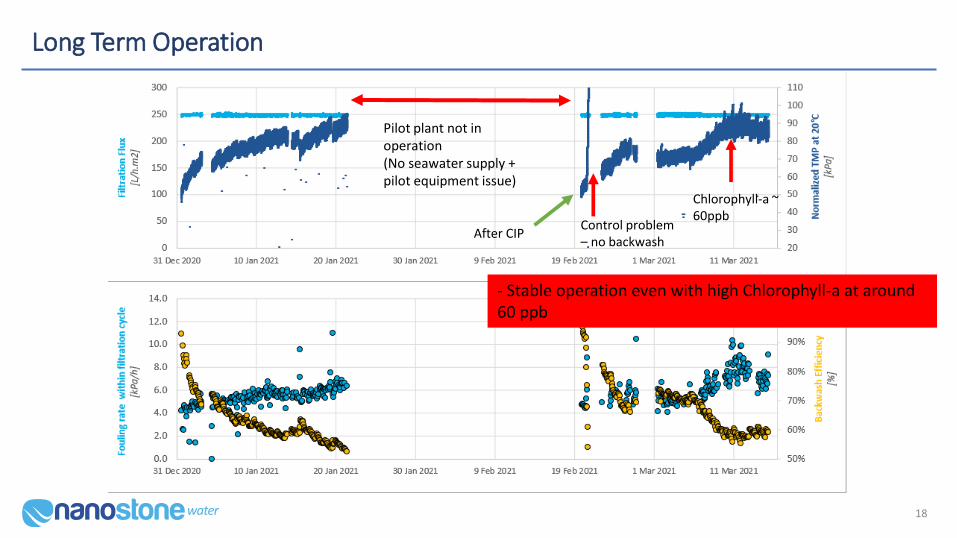
Long Term Operation
18
Pilot plant not in operation(No seawater supply + pilot equipment issue)
Chlorophyll-a ~ 60ppb
Control problem – no backwash
After CIP
- Stable operation even with high Chlorophyll-a at around 60 ppb

Estimated CIP Frequency
19
• Flux – 250 lmh with 90 mins filtration cycle
• CEB frequency – every 24 hours
• Operation period – 31st Dec 20 – 21st Jan 21 (22 days)
• Fouling rate – 1.1317 kPa/day
• CIP Frequency – 89 days
• CIP frequency is calculated based on initial TMP = 50 kPa and TMP before CIP = 150 kPa
• Flux – 250 lmh with 90 mins filtration cycle
• CEB frequency – every 24 hours
• Operation period – 19th Feb 20 – 15th Mar 21 (26 days)
• Fouling rate – 0.9327 kPa/day
• CIP Frequency – 107 days
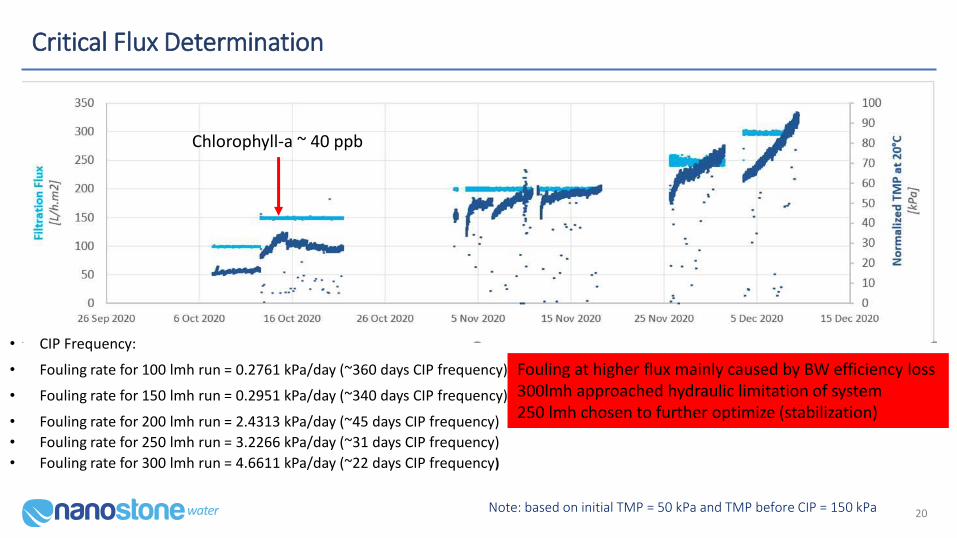
Critical Flux Determination
20
Chlorophyll-a ~ 40 ppb
• CIP Frequency:
• Fouling rate for 100 lmh run = 0.2761 kPa/day (~360 days CIP frequency)
• Fouling rate for 150 lmh run = 0.2951 kPa/day (~340 days CIP frequency)
• Fouling rate for 200 lmh run = 2.4313 kPa/day (~45 days CIP frequency)
• Fouling rate for 250 lmh run = 3.2266 kPa/day (~31 days CIP frequency)
• Fouling rate for 300 lmh run = 4.6611 kPa/day (~22 days CIP frequency)
Note: based on initial TMP = 50 kPa and TMP before CIP = 150 kPa
Fouling at higher flux mainly caused by BW efficiency loss300lmh approached hydraulic limitation of system250 lmh chosen to further optimize (stabilization)
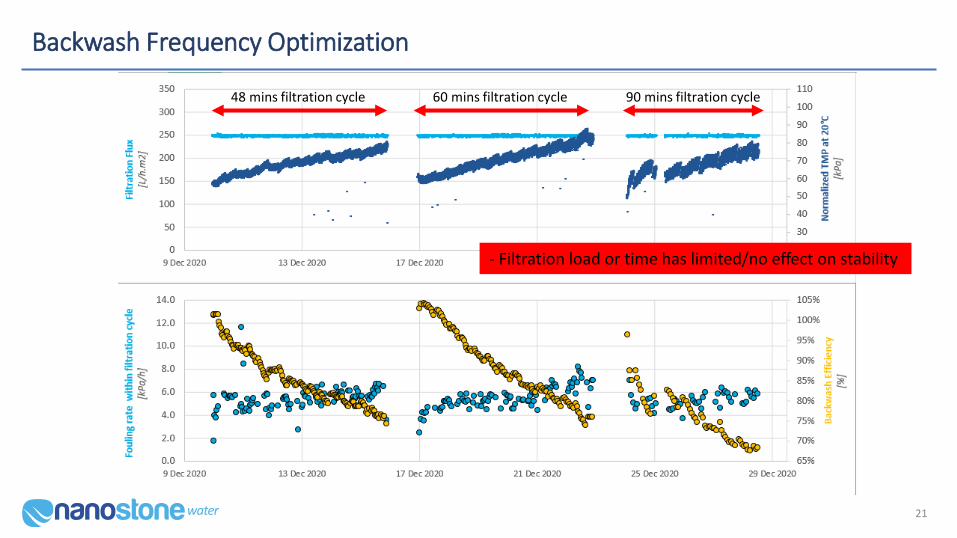
Backwash Frequency Optimization
21
48 mins filtration cycle 60 mins filtration cycle 90 mins filtration cycle
- Filtration load or time has limited/no effect on stability
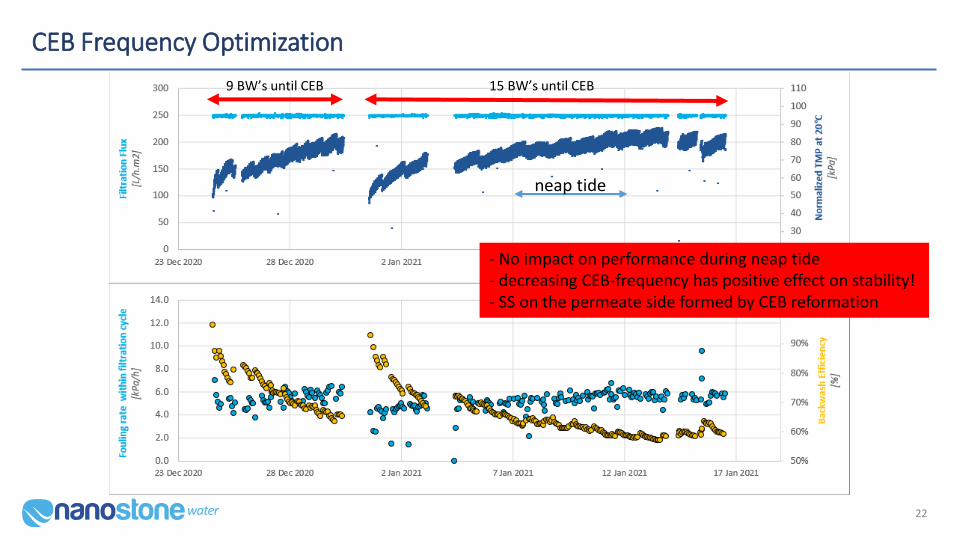
CEB Frequency Optimization
22
9 BW’s until CEB 15 BW’s until CEB
neap tide
- No impact on performance during neap tide - decreasing CEB-frequency has positive effect on stability!- SS on the permeate side formed by CEB reformation
Water Quality permeate
• Turbidity• Raw water turbidity is in the range of 2-14 NTU and filtrate turbidity is below 0.05 NTU most of the time
(spiked after CEB or BW only).
• TOC, DOC and UVT• Raw water TOC and DOC are typically in the range of 1-3 mg/l
• The TOC and DOC removal after filtration are around 30% at typical feed quality ranges and 50-70% at higher feed water concentrations.
• The filtrate UVT is in average around 98%.
• LC-OCD only feasible at raw water and coagulated water, permeate gave signals that were too low to interpreted on the LC-OCD
• SDI15
• Filtrate SDI15 are in average around 2. The SDI15 was higher during the high algae concentration season (Chlorophyll-a ~ 40 ppb).
• Iron• The filtrate total iron and dissolved iron are less than 0.0045 mg/l
23
Summary of Testing and Conclusions
• Membrane operation is stable during algae blooms and tide events with negligible impact on performance
• Established operating parameters demonstrate economically attractive set points• Flux 250 lhm at 90 min filtration cycles
• CEB after 15 FC cycles (approx. 1/day)
• Demonstrated, sustainable and stable flux means:• Reduced footprint
• Reduced CAPEX
• Demonstrated operational set points mean:• Increased water production efficiency
• Increased up time and lower OPEX
• A robust, reliable and cost effective solution for desalination pre-treatment
27
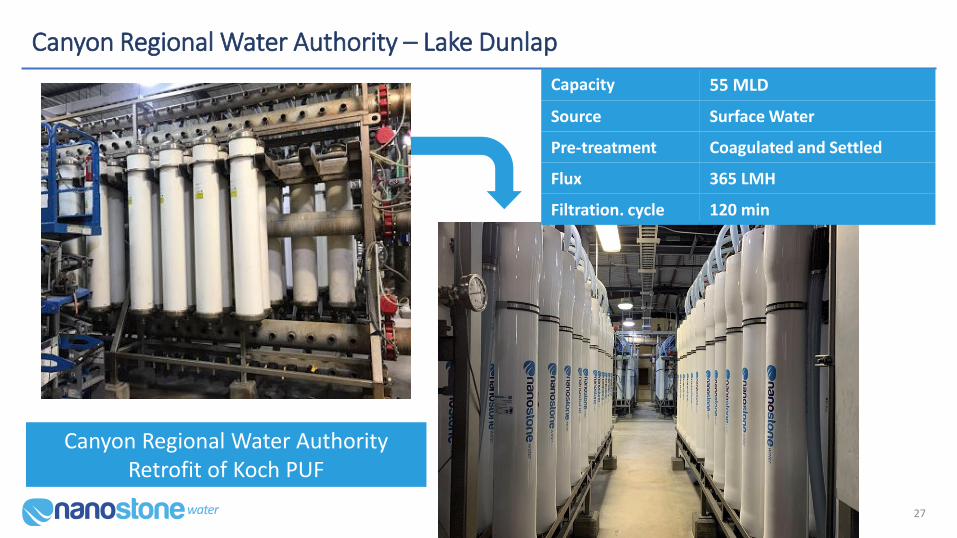
Canyon Regional Water Authority – Lake Dunlap
Canyon Regional Water AuthorityRetrofit of Koch PUF
Capacity 55 MLD
Source Surface Water
Pre-treatment Coagulated and Settled
Flux 365 LMH
Filtration. cycle 120 min

THANK YOU
Nanostone Water
www.nanostonewater.com