menlo - dggs.alaska.govdggs.alaska.gov/webpubs/usgs/of/text/of83-0014.pdf · digitizer, in the form...
TRANSCRIPT
UNITED STATES DEPARTMENT OF THE INTEKIOR
GEOLOGICAL SURVEY
CATALOG OF EARTHQUAKES I N SOUTHERN ALASKA
APRIL-JUNE 1980
OPEN-FILE REPORT 83-14
T h i s r e p o r t i s p r e l i m i n a r y and has n o t been reviewed f o r c o n f o r m i t y
w i t h U.S. Geo log i ca l Survey e d i t o r i a l standards.
Any use o f t r a d e names and t rademarks i n t h i s p u b l i c a t i o n i s f o r
d e s c r i p t i v e purposes o n l y and does n o t c o n s t i t u t e endorsement by t h e
U.S. Geo log ica l Survey.
Menlo Park, C a l i f o r n i a
1983
CATALOG OF EARTHQUAKES IN SOUTHERN ALASKA APRIL-JUNE 1980
K. A. Fogleman, C. D. Stephens, J. C. Lahr, J. A. Rogers, R. S. Cancilla, Roy Tam, J. A. Freiberg, J. P. Melnick
CONTENTS
Page Introduction .......................................................... 1 Instrumentation ....................................................... 4 Data Processing ....................................................... 7 Velocity Models ....................................................... 10 Magnitude ............................................................. 12 Analysis of Quality ................................................... 13 Discussion of Catalog ................................................. 14 Acknowledyments ............................................,.......... 2 0 Keferences ............................................................ 2 1
ILLUSTRATIONS
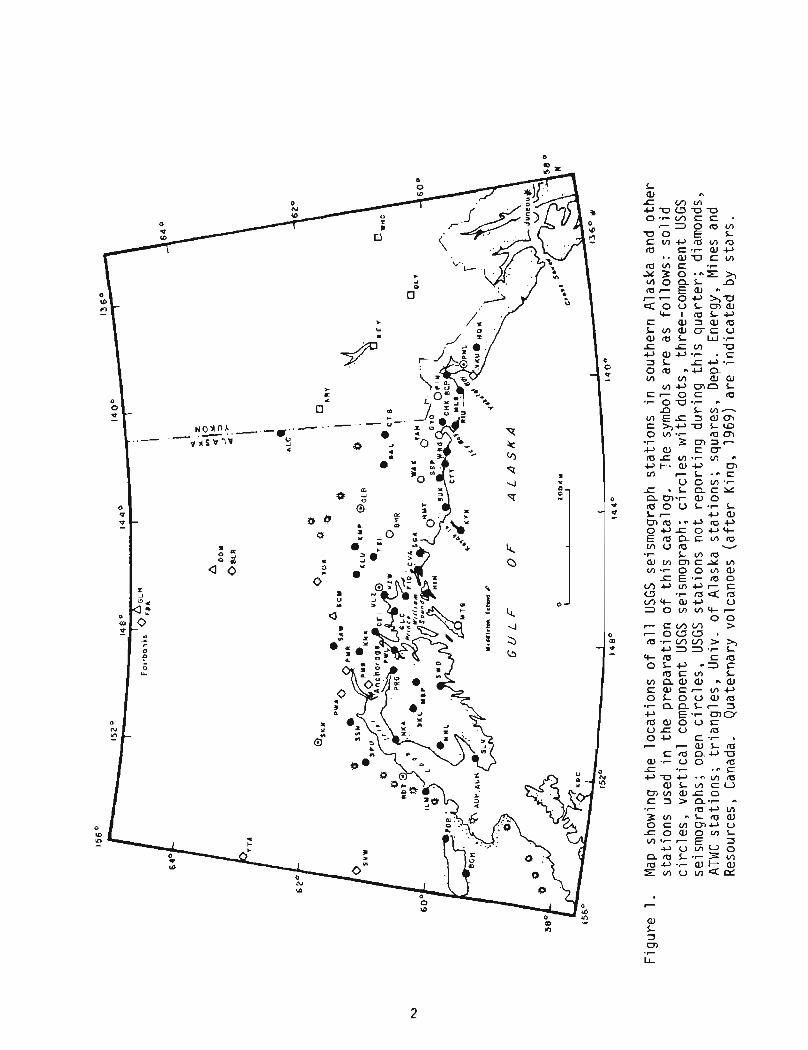
Page Figure 1 Map showing principal seismograph stations used in
in locating earthquakes ................................... i3lock diagram of the USGS telemetered seismograph system .... System response curves of typical USGS telemetered
seismograph stations ...................................... Picture of a typical seismograph station installation ....... Record of station use ....................................... Map showing earthquake epicenters reported in the appendix .. Map of epicenters for earthquakes with magnitudes
greater than 3.5 .......................................... Map showing location of cross sections ...................... Cross sections showing distribution of earthquake hypocenters
listed in the appendix ....................................
TABLES
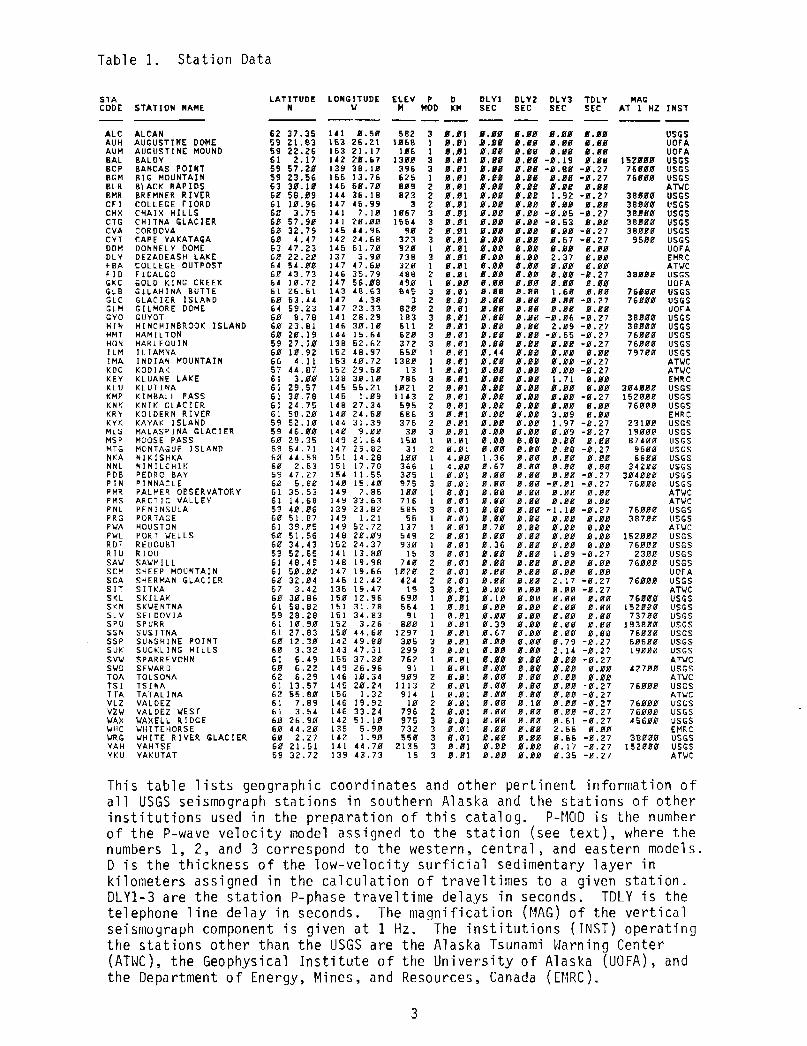
Page Table 1 Station data ................................................ 3
APPENDICES
Page Appendix Southern Alaska earthquakes, second quarter 1980 ............. 2 3
INTRODUCTION
The O f f i c e o f Earthquake S tud ies ( f o r m e r l y t h e Na t i ona l Center f o r Earthquake Research) o f t h e U.S. Geo log ica l Survey (USGS) began a program o f te lemete red se ismic r e c o r d i n g i n sou th - cen t ra l A laska i n 1971. The p r i n c i p a l o b j e c t i v e s o f t h i s program have been t o use da ta recorded by t h i s network t o p r e c i s e l y l o c a t e earthquakes i n t h e a c t i v e se ismic zones of southern Alaska, d e l i n e a t e s e i s m i c a l l y a c t i v e f a u l t s , assess se ismic r i s k , document p o t e n t i a l p remon i to ry earthquake phenomena, i n v e s t i g a t e c u r r e n t t e c t o n i c deformat ion, and s tudy t h e s t r u c t u r e and p h y s i c a l p r o p e r t i e s o f t h e c r u s t and upper mant le. A t a s k fundamental t o a l l o f these goa ls i s t h e r o u t i n e c a t a l o g i n g of earthquake parameters f o r earthquakes l o c a t e d w i t h i n and ad jacen t t o t h e seismograph network.
The i n i t i a l network of 10 s t a t i o n s , 7 around Cook I n l e t and 3 near Valdez, was i n s t a l l e d i n 1971. I n subsequent summers a d d i t i o n s o r m o d i f i c a t i o n s t o t h e network were made. By t h e f a 1 1 of 1973, 26 s t a t i o n s extended f r om western Cook I n l e t t o eas te rn P r i nce W i l l i a m Sound, and 4 s t a t i o n s were l o c a t e d t o t h e eas t between Cordova and Yakutat . A yea r l a t e r 20 a d d i t i o n a l s t a t i o n s were i n s t a l l e d . T h i r t e e n o f these were p laced a long t h e eas te rn Gu l f o f A laska w i t h suppor t f r om t h e N a t i o n a l Oceanic and Atmospheric A d m i n i s t r a t i o n (NOAA) under t h e Outer Con t i nen ta l Shel f Env i ronmenta l Program t o i n v e s t i g a t e t h e s e i s m i c i t y o f t h e o u t e r c o n t i n e n t a l s h e l f , a r e g i o n o f i n t e r e s t f o r o i l e x p l o r a t i o n . Du r i ng t h e subsequent years t h e r e g i o n covered by t h e network has remained r e l a t i v e l y f i x e d w h i l e e f f o r t has been made t o improve t h e i ns t r umen ta t i on and i n s t a l l a t i o n o f t h e s t a t i o n s i n o rde r t o make them more r e l i a b l e .
The l o c a t i o n s o f t h e s t a t i o n s o f t h e USGS seismograph network a re p l o t t e d i n F i g u r e 1 and l i s t e d i n Table 1 a long w i t h t h e a d d i t i o n a l s t a t i o n s f r om which read ings were obta ined. Each USGS s t a t i o n has a s i ng le , ver t ica l -component seismometer. The s t a t i o n s GLB, PNL, RDT, SKN, and VLZ a l s o have nor th -sou th - and eas t -wes t -o r ien ted h o r i z o n t a l seismometers.
T h i s earthquake c a t a l o g p resen ts o r i g i n t imes, f o c a l coord ina tes and magnitudes f o r 1,302 shocks o c c u r r i n g i n t h e second q u a r t e r o f 1980. Readings f r om a t o t a l o f 65 s t a t i o n s were used t o l o c a t e t h e shocks, i n c l u d i n g 12 s t a t i o n s operated by t h e NOAA Alaska Tsunami Warning Center (ATWC, f o r m e r l y Palmer Ubservatory) , 6 s t a t i o n s operated by t h e Geophysical I n s t i t u t e o f t h e U n i v e r s i t y o f A laska (U. o f A.), and 4 s t a t i o n s operated i n southwest Yukon T e r r i t o r y by t h e Department o f Energy, Mines and Resources, Canada.
Earthquakes i n sou th - cen t ra l A laska as sma l l as magnitude 3.0 have been r o u t i n e l y l o c a t e d by t h e N a t i o n a l Earthquake I n f o r m a t i o n Se rv i ce o f t h e USGS and i t s predecessor s i nce t h e g r e a t A laska earthquake of 1964 and a re pub l i shed i n t h e r e p o r t s "P re l im ina ry De te rm ina t i on o f Ep i cen te r s " (PDE). I n c o n t r a s t , t h e shocks i nc l uded i n t h i s c a t a l o g a re as smal l as magnitude 1.0 and most a re sma l l e r than magnitude 3.0. Data f o r t h e l a r g e r h i s t o r i c earthquakes t h a t occur red i n sou th - cen t ra l A laska th rough 1975 have been t a b u l a t e d by Meyers ( 1976) .
., 0 0 .F - a L c n -
vl E c 5 arm r h-P-0 LU3 0 vl.7 5o-l -r 3 m f F -P w m r c n * f F: .. + a m V) r - l . . . C
mrtl ."cr ra-P O + ' K O U + ~ r t r n ~ m r a m u m w -r L m r O a VI m E Y m vl.7 0 0 m w r E.7 ro 0
U7t'mQ-E u . r r C 1 4 : r C 1 Ln'Care v 2 0 v, m't-
0 0 r - c m v , > -0aC3 . rcl--Lnm > r, o33.7 L + rp E m
O L - P ..3c r o C c n L
v r n a , a J *a, E aJ GI- m-P O L O U a J r c l *r n n L - 3 -P E.7 m W r P a J O U S V L V ra OC, E.7 . F F - W L r U
Era CL&-O W . 7 V O m JZ .r .-E -P-O-P . - L n ra
w L V) c v mvr a,= o E 5 > nq7 ., r a Q m z m -LrpaJ O E V , r n Q U ~ O ~ O ~ L vl . 7 - E 3 4 J U v r ~ O
n m L . 7 3 m r C 1 - P . r a r b w r cn v m a c r

INSTRUMENTATION
The instrumentation in the USGS seismograph network is illustrated in the block diagram in Figure 2. Data from each seismometer are telemetered to the NOAA Alaska Tsunami Warning Center in Palmer. The standard equipment at each field station includes a vertical seisrnorneter with a natural frequency of 1.0 Hz (Mark Products, Model L-4), a package consisting of an amplifier and a voltage- controlled oscillator (VCO model NCER 202, or AlVCO) and "air-cell" storage batteries (McGraw-Edison, Model ST-2-1000). The recently developed AlVCO units (Rogers and others, 1980) have been installed at nearly a1 1 of the USGS stations in southern Alaska. These crystal-referenced units have an automatic gain-ranging capability and provide daily information on the gain setting, geophone response, battery voltage, station identification, and temperature. Data are telemetered via a combination of leased telephone circuits (some of which are relayed by satellite and have a -0.30 sec. delay) and VHF (162-174 MHz) radio links. The radio equipment consists of low-power transmitters (100 mW) and receivers adapted from HT-200 Motorola handie-talkie transceivers. Yagi antennae with 9 db directional gain (Scala, Model CAS-150) are used. At some sites where AC power is avai 1 able, base-station radio receivers (G.E. Model R46AP66B) with greater sensitivity and re1 iabi 1 ity are used. The central recording facility incorporates a bank of discriminators (NCER JlOl or Develco Model 6203), four 16 mm-film multi-channel oscillographs (Teledyne Geotech Develocorder, Model 40000), a 14-channel analog tape recorder (Bell and Howell Model VR3700B), and a time-code generator (Datum, Model 9100).
The principle of operation is as follows: The seismometer translates movement of the ground into an electrical voltage that is fed into the amplifier/VCO unit where the amplified voltage causes the frequency of an audio-band oscillator to fluctuate about its center frequency. The frequency-modulated (FM) tone from the amplifier/VCO unit is carried directly by voice-grade telephone circuit to the recording site or alternately is fed through a VHF radio link onto a telephone circuit. At the recording site the FM seismic signal is demodulated by a discriminator. The demodulated signal, which is simply an amplified form of the initial signal from the seismometer, is recorded photographically on a multichannel osci 1 lograph, together with time marks from a crystal-controlled chronometer. Twenty-four hours o f data for 18 stations can be recorded on a single 43 m-long roll of 16-mm film.
Signals from more than one seismograph can be transmitted on a single telephone circuit by employing VCO units with different center frequencies. In the standard configuration there is a 340 Hz separation between center frequencies and a fixed bandwidth of 250 Hz. Up to eight seismic channels with center frequencies ranging from 680 to 3,060 Hz may be placed on a single voice-grade telephone circuit.
Figure 3 illustrates the response characteristics of the entire seismic system from seismometer to film viewer. The response level at each station i s adjusted in steps of 6 decibels so that the ambient seismic noise produces a small deflection o f the trace on the film. As a result, the actual response f o r an individual station may differ from that of the typical station by a factor of 2, 4, 8, etc. The magnification of the typical station is about 6 x 10⁴ at 1 Hz and 106 at 10 Hz. The gain of a station that has an AlVCO unit is automatically reduced by a factor of 10 when the fluctuations of the FM signal exceed a preset threshold.

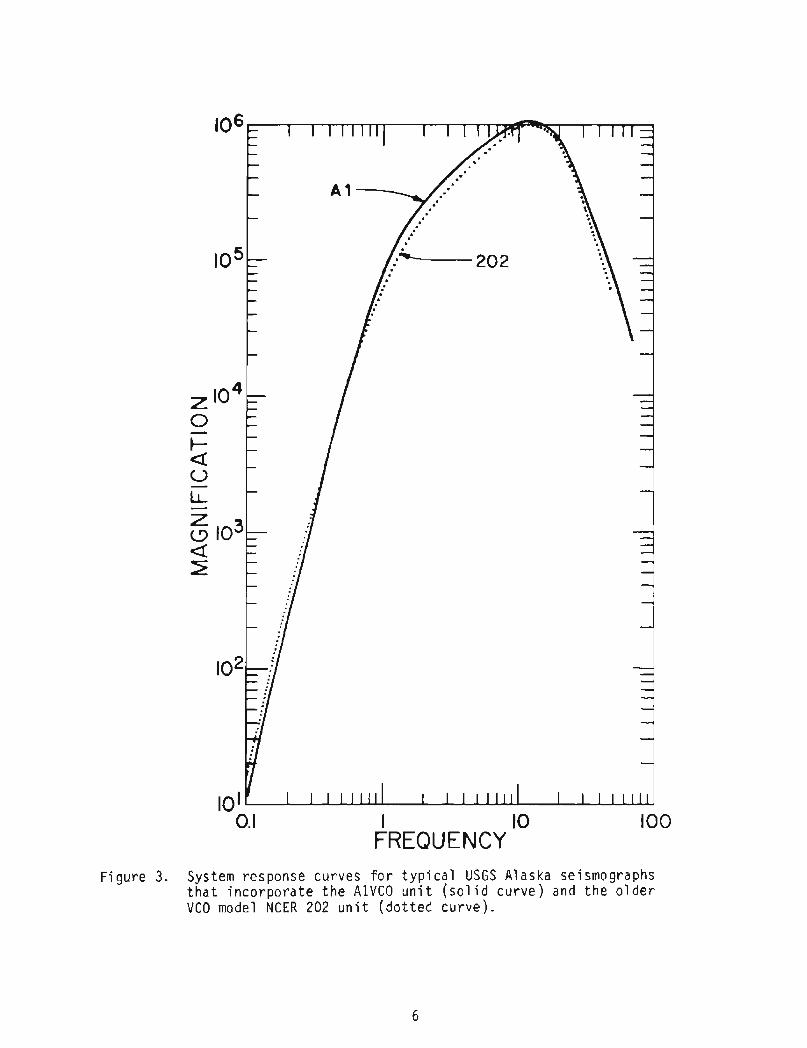
F i g u r e 3. System response cu rves f o r t y p i c a l USGS A1 aska seismographs t h a t i n c o r p o r a t e t h e A l V C O u n i t (sol i d c u r v e ) and t h e o l d e r VCO model NCER 202 u n i t ( d o t t e d c u r v e ) .

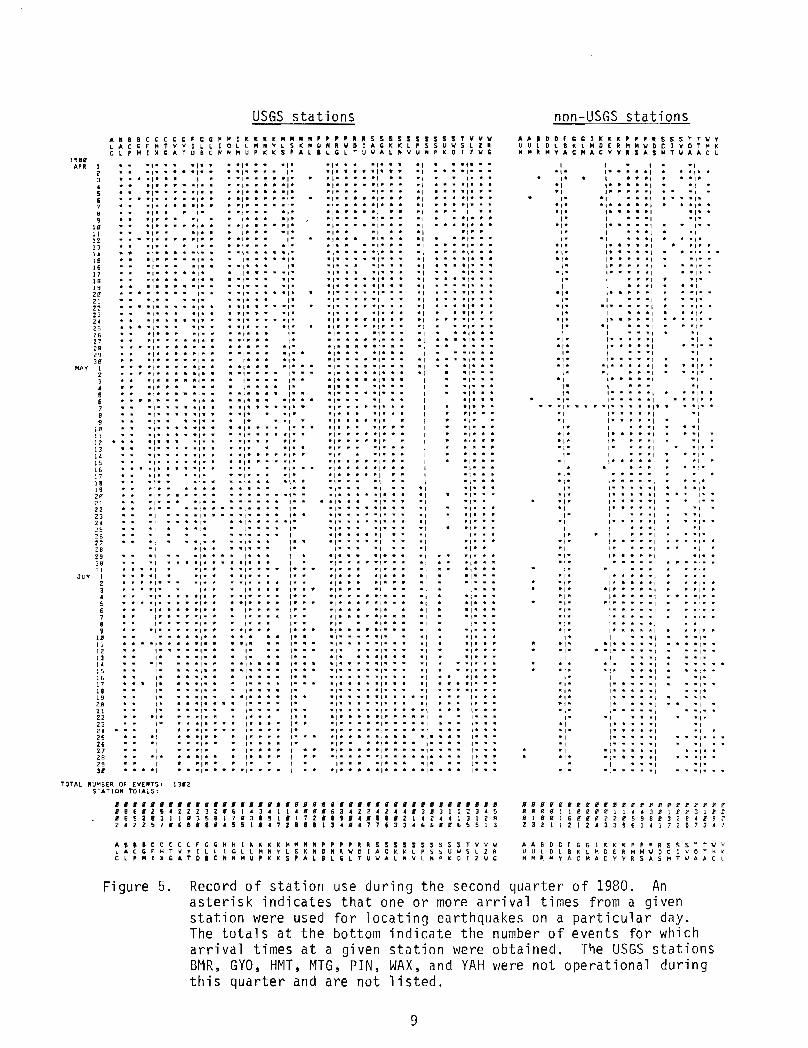
The installation of a typical radio-linked station is shown in Figure 4. Degradation or interruption of data transmission due to inclement weather conditions is a major problem during the winter months. Some indication of the operational reliability of the USGS stations can be inferred from the plot of station use in Figure 5.
DATA PROCESSING
The 16-mm films (four per day) are mailed weekly from Palmer to Menlo Park where the seismic data are processed by the following multi-step routine:
1. Scanning. The scan film, which has 18 stations distributed throughout the network is scanned to identify and note times of all seismic events whether of local, regional, or teleseismic origin.
2. Timing. For the nwell-recorded" local earthquakes identified in the scanning process, the following data are read from each station: P- and S - wave arrival times, direction of first motion, duration of signal in excess of a given threshold amplitude, and period and amplitude of maximum recorded signal. The criterion for choosing earthquakes to be timed is the duration of the signal, which is related to the magnitude. The network is divided into three regions--western, central and eastern-- bounded approximately by longitudes 156O and 150' W., 150" and 145' W., and 145O and 138" W., respectively. In the western and central regions, only events with signal durations longer than 80 s and 20 s, respectively, are timed. In the eastern region, all earthquakes which are recorded by at least three stations and for which at least four clear arrivals can be read are timed. This criterion was established to select from the large number of earthquakes recorded by the network those shocks that are of greatest interest to current research objectives.
Timing is done by projecting the seismic traces onto a table and digitizing the onsets of the P- and S-phases. The output from the digitizer, in the form of x-y data pairs on punched computer cards, is converted into phase data by computer using the program DIGIT3 (written by P. Ward and W. Ellsworth for use within the U.S. Geological Survey).
3. Initial computer processing. The phase data from the films is batch processed by computer using the program HYPOELLIPSE (Lahr, 1980) to obtain origin times, hypocenters, magnitudes and, if desired, first-motion plots for fault-plane solutions.
4. Analysis of initial computer results. Each hypocentral solution is checked for traveltime residuals greater than or equal to 0.75 seconds and for a poor spatial distribution of stations. Arrival times that produce large residuals are re-read. For shocks with a poor distribution of stations, readings from additional stations outside the USGS network are sought.
5. Final computer processing. The poor hypocentral solutions are rerun with corrections and the new solutions are checked for large residuals that might be due to remaining errors. Corrections are made as required before the final computer run is made.
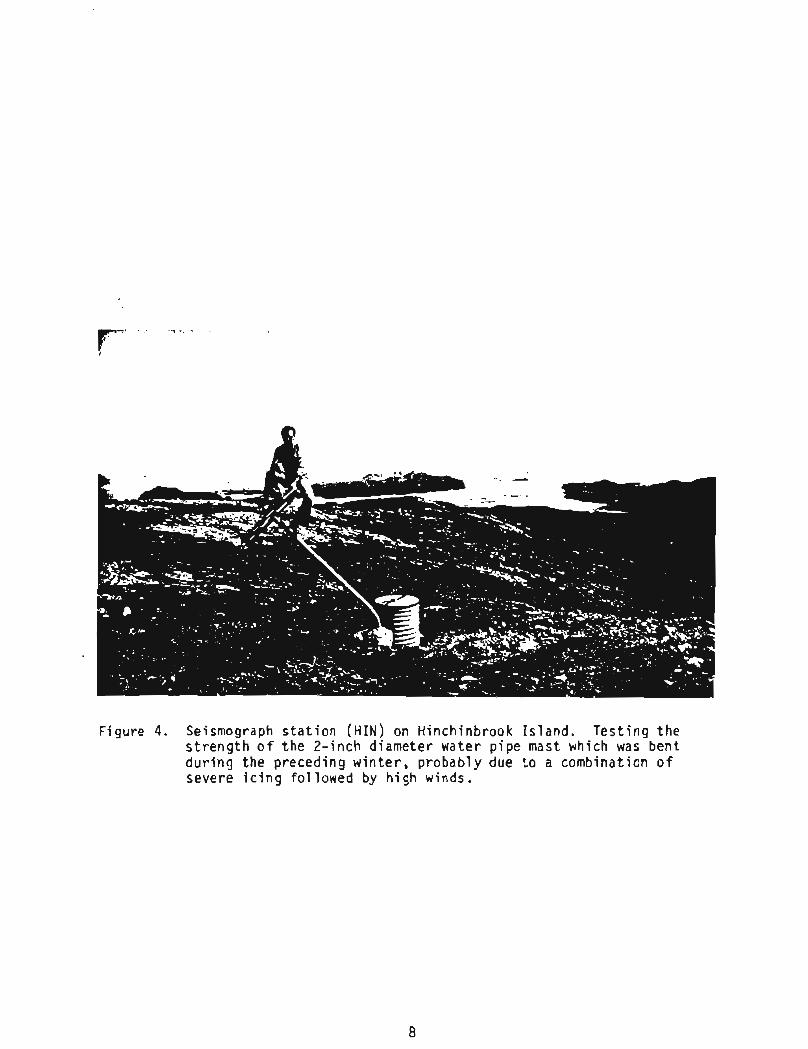
Figure 4. Seismograph s t a t i o n (HIN) on Hinchinbrook Is land. Tes t i ng t h e s t r e n g t h o f t h e 2- inch diameter water p ipe mast which was bent du r i ng the preceding w in te r , probably due t o a combination o f severe i c i n g fo l lowed by h igh winds.
The earthquake l o c a t i o n s a re based on P and S a r r i v a l s , S a r r i v a l s a re impor tan t f o r de te rmin ing ep i cen te rs o f shocks ou t s i de t h e network and depths of events i n t h e Ben io f f zone beneath t h e network i n Cook I n l e t . Un fo r tuna te ly f o r some l a r g e events, S cannot be read a t any s t a t i o n because t h e t r a c e s on t h e f i l m ove r l ap each o t h e r o r a re t o o f a i n t t o f o l l o w .
The HYPOELLIPSE computer program determines hypocenters by m in im iz i ng d i f f e r e n c e s between observed and computed t r a v e l t i m e s through an i t e r a t i v e least -squares scheme. I n many respec ts t h e program i s s i m i l a r t o HYPO71 (Lee and Lahr, 1972), which has been used i n t h e p repa ra t i on o f ca ta logs o f c e n t r a l C a l i f o r n i a earthquakes s i nce January 1969. An impor tan t f e a t u r e a v a i l a b l e i n HYPuELLIPSE i s t h e c a l c u l a t i o n o f conf idence e l l i p s o i d s f o r each hypocenter. The e l l i p s o i d s p rov ide va luab le i n s i g h t i n t o t h e e f f e c t o f network geometry on p o s s i b l e hypocent ra l e r r o r s .
VELOCITY MODELS
Our exper ience w i t h l o c a t i n g earthquakes i n southern Alaska suggests t h a t s i g n i f i c a n t l a t e r a l v a r i a t i o n s a re p resen t i n t h e v e l o c i t y s t r u c t u r e across t h e network. Such v a r i a t i o n s migh t be expected f rom t h e compl icated geology and t e c t o n i c s o f t h e reg ion (e.g., P la f ke r , 1967). Very l i t t l e i n f o r m a t i o n i n t h e form o f d i r e c t measurement i s a v a i l a b l e f o r t h e v e l o c i t y s t r u c t u r e i n southern Alaska. I n p rev ious cata logs, o n l y two P-wave v e l o c i t y models c o n s i s t i n g o f h o r i z o n t a l l a y e r s of cons tan t v e l o c i t y were used t o l o c a t e t h e earthquakes ( e . g . , Stephens, and others , 1979). These v e l o c i t y models were de r i ved by m in im iz i ng t h e t r a v e l t i m e r e s i d u a l s f o r se lec ted s e t s o f earthquakes i n t h e Cook I n l e t r e g i o n (Model A o f Matumoto and Page, 1969) and near Valdez. The models proved adequate f o r l o c a t i n g earthquakes as f a r eas t as Kayak I s l and , b u t earthquakes l oca ted f a r t h e r t o t h e eas t o f t e n had l a r g e t r a v e l t i m e r e s i d u a l s a t nearby s t a t i o n s . An improved v e l o c i t y model f o r t h e r e g i o n eas t o f Kayak I s l a n d was developed by m in im iz i ng t h e t r a v e l t i m e r e s i d u a l s f o r a se lec ted s e t o f a f tershocks from t h e 1979 S t . E l i a s earthquake t h a t occurred n o r t h o f I c y Bay (Stephens, and others , 1980). A s i g n i f i c a n t d i f f e r e n c e between t h i s model and t he e a r l i e r ones i s t h a t t h e new model c o n s i s t s o f a s i n g l e l a y e r o f l i n e a r l y i nc reas ing v e l o c i t y over a ha l f -space o f cons tan t v e l o c i t y , whereas t h e e a r l i e r models c o n s i s t o f severa l h o r i z o n t a l l a y e r s o f cons tan t v e l o c i t y .
I n t h e p repa ra t i on o f t h i s ca ta log , t h e method o f ass ign ing v e l o c i t y models t o c a l c u l a t e t h e o r e t i c a l t r a v e l t i m e s t o var ious s t a t i o n s i s d i f f e r e n t f r om t h a t used i n some e a r l i e r ca ta logs . Prev ious ly , t h e v e l o c i t y model used was determined by t h e r e g i o n i n which t h e earthquake occurred and would then be t he same f o r a l l s t a t i o n s f o r t h a t event. I n t h e r e v i s e d procedure, each s t a t i o n always uses t h e same v e l o c i t y model, and t h e model used i s determined by t h e r e g i o n i n which t h e s t a t i o n i s locatea. Thus, a s t a t i o n i n t h e eas te rn r e g i o n w i l l use t h e eas te rn v e l o c i t y model t o c a l c u l a t e t r a v e l t i m e s f rom events t h a t occur i n t he western, c e n t r a l , and eas te rn p a r t s o f t h e network.
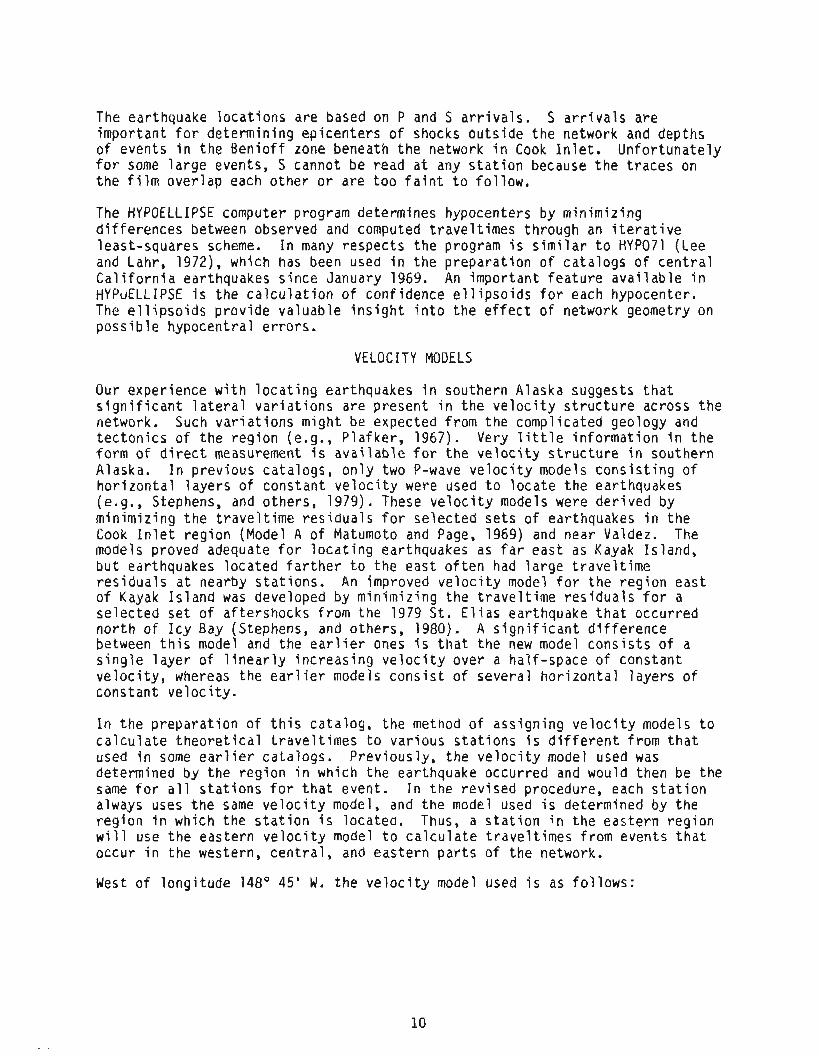
West o f l ong i t ude 148O 45' W. t h e v e l o c i t y model used i s as f o l l o w s :

Layer Depth (km) P velocity (krnlsk
0 - D D - 4 4 - 10 10 - 15 15 - 20 20 - 25 25 - 33 33 - 47 47 - 65 below 65
The thickness, D, of the first layer is allowed to vary between stations to account for the presence of thick sections of low-velocity sediments beneath the stations NKA and NNL, which are located in the Cook Inlet basin. For these stations D is 4 krn. For all other stations D is 0.01 km. It is recognized that a model comprised of uniform horizontal layers may be a poor representation of the actual velocity structure, particularly in the vicinity of a subduction zone (Mitronovas and Isacks, 1971; Jacob, 1972), although such a model does have the advantage of simplifying the computation of traveltimes. In order to determine any bias that might result from this approximation, a set of events in the Benioff zone below Cook Inlet was relocated using a ray- tracing program of E. R. Engdahl that incorporates a more realistic, three- dimensional velocity model (Lahr, 1975). Hypocenter shifts, apparently due to the oversimplified flat-layer model, ranged from near zero at a depth of 60 km to as great as 25 km at the 160 km depth. The offsets were oriented in such a way that the dip of the Benioff zone would appear to be too great for locations based on a flat-layered model.
For earthquakes that occur between longitudes 148' 45' W. and 144" 30' W., the velocity model used to locate the events is:
Layer Depth (km) P velocity (km/s)
East of longitude 144' 30' W. the P-wave velocity of the first layer increases linearly from 5.0 km/s at the surface to 7.8 km/s at 32 km depth, while the half-space has a velocity of 8.2 km/s.
P-phase traveltime delays are applied to stations i n the network that have consistent and large residuals for the locations of large groups of earth- quakes. Each station has three delays (DLY1, DLY2, and DLY3 of Table 1) assigned to it that correspond to the western, central, and eastern regions convered by the network. The particular delay that is used to locate an earthquake is determined by the region in which the earthquake occurs. For example, a station near Icy Bay that is used to locate an earthquake beneath Cook Inlet will be assigned a delay DLY1, but the same station will use DLY3 to locate an earthquake that occurs beneath Icy Bay. Additional delays are applied at several stations to correct for a satellite link in the relay o f the

s igna l . S-phase delays a re determined by m u l t i p l y i n g t h e P-delay by 1.78, t h e P t o S v e l o c i t y r a t i o .
The i n i t i a l t r i a l depths f o r earthquakes which occur i n t h e western, c e n t r a l , and eas te rn p a r t s o f t h e network a re 75, 30, and 15 km, r espec t i ve l y , and r e f l e c t a p rogress ive decrease i n t h e range o f depths o f earthquakes f r o m west t o east.
MAGNITUDE
Magnitudes a re determined f r om e i t h e r t h e s i g n a l d u r a t i o n o r t h e maximum t r a c e ampl i tude. Eaton and o the rs (1970) approximate t h e R i c h t e r l o c a l magnitude, whose d e f i n i t i o n i s t i e d t o maxirnu~n t r a c e ampl i tudes recorded on s tandard h o r i z o n t a l Wood-Anderson t o r s i o n seismographs, by an ampl i tude magnitude based on maximum t r a c e ampl i tudes recorded on high-gain, h igh- f requency v e r t i c a l seismographs such as those operated i n t h e Alaskan network. The ampl i tude magnitude XMAG used i n t h i s c a t a l o g i s based on t h e work o f Eaton and h i s co-workers and i s g iven by t h e express ion (Lee and Lahr, 1972)
XMAG = l o g l o A - 61 + ~ 2 1 o g l 0 ~ ~
where A i s t h e equ i va len t maximum t r a c e ampl i tude i n m i l l i m e t e r s on a s tandard Wood-Anderson seismograph, D i s t h e hypocent ra l d i s t ance i n k i lometers, and B1 and 62 a re constants . D i f f e rences i n t h e f requency response o f t h e two seismograph systems are accounted f o r i n A. I t i s assumed, however, t h a t t h e r e i s no systemat ic d i f f e r e n c e between t h e maximum h o r i z o n t a l ground mot ion and t h e maximum v e r t i c a l mot ion. The terms -61 + ~ ~ 1 0 ~ ~ ~ ~ 2 approximate R i c h t e r ' s -loglOAo f u n c t i o n (R i ch te r , 1958, p. 342), which expresses t h e t r a c e ampl i tude f o r an earthquake o f magnitude zero as a f u n c t i o n o f e p i c e n t r a l d is tance .
Fo r smal l , sha l low earthquakes i n c e n t r a l Ca l i f o rn i a , Lee and o the rs (1972) express t h e d u r a t i o n magnitude FMAG a t a g iven s t a t i o n by t h e r e l a t i o n
FMAG = -0.87 + 2.00 l o g l o T + 0.0035 DEL ( 2 )
where T i s t h e s i g n a l d u r a t i o n i n seconds f r om t h e P-wave onset t o t h e p o i n t where t h e peak-to-peak t r a c e ampl i tude on t h e Geotech Model 6585 f i l m v iewer f a l l s below 1 cm and DEL i s t h e e p i c e n t r a l d i s t ance i n k i l ome te rs .
Comparison o f XMAG and FMAG es t imates from equat ions (1 ) and ( 2 ) f o r 77 Alaskan shocks i n t h e depth range 0 t o 150 km and i n t h e magnitude range 1.5 t o 3.5 r evea l s a systemat ic l i n e a r decrease of FMAG r e l a t i v e t o XMAG w i t h i n c r e a s i n g f o c a l depth. To remove t h i s discrepancy, a l i n e a r dependence on depth i s added t o t h e express ion f o r FMAG as f o l lows:
FMAG = -1.15 + 2.00 l o g l o T + 0.007 Z + 0.0035 DEL ( 3 )
where Z i s t h e f o c a l depth i n k i l ome te rs .
The magnitude p r e f e r e n t i a l l y assigned t o each earthquake i n t h i s c a t a l o g i s t h e FMAG est imate. The XMAG va lue i s used o n l y where no FMAG can be determined.

ANALYSIS OF QUALITY
Two types of errors enter into the determination of hypocenters: systematic errors 1 imi ting the accuracy of hypocenters and random errors 1 imi ting the precision. Systematic errors arise f rom an incorrect velocity model, misidentification of phases, or systematic timing errors and can be evaluated through controlled experiments such as locating the coordinates of a known explosion. Random errors result from random timing errors and are estimated f o r each earthquake through the use of standard statistical techniques.
For each earthquake, HYPOELLIPSE calculates the lengths and orientations of the principal axes of the joint confidence ellipsoid. The one-standard- deviation confidence ellipsoid describes the region of space within which one is 68 percent confident that the hypocenter lies, assuming that the only source of error is random reading error. The ellipsoid is a function of the station geometry for each individual event, the velocity model assumed, and the standard deviation of the random reading error. The standard deviation determined from repeated readings of the same phases by four seismologists is as small as 0.01 to 0.02 s for the most impulsive arrivals and as large as 0.10 to 0.20 s for emergent arrivals. The confidence ellipsoids are computed for a standard deviation of 0.16 s and therefore likely overestimate the 68 percent confidence regions. The standard deviation of the residuals for an individual solution is not used to calculate the confidence ellipsoid because it contains information not only about random reading errors but also about the incompatibility of the velocity model to the data. Thus, the confidence ellipsoid is a measure of the precision of the hypocentral solution. In a few extreme cases the value calculated for one of the ellipsoid axes becomes very large corresponding to a spatial direction with very great uncertainty. In these cases an upperbound length of 25 km is tabulated.
To fully evaluate the quality of a hypocenter one must consider both the confidence ellipsoid and the root mean square (RMS) residual for the solution. The KMS residual reflects both systematic and random errors, but the random errors are typically much smaller. Hence the RMS residual is primarily a measure of the incompatibility of the velocity model, misinterpretation of phases, and systematic timing errors. Interpretation of the RMS residual may depend upon the location of the earthquake. In areas where the velocity model is incompatible with the real earth, RMS residuals could be large and betray the incompatibility; alternatively, the RMS residuals could be small and not reflect the error in a bad hypocenter. Where the velocity model is compatible, however, a large RMS residual would indicate probable misreadings of phases.
Other parameters provided by HYPOELLIPSE that are useful in evaluating the quality of a hypocentral solution are: GAP, the largest azimuthal separation between stations measured from the epicenter; 03, the epicentral distance of the third closest station; NP, the number of P arrivals used in the solution; and NS, the number of S arrivals used in the solution. If GAP exceeds 180°, the earthquake lies outside the network of available stations and the solution is generally less reliable than for events occurring inside the network.
DISCUSSION OF CATALOG
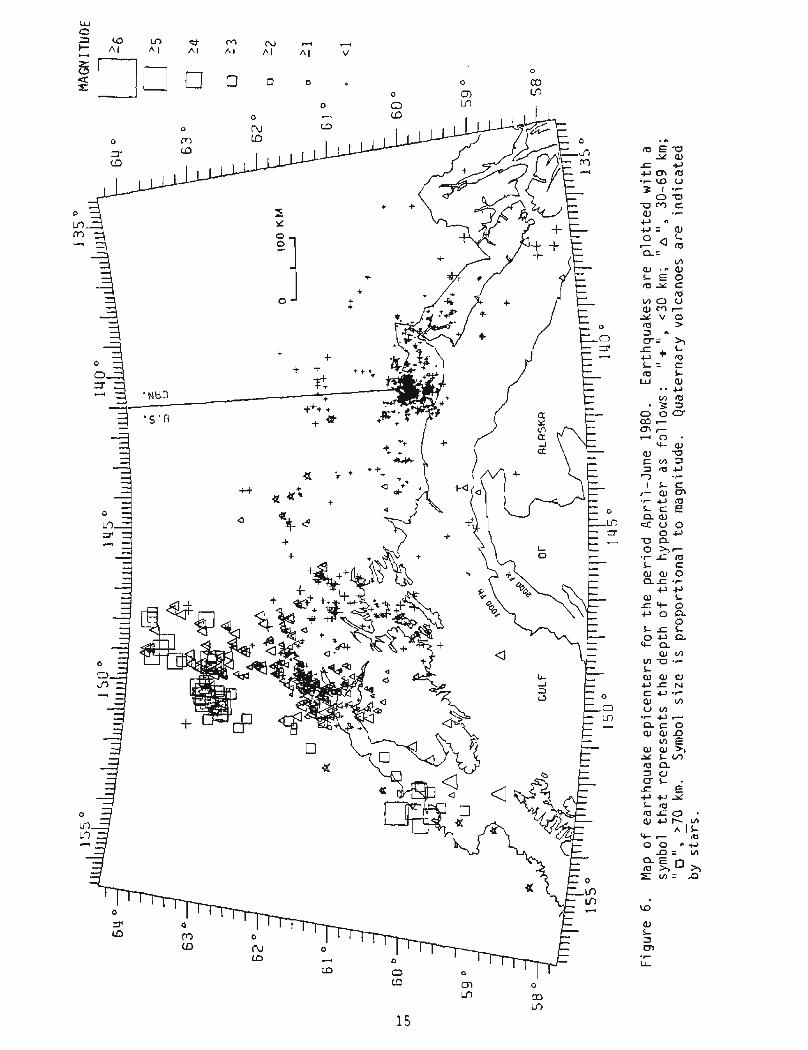
O r i g i n times, f o c a l coordinates, magnitudes, and r e l a t e d parameters f o r 1,302 earthquakes from Apr i l -June 1980 are l i s t e d i n the Appendix. Epicenters f o r these shocks are p l o t t e d i n F igure 6. I n F igure 7, on ly t h e earthquakes w i t h magnitudes greater than 3.5 are p lo t ted . V e r t i c a l sect ions showing t h e depth d i s t r i b u t i o n o f a l l o f t he shocks are presented i n F igures 8 and 9.
We est imate t h a t t h i s ca ta log i s reasonably complete f o r shocks l a r g e r than magnitude 3.5 i n t he western, 2.5 i n t h e cen t ra l , and 2.0 i n t he eastern regions o f the area covered by t h e network. The minimum magnitude o f the l i s t e d earthquakes i s 0.4 f o r c r u s t a l events ( 2 5 3 0 km) and 2.1 f o r Ben io f f zone events deeper than o r equal t o 100 kin.
The p r e c i s i o n o f the hypocenters o r t he r e l a t i v e accuracy o f the l oca t i ons of neighbor ing events i s represented by the conf idence e l l i p s o i d s . The p r e c i s i o n o f epicenters, expressed i n terms o f t he maximum axes o f the p ro jec ted one- s tandard-deviat ion conf idence e l l i p s o i d s (ERH), averages 5.6, 2.2, and 2.5 km, respect ive ly , i n t he eastern, cen t ra l , and western p a r t s o f t h e network. S i m i l a r l y , t he p r e c i s i o n of foca l depth (ERZ) averages about 6.7, 3.6, and 5.1 kin, respect ive ly . The v a r i a t i o n i n the p r e c i s i o n o f hypocenter determinat ion across the network i s s t r o n g l y in f luenced by d i f f e rences i n t he s t a t i o n coverage i n the d i f f e r e n t regions.
The absolute accuracy o f the earthquake l oca t i ons i s d i f f i c u l t t o evaluate i n t he absence o f known explosions. Hypocenter biases equal t o and l a r g e r than the dimensions o f the conf idence e l l i p s o i d s are no t u n l i k e l y f rom t h e over- s i m p l i f i e d v e l o c i t y model assumed i n the prepara t ion o f t h i s catalog.
The dominant f ea tu re i n t he d i s t r i b u t i o n of epicenters i s t he l a r g e number o f af tershocks f rom the 1979 S t . E l i a s earthquake i n southeastern Alaska. A l l of t he af tershocks wi'th b e t t e r c o n t r o l i n t he s o l u t i o n were located a t depths l ess than 30 km, which i s cons i s ten t w i t h the depths found f o r aftershocks i n t he e a r l y p a r t of the sequence (Stephens and others, 1980). I t i s i n t e r e s t i n g t o note t h a t t he aftershocks p l o t t e d here appear t o form s p a t i a l c l u s t e r s s i m i l a r t o those observed i n the e a r l y p a r t of t h e sequence. Two o f the l a r g e s t aftershocks (mb 5.0, PDE) i n t he sequence occurred on June 30, 1980, immediately east o f I c y Bay (F igure 7 ) .
Over 20 earthquakes were loca ted i n t he reg ion o f t he Wrangell volcanoes n o r t h o f about 61' N. near the eastern part o f t he network (F igure 6). S i m i l a r numbers o f events have been loca ted near t h i s reg ion i n e a r l i e r quar te rs o f data. Because the earthquakes occurred outs ide o f t he network the hypocenters are genera l l y poo r l y constrained. For t h i s reason i t i s n o t c l e a r whether the events are occur r ing w i t h i n the c r u s t o r uppermost mantle, o r whether the may be associated w i t h p a r t i c u l a r vo lcan ic centers.
v, w a - w L E O r5Y c
rC1 VlO U aJmr-- A V O la > 3 m w = h


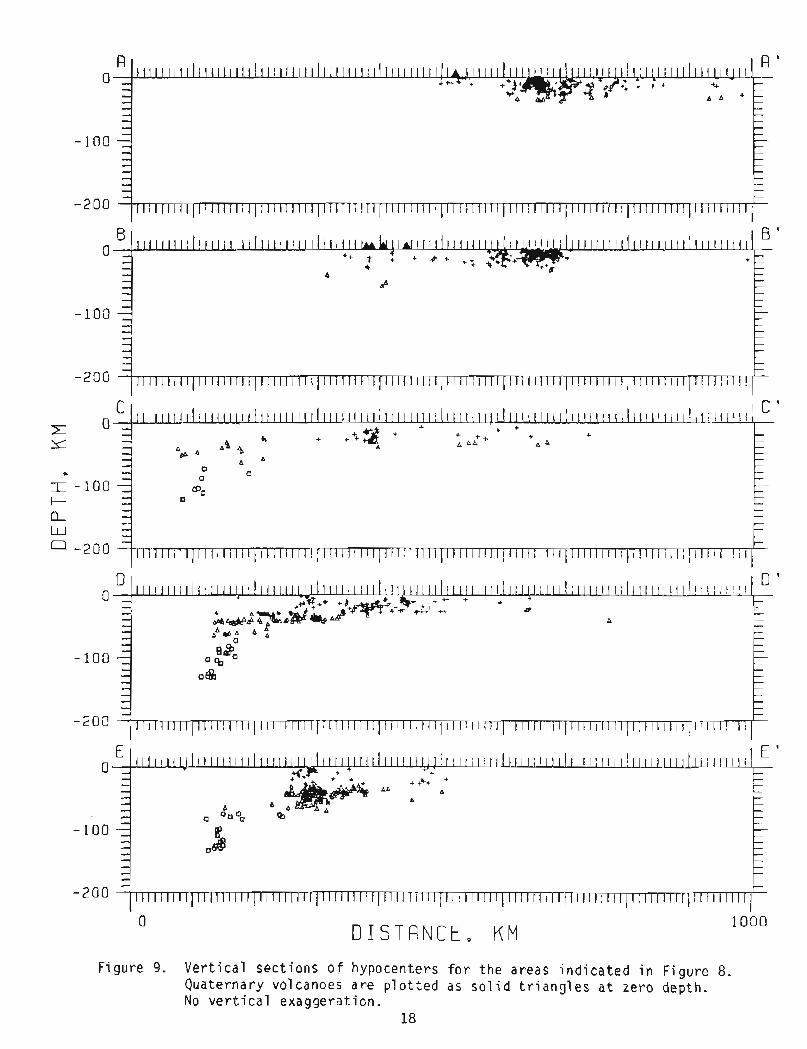
F i g u r e 9. Vertical sec t ions o f hypocenters f o r the areas indicated in F i g u r e 8. Quaternary volcanoes a re p lo t ted as so1 i d t r i a n g l e s a t zero d e p t h . No ve r t i ca l exaggeration.
18
E 0 7 - - - - -
7
- 1 0 0 E - - - - - - - - - 2 0 0
I I I ~ I I I I I I I I I ~ I I I I I I I I I ~ I I I I I I I I ~ ~ I I I ! ~ I I I I ~ I I I I I ! I ~ I ~ I I ~ I ~ ~ ~ I I ~ I I I I I I I I I ~ I I I I I I ~ I ~ I I E ' - ~ ~ ~ ~ ~ l ~ ~ ~ ~ l ~ ~ ~ ~ ~
*A + * ++++ + * +
& A a 0 0 ~ ~ s 0
0 S 1 1 1 1 1 1 1 1 1 1 1 1 1 1 1 1 1 1 1 ~ 1 1 1 1 1 1 1 1 1 ~ 1 1 ~ I I l ~ l I ~ I I ~ I l ~ l l l ~ l ~ l l l l l 1 1 ~ ~ ~ ~ ~ ~ ~ ~ ~ ~ / ~ ~ ~ ~ ~ ~ ~ ~ ~ j ~ ~ ' ~ ~ ~ ~ ~ ~ 1 ~ ~ ~ ~ ~ ~ ~ ~ ~ l
I I I
0 1000 DISTRNCE, K M

Figure 9 . (continued)
Wi th in t h e Yakataga seismic gap, which i s loca ted approximately between Kayak I s l a n d and t h e western l i m i t of t he af tershock zone o f t h e 1979 St . E l i a s af tershock zone, t h e p a t t e r n of s e i s m i c i t y i s s i m i l a r t o t h a t observed i n e a r l i e r quar ters. One i n t e r e s t i n g fea tu re i n t h e s e i s m i c i t y i s a smal l c l u s t e r o f events t h a t occurred o f fshore about 75 km eas t o f Middleton Is land, a t about l a t i t u d e 5 9 O 30' N., l ong i tude 145' W. P re l im ina ry da ta through September 1980 (Stephens and Lahr, 1981) suggest t h a t t h i s c l u s t e r i s p a r t o f a s i g n i f i c a n t l o c a l increase i n s e i s m i c i t y t h a t began i n October 1979.
The s e i s m i c i t y throughout t h e remainder of t he network does n o t vary markedly f rom t h a t descr ibed f o r prev ious quar te rs (Stephens and others, 1979; Fogleman and others, 1978; Lahr, and others, 1974). A we l l -de f ined Ben io f f zone d ips t o t he northwest beneath the Cook I n l e t reg ion (F igu re 9, sec t ions G-J). The depth t o t h e top o f t h i s zone va r i es from about 50 km beneath the western Kenai Peninsula t o about 115 beneath the a c t i v e volcanoes west of Cook I n l e t . The d i p o f t h e B e n i o f f zone appears t o increase f rom nor theas t t o southwest, bu t t he depth t o t he seismic zone beneath t h e a c t i v e volcanoes--Augustine, I l iamna, Redoubt and Spur r - - i s n e a r l y constant a t about 115 km.
A l l o f t h e seismic a c t i v i t y i n t he southern p a r t o f t he network eas t o f l ong i t ude 146' W. occurs a t depths l e s s than about 35 km. The number o f l a r g e r magnitude earthquakes which occur i n t h e eas t i s considerably smal le r than t h a t i n t h e western p a r t o f the network (F igu re 7 ) . Most o f t h e seismic a c t i v i t y i n t h e eastern p a r t of the network appears t o be concentrated beneath I c y Bay and nor theas t o f Kayak Is land.
The contents o f t h e Appendix may be obta ined i n forms amenable t o computer i n p u t (punched cards o r magnetic tape) by con tac t i ng t h e authors.
ACKNOWLEDGMENTS
We thank Robert Eppley, Wayne Jorgensen, and t h e e n t i r e s t a f f o f t h e NOAA Tsunami Warning Center f o r t h e i r ass is tance i n ma in ta in ing our reco rd ing equipment i n Palmer, Alaska, as w e l l as making t h e i r seismic da ta a v a i l a b l e t o US.
We a l so wish t o thank Hans Pulpan, o f t h e Geophysical I n s t i t u t e o f t h e U n i v e r s i t y o f Alaska, f o r a cooperat ive opera t ion o f southern Cook I n l e t seismograph s ta t i ons .
We are indebted t o a l l of those who have spent t ime f a b r i c a t i n g , i n s t a l l i n g , and main ta in ing t h e seismograph network i n Alaska, p a r t i c u l a r l y Greg Condrotte and W i l l i a n Wong.
B e t t y M c I n t i r e and the s t a f f o f t he USGS Anchorage o f f i c e have been o f g rea t ass is tance i n s o l v i n g l o g i s t i c problems, bo th i n t h e f i e l d and i n t h e o f f i c e .
This ca ta log i s pa t te rned a f t e r those prepared f o r c e n t r a l C a l i f o r n i a and we g r a t e f u l l y acknowledge Drs. W. H. K. Lee and R. L. Wesson f o r development of many o f t he pracedures and techniques used here in.
Th is work was supported j o i n t l y by t h e U.S. Geologica l Survey and by the Nat iona l Oceanic and Atmospheric Admin is t ra t ion , under which a mu l t i - yea r program responding t o needs o f pet ro leum development o f t he Alaskan con t i nen ta l s h e l f i s managed by the Outer Cont inenta l She l f Environmental Assessment Program (OCSEAP) O f f i ce .
20
REFERENCES
Eaton, J. P., O ' N e i l l , M. E., and Murdock, J. N., 1970, Af tershocks o f t h e 1966 Parkfield-Cholame, C a l i f o r n i a , earthquake: a d e t a i l e d study, B u l l e t i n o f t h e Seismologica l Soc ie t y of America 60, p. 1151-1197.
Fogleman, K., Stephens, C., Lahr, J. C., Hel ton, S., and A l lan , M., 1978, Cata log o f earthquakes i n southern Alaska, October-December 1977, U.S. Geolog ica l Survey Open-Fi le Repor t 78-1097, 28 p.
Jacob, K. H., 1972, Global t e c t o n i c i m p l i c a t i o n s o f anomalous se ismic P t r a v e l t i m e s f r om t h e nuc lea r exp los ion Longshot, Journal o f Geophysical Research 77, p. 2556-2573.
King, P. B., compi ler, 1969, Tec ton ic Map o f No r th America, U.S. Geo log ica l Survey, sca le 1:5,000,000.
Lahr, J. C., 1975, D e t a i l e d se ismic i n v e s t i g a t i o n of P a c i f i c - N o r t h American p l a t e i n t e r a c t i o n i n southern Alaska, Ph.D. d i s s e r t a t i o n , Columbia U n i v e r s i t y , 141 p .
Lahr, J. C., Engdahl, E. R., and Page, R. A,, 1974, Loca t ions and f o c a l mechanisms o f i n t e rmed ia te depth earthquakes below Cook I n l e t , Alaska, EOS 55, 349 p.
Lahr, J. C., 1980, HYPOELLIPSE/MULTICS: A computer program f o r de te rmin ing l o c a l earthquake hypocentra l parameters, magnitude, and f i r s t mot i o n pa t t e rn , U.S. Geo log ica l Survey Open-Fi le Repor t 80-59, 59 p.
Lee, W. H. K:, and Lahr, J. C., 1972, HYP071: a computer program f o r de te rmin ing hypocenter, magnitude, and f i r s t mot ion p a t t e r n o f l o c a l earthquakes, U.S. Geo log ica l Survey Open-Fi l e Report, 100 p.
Lee, W. H. K., Bennett, R. E., and Meagher, K. L., 1972, A method of e s t i m a t i n g magnitude o f l o c a l earthquakes from s i g n a l dura t ion , U.S. Geo log ica l Survey Open-Fi le Report, 28 p.
Matumoto, T., and Page, R. A., 1969, Microaf tershocks f o l l o w i n g t h e Alaska earthquake o f 28 March 1964: "Dete rmina t ion o f hypocenters and c r u s t a l v e l o c i t i e s i n t h e Kenai Peninsula-Pr ince W i l l i a m Sound area," The P r i nce W i l l i a m Sound, Alaska, Earthquake o f 1964 and Aftershocks, vo ls . 20 & C, U. S . Coast and Geodetic Survey P u b l i c a t i o n 10-3, U.S. Government P r i n t i n g O f f i c e , Washington, D.C., p. 157-173.
Meyers, H., 1976, A h i s t o r i c a l summary o f earthquake ep i cen te rs i n and near Alaska, NOAA Technica l Memorandum EDS NGSDC-1, 57 p.
Mitronovas, W., and Isacks, B. L., 1971, Seismic v e l o c i t y anomalies i n t h e upper mant le beneath t h e Tonga-Kermadec i s l a n d arc, Journal of Geophysical Research 76, p. 7154-7180.
P la f ke r , G., 1967, Geologic map o f t h e G u l f of Alaska T e r t i a r y Province, Alaska, U.S. Geo log ica l Survey Misce l laneous I n v e s t i g a t i o n s Map 1-84, sca le 1:500,000.
R i ch te r , C. F:, 1958, Elementary Seismology, W. H. Freeman and Co., San Franc isco, CA, 768 p.
Rogers, J. A,, Maslak, S., and Lahr, J. C., 1980, A se ismic e l e c t r o n i c system wi th automatic c a l i b r a t i o n and c r y s t a l re ference, U.S. Geo log ica l Survey Open-Fi le Repor t 80-324, 130 p.
Stephens, C. D., and Lahr, J. C., 1981, Seismic s tud ies i n southern and south- eas te rn Alaska, i n W. L. Coonrad, ed., The Un i t ed S ta tes Geo log ica l Survey i n Alaska--Accomplishments du r i ng 1980: U.S. Geo log ica l Survey C i r c u l a r 844, p. 89-93.

Stephens, C. D., Fogleman, K. A,, Lahr, J. C., Helton, S. M., Canc i l la , R. S., Tam, Roy, and Freiberg, J. A., 1980, Catalog o f earthquakes i n southern Alaska, January-March 1980, U.S. Geological Survey Open-File Report 80-1253, 55 p .
Stephens, C. D., Lahr, J. C., Fogleman, K. A,, A l lan , M. A,, and Helton, S. M., 1979, Catalog o f earthquakes i n southern Alaska, January- March 1978, U.S. Geologica l Survey Open-File Report 79-718, 31 p.
Stephens, C. D., Lahr, J. C., Fogleman, K. A., and Horner, R. B., 1980, The S t . E l i as , Alaska, earthquake o f 28 February 1979: reg iona l record ing o f a f tershocks and shor t - te rm pre-earthquake se ismic i ty , B u l l e t i n o f t h e Seismological Society o f America 70, p. 1607-1633.
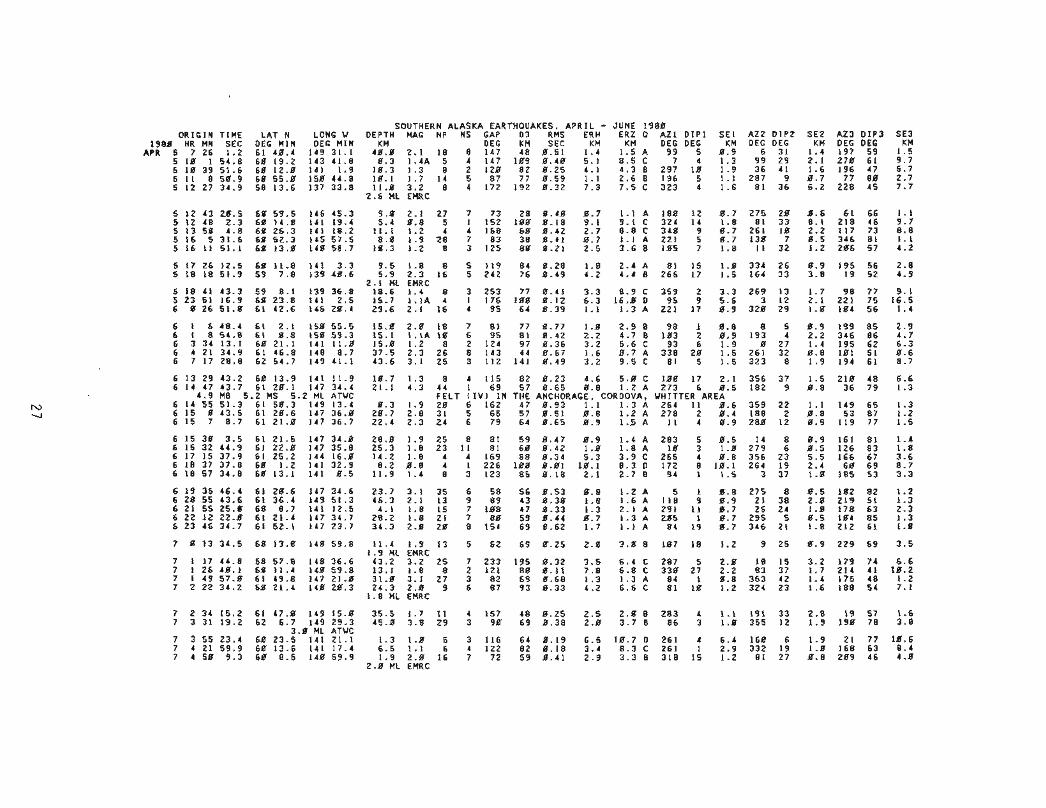
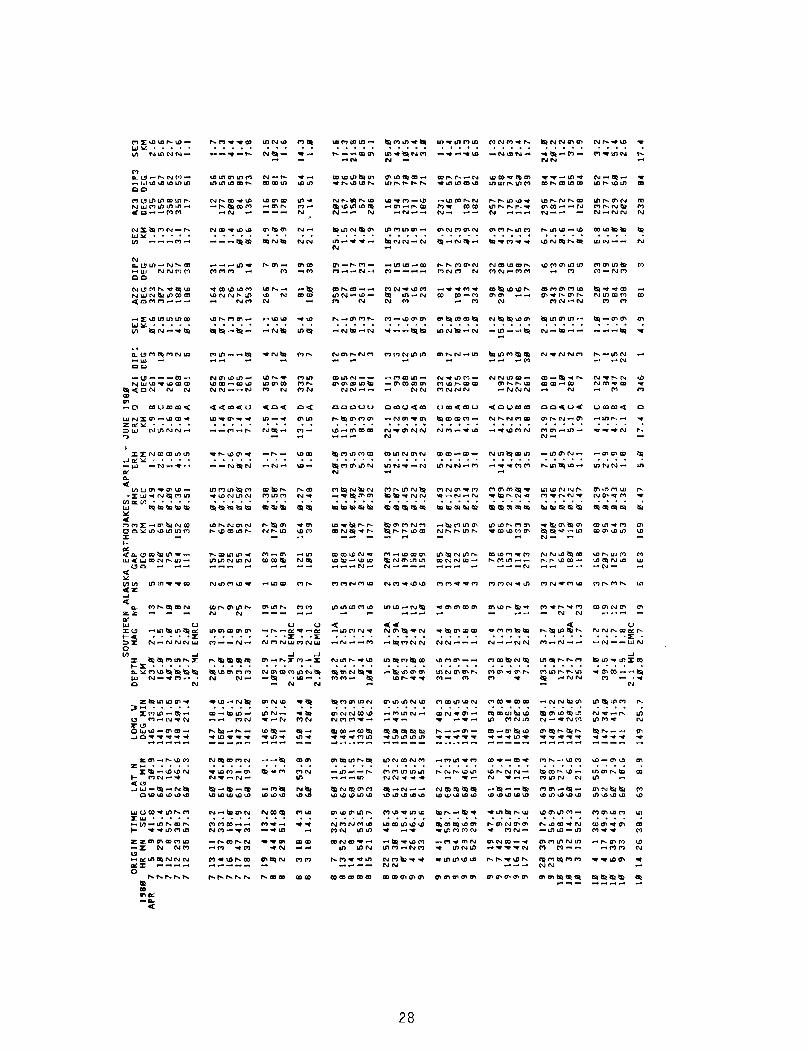
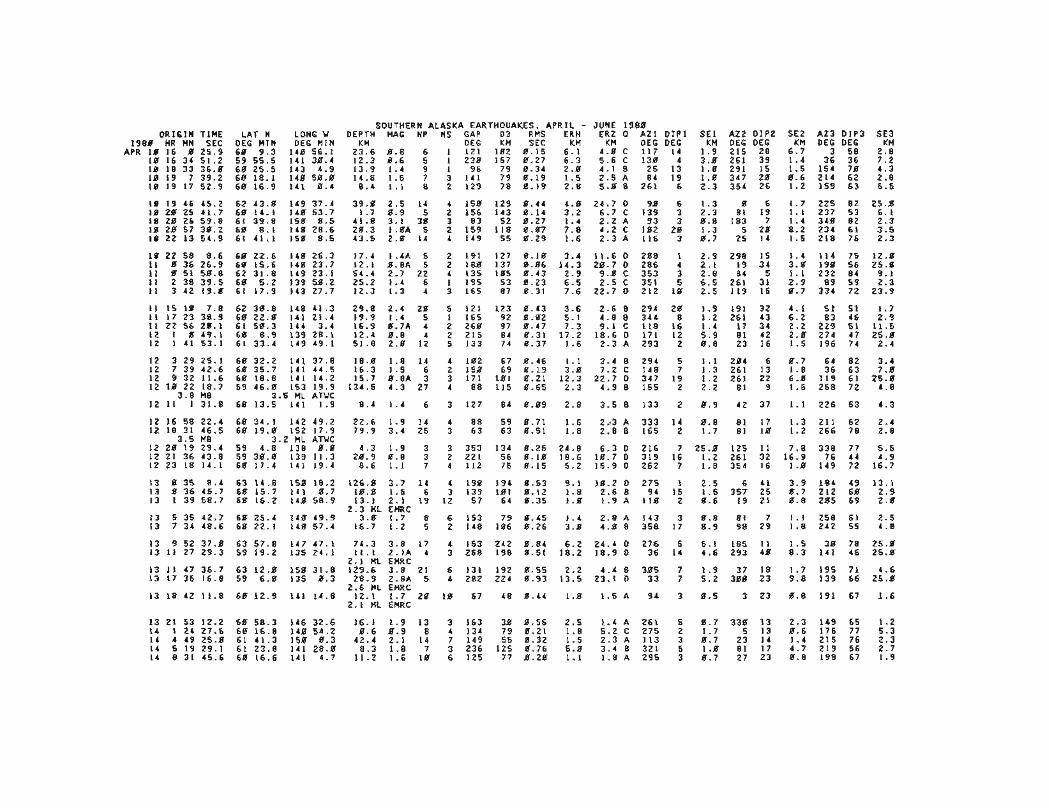
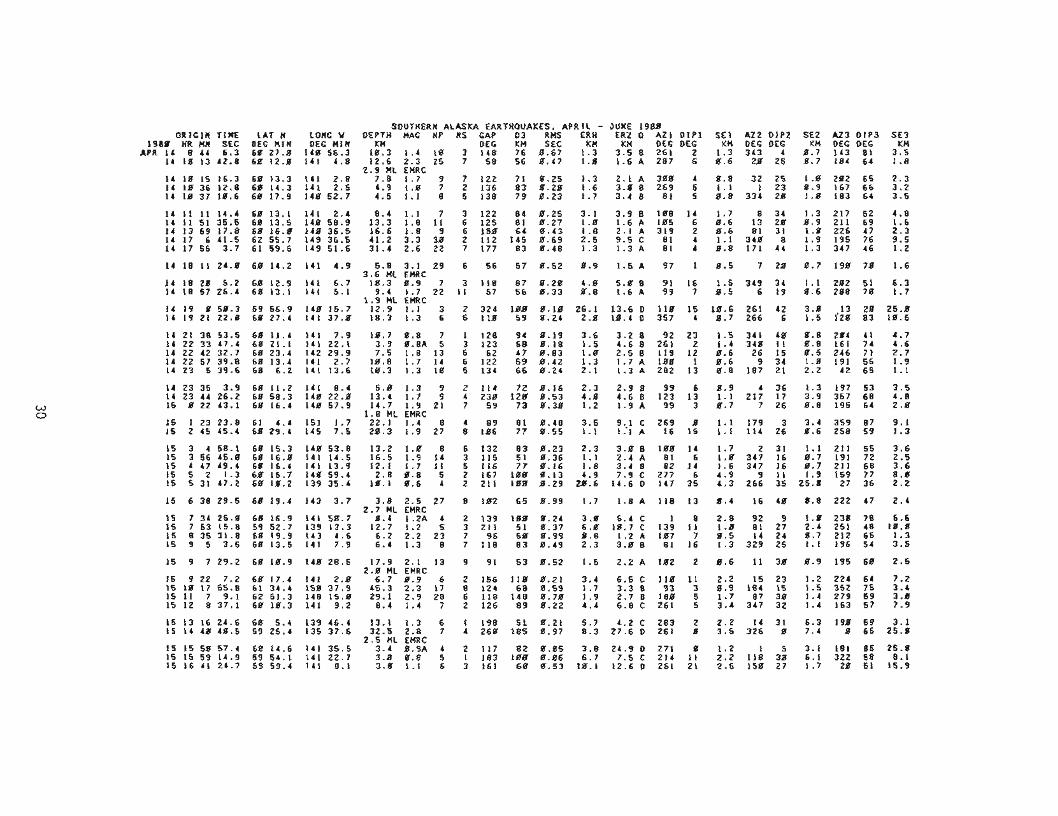
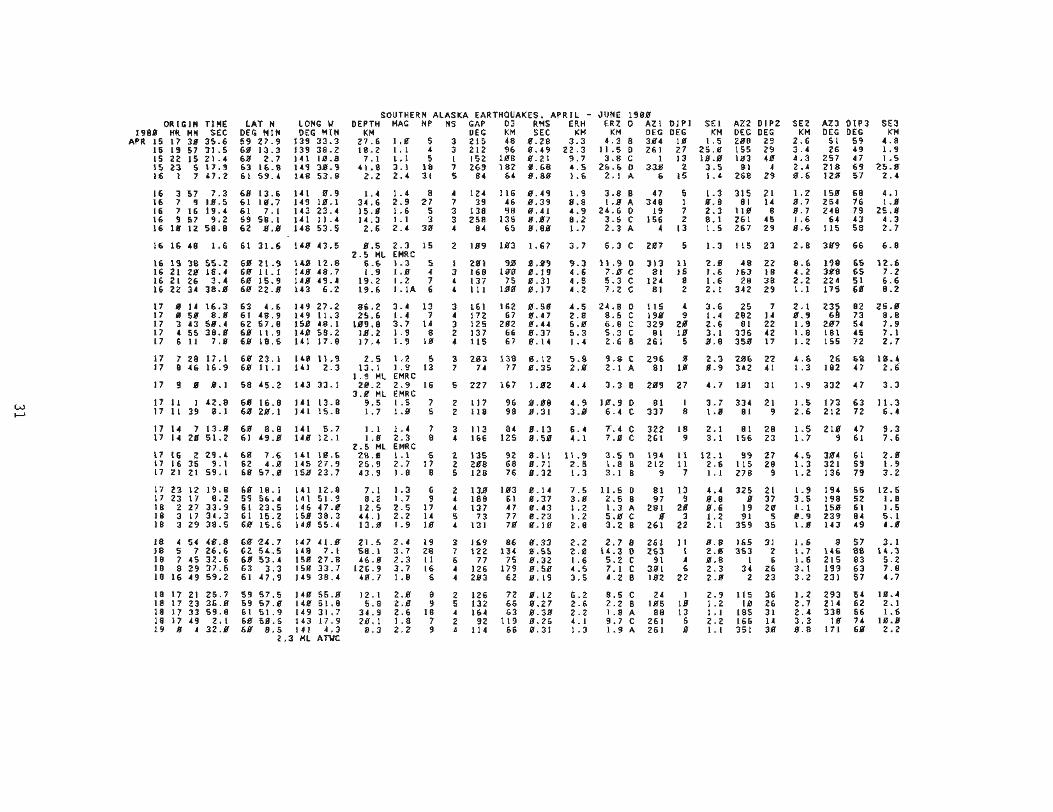
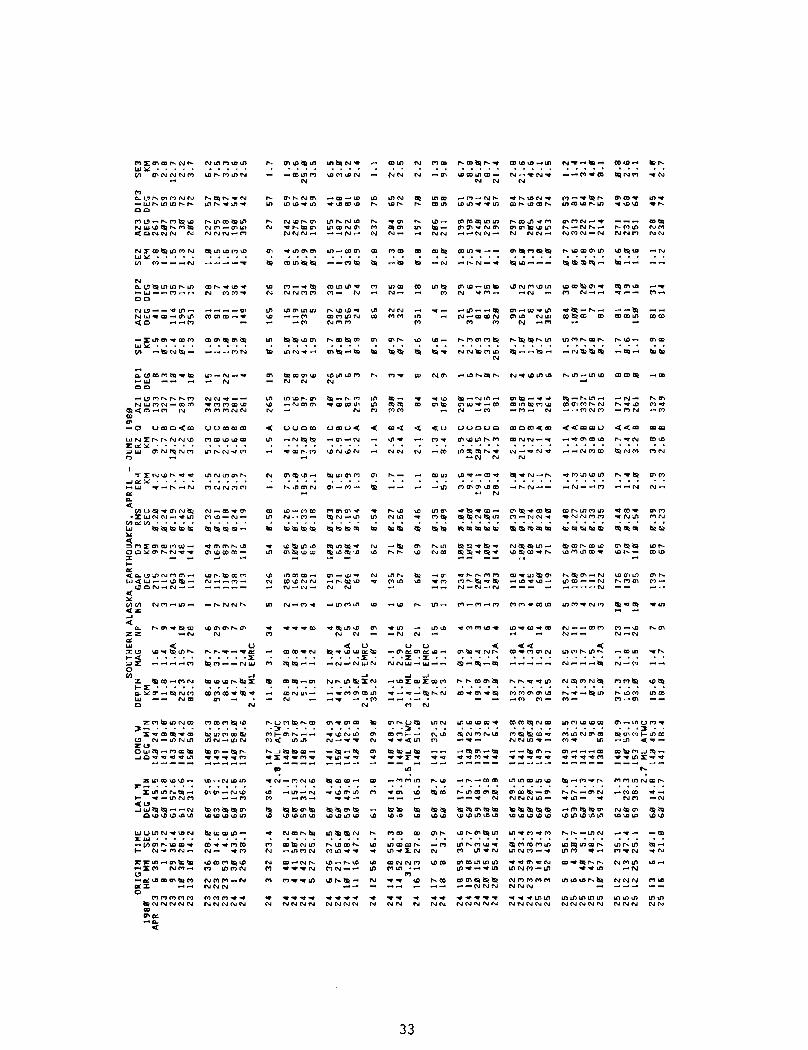
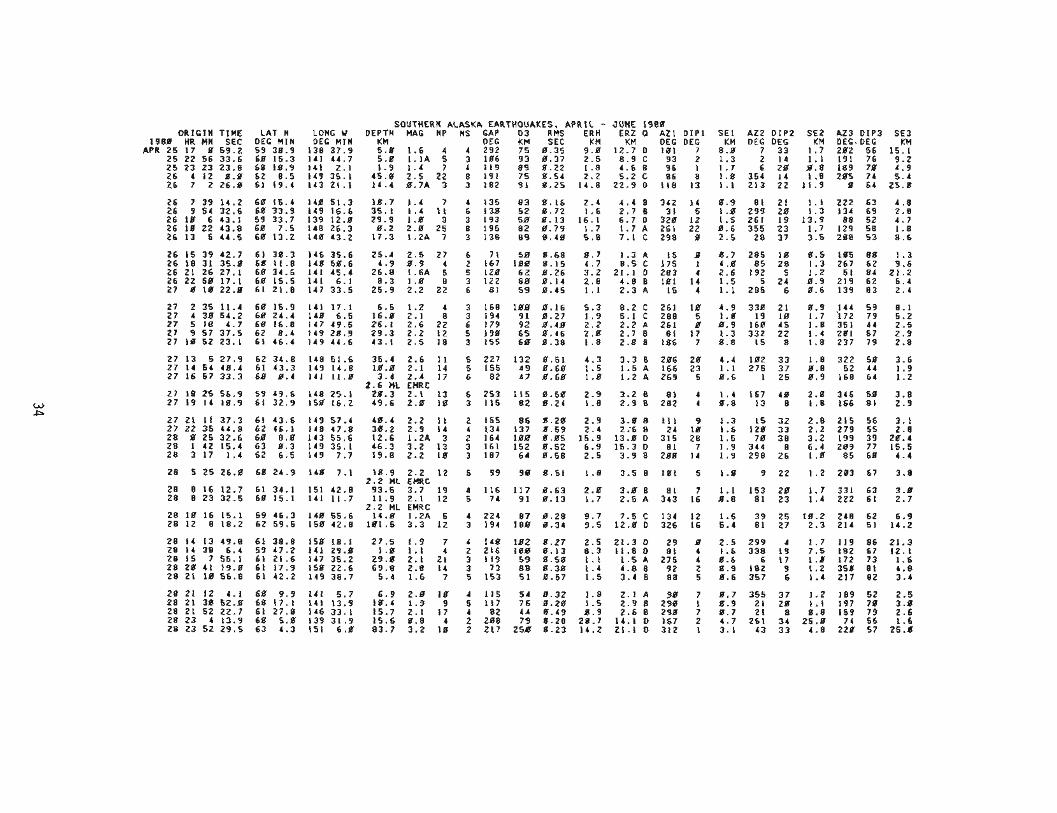
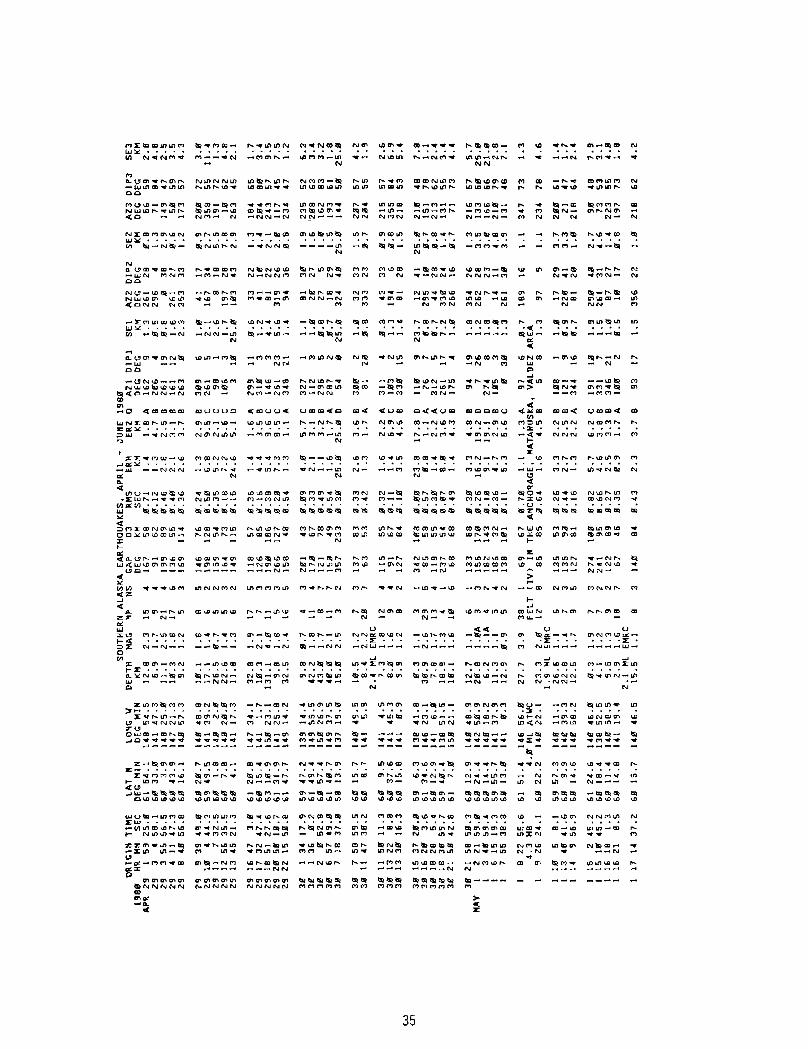
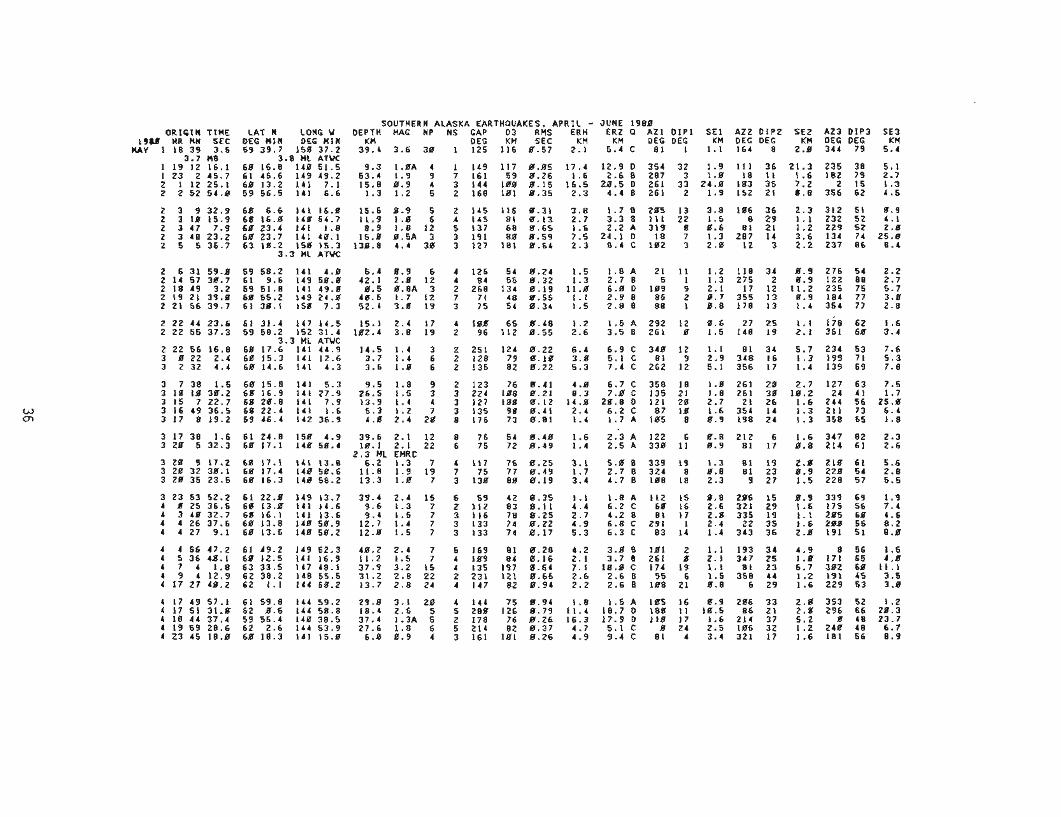
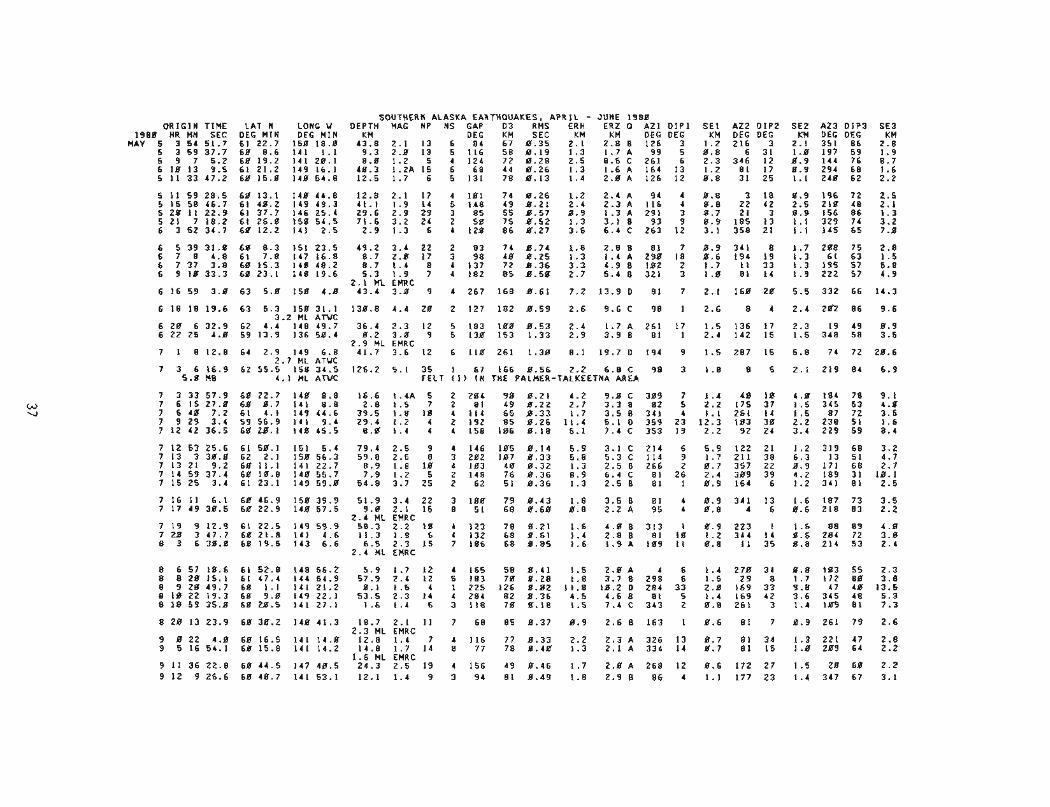
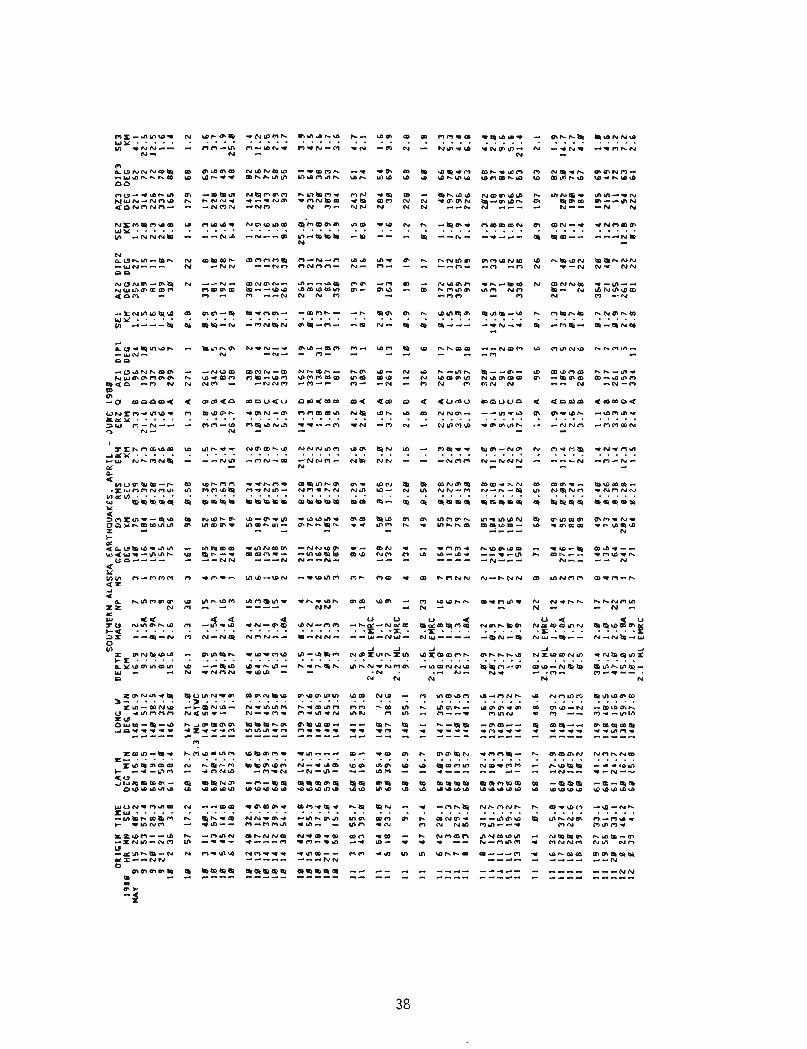
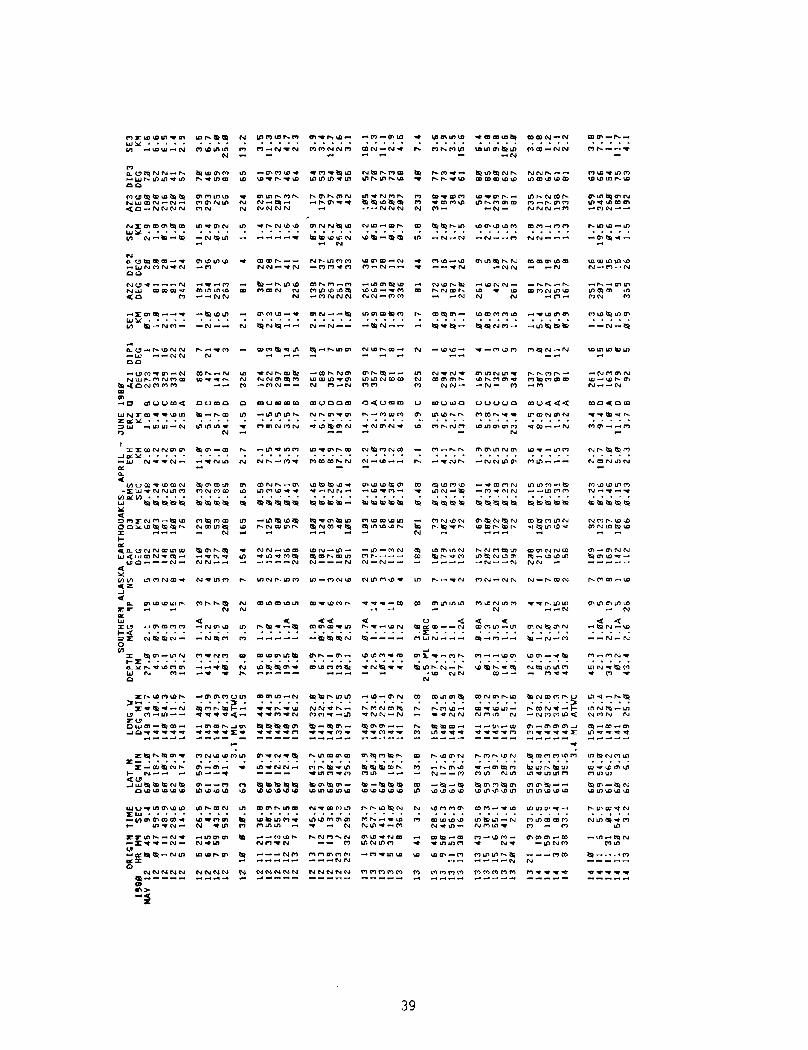
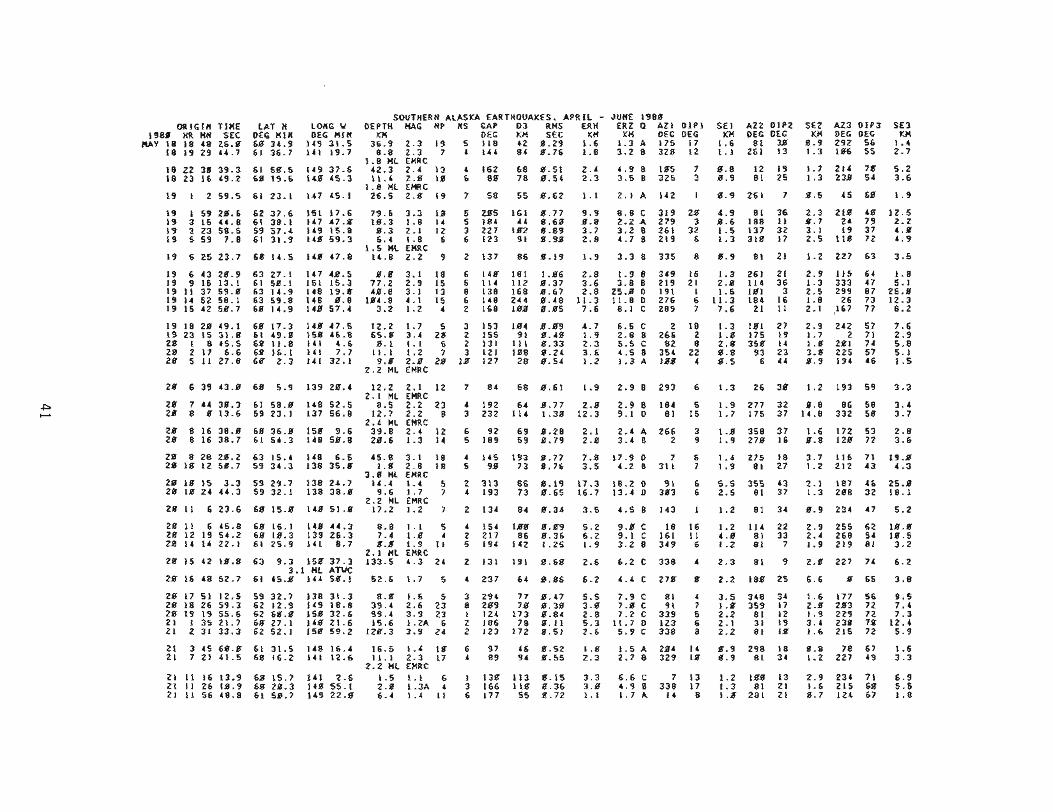
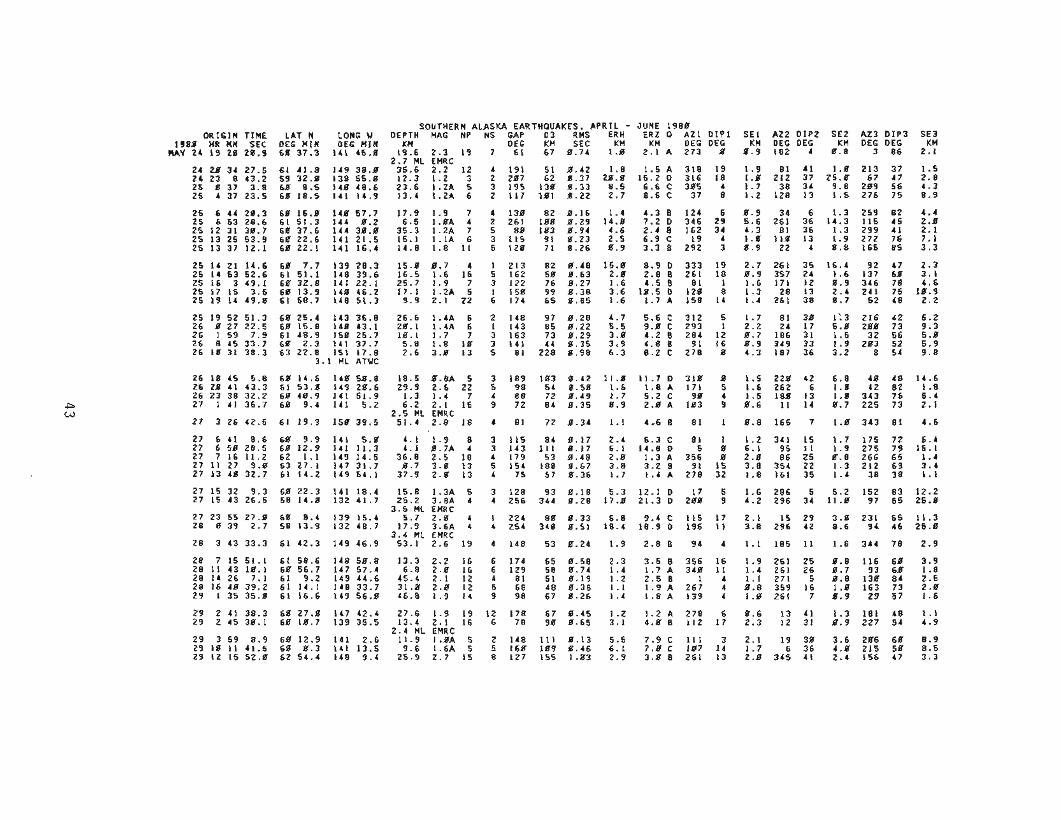
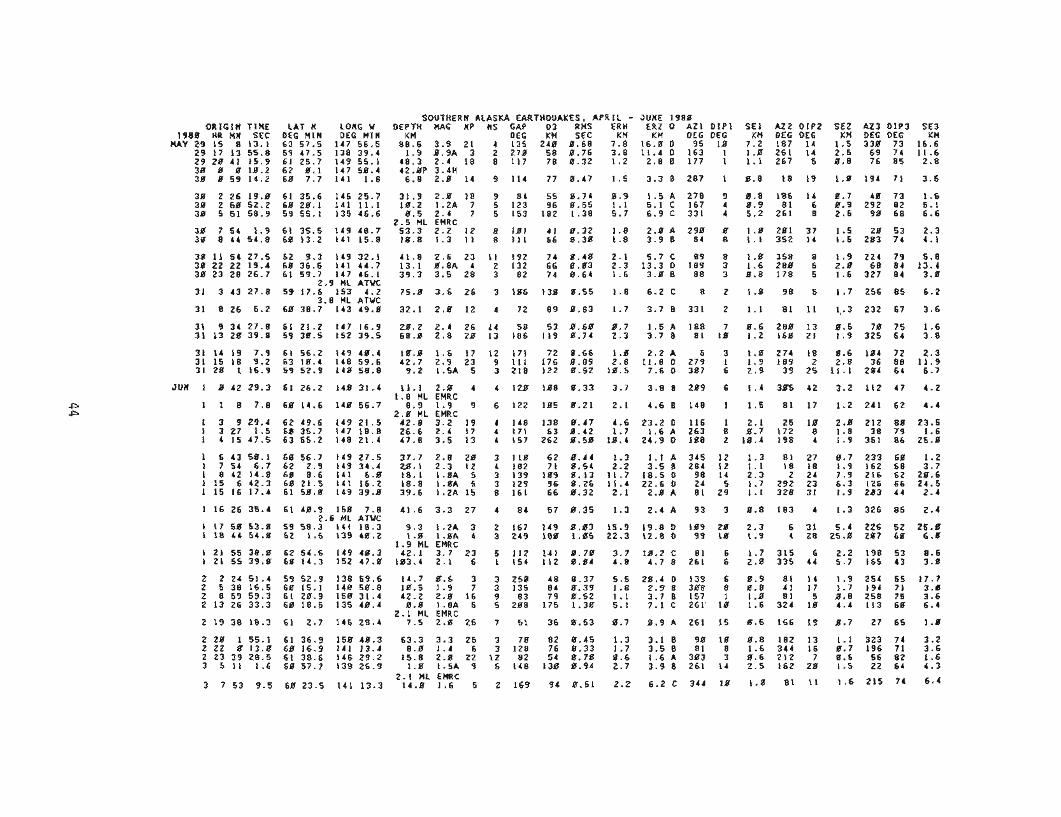
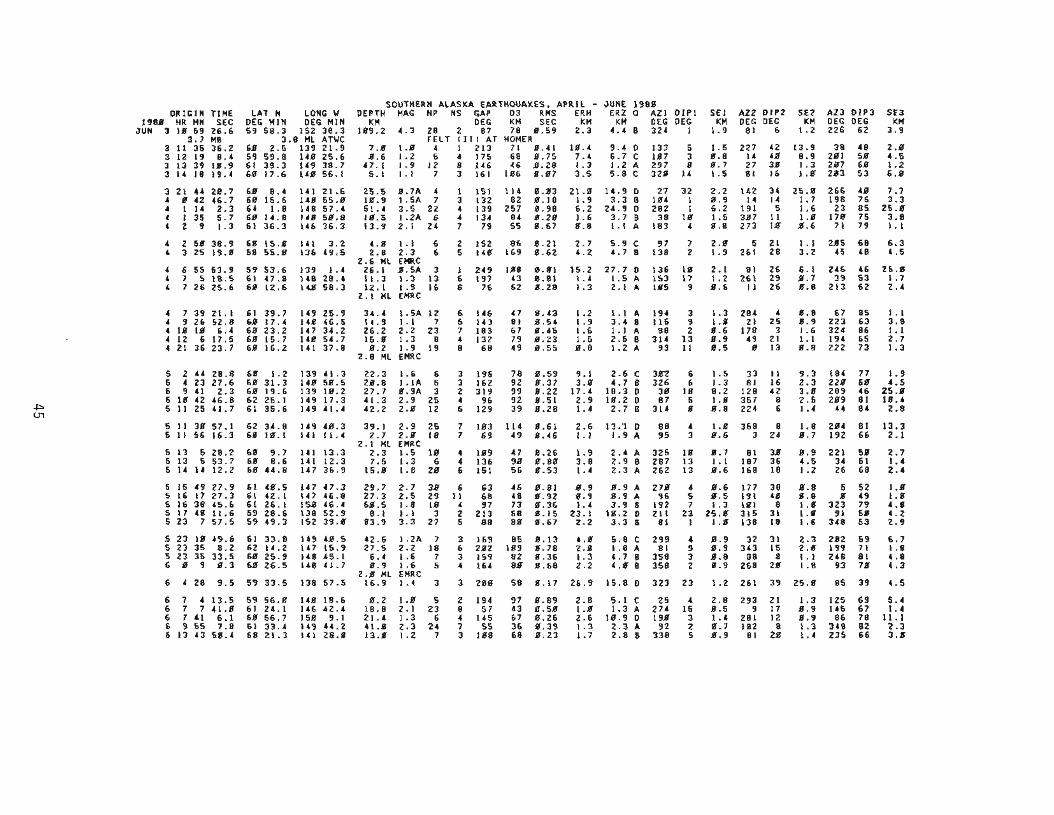
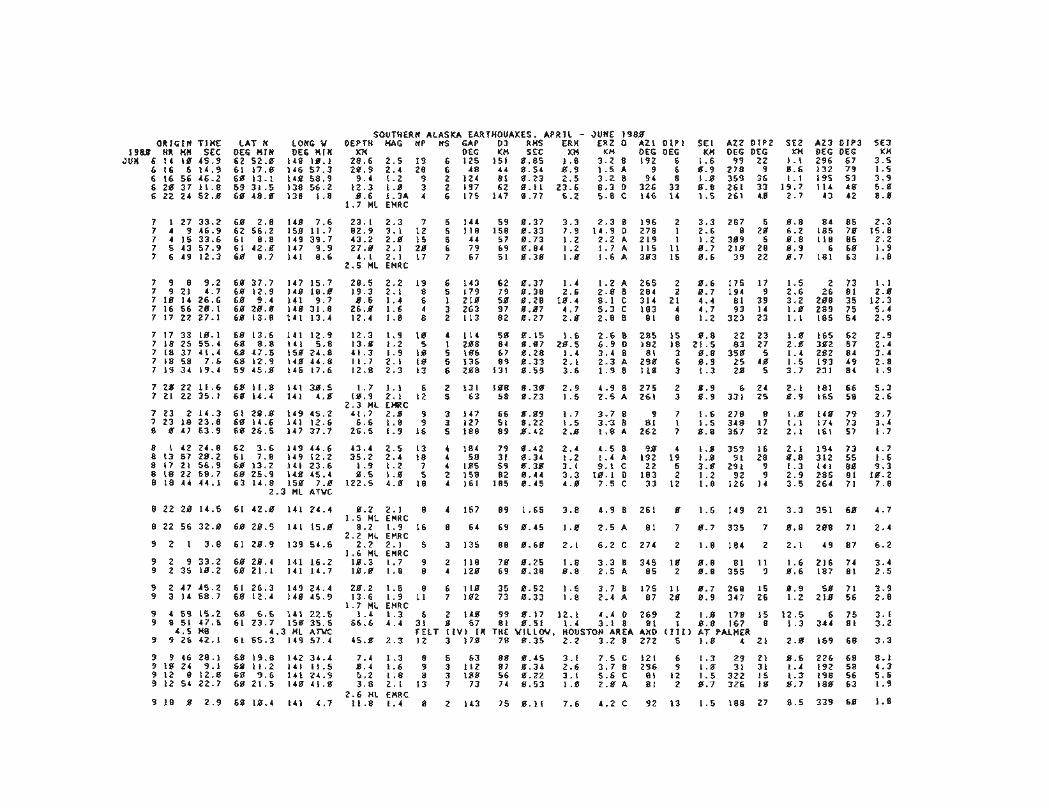
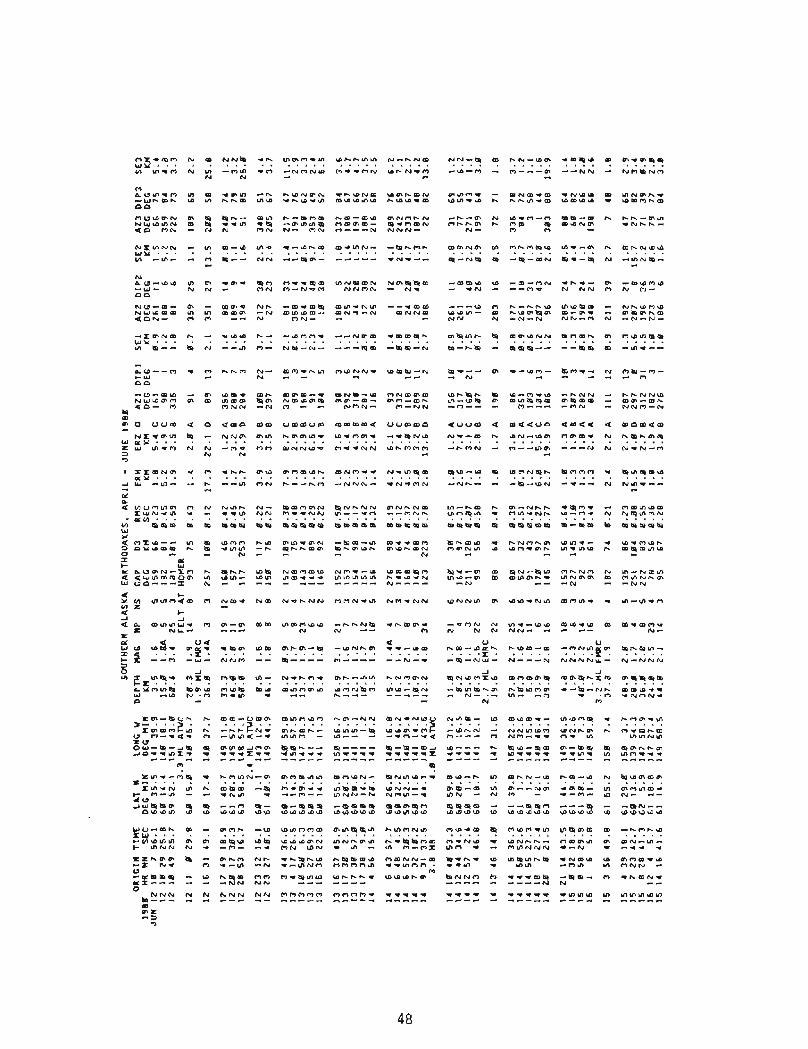
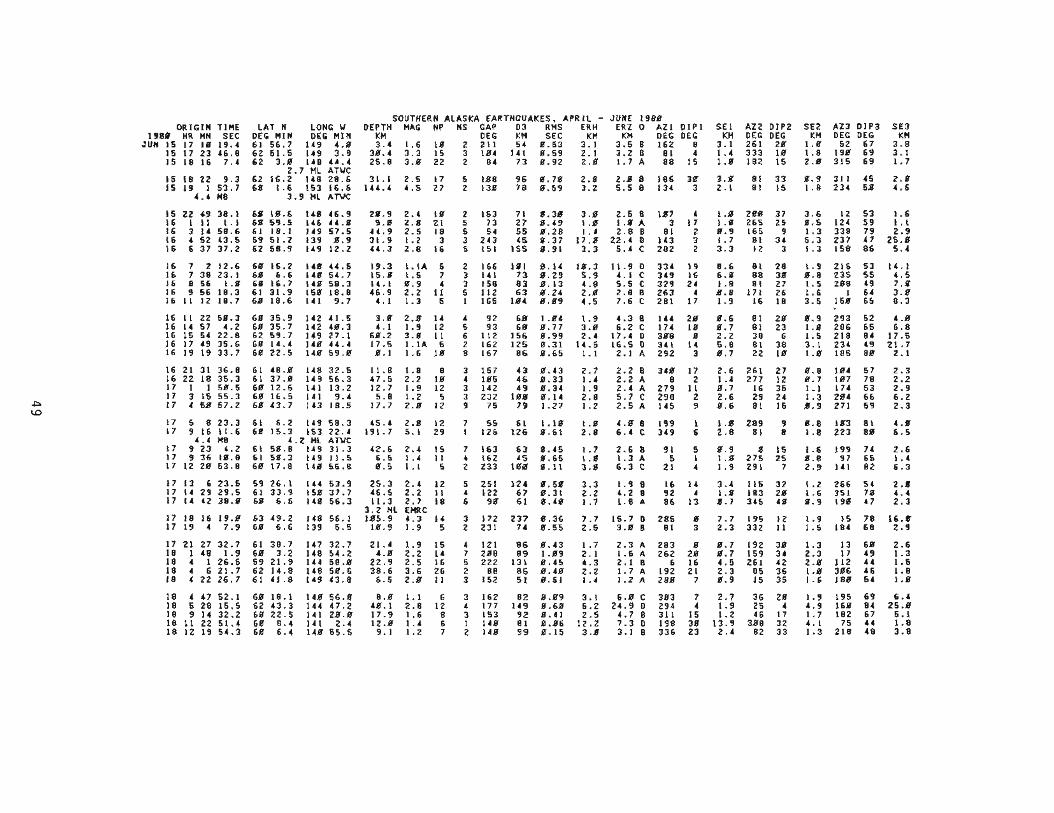
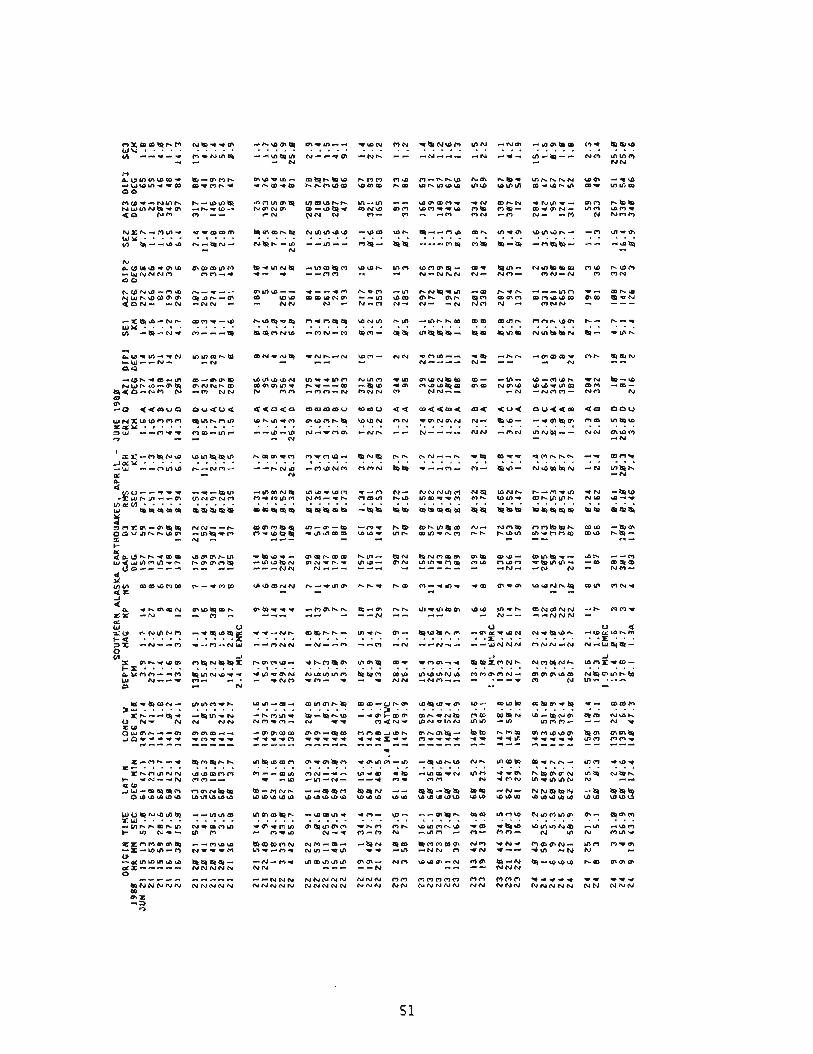
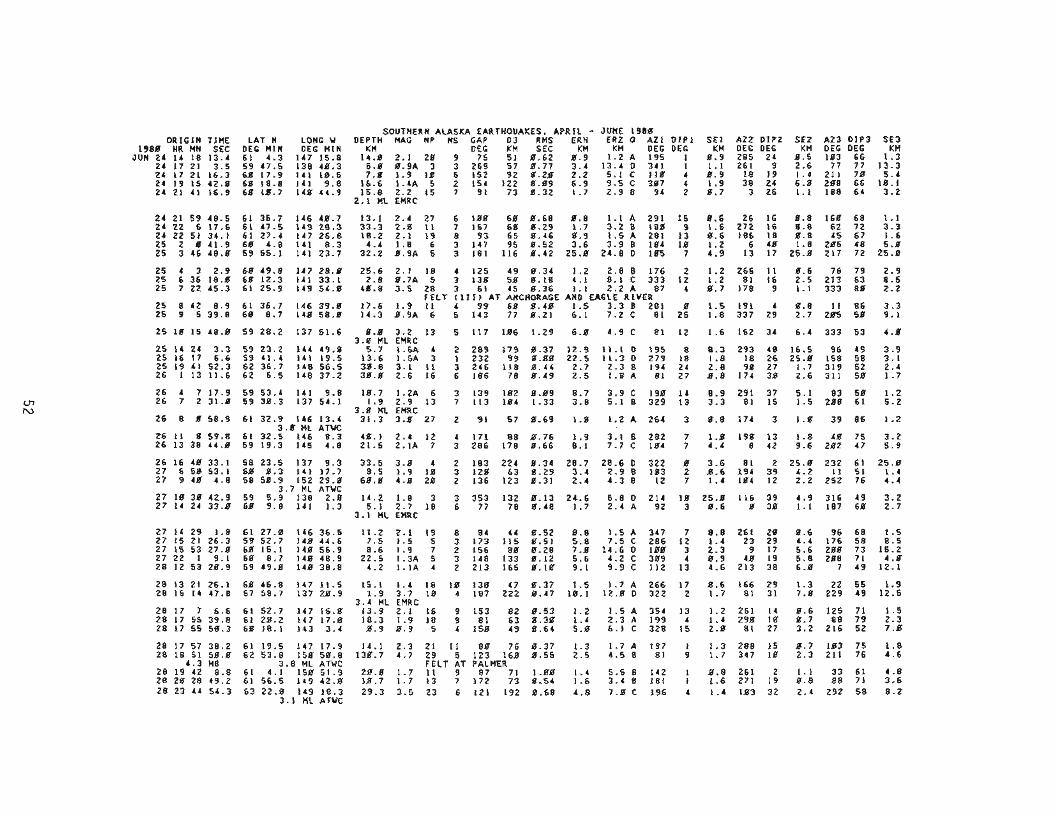
APPENDIX
Cata log o f Earthquakes
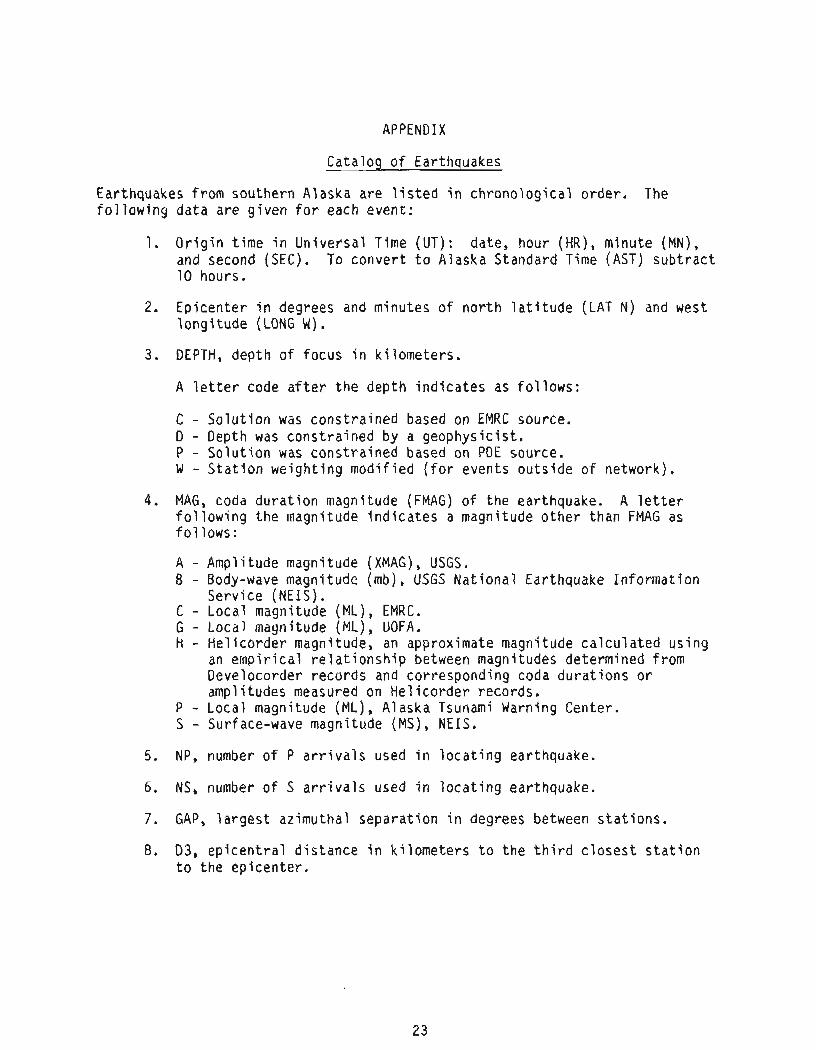
Earthquakes f r om southern Alaska a re l i s t e d i n ch rono log i ca l order. The f o l l o w i n g da ta a r e g i ven f o r each event:
1. O r i g i n t ime i n Un i ve rsa l Time (UT): date, hour (HR), minute (MN), and second (SEC). To conve r t t o Alaska Standard Time (AST) s u b t r a c t 10 hours.
2. Ep i cen te r i n degrees and minutes o f n o r t h l a t i t u d e (LAT N ) and west l o n g i t u d e (LONG W ) .
3. DEPTH, depth of focus i n k i lometers .
A l e t t e r code a f t e r t h e depth i n d i c a t e s as f o l l o w s :
C - S o l u t i o n was cons t ra i ned based on EMRC source. D - Depth was cons t ra ined by a geophys ic is t . P - So lu t ion was cons t ra i ned based on PDE source. W - S t a t i o n we igh t i ng mod i f i ed ( f o r events ou t s i de o f network).
4. MAG, coda d u r a t i o n magnitude (FMAG) o f t h e earthquake. A l e t t e r f o l l o w i n g t h e magnitude i n d i c a t e s a magnitude o t h e r than FMAG as f o l l o w s :
A - Amp1 i tude magnitude (XMAG) , USGS. B - Body-wave magnitude (mb) , USGS Na t i ona l Earthquake I n f o r m a t i o n
Serv ice (NEIS). C - Local magnitude (ML), EMRC. G - Local maynitude (ML), UOFA. H - He l i co rde r magnitude, an approximate magnitude c a l c u l a t e d us ing
an e m p i r i c a l r e l a t i o n s h i p between magnitudes determined f r om Develocorder records and corresponding coda du ra t i ons o r ampl i tudes measured on He l i co rde r records.
P - Loca l magnitude (ML), A laska Tsunami Warning Center. S - Surface-wave magnitude (MS), NEIS.
5. NP, number o f P a r r i v a l s used i n l o c a t i n g earthquake.
6. NS, number o f S a r r i v a l s used i n l o c a t i n g earthquake.
7. GAP, l a r g e s t azimuthal separa t ion i n degrees between s t a t i o n s .
8, D3, e p i c e n t r a l d i s t ance i n k i l o m e t e r s t o t h e t h i r d c l o s e s t s t a t i o n t o t h e ep icen te r .
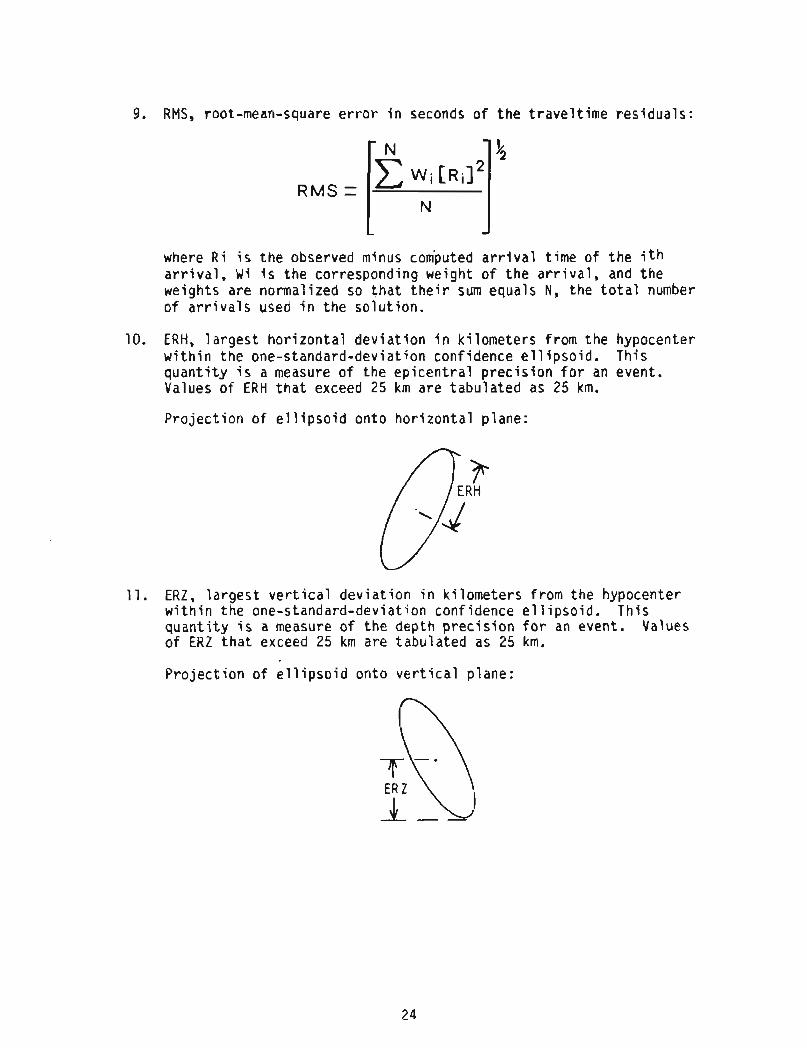
9. RMS, root-mean-square error in seconds of the traveltime residuals:
RMS =
where Ri is the observed minus computed arrival time of the ith arrival, Wi is the corresponding weight of the arrival, and the weights are normalized so that their sum equals N, the total number of arrivals used in the solution.
10. ERH, largest horizontal deviation in kilometers from the hypocenter within the one-standard-deviation confidence ellipsoid. This quantity is a measure of the epicentral precision for an event. Values o f ERH that exceed 25 km are tabulated as 25 km.
Projection of ellipsoid onto horizontal plane:
11. ERZ, largest vertical deviation in kilometers from the hypocenter within the one-standard-deviation confidence ellipsoid. This quantity is a measure of the depth precision for an event. Values of ERZ that exceed 25 km are tabulated as 25 km.
Projection of ellipsoid onto vertical plane:
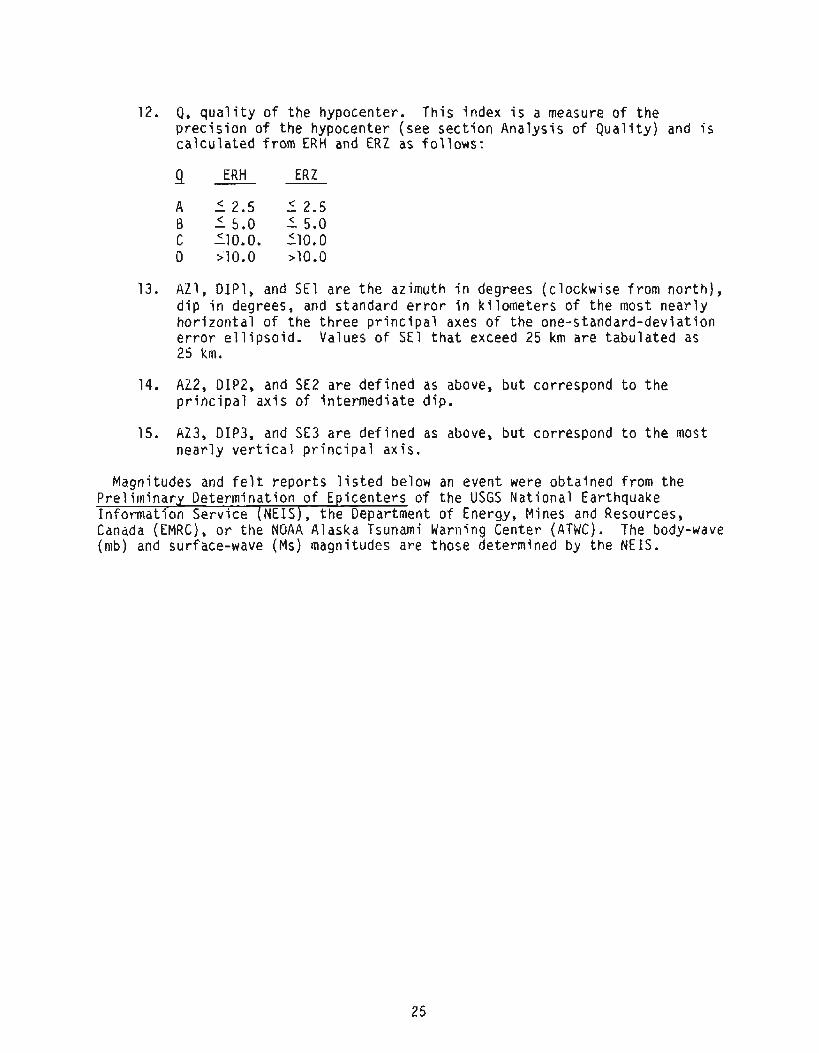
12. Q, q u a l i t y o f t h e hypocenter. T h i s index i s a measure o f t h e p r e c i s i o n o f t h e hypocenter (see s e c t i o n Ana lys is o f Q u a l i t y ) and i s c a l c u l a t e d f r om ERH and ERZ as f o l l o w s :
9 ERH ER Z
13. AZ1, DIPl , and SE1 a re t h e azimuth i n degrees (c lockwise f rom n o r t h ) , d i p i n degrees, and s tandard e r r o r i n k i l ome te rs o f t he most n e a r l y h o r i z o n t a l o f t he t h r e e p r i n c i p a l axes o f t h e one-standard-dev ia t ion e r r o r e l l i p s o i d . Values of SE1 t h a t exceed 25 km a re t abu la ted as 25 km.
14. AZ2, DIP2, and SE2 a re de f i ned as above, b u t correspond t o t h e p r i n c i p a l a x i s o f i n t e rmed ia te d ip .
15. AZ3, DIP3, and SE3 a re def ined as above, b u t correspond t o t h e most n e a r l y v e r t i c a l p r i n c i p a l ax is .
Magnitudes and f e l t r e p o r t s l i s t e d below an event were ob ta ined f rom t h e ~ r e l :minary ~ e t e r m i n a t i o n o f Ep icen te rs o f t h e USGS Na t i ona l Earthquake I n f o r m a t i o n Serv ice (NEIS), t h e Department o f Energy, Mines and Resources, Canada (EMRC), o r t h e NOAA A laska Tsunami Warning Center (ATWC). The body-wave (mb) and surface-wave (Ms) magnitudes a re those determined by t he N E I S .

O R I G I H TIME 1985 ttR MM SEC
APR 5 7 2 6 1 . 2 5 1 0 1 5 4 . 8 5 1 0 3 9 5 1 . 6 5 1 1 8 5 0 . 9 5 12 2 7 3 4 . 9
LAT PI OEG H I M 6 1 4 0 . 4 6 8 1 9 . 2 6 8 1 2 . 8 6 8 5 5 . 0 5 0 1 3 . 6
LONG V DEG MIfl
149 3 1 . 1 1 4 3 4 1 . 8 1 4 1 1 . 9 1 5 0 4 4 . 8 1 3 7 3 3 . 8
SOUTHERN AL DEPTH HAG NP
KM 4 0 . 8 2 . 1 18
8 . 3 1 . 4 A 5 1 0 . 3 1 . 3 8 1 8 . 1 1 . 7 1 4 1 1 . 8 3 . 2 8
2 . 6 ML EMRC
ASKA EAR NS GAP
DEG 8 1 4 7 4 1 4 7 2 1 2 B 5 8 7 4 1 7 2
THOUAKES. A P R I L - 03 RMS ERH KM SEC KM
JUNE 1 9 8 0 ERZ Q A 2 1 D I P 1
KM DEG BEG A 2 2 DEG
6 9 9 3 6
2 8 7 8 1
D I P 2 DEG
3 1 2 9 4 1
9 3 6
A 2 3 D I P 3 DEG DEG 1 9 7 5 9 2 7 8 6 1 1 9 6 4 7
7 7 0 0 2 2 8 4 5
2 . 1 HL EMRC 5 1 8 4 1 4 3 . 3 5 9 0 . 1 1 3 9 3 6 . 8 1 8 . 6 1 . 4 8 3 2 5 3 7 7 0 . 4 1 3 . 3 0 . 9 C 3 5 9 2 3 . 3 269 1 3 1 . 7 98 77 9 . 1 5 2 3 5 1 1 6 . 9 6 8 2 3 . 8 1 4 1 2 . 5 1 5 . 7 1 . 1 A 4 1 1 7 6 I 0 0 E . 1 2 6 . 3 1 6 . 0 D 9 5 9 5 . 6 3 1 2 2 . 1 2 2 1 7 5 1 6 . 5 6 0 2 6 5 1 . 8 6 1 4 2 . 6 1 4 6 2 N . 4 2 9 . 6 2 . 1 1 6 6 9 5 6 4 8 . 3 9 1 . 1 1 . 3 A 2 2 1 17 0 . 9 3 2 0 2 9 1.E 1 8 4 56 1 . 4
6 1 3 2 9 4 3 . 2 6 0 1 3 . 9 1 4 1 11.9 1 0 . 7 1 . 3 8 4 1 1 5 8 2 0 . 2 3 4 . 6 5 . 0 C I08 1 7 2 . 1 356 3 7 1 . 5 2 1 0 4 8 6 . 6 6 1 4 4 7 4 3 . 7 6 1 ZB. I 1 4 7 3 4 . 4 2 1 . 1 4 . 3 4 4 1 6 9 5 7 0 . 6 5 8 . 0 1 . 2 A 2 7 3 6 0 . 5 1 8 2 9 8 . 8 3 6 7 9 1 . 3
4 . 9 MB 5 . 2 H S 5 . 2 ML ATVC F E L T {IVI IN THE ANCHORAGE, CORDOVA. V H I T T E R AREA 6 1 4 5 5 5 1 . 3 6 1 5 0 . 3 1 4 9 1 3 . 1 0 . 3 1 . 9 2 8 6 1 6 2 4 7 8 . 9 3 1 . 1 1 . 3 A 2 6 4 1 1 0 . 6 3 5 9 2 2 1 . 1 1 4 9 6 5 1 . 3 6 1 5 8 4 3 . 5 6 1 2 8 . 6 1 4 7 3 6 . 0 2 0 . 7 2 . 8 3 1 5 6 5 5 7 8 . 5 1 0 . 8 l . 2 A 2 7 8 2 8 . 4 1 8 0 2 0 . 8 5 3 8 7 1 . 2 6 1 5 7 8 . 7 6 1 2 1 . 0 1 4 7 3 6 . 7 2 2 . 4 2 . 3 2 4 6 7 9 6 4 8 . 6 5 0 . 9 A 1 1 4 9 . 9 2 8 0 12 0 . 5 1 1 9 77 1 .5
7 1 2 6 4 8 . 1 6 8 1 1 . 4 1 4 8 5 9 . B 1 3 . 1 1 . 8 8 2 1 2 1 8 8 0 . 1 1 7 . 8 6 . 8 C 3 3 0 2 7 2 . 2 8 3 3 7 1 . 7 2 1 4 4 1 1 5 . 2 7 1 4 9 5 7 . 0 6 1 4 9 . 8 1 4 7 2 1 . 0 3 1 . 8 3 . 1 2 7 3 0 2 6 9 8 . 6 8 1 . 3 1 . 3 A 8 4 1 8 . 8 3 5 3 12 1 .4 1 7 5 4 8 1 . 2 7 2 2 2 3 4 . 2 6 8 2 1 . 4 1 4 0 2 8 . 3 2 4 . 3 2 . 0 9 6 0 7 9 3 0 . 3 3 4 . 2 6 . 6 C 8 1 1 8 1 . 2 3 2 4 2 3 1 . 6 1 8 0 5 4 7 . 1
1 . 8 HL EHRC
3 . 8 ML ATVC 7 3 5 5 2 3 . 4 6 0 2 3 . 5 1 4 1 2 1 . 1 1 . 3 1 . 0 5 3 1 1 6 6 4 8 . 1 9 6 . 6 1 8 . 7 D 2 6 1 1 6 . 1 1 6 8 6 1 . 9 2 1 7 7 1 8 . 6 7 1 2 1 5 9 . 9 6 5 1 3 . 6 1 4 1 1 7 . 4 6 . 5 1 . 1 6 4 1 2 2 8 2 0 . 1 8 3 . 4 8 . 3 C 2 6 1 1 2 . 9 3 3 2 1 9 1 . 8 1 6 8 6 3 8 . 4 7 4 5 B 9 . 3 68 8 . 5 1 4 8 5 9 . 9 1 . 9 2 . 0 I 6 7 7 2 5 9 8 . 4 1 2 . 9 3 . 3 6 3 1 8 1 5 1 . 2 B i 2 7 0 . 0 2 8 9 4 6 4 . 0
2 . 0 Hi EMRC
O R I G T N TIME 1968 HR HN SEC
APR 1 0 16 0 25.9 1 0 16 3 4 5 1 . 2
CAT N LONG W DEG MIN BEG UIN 66 9 . 3 140 56.1 59 55.5 141 30.4 6 6 25.5 143 4.9 6 0 18.1 148 5 0 . 0 6 0 16.9 141 8 . 4
SOUTHERN ALASKA EARTHOUAKES. APRIL - DEPTH MAG UP NS GAP D3 RUS ERH
KU DEG KM SEC KM 23.6 8 . 8 6 1 1 2 1 102 0 . 1 5 6 . 1 12.3 0 .6 5 1 2 3 8 157 8.27 6 . 3 13.9 1.4 9 1 96 79 8.34 2 .0 14.8 1.5 7 3 141 79 0.19 1 . 5
8 . 4 1.1 8 2 129 78 0 . 1 9 2.8
JUNE 19 ERZ O
Kt4 4 . 0 C 5 . 6 C 4.1 a 2.5 A 5 .8 0
24.7 0 6.7 C 2 . 2 A 8.2 C 2.3 A
11.6 D 2 0 . 7 D
9 .8 C 2.5 C
22.7 D
2.6 B 4.8 0 9.1 c
18.6 D 2.3 A
3.4 0 7.2 C
22.7 0 4.9 0
3.5 0
2;3 A 2.8 B
6.3 0 18.7 0 15.9 0
18.2 D 2.6 B 1.9 A
2 . 8 A 4 . 0 B
2 4 . 4 D 18.9 D
4.4 B 23.1 D
1.5 A
1.4 A 5.2 C 2.3 A 3 . 4 B 1 . 8 A
8 8 A Z I D IP1 S E l DEG DEG KM 117 t 4 1 . 9 1 3 0 4 3 . 8
25 13 1 . 8 84 19 1 .0
261 6 2.3
A22 DIP2 DEG DEG 215 28 261 39 291 15 347 20 354 26
8 6 81 19
183 7 5 28
25 14
298 15 19 34 84 5
261 3 1 119 15
191 32 261 43
17 3 4 81 12 23 I 6
SE2 A 2 3 D I P 3 KM DEG DEG
6.7 3 58 1.4 36 36
13.1 2 .1 1 9 12 57 64 8 .35 1 .8 2.3 HL EMRC
3.8 1.7 8 6 153 79 8 . 4 5 1.4
ORIGIH TIME 1 9 8 8 HR MH SEC
I P R 14 8 44 6 . 3 14 10 13 4 2 . 8
L A 1 N DE6 H I N 6 8 2 7 . 0 6 0 1 2 . 0
6 8 13 .3 6 0 14 .3 6 0 17 .9
6 0 13 .1 6 0 1 3 . 5 6 0 1 6 . 0 62 5 5 . 7 61 59 .6
6 8 14 .2
6 0 12 .9 6 0 13 .1
59 5 6 . 9 6 0 2 7 . 4
6 0 11.4 68 21.1 6 1 23 .4 60 1 3 . 4 6 8 6 . 2
6 0 11 .2 6 0 5 8 . 3 6 8 16.4
61 4 . 4 6 0 2 9 . 4
6 8 1 5 . 3 6 8 1 6 . 0 6 0 i 6 . 4 6 0 1 5 . 7 6 0 10 .2
6 0 19 .4
68 1 6 . 9 59 5 2 . 7 6 0 t 9 . 9 6 0 13.5
6 1 1 0 . 9
6 0 I 7 . 4 6 1 3 4 . 4 62 5 1 . 3 6 8 1 8 . 3
6 5 5 . 4 5 9 2 5 . 4
6 8 14.6 59 5 6 . 1 59 5 9 . 4
LONG V DEG M I N
1 4 0 56 .3 141 4 . 8
1 4 1 2 . 0 141 2 . 5 l 4 0 5 2 . 7
141 2 . 4 14ff 5 0 . 9 1 4 8 3 6 . 5 149 3 6 . 5 149 5 1 . 6
1 4 1 4 .9
141 6 . 7 141 5 . t
1 4 0 1 5 . 7 1 1 1 3 7 . 0
1 4 1 7 . 9 141 2 2 . 1 142 2 9 . 9 141 2 . 7 141 1 3 . 6
141 0 . 4 1 4 8 2 2 . 0 1 4 0 5 7 . 9
1 5 1 1 . 7 145 7 . 5
1 4 0 5 3 . 8 I 4 1 1 4 . 5 141 1 3 . 4 140 5 9 . 4 139 3 5 . 4
143 3 . 7
141 5 8 . 7 139 1 3 . 3 143 1 . 6 141 7 . 9
140 2 8 . 5
141 2 . 0 1 5 0 3 7 . 9 140 1 5 . 8 141 9 . 2
139 4 6 . 4 135 3 7 . 6
141 3 5 . 5 141 2 2 . 7 I 4 1 8 . 1
SOUTHERM AL DEPTH MAG NP
Kt4 1 0 . 3 1 . 4 18 1 2 . 6 2 . 3 25
2 . 9 Mi EHRC 7 . 8 1 . 7 9 1 . 9 1 . 0 7 4 . 5 1 . 1 8
ASKA EARTHQUAKES. A P R I L - JUNE 1 9 8 8 ERZ Q A21 D I P 1 SE l
Kt4 DEG DEG K H 3 . 5 B 2 6 1 2 1 . 3 1 . 6 A 2 0 7 6 5 . 6
A22 D I P 2 DEG DEG 343 4
Zfl 25
3 2 25 1 23
3 3 1 2 3
8 34 13 2 0 81 31
3 4 0 8 1 7 1 44
7 28
349 34 6 19
261 42 266 6
3 4 1 10 3 4 8 1 1
2 6 15 9 3 4
187 2 1
4 3 6 217 17
7 2 6
179 3 114 26
2 31 347 16 347 16
9 11 266 35
16 4 8
9 2 9 8 1 2 7 14 24
3 2 9 25
11 3 0
15 23 164 15
8 7 3 8 347 32
I 4 31 3 2 6 0
1 5 I 1 8 3 0 1 5 0 2 7
A23 D I P 3 OEG DEG 143 81 184 64
282 6 5 167 6 6 183 6 4
217 5 2 211 69 226 47 195 76 347 46
1 9 8 7 0
202 5 1 200 7 0
13 2 0 izn 03
284 41 161 7 4 246 7 ) 191 5 6
42 6 5
197 5 3 357 6 0 195 64
359 0 7 2 5 8 59
211 5 5 191 7 2 2 3 1 6 8 159 77
27 3 6
222 47
230 7 8 2 5 1 40 212 6 5 196 54
195 6 0
224 6 4 3 5 2 7 5 279 5 9 163 5 7
1 9 8 5 9 B 6 5
101 05 3 2 2 58
2 0 5 1
NS GAP 0 3 RMS ERH DEG KM SEE Kt4
3 148 76 0 . 6 7 1 . 3 7 5 8 5 6 0 . 4 7 1 . 8
5 . 8 3 . 1 2 9 3 . 6 ML EMRC
1 0 . 3 0 . 9 7 9 . 4 1 . 7 2 2
1 . 9 HL EHRC 1 2 . 9 1 . 1 3 1 8 . 3 1 .3 6
1 4 . 7 1 . 9 21 1 . 8 H i EMRC 22.1 1 . 4 0 2 8 . 3 1 . 9 2 7
2 .7 HL EMRC 8 . 4 1.2A 4
1 2 . 7 1 . 2 5 6 . 2 2 . 2 23 6 . 4 1 .3 0
2 . 0 ML EHRC 6 . 7 8 . 9 6
4 5 . 3 2 . 3 17
1 3 . 1 1 .3 6 3 2 . 5 2 . 8 7
2 . 5 Hi EMRC 3 . 4 8 . 9 A 4 3 .0 8.8 5 3 . 8 1 . 1 6
O R I G I N TIME 1908 MR HH S E C
APR 15 17 38 35.6 15 19 5 7 31.5
LAT N DEG HIM 59 27.9 68 13.3 6 0 2 . 7 63 16.8 6 1 5 9 . 4
60 1 3 . 6 6 1 15.7 6 1 7 . 1 59 5 8 . 1 62 8.8
61 31.6
6 0 21.9 6 0 11.1 60 15.9 6 8 22.8
63 4.6 61 48.9 62 57.8 6 0 11.9 6 0 16.5
6 0 23.1 68 11.1
58 45.2
60 16.0 6 0 20.1
6 0 8.8 61 49.0
6 8 7.6 6 2 4 .0 60 57 .0
6 0 18.1 54 56.4 61 23.5 61 15.2 6 0 15.5
6 0 24.7 6 2 54.5 6 8 53.4 63 3 . 3 6 1 4 7 . 9
59 5 7 . 5 59 57 .0 61 51.9 6 0 50.6 6 0 8.5
2 .
LOHG U DEG MIU
139 33.3 139 38.2
SOUTHERN ALASKA EARTHOUAKES. APRIL - DEPTH HAG NP NS GAP 03 RMS ERH
KH DEG kt4 S E C KM AZ2 DIP2 SEZ DEG DEG KH 2 8 0 29 2.6 155 29 3.4 1 0 3 4 0 1 . 3
81 4 2 . 4 268 29 0 . 6
A23 D I P 3 DEG DEG
51 59 26 69
257 47 218 69 1 2 8 57
1 5 0 68 254 76 240 79
64 43 115 58
3 0 9 66
198 65
308 224 6 5 5 1 175 60
E 207 54 1 8 1 45 155 7 2
2 6 68 182 47
332 47
173 63 212 72
210 47 9 61
384 6 1 3 2 1 59 136 79
394 55 198 52 15B 61 2 3 9 04 143 49
a 5 7 146 8 8 215 83 199 63 231 57
293 54 214 62 338 5 6
18 7 1 1 7 1 6 8
E R Z O A Z I D I P l Kt4 O E G DEG
4.3 8 384 10 11.5 D 261 27
3.8 C 1 13
2 . 3 EMRC 1.3 1 .0 1 . Z 1.1A
2 . 5 1 .2 5 3 1 3 . 1 . 9 13 7
1.9 HL EMRC 28.2 2.9 16 5
3 .8 HL EMRC 9.5 1.5 7 2 1.7 1.0 5 2
1.1 1.4 7 3 1 . 8 2.3 8 4
2.5 ML EMRC
143 17 .9 141 4 . 3
, 3 HL ATWC

ORIGIN TIME 19BB HR MN SEC
APR 25 1 7 B 5 9 . 2 2 5 2 2 5 6 33.6 2 5 2 3 2 3 2 3 . 0 2 6 4 12 B . 0 26 7 2 2 6 . 8
LAT n DEG MIN 5 9 30 .9 6 0 1 5 . 3 6 0 1 0 . 9 62 8 . 5 61 1 9 . 4
6 0 15.4 6 8 3 3 . 9 59 3 3 . 7 6 0 7 . 5 6 8 13 .2
6 1 3 0 . 3 6 0 1 1 . 8 6 8 3 4 . 6 6 0 15.5 6 1 2 1 . 0
6 8 15 .9 6 0 2 4 . 4 68 1 6 . 0 6 2 0 . 4 6 1 4 6 . 4
62 3 4 . 8 61 4 3 . 3 6 8 0 . 4
59 4 9 . 6 61 3 2 . 9
6 1 4 3 . 6 62 4 6 . 1 6 8 0 . B 6 3 8 . 3 6 2 6 . 5
6 0 2 4 . 9
61 3 4 . 1 6 8 15 .1
5 9 4 6 . 3 6 2 59 .5
6 1 3 8 . 8 5 9 4 7 . 2 6 1 2 1 . 6 6 1 1 7 . 9 6 1 4 2 . 2
68 9 . 9 6 0 1 7 . 1 61 2 7 . 0 6 0 5 . 8 63 4 . 3
LONG V DEG MIN
138 3 7 . 9 141 44 .7 141 2 . 1 149 3 5 . 1 143 2 1 . 1
148 5 1 . 3 149 16 .6 139 1 2 . 8 148 2 6 . 3 140 4 3 . 2
146 3 5 . 6 140 5 0 . 6 141 4 5 . 4 141 6 . 1 147 3 3 . 5
141 1 7 . 1 140 6 .5 147 4 9 . 5 149 2 0 . 9 149 4 4 . 6
148 5 1 . 6 149 1 4 . 8 141 1 1 . 8
148 2 5 . 1 1 5 6 1 6 . 2
149 5 7 . 4 14B 4 7 . 8 143 5 5 . 6 149 3 5 . 1 149 7 . 7
148 7 . 1
151 42.B 141 1 1 . 7
1 8 0 55.6 1 5 8 4 2 . 0
1 5 0 10 .1 141 2 9 . 0 147 3 5 . 2 158 2 2 . 6 149 3 8 . 7
141 5 . 7 141 13 .9 146 3 3 . 1 139 3 1 . 9 151 6 . 0
SOUTHERN ALASKA EARTHQUAKES. A P R I L - DEPTH MAG NP NS GAP D3 RMS ERH
KM DEG K H S E C KM
JUNE 1 9 0 8 ERZ 0 A 2 1 D I P 1
KM DEG BEG 1 2 . 7 0 I B 1 7
8 . 9 C 93 2
SEl A22 D I P 2 SE2 A23 D I P 3 KM DEG DEG KM D E G . DEG
8 . 0 7 3 3 1 . 7 202 56 1 .3 2 14 1 . 1 191 76 1 . 7 6 2 0 0 . 8 1 8 9 7 0 1 . B 354 14 1 .B 285 74 1 . 1 213 2 2 1 1 . 9 B 64
3 . 4 2 . 4 17 6 8 2 4 7 8.68 1.0 2 . 6 HL EMRC
2 8 . 3 2 . 1 13 6 253 115 0 .50 2 . 9 4 9 . 6 2 . 0 1 0 3 115 82 0 . 2 1 1 . 8
1 0 . 9 2 . 2 12 5 99 9 0 0 . 5 1 1 . 0 2 . 2 ML EMRC
9 3 . 5 3 . 7 19 1 115 117 8 . 6 3 2 . 0 1 1 . 9 2 . 1 12 5 7 4 9 1 8 . 1 3 1.7
2 . 2 ML EMRC 1 4 . 9 1 .2A 5 4 224 87 0 . 2 8 9 . 7
SOUTHERN ALASKA EARTHQUAKES. A P R I L - JUNE 1 9 8 0 ORIGIN TIME LAT I LONG V DEPTH HAG NP NS GAP 03 RHS ERN ERZ 0 A21 D I P 1 S E l A22 DTP2 SE2 A23 D I P 3 SE3
1986 HR ?4N SEC DE6 M IN DEG M I N KM DEG K M SEC KM Kt4 OEG DEG KM DEt DEG KM DEG OEG KU WAY 1 1 8 3 9 3 . 5 5 3 3 9 . 7 1 5 0 3 7 . 2 3 9 . 4 3 . 6 3 0 1 125 116 0 . 5 7 2.1 5 . 4 C 8 1 1 1 . 1 164 8 2.B 344 7 9 5 . 4
3 - 7 HB 3.8 ML ATVC 1 1 9 12 16.1 6 0 16 .8 140 5 1 . 5 9 . 3 1 .5A 4 1 149 117 0 . 8 5 1 7 . 4 1 2 . 9 D 354 3 2 1 . 9 1 1 1 3 6 2 1 . 3 235 38 5 . 1 1 2 3 2 4 5 . 7 6 1 4 5 . 6 1 4 9 4 9 . 2 5 3 . 4 1 . 9 9 7 1 6 1 5 9 8 . 2 6 1 . 6 2.6B 207 3 1.B 18 I 1 1 .6 182 7 9 2.7 2 1 12 2 5 . 1 6 0 1 3 . 2 1 4 1 7 . 1 1 5 . 0 0 . 9 4 3 $ 4 4 1 0 8 0 . 1 5 1 6 . 5 2 6 . 5 D 2 6 1 3 3 24 .0 103 3 5 7 . 2 2 15 1 .3 2 2 5 2 5 4 . 0 5 9 5 6 . 5 1 4 1 6 . 6 1 . 3 1 . 2 5 2 168 1 8 1 0 . 3 5 2 . 3 4 . 4 8 261 2 1 . 9 152 21 8 . 8 356 6 2 4 . 5
6 8 2 3 . 7 1 4 1 4 8 . 1 6 3 10 .2 t 5 8 15.3
3 .3 Mt ATVC
5 9 5 8 . 2 141 4 .B 61 9 . 6 149 5 0 . 0 5 9 5 1 . 0 141 4 9 . 0 6 0 5 5 . 2 149 2 4 . 0 6 1 38.1 150 7 . 3
61 31.4 147 14 .5 5 9 5 0 . 2 152 3 1 . 4
3 . 3 Hi ATVC 6 0 1 7 . 6 141 44 .9 6 8 1 5 . 3 141 12 .6 6 0 1 4 . 6 141 4 . 3
6 0 15 .8 141 5 . 3 6 0 1 6 . 9 141 2 7 . 9 6 0 2 0 . 8 141 7 . 9 6 0 22.4 141 1 .6 59 4 6 . 4 142 36 .9
61 2 4 . 0 1 5 0 4 . 9 6 0 17 .1 1 4 1 50 .4
6 8 1 7 . 1 141 1 3 . 8 6 8 1 7 . 4 140 5 0 . 6 6 0 1 6 . 3 148 5 8 . 2
6 1 2 2 . 0 149 1 3 . 7 68 1 3 . 0 141 1 4 . 6
4 2 . 1 0 . 5
re. 5
2 . 1 12 a 2 . 1 22 6 EMRC 1 .3 7 4 1 .9 19 7 1 . 0 7 3
SOUTHERN ALASKA EARTHQUAKES. APRIL - JUNE 1 9 8 0 O R I G I M TIME L A 1 N LONG U DEPTH MAG NP NS GAP 0 3 RMS ERH ERZ O A21 D I P 1 SE l A22 D I P 2
1 9 0 8 HR HW SEC OEG M I N DEG M I # KM DEG KH SEC KM KH DEG DEG KM DEG DEG MAY 5 3 5 4 51.7 6 1 2 2 . 7 158 1 8 . 8 4 3 . 8 2 . 1 13 6 84 6 7 8 . 3 5 2 . 1 2 . 8 8 126 3 1 . 2 216 3
5 3 5 9 3 7 . 7 6 # 8 . 6 141 1 . 1 9 . 3 2 . 8 13 5 116 5 8 8 . 1 9 1 . 3 1 . 7 A 99 5 8 . 8 6 31 5 9 7 5 . 2 68 1 9 . 2 141 2 0 . 1 8 . 8 1 .2 5 4 124 7 2 0 . 2 8 2 . 5 8 . 5 C 2 6 1 6 2 . 3 3 4 6 12 5 1N 13 9.5 61 2 1 . 2 149 16 .1 4 0 . 3 1 .2A 15 6 6 8 44 8 . 2 6 1 . 3 1.6 A 164 13 1 . 2 81 17 5 1 1 3 3 4 7 . 2 6 5 1 5 . 0 1 4 8 5 4 . 8 1 2 . 5 1 . 7 6 5 131 7 8 8 . 1 3 1 .4 2 . 0 A 126 12 8 . 8 31 25
S E Z A Z 3 D I P 3 KPI DEG DEG
2 . 1 351 86
6 3 5 . 3 1 5 8 3 1 . 1 3 .2 UL ATWC
62 1 . 4 148 4 9 . 7 59 1 3 . 9 136 5 0 . 4
2 . 3 I 2 5 183 1 0 0 8 . 5 3 2 . 4 1 . 7 A 2 6 1 17 1 . 5 3 . 0 9 5 1 3 0 153 1 . 3 3 2 . 9 3 .9 8 81 1 2.4 EMRC 3 . 6 12 6 1 1 8 2 6 1 1 . 3 0 8 . 1 19 .7 0 194 9 1 . 5 64 2 . 9 I 4 9 6 . 8
2 . 7 HL ATUC 62 55.5 158 3 4 . 5
4.1 HL ATVC 5 . 1 3 5 1 6 7 166 8 . 5 6 2 . 2 6 . 8 C 98 3 1 . 8
FELT ( 1 ) I N THE PALMER-TALKEETNA AREA
7 12 5 3 2 5 . 6 61 59.1 151 5 . 4 7 9 . 4 2 . 5 9 4 146 185 0 . 1 4 5 . 9 3 . 1 C 214 6 5.9 I 2 2 21 7 1 3 3 3 8 . 8 62 2 .1 1 5 8 5 6 . 3 5 9 . 8 2 .5 0 3 252 107 8 . 3 3 5 . 8 5 . 3 C 114 9 1 . 7 2 1 1 38 7 1 3 2 1 9 . 2 6 8 1 1 . 1 1 4 1 2 2 . 7 8 .9 1 .8 18 4 103 4 0 8 . 3 2 1 .3 2 . 5 8 266 2 0 . 7 357 22 7 1 4 5 9 3 7 . 4 6 0 1 0 . 8 1 4 8 5 5 . 7 7 . 9 1 . 2 5 2 148 7 6 8 . 3 6 8 . 9 6 . 4 C 81 2 6 2 . 4 309 39 7 1 5 2 5 3 . 4 6 1 2 3 . 1 1 4 9 5 9 . 0 5 4 . 8 3 . 7 25 2 62 51 8 . 3 6 1 . 3 2 . 5 0 61 1 8 . 9 164 6
7 I 6 1 1 6 . 1 6 0 4 6 . 9 1 5 8 3 9 . 9 5 1 . 9 3 . 4 2 2 3 1 8 0 7 9 8 . 4 3 1 .8 3 . 5 0 81 4 8 . 9 3 4 1 13 7 1 7 4 9 3 0 . 5 6 0 2 2 . 9 1 4 8 5 7 . 5 9 . 0 2 . 1 15 8 51 6 8 0 . 6 0 8 . 8 2 . 2 A 9 5 4 8 . 8 4 6
2 . 4 ML EMRC 7 19 9 1 2 . 9 61 22 .5 1 4 9 5 9 . 9 58 .3 2 . 2 16 1 123 7 8 0 . 2 1 1 . 6 4 . 8 0 313 1 8 . 9 223 I 7 2 f f 3 4 7 . 7 6 0 2 1 . 0 141 4 . 6 1 1 . 3 1 .8 6 d 132 6 8 8 . 6 1 1 .4 2 . 8 0 81 1 8 1 . 2 344 14 8 3 6 3 8 . 0 6 0 19.5 143 6 . 6 6 . 5 2 . 3 15 7 106 6 8 0 . 0 5 1 . 6 1 . 9 A 109 11 0 . 0 1 1 3 5
2 . 4 ML EMRC
8 2 0 1 3 2 3 . 9 6 8 3 0 . 2 1 4 8 4 1 . 3 18.7 2 . 1 11 7 60 85 5 . 3 7 0 . 9 2 . 6 B 163 1 8 . 6 $ 1 7 2 . 3 M t EMRC
9 0 2 2 4 . 5 6 8 1 6 . 5 141 1 4 . 8 1 2 . 8 1 .4 7 4 116 77 8 . 3 3 2 . 2 2 . 3 A 326 13 8 . 7 8 1 31 9 5 16 5 4 . 1 6 8 1 5 . 8 141 14.2 1 4 . 0 1 .7 14 8 77 7 8 8 . 4 8 1 .3 2 . 1 A 334 14 8 . 7 8 1 15
1 c MI F M P ~
m m m m m w 9 t
- * wr .
m w r B N N
Y
$ m ~ m q - q r n m w a k m m-m-m e m m m * m m m m m m h m r m m ~ P m m m m m m r ~ * o o x r - m m m m m m m m t m m c m - m h r - 5 - 2 E E e m h h m m w r e m - m t m m m * r -mmm x - - - d-4- N

O R I 6 1 U T I M E 1 9 8 B HR HN SEC
WAY 18 1 8 4 8 2 6 . 8 1 8 1 9 29 4 4 . 7
LAT M DEG K I N 6 8 3 4 . 9 6 1 3 6 . 7
LONG U DEG M I N
1 4 9 3 1 . 5 1 4 1 1 9 . 7
SOUTHERN Al LASKA EAR NS GAP
D E E 5 1 1 8
ITHQUAKES, A P R I L - 0 3 RMS ERH KM SEC KM 4 2 0 . 2 9 1 . 6 8 4 8 . 7 6 1 . 8
JUNE 1 9 8 8 ERZ O A 2 1 D I P 1 S E I A22 D I P 2
KH DEG OEG
1 . 6 1 . 1 2 6 1 B 1 3 0 1 3
S E Z A 2 3 D I P 3 KH DEG DEG
0 . 9 2 9 2 5 6 1 .3 1 0 6 55
DEPTH MAG NP YU KM DEG DEG
1 . 3 A 1 7 5 1 7 3 . 2 B 3 2 0 1 2
m , ,
3 6 . 9 2 . 3 1 9 8 . 8 2.3 7
1 . 0 ML EMRC 4 2 . 3 2 .4 1 3 1 1 . 4 2 . 8 10
1.8 ML EMRC 2 6 . 5 2 . 1 1 9
8 . 3 2 . 1 1 2 6 .4 1 .8 6
1 . 5 ML EHRC 1 4 . 8 2 . 2 9
12 .2 1 .7 5 65 .8 3 .4 2 0
0 . 1 1.1 6 1 1 . 1 1.2 7
9 . 8 2.8 28 2 . 2 t4L EMRC
1 2 . 2 2 . 1 1 2 2 . 1 ML EMRC
0 .5 2 . 2 23 1 2 . 7 2 . 2 8
2 . 4 HL EMRC 39.8 2 .4 12 2 0 . 6 1.3 1 4
4 5 . 8 3 . 1 1 0 1 . 0 2 . 8 1 8
3 . 0 ML EMRC 1 4 . 4 1.4 5
9 . 6 1 . 7 7 2 . 2 N L EHRC
1 7 . 2 1 .2 7
. - 2 . 1 ML EHRC 1 3 3 . 5 4 . 3 2 4
1 ML ATWC 1 4 4 5 8 . 1
1 6 . 5 1.4 I 0 1 1 . 1 2.3 1 7
2 . 2 H L EMRC

mEy""" . . . ' t ‘ m y y 9 "?""yy?y 1 y y y y . . . . . W X
7 m 5 y ~ - m ~ m m q 7 q y y 4 t y ~ q rn m Q m - m m - m - L N N m h ~ * W m m ~ - m m ~ m m m t h - 9 ~ ~ 9 m u l m m m m ~ t w m - .. w- 4 A NNN
N L V N U I ~ ~ ~ r r m r ~ m m r m - w t - r N m - m m m + m - m m m + r m r m m hqn-t r m b m m M U m N m - N m N N ,-, .. - - -,- - RP3-N- d N - N R W nn ~ w m Q - t - - - m m m m h ~ m n N m Q m m - - - -m - @ m m m m m - m m - - t - w Q m-m- t - ~ u - m w v - m m h m m r P - 9-N - - ~ m - A - m m m ~ h m m * + m u m m m m m - m m m m m qn "NN N N m N m r J - - - r Y N - A N N17 C (7
2 ~ ~ ~ f c ? y - m m b b N - ~ m " . . ? y y y ? m u m m m * . 3 . . . . ? f T ? ? 4??f???Y? mm:Y? . . . . . . . r L m m r N t m 9 & ~ m h L m t - m r m - m m C m s w ~ t - m m m N m m m m m h 9 m - m + w m m m
y c t * m t m m m r -- m r u m m r ~ m n - r m t m t m I m . L I P ) ~ A ~
a= U 2 -.-h d m m - t m ~ m - m m m u m - - - - d ~ q - m r - Q m- - -m O Y - ~ - Q - Q m m m a m - d o r * * - r m u * * * rr* rtrrr r z r r m r w + + r r r m r r r rrr++
---ce ...+.d-- - d ++.A&- - ---- dded* -.-.--- ----- c,....-.-.-. P
0 ----- NNNNN N N NNN N N N N ~ m m m m n m w ~ w * t t t t* trrrr rr.rT* Q N N N N N NNNNN N N NNN NNNNN N NNNN NNNNN NNNNN NNNNN NNNNN m
O R I G I N TIME 1988 HR MH SEC
MAY 2 4 1 9 2 0 2 8 . 9
L A T td DEG H l N 68 3 7 . 3
6 1 4 1 . 8 5 9 3 2 . 0 6 0 0 . 5 6 0 18 .5
6 8 1 6 . 0 61 5 1 . 3 6 0 3 7 . 6 6 0 2 2 . 6 6 0 2 2 . 1
6 8 7 . 7 61 5 1 . 1 6 8 3 2 . 8 6 6 83.9 61 5 0 . 7
6 0 2 5 . 4 6 0 1 5 . 0 6 1 4 8 . 9 6 0 2 . 3 63 2 2 . 8
3 .
60 1 4 . 6 61 5 3 . 8 6 8 4 0 . 9 6 8 9 .4
61 1 9 . 3
6 0 9 . 9 60 1 2 . 9 62 1 . 1 6 3 2 7 . 1 6 1 14 .2
68 2 2 . 3 50 1 4 . 8
6 8 0.4 5 8 13 .9
6 1 4 2 . 3
6 1 5 8 . 6 6 0 5 6 . 7 6 1 9 . 2 6 1 14 .1 6 1 1 6 . 6
6 0 2 7 . 8 6 0 1 0 . 7
60 1 2 . 9 60 8 . 3 6 2 5 4 . 4
LONG W DEG MI#
1 4 1 4 5 . 8
SOUTHERN ALASKA EARTHQUAKES. APRIL - DEPTH HAG NP NS GAP 0 3 RHS ERH
KW DEG KH S E C KH 19 .6 2 .3 19 7 6 1 6 7 8 . 7 4 1.8
JUNE I985 ERZ 0 A21 D I P 1 SE1
KM DEG DEG KH 2 . 1 A 273 8 B.9
A22 DEG D I P 2 DEG
182 4
81 4 1 212 3 7
38 34 128 13
3 4 6 2 6 1 36
81 36 1 1 0 13
22 4
261 35 357 24 171 12
2 8 13 261 3 8
8 1 3 0 24 1 7
186 3 1 349 33 107 36
22E 262 4 2 6 IBE 13
11 14
166 7
3 4 1 15 9 5 l t 8 6 25
354 2 2 161 35
286 5 296 34
I5 2 9 296 42
185 11
261 2 6 1 25 26 2 7 1 5 359 I 6 261 7
13 41 12 31
19 3 8 6 36
345 41
A23 D I P 3 SE3 DEG DEG KM
3 86 2 . 1 2 . 7 UL EMRC
35 .6 2 .2 12 4 1 9 1 51 0 . 4 2 1 . 0 1 2 . 3 1 .2 3 2 207 62 8 . 3 7 2 8 . 8 2 3 . 6 1 .2A 5 3 195 1 3 0 8 . 3 3 8 . 5 1 3 . 4 1.2A 6 2 117 l0l 0 . 2 2 2 . 7
1 5 1 1 7 . 8 . I ML ATVC
2 . 5 H i EMRC 5 1 . 4 2 . 8 1 8
1 5 . 8 1 . 3 h 5 2 5 . 2 3.8A 4
3 . 5 ML EHRC 5.7 2 - 8 4
1 7 . 9 3 . 6 A 4 3 . 4 ML EMRC
27 .6 1 . 9 19 1 3 . 4 2 . 1 16
2 .4 PIL EMRC 1 1 . 9 1 .0A '5
9 . 6 1 .6A 5 2 5 . 9 2 . 7 15
ouIGIn TIME 1988 HR MN SEC
HAY 29 1 5 8 1 3 . 1 2 9 1 7 13 5 5 . 8 29 2 0 4 1 1 5 . 9 3 8 8 H 1 8 . 2 3 0 B 5 9 1 4 . 2
SOUTHERN ALASKA EARTHQUAKES, A P R I L - J U N E 1980 LAT f l LUNG W DEPTH MAG NP MS GAP 0 3 RMS ERH E R Z 0 A21 D I P 1
DEG M I N DEG M I N KM DEG KH SEC K M K H DEG OEG 63 5 7 . 5 1 4 7 5 6 . 5 8 8 . 6 3 . 9 2 1 4 135 2 4 0 8 . 6 8 7 . 8 1 6 . 0 D 95 1 0 59 4 7 . 5 138 3 9 . 4 1 . 9 0 . 9 A 3 2 2 7 8 5 8 8 . 7 6 3 . 8 1 1 . 4 0 163 1 6 1 2 5 . 7 1 4 9 5 5 . 1 4 8 . 3 2 . 4 1 8 a 117 7 8 5 . 3 2 1 . 2 2 . 8 B 177 1 6 2 6 . 1 1 4 7 5 0 . 4 42 .EP 3 . 4 H 6 8 7 . 7 1 4 1 1 . 8 6 . 8 2 . 0 I 4 9 114 7 7 0 . 4 7 1 . 5 3 . 3 0 2 8 7 1
A22 D I P 2 S E Z DEG DEG KH 187 14 1 . 5 2 6 1 1 4 2 . 5 2 6 7 5 0 . 8
A23 D I P 3 DEG DEG 3 3 8 7 3
6 9 74 7 6 8 5
6 1 3 5 . 6 1 4 6 2 5 . 7 3 1 . 9 2 . 0 I 8 9 8 4 55 8 . 7 4 0 . 9 1 . 5 A 2 7 8 3 6 0 2 0 . 1 1 4 1 1 1 . 1 1 0 . 2 1 . 2 A 7 5 1 2 3 9 6 0 . 5 5 1 . 1 5 . 1 C 167 4 5 9 5 5 . 1 1 3 5 4 6 . 6 8 . 5 2 . 4 7 5 1 5 3 I82 1 . 3 8 5 . 7 6 . 9 C 3 3 1 4
2 . 5 HL EHRC 6 1 3 5 . 5 1 4 9 4 8 . 7 5 3 . 3 2 . 2 1 2 8 181 4 1 0 . 3 2 1 . 8 2 . 8 A 2 9 8 0 6 0 1 3 . 2 1 4 1 1 5 . 8 1 8 . 8 1 . 3 1 1 8 1 1 1 6 6 8 . 3 0 1 . 8 3 . 9 0 84 8
6 2 9 . 3 1 4 3 3 2 . 1 6 8 3 6 . 6 1 4 1 4 4 . 7 6 1 5 9 . 7 147 4 6 . 1
2 . 9 ML A W C 5 9 1 7 . 6 1 5 3 4 . 2
3 . 8 PIL ATVC 68 3 8 . 7 1 1 3 4 9 . 0
1 1 , 1 2.B 4 4 1 2 0 1 0 8 0 . 3 3 1 . 0 HL EHRC - 0 . 9 1 . 9 - 9 6 122 105 B . 2 1 2 . 0 M t EMRC
1 . 9 ML EMRC
6 1 2 0 . 9 1 5 8 3 1 . 4 4 2 . 2 2 . 8 1 6 9 8 3 7 9 0.52 1 . 1 3 . 7 0 157 1 6 5 1 8 . 5 1 3 5 4 8 . 4 0.0 1.BA 5 5 2 0 8 1 7 5 1 . 3 0 5 . 1 7 . 1 6 2 6 1 1 0
2 . 1 ML EMRC 6 1 2 . 7 1 4 6 2 8 . 4 7 . 5 2 . B 25 7 5 1 36 8 . 6 3 8 . 7 0 . 9 A 2 6 1 15
2 . 1 ML EMRC 6 0 2 3 . 5 141 1 3 . 3 1 4 . 0 1 . 6 5 2 1 6 9 94 1 . 5 1 2 . 2 6 . 2 C 3 4 4 1 0
ORIGIN TIME 19816 HR HN SEC
JUN 3 10 59 26.6 3 . 7 MB
L A 1 N LONG V DEG M I N DEG M I N 59 5 8 . 3 152 38.3
3.8 HL ATUC 68 2.5 139 21.9 59 59.8 140 25.6 61 39.3 149 38.7 60 17.6 140 56.1
SOUTHERN ALASKA EARTHQUAKES. APRIL - DEPTH MAG NP ns GAP 03 RHS ERH
KM DEG KH SEC KM 1B9.2 4 . 3 28 2 87 70 8.59 2.3
FELT I111 AT HOMER 7.0 1.8 4 1 213 71 0.41 10.4 8.6 1.2 5 4 175 68 8.75 7.4 47.1 1.9 12 8 146 46 8.28 1.3 5.1 1.1 7 3 161 106 0.87 3.5
JUNE 1988 E R Z a AZI DIP]
KM DEG OEG 4.4B 324 1
A22 DIP2 D E G DEG 81 6
227 42 14 4 0 27 38 01 16
142 34 14 14
191 5 307 1 1 273 18
5 21 261 28
8 l 26 261 29
1 1 26
2 8 4 4 21 25 178 3 49 21 a 13
33 1 1
1% :: 357 8 224 6
358 0 3 24
01 3 0 107 36 168 I0
177 30
191 10l 48 0 315 31 138 10
32 31 343 15 88 8
268 20
261 39
293 21 9 I7
281 12 182 0 81 20
A23 DIP3 SE3 DEG OEG KH 226 62 3.9
4.8 1.1 6 2 152 86 8.21 2.7 2.8 2.3 6 5 148 169 0.62 4.2
2.6 ML EMRC 26.1 0.5A 3 1 249 108 0.B1 15.2 11.3 1.3 13 6 197 43 43.81 1.4 12.1 1.9 16 8 76 62 0.28 1.3
2.1 HL EHRC
3 4 . 4 1.5A 12 6 146 47 8.43 1.2 14.9 1.1 7 5 143 81 8.54 1.9 26.2 2.2 23 7 183 67 0.45 1.6 15.0 1.3 0 4 132 79 0.23 1.5 8.2 1.9 19 0 68 49 8.55 0.0
2.0 HL EMRC
39.1 2.9 25 7 103 114 8.61 2.6 2.7 2.S 18 7 69 49 8.46 1.1
2 .1 ML EMRC 2.3 1.5 18 4 109 47 0 . 2 6 1.9 7.5 1.3 6 4 136 98 0 .88 3.8
15.0 1.8 20 6 151 56 0.53 1 . 4
2.0 ML EHRC 16.9 1.4 3 3 20B 58 8.17 26.9
SOUTHERN ALASKA EARTHQUAKES, A P R I L - JUNE 1385 O R 1 6 1 N T I M E LAT N LOUG W DEPTH MAG NP NS GAP D3 RMS ERH E R Z 0 A 2 1 D I P 1
I 9 0 B HR HN SEC DEG M I N DEG M I M KM DEG KM 5EC KM KH DEG OEG JUM 6 14 1 0 4 5 . 9 6 2 5 2 . 0 1 4 8 1 8 . 1 2 8 . 6 2 . 5 19 6 1 2 5 151 8 . B 5 1 . 0 3 . 2 B 1 9 2 6
6 1 6 5 1 4 . 9 6 1 1 7 . 0 1 4 6 5 7 . 3 2 8 . 9 2 . 4 2 0 6 4 0 44 8 . 5 4 0 . 9 1 . 5 A 9 6
S E I A 2 2 DTPZ SEZ A 2 3 D I P 3 KH DEG DEG KH DEG DEG
9 . 4 1 . 2 9 2 124 0 1 8 . 2 3 1 2 . 3 1 . 0 3 2 1 9 7 6 2 8 . 1 1 8 . 6 1 . 3 A 4 6 1 7 5 1 4 7 8 . 7 7
1 . 7 H t EMRC
2 3 . 1 2 . 3 7 5 4 5 9 8 . 3 7 0 2 . 9 3 . 1 1 2 5 1 1 8 1 5 0 8 . 3 3 4 3 . 2 2 . 0 1 5 5 44 5 7 8 . 7 3 2 7 . 0 2 . 1 2 0 6 7 9 6 9 6 . 8 4
4 . 1 2 . 1 17 7 6 7 5 1 8 . 3 8 2 . 5 HL EHRC
1 . 7 1 . 1 6 2 1 3 1 1 0 8 8 . 3 0 1 0 . 9 2 . 1 12 5 6 3 58 8 . 2 3
2 . 3 HL EMRC 4 1 . 7 2 . 0 9 3 1 4 7 6 6 8 . 0 9
6 .6 1 . 0 9 3 1 2 7 5 1 8 . 2 2 2 6 . 5 1 . 9 16 5 1 8 8 8 9 0 . 4 2
4 3 . 4 2 . 5 13 4 104 7 9 0 . 4 2 3 5 . 2 2 . 4 10 4 5 8 3 1 0 . 3 4
1 . 9 1 . 2 7 4 1 8 5 5 9 0 . 3 8 8 . 5 1 . 0 5 2 1 5 8 8 2 0 . 4 4
1 2 2 . 5 4 . 0 10 4 I 6 1 1 0 5 1 . 4 5 2 . 3 ML ATVC
B.2 2 . 1 0 4 1 5 7 0 9 1 . 6 5 1 . 5 HI. EHRC
8 . 2 1 . 9 1 6 0 6 4 6 9 0 . 4 5 2 . 2 ML EMRC
2 . 2 2 . 1 5 3 1 3 5 8 0 0 . 6 0 1.6 HC EMRC
1 0 . 3 1 . 7 9 2 1 1 0 7 0 0 . 2 5 1 0 . 8 1 . 8 0 4 1 2 0 6 9 0 . 3 0
2 0 . 2 1 . 5 0 6 1 1 0 3 5 8 . 5 2 1 3 . 6 1 . 9 1 1 7 1 0 2 7 3 8 . 3 3
I . 7 !4L EMRC 1 . 4 1 . 3 6 2 I 4 0 9 9 8 . 1 7
6 6 . 6 4 . 4 3 1 0 5 7 0 1 0 . 5 1 F E L T I I V ? I N THE WILLOW.
1 2 . 1 4 . 4 D 2 6 9 2 1 . 4 3 . 1 8 0 1 1 HOUSTON AREA AND ( 1 1 1
I . % 1 7 8 15 1 2 . 5 6 8 . 0 1 6 7 0 1 . 3 3 4 4 AT PALMER 1 . 0 4 2 1 2 . 0 1 6 9
3 . 8 2 . 1 1 3 7 7 3 7 4 0 . 5 3 2.6 HL EMRC
1 1 . 8 1 .4 0 2 1 4 3 7 5 0 . 1 1

H w m m ~ m Q B P - m m h - m m m h a - o w m ~ n r - ~ + c - m N m t m - m m b - m b h r r - m m N W ~ ~ N m B r - r m - & d m m m Q m m m m - Q r m m ~ mt - r -m t- m m d z r N h h - U P m ~ - N N nN N- n~ m - d - ~ NNN- N.. m
NU-=- m - m m * N % - m r m q m m r ~ m - - + a m - - d m m - - -ha m a b m - N ~ ~ D ~ L D N w m m m m m m m m IN m m m m - m w r - N ~ N N W warn- m h m m Q m m - m r - m b m h m ~ P N - m m -- N nN- - - NN N -N-N N N & ~ N ~ N - N -
x
0 - e N - - & N 4 - - - x k a! w ~ ' p w m ~ - r m h m l c m UIB wmmrnm ~ m r - m m m m q v Q f c m m t q ~ - Q u r m h ~ m N m - ~ m m q a w u r m 8 o m m w m c w m m m ~ - f w m m m m m h r m r ~ m a - m m w m m t - r m ~ m m m m r n ~ h m W ( I r O - - . - - . - - . ~ N - d -3 - --- ----- e,---- - N -4 NN - -NPI
- d J A
Z F r Y m 3 . m * m + . y?: T y y r - m - . . . . . . . . . . . . . . m w - m m h N m m N mlmqq mT7yrm ??q?? & x n z $ & m a m u m m m m m m m m m n ~ b n m m - m ~ d m m m h m h m m m m r - b - ~ h m m m e r w N .I? EIVU-l * -- p.--.1- 4 - d N d +d Y)- -17 r .17 PNDN* P d .". N m
r m - B u m + m m - u c o m m m m m n h m y y y m ~ r ~ m ~ ~ m m - m m w m r - m w m B P t . m m v o . . . . . . . . . . . . . . . . . . . . 3- . . .> . + . . .> . . . . . . . . . . . . . . > a ~ m m v t - m h - t . b + ~ - m ~ m h - w m m - Q w w m t m + - U Y ~ N - ~ ~ 0 - m m ~ b m h m ~ m r . m
0 n-Pu-? n - m m U - - m m m - m c - - - e n - e q n--A m ~ m - r r n r m m m N Y1 I U O u - m - ~ m Q m m m d m m Q Q C - - I---- m - m - - m d m - - - h Q a - Q m m - m m m m m h h m A m r r m z r r r r P r P r t m * v * m r r w r rrrrrr r++- v m r w q r r r m * m m m r r r
- - C - - --+ -e _Id-.-. _---- " ---- - ----- m f ?
= E y y y m ? * h m m ~ - m m m m m m m n a w - ?:ma-* m a - h m m h ~ - m m m - m . . . . . . . . . . . . . . . . . . . . . . . . . . . . . . . . . ". ?".e?m.T Z ~ P N m o m r u ~QQPI W N N ~ U m m - m m m - - ~ m * m m - m m m m w *
k m - m 2 :2z - 2 - -m- - m N N - N N m m - P m N - N m - * - m - m N- -- W U - m h m - m n h - m a r n n m m ~ ~ ? t ? q h m m ~ m n m e m 7 n f y q y m . . . . . . - h m h w x u . . . . . . . . . . . . . . . . . . . . . . . . *ammu7 m m m Q a ~2 w m m m ~ r n ~ h m m h e & Q m m m - 8 ~ - r w ~ h h - v m m m m WN-0- I- ~ N N N r - m + PIN m ~ + m - m m - m z t n n + W ~ N N N a-N * -+-t w
ORIGIN TIME 198H HR MN SEC
Jun IS 17 10 19.4 15 17 23 46.8 15 18 16 7.4
LAT N LONG V DEG MIN DEG H I M 61 56.7 149 4.5 62 51.5 149 3.9 62 3.0 148 41.4
2 . 7 HL ATUC 62 16.2 148 28.6 60 1.6 153 16.6
3.9 HL ATUC
SOUTHERR ALASKA EARTHOUAKES, A P R I L - DEPTH MAG NP MS GAP 03 RMS ERH
KH DEG KM SEC KM 3.4 1.6 I0 2 211 54 8 . 5 3 3 . 1
30.4 3.3 15 3 104 141 B.59 2.1 25.0 3.8 22 2 84 7 3 0.92 2.8
JUNE 19 ERZ 0 KH
3.5 B 3.2 8 1 . 7 A
2.8 B 5.5 B
2.5 B 1.n A 2.8 B
22.4 D 5.4 C
11.9 D 4.1 C 5.5 C 2.8 B 7.6 C
4.3 B 6.2 C 17.4 D 16.5 0 2.1 A
2.2 B 2.2 A 2.4 A 5.7 C 2.5 A
4.0 B 6.4 C
2 . 6 B 1.3 A 6.3 C
1.9 0 4.2 B 1.0 A
15.7 D 3.0 0
2.3 A 1.6 A 2.1 B 1.7 A 1.2 A
6.0 C 24.9 D 4.7 B 7.3 D 3.1 B
88 A21 DIP1 DEG DEG 162 0 at 4 88 15
186 30 134 3
187 4 3 17
01 2 143 3 282 2
334 19 349 16 329 24 263 4 281 17
144 20 174 10 388 B 341 14 292 3
316 17 0 2
279 1 1 298 2 f 4 5 9
199 1 349 6
9L 5 5 1
21 4
I6 14 92 1 86 13
205 0 01 3
283 8 262 2B
6 16 192 21 288 7
383 7 294 4 311 I5 198 38 336 23
SEI A 2 2 DIP2 KH DEG DEG
3.1 261 20 1.4 333 10 1.8 1 8 2 15
SE2 A23 DIP3 KM DEG DE6 1.B 52 67 1.8 198 69 2.0 315 69
61 6.2 149 58.3 60 15.3 153 22.4
4.2 HL ATUC 61 58.8 149 31.3 61 5 8 . 3 149 11.5
3.2 H L EHRC 105.9 4.3 14 3 172 237 8.36 7 . 7 10.9 1.9 5 2 231 74 8 . 5 5 2.5

O R I G I H TIME 1388 HR MM SEC
J U H 18 13 28 8.6 18 I 8 41 39.9
LAT H DEG HlM 61 58.4 68 14.1
68 2.3 59 58.7 61 17.7
60 18.6 6 8 10.1 51 40.0 51 27.4 60 11.5
6 0 14.3 6 0 6.7 63 17.8 6fl 22.3
60 12.7
6 8 19.1
6 8 12.3 61 23.3 61 19.0 61 47.6
61 13.9 63 56.1 61 47.6 62 46.4 68 17.3
59 48.3 6 0 20.5 6 0 18.2 59 5.2 59 5.5
60 15.H 6 0 6.9 68 28.6 6 8 45.2 68 10.0
68 12.2 6 0 37.1
68 5 8 . 3 61 24.6 60 13.3
68 15.8 60 6.2 68 12.0 68 11.2
68 17.9
L O W V OEG H I M 146 41.4 140 43.5
148 16.3 141 5.2 146 29.8
141 15.1 141 28.7 149 57.3 149 57.3 148 48.8
140 57.3 145 46.3 148 3.2 148 58.1
140 39.8
141 26.5
148 41.2 147 25.7 158 39.6 149 35.1
149 18.6 149 15.0 149 26.0 l4B 28.9 141 40.1
139 16.9 140 47.3 141 12.6 139 2.0 139 8.1
141 17.4 141 6.9 147 18.3 147 17.6 145 52.3
141 H.l 141 45.7
150 23.3 146 36.2 148 59.9
l4H 59.4 141 3.3 148 5 9 . 7 148 59.8
140 46.2
SOUTHERN ALASKA EARTHQUAKES. A P R I L - DEPTH MAG NP n s GAP 0 3 RHS ERH
KM DEG KM SEC KM 36.4 2.7 16 3 97 64 0.36 2.7 18.6 2.3 10 6 85 76 0.20 I .El
2 .2 HL EMRC 27.1 1.5 5 3 158 64 0.22 10.7 6.6 1.9 7 3 103 53 0.26 1.7 16.9 2.2 26 a 47 37 0.71 0.7
14.3 1.6 18 6 154 64 0.12 2.0 26.9 6.7A 4 4 145 91 8.27 16.2 63.3 3.4 1 1 6 140 181 0.69 8.1 3.1 1.9 16 8 61 70 8.56 1.1
2.2 ML EMRC 15.0 2.3 16 10 90 63 8.68 1.5
2.5 ML EMRC
8.6 2.a 15 9 62 49 8.38 1.2 2.1 ML EHRC 17.6 1.3 6 5 174 119 0.26 3.9 15.2 2.3 24 12 57 59 0.30 8.9 55.B 2.2 10 9 149 87 8.27 2.6 13.8 1.3A 6 6 167 61 0.35 1.7
6.8 1.6 8 6 148 6 0 0.31 2.3 25.4 2.5 22 4 6 0 71 8.58 1.5
2 . 7 HL EMRC 42.8 2.1 13 8 9 0 6 8 0.31 1.9 11.4 1.9 19 8 140 39 8.55 1.8 4.3 1.6 9 6 151 61 0.25 2.7
3.8 1.1 6 3 155 83 0.26 3.7 9.9 1.5 7 2 136 81 0.51 9.7 6.4 1.1 7 3 I58 61 8.26 4.5 8.2 2 . 0 13 9 76 6 0 0.37 1.5
1.9 ML EMRC
J U N E 1980 ERZ O A 2 1 D I P 1
K t 4 DEG OEG 1.6 B 166 17 2.8 A 305 0
A22 OEG DIP2 DEG
81 38 35 40
16 22 290 28 308 10
81 16 8 38
81 19 186 5 212 35
7 31
206 276 34 2 358 16
357 27
1 1 21
13 41 211 13 172 5 340 44
167 l i 114 3 87 30
1 15 17 16
261 21 33 I8 15 21
261 233 28 31
326 18 16 38
261 23 158 30 219 24
3&3 35 81 9
1 17 283 19 349 36
7 23 209 28 355 37 18 32
01 29
A23 DTP3 OEG DEG 278 49 215 5 0
174 66 185 62 170 77
2H9 57 188 52 245 49 355 85 357 49
201 50 352 51 123 80 280 78
19J 62
187 69
219 46 66 75
352 05 173 45
351 78
328 287 86 58 142 77 231 71
39 54 203 72 189 69 50 51
100 49
196 57 196 52 30 59 19 52
354 58
19n 53 223 56
I78 73 113 71 185 53
196 67 15 61
175 53 191 58
207 42
m t m - 4 ' W N m N T?"? T"?"S?c-?if! " 77: . . . . . . . . . . YYW?S - - m 8 m N - r t m r N h -- -N--- -N de- UI-@-- N m m m F ~ - N - N N
m m m m m ~ W W - P L m - m -- w m m m t *N m - ~ + ~ m t - m m - b m ~ m ~ m m - w h * INW m m a m t * m m m m m - m v m ~ - m m m m t
CN p N N m - m R N - m N- - m N N m m
m m m m ~ m w t m f 7 ~ m m t m m w ~ q m m e -m- a - m m h *N &-'A m m m m t h t - - m - ~ m t m m m m q m m m ma a m + m m m m d m - N m m - m m - ~ ~ N N - NN-- -N - ~ m m r . ~ m N
D U 4 U d
m y - m y . . . m m - m e d
aanuo m m m m u m m u a a m u u m a m a a u d o u u u m a- oou
wqmP- mbbwm ~ U I - Q N m ~ m m m m m m a - m m q v - m - - - m ~ m m m ~ m ~ r h r m u - @ N m m - m q m m m u m f B m m - - m m m m + N N-C3 - - -N- -N N - N m -
- w A m * m m m m m m m - N W m W m - N m m hdWL0* m m m NN --- --N ed -- NNN
--NNN NNNNN N N N m m m m m m m mm m m m ) r w t e t t ttt
NNNNN NNNNN NNN NN NNNNN NN NNN NNNNN NN NNN NNNNN
LAT N LONG W DEC MIN DEG W I N 6 1 4.3 147 15.8 59 47.5 138 40.3 68 17.9 ill 10.5 6 8 18.0 141 9.0 68 ta.7 1 4 8 4 4 . 9
SOUTHERN ALASKA EARTHQUAKES, APRIL - JUNE 1988 DEPTH MAG NP HS GAP 03 RMS ERH ERZ A21 D I P 1
KM DEG KH SEC Kt4 KM DEG DEG 14.8 2 .1 28 9 75 51 0 . 6 2 8 . 9 1 . 2 A 195 1
5.8 0.9A 3 3 2 6 9 57 0.77 3 . 4 13 .4 D 3 4 1 1 7 . 8 1.9 18 5 152 92 8 . 2 0 2.2 5.1 C 118 4
16.6 1.iA 5 2 154 122 0.09 6.9 9.5 C 307 4 15.8 2 . 2 15 7 9 1 73 0 .32 1.7 2 . 9 6 94 2
2 .1 Hi. EHRC
S E l A12 DIP2 SE2 KH DEG DEG KM
B.9 285 24 8 . 5 OEG DEG Kt4 183 66 1.3
77 77 13.3 211 7 5 5.4 2 0 8 66 18.1
JUN 24 14 18 13 .4 24 17 2 1 3 . 5 24 17 21 16.3 24 19 15 12 .0 24 21 41 16.9
25.6 2.1 10 4 125 49 8 - 3 4 1.2 2 . 0 0 176 2 2.0 0.7A 5 3 1 3 0 5 0 8.10 4 . 1 8 . 1 C 333 I 2
48.6 3.5 28 3 61 45 5 . 3 6 1 . 1 2 .2 A 87 4 FELT ( I I I ) AT ANCHORAGE AND EAGLE RIVER
17.6 1.9 11 4 99 6 8 8 . 4 8 1.5 3 . 3 B 261 8 14.3 8 . 9 A 6 5 143 77 13.21 6.1 7.2 C 81 25
5 . ~ 3.2 13 5 117 IHS 1.29 6 .8 4 .9 c a1 12 3 . f f ML EHRC
11 .7 1.2A 6 3 139 182 8.09 8.7 3.9 C 1 9 0 14 1.9 2 . 9 13 7 113 1B4 1.33 3 . 8 5 . 1 0 329 13
3 . 8 HL EMRC 3 1 . 3 3 .0 27 2 9 1 57 0.69 1.8 1.2 A 264 3 6 1 32.9 1 4 6 13.4
3 .0 ML ATVC 61 3 2 . 5 146 8 . 3 59 19 .3 145 4 .0
58 23.5 137 9.3 6 5 8.3 141 17.7 58 50.9 152 29.0
3 . 7 ML ATWC 59 5.9 130 2.8 6 0 9.8 141 1.3
l 4 , Z 1 . 8 3 3 353 132 8.13 24.6 5 . 8 0 214 18 5.1 2.7 18 6 77 78 8 . 4 8 1 . 7 2.4 A 92 3
3 . 1 H L EMRC
15.1 1 . 4 1 8 1 8 1 3 0 47 0.37 1.5 1.7 A 266 17 1 . 9 3.7 11 4 187 2 2 2 0.47 11.1 12 .8 D 322 2
3 . 4 H l EMRC 13.9 2.1 16 9 153 8 2 8 .53 1 . 2 1.5 A 354 13 1 8 . 3 1.9 18 9 8I 63 0 .30 1 . 4 2.3 A 199 4 8 . 9 8 .9 5 4 1 5 0 49 0.64 5 .0 6 .1 C 328 I 5
14.1 2 3 21 t i 80 76 8 .37 1.3 1.7 A 197 1 130.7 4.7 29 5 1 2 3 1 6 0 8 . 5 5 2 . 5 4 . 5 B E l 9
FELT AT PALMER 20.8 1.7 1 1 9 87 71 1.08 1.4 5 . 5 6 I 4 2 1 10 .7 1 . 7 13 7 172 73 0.54 1.6 3 . 4 B 181 1 29.3 3.5 23 6 1 2 1 192 8.68 4.8 7 .8 C 196 4
6 1 19.5 1 4 7 17.9 62 53.8 1 5 8 5 8 . 8
3.8 ML ATUC 61 4 . 1 1 5 0 51.9 61 56.5 149 42.8 63 22.0 149 18.3
3 .1 ML ATUC

ORIGIN TIME 1988 HR HM SEC
J U K 2 9 1 4 1 .4
LAT U LONG W DE6 H I N DEG K I N 61 2 3 . 4 15B 4 3 . 8 6 8 1 4 . 1 1 4 8 1 4 . 5 6 0 1 9 . 3 146 3 7 . 5 61 4 1 . 4 149 4 8 . 6 6 s 5 6 . 1 149 4 3 . 3
SOUTHERN ALASKA EARTHOUAKES. APRIL - J U N E 1985 DEPTH MAG NP NS GAP 0 3 RMS ERM ERZ O A21 D I P 1
KH DEG KM SEC KM KM DEG OEG 5 6 . 8 1 .7 12 1 8 7 5 6 4 8 . 3 5 1 . 7 2 . 4 A 262 2
8 . 9 1.1A 4 1 185 1 0 8 8 . 2 1 1 4 . 1 11.0 D 384 8
A22 D I P 2 DEG DEG 1 7 1 25
38 2 6 20B 11 357 31 116 2 2
171 3 8 99 3 9 3 0 2 8
295 15 3 9 2 0
173 21
22 18 8 1 0
5 25 174 8
285 3 1 198 29
197 17
347 195 3 5 2 8
8 1 28 3 4 0 4 3
81 24 344 4 1 3 2 0 3 3
81 3 3 94 2 7
3 5 1 2 9
3 5 1 2 9 2 8 8 4 3
197 3 0
198 3 8
343 3 5 285 37 344 27
81 3 5 3 3 3 34
333 197 34 36 346 37
8 1 27 3 5 1 34 2 0 1 31 189 29 334 41
A23 D I P 3 DEG OE6 356 65 198 6 3
6 6 74 199 5 7 2 9 0 6 8
344 6 0 250 4 9 186 6 8 144 7 3 1 9 8 6 7
358 6 9
185 8 8 2 2 0 6 2
195 6 5 312 79
154 47 359 6 8
17 7 3
202 49 347 5 9
224 5 2 1 9 0 45
2 1 0 191 5 3 46 281 4 3
286 4 1 3 1 8 5 5
199 5 8
2 0 0 5 8 2 46
8 6 0
5 51
202 4 8 3 5 0 4 7 2 8 1 5 7
289 41 285 42 195 40
12 5 4 197 49
2 1 3 5 2 198 53 327 4 4 346 5 9 189 43
1 5 . 5 2 . 1 6 3 1 3 1 1 2 6 0 . 8 8 5 . 8 1 1 . 9 D 263 2 1 . 7 HL EMRC
3 7 . 1 2 . 0 8 5 8 2 94 0 . 2 9 2.5 3 . 2 8 2 9 1 3 178 .4 4 .4 25 L 8 3 125 8 . 4 2 2 . 8 6 . 5 C 3 2 4 1
61 2 4 . 7 158 1 3 . 0 5 9 5 3 . 9 153 3 8 . 5
3 . 4 ML ATVC 6 0 12 .2 141 1 2 . 9 61 2 8 . 6 151 1.7
1 3 . 5 2 . 1 13 8 179 7 4 8 . 3 4 4 .4 4 . 6 6 177 2 7 1 4 . 6 4 .B 24 2 7 9 7 2 0 . 4 9 2 . 5 1 . 7 A 183 0
4 . 3 ML EHRC FELT I I V ) IIY THE I C Y BAY AREA AND AT YAKUTAT 1 3 . 9 2 . 6 15 7 110 7 2 0 . 7 9 3 . 1 1 .3 6 287 8
3 . 1 ML EMRC 5 . 4 1 . 4 7 6 124 7 8 8 . 5 8 2 . 3 2 - 5 6 9 0 18 7 . 8 1 .3A 6 3 1 3 8 7 5 0 . 6 2 8 . 6 7 . 8 C 98 12
59 5 6 . 8 141 9 . 5 5 . 1 ML ATUC
59 5 4 . 3 141 9 . 9
6 . 5 t . 6 A 6 1 123 10B 8 . 1 5 5 . 1 7 . 8 C 326 8 8 . 1 2 . 3 15 7 92 73 8 . 4 3 2 . 8 2 . 0 0 8 9 11
2 . 7 ML EKRC 4 . 5 0 . 9 6 4 124 1 8 1 8 . 3 7 3 .3 4 . 3 0 327 18 8 . 8 1 .4 5 6 127 76 8 . 4 2 4 . 1 4 . 2 0 8 6 1 1 5 . 6 1.4A 6 5 1 2 0 9 8 8 . 4 1 4 . 7 4 .4 0 8 t 2 8
5 9 58 .6 1 4 1 6 . 7 6 1 4 2 . 9 I 4 9 3 5 . 9
3 . 8 HL ATUC 6 8 0 . 2 1 4 1 4 . 6 1 . 9 2 . 5 17 6 9 5 75 8 . 6 3 2 . 0 2.9 0 8 8 13
3 . 8 HL EMRC 3 . 7 1 .8A 6 4 122 77 B .45 6 . 0 9 . 5 C 8 9 13 9 . 1 3 . 0 25 4 8 0 74 0 . 4 1 2 . 5 2 .4 0 1 8 1 9
59 5 7 . 5 141 9 . 6 59 5 8 . 8 141 6 . 7
4 . 5 ML ATUC
59 5 5 . 8 I 4 1 7 . 9 . 8 US 5 .2 ML ATUC 59 5 7 . 0 1 4 1 8 . 6
1 4 . 5 4 . 3 24 # 105 7 3 0 . 5 0 2 . 4 1 .7 A 105 4 FELT { I V ) In THE ICY B A Y AREA AND AT YAKVTAT
1 1 . 9 2 . 3 17 5 9 6 7 2 8 . 2 6 2 . 9 2 . 3 8 103 6 2 . 8 ML EMRC
8 . 8 1.ZA 6 3 1 2 1 7 9 0 . 4 1 3 . 9 4 . 3 0 8 8 2 0 7 . 3 8 . 9 A 6 3 1 3 0 01 8 . 2 9 0 . 5 6 . 9 C 1 8 1 18 5 . 6 1 .9 9 5 1 2 5 7 9 8 . 3 8 2 . 6 3 . 9 B 8 3 17
2 . 9 HL EMRC

ORIGIM TIME I980 HR HN SEC
JUB 3 8 19 4 2 1 1 . 1 3 0 19 42 5 6 . 8 3 8 19 1 3 8 . 7
LAT N DEG H I N 5 9 4 9 . 3 5 9 5 6 . 9 5 9 5 6 . 3
61 4 5 . 6 59 5 5 . 9
5 9 5 3 . 9 6 3 1 3 . 1 5 9 53 .7 5 9 5 8 . 3 5 9 57 .4
59 5 9 . 5 59 5 6 . 8 58 4 4 . 0 5 9 4 3 . 2 5 9 5 6 . 7
5 9 5 6 . 7 5 9 5 6 . 5 5 9 5 8 . 2 59 59 .4 59 5 6 . 6
5 9 5 9 . 0 5 9 5 6 . 0 5 9 5 8 . 0 5 9 5 7 . 6 5 9 5 5 . 7
5 9 5 6 . 7 5 9 5 8 . 2 59 5 9 . 2 59 5 8 . 5 59 5 4 . 7
5 9 5 4 . 3 5 9 5 1 . 7 5 9 4 8 . 5 60 1 .5 5 9 5 9 . 1
59 5 7 . 8 59 5 5 . 4 5 9 5 6 . 8 5 9 5 3 . 6 5 9 5 5 . 7
59 5 8 . 1 59 5 6 . 2
LONG V DEG M I N
141 3 . 2 141 4 . 6 1 4 8 58 .2
1 5 0 28.6 141 1 .B
1 6 1 1 .3 149 3 3 . 7 141 8 . 6 141 0 . 0 1 4 8 5 9 . 3
141 2 . 8 141 2 . 2 138 4 7 . 7 140 5 6 . 6 141 4 .4
1 4 1 4 . 8 141 5 . 7 1 4 8 5 9 . 3 141 1 .0 141 5 . 5
141 2 . 1 141 2 8 . 7 141 1 . 9 141 3 . 7 141 6.8
141 1 . 5 1 4 0 6 0 . 8 141 2 . 9 141 8 . 2 141 1 . 1
141 1 . 4 140 59 .5 1 4 1 6 . 9 1 4 0 5 9 . 3 1 4 1 1.0
141 3 . 9 141 8 . 9 141 0 . 2 1 4 1 1 . 8 141 3 . 0
141 6 . 1 141 5 . 4
SOUTHERN ALASKA EARTHOUAKES . APRIL - DEPTH MAG NP US GAP 0 3 RHS ERH
KU DEG KM SEC KH 11.8 1.2A 6 3 185 81 0 . 5 7 8 . 9
8 . 7 8 . 8 A 6 1 1 2 8 81 8 . 1 9 12 .1 8 . 6 2 . 1 13 6 1 3 1 7 5 0 . 6 4 2 . 8
2 . 2 HL EMRC 45 .4 2 .6 17 3 149 67 0 . 2 7 2 .4
7 . 8 1 .1A 6 3 129 77 8 . 6 1 7 . 8
JUNE 1 9 8 8 ERZ Q A Z I D I P 1
KH DEG OEG 3 . 6 C 2 0 3 1 1
1 0 . 1 D 316 24 3 . 7 0 6 2 12
AZ2 D I P 2 DEG 104 DEG 4 0
81 3 4 345 32
1 9 0 2 2 341 27
197 132 3 8 2 9 0 35
196 37 337 24
61 2 0 324 3 8
81 34 216 29
8 1 2 3
81 3 5 194 35 3 3 2 2 8
01 18 327 34
61 3 8 203 39
01 31 3 4 2 3 0 280 3 5
335 41 3 3 2 2 8
81 10 198 41 197 33
3 4 2 38 103 2 7 112 4 2 356 36
81 27
3 5 41 282 3 0 339 36 2 0 0 3 5 191 3 8
281 261 3 9 4 0
A23 D I P 3 DEG OEG 385 48
205 1 9 0 3 8 5 5
8 6 8 214 5 0
339 5 4 265 00 316 45
5 9 39 205 5 6
202 5 0 196 3 6 245 9
5 2 5 8 233 6 4
200 41 50 46
283 50 214 62 284 39
212 4 6 354 4 7
219 289 48 5 0 5 2 5 8
192 4 3 206 48 269 7 8
5 4 0 346 5 3
202 44 2 4 8 5 8 386 4 7 200 5 0 2 1 1 49
1 9 8 78 46 4 9
280 335 46 45 324 41
3 3 0 42 83 3 9