menr ipa12/cs02 calculation tool report
TRANSCRIPT
European Union / Ins
MENR IPA12/CS02
Calculation Tool Report
Version 3
July 2017
This Project is co-funded by the European Union and the Republic of Turkey
European Union / Instrument For Pre-
Acession Asistance (IPA) Energy Sector
Technical Asistance Project

European Union / Instrument For Pre-Accession Assistance (IPA) Energy Sector Technical Assistance Project
Contract Number MENR IPA12/CS02
Summary
Project Title: European Union (EU) / Instrument For Pre-Accession Assistance (IPA), Energy Sector Technical Assistance Project, Consulting Services Development of the Renewable Energy Sector
Number: TF 016532 - TR
Service Contract: MENR12/CS02
Commencement Date: 17 September 2015
Completion Date: 18 Months
Employer: General Directorate of Foreign Relations and EU of the Ministry of Energy and Natural Resources
Observer: EUD (European Union Delegation)
Lead Terna Plus Srl:
Name: Terna Plus Srl
Address: Viale Edigio Galbani, 70 – 00156 Rome, Italy
Tel. number: +39 06 83 138 340
Contact person: Antonio Moretti
JV:
Name: MWH (Montgomery Watson Harza)-Gazel Enerji Yatırımları Taahhüt A.S
Address: Salih Omurtak Sok. No:61
Koşuyolu, Kadıköy / İstanbul
Tel. number: +90 216 545 32 28
Contact person: Dr. Murat Sarıoğlu
Date of report: 1 July 2016
Date of revision 25 November 2016
Date of 2nd revision
Author of report:
30 June 2017
Date of 3rd revision
28 July 2017
European Union / Instrument For Pre-Accession Assistance (IPA) Energy Sector Technical Assistance Project
Contract Number MENR IPA12/CS02 Page - 3 -
Table of Contents
SUMMARY ...................................................................................................................................................... - 2 -
LIST OF FIGURES .......................................................................................................................................... - 4 -
LIST OF TABLES ............................................................................................................................................ - 5 -
1 INTRODUCTION ...................................................................................................................................... - 7 -
2 CALCULATION TOOL STRUCTURE ..................................................................................................... - 8 -
2.1 INPUTS ................................................................................................................................................ - 8 - 2.1.1 Project Information ..................................................................................................................... - 8 - 2.1.2 Financial Parameters ................................................................................................................. - 8 - 2.1.3 Loan Details ............................................................................................................................... - 8 - 2.1.4 Technical Parameters ................................................................................................................ - 9 -
2.2 REFERENCES AND ASSUMPTIONS ....................................................................................................... - 11 - 2.3 OUTPUTS .......................................................................................................................................... - 11 -
3 CALCULATIONS ................................................................................................................................... - 13 -
3.1 TECHNICAL CALCULATIONS ................................................................................................................ - 13 - 3.1.1 Solar PV ................................................................................................................................... - 13 - 3.1.2 Wind ......................................................................................................................................... - 15 - 3.1.3 Biogas ...................................................................................................................................... - 17 - 3.1.4 Landfill Gas .............................................................................................................................. - 18 - 3.1.5 Heat Pump ............................................................................................................................... - 19 -
3.2 FINANCIAL CALCULATIONS ................................................................................................................. - 20 - 3.3 EMISSION CALCULATIONS .................................................................................................................. - 25 -
ANNEX – CASE STUDY ............................................................................................................................... - 27 -

European Union / Instrument For Pre-Accession Assistance (IPA) Energy Sector Technical Assistance Project
Contract Number MENR IPA12/CS02 Page - 4 -
List of Figures
Figure 3-1: Sample Weibull distribution .......................................................................................................... - 16 -
European Union / Instrument For Pre-Accession Assistance (IPA) Energy Sector Technical Assistance Project
Contract Number MENR IPA12/CS02 Page - 5 -
List of Tables
Table 3-1: Loss Scenarios for each Panel Type ............................................................................................. - 15 - Table 3-2: Insurance, Operation and Maintenance Cost for each Technology ............................................... - 21 - Table 3-3: Example of a calculation table ....................................................................................................... - 22 - Table 3-4: Example of an Output Table.......................................................................................................... - 25 -

European Union / Instrument For Pre-Accession Assistance (IPA) Energy Sector Technical Assistance Project
Contract Number MENR IPA12/CS02 Page - 6 -
Acronyms
COP Coefficient of Performance
EPC Engineering Procurement Construction
EC European Commission
FIT Feed-in Tariff
IRR Internal Rate of Return
GDRE General Directorate of Renewable Energy
MENR Ministry of Energy and Natural Resources
LHV Lower Heating Value
NPV Net Present Value
PC Project Consultant
PV Photovoltaic
SPT Simple Payback Time
WB World Bank
European Union / Instrument For Pre-Accession Assistance (IPA) Energy Sector Technical Assistance Project
Contract Number MENR IPA12/CS02 Page - 7 -
1 Introduction
This project is executed by the Ministry of Energy and Natural Resources (MENR) and administered by the World Bank (WB). WB signed an administrative agreement between the European Commission (EC) and a grant agreement between MENR in order to finance the implementation of the project.
In the context of the MENR IPA12/CS02 project, the Project Consultant (PC) has designed simple calculation tools in order to assess feasibility and bankability of small-scale renewable energy projects. PC has paid strict attention to develop tools, which are user friendly, simplified for everyone to use, but detailed enough for an accurate technical and financial representation of renewable energy projects. In order to reach a wide range of stakeholders, they were designed on Excel platform because it is a widespread software.
The tools will play an important role in project assessment process where at least 160 project assessment reports will be written. The projects will be analysed based on financial and technical parameters, which were specifically chosen for each project type. The projects will be also evaluated based on a key performance indicator – also determined by PC – which is the ratio of annual net electricity production per total investment amount.

European Union / Instrument For Pre-Accession Assistance (IPA) Energy Sector Technical Assistance Project
Contract Number MENR IPA12/CS02 Page - 8 -
2 Calculation Tool Structure
PC has determined key inputs, outputs, and KPIs for each type of renewable energy technology. Five calculation tools were developed for PV solar, wind, biogas, landfill gas, and heat pump projects, which are expected to constitute the most common project assessment applications.
2.1 Inputs
Project information, financial parameters, and loan details are common inputs for all tools. After entering the investment amount for their proposed projects, the users also need to select an appropriate loss scenario that can change depending on technical and environmental conditions. However, in heat pump tool, the selection of loss scenario is not applicable.
2.1.1 Project Information
• Project Name
• Name of the Engineering Procurement Construction (EPC) Company or the Beneficiary
• Type of Installation1
• Model & Brand of the Equipment
• Type of Equipment Technology 2
• Project Location (Province & District)
• Preferred Loss Scenario
2.1.2 Financial Parameters
• Investment Amount
• Exchange Rate Date and Exchange Rates
• Feed-in Tariff (FIT)
• Period of the FIT
• Distribution Fee
• Insurance, Operation, and Operating Expenses
• Unit Price of the Electricity Used in the Facility
• Unit Price of the Electricity Foreseen after the FIT
2.1.3 Loan Details
• Grace Period
• Debt Term
• Debt-Equity Ratio
• Debt-Equity Amount
• Cost of Debt & Equity
• Weighted Average Cost of Capital is calculated by using Debt-Equity Ratio & Amount
1 This information is specific to PV Solar Tool 2 This information is specific to PV Solar Tool

European Union / Instrument For Pre-Accession Assistance (IPA) Energy Sector Technical Assistance Project
Contract Number MENR IPA12/CS02 Page - 9 -
2.1.4 Technical Parameters
PV Solar
The project location data is needed from the user to get an accurate irradiation and insolation data from the database of PV Solar calculation tool. This data was obtained from Solar Energy Potential Atlas published by General Directorate of Renewable Energy (GDRE). Electricity generation potential of the project is determined mainly through panel inputs. Then, total module area, specific area, PV to inverter ratio, and installed capacity are calculated by using technical inputs entered by the user.
Input Technical Parameters
• Number of Panels • Number of Inverters
• Panel Peak Power • Inverter Output Power
• Panel Dimensions (length, width) • Self-Consumed Electricity
• Slope
Calculated Technical Parameters
• Total Module Area • Module Efficiency
• Specific Area • Installed Capacity
• PV to Inverter Ratio
Wind
Since wind characteristics of a region are highly site specific even in same provinces, no location data is used in the calculation tool. The user enters the number and the rated power of the turbines to be used in the project. Weibull distribution data collected from the site is a necessity for accurate project assessment. Thus, scale and shape parameters need to be entered by the user as well. Then, the user will enter the availability of the proposed plant throughout a year and self-consumption data to complete the necessary steps to get the results. If Weibull data is not presented, the user can choose another calculation method that only requires the expected capacity factor as an input.
Input Technical Parameters
• Turbine Rated Power • Turbine Power Curve
• Number of Turbines • Capacity Factor
• Plant Availability • Standard Uncertainty
• Weibull Scale Parameter • Calculation Method
• Weibull Shape Parameter
• Self-Consumed Electricity
Calculated Technical Parameters
• Weibull Distribution

European Union / Instrument For Pre-Accession Assistance (IPA) Energy Sector Technical Assistance Project
Contract Number MENR IPA12/CS02 Page - 10 -
Biogas
Due to the nature of biogas applications, they require more data than PV Solar and Wind to complete an accurate project assessment. Yearly average waste production data shows the resources that the facility will be able to use. The users are able to enter multiple types of bio-wastes such as animal, agricultural, and forest waste. Dry matter and volatile solid percentage of the waste, and biogas production factor determine the net amount of waste, which can be converted into biogas. Installed capacity, yearly average operating hours, lower heating value of the biogas, self-consumption, motor efficiency, and load factor are used to obtain the project’s net electricity production and revenues.
Input Technical Parameters
• Yearly Average Waste Production • Yearly Average Operating Hours
• Dry Matter Percentage of the Solid Waste • Lower Heating Value of the Biogas
• Volatile Solids Percentage of the Dry Waste • Auxiliary System Consumption
• Biogas Production Factor • Self-Consumed Electricity
• Self-Consumed Biogas • Motor Efficiency
• Installed Capacity • Load Factor
Calculated Technical Parameters
• Yearly Biogas Production
Landfill Gas
Compared to the structure of the biogas tool, landfill gas tool has fewer inputs. The user will not be able to enter multiple waste data, because municipal solid waste, which is the source of landfill gas, is considered as a single source. The user has to insert yearly data, such as operating hours, landfill gas production, and the lower heating value for the landfill gas. As in previously described tools, the user also needs to enter self-consumption, efficiency, and load factor data to get results.
Input Technical Parameters
• Installed Capacity • Motor Efficiency
• Yearly Average Operating Hours • Load Factor
• Lower Heating Value of the Landfill Gas • Self-Consumed Electricity
• Auxiliary System Consumption
Calculated Technical Parameters
• Yearly Landfill Gas Production
Heat Pump
In the heat pump tool, no location data is used. The user has to enter the type of the heat pump and its make/model. Following the entrance of the heat pump type, the user enters its capacity. For an accurate project assessment, COP of the heat pump has to be entered by the user from the datasheet of the heat pump. Then, the user will insert fuel cost and yearly fuel consumption. As in previously described tools, the user also needs to enter average annual working hours.
European Union / Instrument For Pre-Accession Assistance (IPA) Energy Sector Technical Assistance Project
Contract Number MENR IPA12/CS02 Page - 11 -
Input Technical Parameters
• Heat Pump Type • Thermal Energy Used
• Heat Pump Capacity • Fuel Cost
• Coefficient of Performance • Fuel Consumption
Calculated Technical Parameters
• Heat Produced from the Heat Pump
2.2 References and Assumptions
The following assumptions and references are used in order to make calculations more accurately. CO2eq coefficient is taken from "Baseline Study for the Republic of Turkey" report by the European Bank for Reconstruction and Development (EBRD) to calculate yearly CO2 equivalent reduction. The default annual degradation of PV panels is assumed as 0.7%. In addition, it is assumed that the project will be operational for 25 years for solar PV and 20 years for wind, biogas, and landfill gas. Finally, for heat pump it is assumed that the project will be operational for 15 years. Inflation value of Turkey for January 2017 is taken as 9.22%. In calculations, inflation value is adjusted accordingly to the USD exchange rate. Levelized cost of electricity is calculated specifically for each technology as the present value of total costs over the present value of total electricity produced during project lifetime. In the landfill gas tool, the methane content of the landfill gas and the methane density are assumed 50% and 0.676m3/kg, respectively. It is assumed that 1 kCal equals to 0.001162 kWh. Emission values of different fuels such as anthracite, coke, fuel oil, gas (propane, butane, methane, and biogas), natural gas, and lignite are taken from the literature.
• CO2eq Factor • CH4 Density
• Default Annual Degradation3 • Content of Methane4
• Default Operational Year • Emission Factors5
• Inflation • kCal – kWh Conversion6
• LCOE
2.3 Outputs
A single key performance indicator (KPI) is determined for all renewable energy projects based on PC’s experience in the market. It is the ratio of annual net electricity production of the facility per total investment amount (in USD), which was determined to be 1.20. The financial performance of the project is assessed based on common financial indicators such as payback time (PBT), internal rate of return (IRR), and net present value (NPV). The inputs of the users are used to calculate the amount of electricity that can be generated and sold to grid or self-consumed by the beneficiary. Then, the financial model inside of the tool calculates these indicators for each project based on the generated net revenues. In addition to the financial model, levelized cost of electricity, specific investment cost, distribution expense, insurance, operation, and maintenance costs are calculated. These outputs are
3 This information belongs to Wind 4 This information belongs to Landfill gas 5 This information belongs to Heat Pump 6 This information belongs to Heat Pump
European Union / Instrument For Pre-Accession Assistance (IPA) Energy Sector Technical Assistance Project
Contract Number MENR IPA12/CS02 Page - 12 -
also crucial to assess the financial viability of the project. There is also an environmental output that shows the amount of CO2eq emission reduction that each project provides. Finally, in case of wind tool the financial viability of the project is calculated based on three different probability scenarios called P50, P75, and P95. In these scenarios, the net electricity generation varies based on defined probability scenarios.
• Installed Capacity • Payback Time
• Net Electricity Generation • Net Present Values
• CO2eq Emission Reduction • Internal Rate of Return
• Specific Investment Cost • LCOE
• Insurance, Operation, and Maintenance Expense • Key Performance Indicator
• Distribution Expense • Suggested Key Performance Indicator
• Net Revenues • Probability Scenario (P50, P75, P90)

European Union / Instrument For Pre-Accession Assistance (IPA) Energy Sector Technical Assistance Project
Contract Number MENR IPA12/CS02 Page - 13 -
3 Calculations
All the inputs and outputs for every calculation tool are explained in the previous chapter. Each technology has its own unique inputs and formulas to calculate the key performance indicators, net revenues, and other outputs. This chapter explains how the calculations are done.
3.1 Technical Calculations
This sub-chapter explains the methodologies behind technical calculations, which are being used in the calculation tools.
3.1.1 Solar PV
The first output calculated is the Installed Capacity (MW).
𝐼𝑛𝑠𝑡𝑎𝑙𝑙𝑒𝑑 𝐶𝑎𝑝𝑎𝑐𝑖𝑡𝑦 =𝑁𝑢𝑚𝑏𝑒𝑟 𝑜𝑓 𝑃𝑎𝑛𝑒𝑙𝑠 × 𝑃𝑎𝑛𝑒𝑙 𝑃𝑒𝑎𝑘 𝑃𝑜𝑤𝑒𝑟
1,000,000
o The Number of Panels and Panel Peak Power (W) values are user inputs.
o Because the unit of Panel Peak Power is watts, the multiplication is divided by
1,000,000 to calculate the capacity in terms of megawatts.
The second output is the Net Electricity Generation (MWh/year), which needs the
calculation below:
o First, the Total Module Area (m2) is calculated.
𝑇𝑜𝑡𝑎𝑙 𝑀𝑜𝑑𝑢𝑙𝑒 𝐴𝑟𝑒𝑎 =𝑁𝑢𝑚𝑏𝑒𝑟 𝑜𝑓 𝑃𝑎𝑛𝑒𝑙𝑠 × 𝑃𝑎𝑛𝑒𝑙 𝐿𝑒𝑛𝑔𝑡ℎ × 𝑃𝑎𝑛𝑒𝑙 𝑊𝑖𝑑𝑡ℎ
1,000
o The Number of Panels, and the Panel Length and Width are user inputs. These
values can be found in the solar panel datasheet.
o Because the unit of the Panel Dimensions are centimetres, the multiplication is
divided by 1,000 to calculate the module area in terms of square metres.
o Then, the Tilted Irradiation on Module (kWh/m2/year) is calculated. For this, we must
first calculate the Declination Angle (δ) and the Elevation Angle (α). A table for the
whole year is prepared with the results from this calculation.
𝐷𝑒𝑐𝑙𝑖𝑛𝑎𝑡𝑖𝑜𝑛 𝐴𝑛𝑔𝑙𝑒 = 𝛿 = 23.45° × sin [360
365 × (284 + 𝑑)]

European Union / Instrument For Pre-Accession Assistance (IPA) Energy Sector Technical Assistance Project
Contract Number MENR IPA12/CS02 Page - 14 -
o The Earth is tilted by 23.45° and the declination angle varies plus or minus this amount.
o d is the day of the year. So for the 1st of January, d equals to 1, and for the 31st of
December, it equals to 365.
𝐸𝑙𝑒𝑣𝑎𝑡𝑖𝑜𝑛 𝐴𝑛𝑔𝑙𝑒 = 𝛼 = 90° − 𝜃 + 𝛿
o θ is the latitude of the proposed project, it is embedded into excel file per city basis.
𝐼𝑟𝑟𝑎𝑑𝑖𝑎𝑡𝑖𝑜𝑛 𝑜𝑛 𝑇𝑖𝑙𝑡𝑒𝑑 𝑀𝑜𝑑𝑢𝑙𝑒 = 𝐼𝑟𝑟𝑎𝑑𝑖𝑎𝑡𝑜𝑛 𝐷𝑎𝑡𝑎 × sin(𝛼 + 𝛽)
sin(𝛼)
o Irradiation Data (kWh/m2/year) is embedded into the excel file from the Solar Energy
Potential Atlas published by GDRE. Calculation tool has a sheet containing all the
irradiation information for each district of each province in Turkey.
o After their installation, the modules will have a slope of β°, which is also a user input.
The third step is to calculate the Gross Electricity Potential (MWh/year).
𝐺𝑟𝑜𝑠𝑠 𝐸𝑙𝑒𝑐𝑡𝑟𝑖𝑐𝑖𝑡𝑦 𝑃𝑜𝑡𝑒𝑛𝑡𝑖𝑎𝑙 = 𝐼𝑟𝑟𝑎𝑑𝑖𝑎𝑡𝑖𝑜𝑛 𝑜𝑛 𝑇𝑖𝑙𝑡𝑒𝑑 𝑀𝑜𝑑𝑢𝑙𝑒 × 𝑇𝑜𝑡𝑎𝑙 𝑀𝑜𝑑𝑢𝑙𝑒 𝐴𝑟𝑒𝑎
1,000
o The unit of Irradiation on Tilted Module is kWh/m²/year. In order to change the unit
to MWh/m²/year, the multiplication is divided by 1,000.
The fourth step is calculating the Gross Electricity Generation (MWh/year).
𝐺𝑟𝑜𝑠𝑠 𝐸𝑙𝑒𝑐𝑡𝑟𝑖𝑐𝑖𝑡𝑦 𝐺𝑒𝑛𝑒𝑟𝑎𝑡𝑖𝑜𝑛 = 𝐺𝑟𝑜𝑠𝑠 𝐸𝑙𝑒𝑐𝑡𝑟𝑖𝑐𝑖𝑡𝑦 𝑃𝑜𝑡𝑒𝑛𝑡𝑖𝑎𝑙 × 𝑀𝑜𝑑𝑢𝑙𝑒 𝐸𝑓𝑓𝑖𝑐𝑖𝑒𝑛𝑐𝑦
o To calculate the Module Efficiency (%) the following equation is used.
𝑀𝑜𝑑𝑢𝑙𝑒 𝐸𝑓𝑓𝑖𝑐𝑖𝑒𝑛𝑐𝑦 = 𝑃𝑎𝑛𝑎𝑙 𝑃𝑒𝑎𝑘 𝑃𝑜𝑤𝑒𝑟
𝐿𝑒𝑛𝑔𝑡ℎ 𝑜𝑓 𝑃𝑎𝑛𝑒𝑙 × 𝑊𝑖𝑑𝑡ℎ 𝑜𝑓 𝑃𝑎𝑛𝑒𝑙× 1000
o The module efficiency could be entered by the user from the panel’s datasheet,
however to make the tool more user friendly, the module efficiency is calculated from
the panel dimensions.
Finally, the Net Electricity Generation (MWh/year) is calculated by multiplying the generated
gross electricity with the loss scenario.
𝑁𝑒𝑡 𝐸𝑙𝑒𝑐𝑡𝑟𝑖𝑐𝑖𝑡𝑦 𝐺𝑒𝑛𝑒𝑟𝑎𝑡𝑖𝑜𝑛 = 𝐺𝑟𝑜𝑠𝑠 𝐸𝑙𝑒𝑐𝑡𝑟𝑖𝑐𝑖𝑡𝑦 𝐺𝑒𝑛𝑒𝑟𝑎𝑡𝑖𝑜𝑛 × (1 − 𝐿𝑜𝑠𝑠 𝑆𝑐𝑒𝑛𝑎𝑟𝑖𝑜)

European Union / Instrument For Pre-Accession Assistance (IPA) Energy Sector Technical Assistance Project
Contract Number MENR IPA12/CS02 Page - 15 -
o The Loss Scenario (%) is chosen by the user and it changes according to the selected
panel type. For example, for the medium loss scenario, there is a 25% reduction in
Gross Electricity Generation, when Polycrystalline and Monocrystalline panels are
used, while this value is 23% for thin-film panels.
Table 3-1: Loss Scenarios for each Panel Type
Panel Type
Loss Scenario Unit Polycrystalline Monocrystalline Thin-Film
Low % 20 20 18
Medium % 25 25 23
High % 30 30 28
3.1.2 Wind
The calculation tool for wind energy applications has two different methodologies: Weibull Method
and Capacity Factor Method. The methodologies for both of them are found below.
3.1.2.1 Weibull Method
Since wind is variable, statistical approaches are needed to be used to calculate the amount of wind
captured by the wind turbines. The most common approach is using the Weibull distribution, which
calculates the frequency of the hourly wind speeds.
If the Weibull parameters that are shape and scale coefficients are available as a user input,
the first output calculated is the Weibull distribution function through the following equation:
𝑓(𝑣; 𝑘, 𝑐) = 𝑘
𝑐𝑘𝑣𝑘−1𝑒−(
𝑣𝑐)𝑘
Where,
• f: Frequency distribution function • v: Wind speed (m/s)
• k: Shape parameter • c: Scale parameter (m/s)
Microsoft Excel has its own function to create the Weibull distribution as it can be seen in the following equation.
= 𝑊𝐸𝐼𝐵𝑈𝐿𝐿. 𝐷𝐼𝑆𝑇(𝑣, 𝑘, 𝑐)

European Union / Instrument For Pre-Accession Assistance (IPA) Energy Sector Technical Assistance Project
Contract Number MENR IPA12/CS02 Page - 16 -
Figure 3-1: Sample Weibull distribution
The second output is the yearly Gross Electricity Generation (MWh/year).
𝑌𝑒𝑎𝑟𝑙𝑦 𝐺𝑟𝑜𝑠𝑠 𝐸𝑙𝑒𝑐𝑡𝑟𝑖𝑐𝑖𝑡𝑦 𝐺𝑒𝑛𝑒𝑟𝑎𝑡𝑖𝑜𝑛 =
∑𝑅𝑎𝑡𝑒𝑑 𝑇𝑢𝑟𝑏𝑖𝑛𝑒 𝑂𝑢𝑡𝑝𝑢𝑡@𝑒𝑎𝑐ℎ 𝑤𝑖𝑛𝑑 𝑠𝑝𝑒𝑒𝑑 × 𝑁˚ 𝑜𝑓 𝑇𝑢𝑟𝑏𝑖𝑛𝑒𝑠 × 𝑊𝑒𝑖𝑏𝑢𝑙𝑙 𝐷𝑖𝑠𝑡𝑟𝑖𝑏𝑢𝑡𝑖𝑜𝑛𝐹𝑟𝑒𝑞𝑢𝑒𝑛𝑐𝑦
o Rated turbine output at each wind speed and number of turbines are user inputs.
o Weibull distribution that was obtained in the first step in terms of each wind speed is
used as an input.
The third output is the yearly Net Electricity Generation (MWh/year).
𝑁𝑒𝑡 𝐸𝑙𝑒𝑐𝑡𝑟𝑖𝑐𝑖𝑡𝑦 𝐺𝑒𝑛𝑒𝑟𝑎𝑡𝑖𝑜𝑛 = 𝐺𝑟𝑜𝑠𝑠 𝐸𝑙𝑒𝑐. 𝐺𝑒𝑛𝑒𝑟𝑎𝑡𝑖𝑜𝑛 × 𝑃𝑙𝑎𝑛𝑡 𝐴𝑣𝑎𝑖𝑙𝑎𝑏𝑖𝑙𝑖𝑡𝑦 × (1 − 𝑃𝑟𝑒𝑑𝑖𝑐𝑡𝑒𝑑 𝑙𝑜𝑠𝑠𝑒𝑠)
o To calculate the yearly net electricity generation, yearly gross electricity
generation and plant availability are used as inputs.
o Three predicted loss scenarios have been adapted according to PC’s experience.
These scenarios change based on the percentage of forecasted overall losses
forecasted. Estimated overall losses for the low, medium, and high loss scenarios are
14%, 17%, and 20% respectively. Different loss scenarios result in different annual net
electricity generation levels. In order to make an accurate project assessment, PC
team has conducted the assessment based on the medium predicted loss scenario.
3.1.2.2 Capacity Factor Method
The first output in this method is the yearly Net Electricity Generation (MWh/year).
𝑁𝑒𝑡 𝐸𝑙𝑒𝑐𝑡𝑟𝑖𝑐𝑖𝑡𝑦 𝐺𝑒𝑛𝑒𝑟𝑎𝑡𝑖𝑜𝑛 = 𝑅𝑎𝑡𝑒𝑑 𝑇𝑢𝑟𝑏𝑖𝑛𝑒 𝑂𝑢𝑡𝑝𝑢𝑡 × 𝑁° 𝑜𝑓 𝑇𝑢𝑟𝑏𝑖𝑛𝑒𝑠 × 𝐶𝑎𝑝𝑎𝑐𝑖𝑡𝑦 𝐹𝑎𝑐𝑡𝑜𝑟 × 8,760
o Rated turbine output at each wind speed, number of turbines, and capacity factor
(%) are user inputs.
European Union / Instrument For Pre-Accession Assistance (IPA) Energy Sector Technical Assistance Project
Contract Number MENR IPA12/CS02 Page - 17 -
3.1.3 Biogas
The first output calculated is the waste specific yearly Biogas Production (Nm3/year).
𝐵𝑖𝑜𝑔𝑎𝑠 𝑃𝑟𝑜𝑑𝑢𝑐𝑡𝑖𝑜𝑛 = 𝑌𝑒𝑎𝑟𝑙𝑦 𝐴𝑣𝑒𝑟𝑎𝑔𝑒 𝑊𝑎𝑠𝑡𝑒 𝑃𝑟𝑜𝑑.× 𝐷𝑟𝑦 𝑀𝑎𝑡𝑡𝑒𝑟 % × 𝐷𝑟𝑦 𝑀𝑎𝑡𝑡𝑒𝑟 𝑉𝑜𝑙𝑎𝑡𝑖𝑙𝑒 𝑆𝑜𝑙𝑖𝑑𝑠 % × 𝐵𝑖𝑜𝑔𝑎𝑠 𝑃𝑟𝑜𝑑. 𝐹𝑎𝑐𝑡𝑜𝑟
o Yearly average waste production, percentage of dry matter, percentage of dry
matter in volatile solids in waste, and biogas production factor are user inputs.
The second output calculated is the waste specific yearly Net Biogas Production (Nm3/year).
𝑁𝑒𝑡 𝐵𝑖𝑜𝑔𝑎𝑠 𝑃𝑟𝑜𝑑𝑢𝑐𝑡𝑖𝑜𝑛 = 𝐵𝑖𝑜𝑔𝑎𝑠 𝑃𝑟𝑜𝑑𝑢𝑐𝑡𝑖𝑜𝑛 − 𝑆𝑒𝑙𝑓 𝐶𝑜𝑛𝑠𝑢𝑚𝑒𝑑 𝐵𝑖𝑜𝑔𝑎𝑠
o Waste specific amount of biogas that is self-consumed is a user input.
The third output calculated is the waste specific Primary Energy of the Biogas (kWhth/Nm3).
𝑃𝑟𝑖𝑚𝑎𝑟𝑦 𝐸𝑛𝑒𝑟𝑔𝑦 𝑜𝑓 𝑡ℎ𝑒 𝐵𝑖𝑜𝑔𝑎𝑠 = 𝑁𝑒𝑡 𝐵𝑖𝑜𝑔𝑎𝑠 𝑃𝑟𝑜𝑑𝑢𝑐𝑡𝑖𝑜𝑛 𝑥 𝐿𝐻𝑉 𝑜𝑓 𝐵𝑖𝑜𝑔𝑎𝑠
o Waste specific Lower Heating Value (LHV) of biogas is a user input.
The first two steps as mentioned are waste specific calculations. If there are more than one
type of solid waste that fed to the system, these calculations have to be done for each type of
solid waste (e.g. cattle manure, chicken manure, corn silage). Then Total Net Biogas
Production (Nm3) is calculated by using the following equation.
𝑇𝑜𝑡𝑎𝑙 𝑁𝑒𝑡 𝐵𝑖𝑜𝑔𝑎𝑠 𝑃𝑟𝑜𝑑𝑢𝑐𝑡𝑖𝑜𝑛 =
∑𝐵𝑖𝑜𝑔𝑎𝑠 𝑃𝑟𝑜𝑑. 𝑜𝑓 𝑆𝑜𝑙𝑖𝑑 𝑤𝑎𝑠𝑡𝑒1 + ⋯+ 𝐵𝑖𝑜𝑔𝑎𝑠 𝑃𝑟𝑜𝑑. 𝑜𝑓 𝑆𝑜𝑙𝑖𝑑 𝑤𝑎𝑠𝑡𝑒𝑁
𝑁
𝑖=1
Like the calculation of the Total Net Biogas Production, the fifth step is to calculate biogas’s
Total Primary Energy (kWhth/Nm3) as an output.
𝑇𝑜𝑡𝑎𝑙 𝑃𝑟𝑖𝑚𝑎𝑟𝑦 𝐸𝑛𝑒𝑟𝑔𝑦 𝑜𝑓 𝑡ℎ𝑒 𝐵𝑖𝑜𝑔𝑎𝑠 𝑀𝑖𝑥𝑡𝑢𝑟𝑒 =
∑𝑃𝑟𝑖𝑚𝑎𝑟𝑦 𝐸𝑛𝑒𝑟𝑔𝑦 𝑜𝑓 𝐵𝑖𝑜𝑔𝑎𝑠1 + ⋯+ 𝑃𝑟𝑖𝑚𝑎𝑟𝑦 𝐸𝑛𝑒𝑟𝑔𝑦 𝑜𝑓 𝐵𝑖𝑜𝑔𝑎𝑠𝑁
𝑁
𝑖=1
The sixth output is Annual Net Electricity Generation (kWh/year) of the biogas plant. It is
limited by either the primary energy found in biogas or the performance of gas motors.
Therefore, after the calculation of two different electricity generation levels through primary
energy of biogas and installed capacity of the system, the smaller generation level is taken
into consideration in the calculations.
European Union / Instrument For Pre-Accession Assistance (IPA) Energy Sector Technical Assistance Project
Contract Number MENR IPA12/CS02 Page - 18 -
𝐴𝑛𝑛𝑢𝑎𝑙 𝐺𝑟𝑜𝑠𝑠 𝐸𝑙𝑒𝑐𝑡𝑟𝑖𝑐𝑖𝑡𝑦 𝐺𝑒𝑛𝑒𝑟𝑎𝑡𝑖𝑜𝑛 = 𝑇𝑜𝑡𝑎𝑙 𝑃𝑟𝑖𝑚𝑎𝑟𝑦 𝐸𝑛𝑒𝑟𝑔𝑦 𝑜𝑓 𝑡ℎ𝑒 𝐵𝑖𝑜𝑔𝑎𝑠 × 𝑁𝑒𝑡 𝐸𝑙𝑒𝑐𝑡𝑟𝑖𝑐𝑖𝑡𝑦 𝐸𝑓𝑓𝑖𝑐𝑖𝑒𝑛𝑐𝑦 × 𝐿𝑜𝑎𝑑 𝐹𝑎𝑐𝑡𝑜𝑟
Or
𝐴𝑛𝑛𝑢𝑎𝑙 𝐺𝑟𝑜𝑠𝑠 𝐸𝑙𝑒𝑐𝑡𝑟𝑖𝑐𝑖𝑡𝑦 𝐺𝑒𝑛𝑒𝑟𝑎𝑡𝑖𝑜𝑛 = 𝐼𝑛𝑠𝑡𝑎𝑙𝑙𝑒𝑑 𝐶𝑎𝑝𝑎𝑐𝑖𝑡𝑦 × 𝑌𝑒𝑎𝑟𝑙𝑦 𝑂𝑝𝑒𝑟𝑎𝑡𝑖𝑛𝑔 𝐻𝑜𝑢𝑟𝑠 × 1,000
o Net electricity efficiency of the gas motor (%), load factor (%), installed capacity
(MW), and yearly operating hours (hours/year) are user inputs.
The seventh output is the yearly Net Electricity Generation (MWh/year).
𝑁𝑒𝑡 𝐸𝑙𝑒𝑐𝑡𝑟𝑖𝑐𝑖𝑡𝑦 𝐺𝑒𝑛𝑒𝑟𝑎𝑡𝑖𝑜𝑛 = 𝐺𝑟𝑜𝑠𝑠 𝐸𝑙𝑒𝑐𝑡𝑟𝑖𝑐𝑖𝑡𝑦 𝐺𝑒𝑛𝑒𝑟𝑎𝑡𝑖𝑜𝑛 × (1 − 𝑃𝑟𝑒𝑑𝑖𝑐𝑡𝑒𝑑 𝑙𝑜𝑠𝑠𝑒𝑠)
o To calculate the yearly net electricity generation, yearly gross electricity
generation and predicted losses are used as inputs.
o Three predicted loss scenarios have been adapted according to PC’s experience.
These scenarios change based on the percentage of forecasted overall losses
forecasted. Estimated overall losses for the low, medium, and high loss scenarios are
20%, 25%, and 30% respectively. Different loss scenarios result in different annual net
electricity generation levels. In order to make an accurate project assessment, PC
team has conducted the assessment based on the medium predicted loss scenario.
3.1.4 Landfill Gas
The first output calculated is the yearly Thermal Power of the Landfill Gas (kWth/year).
𝑇ℎ𝑒𝑟𝑚𝑎𝑙 𝑃𝑜𝑤𝑒𝑟 𝑜𝑓 𝑡ℎ𝑒 𝐿𝑎𝑛𝑑𝑓𝑖𝑙𝑙 𝐺𝑎𝑠 = 𝐿𝑎𝑛𝑑𝑓𝑖𝑙𝑙 𝐺𝑎𝑠 𝑃𝑟𝑜𝑑𝑢𝑐𝑡𝑖𝑜𝑛 × 𝐿𝐻𝑉 𝑜𝑓 𝐿𝑎𝑛𝑑𝑓𝑖𝑙𝑙 𝐺𝑎𝑠
o Yearly landfill gas production (m3/year) and the Lower Heating Value (LHV) (kWhth
/Nm3) of the landfill gas are user inputs.
The second output calculated is the yearly Gross Electricity Production (kWh/year) of the
landfill gas plant. It is limited by either the primary energy found in landfill gas or the capacity
of gas motors. Therefore, after the calculation of two different electricity generation levels
through thermal of landfill gas and installed capacity of the system, the smaller generation
level is taken into consideration in the calculations.
𝐴𝑛𝑛𝑢𝑎𝑙 𝐺𝑟𝑜𝑠𝑠 𝐸𝑙𝑒𝑐𝑡𝑟𝑖𝑐𝑖𝑡𝑦 𝑃𝑟𝑜𝑑𝑢𝑐𝑡𝑖𝑜𝑛 = 𝑇ℎ𝑒𝑟𝑚𝑎𝑙 𝑃𝑜𝑤𝑒𝑟 𝑜𝑓 𝑡ℎ𝑒 𝐿𝑎𝑛𝑑𝑓𝑖𝑙𝑙 𝐺𝑎𝑠 × 𝑌𝑒𝑎𝑟𝑙𝑦 𝑂𝑝𝑒𝑟𝑎𝑡𝑖𝑛𝑔 𝐻𝑜𝑢𝑟𝑠
Or
𝐴𝑛𝑛𝑢𝑎𝑙 𝐺𝑟𝑜𝑠𝑠 𝐸𝑙𝑒𝑐𝑡𝑟𝑖𝑐𝑖𝑡𝑦 𝑃𝑟𝑜𝑑𝑢𝑐𝑡𝑖𝑜𝑛 = 𝐼𝑛𝑠𝑡𝑎𝑙𝑙𝑒𝑑 𝐶𝑎𝑝𝑎𝑐𝑖𝑡𝑦 𝑥 𝑌𝑒𝑎𝑟𝑙𝑦 𝑂𝑝𝑒𝑟𝑎𝑡𝑖𝑛𝑔 𝐻𝑜𝑢𝑟𝑠 𝑥 1000

European Union / Instrument For Pre-Accession Assistance (IPA) Energy Sector Technical Assistance Project
Contract Number MENR IPA12/CS02 Page - 19 -
o Installed capacity (MW), and yearly operating hours (hours/year) are user inputs.
The third output calculated is the yearly Net Electricity Production (kWh/year).
𝐴𝑛𝑛𝑢𝑎𝑙 𝑁𝑒𝑡 𝐸𝑙𝑒𝑐𝑡𝑟𝑖𝑐𝑖𝑡𝑦 𝑃𝑟𝑜𝑑𝑢𝑐𝑡𝑖𝑜𝑛 = 𝐴𝑛𝑛𝑢𝑎𝑙 𝐺𝑟𝑜𝑠𝑠 𝐸𝑙𝑒𝑐. 𝑃𝑟𝑜𝑑.− (𝑆𝑒𝑙𝑓 𝐶𝑜𝑛𝑠. 𝐸𝑙𝑒𝑐. +𝐴𝑢𝑥. 𝑆𝑦𝑠𝑡𝑒𝑚 𝐶𝑜𝑛𝑠. ) × (1 − 𝑃𝑟𝑒𝑑𝑖𝑐𝑡. 𝐿𝑜𝑠𝑠𝑒𝑠)
o Self-consumed electricity and auxiliary electricity consumption are user inputs.
o Three predicted loss scenarios have been adapted according to PC’s experience.
These scenarios change based on the percentage of forecasted overall losses
forecasted. Estimated overall losses for the low, medium, and high loss scenarios are
20%, 25%, and 30% respectively. Different loss scenarios result in different annual net
electricity generation levels. In order to make an accurate project assessment, PC
team has conducted the assessment based on the medium predicted loss scenario.
3.1.5 Heat Pump
This is the calculation tool with the most straightforward methodology because heat pump applications are not implemented in large scales such as renewable energy power plants. Therefore, they do not typically require extensive calculations in order to assess their feasibility.
The first output calculated is the yearly Net Electricity Consumption (kWh/year) of the heat
pump.
𝑁𝑒𝑡 𝐸𝑙𝑒𝑐𝑡𝑟𝑖𝑐𝑖𝑡𝑦 𝐶𝑜𝑛𝑠𝑢𝑚𝑝𝑡𝑖𝑜𝑛 = 𝐻𝑒𝑎𝑡 𝑃𝑢𝑚𝑝 𝐶𝑎𝑝𝑎𝑐𝑖𝑡𝑦/𝐶𝑂𝑃 𝑥 𝐴𝑣𝑒𝑟𝑎𝑔𝑒 𝐴𝑛𝑛𝑢𝑎𝑙 𝑊𝑜𝑟𝑘𝑖𝑛𝑔 𝐻𝑜𝑢𝑟𝑠.
o Heat pump capacity and average annual working hours are user inputs.
o Coefficient of Performance (COP) is a user input that can be obtained from the
datasheet of the heat pump.
The second output calculated is the yearly Heat Production from Heat Pump (kWh/year).
𝐻𝑒𝑎𝑡 𝑃𝑟𝑜𝑑𝑢𝑐𝑡𝑖𝑜𝑛 𝐹𝑟𝑜𝑚 𝐻𝑒𝑎𝑡 𝑃𝑢𝑚𝑝
= 𝐻𝑒𝑎𝑡 𝑃𝑢𝑚𝑝 𝐶𝑎𝑝𝑎𝑐𝑖𝑡𝑦 𝑥 𝐴𝑣𝑒𝑟𝑎𝑔𝑒 𝐴𝑛𝑛𝑢𝑎𝑙 𝑊𝑜𝑟𝑘𝑖𝑛𝑔 𝐻𝑜𝑢𝑟𝑠
o Heat pump capacity and average annual working hours are user inputs.
The third step is to calculate the yearly Heat Demand (kWh/year).
𝐻𝑒𝑎𝑡 𝐷𝑒𝑚𝑎𝑛𝑑 = 𝐹𝑢𝑒𝑙 𝐶𝑜𝑛𝑠𝑢𝑚𝑝𝑡𝑖𝑜𝑛 𝑥 𝐿𝑉𝐻 𝑜𝑓 𝐹𝑢𝑒𝑙
o First of all, the users enter the type of fuel that is currently being used to power their
facility, such as, natural gas and lignite.

European Union / Instrument For Pre-Accession Assistance (IPA) Energy Sector Technical Assistance Project
Contract Number MENR IPA12/CS02 Page - 20 -
o Current fuel consumption level is an input; indicating the amount of fuel consumed
in a facility before the implementation of the heat pump project. It is measured in cubic
metres or kilograms per year.
o LHV of the fuel is embedded inside the calculation tool and is used automatically in
the calculations.
The fourth step is calculating the yearly Natural Gas Equivalent of Heat Produced from
Heat Pump (m3/year).
𝑁𝑎𝑡𝑢𝑟𝑎𝑙 𝐺𝑎𝑠 𝐸𝑞𝑢𝑖𝑣𝑎𝑙𝑒𝑛𝑡 𝑜𝑓 𝐻𝑒𝑎𝑡 𝑃𝑟𝑜𝑑𝑢𝑐𝑒𝑑 𝑓𝑟𝑜𝑚 𝐻𝑒𝑎𝑡 𝑃𝑢𝑚𝑝
= 𝐻𝑒𝑎𝑡 𝑃𝑟𝑜𝑑𝑢𝑐𝑡𝑖𝑜𝑛 𝐹𝑟𝑜𝑚 𝐻𝑒𝑎𝑡 𝑃𝑢𝑚𝑝
𝐿𝐻𝑉 𝑜𝑓 𝐹𝑢𝑒𝑙
Finally, annual Net Primary Energy Savings (kWh/year) are calculated as:
𝑁𝑒𝑡 𝑃𝑟𝑖𝑚𝑎𝑟𝑦 𝐸𝑛𝑒𝑟𝑔𝑦 𝑆𝑎𝑣𝑖𝑛𝑔𝑠 =
𝐹𝑢𝑒𝑙 𝐶𝑜𝑛𝑠𝑢𝑚𝑝𝑡𝑖𝑜𝑛 𝐿𝑒𝑣𝑒𝑙 × 𝐿𝐻𝑉 𝑜𝑓 𝑡ℎ𝑒 𝐹𝑢𝑒𝑙 − 𝑁𝑒𝑡 𝐸𝑙𝑒𝑐𝑡𝑟𝑖𝑐𝑖𝑡𝑦 𝐶𝑜𝑛𝑠𝑢𝑚𝑝𝑡𝑖𝑜𝑛 / 0.33
o Current fuel consumption level is an input; indicating the amount of fuel consumed
in a facility before the implementation of the heat pump project. It is measured in cubic
metres or kilograms per year.
o LHV of the fuel is embedded inside the calculation tool and is used automatically in
the calculations.
o Net Electricity Consumption of the heat pump value is taken from the first step of the
calculation.
o 0.33 is the conversion factor between natural gas and electricity.
o LHV of the fuel is embedded inside the calculation tool and is used automatically in
the calculations.
3.2 Financial Calculations
Investment cost and the exchange rates are necessary inputs for the financial analysis of the
projects.
The first financial output is the Revenues from Electricity Sold to the Grid (USD/year).
o The Self Consumption (MWh/year) value of the plant, which must be entered by the
user, is subtracted from the Net Electricity Generation (MWh/year).
𝐸𝑙𝑒𝑐𝑡𝑟𝑖𝑐𝑖𝑡𝑦 𝑆𝑜𝑙𝑑 𝑡𝑜 𝑡ℎ𝑒 𝐺𝑟𝑖𝑑 = 𝑁𝑒𝑡 𝐸𝑙𝑒𝑐𝑡𝑟𝑖𝑐𝑖𝑡𝑦 𝐺𝑒𝑛𝑒𝑟𝑎𝑡𝑖𝑜𝑛 − 𝑆𝑒𝑙𝑓 𝐶𝑜𝑛𝑠𝑢𝑚𝑝𝑡𝑖𝑜𝑛

European Union / Instrument For Pre-Accession Assistance (IPA) Energy Sector Technical Assistance Project
Contract Number MENR IPA12/CS02 Page - 21 -
o The user must pay a distribution fee for the amount of electricity fed in to the grid.
𝐷𝑖𝑠𝑡𝑟𝑖𝑏𝑢𝑡𝑖𝑜𝑛 𝐸𝑥𝑝𝑒𝑛𝑠𝑒 = 𝐸𝑙𝑒𝑐𝑡𝑟𝑖𝑐𝑖𝑡𝑦 𝑆𝑜𝑙𝑑 𝑡𝑜 𝑡ℎ𝑒 𝐺𝑟𝑖𝑑 × 𝐷𝑖𝑠𝑡𝑟𝑖𝑏𝑢𝑡𝑖𝑜𝑛 𝐹𝑒𝑒
𝑅𝑒𝑣𝑒𝑛𝑢𝑒𝑠 𝑓𝑟𝑜𝑚 𝐸𝑙𝑒𝑐𝑡𝑟𝑖𝑐𝑖𝑡𝑦 𝑆𝑜𝑙𝑑 𝑡𝑜 𝑡ℎ𝑒 𝐺𝑟𝑖𝑑
= 𝐸𝑙𝑒𝑐𝑡𝑟𝑖𝑐𝑖𝑡𝑦 𝑆𝑜𝑙𝑑 𝑡𝑜 𝑡ℎ𝑒 𝐺𝑟𝑖𝑑 × 𝐹𝑒𝑒𝑑 𝑖𝑛 𝑇𝑎𝑟𝑖𝑓𝑓
− 𝐷𝑖𝑠𝑡𝑟𝑖𝑏𝑢𝑡𝑖𝑜𝑛 𝐸𝑥𝑝𝑒𝑛𝑠𝑒
o The second financial output is the Revenues Generated from Electricity Savings
(USD/year).
𝑅𝑒𝑣𝑒𝑛𝑢𝑒𝑠 𝐺𝑒𝑛𝑒𝑟𝑎𝑡𝑒𝑑 𝑓𝑟𝑜𝑚 𝐸𝑙𝑒𝑐𝑡𝑟𝑖𝑐𝑖𝑡𝑦 𝑆𝑎𝑣𝑖𝑛𝑔𝑠
= 𝑁𝑒𝑡 𝐸𝑙𝑒𝑐𝑡𝑟𝑖𝑐𝑖𝑡𝑦 𝐺𝑒𝑛𝑒𝑟𝑎𝑡𝑖𝑜𝑛 − 𝐸𝑙𝑒𝑐𝑡𝑟𝑖𝑐𝑖𝑡𝑦 𝑆𝑜𝑙𝑑 𝑡𝑜 𝑡ℎ𝑒 𝐺𝑟𝑖𝑑
× 𝑈𝑛𝑖𝑡 𝑃𝑟𝑖𝑐𝑒 𝑜𝑓 𝐸𝑙𝑒𝑐𝑡𝑟𝑖𝑐𝑖𝑡𝑦 𝐵𝑜𝑢𝑔ℎ𝑡
The Insurance and Operations & Maintenance Costs (USD/year) is calculated differently
for each technology.
o For Solar PV, O&M Costs are assumed as 2.1% of the Investment Amount (USD)
for ground type projects; as for rooftop projects, this value is assumed as 0.1%.
Additionally, the average insurance amount is assumed as 0.4%. The insurance,
operation, and maintenance cost of other technologies could be seen in Table 3-2
below.
Table 3-2: Insurance, Operation and Maintenance Cost for each Technology
Technology Unit Insurance, Operation, and
Maintenance Cost
Solar PV Ground % 2.5
Solar PV Rooftop % 0.5
Wind USD/MWh 15
Landfill USD/MWh 20
Biogas USD/MWh 15
Heat Pump % 1
The third output is the Operating Income (USD/year).
𝑂𝑝𝑒𝑟𝑎𝑡𝑖𝑛𝑔 𝐼𝑛𝑐𝑜𝑚𝑒
= 𝑅𝑒𝑣𝑒𝑛𝑢𝑒𝑠 𝑓𝑟𝑜𝑚 𝐸𝑙𝑒𝑐𝑡𝑟𝑖𝑐𝑖𝑡𝑦 𝑆𝑜𝑙𝑑 𝑡𝑜 𝑡ℎ𝑒 𝐺𝑟𝑖𝑑
+ 𝑅𝑒𝑣𝑒𝑛𝑢𝑒𝑠 𝐺𝑒𝑛𝑒𝑟𝑎𝑡𝑒𝑑 𝑓𝑟𝑜𝑚 𝐸𝑙𝑒𝑐𝑡𝑟𝑖𝑐𝑖𝑡𝑦 𝑆𝑎𝑣𝑖𝑛𝑔𝑠
− 𝐼𝑛𝑠𝑢𝑟𝑎𝑛𝑐𝑒 𝑎𝑛𝑑 𝑂&𝑀 𝐶𝑜𝑠𝑡𝑠
If the project is financed by Debt, the Loan Interest Expense (USD/year) and Repayment of
Loan Principal (USD/year) must be calculated.

European Union / Instrument For Pre-Accession Assistance (IPA) Energy Sector Technical Assistance Project
Contract Number MENR IPA12/CS02 Page - 22 -
o Excels IMPT function is used to calculate the Loan Interest Expense.
𝐼𝑃𝑀𝑇 = (𝐶𝑜𝑠𝑡 𝑜𝑓 𝐷𝑒𝑏𝑡, 𝐺𝑖𝑣𝑒𝑛 𝑌𝑒𝑎𝑟, 𝑇𝑜𝑡𝑎𝑙 𝐷𝑒𝑏𝑡 𝑇𝑒𝑟𝑚, 𝐴𝑚𝑜𝑢𝑛𝑡 𝑜𝑓 𝐷𝑒𝑏𝑡)
o Excels PMPT function is used to calculate the Repayment of Loan Principal. The
grace period is excluded for the calculation
𝑃𝑃𝑀𝑇 = (𝐶𝑜𝑠𝑡 𝑜𝑓 𝐷𝑒𝑏𝑡, 𝐺𝑖𝑣𝑒𝑛 𝑌𝑒𝑎𝑟, 𝑇𝑜𝑡𝑎𝑙 𝐷𝑒𝑏𝑡 𝑇𝑒𝑟𝑚, 𝐴𝑚𝑜𝑢𝑛𝑡 𝑜𝑓 𝐷𝑒𝑏𝑡)
The Cash Flow (USD/year) is calculated by subtracting the Loan Interest Expense and
Repayment of Loan Principal from the Operating Income.
𝐶𝑎𝑠ℎ 𝐹𝑙𝑜𝑤 = 𝑂𝑝𝑒𝑟𝑎𝑡𝑖𝑛𝑔 𝐼𝑛𝑐𝑜𝑚𝑒 − 𝐿𝑜𝑎𝑛 𝐼𝑛𝑡𝑒𝑟𝑒𝑠𝑡 𝐸𝑥𝑝𝑒𝑛𝑠𝑒 − 𝑅𝑒𝑝𝑎𝑦𝑚𝑒𝑛𝑡 𝑜𝑓 𝐿𝑜𝑎𝑛 𝑃𝑟𝑖𝑛𝑐𝑖𝑝𝑎𝑙
The cumulative revenue is calculated by subtracting the Net Revenue of a given year, from
the Cumulative Revenue from the previous year. For an example:
𝑪𝒖𝒎𝒖𝒍𝒂𝒕𝒊𝒗𝒆 𝑹𝒆𝒗𝒆𝒏𝒖𝒆 𝒇𝒐𝒓 𝒕𝒉𝒆 𝟏𝒔𝒕 𝒀𝒆𝒂𝒓 = 𝑰𝒏𝒗𝒆𝒔𝒕𝒎𝒆𝒏𝒕 𝑪𝒐𝒔𝒕 (𝒀𝒆𝒂𝒓 𝟎) − 𝑵𝒆𝒕 𝑹𝒆𝒗𝒆𝒏𝒖𝒆 𝒐𝒇 𝒀𝒆𝒂𝒓 𝟏
All the above values are calculated for each year of the projects lifetime. These values are tabled
in a separate sheet of the excel document.
Table 3-3: Example of a calculation table
The Specific Cost of the Investment (USD/W) is the amount invested (USD) per watt.
𝑆𝑝𝑒𝑐𝑖𝑓𝑖𝑐 𝐶𝑜𝑠𝑡 𝑜𝑓 𝑡ℎ𝑒 𝐼𝑛𝑣𝑒𝑠𝑡𝑚𝑒𝑛𝑡 =𝐼𝑛𝑣𝑒𝑠𝑡𝑚𝑒𝑛𝑡 𝐴𝑚𝑜𝑢𝑛𝑡
𝐼𝑛𝑠𝑡𝑎𝑙𝑙𝑒𝑑 𝐶𝑎𝑝𝑎𝑐𝑖𝑡𝑦
The Net Revenue (UDS/year) for the first year equals to the Operating Income (USD/year)
of the first year.
The Payback Time is calculated as:

European Union / Instrument For Pre-Accession Assistance (IPA) Energy Sector Technical Assistance Project
Contract Number MENR IPA12/CS02 Page - 23 -
𝑃𝑎𝑦𝑏𝑎𝑐𝑘 𝑇𝑖𝑚𝑒 = 𝑁𝑢𝑚𝑏𝑒𝑟 𝑜𝑓 𝑦𝑒𝑎𝑟𝑠 𝑏𝑒𝑓𝑜𝑟𝑒 𝑓𝑖𝑟𝑠𝑡 𝑝𝑜𝑠𝑖𝑡𝑖𝑣𝑒 𝑐𝑎𝑠ℎ 𝑓𝑙𝑜𝑤
+ 𝐴𝑏𝑠𝑜𝑙𝑢𝑡𝑒 𝑣𝑎𝑙𝑢𝑒 𝑜𝑓 𝑙𝑎𝑠𝑡 𝑛𝑒𝑔𝑎𝑡𝑖𝑣𝑒 𝑐𝑢𝑚𝑢𝑙𝑎𝑡𝑖𝑣𝑒 𝑐𝑎𝑠ℎ 𝑓𝑙𝑜𝑤
𝐶𝑎𝑠ℎ 𝑓𝑙𝑜𝑤 𝑖𝑛 𝑡ℎ𝑒 𝑦𝑒𝑎𝑟 𝑜𝑓 𝑓𝑖𝑟𝑠𝑡𝑝𝑜𝑠𝑖𝑡𝑖𝑣𝑒 𝑐𝑢𝑚𝑢𝑙𝑎𝑡𝑖𝑣𝑒 𝑐𝑎𝑠ℎ 𝑓𝑙𝑜𝑤
So, in the example table above;
𝑷𝒂𝒚𝒃𝒂𝒄𝒌 𝑻𝒊𝒎𝒆 = 𝟓 +|−𝟖𝟗𝟎𝟏𝟒|
𝟏𝟕𝟖𝟏𝟓𝟗= 𝟓. 𝟓 𝒚𝒆𝒂𝒓𝒔
Net Present Value is calculated for N (years), which is the project lifetime.
𝑁𝑃𝑉 (𝑖 , 𝑁) = ∑𝑅𝑡
(1 + 𝑖)𝑡
𝑁
𝑡=0
o i is the discount factor, i.e. the return that could be earned per unit of time on an
investment with similar risk. The discount factor used is the calculation tools is 7%.
o t is the time of the cash flow.
o N is the lifetime of the project.
Internal Rate of Return is also calculated for N (years). It is defined as the discount rate, r,
at which the present value of all future cash flows is equal to the initial investment.
𝑁𝑃𝑉 (𝑖 , 𝑁) = ∑𝑅𝑡
(1 + 𝑟)𝑡= 0
𝑁
𝑡=0
Levelized Cost of Electricity (LCOE) (USD/MWh) is the ratio of the present value of total
costs over projects lifetime to the present value of total electricity produced over projects
lifetime
𝐿𝐶𝑂𝐸 =∑
𝐶𝑛
(1 + 𝑑)𝑛𝑁𝑛=0
∑𝑄𝑛
(1 + 𝑑)𝑛𝑁𝑛=1
Where; o Cn is project’s equivalent annual cost. Project costs Cn include installation, operation
and maintenance, financial costs and fees, and taxes, and also account for incentives
and salvage value.
o Qn is the quantity of electricity generated by the system in that year

European Union / Instrument For Pre-Accession Assistance (IPA) Energy Sector Technical Assistance Project
Contract Number MENR IPA12/CS02 Page - 24 -
o The summation in the lower hand term begins at n = 1, which is the first year that the
system produces energy. The upper hand summation begins at n = 0 to include
investment costs in the calculation.
Note. This equation makes it appear that the energy term in the denominator is discounted. That is a result of the algebraic solution of the equation, not an indication of the physical performance of the system.
Finally, the Key Performance Indicator (KPI) is calculated to check the eligibility of the
proposed project.
𝑲𝑷𝑰 =𝟏, 𝟎𝟎𝟎 × 𝑵𝒆𝒕 𝑬𝒍𝒆𝒄𝒕𝒓𝒊𝒄𝒊𝒕𝒚 𝑮𝒆𝒏𝒆𝒓𝒂𝒕𝒊𝒐𝒏
𝑰𝒏𝒗𝒆𝒔𝒕𝒎𝒆𝒏𝒕 𝑨𝒎𝒐𝒖𝒏𝒕
o The Net Electricity Generation is multiplied with 1,000 to convert its unit from
MWh/year to kWh/year.
For heat pump projects, Net Cost Savings per year is calculated:
𝑵𝒆𝒕 𝑪𝒐𝒔𝒕 𝑺𝒂𝒗𝒊𝒏𝒈𝒔
= 𝑭𝒖𝒆𝒍 𝑪𝒐𝒏𝒔𝒖𝒎𝒑𝒕𝒊𝒐𝒏 × 𝑭𝒖𝒆𝒍 𝑻𝒂𝒓𝒊𝒇𝒇 − 𝑵𝒆𝒘 𝑬𝒍𝒆𝒄𝒕. 𝑪𝒐𝒏𝒔𝒖𝒎𝒑𝒕𝒊𝒐𝒏 × 𝑬𝒍𝒆𝒄𝒕. 𝑻𝒂𝒓𝒊𝒇𝒇
𝑬𝒙𝒄𝒉𝒂𝒏𝒈𝒆 𝑹𝒂𝒕𝒆 (𝑼𝑺𝑫/ 𝑻𝑹𝒀)
o Fuel and electricity tariffs are entered as inputs. Fuel tariff is measured either in
TRY per cubic metres or kilograms, while electricity tariff is measured in TRY per
kWh.
All the above values are calculated for each year of the projects lifetime. These values are tabled
in a separate sheet of the excel document.
European Union / Instrument For Pre-Accession Assistance (IPA) Energy Sector Technical Assistance Project
Contract Number MENR IPA12/CS02 Page - 25 -
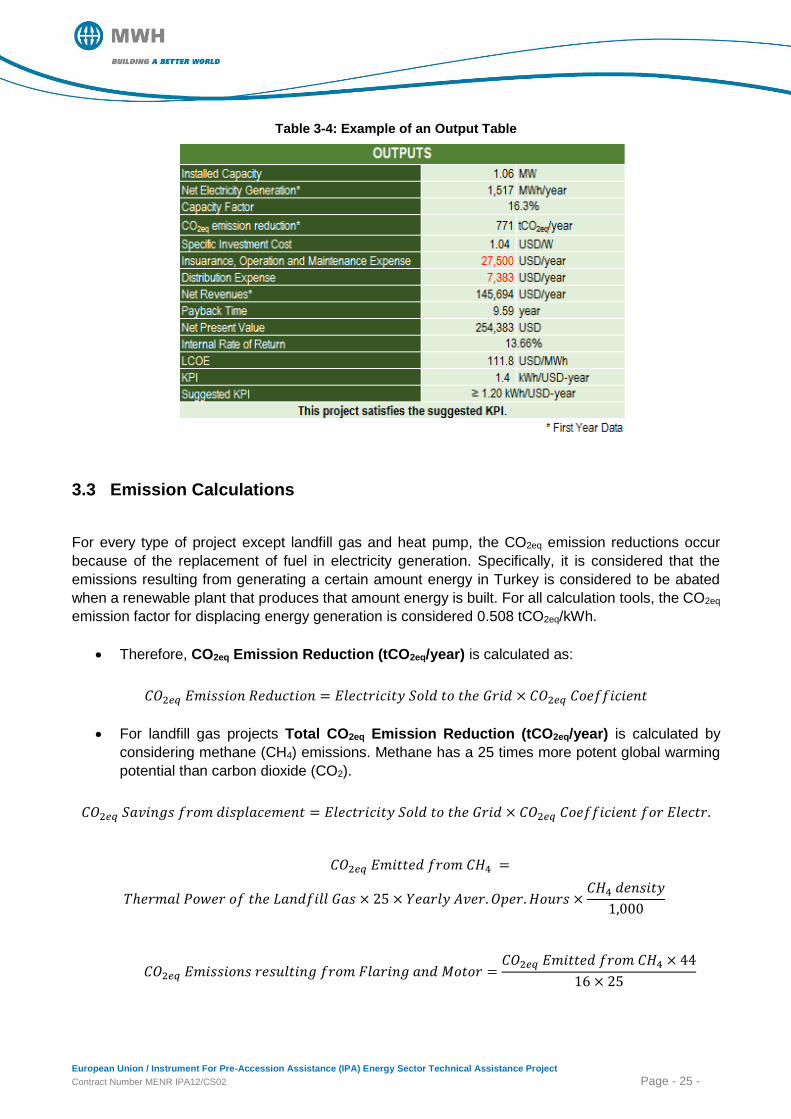
Table 3-4: Example of an Output Table
3.3 Emission Calculations
For every type of project except landfill gas and heat pump, the CO2eq emission reductions occur
because of the replacement of fuel in electricity generation. Specifically, it is considered that the
emissions resulting from generating a certain amount energy in Turkey is considered to be abated
when a renewable plant that produces that amount energy is built. For all calculation tools, the CO2eq
emission factor for displacing energy generation is considered 0.508 tCO2eq/kWh.
Therefore, CO2eq Emission Reduction (tCO2eq/year) is calculated as:
𝐶𝑂2𝑒𝑞 𝐸𝑚𝑖𝑠𝑠𝑖𝑜𝑛 𝑅𝑒𝑑𝑢𝑐𝑡𝑖𝑜𝑛 = 𝐸𝑙𝑒𝑐𝑡𝑟𝑖𝑐𝑖𝑡𝑦 𝑆𝑜𝑙𝑑 𝑡𝑜 𝑡ℎ𝑒 𝐺𝑟𝑖𝑑 × 𝐶𝑂2𝑒𝑞 𝐶𝑜𝑒𝑓𝑓𝑖𝑐𝑖𝑒𝑛𝑡
For landfill gas projects Total CO2eq Emission Reduction (tCO2eq/year) is calculated by
considering methane (CH4) emissions. Methane has a 25 times more potent global warming
potential than carbon dioxide (CO2).
𝐶𝑂2𝑒𝑞 𝑆𝑎𝑣𝑖𝑛𝑔𝑠 𝑓𝑟𝑜𝑚 𝑑𝑖𝑠𝑝𝑙𝑎𝑐𝑒𝑚𝑒𝑛𝑡 = 𝐸𝑙𝑒𝑐𝑡𝑟𝑖𝑐𝑖𝑡𝑦 𝑆𝑜𝑙𝑑 𝑡𝑜 𝑡ℎ𝑒 𝐺𝑟𝑖𝑑 × 𝐶𝑂2𝑒𝑞 𝐶𝑜𝑒𝑓𝑓𝑖𝑐𝑖𝑒𝑛𝑡 𝑓𝑜𝑟 𝐸𝑙𝑒𝑐𝑡𝑟.
𝐶𝑂2𝑒𝑞 𝐸𝑚𝑖𝑡𝑡𝑒𝑑 𝑓𝑟𝑜𝑚 𝐶𝐻4 =
𝑇ℎ𝑒𝑟𝑚𝑎𝑙 𝑃𝑜𝑤𝑒𝑟 𝑜𝑓 𝑡ℎ𝑒 𝐿𝑎𝑛𝑑𝑓𝑖𝑙𝑙 𝐺𝑎𝑠 × 25 × 𝑌𝑒𝑎𝑟𝑙𝑦 𝐴𝑣𝑒𝑟. 𝑂𝑝𝑒𝑟. 𝐻𝑜𝑢𝑟𝑠 ×𝐶𝐻4 𝑑𝑒𝑛𝑠𝑖𝑡𝑦
1,000
𝐶𝑂2𝑒𝑞 𝐸𝑚𝑖𝑠𝑠𝑖𝑜𝑛𝑠 𝑟𝑒𝑠𝑢𝑙𝑡𝑖𝑛𝑔 𝑓𝑟𝑜𝑚 𝐹𝑙𝑎𝑟𝑖𝑛𝑔 𝑎𝑛𝑑 𝑀𝑜𝑡𝑜𝑟 =𝐶𝑂2𝑒𝑞 𝐸𝑚𝑖𝑡𝑡𝑒𝑑 𝑓𝑟𝑜𝑚 𝐶𝐻4 × 44
16 × 25

European Union / Instrument For Pre-Accession Assistance (IPA) Energy Sector Technical Assistance Project
Contract Number MENR IPA12/CS02 Page - 26 -
𝑇𝑜𝑡𝑎𝑙 𝐶𝑂2𝑒𝑞 𝐸𝑚𝑖𝑠𝑠𝑖𝑜𝑛 𝑅𝑒𝑑𝑢𝑐𝑡𝑖𝑜𝑛 =
𝑆𝑎𝑣𝑖𝑛𝑔𝑠 𝑓𝑟𝑜𝑚 𝑑𝑖𝑠𝑝𝑙𝑎𝑐𝑒𝑚𝑒𝑛𝑡 + 𝐸𝑚𝑖𝑠𝑠𝑖𝑜𝑛 𝑓𝑟𝑜𝑚 𝐶𝐻4
− 𝐸𝑚𝑖𝑠𝑠𝑖𝑜𝑛𝑠 𝑟𝑒𝑠𝑢𝑙𝑡𝑖𝑛𝑔 𝑓𝑟𝑜𝑚 𝐹𝑙𝑎𝑟𝑖𝑛𝑔 𝑎𝑛𝑑 𝑀𝑜𝑡𝑜𝑟
For heat pump projects, CO2eq Emission Reduction (tCO2eq/year) occurs because of fuel
shift to electricity. It is calculated as:
𝐶𝑂2𝑒𝑞 𝐸𝑚𝑖𝑠𝑠𝑖𝑜𝑛 𝑅𝑒𝑑𝑢𝑐𝑡𝑖𝑜𝑛 =
𝐹𝑢𝑒𝑙 𝐶𝑜𝑛𝑠𝑢𝑚𝑝𝑡𝑖𝑜𝑛 × 𝐿𝐻𝑉 𝑜𝑓 𝐹𝑢𝑒𝑙 × 𝐶𝑂2𝑒𝑞 𝐶𝑜𝑒𝑓𝑓𝑖𝑐𝑖𝑒𝑛𝑡 𝑓𝑜𝑟 𝐹𝑢𝑒𝑙
− 𝑁𝑒𝑤 𝐸𝑙𝑒𝑐𝑡𝑟𝑖𝑐𝑖𝑡𝑦 𝐶𝑜𝑛𝑠𝑢𝑚𝑝𝑡𝑖𝑜𝑛 × 𝐶𝑂2𝑒𝑞 𝐶𝑜𝑒𝑓𝑓𝑖𝑐𝑖𝑒𝑛𝑡 𝑓𝑜𝑟 𝐸𝑙𝑒𝑐𝑡𝑟𝑖𝑐𝑖𝑡𝑦
o CO2eq emission factors for different types of fuels are embedded into the calculation
tool.

European Union / Instrument For Pre-Accession Assistance (IPA) Energy Sector Technical Assistance Project
Contract Number MENR IPA12/CS02 Page - 27 -
Annex – Case Study
Project Name 1 Enter the name of the project.
EPC Company Name 2 Enter the name of the EPC company.
Installation Type 3 Choose the installation type.
Panel Brand/Model X Solar XX 265p 4 Enter the brand and model of the PV panel.
Panel Type 5 Choose the type of PV panel.
Inverter Make/Modeli YZZ YZZ 50.0TL 6 Enter the brand and model of the inverter.
Province 7 Choose the province where the project is located.
District 8 Choose the district where the project is located.
Loss Scenario 9 Choose the loss scenario.
1,000,000 USD 10 Enter the investment amount and choose the currency.
1,000,000 USD 11 The Investment amount is calculated in USD if the exchange rates are written below.
Exchange Rate Date 12 Enter the date of the exchange rates.
3.52 USD/TRY 13 Enter the exchange rates.
3.97 EUR/TRY 14 Link for the exchange rates.
Feed-in-Tariff(base) 0.133 USD/kWh 15 Feed-in-tariff for unlicensed generation for projects realized before 2020.
Feed-in-Tariff Duration 10 year 16 Duration of the feed-in-tariff guarantee.
Projected Electricity Price after Feed Tariff
Guarantee0.07 USD/kWh 17 Enter the projected electricity price after for the following years.
Distrubution fee 0.026 TRY/kWh 18The default value is for projects that will realize before 31/12/2017. After this date, the
distrubution fee will be 10.2115 kuruş/kWh.
Insurance, Operation and Maintenance Expense 19
Operating and maintenance costs are assumed as 2.1% of the investment amount for on-
ground projects; as for rooftop project this value is assumed as 0.1%. Additionally, the
average insurance amount is assumed as 0.4%.
Unit Price for Electricity Bought 0.24 TRY/kWh 20 Enter the unit price of the electricity used in the facility.
Grace Period 1 year 21 Enter the grace period.
Debt Term 7 year 22 Enter the total debt term.
Equity Debt
Debt-Equity Ratio 100% 0% 23 Enter the equity ratio. The debt percentage is calculated accordingly.
Debt-Equity Amount (USD) 1,000,000 0 24 Amount of debt and equity are calculated accordingly.
Cost of Dept & Equity 10% 7% 25 Default values for the cost of debt and equity. Change the values if needed.
WACC (Weighted Average Cost of Capital) 26 Weighted average cost of capital is calculated for discounted cash flows.
Panel Number 27 Enter the number of PV panels.
Panel Peak Power 265 W 28 Enter panel peak power. (From technical documentation.)
Panel Dimension (length) 165 cm 29 Enter the lenght of panel. (From technical documentation.)
Panel Dimension (width) 99 cm 30 Enter the width of panel. (From technical documentation.)
Slope 30 ° 31 Enter the angle that the panels will be installed.
Module Efficiency 32 The module efficiency will be calculated automatically.
Total Modules Area 6,534 m2 33 Total module area will be calculated automatically.
Specific Area 6.16 m²/kWp 34 Spesific area will be calculated automatically.
Installed Capacity 1.06 MW 35 Installed capacity will be calculated automatically.
Number of Inverters 36 Enter the number of inverters
Inverter Output Power (AC) 50 kW 37 Enter the output power of inverters.
PV to Inverter Ratio 38 Panel/Inverter ratio will be calculated automatically.
Self Consumption 300 MWh/year 39 Enter the amount of yearly self consumption.
Installed Capacity 1.06 MW 40 Displays the installed capacity of the plant.
Net Electricity Generation* 1,496 MWh/year 41 Displays the net electricity generation of the plant.
Capacity Factor 42 Displays the capacity factor.
CO2eq emission reduction* 760 tCO2eq/year 43 Displays the CO2eq emission reduction of the plant.
Specific Investment Cost 1.15 USD/W 44 Displays the specific cost of investment (the amount invested per watt).
Insuarance, Operation and Maintenance Expense 25,000 USD/year 45 Displays the insurance, operation and maintenance expense for first year.
Distribution Expense 11,092 USD/year 46 Displays the total distribution expense for the electricty fed in to the grid.
Net Revenues* 153,497 USD/year 47 Displays the net revenues.
Payback Time 6.67 year 48 Displays the payback time.
Net Present Value 344,408 USD 49 Displays the net present value.
Internal Rate of Return 50 Displays the internal rate of return.
LCOE 89.1 USD/MWh 51 Displays the levelized cost of electricity (LCOE) of the project.
KPI 1.5 kWh/USD-year 52 Displays the key performance index (KPI) of the project.
Suggested KPI 53 Recommended KPI value.
CO2eq Coefficient 0.508 tCO2eq/kWh 54CO2eq coefficient is taken from "Baseline Study for the Republic of Turkey" report by
European Bank for Reconstruction and Development (EBRD).
Default Annual Degradation of PV Panels 55 0.7% degredation assumed for PV panels.
Operational Year 25 year 56 It is assumed that the project will be operational for 25 years.
Inflation 57Inflation value of Turkey for January 2017. In calculations, value is calculated accordingly to
the USD exchange rate.
LCOE 58
16.00%
Note: The values below are provided as examples and should not be used as reference data.
SAMPLE INPUTS
PROJECT DETAILS
Adana GES
Polycrystalline
Medium - % 25
Ground
LOAN DETAILS Loan Information
7.6%
Debt-Equity Information
Calculated for the project
INSTRUCTIONS
Light blue cells represent the inputs. They can be edited.
Dark blue cells represent automatic calculations. They can not be edited.
Light green cells reperesent outputs. They can not be edited.
ASSUMPTIONS VE REFERANCES
EPC Company
Adana
Aladağ
INSTRUCTIONS
General Information
19
1.12
SAMPLE OUTPUTS
16.1%
2.5%
Default values are written in these cells. Users can change them according to their needs.
INSTRUCTIONS
9.22%
Financial Information
Technical Information
0.7%
TECHNICAL PARAMETERS
4,000
11.95%
≥ 1.20 kWh/USD-year
This project satisfies the suggested KPI.
* First Year Data
FINANCIAL PARAMETERS
Investment Amount
7/6/2017
Exchange Rates
LCOE=𝑻𝒉𝒆 𝒑𝒓𝒆𝒔𝒆𝒏𝒕 𝒗𝒂𝒍𝒖𝒆 𝒐𝒇 𝒕𝒐𝒕𝒂𝒍 𝒄𝒐𝒔𝒕𝒔 𝒐𝒗𝒆𝒓 𝒑𝒓𝒐 𝒆𝒄𝒕𝒔 𝒍𝒊𝒇𝒆𝒕𝒊𝒎𝒆
𝑻𝒉𝒆 𝒑𝒓𝒆𝒔𝒆𝒏𝒕 𝒗𝒂𝒍𝒖𝒆 𝒐𝒇 𝒕𝒐𝒕𝒂𝒍 𝒆𝒍𝒆𝒄𝒕𝒓𝒊𝒄𝒊𝒕𝒚 𝒑𝒓𝒐 𝒖𝒄𝒆 𝒐𝒗𝒆𝒓 𝒑𝒓𝒐 𝒆𝒄𝒕𝒔 𝒍𝒊𝒇𝒆𝒕𝒊𝒎𝒆

“The contents of this publication are the sole responsibility of MWH – Terna – Gazel and can in no way be taken to reflect the views of the European Union”