mental health impacts of racial discrimination in ... report-web... · racial discrimination in...
TRANSCRIPT
Angeline Ferdinand, Yin Paradies and Margaret Kelaher
Mental Health Impacts of Racial Discrimination in Victorian Aboriginal CommunitiesThe Localities Embracing and Accepting Diversity (LEAD) Experiences of Racism Survey
‘The colour of my skin might be different but inside I’m the same as you’ by Heidi Knowles, a descendant of the Yorta Yorta tribe from Cummeragunja, Victoria
About the Artwork‘The two Longneck Turtles in the painting represent Peace and Harmony, while the People represent those on whom the research was based. They are surrounded by Spirit Figures, which represent the different nationalities living in the community, and if you look inside these figures you will see that each one has the same insides but different coloured skin. This means that no matter what the colour of your skin, inside we are all exactly the same and bleed the same colour.’
Angeline Ferdinand, Yin Paradies and Margaret Kelaher
Mental Health Impacts of Racial Discrimination in Victorian Aboriginal CommunitiesThe Localities Embracing and Accepting Diversity (LEAD) Experiences of Racism Survey
© The Lowitja Institute and the individual authors
ISBN 978-1-921889-22-6
First published in January 2013
This work is copyright. It may be reproduced in whole or in part for study or training purposes, or by Aboriginal and Torres Strait Islander community organisations subject to an acknowledgment of the source and no commercial use or sale. Reproduction for other purposes or by other organisations requires the written permission of the copyright holder(s). The project on which this report is based has been funded by the Lowitja Institute, which incorporates the Cooperative Research Centre for Aboriginal and Torres Strait Islander Health.
Additional copies of this publication can be obtained from:
The Lowitja InstitutePO Box 650, Carlton SouthVictoria 3053 AUSTRALIA
T: +61 3 8341 5555F: +61 3 8341 5599E: [email protected]: www.lowitja.org.au
Authors: Angeline Ferdinand1, Yin Paradies2 and Margaret Kelaher1
Managing Editor: Jane Yule
CRCATSIH Program Manager: Vanessa Harris
Artwork: ‘The colour of my skin might be different but inside I’m the same as you’ by Heidi Knowles
Design: Inprint Design
For citation: Ferdinand, A., Paradies, Y. & Kelaher, M. 2012, Mental Health Impacts of Racial Discrimination in Victorian Aboriginal Communities: The Localities Embracing and Accepting Diversity (LEAD) Experiences of Racism Survey, The Lowitja Institute, Melbourne.
Please note: For the purposes of this report, the term ‘Aboriginal’ has been used to denote Aboriginal and Torres Strait Islander peoples.
1 Centre for Health Policy, Programs & Economics, School of Population Health, The University of Melbourne ([email protected]; [email protected])
2 Centre for Citizenship and Globalisation, Faculty of Arts and Education, Deakin University ([email protected])
Acknowledgments iv
Executive Summary 1Experiences of racism 1Mental health Impacts of experiences of racism 1Implications 1
Background 2The Localities Embracing and Accepting Diversity (LEAD) Program 2Contextual background 2
Definitions and concepts 2Cultural diversity in Australia 3Racism and health 3
Purpose of the survey 4
Survey Methods 5Survey administration 5Survey structure 5
Demographic items 5Experiences of racism 5Mental health 6
Data analysis 7
Results 8Demographic data 8Sense of belonging 9Experiences of racism 9
Interpersonal racism: Types and frequencies of experiences 9Interpersonal racism: Settings 10Perpetrators 11Responses to interpersonal racism 11Factors affecting experiences of interpersonal racism 12Internalised racism 14Mental health and racism 14
Discussion 19Prevalence and nature of racism experienced 19Settings where racism was experienced 19Racism and mental health 21Responses to racism 21Limitations 22Implications 23
Conclusions 24Strategies for change 24
References 25
Appendix 1. Statistics 30
Appendix 2. Experiences of Racism survey items 33
Table of Contents iii
List of Tables and Figures
Table 1: Demographic data 8
Table 2: Item regarding sense of belonging to local area/neighbourhood 9
Table 3: Witnessing racism 9
Table 4: Experiences of racism by demographic characteristics 13
Table 5: Item regarding internalised racism 14
Table 6: Items from the Kessler 5 Psychological Distress Scale 15
Table 7: Items regarding anticipation, worrying and avoidance 18
Table 8: Items regarding perceived impact of racism 18
Figure 1: Experiences of racism in past 12 months 10
Figure 2: Settings of racist experiences in past 12 months 10
Figure 3: Participant responses to interpersonal racism 11
Figure 4: Number of different responses used in reaction to last reported experience 12
Figure 5: Experiences of racism by setting and university education 14
Figure 6: Experiences of racism and mean K5 score 15
Figure 7: Experiences of racism and being above the threshold for high or very high psychological distress on the K5 16
Figure 8: Types of experiences and odds of being above the threshold for high or very high psychological distress on the K5 adjusted for frequency of exposure 16
Figure 9: Settings of experiences and odds of being above the threshold for high or very high psychological distress on the K5 17
Figure 10: Responses to last experience and odds of finding the experience stressful or very stressful 17
This report is based on research from the project ‘Understanding and addressing racism against Aboriginal and Torres Strait Islander Australians through the LEAD (Localities Embracing and Accepting Diversity) program’ funded by the Lowitja Institute, Australia’s National Institute for Aboriginal and Torres Strait Islander Health Research, which incorporates the Cooperative Research Centre for Aboriginal and Torres Strait Islander Health. The LEAD program is funded by the Victorian Health Promotion Foundation (VicHealth), the Department of Immigration and Citizenship (DIAC) through its Diverse Australia
program and beyondblue, Australia’s peak body for mental health issues. The Experiences of Racism survey was carried out as part of these two interrelated projects. The report authors are part of the University of Melbourne LEAD evaluation team.
We would like to thank the community workers for their invaluable support in administering the surveys. We would also like to thank Peter Streker and Pamela Rodriguez from VicHealth for their support and advice in compiling this report, as well as Anna Ziersch and Donna Cormack for reviewing the report.
Acknowledgments
iv
1
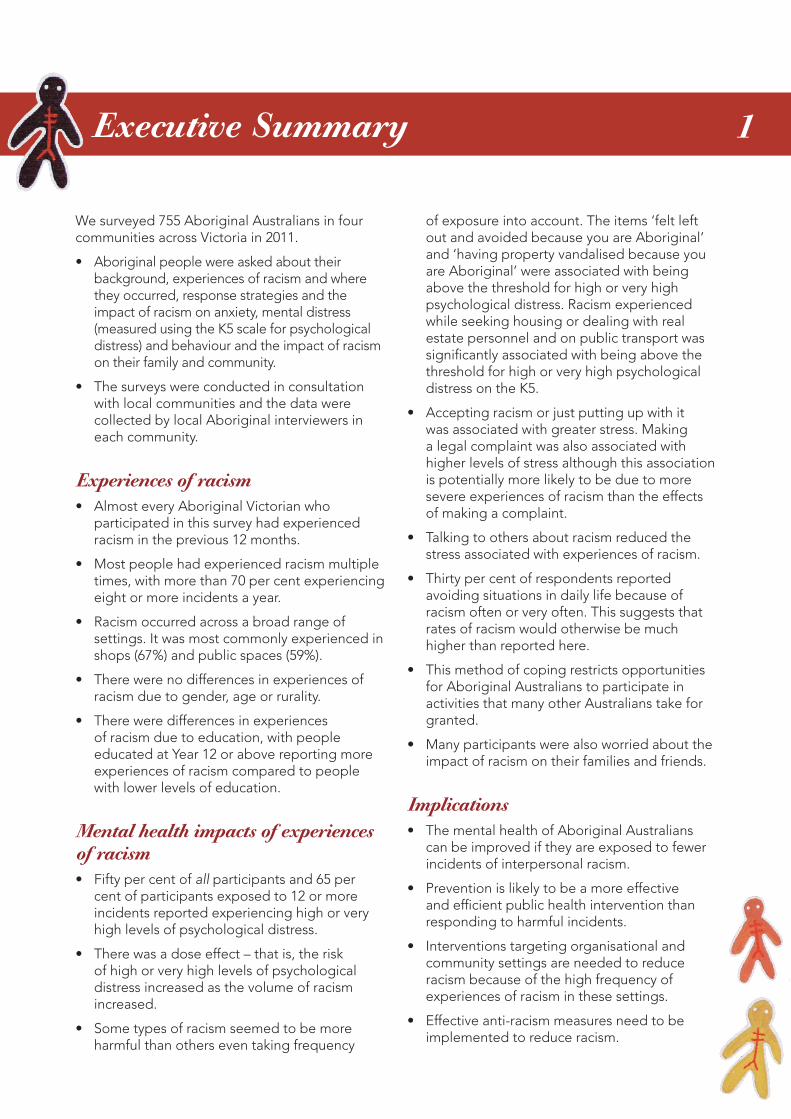
We surveyed 755 Aboriginal Australians in four communities across Victoria in 2011.
• Aboriginal people were asked about their background, experiences of racism and where they occurred, response strategies and the impact of racism on anxiety, mental distress (measured using the K5 scale for psychological distress) and behaviour and the impact of racism on their family and community.
• The surveys were conducted in consultation with local communities and the data were collected by local Aboriginal interviewers in each community.
Experiences of racism • Almost every Aboriginal Victorian who
participated in this survey had experienced racism in the previous 12 months.
• Most people had experienced racism multiple times, with more than 70 per cent experiencing eight or more incidents a year.
• Racism occurred across a broad range of settings. It was most commonly experienced in shops (67%) and public spaces (59%).
• There were no differences in experiences of racism due to gender, age or rurality.
• There were differences in experiences of racism due to education, with people educated at Year 12 or above reporting more experiences of racism compared to people with lower levels of education.
Mental health impacts of experiences of racism• Fifty per cent of all participants and 65 per
cent of participants exposed to 12 or more incidents reported experiencing high or very high levels of psychological distress.
• There was a dose effect – that is, the risk of high or very high levels of psychological distress increased as the volume of racism increased.
• Some types of racism seemed to be more harmful than others even taking frequency
Executive Summary
of exposure into account. The items ‘felt left out and avoided because you are Aboriginal’ and ‘having property vandalised because you are Aboriginal’ were associated with being above the threshold for high or very high psychological distress. Racism experienced while seeking housing or dealing with real estate personnel and on public transport was significantly associated with being above the threshold for high or very high psychological distress on the K5.
• Accepting racism or just putting up with it was associated with greater stress. Making a legal complaint was also associated with higher levels of stress although this association is potentially more likely to be due to more severe experiences of racism than the effects of making a complaint.
• Talking to others about racism reduced the stress associated with experiences of racism.
• Thirty per cent of respondents reported avoiding situations in daily life because of racism often or very often. This suggests that rates of racism would otherwise be much higher than reported here.
• This method of coping restricts opportunities for Aboriginal Australians to participate in activities that many other Australians take for granted.
• Many participants were also worried about the impact of racism on their families and friends.
Implications • The mental health of Aboriginal Australians
can be improved if they are exposed to fewer incidents of interpersonal racism.
• Prevention is likely to be a more effective and efficient public health intervention than responding to harmful incidents.
• Interventions targeting organisational and community settings are needed to reduce racism because of the high frequency of experiences of racism in these settings.
• Effective anti-racism measures need to be implemented to reduce racism.
2
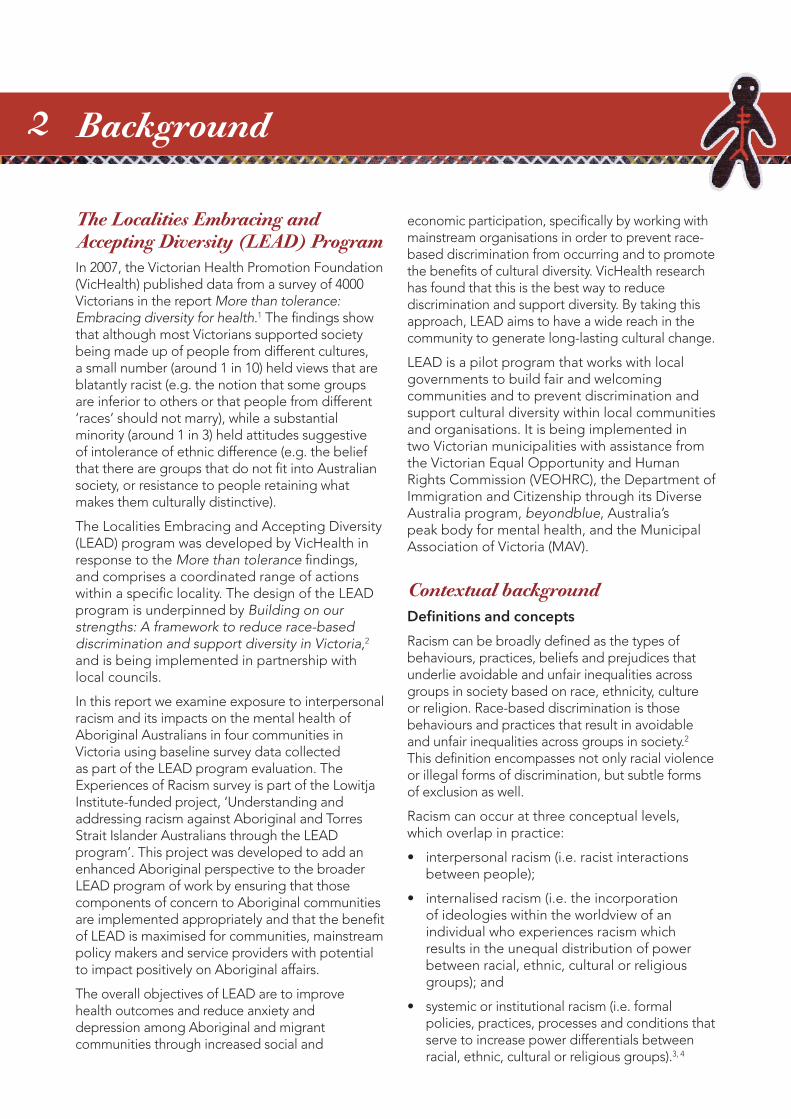
The Localities Embracing and Accepting Diversity (LEAD) ProgramIn 2007, the Victorian Health Promotion Foundation (VicHealth) published data from a survey of 4000 Victorians in the report More than tolerance: Embracing diversity for health.1 The findings show that although most Victorians supported society being made up of people from different cultures, a small number (around 1 in 10) held views that are blatantly racist (e.g. the notion that some groups are inferior to others or that people from different ‘races’ should not marry), while a substantial minority (around 1 in 3) held attitudes suggestive of intolerance of ethnic difference (e.g. the belief that there are groups that do not fit into Australian society, or resistance to people retaining what makes them culturally distinctive).
The Localities Embracing and Accepting Diversity (LEAD) program was developed by VicHealth in response to the More than tolerance findings, and comprises a coordinated range of actions within a specific locality. The design of the LEAD program is underpinned by Building on our strengths: A framework to reduce race-based discrimination and support diversity in Victoria,2 and is being implemented in partnership with local councils.
In this report we examine exposure to interpersonal racism and its impacts on the mental health of Aboriginal Australians in four communities in Victoria using baseline survey data collected as part of the LEAD program evaluation. The Experiences of Racism survey is part of the Lowitja Institute-funded project, ‘Understanding and addressing racism against Aboriginal and Torres Strait Islander Australians through the LEAD program’. This project was developed to add an enhanced Aboriginal perspective to the broader LEAD program of work by ensuring that those components of concern to Aboriginal communities are implemented appropriately and that the benefit of LEAD is maximised for communities, mainstream policy makers and service providers with potential to impact positively on Aboriginal affairs.
The overall objectives of LEAD are to improve health outcomes and reduce anxiety and depression among Aboriginal and migrant communities through increased social and
economic participation, specifically by working with mainstream organisations in order to prevent race-based discrimination from occurring and to promote the benefits of cultural diversity. VicHealth research has found that this is the best way to reduce discrimination and support diversity. By taking this approach, LEAD aims to have a wide reach in the community to generate long-lasting cultural change.
LEAD is a pilot program that works with local governments to build fair and welcoming communities and to prevent discrimination and support cultural diversity within local communities and organisations. It is being implemented in two Victorian municipalities with assistance from the Victorian Equal Opportunity and Human Rights Commission (VEOHRC), the Department of Immigration and Citizenship through its Diverse Australia program, beyondblue, Australia’s peak body for mental health, and the Municipal Association of Victoria (MAV).
Contextual backgroundDefinitions and concepts
Racism can be broadly defined as the types of behaviours, practices, beliefs and prejudices that underlie avoidable and unfair inequalities across groups in society based on race, ethnicity, culture or religion. Race-based discrimination is those behaviours and practices that result in avoidable and unfair inequalities across groups in society.2 This definition encompasses not only racial violence or illegal forms of discrimination, but subtle forms of exclusion as well.
Racism can occur at three conceptual levels, which overlap in practice:
• interpersonal racism (i.e. racist interactions between people);
• internalised racism (i.e. the incorporation of ideologies within the worldview of an individual who experiences racism which results in the unequal distribution of power between racial, ethnic, cultural or religious groups); and
• systemic or institutional racism (i.e. formal policies, practices, processes and conditions that serve to increase power differentials between racial, ethnic, cultural or religious groups).3, 4
Background
3
Racism can be direct (or overt) or indirect (covert or hidden). Direct racism is based in differential treatment that results in an unequal distribution of power, resources or opportunities across different groups, such as a refusal to hire people from a particular ethnic group. Indirect racism is equal treatment that impacts groups differently and, therefore, results in an unequal distribution of power, resources or opportunities across different groups. An example of indirect racism is a policy that requires all employees to have their head uncovered while working: although the policy is the same for all employees, it adversely affects the opportunities of those who wear head coverings for religious or traditional reasons.2
Cultural diversity in Australia
From the early days of European settlement in Australia in 1788, racism against Aboriginal people took the form of murder, exploitation and the dispossession of Aboriginal people’s land and culture. The requirement or expectation that minority ethnic, cultural or religious groups should strive to become culturally indistinguishable from the majority population is an approach called ‘assimilation.’ By contrast, ‘multiculturalism’ is a policy that sees the retention of cultural, social and linguistic distinctions as a private matter, rather than being controlled by government. In 1937, the Federal government developed an official policy of assimilation towards Aboriginal Australians, detailing that Aboriginal people of mixed descent were to be assimilated into white society regardless of individuals’ desires while confining those not of mixed descent to Aboriginal reserves. This policy led to the further destruction of Aboriginal culture, families and social structures, segregationist practices and the removal of Aboriginal children from their families and Aboriginal people from their land.5, 6
The denial of full citizenship rights to Aboriginal and Torres Strait Islander people continued until the Constitutional amendment of 1967, which allowed for Aboriginal people to be counted in the census and empowered the Federal government to legislate for Aboriginal people. In 1969 all States repealed legislation that had allowed the systematic forcible removal of Aboriginal children under the policy of ‘protection.’ However, the decades of removal and displacement of families and the institutionalisation of Aboriginal people on reserves and missions continues to have long-standing effects, including the loss of cultural knowledge and Aboriginal identity and attenuation of family relationships.7 The
Federal government issued a formal apology to Aboriginal and Torres Strait Islander people over the forced removal of their children in 2008.5,6
In 1972 the Federal government introduced the policy of self-determination for Aboriginal Australians, which was based on the rights of Aboriginal people to maintain their cultural and linguistic heritage and natural resources on Australian land.5,6 However, despite the evolution of government policy towards the support of cultural diversity, the social changes necessary to eliminate racist attitudes, actions and beliefs within individuals, and policies and processes within organisations and institutions, are complex and develop slowly.
The relationship between Aboriginal and other Australians has been heavily impacted by racist practice over many years and there continues to be a need to address both the effects of past racism and ongoing forms of discrimination. In 2010 the University of Western Sydney’s ‘Challenging Racism Project’ reported that although a large majority of Australians are positive about living in a multicultural country, 41 per cent have a narrow view of who belongs in Australia.8 The ‘Challenging Racism Project’ echoed More than Tolerance in finding that approximately one in 10 Australians hold blatantly racist views. Although more difficult to establish, there is also evidence of ongoing systemic discrimination in Australia, including within health care settings and in responding to issues of child services.2,9,10
Racism and health
The link between poorer physical and mental health and self-reported perceptions or experiences of racism is well documented.11–14 Racism can affect mental health in several ways. In particular, there is a risk that targets of racism will develop a range of mental health problems such as anxiety and depression.11,14,15 Racism is understood to have a negative impact on health for a number of reasons, including restricting access to resources required for health, stress and negative emotions having harmful psychological and physiological effects, and injury through racially motivated assault.2 People may experience anxiety when anticipating that they may be subject to racism in specific settings, and past experiences of racism may cause social isolation of both individuals and communities that might in turn contribute to mental disorders. In some cases, it may be that the racist experiences themselves do not contribute directly to poorer health, but are mediated by other factors along
4
the pathway. For example, if an individual experiences racism that prevents them from finding adequate employment, the resultant un- or underemployment may then contribute to poorer health outcomes. There is also evidence that responses to racism may mediate the relationship between experiencing racism and poorer mental and physical health.16
There is clear evidence that Aboriginal Australians experience substantially lower levels of health in comparison to the wider Australian population, including a reduced life expectancy of 11.5 years for males and 9.7 years for females.17 This has led to a number of studies examining racism as a determinant of ill health in Aboriginal Australians.18–24 Collectively, these studies support the correlation between experiencing racism and poorer mental and physical health outcomes for Aboriginal Australians. The studies also address factors that may mediate the relationship between experiencing racism and ill-health, including stress and social disconnectedness. Many of these studies aim to develop an understanding of how racism is experienced by Aboriginal Australians, including specifying details around incident settings, perpetrators and individual responses in order to assist in developing appropriate and effective approaches to support the health of Aboriginal Australians.25
Purpose of the surveyThe Experiences of Racism survey attempted to understand Victorian Aboriginal community members’ self-reported experiences of interpersonal, systemic and internalised racism, their responses and reactions to these experiences and the association between these experiences and measures of psychological distress. The survey was developed in conjunction with the LEAD program evaluation and administered as part of baseline data collection at the beginning of the LEAD program. The two rural and two metropolitan local government areas (LGAs) surveyed have been de-identified in this report in order to protect the affected communities. The surveyed LGAs were selected as areas that had a high level of racial and ethnic diversity in which the local council recognised racism as a concern in the community and demonstrated both a capacity and commitment to addressing it. Selection was not due to particularly high levels of racism in comparison to other Victorian communities.
5
Aboriginal participants in the Experiences of Racism surveys were aged 18 years or older and lived within Rural Council 1 (n=313), Metropolitan Council 1 (n=90), Metropolitan Council 2 (n=57) or Rural Council 2 (n=295) for at least one year.
Survey administrationIn each area, four (Metropolitan Council 1 and Rural Council 2) or five (Rural Council 1 and Metropolitan Council 2) Aboriginal workers were recruited to administer the surveys. The recruitment process included a consultation phase with relevant stakeholder groups in each council. This process was used to identify the most appropriate way of recruiting community interviewers and to develop data governance protocols. Community workers were trained in ethical research practices and survey administration by the LEAD evaluation team and supported throughout the data collection period by frequent contact with evaluation team members. Community workers distributed surveys through their personal and professional contacts as well as at local community events and functions. Surveys were administered face-to-face in group or individual sessions.
The community workers who administered the surveys recorded both participants and people who were invited but declined to participate. The reasons provided for declining to participate were recorded. Community workers also participated in a follow-up session for feedback and debriefing. Participants received a $20 supermarket gift voucher after completing the surveys. Surveys were administered between March and May 2011 in Rural Council 1, between January and April 2011 in Metropolitan Council 1, between June and October 2011 in Metropolitan Council 2, and between December 2010 and June 2011 in Rural Council 2.
Consultation was conducted in each area to ensure that the relevant Experiences of Racism survey was appropriate for each community. The Experiences of Racism survey varied slightly in each locality as wording was changed or items removed on advice of local community members. Most significantly, in the Experiences of Racism survey for Rural Council 2, one question was removed from the Kessler 6
Survey Methods
(K6) questionnaire to assess psychological distress in response to feedback from the community. Only items that were included on all surveys are presented in this report.
Survey structureDemographic items
The survey began with demographic questions, including age, gender, education and whether the participant was Aboriginal and/or Torres Strait Islander. Although a range of other factors such as existing chronic conditions and socio-economic status can also be associated with health outcomes, these were not measured in the survey as it was believed that inclusion of additional items would lead to an overly long survey and reduce participant interest in completing it.
Experiences of racism
The next section of the survey presented items assessing participants’ sense of belonging within their local area or neighbourhood, internalised racism, frequency of witnessing discrimination, frequency of anxiety around friends and family experiencing discrimination, and the level of effect that racism has had on their own lives and the lives of their friends and family. Internalised racism was assessed through the item: ‘I feel good about being Aboriginal…’ using a subjective frequency scale (i.e. ‘very often’/’often’/’sometimes’/etc.). For all other items in this section, the response categories consisted of either Likert scales (i.e. ‘to a great extent’/’to a moderate extent’/’only slightly’/’not at all’) or objective frequency scales (e.g. ‘at least once a week’/‘a few times a month’ etc.). An additional item to assess internalised racism by asking whether the respondent believed that Aboriginal people should think and act more like other Australians was removed because communities felt that it could be construed as offensive. ‘Local area or neighbourhood’ was not defined in the survey to allow participants to interpret their local area in a way that reflected their own experiences.
The next section in the survey recorded frequency of exposure to systemic racism as well as the level
6
of distress caused by exposure. Participants were asked to indicate the frequency and resulting stress level over the previous 12 months of negative media exposure of Aboriginal people and communities, witnessing discrimination as a result of policies or practices at work, in businesses or in government agencies, exclusion from decision-making opportunities or witnessing racial tension or conflicts in the local area. Responses to this section are not detailed in this report.
The survey assessed types of interpersonal racism experienced in the past 12 months, and where these incidents took place, using a grid that had experiences listed on the left and settings listed across the top. Participants then indicated which type of experience had occurred and where it took place by marking the appropriate grid box. This method was based on a tool used previously with young Australians.26
Experiences listed included racist name-calling or teasing; verbal abuse or offensive gestures; being told the participant does not belong, that they should ‘go home’ or ‘get out’; being left out or avoided; being treated as inferior or less intelligent; being ignored, treated with suspicion or treated rudely; having property vandalised; and physical abuse or the threat of physical abuse.
Settings listed were:
• in a shop, store or mall
• while doing sport, recreational or leisure activities
• while seeking housing or in dealing with real estate personnel
• in a bank or other financial institution
• in dealings with local council
• in dealings with other government agencies
• at work, on the job or when looking for a job
• at school, university or another educational setting
• in public spaces (on the street, beach, park etc.)
• with the police, courts or jails
• in hospitals, health centres, at the doctor’s office
• on public transport.
The participants who reported experiencing a racist incident over the past 12 months received a series of questions asking for details about their most recent experience. These included how long ago it occurred, whether it had occurred in the participant’s local neighbourhood, whether the perpetrator was Aboriginal or not, how
well the participant knew the perpetrator, how stressful the incident was for the participant, and actions that the participant took in relation to the incident. An open-ended item gave participants the opportunity to supply any other comments about their experiences. The survey items and the sources of the items are listed in Appendix 2.
Mental health
All participants were asked to indicate how frequently they anticipated and worried about experiencing racism as well as how often they took action to avoid racism.
Mental health was assessed through the inclusion of a modified version of the Kessler 6 (K6) scale. The scale is a quantifier of non-specific psychological distress, which was derived from the Kessler Psychological Distress Scale (K10) as a simple measure of psychological distress. It has demonstrated excellent internal consistency and reliability as well as consistency across major socio-demographic sub-samples.27 The K6 involves six questions about emotional states, each with a five-level response scale. The measure can be used as a brief screen to identify levels of distress. The K6 can be given to participants to complete, or alternatively the questions can be read to the participant by the administrator. The question ‘In the past 4 weeks, about how often did you feel worthless?’ was removed from the K6 in Rural Council 2 on advice from the community that it could be offensive. The five-question scale (K5) has also been used by the Australian Bureau of Statistics for Aboriginal and Torres Strait Islander people’s surveys, after consultation with the creator of the K10.28–30
The K5 is scored using the sum of answer responses, where responses of ‘None of the time’ are given a score of one to ‘All of the time’ yielding a score of five. Thus, the range of responses is 5–25. Low scores indicate low levels of psychological distress and high scores indicate high levels of psychological distress. There are a number of different categories and groupings used for analysis of the K10 and K6 scores.30,31 However, in most ABS and other Australian surveys, the data is presented according to four categories (low, moderate, high and very high), with a very high score of psychological distress possibly indicating a need for professional help.31 In 2003, data from the 1997–98 NSW Health Survey were used to validate K5 scoring categories. According to these categories, scores of 12 to 25 on the K5 indicate high or very high psychological distress.30 Despite the reduction
7
in the number of items the reliability of the scale was high among this sample (Cronbach’s α=0.85).
The final item in the survey was an open-ended question for participants to give any comments they thought relevant.
Someone who can be visibly identified as belonging to an ethnic minority group is likely to have higher exposure to racism than someone who is not visibly identifiable. However, visibility status was not taken into account in this survey as there is no accepted way of assessing visibility for Aboriginal people and questions to this effect were likely to be highly offensive to communities.
Data analysisSPSS Statistics 19, a statistical software package, was used to analyse the data. Participants’ experiences of racism were divided into None, Low (1–7 experiences), Medium (8–11) and High (12+) frequency categories. These cut-off points were selected so approximately one-third of people who experienced racism were in each category. Chi-square analysis was used to assess demographic differences between people with different frequency levels. Chi-square analysis is used to determine whether there is an association between two variables based on their frequencies in the data.
Logistic regression was used to assess the relationship between participants’ experiences of
racism and position above or below the threshold for high or very high psychological distress on the K5 scale. The relationship between the types of racism experienced and settings for experiencing racism and being above or below the threshold for high or very high psychological distress on the K5 scale was also explored using logistic regression. Logistic regression is used to predict the outcome of one variable based on other variables within a model. A logistic regression was conducted to assess the role of response strategies on stress associated with the most recent racist incident.
Stress was coded into two categories (Not at all/a little/somewhat stressful and very/extremely stressful). These relationships are reported in the form of odds ratios, which indicates the strength of the relationship. An odds ratio of one indicates that there is no difference between the groups being studied. All models controlled for age, gender, education and LGA as potential confounding factors. As some participants did not complete every item, valid percentages are reported for all frequencies, with missing data removed. Within demographic items, data regarding education is missing for 17.4 per cent of participants and age is missing for 6.9 per cent of participants. Throughout the rest of the survey, data is missing for between 1.6 per cent and 5.2 per cent of participants.
8
Table 1: Demographic data
n %
LGA Rural Council 1Metropolitan Council 1Metropolitan Council 2Rural Council 2
3139057295
41.511.97.539.1
Gender MaleFemale
284451
37.659.7
Age 18–2425–3435–4445–5455–6465+
178175174905333
23.623.223.011.97.04.4
Education Tertiary qualificationsTrade or TAFEHigher School Certificate School certificatePrimary schoolOther
7888992367449
10.311.713.131.39.86.5
Level of experiences NoneLowMediumHigh
26191285253
3.425.337.733.5
*n may not add up to 755 due to missing values; percentages may not add up to 100% due to rounding.
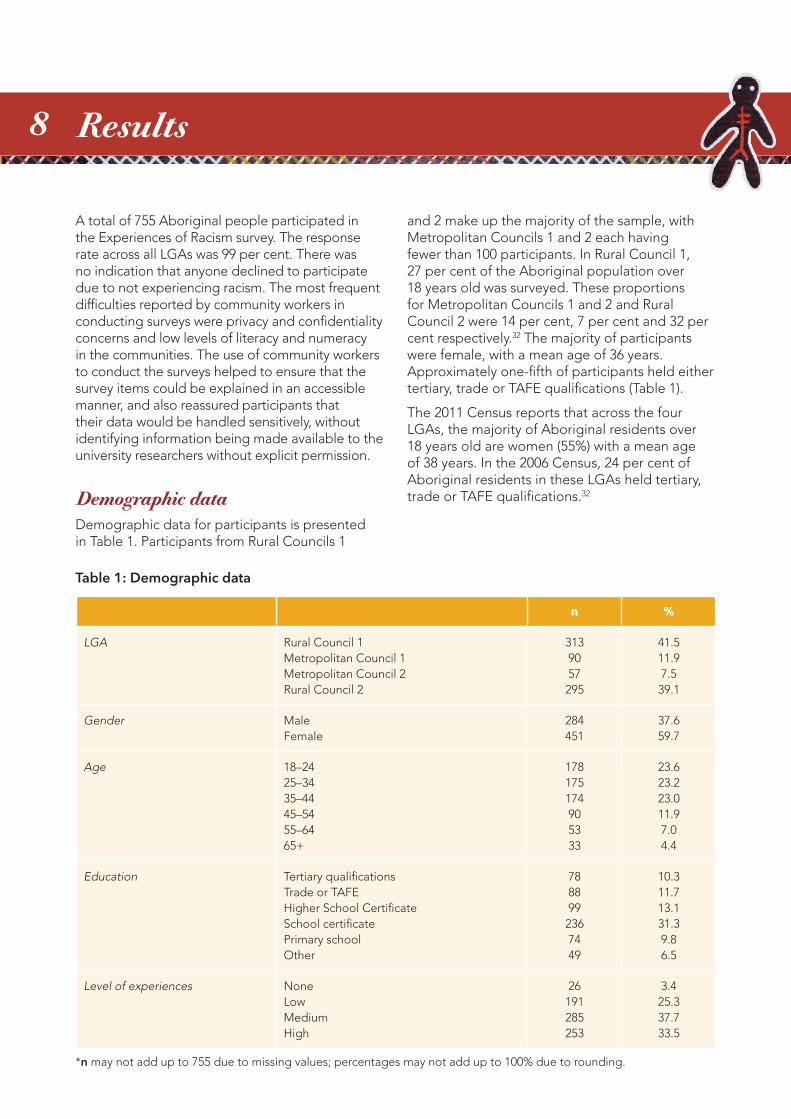
A total of 755 Aboriginal people participated in the Experiences of Racism survey. The response rate across all LGAs was 99 per cent. There was no indication that anyone declined to participate due to not experiencing racism. The most frequent difficulties reported by community workers in conducting surveys were privacy and confidentiality concerns and low levels of literacy and numeracy in the communities. The use of community workers to conduct the surveys helped to ensure that the survey items could be explained in an accessible manner, and also reassured participants that their data would be handled sensitively, without identifying information being made available to the university researchers without explicit permission.
Demographic dataDemographic data for participants is presented in Table 1. Participants from Rural Councils 1
Results
and 2 make up the majority of the sample, with Metropolitan Councils 1 and 2 each having fewer than 100 participants. In Rural Council 1, 27 per cent of the Aboriginal population over 18 years old was surveyed. These proportions for Metropolitan Councils 1 and 2 and Rural Council 2 were 14 per cent, 7 per cent and 32 per cent respectively.32 The majority of participants were female, with a mean age of 36 years. Approximately one-fifth of participants held either tertiary, trade or TAFE qualifications (Table 1).
The 2011 Census reports that across the four LGAs, the majority of Aboriginal residents over 18 years old are women (55%) with a mean age of 38 years. In the 2006 Census, 24 per cent of Aboriginal residents in these LGAs held tertiary, trade or TAFE qualifications.32
9
Sense of belongingNearly 85 per cent of respondents reported a moderate or great sense of belonging to their local area/neighbourhood (Table 2).
Table 2: Item regarding sense of belonging to local area/neighbourhood
n To a great extent %
To a moderate extent %
Only slightly % Not at all %
I have a sense of belonging in my local area/neighbourhood...
743 44.4 38.9 11.8 3.3
Experiences of racism
Interpersonal racism: types and frequencies of experiences
Nearly all participants reported at least one racist incident in the preceding 12 months, with 25 per cent reporting between one and seven experiences, 38 per cent reporting between eight
and 11 experiences and 34 per cent reporting 12 or more experiences. Only 3 per cent of participants reported no racist experiences. The highest number of experiences reported was 101, reported by one person. The average across the sample was 13.7 experiences. Nearly half of respondents (44%) also reported witnessing other people being treated unfairly due to their race, ethnicity, culture or religion at least once a week.
Table 3: Witnessing racism
n Almost every day
At least once a week
A few times a month
A few times a
year
Less than once a
yearNever
How often have you seen people being treated unfairly because of their race, ethnicity, culture or religion?
738 17.8 25.6 28.4 15.6 7.5 2.7
When asked about the most recent racist incident that they had experienced, approximately one-third of the incidents (35%) had occurred within the past month. A majority (81%) had occurred within the respondent’s local area or neighbourhood and of those that were not in the local area, 70 per cent happened within Victoria.
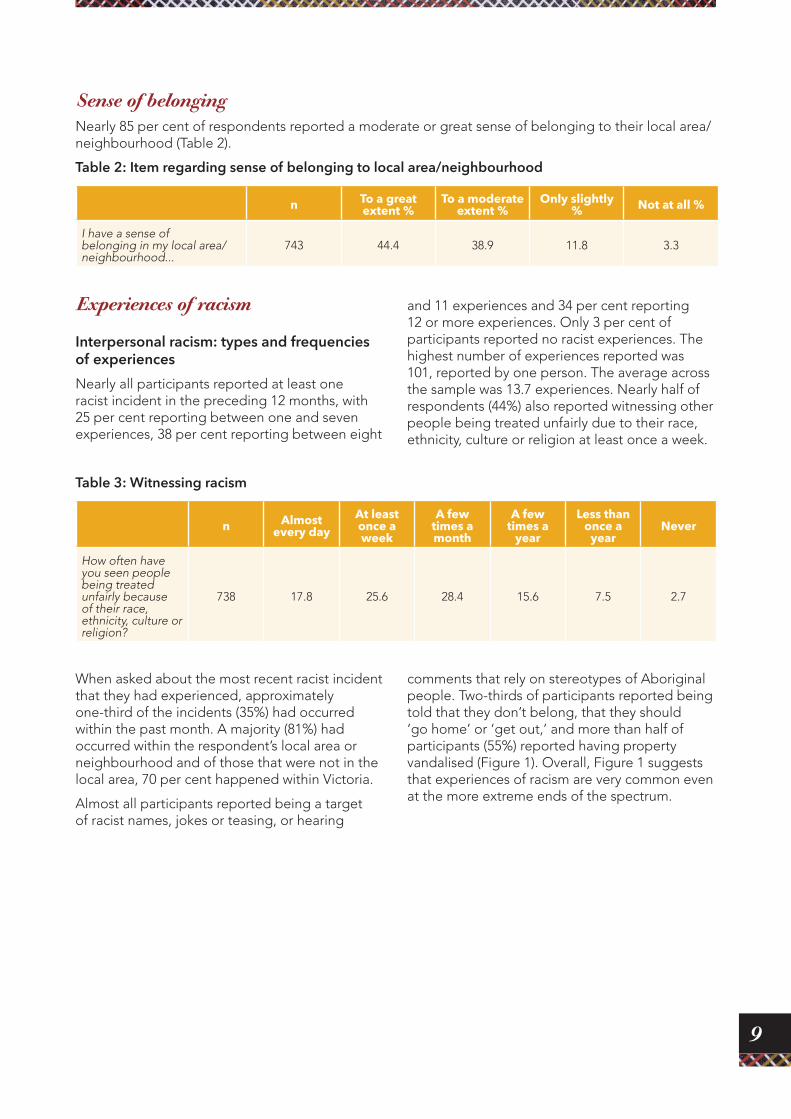
Almost all participants reported being a target of racist names, jokes or teasing, or hearing
comments that rely on stereotypes of Aboriginal people. Two-thirds of participants reported being told that they don’t belong, that they should ‘go home’ or ‘get out,’ and more than half of participants (55%) reported having property vandalised (Figure 1). Overall, Figure 1 suggests that experiences of racism are very common even at the more extreme ends of the spectrum.
10
Figure 1: Experiences of racism in past 12 months
Names, teasing or comments
92.3
85.8 84.181.9 79.9
67.4 66.0
54.7
Perc
ent o
f res
po
nden
ts
0
10
20
30
40
50
60
70
80
90
100
Ignored Swore at/verbally abused
Less intelligent Left out Spit or something
thrown
Don’t belong in Australia
Property vandalised
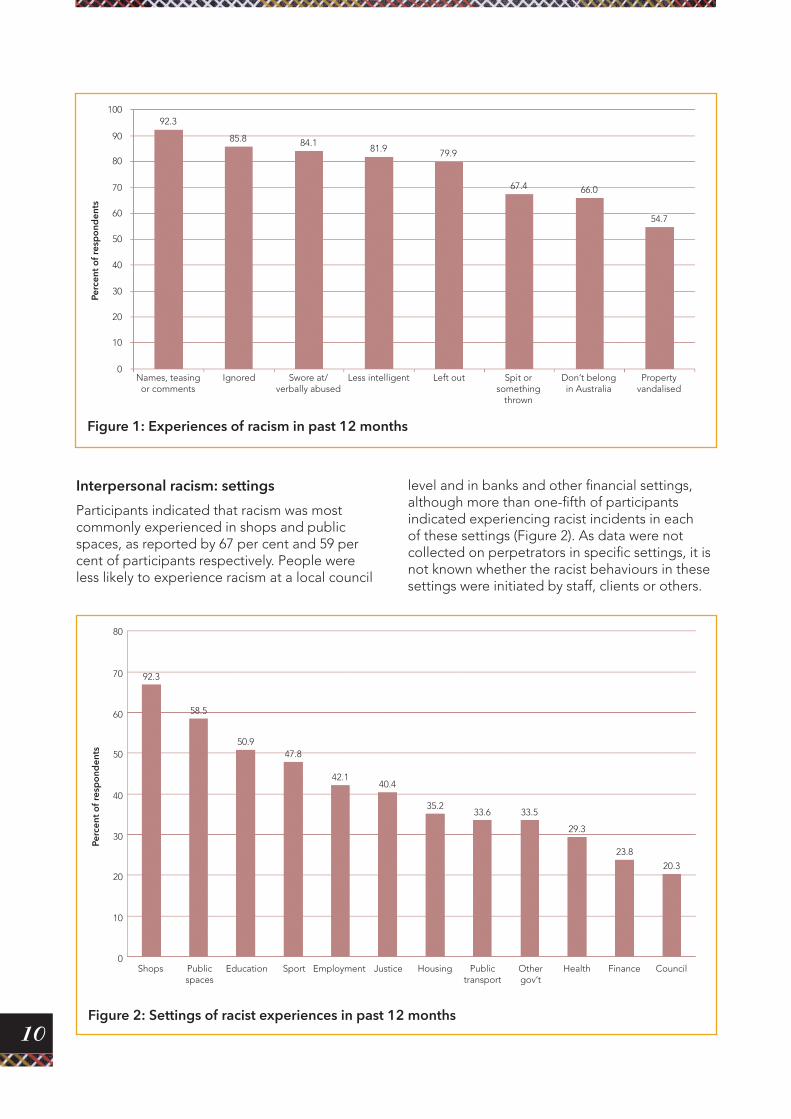
Interpersonal racism: settings
Participants indicated that racism was most commonly experienced in shops and public spaces, as reported by 67 per cent and 59 per cent of participants respectively. People were less likely to experience racism at a local council
level and in banks and other financial settings, although more than one-fifth of participants indicated experiencing racist incidents in each of these settings (Figure 2). As data were not collected on perpetrators in specific settings, it is not known whether the racist behaviours in these settings were initiated by staff, clients or others.
Figure 2: Settings of racist experiences in past 12 months
Shops Public spaces
Education Sport Employment Justice Housing Public transport
Other gov’t
Health Finance Council
92.3
58.5
50.947.8
42.140.4
35.233.6 33.5
29.3
23.8
20.3
Perc
ent o
f res
po
nden
ts
0
10
20
30
40
50
60
70
80

11
Responses to interpersonal racism
People who had experienced racism used a range of methods to respond to these incidents. Twelve responses were listed, plus an ‘other’ category, with participants able to choose however many applied to their most recent experience. With regards to respondents’ most recent experiences, the two most common responses were either to ignore it or to verbally confront the perpetrator (33% and 32% respectively of respondents who reported at least one experience) (Figure 3).
Perpetrators
When asked about the last racist incident experienced by participants who had experienced interpersonal racism, a high proportion (92%) of respondents reported that the perpetrator in the incident was non-Aboriginal. Approximately one-quarter (26%) of respondents knew the perpetrator of their most recent experience a little, while 64 per cent did not know the perpetrator at all. The remaining 10 per cent of respondents reported that the perpetrator was someone they knew well or someone who was close to them.
Figure 3: Participant responses to interpersonal racism
Ignored it
Talked to someone
Accepted it
Tried to reason
Used humour
Made a complaint
Changed self
Received help
Reported to police
Wrote, drew,
sang or painted
OtherVerbally confronted
Wanted to confront;
didn’t
33.232.4
25
18
13.7 13.4
11.2 10.8
6.45.6
4.4
2.31.6Pe
rcen
t of r
esp
ond
ents
who
exp
erie
nced
at l
east
one
inci
den
t
0
5
10
15
20
25
35
30
12
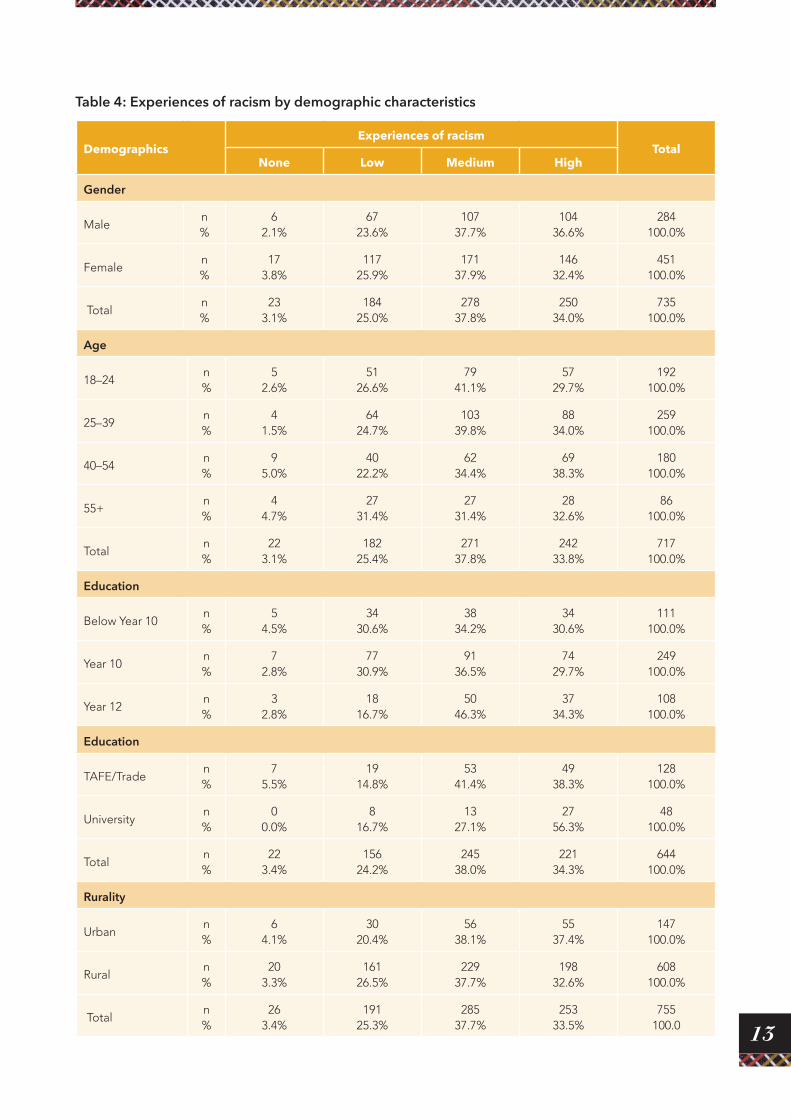
Factors affecting experiences of interpersonal racism
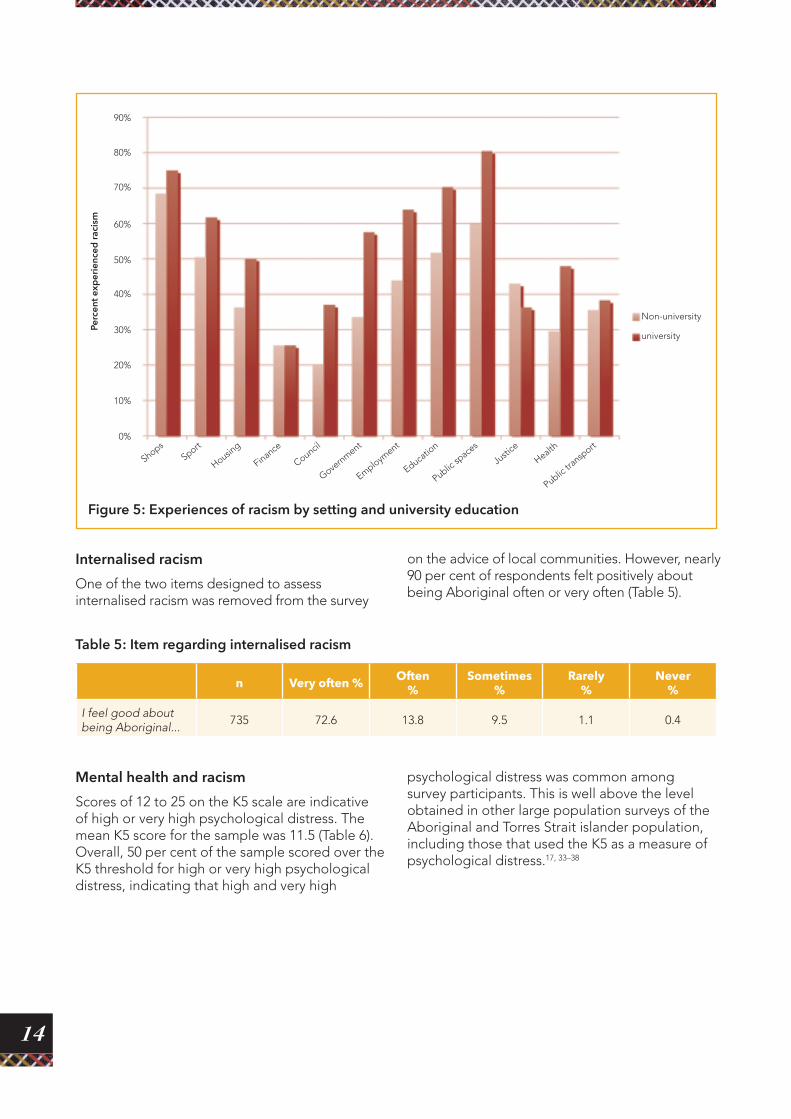
There were no differences in experiences of racism due to gender (χ2=2.84, df=3, p=0.42), age (χ2=11.5, df=9, p=0.24) or rurality (χ2=2.8, df=3, p=0.43). People educated at Year 12 or above reported more racism than people with lower levels of education (χ2=32.5,df=12, p=0.001) (Table 4). This effect was particularly marked for the small number of people with a university
education. Figure 5 shows that university-educated people reported more experiences of racism than non-university educated people in council, government, employment, education, public spaces and health settings (Figure 5). Levels of experiences in shops, sport, housing, finance, justice and public transport were not significantly different between university-educated people and others (see Appendix 1, Table 1 for statistics).
Figure 4: Number of different responses used in reaction to last reported experience
39.4
16.6
10.2
6.0
1.91 0.7 0.4 0.1 0.3
Perc
ent o
f res
po
nden
ts th
e ex
per
ienc
ed a
t lea
st o
ne in
cid
ent
01 2 3 4 5 6 7 8 9 10
5
10
15
20
25
30
35
40
45
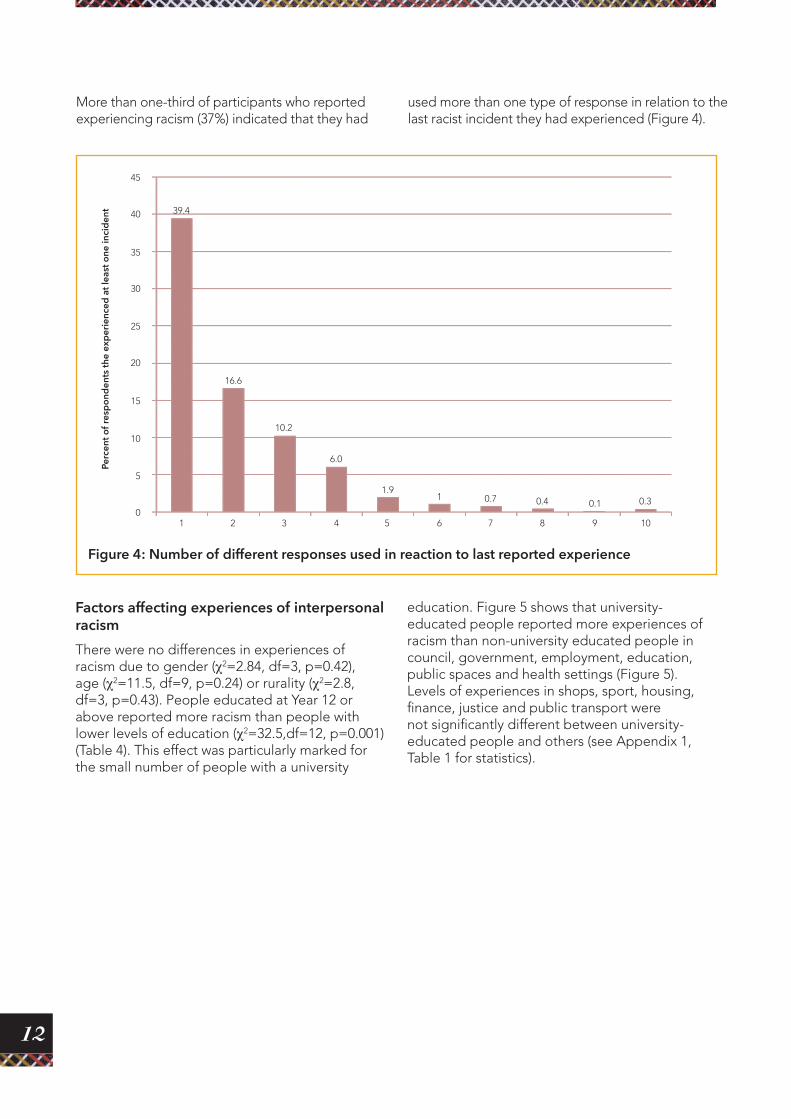
More than one-third of participants who reported experiencing racism (37%) indicated that they had
used more than one type of response in relation to the last racist incident they had experienced (Figure 4).
13
Table 4: Experiences of racism by demographic characteristics
Demographics Experiences of racism
TotalNone Low Medium High
Gender
Male n%
62.1%
6723.6%
10737.7%
10436.6%
284100.0%
Femalen%
173.8%
11725.9%
17137.9%
14632.4%
451100.0%
Totaln%
233.1%
18425.0%
27837.8%
25034.0%
735100.0%
Age
18–24n%
52.6%
5126.6%
7941.1%
5729.7%
192100.0%
25–39n%
41.5%
6424.7%
10339.8%
8834.0%
259100.0%
40–54n%
95.0%
4022.2%
6234.4%
6938.3%
180100.0%
55+n%
44.7%
2731.4%
2731.4%
2832.6%
86100.0%
Totaln%
223.1%
18225.4%
27137.8%
24233.8%
717100.0%
Education
Below Year 10n%
54.5%
3430.6%
3834.2%
3430.6%
111100.0%
Year 10n%
72.8%
7730.9%
9136.5%
7429.7%
249100.0%
Year 12n%
32.8%
1816.7%
5046.3%
3734.3%
108100.0%
Education
TAFE/Traden%
75.5%
1914.8%
5341.4%
4938.3%
128100.0%
Universityn%
00.0%
816.7%
1327.1%
2756.3%
48100.0%
Totaln%
223.4%
15624.2%
24538.0%
22134.3%
644100.0%
Rurality
Urban n%
64.1%
3020.4%
5638.1%
5537.4%
147100.0%
Ruraln%
203.3%
16126.5%
22937.7%
19832.6%
608100.0%
Totaln%
263.4%
19125.3%
28537.7%
25333.5%
755100.0
14
Table 5: Item regarding internalised racism
n Very often % Often %
Sometimes %
Rarely %
Never %
I feel good about being Aboriginal...
735 72.6 13.8 9.5 1.1 0.4
Figure 5: Experiences of racism by setting and university education
ShopsSport
Housing
Finance
Council
Government
Employment
Educatio
n
Public sp
aces
Non-university
university
Justi
ce
Health
Public tr
ansport
Perc
ent e
xper
ienc
ed ra
cism
0%
10%
20%
30%
40%
50%
60%
70%
80%
90%
Internalised racism
One of the two items designed to assess internalised racism was removed from the survey
on the advice of local communities. However, nearly 90 per cent of respondents felt positively about being Aboriginal often or very often (Table 5).
Mental health and racism
Scores of 12 to 25 on the K5 scale are indicative of high or very high psychological distress. The mean K5 score for the sample was 11.5 (Table 6). Overall, 50 per cent of the sample scored over the K5 threshold for high or very high psychological distress, indicating that high and very high
psychological distress was common among survey participants. This is well above the level obtained in other large population surveys of the Aboriginal and Torres Strait islander population, including those that used the K5 as a measure of psychological distress.17, 33–38
15
Table 6: Items from the Kessler 5 Psychological Distress Scale
n None of the time %
A little of the time %
Some of the time %
Most of the time %
All of the time %
In the past 4 weeks, about how often did you feel so sad that nothing could cheer you up?
716 25.4 28.6 29.4 9.7 1.7
In the past 4 weeks, about how often did you feel nervous?
723 19.3 36.3 29.3 8.2 2.6
In the past 4 weeks, about how often did you feel restless or fidgety?
727 24.5 26.5 31.5 10.2 3.6
In the past 4 weeks, about how often did you feel hopeless?
719 35.9 22.8 26.8 7.8 2.0
In the past 4 weeks, about how often did you feel that everything was an effort?
728 21.3 29.0 31.0 11.5 3.6
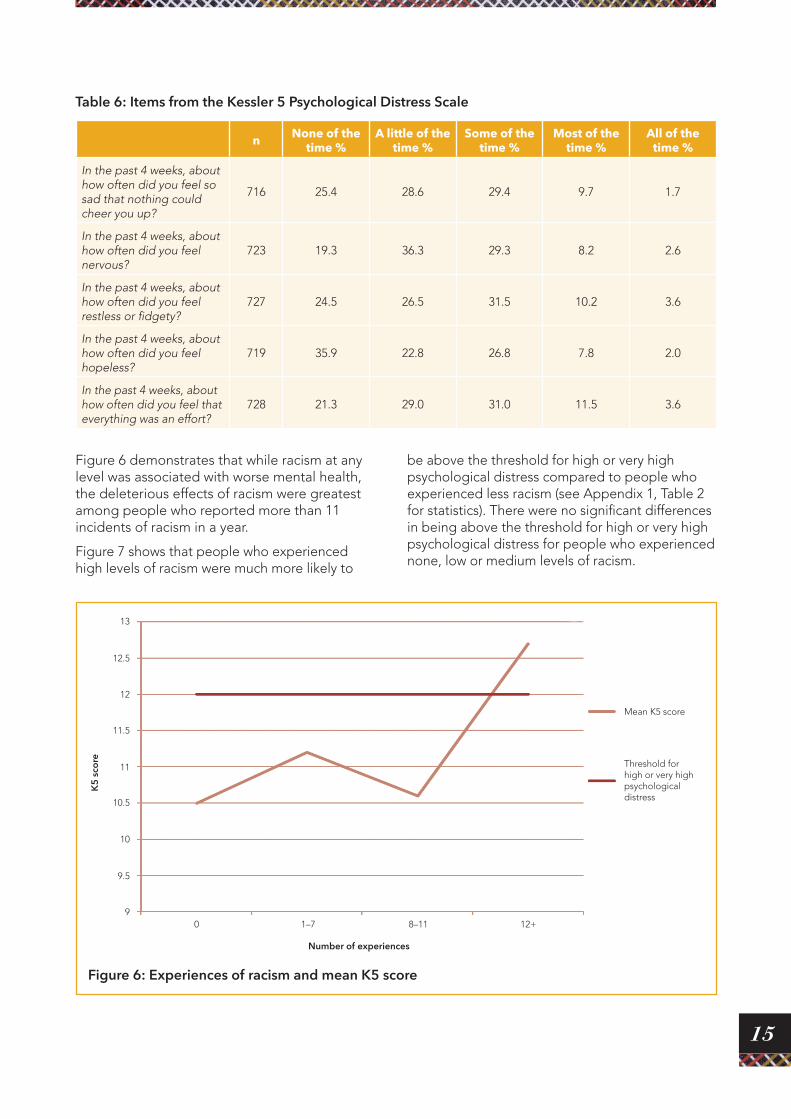
Figure 6 demonstrates that while racism at any level was associated with worse mental health, the deleterious effects of racism were greatest among people who reported more than 11 incidents of racism in a year.
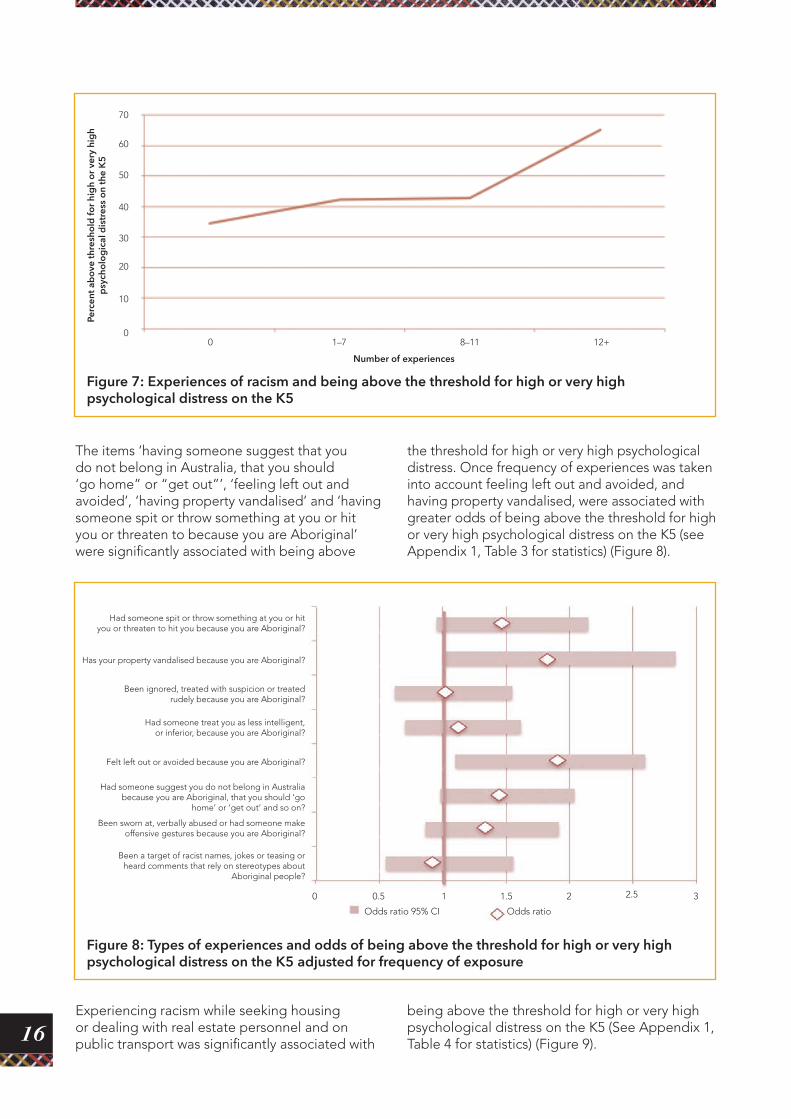
Figure 7 shows that people who experienced high levels of racism were much more likely to
be above the threshold for high or very high psychological distress compared to people who experienced less racism (see Appendix 1, Table 2 for statistics). There were no significant differences in being above the threshold for high or very high psychological distress for people who experienced none, low or medium levels of racism.
Figure 6: Experiences of racism and mean K5 score
0 1–7 8–11 12+
Mean K5 score
Threshold for high or very high psychological distress
K5
sco
re
Number of experiences
9
10
11
12
13
9.5
10.5
11.5
12.5
16
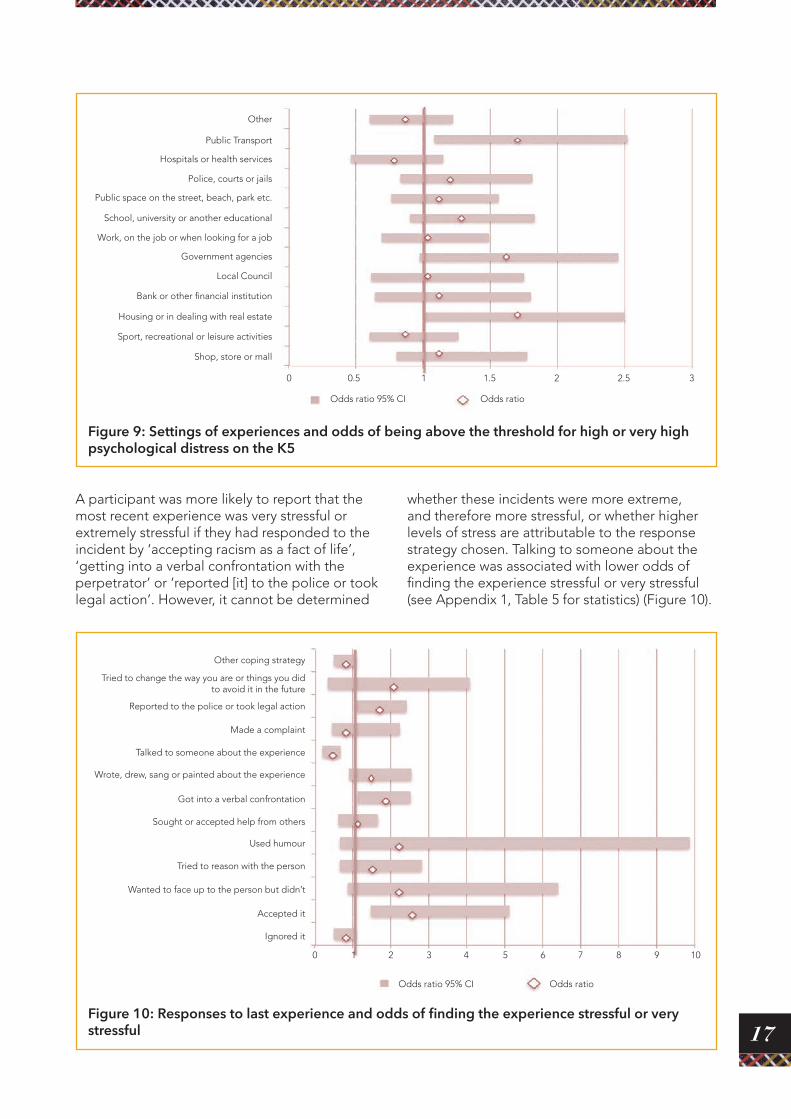
The items ‘having someone suggest that you do not belong in Australia, that you should ‘go home” or “get out”’, ‘feeling left out and avoided’, ‘having property vandalised’ and ‘having someone spit or throw something at you or hit you or threaten to because you are Aboriginal’ were significantly associated with being above
the threshold for high or very high psychological distress. Once frequency of experiences was taken into account feeling left out and avoided, and having property vandalised, were associated with greater odds of being above the threshold for high or very high psychological distress on the K5 (see Appendix 1, Table 3 for statistics) (Figure 8).
Figure 7: Experiences of racism and being above the threshold for high or very high psychological distress on the K5
0 1–7 8–11 12+
Perc
ent a
bo
ve th
resh
old
for
hig
h o
r ve
ry h
igh
psy
cho
log
ical
dis
tres
s o
n th
e K
5
Number of experiences
10
30
50
70
0
20
40
60
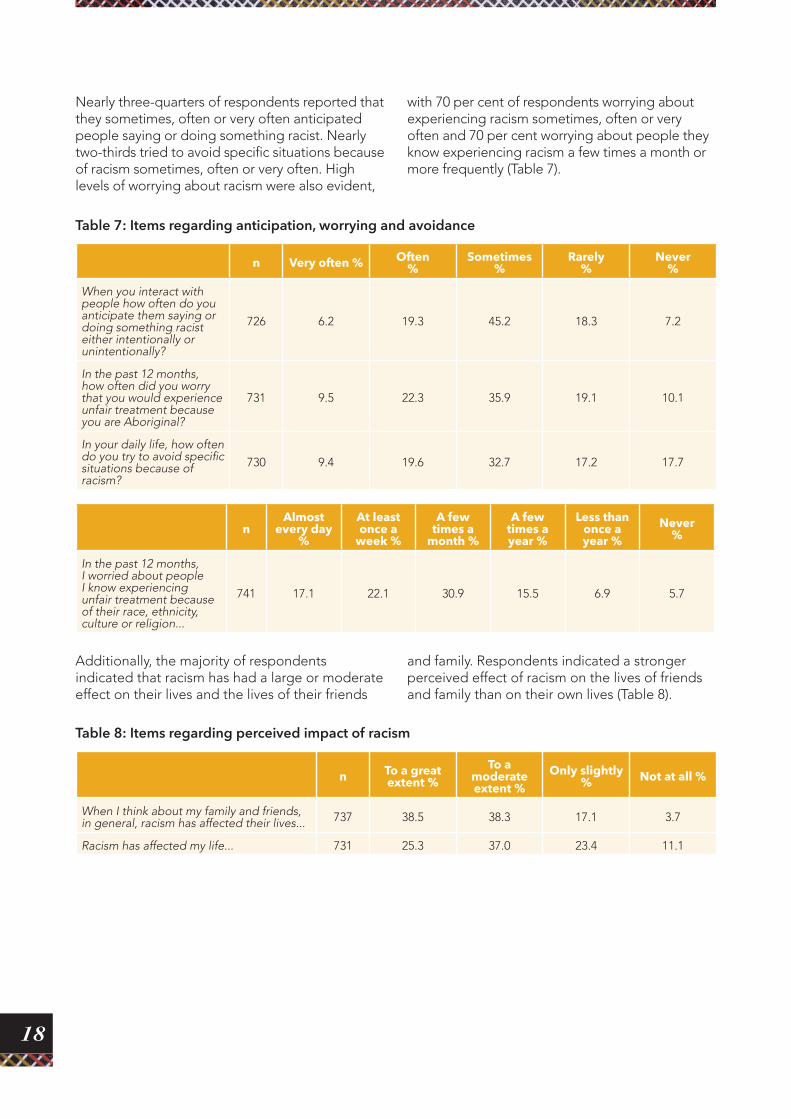
Experiencing racism while seeking housing or dealing with real estate personnel and on public transport was significantly associated with
Figure 8: Types of experiences and odds of being above the threshold for high or very high psychological distress on the K5 adjusted for frequency of exposure
0 0.5
Odds ratio 95% CI Odds ratio
1 1.5 2.52 3
Had someone spit or throw something at you or hit you or threaten to hit you because you are Aboriginal?
Been ignored, treated with suspicion or treated rudely because you are Aboriginal?
Had someone treat you as less intelligent, or inferior, because you are Aboriginal?
Been sworn at, verbally abused or had someone make offensive gestures because you are Aboriginal?
Been a target of racist names, jokes or teasing or heard comments that rely on stereotypes about
Aboriginal people?
Had someone suggest you do not belong in Australia because you are Aboriginal, that you should ‘go
home’ or ‘get out’ and so on?
Felt left out or avoided because you are Aboriginal?
Has your property vandalised because you are Aboriginal?
being above the threshold for high or very high psychological distress on the K5 (See Appendix 1, Table 4 for statistics) (Figure 9).
17
A participant was more likely to report that the most recent experience was very stressful or extremely stressful if they had responded to the incident by ‘accepting racism as a fact of life’, ‘getting into a verbal confrontation with the perpetrator’ or ‘reported [it] to the police or took legal action’. However, it cannot be determined
Figure 9: Settings of experiences and odds of being above the threshold for high or very high psychological distress on the K5
0 0.5
Odds ratio 95% CI Odds ratio
1 1.5 2.52 3
Other
Public Transport
Hospitals or health services
Police, courts or jails
Public space on the street, beach, park etc.
School, university or another educational
Work, on the job or when looking for a job
Government agencies
Local Council
Bank or other financial institution
Housing or in dealing with real estate
Sport, recreational or leisure activities
Shop, store or mall
whether these incidents were more extreme, and therefore more stressful, or whether higher levels of stress are attributable to the response strategy chosen. Talking to someone about the experience was associated with lower odds of finding the experience stressful or very stressful (see Appendix 1, Table 5 for statistics) (Figure 10).
Figure 10: Responses to last experience and odds of finding the experience stressful or very stressful
0 1 2 3 4 5 6 7 8 9 10
Odds ratio 95% CI Odds ratio
Other coping strategy
Tried to change the way you are or things you did to avoid it in the future
Reported to the police or took legal action
Made a complaint
Talked to someone about the experience
Wrote, drew, sang or painted about the experience
Got into a verbal confrontation
Sought or accepted help from others
Used humour
Tried to reason with the person
Wanted to face up to the person but didn’t
Accepted it
Ignored it
18
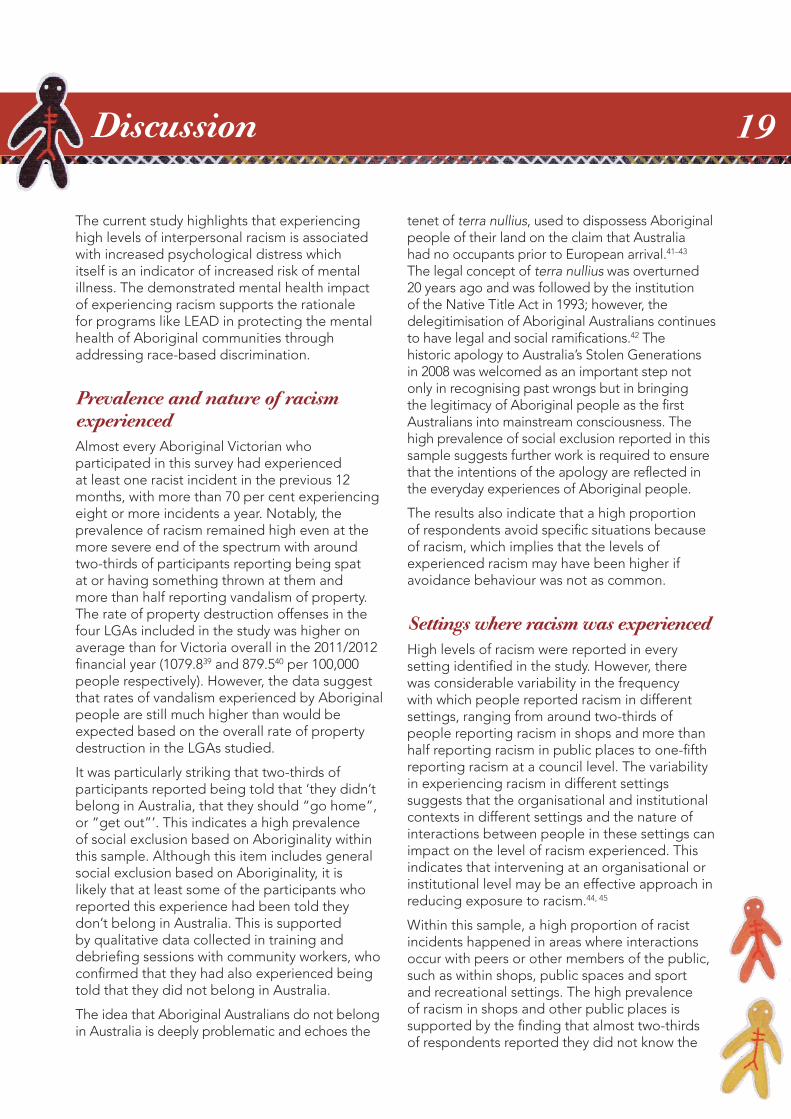
Nearly three-quarters of respondents reported that they sometimes, often or very often anticipated people saying or doing something racist. Nearly two-thirds tried to avoid specific situations because of racism sometimes, often or very often. High levels of worrying about racism were also evident,
with 70 per cent of respondents worrying about experiencing racism sometimes, often or very often and 70 per cent worrying about people they know experiencing racism a few times a month or more frequently (Table 7).
Table 7: Items regarding anticipation, worrying and avoidance
n Very often % Often %
Sometimes %
Rarely %
Never %
When you interact with people how often do you anticipate them saying or doing something racist either intentionally or unintentionally?
726 6.2 19.3 45.2 18.3 7.2
In the past 12 months, how often did you worry that you would experience unfair treatment because you are Aboriginal?
731 9.5 22.3 35.9 19.1 10.1
In your daily life, how often do you try to avoid specific situations because of racism?
730 9.4 19.6 32.7 17.2 17.7
nAlmost
every day %
At least once a
week %
A few times a
month %
A few times a year %
Less than once a year %
Never %
In the past 12 months, I worried about people I know experiencing unfair treatment because of their race, ethnicity, culture or religion...
741 17.1 22.1 30.9 15.5 6.9 5.7
Table 8: Items regarding perceived impact of racism
n To a great extent %
To a moderate extent %
Only slightly % Not at all %
When I think about my family and friends, in general, racism has affected their lives... 737 38.5 38.3 17.1 3.7
Racism has affected my life... 731 25.3 37.0 23.4 11.1
Additionally, the majority of respondents indicated that racism has had a large or moderate effect on their lives and the lives of their friends
and family. Respondents indicated a stronger perceived effect of racism on the lives of friends and family than on their own lives (Table 8).
19
The current study highlights that experiencing high levels of interpersonal racism is associated with increased psychological distress which itself is an indicator of increased risk of mental illness. The demonstrated mental health impact of experiencing racism supports the rationale for programs like LEAD in protecting the mental health of Aboriginal communities through addressing race-based discrimination.
Prevalence and nature of racism experiencedAlmost every Aboriginal Victorian who participated in this survey had experienced at least one racist incident in the previous 12 months, with more than 70 per cent experiencing eight or more incidents a year. Notably, the prevalence of racism remained high even at the more severe end of the spectrum with around two-thirds of participants reporting being spat at or having something thrown at them and more than half reporting vandalism of property. The rate of property destruction offenses in the four LGAs included in the study was higher on average than for Victoria overall in the 2011/2012 financial year (1079.839 and 879.540 per 100,000 people respectively). However, the data suggest that rates of vandalism experienced by Aboriginal people are still much higher than would be expected based on the overall rate of property destruction in the LGAs studied.
It was particularly striking that two-thirds of participants reported being told that ‘they didn’t belong in Australia, that they should “go home”, or “get out”’. This indicates a high prevalence of social exclusion based on Aboriginality within this sample. Although this item includes general social exclusion based on Aboriginality, it is likely that at least some of the participants who reported this experience had been told they don’t belong in Australia. This is supported by qualitative data collected in training and debriefing sessions with community workers, who confirmed that they had also experienced being told that they did not belong in Australia.
The idea that Aboriginal Australians do not belong in Australia is deeply problematic and echoes the
Discussion
tenet of terra nullius, used to dispossess Aboriginal people of their land on the claim that Australia had no occupants prior to European arrival.41–43 The legal concept of terra nullius was overturned 20 years ago and was followed by the institution of the Native Title Act in 1993; however, the delegitimisation of Aboriginal Australians continues to have legal and social ramifications.42 The historic apology to Australia’s Stolen Generations in 2008 was welcomed as an important step not only in recognising past wrongs but in bringing the legitimacy of Aboriginal people as the first Australians into mainstream consciousness. The high prevalence of social exclusion reported in this sample suggests further work is required to ensure that the intentions of the apology are reflected in the everyday experiences of Aboriginal people.
The results also indicate that a high proportion of respondents avoid specific situations because of racism, which implies that the levels of experienced racism may have been higher if avoidance behaviour was not as common.
Settings where racism was experiencedHigh levels of racism were reported in every setting identified in the study. However, there was considerable variability in the frequency with which people reported racism in different settings, ranging from around two-thirds of people reporting racism in shops and more than half reporting racism in public places to one-fifth reporting racism at a council level. The variability in experiencing racism in different settings suggests that the organisational and institutional contexts in different settings and the nature of interactions between people in these settings can impact on the level of racism experienced. This indicates that intervening at an organisational or institutional level may be an effective approach in reducing exposure to racism.44, 45
Within this sample, a high proportion of racist incidents happened in areas where interactions occur with peers or other members of the public, such as within shops, public spaces and sport and recreational settings. The high prevalence of racism in shops and other public places is supported by the finding that almost two-thirds of respondents reported they did not know the
20
perpetrator involved in their last experience of racism. Experiencing racist incidents in these settings may limit the ability of Aboriginal community members to take part safely in some aspects of community life, including enjoyment of parks and recreation centres, interacting with other community members through sports clubs or events or attending community celebrations or festivals. One-fifth of participants reported having racist experiences in dealings with the local council, which may also hamper participation in community life by causing them to have limited contact with local government. This has important implications for the social connectedness of Aboriginal Australians, particularly if these settings are avoided in order to limit personal exposure to racism. This highlights the need to implement strategies that reach the community as a whole, in addition to interventions within organisational contexts.
Both employment and education are within the five settings where racism was most commonly reported. This may indicate a reduction in life chances for Aboriginal Australians, which also has significant implications for mental health and wellbeing. Mental health inequality is at least partly linked to income inequality, which is associated with differential employment and education outcomes.46–48 Although the LEAD survey was restricted to people aged 18 and over, other Australian research with young people also indicates that racism in schools is prevalent. In 2009, the Foundation for Young Australians conducted a survey of 698 students from 18 Australian secondary schools across four States. This study found that 80 per cent of young people (including 63% of only 20 Aboriginal and Torres Strait Islander students in this study) had experienced racism, with 67 per cent of these incidents taking place at school.26 This is particularly concerning as racism has the potential to negatively affect young people’s psychological adjustment and thereby their wellbeing into adulthood. Experiencing racism within school may also have a negative effect on Aboriginal and Torres Strait Islander students’ educational outcomes49 as a social determinant in its own right.
It is also concerning that 40 per cent of participants indicated that they had experienced racism within the justice system and 30 per cent within health care systems. Experiences in these settings can strongly influence individual and community health and wellbeing. Experiencing racism within the justice system may lead to further unnecessary contact with this system and higher rates of incarceration if
people from Aboriginal backgrounds receive harsher sentences for similar offences or are unnecessarily arrested or detained for minor infractions. Repeated contact with both the juvenile and adult justice systems is linked to a higher risk of developing mental illness and can exacerbate existing mental illness.50,51 Community consequences of overrepresentation in the justice system include increased rates of substance abuse, violence, un- and underemployment and family breakdown.52–54 Racism within health care settings may lead to reduced access to health care services, including preventative services, and poorer treatment and care from health professionals.9,55,56
The current study further suggests that Aboriginal Australians who have higher levels of formal education may be more subject to discrimination than their peers with lower levels of education. This effect was particularly marked for the small number of Aboriginal people with university education in the sample. The finding that more educated minority people report higher exposure to racism is consistent with the research literature.57–59
There are three possible explanations for this effect. The first explanation is that more educated people may have higher expectations about how others should treat them: that is, the difference is about perception rather than actual exposure. The second explanation is that higher educated people from minority groups defy stereotypes of Aboriginal people as being uneducated.60 They are, therefore, more likely to be in situations where they challenge the status quo with more racism directed against them as a result. A related third possibility is that educated Aboriginal people are more likely to work and socialise with people from majority (Anglo) backgrounds. Under the assumption that racism is more likely to be perpetrated by those from the majority culture, this would lead to increased experiences of racism for this group.
The settings in which university-educated people were more likely to report racism than non-university educated people were overwhelmingly institutional (council, government, employment, education, public spaces and health settings). However, there were no differences in reported exposures in a range of other settings. The levels of racist incidents experienced in shops, sport, housing, finance, justice and public transport were not significantly different between people educated at university level and those educated below university level. A bias in perception

21
would be expected to operate in all settings so the variation between settings, and particularly the higher exposure in some settings among more educated Aboriginal Australians, tends to suggest that differences may be due to higher exposure to racism.57,59
Racism and mental healthStudy participants indicated anxiety and worrying due to racist experiences, with more than one-quarter often or very often anticipating people saying or doing something racist and nearly one-third worrying often or very often that they would experience unfair treatment due to being Aboriginal. This worry extended to family and friends, as nearly 70 per cent of respondents worried about people they knew experiencing unfair treatment a few times a month or more frequently. Collectively, these data indicate that racist experiences have an ongoing deleterious effect on people’s lives and wellbeing even after direct exposure has ended. The long-term impacts of racism are evident in that more than one-third of respondents indicated that racism had affected the lives of their family and friends to a great extent, while one-quarter indicated that racism had affected their own lives to a great extent.
Study results demonstrate that while experiencing any racism was associated with worse mental health, the negative effects of racism were most apparent for people who reported experiencing high levels of racism in the previous 12 months. High levels of psychological distress were not exclusively related to racism, since approximately one-third of people who reported no experiences were above the threshold for high or very high psychological distress. However, the proportion of people within the highest exposure category who were above the threshold for high or very high psychological distress was greater in comparison to other exposure categories. The odds of Aboriginal Australians who experienced high levels of racist incidents (12+) being above the threshold for high or very high psychological distress on the K5 were 342 per cent (Appendix 1, Table 2) greater than for Aboriginal Australians who experienced no exposure to racism in the past 12 months.
In addition to the volume of experiences, the type of racist incident also had an impact on mental health. Specifically, having someone suggest that you do not belong, feeling left out and avoided, having property vandalised, having someone spit or throw something at you, or hit you or threaten to hit you because you are Aboriginal were
significantly associated with experiencing high or very high levels of psychological distress. The association between feeling left out and avoided and having someone suggest that you do not belong and poorer mental health highlights the effect of social exclusion on health outcomes. It is also possible that the history and ongoing effects of terra nullius contribute to the association between participants being told they do not belong in Australia and high or very high levels of psychological distress.
Two types of experiences – feeling left out and avoided and having property vandalised – were associated with greater odds of being above the threshold for high or very high psychological distress on the K5 after the effects of exposure frequency were removed. Although it is unsurprising that more extreme forms of racism, such as property destruction, may be associated with high psychological distress, it does indicate that subtle types of racism like social exclusion can also have a deleterious effect on health. Overall, the study suggests that the volume of racism being experienced by an individual, as well as the specific type of racism, can contribute to worse mental health.
Experiencing racism in some specific settings was also shown to be more strongly associated with being above the threshold for high or very high psychological distress. Experiencing racism while seeking housing or interacting with real estate personnel, as well as experiencing racism on public transport, were both significantly associated with being above the threshold for high or very high psychological distress on the K5. Both of these settings would be expected to affect people’s access to resources, goods and services that might affect their health. A stronger negative effect in relation to experiencing racism in real estate settings may be due to a decrease in housing quality and resultant effects on mental health. Low-quality housing has been found to be a social determinant of Aboriginal ill-health.2,61 Access to transport is a key determinant of people’s ability to access services and negative experiences on public transport may decrease Aboriginal Australians’ willingness or ability to use this public resource.
Responses to racismSelecting a specific strategy or set of strategies in response to experiencing discrimination is influenced by a range of factors, including the perceived social costs and benefits of confrontation, culture and gender
22
and expectations of the effectiveness of confrontation.62–64 Different strategies are used to respond to a perpetrator during an event (e.g. ignoring it, getting into a verbal confrontation) than used to address the consequences of discrimination (e.g. making a complaint, reporting to the police or taking legal action) or mediate subsequent stress resulting from the incident (e.g. talking to someone about the event; accepting it as a fact of life; writing, drawing or painting about the experience).65, 66 In the current study, respondents were more likely to report finding the most recent experience very stressful or extremely stressful if they had responded to the incident by ‘accepting racism as a fact of life’, ‘getting into a verbal confrontation with the perpetrator’ or ‘reported to the police or took legal action’. It may be that the types of incidents that prompted these responses were more extreme and more stressful events, or higher levels of stress may be due to the response strategy chosen.
Talking to someone about the experience was the only response associated with lower odds of finding the experience very stressful or extremely stressful. Given that a single response out of the 12 possible strategies was associated with lower odds of finding the most recent incident very stressful or extremely stressful, it appears that there is little Aboriginal Australians can do as individuals to reduce the deleterious effect of racism on their health. Other research supports the use of social support in response to racism for Aboriginal people but also notes that all responses entail a range of costs and benefits.67 This suggests that interventions designed to prevent the occurrence of racism have more potential to improve mental health in Aboriginal communities than interventions that work with individuals in response to experiencing racism. Because talking to others about racist experiences was associated with reduced stress, such interventions may include providing an environment within which such conversations can occur.
LimitationsAlthough the study focused on participants’ perceptions of experiencing racism and did not attempt to discern perpetrators’ motives, many of the behaviours reported are quite unambiguous, including being spat at or experiencing physical or verbal abuse. The data also captured experiences that may have affected multiple people – for example, if a group of friends are verbally harassed or family property is vandalised. A single incident may therefore be reported
multiple times because each individual has experienced racism as a result. It is also important to note that the international literature clearly indicates that racism tends to be under-reported rather than over-reported 68–73 and that people may act in ways that are discriminatory or racist without malice or awareness.74–77 Regardless of the intent of the perpetrators, the results of the study clearly demonstrate that the perception of experiencing racism had a negative health impact.
There are many factors that impact on mental health and wellbeing that have not been explored in this study. However, the study results demonstrate that exposure to racism contributes to an increased risk of mental distress and illness without denying that there are a range of other contributors to psychological distress.
Although the sample demographic profile across the four LGAs closely matches the combined census profiles, the purpose of this study was to explore the associations between experiences of racism and mental health outcomes, rather than examining the prevalence of racism within or between the four localities. Recruitment methods were not necessarily intended to develop a representative sample. The validity of the relationship observed between experiences of racism and mental health status in this study is not affected by this non-representative sample. The proportions of the Aboriginal community sampled in each LGA differed significantly, which also limits the validity of comparisons between LGAs. This is due to a range of factors, including differences in how connected the community was to their local service providers and the personal and professional networks of the community workers. There were also small variations in survey wording in each LGA, as well as some questions removed from specific surveys, which may have affected how participants reported their experiences.
While the overall prevalence of racism reported by Aboriginal people varies significantly depending on the survey used, the frequency of racist incidents reported in this study tends to be higher than frequencies reported elsewhere. In Our Own Backyard, a survey of Aboriginal and Torres Strait Islander people who live in urban areas in South Australia, found that 39 per cent of people surveyed experienced racism in sporting or recreational settings,78 compared to 48 per cent in LEAD. Similarly, 54 per cent of the In Our Own Backyard sample reported experiencing racism in general public settings, compared to 58 per
23
cent of those in the LEAD survey.78 In the Darwin Region Urban Indigenous Diabetes (DRUID) study, 40 per cent of participants reported being treated unfairly because of being Aboriginal in employment settings, compared to 42 per cent in LEAD.79 In the DRUID study, 27 per cent also reported experiencing racial discrimination in sporting, recreational or leisure settings and 22 per cent in health care settings.79 In the LEAD survey, 48 per cent of people reported experiencing racial discrimination in sports settings and 29 per cent in health care settings. The differences in reported rates of experiencing racism may be due to a range of factors. Firstly, they may simply reflect the differential rates of racism experienced by Aboriginal Australians in different areas of the country. Each survey also had very different sampling methods, as well as slightly different ways of eliciting information about racist experiences, each of which may have contributed to finding different levels of racism.
The proportion of people above the threshold for high or very high psychological distress in this sample is higher than has been reported elsewhere,20,34–39 which may be attributable to the sampling and surveying method used in this research. Even though the questions to assess mental health and psychological distress are the same as used in other studies, having community workers administer the survey may have encouraged participants to be more open about the negative feelings they experienced over the previous four weeks.
The data is cross-sectional so there is the potential for reverse causation; that is, people above the threshold for high or very high psychological distress may be more exposed to racism. There is, however, a wide body of evidence suggesting an association between racism and ill-health in longitudinal studies.57,80,81 By contrast, there is very little research suggesting reverse causation. However, it is worth noting that in either case the study has uncovered a significant social problem.
ImplicationsRacism is associated with poorer mental health and reduced life chances for Aboriginal Australians. Reducing Aboriginal Australians’ experiences of racism is therefore an important approach to improving health in this population.
Exposure to racism was very common with 97 per cent of all participants reporting at least one racist incident in the preceding 12 months and high levels of racism reported in all settings
studied. Aboriginal Australians who experienced high levels of racist incidents were 342 per cent (Appendix 1,Table 2) more likely to be above the threshold for high or very high psychological distress on the K5 than Aboriginal Australians who experienced no exposure to racism in the previous 12 months. Even subtle forms of racism, such as social exclusion, were found to increase the odds of participants being over the threshold for high or very high psychological distress.
Both organisational and community interventions are needed to reduce racism.
Only one of the 12 responses to racism examined (talking about it) was associated with lower odds of finding the most recent incident very stressful or extremely stressful. This suggests that preventing the occurrence of racism will be more effective in improving the mental health of Aboriginal Australians than interventions that work with individuals in response to experiencing racism. As a high proportion of reported experiences occurred in public and community spaces, strategies to promote social cohesion and support social norms that curtail the expression of racism may be effective in reducing Aboriginal Australians’ experiences of racism. Additionally, the variability of participants’ experiences of racism in different settings suggests that organisational and institutional cultures can affect the occurrence of racism. This in turn suggests that organisational and institutional environments are also appropriate places for intervention. Further strategies for preventing race-based discrimination are outlined in the VicHealth reports Building on our strengths: A framework to reduce race-based discrimination and support diversity in Victoria; Preventing race-based discrimination and supporting cultural diversity in the workplace: An evidence review; and Review of bystander approaches in support of preventing race-based discrimination.2, 45, 83
Effective anti-racism measures need to be implemented in order to reduce racism.
Exposure to interpersonal racism was very common in almost all settings in the study. The settings included a number where there is existing legislation to prohibit discrimination and legal recourse is available for people who have experienced discrimination (e.g. employment and education).82 More work may be needed to support employers and educators to comply with anti-discrimination legislation.
24
The notion that all citizens have the same rights is a key value that underpins every aspect of Australian society. Racism denies Aboriginal Australians access to rights such as the ability to participate equally and freely in community and public life, equitable service provision and freedom from violence. The results of this study highlight the pathways between exposure to racism and poorer mental health outcomes and poorer life chances.
A strong understanding of the patterns of experiencing racism and ways in which racism influences health is crucial for the development and implementation of relevant intervention strategies and allows us to target our efforts
to improve the health of affected populations more effectively. In particular, the various ways that racism can lead to poorer health outcomes indicate the need for multi-level, multi-setting and multi-strategy interventions. For example, employment and education are two of the settings where legislation exists to prohibit discrimination and legal recourse is available for people who have experienced discrimination. More work may be needed to support employers and educators to comply with existing anti-discrimination legislation. Alternatively, strategies that promote social cohesion within a community may support social norms that curtail the expression of racism in public spaces and minimise the exclusion of Aboriginal communities from public life.
Conclusions
Strategies for change• Increase efforts to support employers, staff and educators to comply with anti-discrimination
legislation.
• Devise strategies that promote respect and social cohesion within communities.
• Organisational and community interventions are likely to be effective approaches to reducing racism.
• Further strategies for preventing race-based discrimination are outlined in the reports:
• Preventing race-based discrimination and supporting cultural diversity in the workplace – An evidence review: Full report 45
• Review of bystander approaches in support of preventing race-based discrimination83
• Building on our strengths: A framework to reduce race-based discrimination and support diversity in Victoria2
25
1. Victorian Health Promotion Foundation. More than tolerance: Embracing diversity for health: Discrimination affecting migrant and refugee communities in Victoria, its health consequences, community attitudes and solutions – A summary report, Melbourne: VicHealth, 2007.
2. Paradies Y, Chandrakumar L, Klocker N, Frere M, Webster K, Burrell M, et al., Building on our strengths: A framework to reduce race-based discrimination and support diversity in Victoria, Melbourne: VicHealth, 2009.
3. Paradies Y, Defining, conceptualising and characterising racism in health research, Critical Public Health, 2006, 16(2):143–57.
4. Paradies Y, Williams D, Heggenhougen K, Quah S, Racism and health (in press), Encyclopedia of Public Health, San Diego: Academic Press, 2008, p. 474–83.
5. Dudgeon P, Wright M, Paradies Y, Garvey D, Walker I, The social, cultural and historical context of Aboriginal and Torres Strait Islander Australians, in Purdie N, Dudgeon P, Walker R (eds), Working together: Aboriginal and Torres Strait Islander mental health and wellbeing principles and practice, Australian Government Publishing Services, 2010.
6. Korff J, Creative spirits: Aboriginal timeline, 2012. Accessed at: http://www.creativespirits.info/aboriginalculture/history/aboriginal-history-timeline-early-20th.html on 5 July 2012.
7. Human Rights and Equal Opportunity Commission, Bringing them home: National inquiry into the separation of Aboriginal and Torres Strait Islander children from their families, Canberra, 1997.
8. Dunn K, Challenging racism: The anti-racism research project: National findings, a project based at the University of Western Sydney, 2010. Accessed at: http://www.uws.edu.au/ssap/school_of_social_sciences_and_psychology/research/challenging_racism on 5 July 2012.
9. Durey A, Thompson SC, Wood M, Time to bring down the twin towers in poor Aboriginal hospital care: Addressing institutional racism and misunderstandings in communication, Internal Medicine Journal, 2012, 42(1):17–22.
10. Raman S, Hodes D, Cultural issues in child maltreatment, J Paediatr Child Health, 2012, 48(1):30–7.
11. Paradies Y, A systematic review of empirical research on self-reported racism and health, International Journal of Epidemiology, 2006, 35(4):888–901.
12. Williams DR, Williams-Morris R, Racism and mental health: The African American experience, EthnHealth, 2000, 5(3–4):243–68.
13. Soto JA, Dawson-Andoh NA, BeLue R, The relationship between perceived discrimination and generalized anxiety disorder among African Americans, Afro Caribbeans, and non-Hispanic whites, Journal of Anxiety Disorders, 2011, 25:258–65.
14. Pascoe E, Richman L, Perceived discrimination and health: A meta-analytic review, Psychol Bull, 2009, 135(4):531–54.
15. Williams D, Mohammed S, Discrimination and racial disparities in health: Evidence and needed research, J Behav Med, 2009, 32(1):20–47.
16. Brondolo E, Brady VerHalen NB, Pencille M, Beatty D, Contrada RJ, Coping with racism: A selective review of the literature and a theoretical and methodological critique, J Behav Med, 2009, 32(1):64–84.
17. Australian Bureau of Statistics, The health and welfare of Australia’s Aboriginal and Torres Strait Islander peoples, Canberra: ABS, 2010.
18. Larson A, Gillies M, It’s enough to make you sick: The impact of racism on the health of Aboriginal Australians, Australian and New Zealand Journal of Public Health, 2007, 31(4):322–9.
References
26
19. Paradies Y, Cunningham J, The DRUID study: Exploring mediating pathways between racism and depressive symptoms among Indigenous Australians, Ethnic and Racial Studies, 2009, 32(3):548–73.
20. Priest N, Paradies Y, Gunthorpe W, Cairney SJ, Sayers SM, Racism as a determinant of social and emotional wellbeing for Aboriginal Australian youth, Medical Journal of Australia, 2011, 194(10):546–50.
21. Priest N, Paradies Y, Stewart P, Luke J, Racism and health among urban Aboriginal young people, BMC Public Health, 2011, 11.
22. Ziersch A, Gallaher G, Baum F, Bentley M, Racism, social resources and mental health for Aboriginal people living in Adelaide, Australian and New Zealand Journal of Public Health, 2011, 35(3):231–37.
23. Priest N, Paradies Y, Exploring relationships between racism, housing and child illness in remote Aboriginal communities, Journal of Epidemiology and Community Health, in press.
24. Paradies Y, Cunningham J, The DRUID study: Racism and self-assessed health status in an Indigenous population, BMC Public Health, February 2012, 12(131).
25. Paradies Y, Harris R, Anderson I, The impact of racism on Indigenous health in Australia and Aotearoa: Towards a research agenda, Darwin: Cooperative Research Centre for Aboriginal Health, March 2008.
26. Mansouri F, Jenkins L, Morgan L, Taouk M, The impact of racism upon the health and wellbeing of young Australians, Melbourne: Foundation for Young Australians, 2009.
27. Kessler R, Barker P, Colpe L, Epstein J, Gfroerer J, Hiripi E, et al., Screening for serious mental illness in the general population, Arch Gen Psychiatry, 2003, 60(2):184–9.
28. Australian Bureau of Statistics, Inclusion of the K5 in ABS surveys. Accessed at: http://www.abs.gov.au/ausstats/[email protected]/Lookup/84330C2EDC3DB940CA2579D50015D74E?opendocument on 28 June 2012.
29. Trewin D, National Aboriginal and Torres Strait Islander Health Survey 2004–2005, Canberra: Australian Bureau of Statistics, 2006.
30. Australian Institute of Health and Welfare, Measuring the social and emotional wellbeing of Aboriginal and Torres Strait Islander peoples, Canberra: AIHW, 2009.
31. Australian Bureau of Statistics, Use of the Kessler Psychological Distress Scale in ABS health surveys. Accessed at: http://www.abs.gov.au/ausstats/[email protected]/Lookup/4817.0.55.001Chapter92007-08 on 28 June 2012.
32. Australian Bureau of Statistics, 2011 Census community profiles. Accessed at: http://www.abs.gov.au/websitedbs/censushome.nsf/home/communityprofiles?opendocument&navpos=230 on 28 June 2012.
33. Centre for Epidemiology and Research, Report on adult health by country of birth from the New South Wales Population Health Survey, Sydney: NSW Department of Health. Accessed at: http://www.health.nsw.gov.au/PublicHealth/surveys/hsa/0205cob/index.asp, 2006.
34. Centre for Epidemiology and Research, 2002–2005 report on adult Aboriginal health from the New South Wales Population Health Survey, Sydney: NSW Department of Health, 2006.
35. Centre for Epidemiology and Research, Report on adult health in New South Wales 2005, Sydney: NSW Department of Health. Accesed at: http://www.health.nsw.gov.au/PublicHealth/surveys/hsa/05/index.asp, 2007.
36. Butterworth P, Crosier T, The validity of the SF-36 in an Australian National Household Survey: Demonstrating the applicability of the Household Income and Labour Dynamics in Australia (HILDA) Survey to examination of health inequalities, BMC Public Health, 2004, 4.
37. Australian Bureau of Statistics, National Aboriginal and Torres Strait Islander Health Survey 2004–2005, Canberra: ABS, 2006.
27
38. Morgan A, Jorm A, Awareness of beyondblue: The national depression initiative in Australian young people, Australasian Psychiatry, 2007, 15(4):329–33.
39. Victoria Police, Crime statistics by LGA 2010/2011 to 2011/2012, Melbourne. Accessed at: http://www.police.vic.gov.au/content.asp?a=internetBridgingPage&Media_ID=72178 on 5 September 2012.
40. Victoria Police, Crime statistics: 2011/2012, Melbourne. Accessed at: http://www.police.vic.gov.au/content.asp?a=internetBridgingPage&Media_ID=72176 on 4 September 2012.
41. Borch M, Rethinking the origins of terra-nullius (Australia), Aust Hist Stud, 2001, 32(117):222–39.
42. Chamarette C, Terra nullius then and now: Mabo, native title, and reconciliation in 2000, Aust Psychol, 2000, 35(2):167–72.
43. Merle I, Australia facing its colonial past, Ann-Hist Sci Sociales, 1998, 53(2):209– +.
44. Trenerry B, Paradies Y, Organizational assessment: An overlooked approach to managing diversity and addressing racism in the workplace, (English), Journal of Diversity Management, 2012, 7(1):11–26.
45. Trenerry B, Franklin H, Paradies Y, Preventing race-based discrimination and supporting cultural diversity in the workplace – An evidence review: full report, Melbourne: Victorian Health Promotion Foundation, 2012.
46. Huurre T, Aro H, Rahkonen O, Komulainen E, Health, lifestyle, family and school factors in adolescence: Predicting adult educational level, Educational Research, 2006, 48(1):41–53.
47. Judge TA, Watanabe S, Another look at the job satisfaction-life satisfaction relationship, Journal of Applied Psychology, 1993, 78(6):939–48.
48. Mangalore R, Knapp M, Income-related inequalities in common mental disorders among ethnic minorities in England, Social Psychiatry and Psychiatric Epidemiology, 2012, 47(3):351–9.
49. Bodkin-Andrews G, O’Rourke V, Grant R, Denson N, Craven RG, Validating racism and cultural respect: Understanding the educational impact of perceived discrimination and multiculturation for Indigenous and non-Indigenous students, Educational Research and Evaluation, 2011, 16(6):471–93.
50. Teplin LA, Abram KM, McClelland GM, Dulcan MK, Mericle AA, Psychiatric disorders in youth in juvenile detention, Archives of General Psychiatry, 2002, 59(12):1133–43.
51. Dettbarn E, Effects of long-term incarceration: A statistical comparison of two expert assessments of two experts at the beginning and the end of incarceration, Int J Law Psychiatr, 2012, 35(3):236–9.
52. German D, Latkin CA, Social stability and health: Exploring multidimensional social disadvantage, J Urban Health, 2012, 89(1):19–35.
53. Murray J, Farrington DP, Sekol I, Children’s antisocial behavior, mental health, drug use, and educational performance after parental incarceration: A systematic review and meta-analysis, Psychol Bull, 2012, 138(2):175–210.
54. Drakulich KM, Crutchfield RD, Matsueda RL, Rose K, Instability, informal control, and criminogenic situations: Community effects of returning prisoners, Crime Law Soc Change, 2012, 57(5):493–519.
55. Harris R, Cormack D, Tobias M, Yeh LC, Talamaivao N, Minster J, et al., Self-reported experience of racial discrimination and health care use in New Zealand: Results from the 2006/07 New Zealand Health Survey, American Journal of Public Health, 2012, 102(5):1012–9.
56. Johnstone M-J, Olga K, Cultural racism, language prejudice and discrimination in hospital contexts: An Australian study, Diversity in Health & Social Care, 2008, 5(1):19–30.
57. Kelaher M, Paul S, Lambert H, Ahmad W, Paradies Y, Davey Smith G, Discrimination and health in an English study, Soc Sci Med, 2008, 66(7):1627–36.
58. Ren XS, Amick BC, Williams DR, Racial/ethnic disparities in health: The interplay between discrimination and socioeconomic status, Ethnicity and Disease, 1999, 9(2):151–65.
28
59. Vines AI, Baird DD, McNeilly M, Hertz-Picciotto I, Light KC, Stevens J, Social correlates of the chronic stress of perceived racism among black women, Ethnicity and Disease, 2006, 16(1):101–7.
60. Balvin N, Kashima Y, Hidden obstacles to reconciliation in Australia: The persistence of stereotypes, in Bretherton D, Balvin N, editors, Peace Psychology in Australia: Springer US, 2012, p. 197–219.
61. Bailie R, Stevens M, McDonald E, Brewster D, Guthridge S, Exploring cross-sectional associations between common childhood illness, housing and social conditions in remote Australian Aboriginal communities, BMC Public Health, 2010, 10.
62. Czopp AM, Monteith MJ, Confronting prejudice (literally): Reactions to confrontations of racial and gender bias, Personality and Social Psychology Bulletin, 2003, 29(4):532–44.
63. Lee EA, Soto JA, Swim JK, Bernstein MJ, Bitter reproach or sweet revenge: Cultural differences in response to racism, Personality and Social Psychology Bulletin, 2012, 38(7):920–32.
64. Good JJ, Moss-Racusin CA, Sanchez DT, When do we confront? Perceptions of costs and benefits predict confronting discrimination on behalf of the self and others, Psychol Women Q, 2012, 36(2):210–26.
65. Krieger N, Sidney S, Racial discrimination and blood pressure: The CARDIA study of young black and white adults, American Journal of Public Health, 1996, 86(10):1370–8.
66. Brondolo E, ver Halen NB, Pencille M, Beatty D, Contrada RJ, Coping with racism: A selective review of the literature and a theoretical and methodological critique, J Behav Med, 2009, 32(1):64–88.
67. Ziersch AM, Gallaher G, Baum F, Bentley M, Responding to racism: Insights on how racism can damage health from an urban study of Australian Aboriginal people, Social Science & Medicine, 2011, 73(7):1045–53.
68. Goodwin SA, Williams KD, Carter-Sowell AR, The psychological sting of stigma: The costs of attributing ostracism to racism, Journal of Experimental Social Psychology, 2010, 46(4):612–8.
69. Kaiser CR, Major B, A social psychological perspective on perceiving and reporting discrimination, Law and Social Inquiry – Journal of the American Bar Foundation, 2006, 31(4):801–30.
70. Kaiser CR, Miller CT, Stop complaining! The social costs of making attributions to discrimination, Personality and Social Psychology Bulletin, 2001, 27(2):254–63.
71. Krieger N, Carney D, Lancaster K, Waterman PD, Kosheleva A, Banaji M, Combining explicit and implicit measures of racial discrimination in health research, American Journal of Public Health, 2010, 100(8):1485–92.
72. Major B, Quinton WJ, McCoy SK, Antecedents and consequences of attributions to discrimination: Theoretical and empirical advances, Advances in Experimental Social Psychology, 2002, 34:251–330.
73. Sechrist GB, Swim JK, Stangor C, When do the stigmatized make attributions to discrimination occurring to the self and others? The roles of self-presentation and need for control, Journal of Personality and Social Psychology, 2004, 87(1):111–22.
74. Sue DW, Capodilupo CM, Torino GC, Bucceri JM, Holder AMB, Nadal KL, et al., Racial microaggressions in everyday life – Implications for clinical practice, Am Psychol, 2007, 62(4):271–86.
75. Nelson RL, Berrey EC, Nielsen LB, Divergent paths: Conflicting conceptions of employment discrimination in law and the social sciences, Annual Review of Law and Social Science, Palo Alto: Annual Reviews, 2008, pp. 103–22.
76. Gaertner SL, Dovidio JF, Nier J, Hodson G, Houlette MA, Aversive racism: Bias without intention, New York: Springer, 2008.
77. Dipboye RL, Colella A, The dilemmas of workplace discrimination, in Dipboye RL, Colella A (eds), Discrimination at work: The psychological and organizational bases, Mahway, NJ: Lawrence Erlbaum Associates, 2005, pp. 407–42.
29
78. Gallaher G, Ziersch A, Baum F, Bentley M, Palmer C, Edmondson W, et al., In our own backyard: Urban health inequities an Aboriginal experiences of neighbourhood life, social capital and racism, Adelaide: Flinders University, 2009.
79. Paradies Y, Cunningham J, Experiences of racism among urban Indigenous Australians: Findings from the DRUID study, Ethnic & Racial Studies, 2009, 32(3):548–73.
80. Paradies Y, A systematic review of empirical research on self-reported racism and health, Int J Epidemiol, 2006, 35(4):888–901.
81. Gee G, Walsemann K, Does health predict the reporting of racial discrimination or do reports of discrimination predict health? Findings from the National Longitudinal Study of Youth, Social Science & Medicine, 2009, 68(9):1676–84.
82. Equal Opportunity Act, No. 16, 2010. Accessible at: http://www.justice.vic.gov.au/home/your+rights/equal+opportunity/.
83. Nelson J, Dunn K, Paradies Y, Pedersen A, Sharpe S, Hynes M, Guerin B, Review of bystander approaches in support of preventing race-based discrimination, Melbourne: Victorian Health Promotion Foundation, 2010.
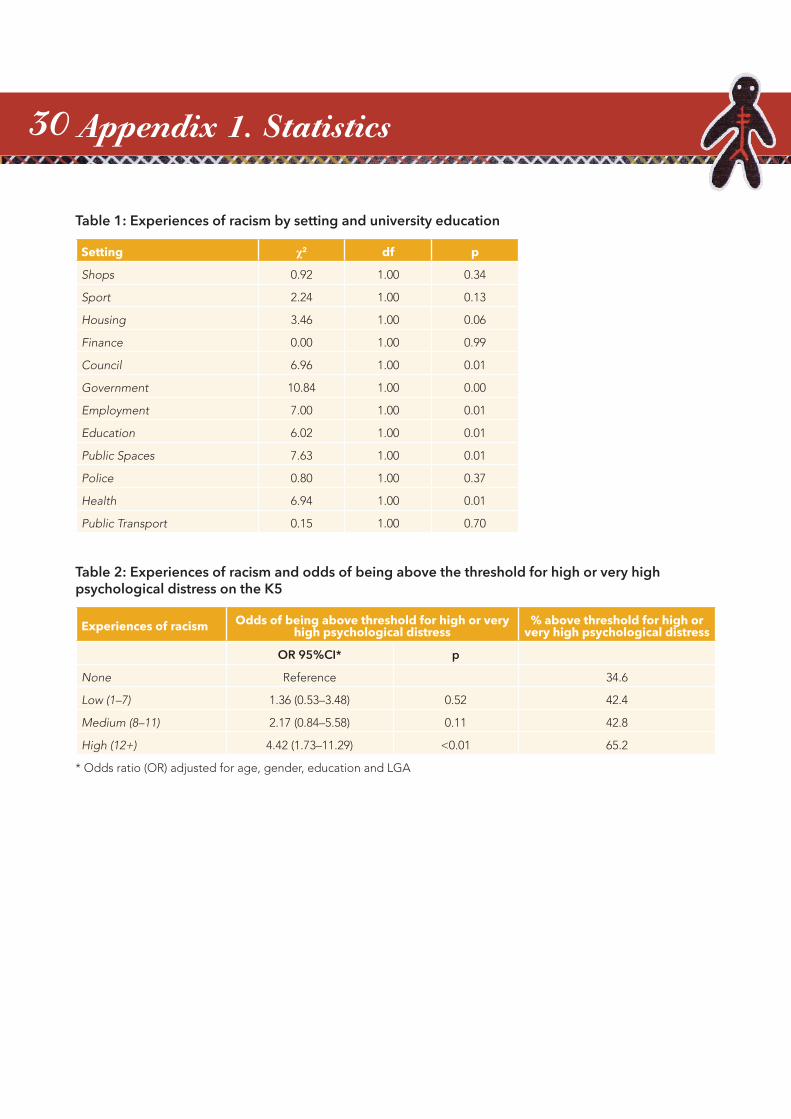
30 Appendix 1. Statistics
Table 1: Experiences of racism by setting and university education
Setting χ2 df p
Shops 0.92 1.00 0.34
Sport 2.24 1.00 0.13
Housing 3.46 1.00 0.06
Finance 0.00 1.00 0.99
Council 6.96 1.00 0.01
Government 10.84 1.00 0.00
Employment 7.00 1.00 0.01
Education 6.02 1.00 0.01
Public Spaces 7.63 1.00 0.01
Police 0.80 1.00 0.37
Health 6.94 1.00 0.01
Public Transport 0.15 1.00 0.70
Table 2: Experiences of racism and odds of being above the threshold for high or very high psychological distress on the K5
Experiences of racism Odds of being above threshold for high or very high psychological distress
% above threshold for high or very high psychological distress
OR 95%CI* p
None Reference 34.6
Low (1–7) 1.36 (0.53–3.48) 0.52 42.4
Medium (8–11) 2.17 (0.84–5.58) 0.11 42.8
High (12+) 4.42 (1.73–11.29) <0.01 65.2
* Odds ratio (OR) adjusted for age, gender, education and LGA
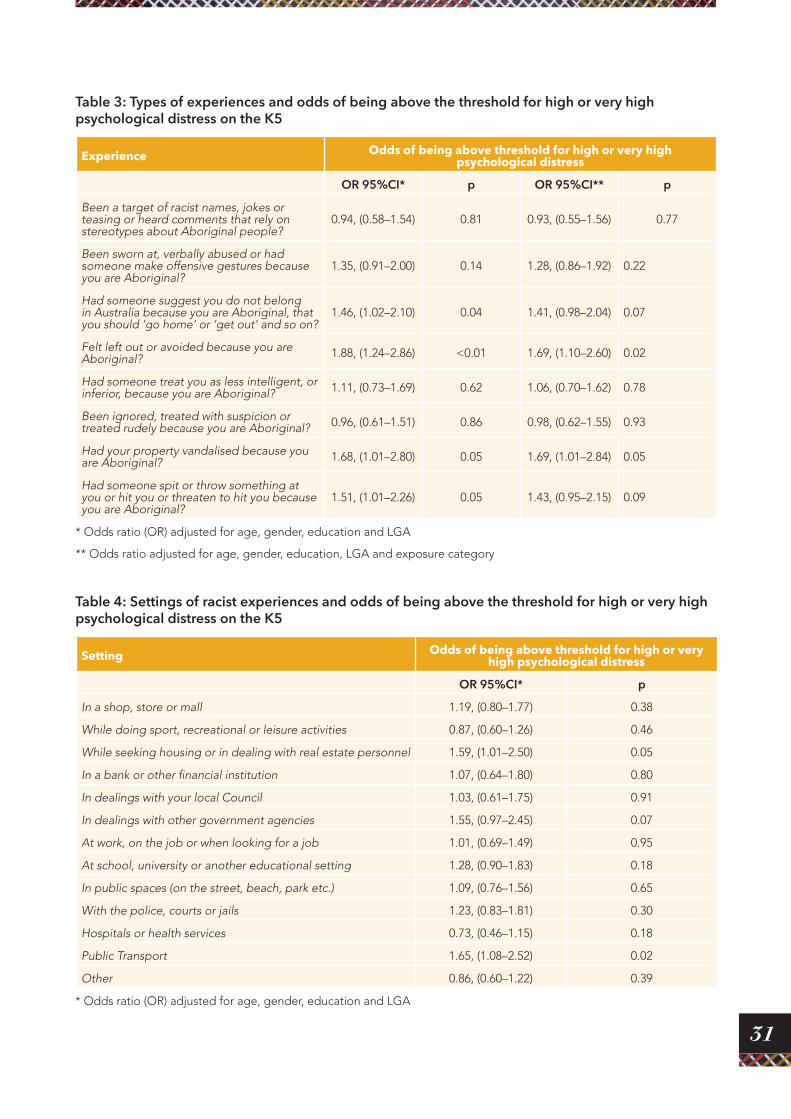
31
Table 3: Types of experiences and odds of being above the threshold for high or very high psychological distress on the K5
Experience Odds of being above threshold for high or very high psychological distress
OR 95%CI* p OR 95%CI** p
Been a target of racist names, jokes or teasing or heard comments that rely on stereotypes about Aboriginal people?
0.94, (0.58–1.54) 0.81 0.93, (0.55–1.56) 0.77
Been sworn at, verbally abused or had someone make offensive gestures because you are Aboriginal?
1.35, (0.91–2.00) 0.14 1.28, (0.86–1.92) 0.22
Had someone suggest you do not belong in Australia because you are Aboriginal, that you should ‘go home’ or ‘get out’ and so on?
1.46, (1.02–2.10) 0.04 1.41, (0.98–2.04) 0.07
Felt left out or avoided because you are Aboriginal? 1.88, (1.24–2.86) <0.01 1.69, (1.10–2.60) 0.02
Had someone treat you as less intelligent, or inferior, because you are Aboriginal? 1.11, (0.73–1.69) 0.62 1.06, (0.70–1.62) 0.78
Been ignored, treated with suspicion or treated rudely because you are Aboriginal? 0.96, (0.61–1.51) 0.86 0.98, (0.62–1.55) 0.93
Had your property vandalised because you are Aboriginal? 1.68, (1.01–2.80) 0.05 1.69, (1.01–2.84) 0.05
Had someone spit or throw something at you or hit you or threaten to hit you because you are Aboriginal?
1.51, (1.01–2.26) 0.05 1.43, (0.95–2.15) 0.09
* Odds ratio (OR) adjusted for age, gender, education and LGA
** Odds ratio adjusted for age, gender, education, LGA and exposure category
Table 4: Settings of racist experiences and odds of being above the threshold for high or very high psychological distress on the K5
Setting Odds of being above threshold for high or very high psychological distress
OR 95%CI* p
In a shop, store or mall 1.19, (0.80–1.77) 0.38
While doing sport, recreational or leisure activities 0.87, (0.60–1.26) 0.46
While seeking housing or in dealing with real estate personnel 1.59, (1.01–2.50) 0.05
In a bank or other financial institution 1.07, (0.64–1.80) 0.80
In dealings with your local Council 1.03, (0.61–1.75) 0.91
In dealings with other government agencies 1.55, (0.97–2.45) 0.07
At work, on the job or when looking for a job 1.01, (0.69–1.49) 0.95
At school, university or another educational setting 1.28, (0.90–1.83) 0.18
In public spaces (on the street, beach, park etc.) 1.09, (0.76–1.56) 0.65
With the police, courts or jails 1.23, (0.83–1.81) 0.30
Hospitals or health services 0.73, (0.46–1.15) 0.18
Public Transport 1.65, (1.08–2.52) 0.02
Other 0.86, (0.60–1.22) 0.39
* Odds ratio (OR) adjusted for age, gender, education and LGA
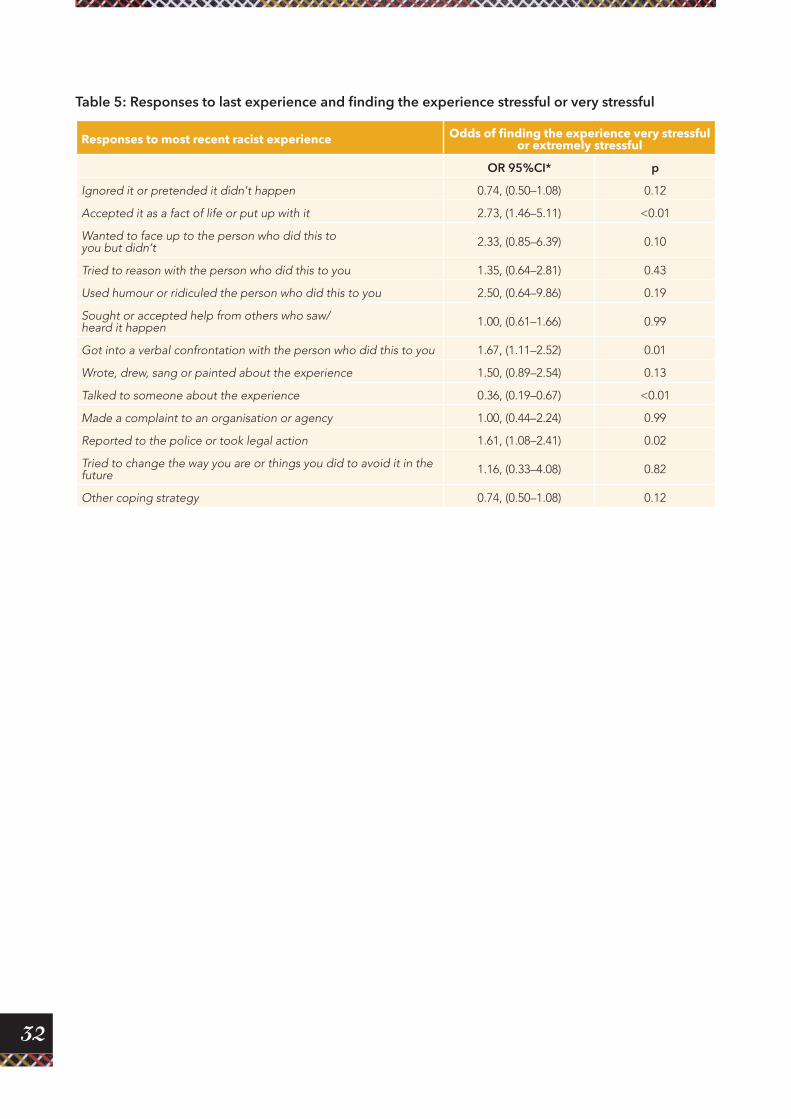
32
Table 5: Responses to last experience and finding the experience stressful or very stressful
Responses to most recent racist experience Odds of finding the experience very stressful or extremely stressful
OR 95%CI* p
Ignored it or pretended it didn't happen 0.74, (0.50–1.08) 0.12
Accepted it as a fact of life or put up with it 2.73, (1.46–5.11) <0.01
Wanted to face up to the person who did this to you but didn’t 2.33, (0.85–6.39) 0.10
Tried to reason with the person who did this to you 1.35, (0.64–2.81) 0.43
Used humour or ridiculed the person who did this to you 2.50, (0.64–9.86) 0.19
Sought or accepted help from others who saw/ heard it happen 1.00, (0.61–1.66) 0.99
Got into a verbal confrontation with the person who did this to you 1.67, (1.11–2.52) 0.01
Wrote, drew, sang or painted about the experience 1.50, (0.89–2.54) 0.13
Talked to someone about the experience 0.36, (0.19–0.67) <0.01
Made a complaint to an organisation or agency 1.00, (0.44–2.24) 0.99
Reported to the police or took legal action 1.61, (1.08–2.41) 0.02
Tried to change the way you are or things you did to avoid it in the future 1.16, (0.33–4.08) 0.82
Other coping strategy 0.74, (0.50–1.08) 0.12
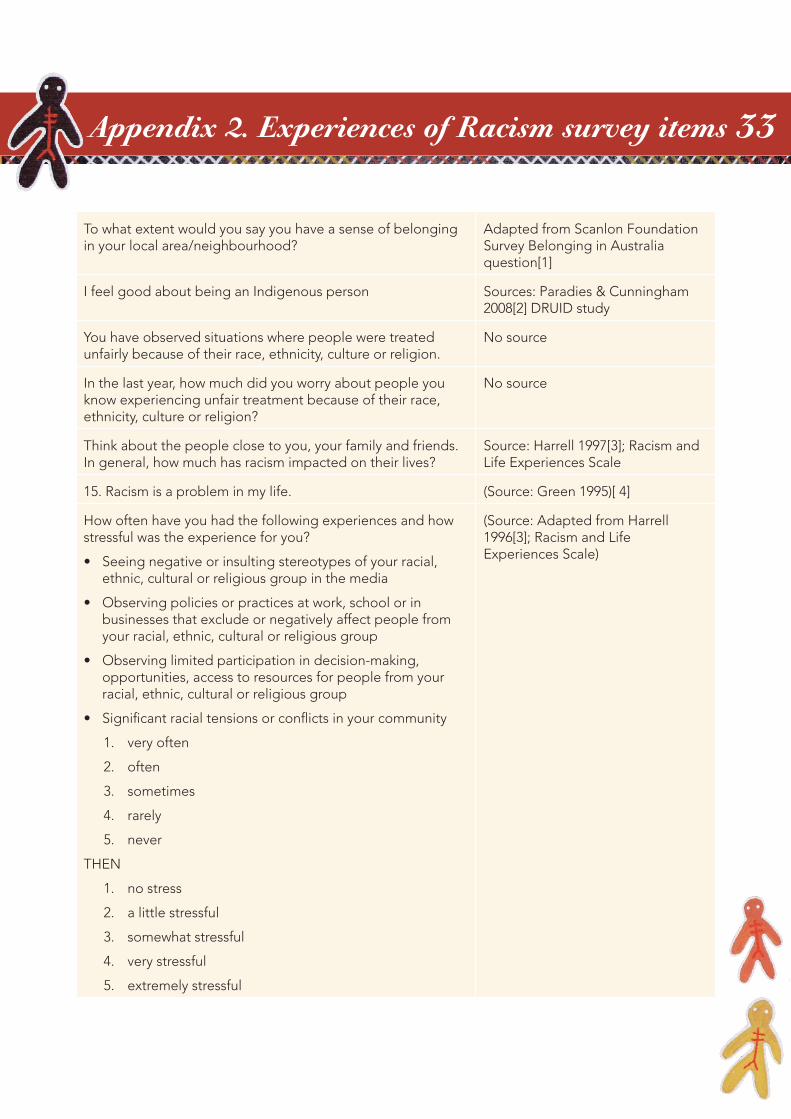
33
To what extent would you say you have a sense of belonging in your local area/neighbourhood?
Adapted from Scanlon Foundation Survey Belonging in Australia question[1]
I feel good about being an Indigenous person Sources: Paradies & Cunningham 2008[2] DRUID study
You have observed situations where people were treated unfairly because of their race, ethnicity, culture or religion.
No source
In the last year, how much did you worry about people you know experiencing unfair treatment because of their race, ethnicity, culture or religion?
No source
Think about the people close to you, your family and friends. In general, how much has racism impacted on their lives?
Source: Harrell 1997[3]; Racism and Life Experiences Scale
15. Racism is a problem in my life. (Source: Green 1995)[ 4]
How often have you had the following experiences and how stressful was the experience for you?
• Seeing negative or insulting stereotypes of your racial, ethnic, cultural or religious group in the media
• Observing policies or practices at work, school or in businesses that exclude or negatively affect people from your racial, ethnic, cultural or religious group
• Observing limited participation in decision-making, opportunities, access to resources for people from your racial, ethnic, cultural or religious group
• Significant racial tensions or conflicts in your community
1. very often
2. often
3. sometimes
4. rarely
5. never
THEN
1. no stress
2. a little stressful
3. somewhat stressful
4. very stressful
5. extremely stressful
(Source: Adapted from Harrell 1996[3]; Racism and Life Experiences Scale)
Appendix 2. Experiences of Racism survey items
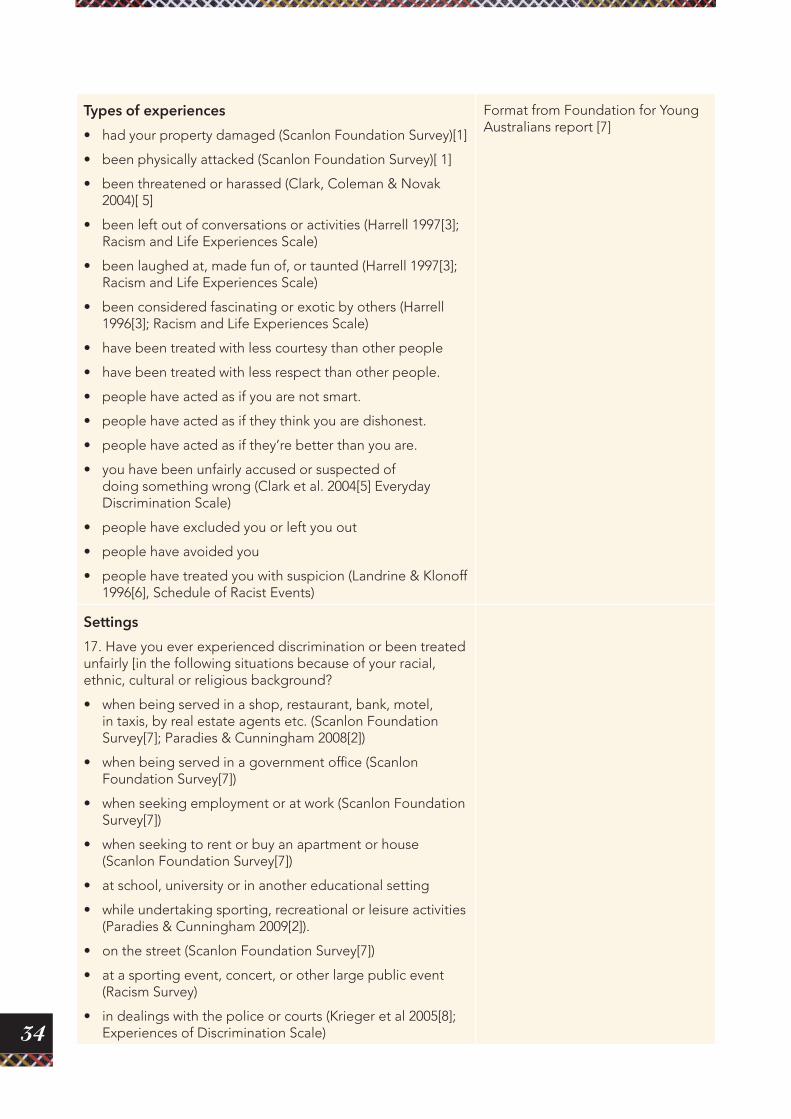
34
Types of experiences
• had your property damaged (Scanlon Foundation Survey)[1]
• been physically attacked (Scanlon Foundation Survey)[ 1]
• been threatened or harassed (Clark, Coleman & Novak 2004)[ 5]
• been left out of conversations or activities (Harrell 1997[3]; Racism and Life Experiences Scale)
• been laughed at, made fun of, or taunted (Harrell 1997[3]; Racism and Life Experiences Scale)
• been considered fascinating or exotic by others (Harrell 1996[3]; Racism and Life Experiences Scale)
• have been treated with less courtesy than other people
• have been treated with less respect than other people.
• people have acted as if you are not smart.
• people have acted as if they think you are dishonest.
• people have acted as if they’re better than you are.
• you have been unfairly accused or suspected of doing something wrong (Clark et al. 2004[5] Everyday Discrimination Scale)
• people have excluded you or left you out
• people have avoided you
• people have treated you with suspicion (Landrine & Klonoff 1996[6], Schedule of Racist Events)
Format from Foundation for Young Australians report [7]
Settings
17. Have you ever experienced discrimination or been treated unfairly [in the following situations because of your racial, ethnic, cultural or religious background?
• when being served in a shop, restaurant, bank, motel, in taxis, by real estate agents etc. (Scanlon Foundation Survey[7]; Paradies & Cunningham 2008[2])
• when being served in a government office (Scanlon Foundation Survey[7])
• when seeking employment or at work (Scanlon Foundation Survey[7])
• when seeking to rent or buy an apartment or house (Scanlon Foundation Survey[7])
• at school, university or in another educational setting
• while undertaking sporting, recreational or leisure activities (Paradies & Cunningham 2009[2]).
• on the street (Scanlon Foundation Survey[7])
• at a sporting event, concert, or other large public event (Racism Survey)
• in dealings with the police or courts (Krieger et al 2005[8]; Experiences of Discrimination Scale)
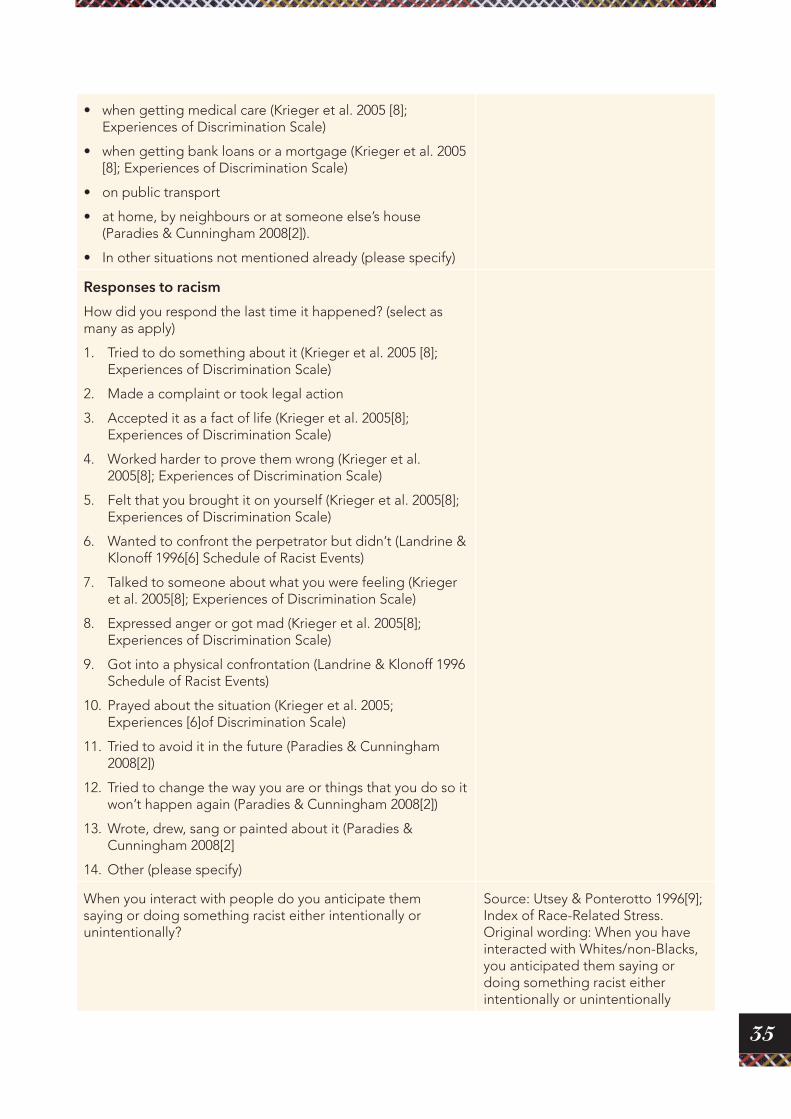
35
• when getting medical care (Krieger et al. 2005 [8]; Experiences of Discrimination Scale)
• when getting bank loans or a mortgage (Krieger et al. 2005 [8]; Experiences of Discrimination Scale)
• on public transport
• at home, by neighbours or at someone else’s house (Paradies & Cunningham 2008[2]).
• In other situations not mentioned already (please specify)
Responses to racism
How did you respond the last time it happened? (select as many as apply)
1. Tried to do something about it (Krieger et al. 2005 [8]; Experiences of Discrimination Scale)
2. Made a complaint or took legal action
3. Accepted it as a fact of life (Krieger et al. 2005[8]; Experiences of Discrimination Scale)
4. Worked harder to prove them wrong (Krieger et al. 2005[8]; Experiences of Discrimination Scale)
5. Felt that you brought it on yourself (Krieger et al. 2005[8]; Experiences of Discrimination Scale)
6. Wanted to confront the perpetrator but didn’t (Landrine & Klonoff 1996[6] Schedule of Racist Events)
7. Talked to someone about what you were feeling (Krieger et al. 2005[8]; Experiences of Discrimination Scale)
8. Expressed anger or got mad (Krieger et al. 2005[8]; Experiences of Discrimination Scale)
9. Got into a physical confrontation (Landrine & Klonoff 1996 Schedule of Racist Events)
10. Prayed about the situation (Krieger et al. 2005; Experiences [6]of Discrimination Scale)
11. Tried to avoid it in the future (Paradies & Cunningham 2008[2])
12. Tried to change the way you are or things that you do so it won’t happen again (Paradies & Cunningham 2008[2])
13. Wrote, drew, sang or painted about it (Paradies & Cunningham 2008[2]
14. Other (please specify)
When you interact with people do you anticipate them saying or doing something racist either intentionally or unintentionally?
Source: Utsey & Ponterotto 1996[9]; Index of Race-Related Stress. Original wording: When you have interacted with Whites/non-Blacks, you anticipated them saying or doing something racist either intentionally or unintentionally
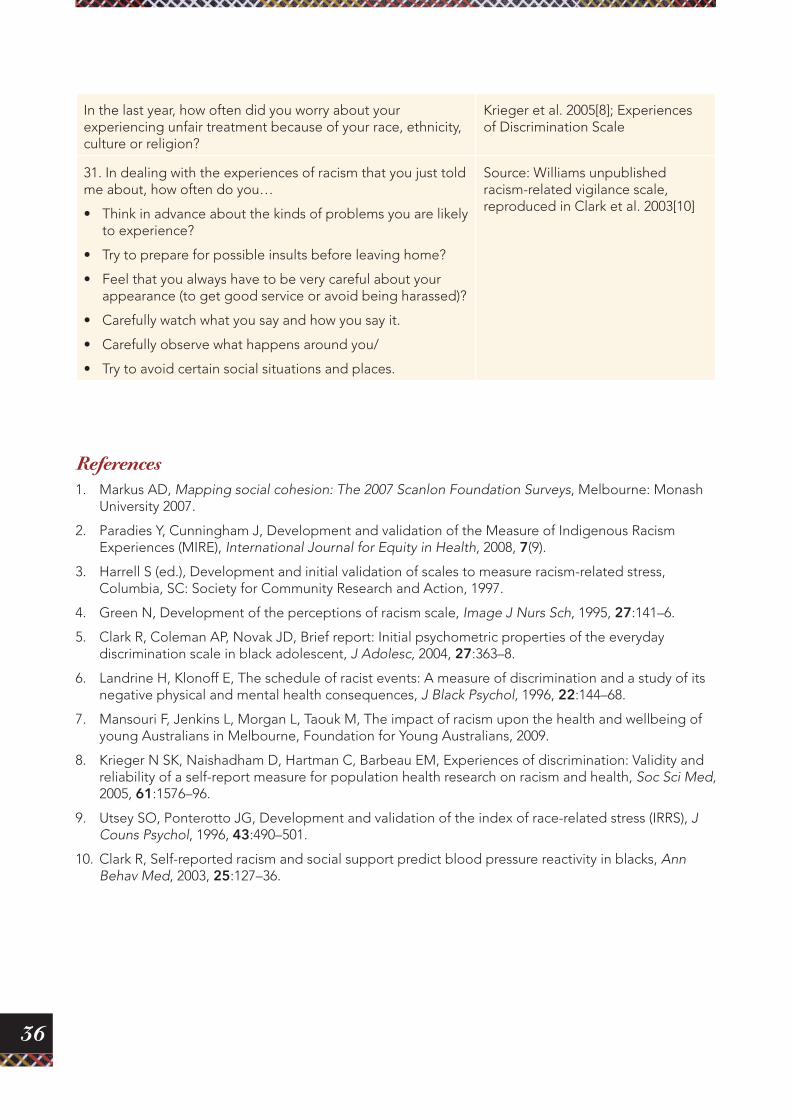
36
In the last year, how often did you worry about your experiencing unfair treatment because of your race, ethnicity, culture or religion?
Krieger et al. 2005[8]; Experiences of Discrimination Scale
31. In dealing with the experiences of racism that you just told me about, how often do you…
• Think in advance about the kinds of problems you are likely to experience?
• Try to prepare for possible insults before leaving home?
• Feel that you always have to be very careful about your appearance (to get good service or avoid being harassed)?
• Carefully watch what you say and how you say it.
• Carefully observe what happens around you/
• Try to avoid certain social situations and places.
Source: Williams unpublished racism-related vigilance scale, reproduced in Clark et al. 2003[10]
References 1. Markus AD, Mapping social cohesion: The 2007 Scanlon Foundation Surveys, Melbourne: Monash
University 2007.
2. Paradies Y, Cunningham J, Development and validation of the Measure of Indigenous Racism Experiences (MIRE), International Journal for Equity in Health, 2008, 7(9).
3. Harrell S (ed.), Development and initial validation of scales to measure racism-related stress, Columbia, SC: Society for Community Research and Action, 1997.
4. Green N, Development of the perceptions of racism scale, Image J Nurs Sch, 1995, 27:141–6.
5. Clark R, Coleman AP, Novak JD, Brief report: Initial psychometric properties of the everyday discrimination scale in black adolescent, J Adolesc, 2004, 27:363–8.
6. Landrine H, Klonoff E, The schedule of racist events: A measure of discrimination and a study of its negative physical and mental health consequences, J Black Psychol, 1996, 22:144–68.
7. Mansouri F, Jenkins L, Morgan L, Taouk M, The impact of racism upon the health and wellbeing of young Australians in Melbourne, Foundation for Young Australians, 2009.
8. Krieger N SK, Naishadham D, Hartman C, Barbeau EM, Experiences of discrimination: Validity and reliability of a self-report measure for population health research on racism and health, Soc Sci Med, 2005, 61:1576–96.
9. Utsey SO, Ponterotto JG, Development and validation of the index of race-related stress (IRRS), J Couns Psychol, 1996, 43:490–501.
10. Clark R, Self-reported racism and social support predict blood pressure reactivity in blacks, Ann Behav Med, 2003, 25:127–36.

37
The Lowitja Institute 179 Grattan Street, Carlton Victoria 3053 AUSTRALIAPO Box 650, Carlton South Victoria 3053 AUSTRALIAT: +61 3 8341 5500 F: +61 3 8341 5599 E: [email protected] W: www.lowitja.org.au