merced county employees’ retirement association
TRANSCRIPT

PERIOD ENDING: MARCH 31, 2017
Investment Performance Review for
Merced County Employees’ Retirement Association

VERUSINVESTMENTS.COM
SEATTLE 206-622-3700LOS ANGELES 310-297-1777
SAN FRANCISCO 415-362-3484
Table of contents
Market Environment TAB I
Total Fund TAB II
US Equity TAB III
International Equity TAB IV
US Fixed Income TAB V
Hedge Fund TAB VI
Real Estate TAB VII
Policy and Benchmark History
TAB VIII

1st quarter summary
THE ECONOMIC CLIMATE
—Developed economies continued to experience steady, moderate expansion with fourth quarter real GDP growth in the U.S., the Eurozone, and Japan all between 1.5‐2.0%. The base effect of lower oil prices led to higher year‐over‐year headline inflation in many countries.
—During the first quarter, the global economy exhibited a coordinated pick up in economic activity. Data generally exceeded expectations, especially in the U.S. and the Eurozone.
MARKET PORTFOLIO IMPACTS
—The U.S. Treasury curve flattened in the first quarter. Short‐term rates were driven higher by the Fed, while the long end of the curve remained unchanged. Even with Fed tightening, the U.S. may not be in a typical rising rate environment.
—A better outlook for commodity performance, as well as a flattening of the futures curve in some markets increases the attractiveness of commodities as an inflation hedge.
THE INVESTMENT CLIMATE
—While central banks are still accommodative outside of the U.S., most appear to be in later stages of the easing cycle. Developed central banks appear to be broadly entering a period of policy normalization.
—The market is expecting better earnings growth in U.S. equities. According to FactSet, the estimated Q1 earnings growth for the S&P 500 is 9.2% from the previous year. Higher earnings growth may help justify above average valuations.
ASSET ALLOCATION ISSUES
—Stabilizing currencies and commodity prices, as well as higher growth outlooks, may benefit emerging market equities.
—With U.S. Treasury yields still at historic lows and the expectation of additional tightening from the Fed, investors may not be adequately compensated for taking duration risk in the current environment.
We continue to be neutral towards risk
Merced County Employees’ Retirement Association 1

U.S. economics summary—U.S. real GDP grew 2.0% YoY in
Q4, up from 1.7% in Q3. Moderate increases in consumer spending continued to be the main driver of the economy.
— Inflation moved higher as headline CPI increased 2.8% YoY in February. Core inflation, however, increased only modestly to 2.2%. Most of the rise was caused by the low base effect from falling oil prices last year.
—The Fed continued tighter monetary policy by raising the target federal funds rate 25 bps to 0.75‐1.00% at its March meeting. The FOMC dot plot indicates two more rate hikes in 2017, while the market has only priced in one more increase.
—The March Fed meeting minutes revealed that the central bank
may begin shrinking its balance sheet as early as December, representing a form of monetary tightening. It remains unclear whether the Fed will stop rolling over maturing securities or actively sell in the open market.
—On average, 178,000 jobs were added each month during Q1, and unemployment fell 0.2% to 4.5%. Data continued to indicate a tighter labor market, though wage growth is lackluster. Real hourly earnings fell 0.1% in February from the prior year.
—Soft data (consumer & business sentiment) improved markedly following the U.S. presidential election. We are continuing to monitor the degree to which soft data flows through to actual spending and investment patterns. At this point evidencestill is lacking.
Most Recent 12 Months Prior
GDP (annual YoY) 2.0%12/31/16
1.9%12/31/15
Inflation (CPI YoY, Headline)
2.8%2/28/17
1.0%2/29/16
Expected Inflation (5yr‐5yr forward)
2.2%3/31/17
1.8%3/31/16
Fed Funds Rate 0.75%3/31/17
0.25%3/31/16
10 Year Rate 2.4%3/31/17
1.8%3/31/16
U‐3 Unemployment 4.5%3/31/17
5.0%3/31/16
U‐6 Unemployment 8.9%3/31/17
9.8%3/31/16
Merced County Employees’ Retirement Association 2

International economics summary—Developed countries once again
experienced moderate positive growth in the fourth quarter, in line with the trend of recent years. Real GDP in the U.S., Europe, and Japan grew between 1.5‐2.0%.
— The low base effect of the drop in energy prices that occurred in Q1 2016 helped boost inflation across the globe. With energy prices stabilizing over recent months, it is possible the jump in inflation is only transitory.
—Developed world unemployment rates declined over the quarter. In the Euro Area, the unemployment rate fell to a nearly eight year low of 9.5%, although this is still well above its pre‐crisis level of 7.3%.
— The economic recovery in Europe has also picked up in terms of higher growth and inflation. Much of this recovery can be attributed to the core countries, rather than
the periphery. However, significant tail risks remain including the French election, ECB tapering, and Brexit negotiations.
—On March 29th, the British Prime Minister, Theresa May, filed the official papers to withdraw the U.K. from the European Union. Article 50 of the Treaty of Lisbon outlines a two year timeframe for negotiations to take place.
— As many expected, Emmanuel Macron and Marine Le Pen were the top two vote getters in the first round of the French election. Macron and Le Pen will have a runoff vote on May 7th, where Macron is heavily favored, according to the most recent polls. Equity markets reacted positively to the results and the euro strengthened.
AreaGDP
(Real, YoY)Inflation (CPI, YoY) Unemployment
United States 2.0%12/31/16
2.7%2/28/17
4.5%3/31/17
Western Europe
1.8%12/31/16
1.5%3/31/17
8.6%12/31/16
Japan 1.6%12/31/16
0.3%2/28/17
2.8%2/28/17
BRIC Nations 5.2%12/31/16
3.1%12/31/16
5.5%12/31/16
Brazil (2.5%)12/31/16
4.6%3/31/17
12.9%3/31/17
Russia 0.3%12/31/16
4.3%3/31/17
5.4%12/31/16
India 7.0%12/31/16
3.7%2/28/17
7.1%12/31/15
China 6.8%12/31/16
0.8%2/28/17
4.0%12/30/16
Merced County Employees’ Retirement Association 3
Equity environment
Source: Russell Investments, MSCI, STOXX, FTSE, Nikkei, as of 3/31/17
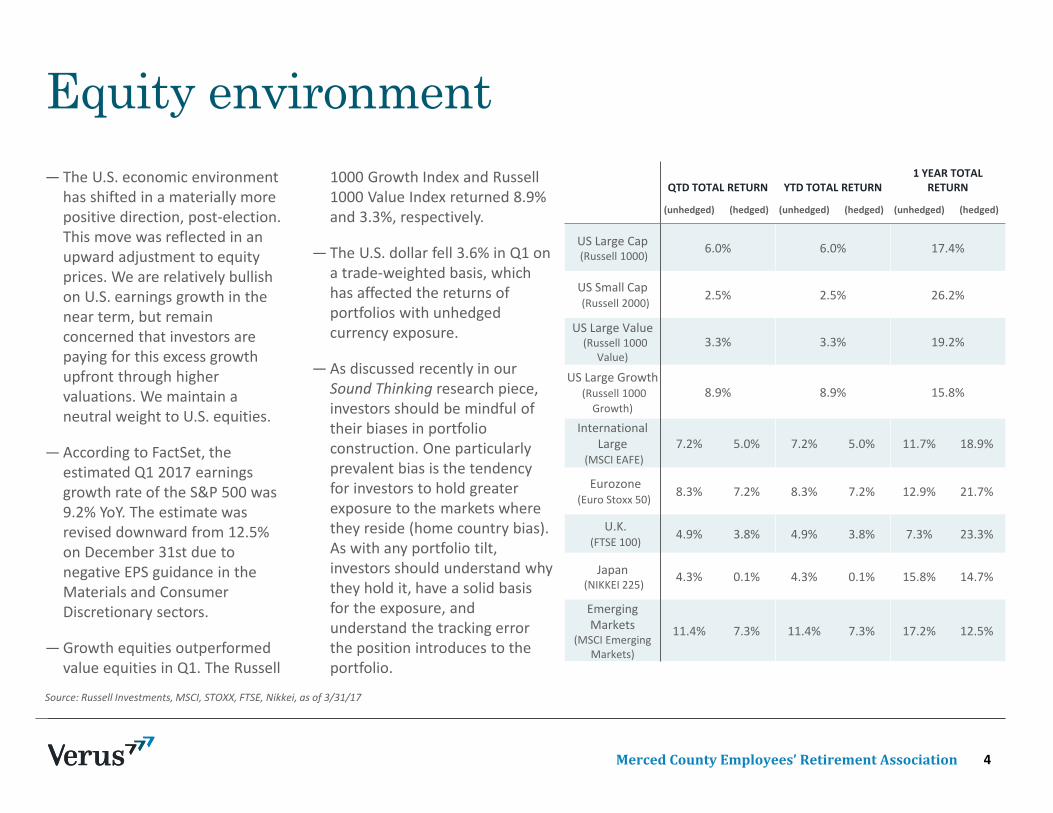
—The U.S. economic environment has shifted in a materially more positive direction, post‐election. This move was reflected in an upward adjustment to equity prices. We are relatively bullish on U.S. earnings growth in the near term, but remain concerned that investors are paying for this excess growth upfront through higher valuations. We maintain a neutral weight to U.S. equities.
—According to FactSet, the estimated Q1 2017 earnings growth rate of the S&P 500 was 9.2% YoY. The estimate was revised downward from 12.5% on December 31st due to negative EPS guidance in the Materials and Consumer Discretionary sectors.
—Growth equities outperformed value equities in Q1. The Russell
1000 Growth Index and Russell 1000 Value Index returned 8.9% and 3.3%, respectively.
— The U.S. dollar fell 3.6% in Q1 on a trade‐weighted basis, which has affected the returns of portfolios with unhedged currency exposure.
—As discussed recently in our Sound Thinking research piece, investors should be mindful of their biases in portfolio construction. One particularly prevalent bias is the tendency for investors to hold greater exposure to the markets where they reside (home country bias). As with any portfolio tilt, investors should understand why they hold it, have a solid basis for the exposure, and understand the tracking error the position introduces to the portfolio.
QTD TOTAL RETURN YTD TOTAL RETURN1 YEAR TOTAL
RETURN
(unhedged) (hedged) (unhedged) (hedged) (unhedged) (hedged)
US Large Cap (Russell 1000) 6.0% 6.0% 17.4%
US Small Cap (Russell 2000)
2.5% 2.5% 26.2%
US Large Value(Russell 1000
Value)3.3% 3.3% 19.2%
US Large Growth(Russell 1000 Growth)
8.9% 8.9% 15.8%
International Large
(MSCI EAFE)7.2% 5.0% 7.2% 5.0% 11.7% 18.9%
Eurozone (Euro Stoxx 50) 8.3% 7.2% 8.3% 7.2% 12.9% 21.7%
U.K. (FTSE 100)
4.9% 3.8% 4.9% 3.8% 7.3% 23.3%
Japan (NIKKEI 225)
4.3% 0.1% 4.3% 0.1% 15.8% 14.7%
Emerging Markets
(MSCI Emerging Markets)
11.4% 7.3% 11.4% 7.3% 17.2% 12.5%
Merced County Employees’ Retirement Association 4

The U.S. economic environment has shifted in a materially more positive direction, post‐election, as reflected by rising in equity prices. We are relatively bullish on U.S. earnings growth in the near term but remain concerned that investors are paying for this excess growth upfront through higher valuations. We maintain a neutral weight to U.S. equities.
Higher equity prices and earnings expectations have been influenced by corporate tax cuts and deregulation
proposed by the new administration. There have been no further details released on timing of tax cuts, and lofty expectations may leave room for disappointment.
According to FactSet, Q1 2017 S&P 500 earnings are expected to grow 9.2% YoY. The estimate was revised downward from 12.5% on December 31st due to negative EPS guidance in the Materials and Consumer Discretionary sectors.
U.S. EQUITIES S&P 500 EPS GROWTH Q1 FORECAST EPS GROWTH
Domestic equity
Source: Russell Investments, as of 4/3/17 Source: Bloomberg, as of 12/31/16 Source: FactSet, as of 4/14/17
Investors may be paying for higher earnings growth through elevated valuations
3000
4000
5000
6000
7000
Jul‐12 Jul‐13 Jul‐14 Jul‐15 Jul‐16
Russell 3000
+16.5%
+2.8%
‐10%
0%
10%
20%
Jan‐12 Sep‐13 May‐15
‐7%‐4%
‐2%1%2%2%
7%9%
13%13%
16%
‐10% ‐5% 0% 5% 10% 15% 20%
IndustrialsTelecom
CDHealthcare
CSUtilities
Real EstateS&P 500
ITMaterialsFinancials
Merced County Employees’ Retirement Association 5

SMALL CAP VS LARGE CAP (YOY) VALUE VS GROWTH (YOY)U.S. LARGE VS. SMALL RELATIVE PERFORMANCE
Domestic equity size and styleGrowth equities outperformed value equities during the quarter. The Russell 1000 Growth Index and Russell 1000 Value Index returned 8.9% and 3.3%, respectively. Financial sector performance had a significant effect on the value premium, affected by uncertainty around the direction of interest rates and deregulation proposals.
U.S. large cap equities outperformed small cap during the quarter, though small caps have delivered strong
year‐over‐year outperformance. Small cap equity valuations remain considerably elevated relative to large cap equities which will likely act as a headwind to future performance. However, if President Trump’s deregulation proposals are seen through, this should benefit smaller American companies. Further U.S. dollar appreciation would also benefit smaller companies on a relative basis due to less international currency exposure.
Source: Russell Investments, as of 3/31/17 Source: Russell Investments, as of 3/31/17 Source: Morningstar, as of 3/31/17
‐40
‐30
‐20
‐10
0
10
20
30
40
Jan‐80 Oct‐88 Jul‐97 Apr‐06 Jan‐15
Return Differen
ce (%
)
Russell 2000 minus Russell 1000
‐40
‐30
‐20
‐10
0
10
20
30
40
50
Jan‐80 Oct‐88 Jul‐97 Apr‐06 Jan‐15
Return Differen
ce (%
)
R3000 Value minus R3000 Growth
‐4% ‐4%
9%
‐3%
‐1% 0%
1%
‐6%
‐3%
0%
3%
6%
9%
12%
QTD YTD 1 Yr 3 Yrs 5 Yrs 10 Yrs 20 Yrs
Small Outperformance
Large Outperformance
Merced County Employees’ Retirement Association 6

GLOBAL EQUITY PERFORMANCE VALUATIONS EFFECT OF CURRENCY (1 YEAR ROLLING)
International equityInternational equity markets outperformed domestic equities over the quarter. The MSCI ACWI ex U.S. returned 7.9% on an unhedged basis while the S&P 500 returned 6.1%.
International and emerging markets continue to trade at lower valuation levels than domestic markets, based on a variety of metrics. Despite our positive outlook for earnings growth in the U.S., the upside for domestic equities appears limited due to the optimism already baked into the price. International markets likely possess greater upside potential through either valuation
expansion or earnings growth surprise, simply due to current valuation levels. However, tail risks are also apparent in these markets. We believe a neutral weight is appropriate.
The U.S. dollar fell 3.6% in Q1 on a trade‐weighted basis, and continued to contribute volatility to portfolios with unhedged currency exposure. Emerging market currencies exhibited further recovery during the quarter (MSCI EM 11.4% unhedged return vs. 7.3% hedged return) while the yen appreciated (4.3% NIKKEI 225 unhedged return vs. 0.1% hedged).
Source: Bloomberg, as of 3/31/17 Source: Bloomberg, MSCI, as of 3/31/17 ‐ 3 month average Source: MSCI, as of 3/31/17
‐20%
‐10%
0%
10%
20%
30%
Jan‐09 Dec‐10 Nov‐12 Oct‐14 Sep‐16MSCI EAFE MSCI ACWI ex USA MSCI EM
‐10
‐5
0
5
10
15
20
25
Mar‐16 Jun‐16 Sep‐16 Dec‐16 Mar‐17
Cumulative Re
turn (%
)
MSCI EAFE IndexMSCI Emerging Markets IndexMSCI EAFE Small Cap Index
1.7
21.2
11.5
3.14.7
3.1
22.0 21.2
2.0
4.5
1.6
15.513.4
2.5
6.4
0
5
10
15
20
25
P/BV P/E Price/FCF DividendYield (%)
EarningsYield (%)
EAFE
United States
Emerging Markets
Merced County Employees’ Retirement Association 7

‐30%
‐20%
‐10%
0%
10%
20%
30%
Jan‐12 Jan‐13 Jan‐14 Jan‐15 Jan‐16 Jan‐17
MSCI EM Hedged MSCI EM
5
10
15
20
25
Nov‐05 May‐08 Nov‐10 Apr‐13 Oct‐15
MSCI EAFE Emerging Markets MSCI EAFE Small
‐20%
‐10%
0%
10%
20%
30%
40%
50%
Dec‐03 Dec‐06 Dec‐09 Dec‐12 Dec‐15
3‐yr Rolling Pe
rformance
MSCI EM Bloomberg Commodity Spot
12‐MONTH ROLLING PERFORMANCE FORWARD P/E RATIOSCOMMODITY PRICES & EM PERFORMANCE
Emerging market equityEmerging market equities extended their positive run in the first quarter, as the unhedged MSCI Emerging Markets index returned 11.4% (7.3% hedged). Performance was bolstered by strong global growth and stable commodity prices which have correlated highly with emerging market equities in the past. Steady demand from developed markets encouraged manufacturing in emerging economies as seen by increases in aggregate purchasing managers’ indices (PMI).
Valuations increased moderately over the past three years but remain at attractive levels relative to EAFE and U.S equities. Earnings growth estimates were highest in the Technology and Financial sectors, concentrated mainly in Korea and China.
Positive long‐term growth expectations are not without potential disruptions. We remain particularly watchful of U.S. trade policies and upcoming elections in France, Germany, and Turkey.
Source: MPI, as of 3/31/17 Source: Bloomberg, as of 3/31/17 Source: Bloomberg as of 3/31/17
Fundamentals are improving in emerging economies
5
10
15
20
25
Nov‐05 Aug‐08 May‐11 Jan‐14 Oct‐16
MSCI EAFE Emerging Markets MSCI EAFE Small
Merced County Employees’ Retirement Association 8

Interest rate environment
Source: Bloomberg, as of 3/31/17
— U.S. Treasuries have an attractive yield relative to other developed sovereign bonds, but remain historically expensive.
— Despite broad agreement that the U.S. has entered an environment of rising interest rates, the broad yield curve rose very little over the past year. However, the short end of the curve has increased in line with Federal Reserve rate rises. Inflation has historically had a significant impact on the yield curve, which indicates investors should keep an eye on inflation trends.
— In March, the Federal Reserve announced a change to the federal funds target rate from 0.50‐0.75% to 0.75‐1.00%. The move resulted in the U.S. Treasury curve flattening
moderately as short‐term interest rates increased and long‐term rates remained materially unchanged. The Fed has indicated two additional rate hikes are expected to occur this year.
— Developed sovereign yields are expected to rise only modestly over the next year, with very little movement expected in longer dated bonds. Central banks of most developed economies are nearing the end of the monetary easing cycle or have begun to pull back, as in the case of the U.S. Federal Reserve.
— Many emerging market governments continue with monetary easing, suggesting these economies may be in an earlier stage of the economic cycle.
Area Short Term (3M) 10 Year
United States 0.75% 2.39%
Germany (0.92%) 0.33%
France (0.57%) 0.97%
Spain (0.39%) 1.65%
Italy (0.34%) 2.31%
Greece 2.39% 6.90%
U.K. 0.13% 1.14%
Japan (0.20%) 0.07%
Australia 1.59% 2.70%
China 2.93% 3.28%
Brazil 10.91% 10.06%
Russia 9.50% 7.87%
Merced County Employees’ Retirement Association 9

Yield environment
Source: Bloomberg, as of 3/31/17
Global investors continue to prefer U.S. Treasuries due to higher relative yields
YIELD CURVE CHANGES OVER LAST FIVE YEARS IMPLIED CHANGES OVER NEXT YEAR
GLOBAL GOVERNMENT YIELD CURVESU.S. YIELD CURVE
‐0.2
0.0
0.2
0.4
0.6
0.8
1.0
1.2
1M 3M 6M 1Y 2Y 3Y 4Y 5Y 7Y 9Y 10Y 12Y 15Y 20Y 30Y
Yield Ch
ange (%
)
US Treasury UK Treasury Japan Treasury Germany Treasury
Canada Treasury Australia Treasury Italy Treasury
‐1%
0%
1%
2%
3%
4%
5%
1M3M6M 1Y 2Y 3Y 4Y 5Y 7Y 9Y 10Y 12Y 15Y 20Y 30YUS Treasury Curve 3/31/17 Japan Curve 3/31/17Canada Curve 3/31/17 Germany Curve 3/31/17United Kingdom Curve 3/31/17 France Curve 3/31/17Italy Curve 3/31/17 China Curve 3/31/17
‐4%
‐3%
‐2%
‐1%
0%
1%
2%
1M3M6M 1Y 2Y 3Y 4Y 5Y 7Y 9Y 10Y 12Y 15Y 20Y 30Y
US Japan CanadaGermany United Kingdom FranceItaly China
‐1
0
1
2
3
4
5
1M 3M 6M 1Y 2Y 3Y 5Y 7Y 10Y 30Y
US Treasury Curve 3/31/17 US Treasury Curve 12/31/16US Treasury Curve 12/31/15 US Treasury Curve 12/31/14US Treasury Curve 12/31/10 US Treasury Curve 12/31/05
Merced County Employees’ Retirement Association 10

EFFECT OF CURRENCY (1YR ROLLING) LONG‐TERM TRADE WEIGHTED DOLLAR JPM EM CURRENCY INDEX
CurrencyIn the first quarter, the U.S. dollar reversed part of its gains following the presidential election in November. On a trade weighted basis, the dollar was down 3.6% against a basket of major currencies. Currency movement has been an important influence in unhedged foreign asset exposure. Over the past year, U.S. dollar strength has eroded positive equity returns in developed markets, while dollar weakness against emerging markets has added to returns.
Emerging market currencies rallied in the first quarter following a sharp decline to end last year. The JPM Emerging Market Currency Index was up 2.5%.
While long‐term movements in the U.S. are often driven by broad mean reversion to fair value based on purchasing power parity, shorter term moves are still likely to be heavily influenced by developments in foreign trade policy, where much uncertainty remains.
Source: MPI, as of 3/31/17 Source: FRED, as of 4/7/17 Source: Bloomberg, as of 3/31/17
60
70
80
90
100
110
Jul‐10 Sep‐12 Nov‐14 Jan‐17
60
70
Oct‐16 Jan‐17
‐20%
‐10%
0%
10%
20%
30%
Jan‐09 Apr‐11 Jun‐13 Aug‐15
MSCI EAFE MSCI ACWI ex USA MSCI EM
80
90
100
110
120
130
140
Jan‐95 Jan‐00 Jan‐05 Jan‐10 Jan‐15
116
124
132
Jan‐16 Jan‐17
Merced County Employees’ Retirement Association 11

Period Ending: March 31, 2017Executive Summary
― The composite fund returned 4.4% in the first quarter of 2017 and ranked in the 61st percentile among other $250mm-$1B public funds (4.5% median). The Plan lagged its policy index (4.7%) during this time period. Longer term, the three-year returns of 5.6% ranked above the median among its peer public plans (5.4%).
― First quarter results were enhanced by the following factors:
1. Mellon Dynamic US Equity rose 7.9% beating the S&P 500 and ranking in the top decile of Large Cap core managers. The strategy outperformed due to the extended U.S. equity position.
2. Wells Capital beat the MSCI Emerging Markets index (13.2% v. 11.5%). A weaker U.S. dollar and softer U.S. interest rates helped reverse
the negative trend in emerging markets. Mexico was a positive contributor for the quarter. 3. Greenfield Partners was up 5.4% vs. 2.8% for its benchmark in the first quarter and 13.1% since inception. Fund VII is still in the first
half of its fund life so results are subject to change as market conditions move but we are pleased with the Fund’s results so far. ― First quarter results were hindered by the following factors:
1. DFA Small Cap gained 0.8% versus the Russell 2000 2.5% return. The primary driver for underperformance was the exclusion of relatively high price low profitability positions.
2. Copper Rock ranked in the bottom decile of its peers gaining 6.6% for the quarter. Underperformance was driven by stock selection
within the consumer staples and energy sectors.
Merced County Employees’ Retirement Association 12

* Managers are ranked against the eVestment Alliance (eA) style universes. Asset class composites are ranked against the InvestorForce universes.** Since inception returns are based on the first full quarter of performance.*** Since inception date denotes last day of the month.- Effective 1/1/2017, only traditional asset class (public equity, public fixed income, REITs) investment management fees will be included in the gross of fee return calculation.1 See Benchmark History.2 Funded on 3/15/2016.
Total FundPerformance Summary (Gross of Fees) Period Ending: March 31, 2017
Market Value($)
3 Mo(%) Rank YTD
(%) Rank 3 Yrs(%) Rank 5 Yrs
(%) Rank 7 Yrs(%) Rank 10 Yrs
(%) Rank Return(%) Since
_
Total Fund - Gross 726,903,211 4.4 61 4.4 61 5.6 40 7.9 47 8.3 40 5.0 72 8.1 Dec-94Policy Index 4.6 45 4.6 45 5.9 25 8.2 32 8.6 26 5.5 48 5.8 Dec-94
InvestorForce Public DB $250mm-$1B GrossMedian 4.5 4.5 5.4 7.8 8.1 5.4 8.2 Dec-94
Total Fund w/o Alternatives - Gross 565,144,033 5.2 8 5.2 8 5.3 56 7.9 47 -- -- -- -- -- Dec-94Policy Index w/o AI 4.9 16 4.9 16 5.0 68 7.2 70 -- -- -- -- -- Dec-94
InvestorForce Public DB $250mm-$1B GrossMedian 4.5 4.5 5.4 7.8 8.1 5.4 8.2 Dec-94
US Equity - Gross 223,329,776 5.8 39 5.8 39 11.2 2 14.0 5 13.2 19 8.0 19 9.9 Dec-9480% R1000/ 20% R2000 5.3 67 5.3 67 9.6 38 13.1 39 12.8 43 7.5 48 9.8 Dec-94
InvestorForce All DB US Eq Gross Median 5.7 5.7 9.2 12.8 12.7 7.5 9.9 Dec-94Mellon Dynamic US Equity - Gross 70,818,627 7.9 7 7.9 7 13.2 1 -- -- -- -- -- -- 18.7 Dec-12
S&P 500 6.1 44 6.1 44 10.4 26 13.3 38 12.9 45 7.5 67 15.0 Dec-12eA US Large Cap Core Equity Gross Median 5.9 5.9 9.4 12.9 12.7 7.9 14.7 Dec-12
Mellon Large Cap - Gross 111,878,762 6.0 47 6.0 47 -- -- -- -- -- -- -- -- 17.5 Mar-16Russell 1000 6.0 47 6.0 47 10.0 35 13.3 37 13.0 41 7.6 60 17.4 Mar-16
eA US Large Cap Equity Gross Median 5.8 5.8 9.2 12.8 12.6 7.9 16.4 Mar-16DFA Small Cap - Gross 20,544,349 0.8 71 0.8 71 -- -- -- -- -- -- -- -- 8.7 Jun-14
Russell 2000 2.5 52 2.5 52 7.2 61 12.4 66 12.3 75 7.1 80 7.1 Jun-14eA US Small Cap Equity Gross Median 2.6 2.6 8.0 13.3 13.7 8.4 7.9 Jun-14
PanAgora - Gross 20,088,038 2.7 49 2.7 49 8.9 39 -- -- -- -- -- -- 11.4 Sep-13Russell 2000 2.5 52 2.5 52 7.2 61 12.4 66 12.3 75 7.1 80 9.1 Sep-13
eA US Small Cap Equity Gross Median 2.6 2.6 8.0 13.3 13.7 8.4 10.0 Sep-13
1
1
2
1
*
** ***
Merced County Employees’ Retirement Association 13
3 Liquidating as of 9/14/2016.
Total FundPerformance Summary (Gross of Fees) Period Ending: March 31, 2017
Market Value($)
3 Mo(%) Rank YTD
(%) Rank 3 Yrs(%) Rank 5 Yrs
(%) Rank 7 Yrs(%) Rank 10 Yrs
(%) Rank Return(%) Since
_
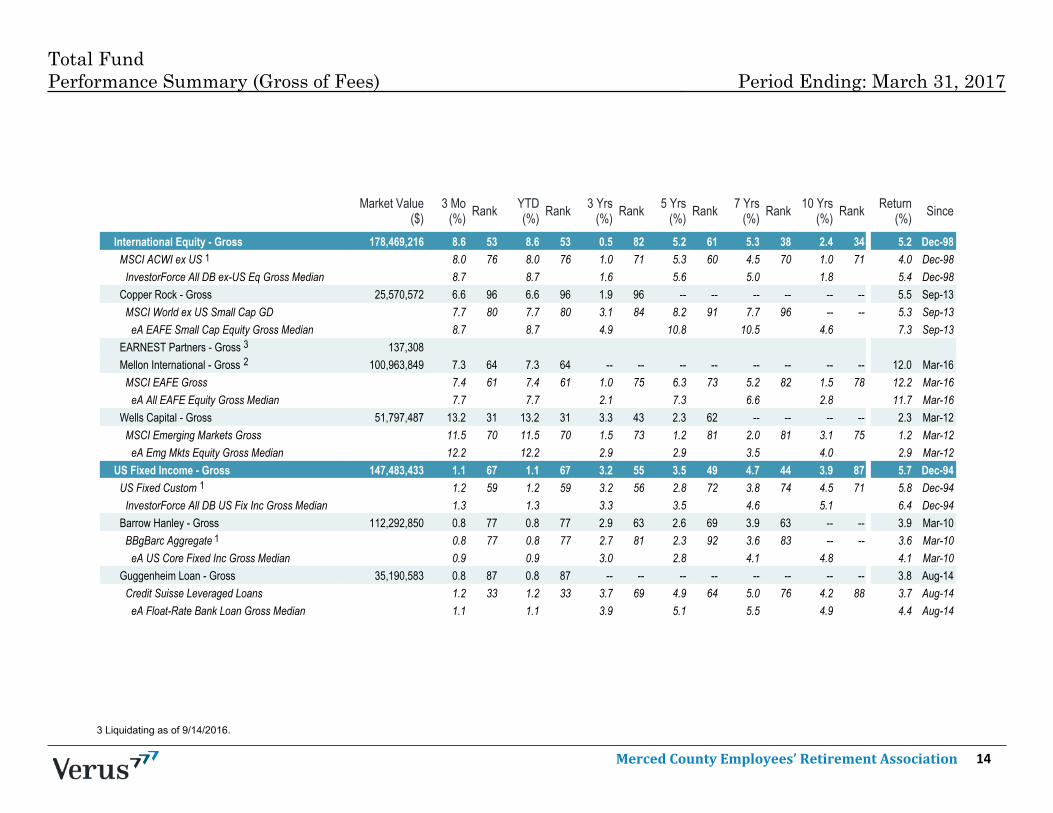
International Equity - Gross 178,469,216 8.6 53 8.6 53 0.5 82 5.2 61 5.3 38 2.4 34 5.2 Dec-98MSCI ACWI ex US 8.0 76 8.0 76 1.0 71 5.3 60 4.5 70 1.0 71 4.0 Dec-98
InvestorForce All DB ex-US Eq Gross Median 8.7 8.7 1.6 5.6 5.0 1.8 5.4 Dec-98Copper Rock - Gross 25,570,572 6.6 96 6.6 96 1.9 96 -- -- -- -- -- -- 5.5 Sep-13
MSCI World ex US Small Cap GD 7.7 80 7.7 80 3.1 84 8.2 91 7.7 96 -- -- 5.3 Sep-13eA EAFE Small Cap Equity Gross Median 8.7 8.7 4.9 10.8 10.5 4.6 7.3 Sep-13
EARNEST Partners - Gross 137,308Mellon International - Gross 100,963,849 7.3 64 7.3 64 -- -- -- -- -- -- -- -- 12.0 Mar-16
MSCI EAFE Gross 7.4 61 7.4 61 1.0 75 6.3 73 5.2 82 1.5 78 12.2 Mar-16eA All EAFE Equity Gross Median 7.7 7.7 2.1 7.3 6.6 2.8 11.7 Mar-16
Wells Capital - Gross 51,797,487 13.2 31 13.2 31 3.3 43 2.3 62 -- -- -- -- 2.3 Mar-12MSCI Emerging Markets Gross 11.5 70 11.5 70 1.5 73 1.2 81 2.0 81 3.1 75 1.2 Mar-12
eA Emg Mkts Equity Gross Median 12.2 12.2 2.9 2.9 3.5 4.0 2.9 Mar-12US Fixed Income - Gross 147,483,433 1.1 67 1.1 67 3.2 55 3.5 49 4.7 44 3.9 87 5.7 Dec-94
US Fixed Custom 1.2 59 1.2 59 3.2 56 2.8 72 3.8 74 4.5 71 5.8 Dec-94InvestorForce All DB US Fix Inc Gross Median 1.3 1.3 3.3 3.5 4.6 5.1 6.4 Dec-94
Barrow Hanley - Gross 112,292,850 0.8 77 0.8 77 2.9 63 2.6 69 3.9 63 -- -- 3.9 Mar-10BBgBarc Aggregate 0.8 77 0.8 77 2.7 81 2.3 92 3.6 83 -- -- 3.6 Mar-10
eA US Core Fixed Inc Gross Median 0.9 0.9 3.0 2.8 4.1 4.8 4.1 Mar-10Guggenheim Loan - Gross 35,190,583 0.8 87 0.8 87 -- -- -- -- -- -- -- -- 3.8 Aug-14
Credit Suisse Leveraged Loans 1.2 33 1.2 33 3.7 69 4.9 64 5.0 76 4.2 88 3.7 Aug-14eA Float-Rate Bank Loan Gross Median 1.1 1.1 3.9 5.1 5.5 4.9 4.4 Aug-14
1
32
1
1
Merced County Employees’ Retirement Association 14
Market Value($)
3 Mo(%) Rank YTD
(%) Rank 3 Yrs(%) Rank 5 Yrs
(%) Rank 7 Yrs(%) Rank 10 Yrs
(%) Rank Return(%) Since
_
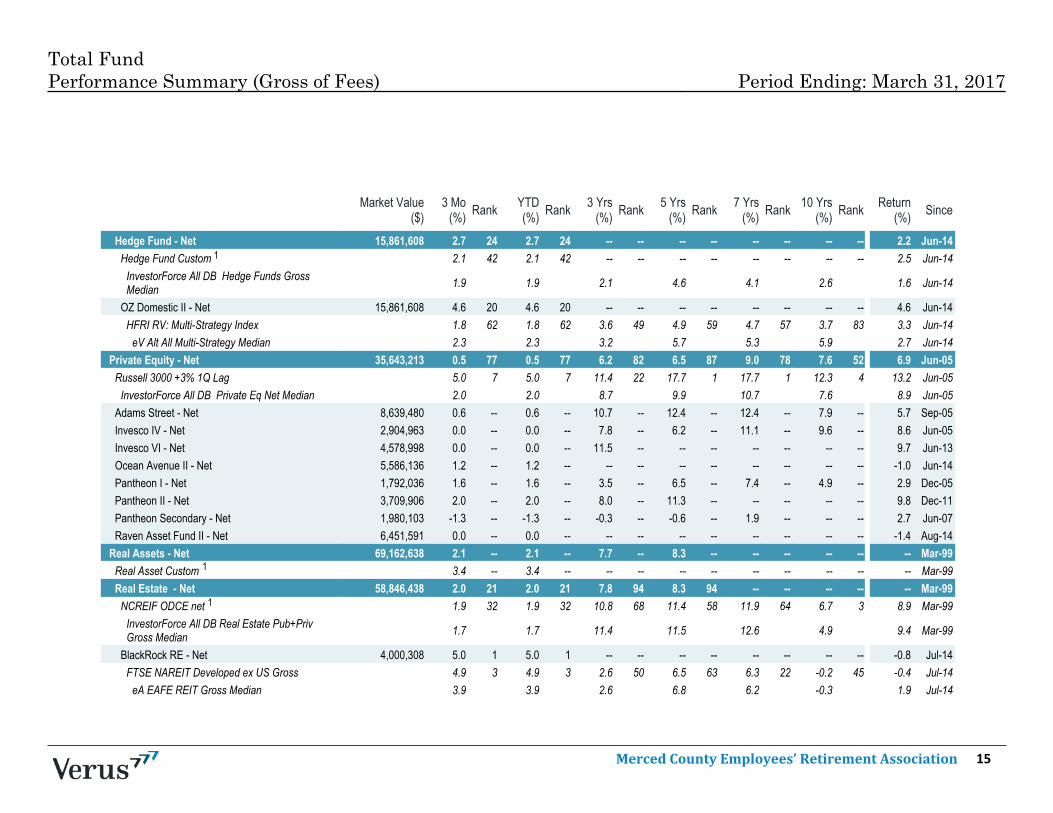
Hedge Fund - Net 15,861,608 2.7 24 2.7 24 -- -- -- -- -- -- -- -- 2.2 Jun-14Hedge Fund Custom 2.1 42 2.1 42 -- -- -- -- -- -- -- -- 2.5 Jun-14
InvestorForce All DB Hedge Funds GrossMedian 1.9 1.9 2.1 4.6 4.1 2.6 1.6 Jun-14
OZ Domestic II - Net 15,861,608 4.6 20 4.6 20 -- -- -- -- -- -- -- -- 4.6 Jun-14HFRI RV: Multi-Strategy Index 1.8 62 1.8 62 3.6 49 4.9 59 4.7 57 3.7 83 3.3 Jun-14
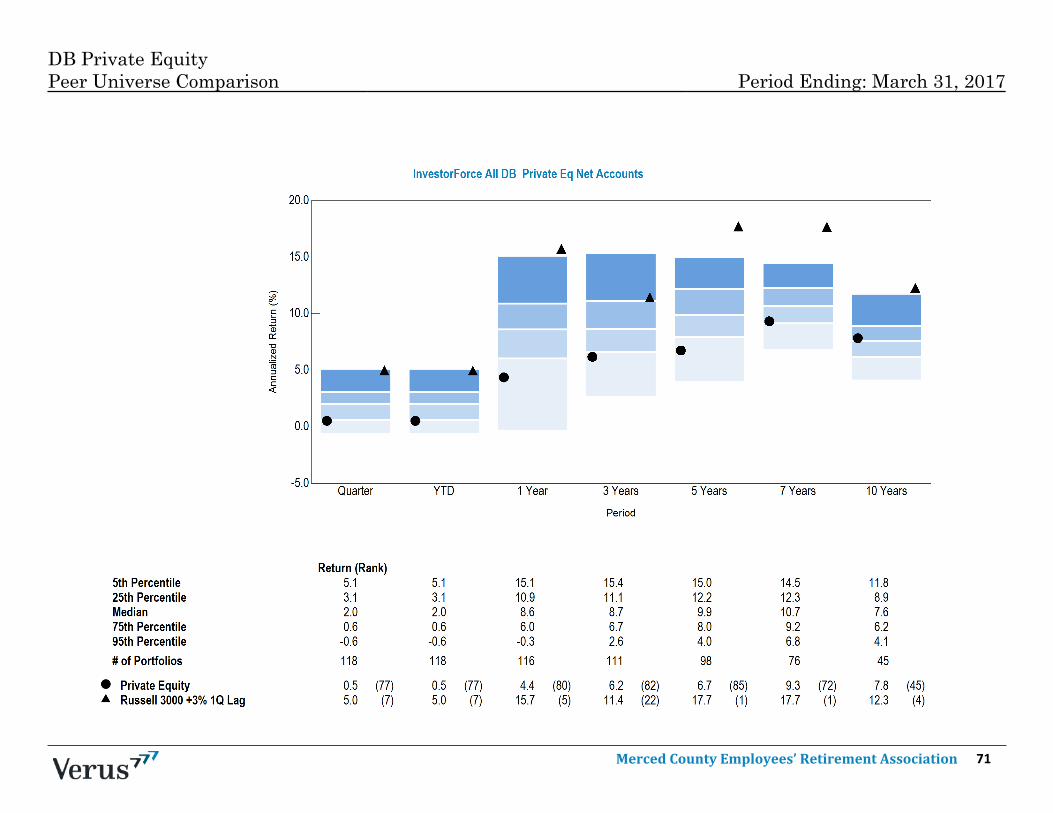
eV Alt All Multi-Strategy Median 2.3 2.3 3.2 5.7 5.3 5.9 2.7 Jun-14Private Equity - Net 35,643,213 0.5 77 0.5 77 6.2 82 6.5 87 9.0 78 7.6 52 6.9 Jun-05
Russell 3000 +3% 1Q Lag 5.0 7 5.0 7 11.4 22 17.7 1 17.7 1 12.3 4 13.2 Jun-05InvestorForce All DB Private Eq Net Median 2.0 2.0 8.7 9.9 10.7 7.6 8.9 Jun-05
Adams Street - Net 8,639,480 0.6 -- 0.6 -- 10.7 -- 12.4 -- 12.4 -- 7.9 -- 5.7 Sep-05Invesco IV - Net 2,904,963 0.0 -- 0.0 -- 7.8 -- 6.2 -- 11.1 -- 9.6 -- 8.6 Jun-05Invesco VI - Net 4,578,998 0.0 -- 0.0 -- 11.5 -- -- -- -- -- -- -- 9.7 Jun-13Ocean Avenue II - Net 5,586,136 1.2 -- 1.2 -- -- -- -- -- -- -- -- -- -1.0 Jun-14Pantheon I - Net 1,792,036 1.6 -- 1.6 -- 3.5 -- 6.5 -- 7.4 -- 4.9 -- 2.9 Dec-05Pantheon II - Net 3,709,906 2.0 -- 2.0 -- 8.0 -- 11.3 -- -- -- -- -- 9.8 Dec-11Pantheon Secondary - Net 1,980,103 -1.3 -- -1.3 -- -0.3 -- -0.6 -- 1.9 -- -- -- 2.7 Jun-07Raven Asset Fund II - Net 6,451,591 0.0 -- 0.0 -- -- -- -- -- -- -- -- -- -1.4 Aug-14
Real Assets - Net 69,162,638 2.1 -- 2.1 -- 7.7 -- 8.3 -- -- -- -- -- -- Mar-99Real Asset Custom 3.4 -- 3.4 -- -- -- -- -- -- -- -- -- -- Mar-99Real Estate - Net 58,846,438 2.0 21 2.0 21 7.8 94 8.3 94 -- -- -- -- -- Mar-99
NCREIF ODCE net 1.9 32 1.9 32 10.8 68 11.4 58 11.9 64 6.7 3 8.9 Mar-99InvestorForce All DB Real Estate Pub+PrivGross Median 1.7 1.7 11.4 11.5 12.6 4.9 9.4 Mar-99
BlackRock RE - Net 4,000,308 5.0 1 5.0 1 -- -- -- -- -- -- -- -- -0.8 Jul-14FTSE NAREIT Developed ex US Gross 4.9 3 4.9 3 2.6 50 6.5 63 6.3 22 -0.2 45 -0.4 Jul-14
eA EAFE REIT Gross Median 3.9 3.9 2.6 6.8 6.2 -0.3 1.9 Jul-14
Total FundPerformance Summary (Gross of Fees) Period Ending: March 31, 2017
1
1
1
Merced County Employees’ Retirement Association 15

4 Funded on 1/22/2016.5 Funded on 1/31/2017.
Market Value($)
3 Mo(%) Rank YTD
(%) Rank 3 Yrs(%) Rank 5 Yrs
(%) Rank 7 Yrs(%) Rank 10 Yrs
(%) Rank Return(%) Since
_
Greenfield Gap VII - Net 12,031,746 5.4 -- 5.4 -- -- -- -- -- -- -- -- -- 13.2 Dec-14NCREIF CEVA 1Q Lag - NET 2.8 -- 2.8 -- 15.1 -- -- -- -- -- -- -- 14.6 Dec-14
Patron Capital V - Net 1,318,057 -0.6 -- -0.6 -- -- -- -- -- -- -- -- -- -10.7 Jan-16NCREIF CEVA 1Q Lag - NET 2.8 -- 2.8 -- 15.1 -- -- -- -- -- -- -- 13.8 Jan-16
UBS Trumbull Property - Net 41,496,327 0.9 -- 0.9 -- 8.9 -- 9.0 -- 10.5 -- 4.5 -- 7.6 Mar-99NCREIF ODCE net 1.9 -- 1.9 -- 11.1 -- 11.6 -- 13.2 -- 7.6 -- 10.3 Mar-99
Infrastructure - Net 6,640,794 0.6 -- 0.6 -- -- -- -- -- -- -- -- -- 0.0 Dec-14S&P Global Infrastructure 7.9 -- 7.9 -- -- -- -- -- -- -- -- -- 8.9 Dec-14KKR Global II - Net 4,203,232 2.7 -- 2.7 -- -- -- -- -- -- -- -- -- 6.3 Dec-14North Haven Infrastructure II - Net 2,437,562 -2.7 -- -2.7 -- -- -- -- -- -- -- -- -- -3.9 May-15
S&P Global Infrastructure 7.9 -- 7.9 -- -- -- -- -- -- -- -- -- 10.1 May-15Natural Resources - Net 3,675,406 5.4 -- 5.4 -- -- -- -- -- -- -- -- -- 30.1 Sep-15
S&P Global Natural Resources 2.9 -- 2.9 -- -- -- -- -- -- -- -- -- 7.6 Sep-15GSO Energy Opportunities - Net 1,710,151 3.6 -- 3.6 -- -- -- -- -- -- -- -- -- 28.9 Nov-15Taurus Mining - Net 1,531,977 2.0 -- 2.0 -- -- -- -- -- -- -- -- -- 30.2 Sep-15Taurus Mining Annex - Net 433,278 39.0 -- 39.0 -- -- -- -- -- -- -- -- -- 39.0 Jan-17
S&P Global Natural Resources 2.9 -- 2.9 -- -- -- -- -- -- -- -- -- -1.5 Jan-17Cash - Gross 53,409,659 0.1 -- 0.1 -- 0.5 -- 0.5 -- 1.0 -- 4.6 -- 4.4 Sep-03Treasury Cash - Gross 3,543,668 -- -- -- -- -- -- -- -- -- -- -- -- -- Sep-11
XXXXX
Total FundPerformance Summary (Gross of Fees) Period Ending: March 31, 2017
4
5
1
1
Merced County Employees’ Retirement Association 16
Market Value($)
3 Mo(%)
YTD(%)
3 Yrs(%)
5 Yrs(%)
7 Yrs(%)
10 Yrs(%)
_
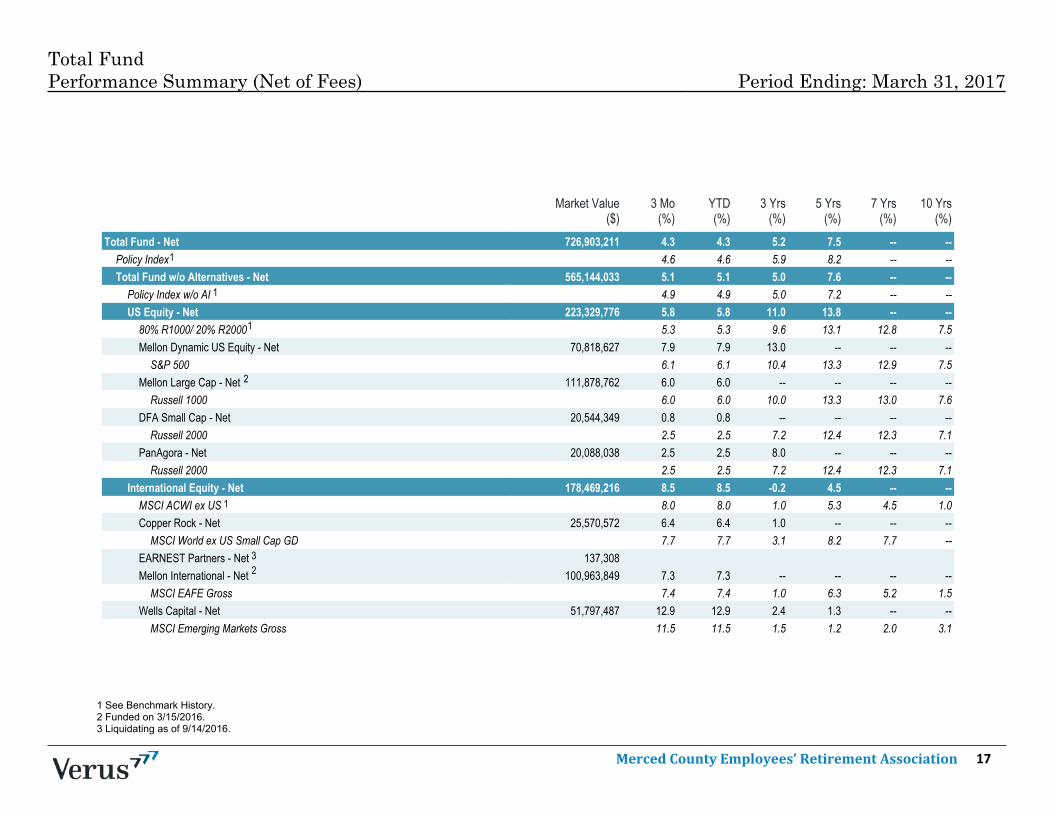
Total Fund - Net 726,903,211 4.3 4.3 5.2 7.5 -- --Policy Index 4.6 4.6 5.9 8.2 -- --Total Fund w/o Alternatives - Net 565,144,033 5.1 5.1 5.0 7.6 -- --
Policy Index w/o AI 4.9 4.9 5.0 7.2 -- --US Equity - Net 223,329,776 5.8 5.8 11.0 13.8 -- --
80% R1000/ 20% R2000 5.3 5.3 9.6 13.1 12.8 7.5Mellon Dynamic US Equity - Net 70,818,627 7.9 7.9 13.0 -- -- --
S&P 500 6.1 6.1 10.4 13.3 12.9 7.5Mellon Large Cap - Net 111,878,762 6.0 6.0 -- -- -- --
Russell 1000 6.0 6.0 10.0 13.3 13.0 7.6DFA Small Cap - Net 20,544,349 0.8 0.8 -- -- -- --
Russell 2000 2.5 2.5 7.2 12.4 12.3 7.1PanAgora - Net 20,088,038 2.5 2.5 8.0 -- -- --
Russell 2000 2.5 2.5 7.2 12.4 12.3 7.1International Equity - Net 178,469,216 8.5 8.5 -0.2 4.5 -- --
MSCI ACWI ex US 8.0 8.0 1.0 5.3 4.5 1.0Copper Rock - Net 25,570,572 6.4 6.4 1.0 -- -- --
MSCI World ex US Small Cap GD 7.7 7.7 3.1 8.2 7.7 --EARNEST Partners - Net 137,308Mellon International - Net 100,963,849 7.3 7.3 -- -- -- --
MSCI EAFE Gross 7.4 7.4 1.0 6.3 5.2 1.5Wells Capital - Net 51,797,487 12.9 12.9 2.4 1.3 -- --
MSCI Emerging Markets Gross 11.5 11.5 1.5 1.2 2.0 3.1
Total FundPerformance Summary (Net of Fees) Period Ending: March 31, 2017
1 See Benchmark History.2 Funded on 3/15/2016.3 Liquidating as of 9/14/2016.
1
2
1
32
1
1
Merced County Employees’ Retirement Association 17
Total FundPerformance Summary (Net of Fees) Period Ending: March 31, 2017
Market Value($)
3 Mo(%)
YTD(%)
3 Yrs(%)
5 Yrs(%)
7 Yrs(%)
10 Yrs(%)
_
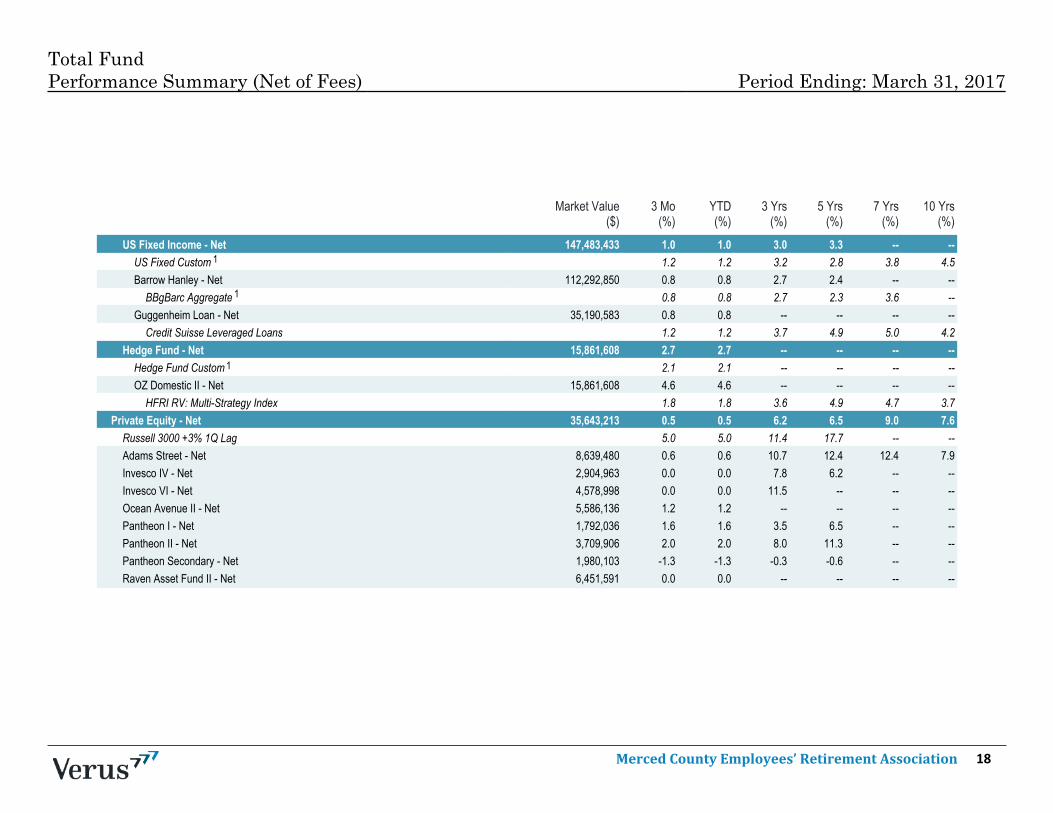
US Fixed Income - Net 147,483,433 1.0 1.0 3.0 3.3 -- --US Fixed Custom 1.2 1.2 3.2 2.8 3.8 4.5Barrow Hanley - Net 112,292,850 0.8 0.8 2.7 2.4 -- --
BBgBarc Aggregate 0.8 0.8 2.7 2.3 3.6 --Guggenheim Loan - Net 35,190,583 0.8 0.8 -- -- -- --
Credit Suisse Leveraged Loans 1.2 1.2 3.7 4.9 5.0 4.2Hedge Fund - Net 15,861,608 2.7 2.7 -- -- -- --
Hedge Fund Custom 2.1 2.1 -- -- -- --OZ Domestic II - Net 15,861,608 4.6 4.6 -- -- -- --
HFRI RV: Multi-Strategy Index 1.8 1.8 3.6 4.9 4.7 3.7Private Equity - Net 35,643,213 0.5 0.5 6.2 6.5 9.0 7.6
Russell 3000 +3% 1Q Lag 5.0 5.0 11.4 17.7 -- --Adams Street - Net 8,639,480 0.6 0.6 10.7 12.4 12.4 7.9Invesco IV - Net 2,904,963 0.0 0.0 7.8 6.2 -- --Invesco VI - Net 4,578,998 0.0 0.0 11.5 -- -- --Ocean Avenue II - Net 5,586,136 1.2 1.2 -- -- -- --Pantheon I - Net 1,792,036 1.6 1.6 3.5 6.5 -- --Pantheon II - Net 3,709,906 2.0 2.0 8.0 11.3 -- --Pantheon Secondary - Net 1,980,103 -1.3 -1.3 -0.3 -0.6 -- --Raven Asset Fund II - Net 6,451,591 0.0 0.0 -- -- -- --
1
1
1
Merced County Employees’ Retirement Association 18

4 Funded on 1/22/2016.5 Funded on 1/31/2017.
Total FundPerformance Summary (Net of Fees) Period Ending: March 31, 2017
Market Value($)
3 Mo(%)
YTD(%)
3 Yrs(%)
5 Yrs(%)
7 Yrs(%)
10 Yrs(%)
_
Real Assets - Net 69,162,638 2.1 2.1 7.7 8.3 -- --Real Asset Custom 3.4 3.4 -- -- -- --Real Estate - Net 58,846,438 2.0 2.0 7.8 8.3 -- --
NCREIF ODCE net 1.9 1.9 10.8 11.4 12.7 --BlackRock RE - Net 4,000,308 5.0 5.0 -- -- -- --
FTSE NAREIT Developed ex US Gross 4.9 4.9 2.6 6.5 6.3 -0.2Greenfield Gap VII - Net 12,031,746 5.4 5.4 -- -- -- --
NCREIF CEVA 1Q Lag - NET 2.8 2.8 15.1 -- -- --Patron Capital V - Net 1,318,057 -0.6 -0.6 -- -- -- --
NCREIF CEVA 1Q Lag - NET 2.8 2.8 15.1 -- -- --UBS Trumbull Property - Net 41,496,327 0.9 0.9 8.9 9.0 -- --
NCREIF ODCE net 1.9 1.9 11.1 11.6 13.2 7.6Infrastructure - Net 6,640,794 0.6 0.6 -- -- -- --
S&P Global Infrastructure 7.9 7.9 -- -- -- --KKR Global II - Net 4,203,232 2.7 2.7 -- -- -- --North Haven Infrastructure II - Net 2,437,562 -2.7 -2.7 -- -- -- --
S&P Global Infrastructure 7.9 7.9 -- -- -- --Natural Resources - Net 3,675,406 5.4 5.4 -- -- -- --
S&P Global Natural Resources 2.9 2.9 -- -- -- --GSO Energy Opportunities - Net 1,710,151 3.6 3.6 -- -- -- --Taurus Mining - Net 1,531,977 2.0 2.0 -- -- -- --Taurus Mining Annex - Net 433,278 39.0 39.0 -- -- -- --
S&P Global Natural Resources 2.9 2.9 -- -- -- --Cash - Net 53,409,659 0.1 0.1 0.5 0.5 -- --Treasury Cash - Net 3,543,668 -- -- -- -- -- --
1
1
5
1
1
4
Merced County Employees’ Retirement Association 19

Total FundAsset Allocation Analysis Period Ending: March 31, 2017
Current %US Equity $223,329,776 30.7%International Equity $126,671,729 17.4%Emerging Market Equity $51,797,487 7.1%US Fixed Income $112,292,850 15.4%Bank Loan $35,190,583 4.8%Hedge Fund $15,861,608 2.2%Real Estate $58,846,438 8.1%Private Equity $35,643,213 4.9%Real Assets $10,316,200 1.4%Cash $56,953,327 7.8%Total $726,903,211 100.0%
Current Policy DifferenceUS Equity 30.7% 27.0% 3.7%International Equity 17.4% 16.0% 1.4%Emerging Market Equity 7.1% 7.0% 0.1%US Fixed Income 15.4% 17.0% -1.6%Bank Loan 4.8% 5.0% -0.2%Hedge Fund 2.2% 5.0% -2.8%Real Estate 8.1% 8.0% 0.1%Private Equity 4.9% 9.0% -4.1%Real Assets 1.4% 6.0% -4.6%Cash 7.8% -- 7.8%Total 100.0% 100.0%
Merced County Employees’ Retirement Association 20

Total FundManager Allocation Analysis Period Ending: March 31, 2017
Actual Actual_
Adams Street $8,639,480 1.2%Barrow Hanley $112,292,850 15.4%BlackRock RE $4,000,308 0.6%Cash $53,409,659 7.3%Copper Rock $25,570,572 3.5%DFA Small Cap $20,544,349 2.8%EARNEST Partners $137,308 0.0%Greenfield Gap VII $12,031,746 1.7%GSO Energy Opportunities $1,710,151 0.2%Guggenheim Loan $35,190,583 4.8%Invesco IV $2,904,963 0.4%Invesco VI $4,578,998 0.6%KKR Global II $4,203,232 0.6%Mellon Dynamic US Equity $70,818,627 9.7%Mellon International $100,963,849 13.9%Mellon Large Cap $111,878,762 15.4%North Haven Infrastructure II $2,437,562 0.3%Ocean Avenue II $5,586,136 0.8%OZ Domestic II $15,861,608 2.2%PanAgora $20,088,038 2.8%Pantheon I $1,792,036 0.2%Pantheon II $3,709,906 0.5%Pantheon Secondary $1,980,103 0.3%Patron Capital V $1,318,057 0.2%Raven Asset Fund II $6,451,591 0.9%Taurus Mining $1,531,977 0.2%Taurus Mining Annex $433,278 0.1%Treasury Cash $3,543,668 0.5%UBS Trumbull Property $41,496,327 5.7%Wells Capital $51,797,487 7.1%Total $726,903,211 100.0%
_
Merced County Employees’ Retirement Association 21

Total FundRisk vs. Return (3 Years) Period Ending: March 31, 2017
AnlzdReturn
AnlzdReturnRank
AnlzdStandardDeviation
AnlzdStandardDeviation
Rank
SharpeRatio
SharpeRatioRank
_
Total Fund 5.6% 40 5.2% 3 1.0 4
Policy Index 5.9% 25 5.2% 3 1.1 2
InvestorForce Public DB$250mm-$1B Gross Median 5.4% -- 6.4% -- 0.8 --
XXXXX
Merced County Employees’ Retirement Association 22

Total FundRisk vs. Return (5 Years) Period Ending: March 31, 2017
AnlzdReturn
AnlzdReturnRank
AnlzdStandardDeviation
AnlzdStandardDeviation
Rank
SharpeRatio
SharpeRatioRank
_
Total Fund 7.9% 47 5.6% 7 1.4 4
Policy Index 8.2% 32 5.2% 4 1.5 2
InvestorForce Public DB$250mm-$1B Gross Median 7.8% -- 6.5% -- 1.2 --
XXXXX
Merced County Employees’ Retirement Association 23

Total FundPeer Universe Comparison Period Ending: March 31, 2017
Merced County Employees’ Retirement Association 24

Attribution SummaryWtd. Actual
ReturnWtd. Index
ReturnExcessReturn
SelectionEffect
AllocationEffect
InteractionEffects
TotalEffects
US Equity 3.15% 2.79% 0.37% 0.10% 0.02% 0.01% 0.13%International Equity -0.60% -0.40% -0.19% -0.05% -0.02% 0.00% -0.07%US Fixed Income 2.64% 2.93% -0.28% -0.08% -0.02% 0.01% -0.10%Hedge Fund -0.22% 1.02% -1.24% -0.06% 0.00% 0.00% -0.05%Private Equity -0.16% 1.81% -1.97% -0.14% 0.00% 0.02% -0.11%Real Estate 1.57% 1.91% -0.34% -0.03% 0.00% 0.00% -0.03%Total 1.62% 1.86% -0.24% -0.24% -0.03% 0.03% -0.24%
Total FundPerformance Attribution Period Ending: March 31, 2017
Merced County Employees’ Retirement Association 25
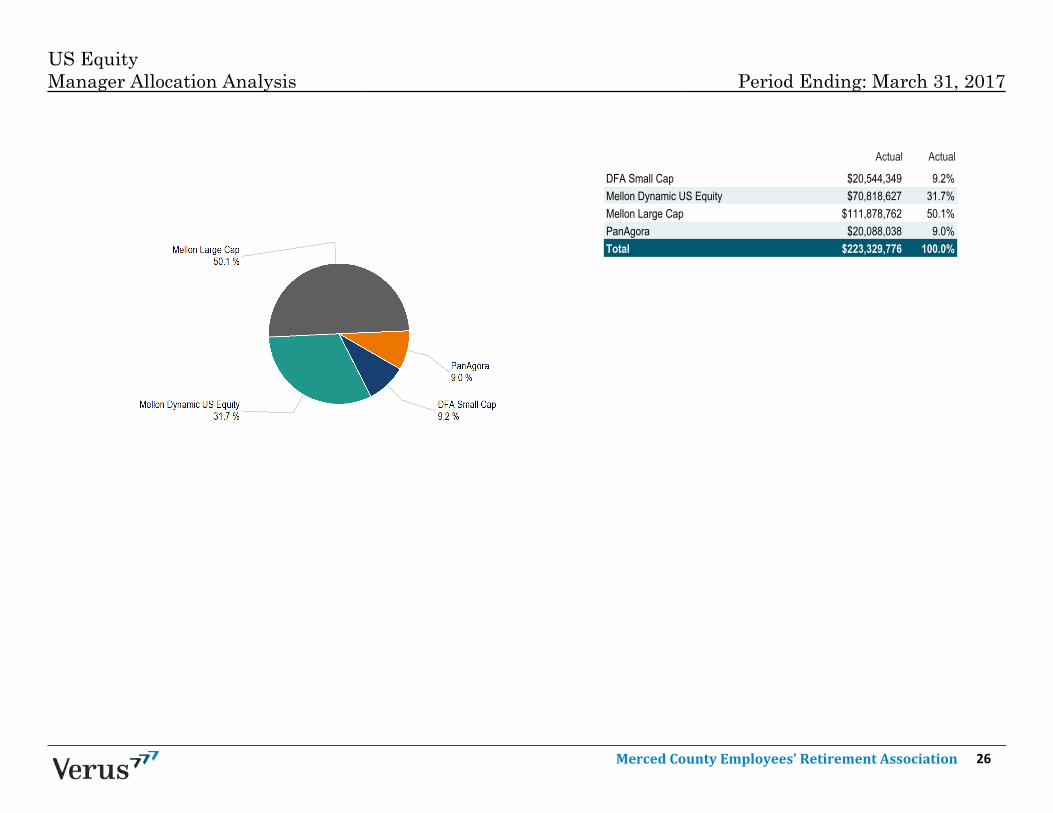
US EquityManager Allocation Analysis Period Ending: March 31, 2017
Actual Actual_
DFA Small Cap $20,544,349 9.2%Mellon Dynamic US Equity $70,818,627 31.7%Mellon Large Cap $111,878,762 50.1%PanAgora $20,088,038 9.0%Total $223,329,776 100.0%
_
Merced County Employees’ Retirement Association 26

US EquityRisk vs. Return (3 Years) Period Ending: March 31, 2017
AnlzdReturn
AnlzdReturnRank
AnlzdStandardDeviation
AnlzdStandardDeviation
Rank
SharpeRatio
SharpeRatioRank
_
US Equity 11.2% 2 7.9% 1 1.4 1
80% R1000/ 20% R2000 9.6% 38 8.0% 1 1.2 1
InvestorForce All DB US EqGross Median 9.2% -- 10.9% -- 0.8 --
XXXXX
Merced County Employees’ Retirement Association 27

US EquityRisk vs. Return (5 Years) Period Ending: March 31, 2017
AnlzdReturn
AnlzdReturnRank
AnlzdStandardDeviation
AnlzdStandardDeviation
Rank
SharpeRatio
SharpeRatioRank
_
US Equity 14.0% 5 9.0% 1 1.5 1
80% R1000/ 20% R2000 13.1% 39 8.8% 1 1.5 1
InvestorForce All DB US EqGross Median 12.8% -- 10.7% -- 1.2 --
XXXXX
Merced County Employees’ Retirement Association 28

US EquityPeer Universe Comparison Period Ending: March 31, 2017
Merced County Employees’ Retirement Association 29

Top HoldingsAPPLE 2.9%MICROSOFT 1.9%AMAZON.COM 1.3%EXXON MOBIL 1.3%JOHNSON & JOHNSON 1.3%FACEBOOK CLASS A 1.2%JP MORGAN CHASE & CO. 1.2%BERKSHIRE HATHAWAY 'B' 1.2%GENERAL ELECTRIC 1.0%AT&T 0.9%
Worst PerformersReturn %
_
HHGREGG (HGGGQ) -91.3%GULFMARK OFFSHORE 'A' (GLFM) -80.0%RENTECH (RTK) -79.8%ADEPTUS HEALTH CL.A (ADPTQ) -76.4%SPANISH BCAST.SY.'A' -75.8%EMERGENT CAPITAL (EMGC) -73.6%CUMULUS MDA.'A' (CMLS) -68.5%TIDEWATER (TDW) -66.3%VINCE HOLDING -61.7%INVENTURE FOODS -55.1%
_
US EquityEquity Only Summary Statistics Period Ending: March 31, 2017
CharacteristicsPortfolio Russell 3000
Number of Holdings 2,790 2,943Weighted Avg. Market Cap. ($B) 115.0 127.3Median Market Cap. ($B) 2.3 1.6Price To Earnings 24.6 23.8Price To Book 4.5 4.1Price To Sales 3.4 3.4Return on Equity (%) 19.6 16.8Yield (%) 1.8 1.9Beta (holdings; domestic) 1.1 1.0
Best PerformersReturn %
_
PULMATRIX 491.5%INTERNAP 141.6%APPLIED OPTOELECTRONICS 139.5%NEWLINK GENETICS 134.4%LANTRONIX 128.2%TETRAPHASE PHARMS. 128.0%EVERI HOLDINGS (EVRI) 120.7%ASSEMBLY BIOSCIENCES (ASMB) 109.8%BROADWIND ENERGY 105.9%TEXTAINER GROUP HOLDINGS 105.4%
_
Merced County Employees’ Retirement Association 30

US EquityEquity Sector Attribution Period Ending: March 31, 2017
US Equity Performance Attribution vs. Russell 3000Attribution Effects Returns Sector Weights
Total Selection Allocation InteractionEffects Effect Effect Effects Portfolio Benchmark Portfolio Benchmark
_
Energy 0.0% -0.1% 0.0% 0.0% -7.8% -6.9% 6.7% 6.9%Materials 0.0% 0.0% 0.0% 0.0% 6.2% 6.5% 3.6% 3.4%Industrials 0.0% 0.0% 0.0% 0.0% 3.8% 4.1% 11.7% 10.9%Consumer Discretionary -0.2% -0.2% 0.0% 0.0% 6.5% 7.8% 12.9% 12.5%Consumer Staples 0.0% 0.0% 0.0% 0.0% 5.6% 5.9% 8.0% 8.4%Health Care 0.0% 0.0% 0.0% 0.0% 9.2% 8.8% 12.7% 12.9%Financials -0.1% -0.1% 0.0% 0.0% 1.7% 2.2% 16.2% 15.5%Information Technology -0.1% -0.1% 0.0% 0.0% 11.4% 11.9% 19.2% 19.9%Telecommunication Services 0.0% 0.0% 0.0% 0.0% -3.6% -3.5% 2.3% 2.4%Utilities 0.0% 0.0% 0.0% 0.0% 6.3% 6.1% 3.3% 3.2%Real Estate 0.0% 0.0% 0.0% 0.0% 3.0% 2.9% 3.4% 4.1%Cash 0.0% 0.0% 0.0% 0.0% 0.1% -- 0.1% 0.0%Portfolio -0.4% = -0.4% + 0.0% + 0.0% 5.3% 5.8% 100.0% 100.0%
_
Merced County Employees’ Retirement Association 31

US EquityReturn Based Style Analysis (3 Years) Period Ending: March 31, 2017
Merced County Employees’ Retirement Association 32

Large Cap Core EquityPeer Universe Comparison Period Ending: March 31, 2017
Merced County Employees’ Retirement Association 33

Worst PerformersReturn %
_
FRONTIER COMMUNICATIONS (FTR) -34.1%ENDO INTERNATIONAL (ENDP) -32.2%UNDER ARMOUR 'A' (UAA) -31.9%L BRANDS -27.7%UNDER ARMOUR CL C ORD -27.3%SIGNET JEWELERS (SIG) -26.3%SOUTHWESTERN ENERGY (SWN) -24.5%TARGET (TGT) -22.9%HESS -22.2%PERRIGO (PRGO) -20.1%
_
Mellon Dynamic US EquityEquity Only Summary Statistics Period Ending: March 31, 2017
Best PerformersReturn %
_
NRG ENERGY (NRG) 52.8%VERTEX PHARMS. 48.4%ALCOA (ARNC) 42.4%ACTIVISION BLIZZARD (ATVI) 38.9%VIACOM 'B' 33.4%INCYTE 33.3%ILLUMINA 33.3%WYNN RESORTS (WYNN) 33.2%MICRON TECHNOLOGY (MU) 31.8%IDEXX LABORATORIES 31.8%
_
Top HoldingsAPPLE 3.7%MICROSOFT 2.5%AMAZON.COM 1.7%EXXON MOBIL 1.7%JOHNSON & JOHNSON 1.7%FACEBOOK CLASS A 1.6%BERKSHIRE HATHAWAY 'B' 1.6%JP MORGAN CHASE & CO. 1.5%GENERAL ELECTRIC 1.3%AT&T 1.3%
CharacteristicsPortfolio S&P 500
Number of Holdings 510 505Weighted Avg. Market Cap. ($B) 151.4 151.4Median Market Cap. ($B) 19.9 19.9Price To Earnings 24.6 23.7Price To Book 4.9 4.4Price To Sales 3.6 3.3Return on Equity (%) 21.0 18.8Yield (%) 2.0 2.0Beta (holdings; domestic) 1.0 1.0
Merced County Employees’ Retirement Association 34

Large Cap EquityPeer Universe Comparison Period Ending: March 31, 2017
Merced County Employees’ Retirement Association 35

Mellon Large CapEquity Only Summary Statistics Period Ending: March 31, 2017
Best PerformersReturn %
_
NRG ENERGY (NRG) 52.8%VERTEX PHARMS. 48.4%ALCOA (ARNC) 42.4%DEXCOM 41.9%AGIOS PHARMACEUTICALS (AGIO) 39.9%CLEAR CHL.OUTDR.HDG.'A' (CCO) 39.9%ACTIVISION BLIZZARD (ATVI) 38.9%ALNYLAM PHARMACEUTICALS 36.9%ARISTA NETWORKS 36.7%VIACOM 'B' 33.4%
_
Worst PerformersReturn %
_
RITE AID (RAD) -48.4%VISTA OUTDOOR -44.2%FRONTIER COMMUNICATIONS -34.1%ENDO INTERNATIONAL (ENDP) -32.2%AMTRUST FINL.SVS. -32.0%TEMPUR SEALY INTL. (TPX) -32.0%UNDER ARMOUR 'A' -31.9%QEP RESOURCES -31.0%SM ENERGY (SM) -30.3%NUTANIX ORD (NTNX) -29.3%
_
Top HoldingsAPPLE 3.5%MICROSOFT 2.2%AMAZON.COM 1.5%JOHNSON & JOHNSON 1.5%EXXON MOBIL 1.5%JP MORGAN CHASE & CO. 1.4%FACEBOOK CLASS A 1.4%BERKSHIRE HATHAWAY 'B' 1.4%GENERAL ELECTRIC 1.2%AT&T 1.1%
CharacteristicsPortfolio Russell 1000
Number of Holdings 1,001 997Weighted Avg. Market Cap. ($B) 137.6 137.7Median Market Cap. ($B) 8.8 8.8Price To Earnings 24.6 23.7Price To Book 4.9 4.4Price To Sales 3.6 3.5Return on Equity (%) 20.5 17.9Yield (%) 2.0 2.0Beta (holdings; domestic) 1.0 1.0
Merced County Employees’ Retirement Association 36

Mellon Large CapEquity Sector Attribution Period Ending: March 31, 2017
Mellon Large Cap Performance Attribution vs. Russell 1000Attribution Effects Returns Sector Weights
Total Selection Allocation InteractionEffects Effect Effect Effects Portfolio Benchmark Portfolio Benchmark
_
Energy 0.0% 0.0% 0.0% 0.0% -6.7% -6.7% 7.1% 7.1%Materials 0.0% 0.0% 0.0% 0.0% 6.6% 6.6% 3.3% 3.3%Industrials 0.0% 0.0% 0.0% 0.0% 4.4% 4.4% 10.6% 10.6%Consumer Discretionary 0.0% 0.0% 0.0% 0.0% 8.4% 8.4% 12.5% 12.5%Consumer Staples 0.0% 0.0% 0.0% 0.0% 6.1% 6.1% 8.8% 8.8%Health Care 0.0% 0.0% 0.0% 0.0% 8.6% 8.6% 13.0% 13.0%Financials 0.0% 0.0% 0.0% 0.0% 2.6% 2.6% 15.1% 15.1%Information Technology 0.0% 0.0% 0.0% 0.0% 12.3% 12.3% 20.2% 20.2%Telecommunication Services 0.0% 0.0% 0.0% 0.0% -3.0% -3.4% 2.6% 2.5%Utilities 0.0% 0.0% 0.0% 0.0% 6.3% 6.3% 3.1% 3.1%Real Estate 0.0% 0.0% 0.0% 0.0% 3.2% 3.4% 3.7% 3.7%Cash 0.0% -- -- -- -- -- 0.0% 0.0%Portfolio 0.0% = 0.0% + 0.0% + 0.0% 6.0% 6.0% 100.0% 100.0%
_
Merced County Employees’ Retirement Association 37

Small Cap EquityPeer Universe Comparison Period Ending: March 31, 2017
Merced County Employees’ Retirement Association 38

DFA Small CapEquity Only Summary Statistics Period Ending: March 31, 2017
Worst PerformersReturn %
_
HHGREGG (HGGGQ) -91.3%GULFMARK OFFSHORE 'A' (GLFM) -80.0%RENTECH (RTK) -79.8%ADEPTUS HEALTH CL.A (ADPTQ) -76.4%SPANISH BCAST.SY.'A' -75.8%EMERGENT CAPITAL (EMGC) -73.6%CUMULUS MDA.'A' (CMLS) -68.5%TIDEWATER -66.3%VINCE HOLDING (VNCE) -61.7%INVENTURE FOODS (SNAK) -55.1%
_
Best PerformersReturn %
_
PULMATRIX 491.5%INTERNAP 141.6%APPLIED OPTOELECTRONICS 139.5%NEWLINK GENETICS 134.4%LANTRONIX 128.2%TETRAPHASE PHARMS. 128.0%EVERI HOLDINGS (EVRI) 120.7%ASSEMBLY BIOSCIENCES (ASMB) 109.8%BROADWIND ENERGY 105.9%TEXTAINER GROUP HOLDINGS (TGH) 105.4%
_
CharacteristicsPortfolio Russell 2000
Number of Holdings 1,821 1,946Weighted Avg. Market Cap. ($B) 2.2 2.2Median Market Cap. ($B) 0.7 0.8Price To Earnings 25.3 24.3Price To Book 3.0 3.0Price To Sales 2.4 3.1Return on Equity (%) 13.1 10.0Yield (%) 1.2 1.2Beta (holdings; domestic) 1.2 1.3
Top HoldingsSEABOARD 0.3%NATIONAL BEVERAGE 0.3%MASIMO 0.3%PRIVATEBANCORP 0.3%PRIMERICA 0.3%FNB 0.3%TEXAS CAPITAL BANCSHARES 0.3%COHERENT 0.3%WGL HOLDINGS 0.3%CANTEL MED. 0.2%
Merced County Employees’ Retirement Association 39

DFA Small CapEquity Sector Attribution Period Ending: March 31, 2017
DFA Small Cap Performance Attribution vs. Russell 2000Attribution Effects Returns Sector Weights
Total Selection Allocation InteractionEffects Effect Effect Effects Portfolio Benchmark Portfolio Benchmark
_
Energy -0.1% 0.0% -0.1% 0.0% -10.3% -10.6% 4.4% 3.8%Materials -0.2% -0.2% 0.0% 0.0% 1.6% 6.0% 5.6% 4.9%Industrials 0.0% 0.0% -0.1% 0.0% 1.4% 1.1% 19.7% 14.6%Consumer Discretionary -0.2% -0.1% -0.1% 0.0% -0.4% 0.8% 15.8% 12.4%Consumer Staples 0.1% 0.1% -0.1% 0.1% 3.1% -1.3% 5.0% 3.0%Health Care -0.9% -0.7% -0.4% 0.2% 5.6% 11.7% 7.8% 11.9%Financials -0.3% -0.2% 0.0% 0.0% -2.5% -1.5% 21.5% 20.4%Information Technology -0.3% -0.3% -0.1% 0.0% 4.5% 6.1% 14.6% 16.8%Telecommunication Services 0.0% 0.0% 0.0% 0.0% -4.0% -4.3% 1.0% 0.7%Utilities 0.0% 0.0% 0.0% 0.0% 4.4% 4.7% 3.9% 3.6%Real Estate 0.2% 0.2% 0.2% -0.2% 2.6% 0.1% 0.7% 7.8%Cash 0.0% -- -- -- -- -- 0.0% 0.0%Portfolio -1.7% = -1.2% + -0.6% + 0.1% 0.7% 2.4% 100.0% 100.0%
_
Merced County Employees’ Retirement Association 40

DFA Small CapReturn Based Style Analysis (3 Years) Period Ending: March 31, 2017
Merced County Employees’ Retirement Association 41

Small Cap EquityPeer Universe Comparison Period Ending: March 31, 2017
Merced County Employees’ Retirement Association 42

CharacteristicsPortfolio Russell 2000
Number of Holdings 286 1,946Weighted Avg. Market Cap. ($B) 1.9 2.2Median Market Cap. ($B) 0.8 0.8Price To Earnings 23.9 24.3Price To Book 3.6 3.0Price To Sales 3.1 3.1Return on Equity (%) 16.7 10.0Yield (%) 1.2 1.2Beta (holdings; domestic) 1.3 1.3
Top HoldingsCHEMOURS 1.6%NEKTAR THERAPEUTICS 1.4%TENNECO 1.4%BLACK HILLS 1.3%MEDICINES COMPANY 1.3%JACK IN THE BOX 1.3%PNM RESOURCES 1.3%LOGMEIN 1.2%DUPONT FABROS TECHNOLOGY 1.2%EVERCORE PARTNERS 'A' 1.2%
Worst PerformersReturn %
_
JONES ENERGY CLASS A -44.5%HORIZON GLOBAL (HZN) -42.2%GENESIS HEALTHCARE 'A' (GEN) -37.9%DHI GROUP -36.8%BILL BARRETT -34.9%ARC DOCUMENT SOLUTIONS -32.1%DAWSON GEOPHYSICAL (DWSN) -30.8%IDT 'B' (IDT) -30.4%DEPOMED (DEPO) -30.4%DENBURY RES. (DNR) -29.9%
_
Best PerformersReturn %
_
NEKTAR THERAPEUTICS 91.3%IMMUNOGEN 89.7%IMMUNOMEDICS 76.3%CHEMOURS 74.4%NUTRISYSTEM 60.7%EVOLENT HEALTH CL.A 50.7%DYNAVAX TECHNOLOGIES (DVAX) 50.6%COHERENT (COHR) 49.7%ORASURE TECHS. 47.3%SPECTRUM PHARMS. (SPPI) 46.7%
_
PanAgoraEquity Only Summary Statistics Period Ending: March 31, 2017
Merced County Employees’ Retirement Association 43

PanAgoraEquity Sector Attribution Period Ending: March 31, 2017
PanAgora Performance Attribution vs. Russell 2000Attribution Effects Returns Sector Weights
Total Selection Allocation InteractionEffects Effect Effect Effects Portfolio Benchmark Portfolio Benchmark
_
Energy -0.5% -0.4% 0.0% 0.0% -20.9% -10.6% 4.1% 3.8%Materials 0.2% 0.2% 0.0% 0.0% 9.4% 6.0% 5.8% 4.9%Industrials 0.4% 0.4% 0.0% 0.0% 3.6% 1.1% 14.0% 14.6%Consumer Discretionary -0.1% 0.0% 0.0% 0.0% 0.6% 0.8% 15.1% 12.4%Consumer Staples -0.1% -0.2% 0.0% 0.0% -7.2% -1.3% 2.4% 3.0%Health Care 0.9% 0.7% 0.1% 0.1% 17.6% 11.7% 13.1% 11.9%Financials 0.4% 0.4% 0.0% 0.0% 0.4% -1.5% 20.6% 20.4%Information Technology 0.0% 0.1% -0.1% 0.0% 6.7% 6.1% 14.2% 16.8%Telecommunication Services 0.0% -0.1% 0.0% 0.0% -12.4% -4.3% 0.7% 0.7%Utilities 0.1% 0.2% 0.0% 0.0% 8.9% 4.7% 3.5% 3.6%Real Estate 0.1% 0.1% 0.0% 0.0% 1.4% 0.1% 5.8% 7.8%Cash 0.0% 0.0% 0.0% 0.0% 0.1% -- 0.8% 0.0%Portfolio 1.4% = 1.3% + 0.0% + 0.0% 3.8% 2.4% 100.0% 100.0%
_
Merced County Employees’ Retirement Association 44

PanAgoraReturn Based Style Analysis (3 Years) Period Ending: March 31, 2017
Merced County Employees’ Retirement Association 45

International EquityManager Allocation Analysis Period Ending: March 31, 2017
Actual Actual_
Copper Rock $25,570,572 14.3%EARNEST Partners $137,308 0.1%Mellon International $100,963,849 56.6%Wells Capital $51,797,487 29.0%Total $178,469,216 100.0%
_
Merced County Employees’ Retirement Association 46
AnlzdReturn
AnlzdReturnRank
AnlzdStandardDeviation
AnlzdStandardDeviation
Rank
SharpeRatio
SharpeRatioRank
_
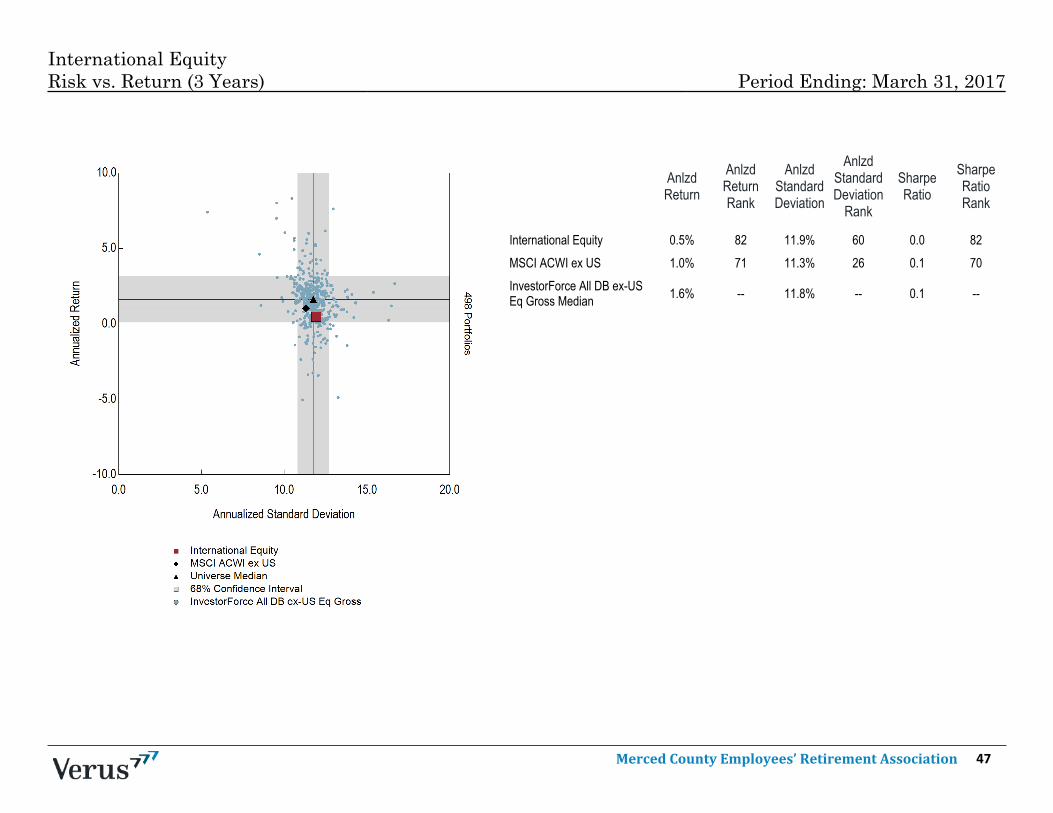
International Equity 0.5% 82 11.9% 60 0.0 82
MSCI ACWI ex US 1.0% 71 11.3% 26 0.1 70
InvestorForce All DB ex-USEq Gross Median 1.6% -- 11.8% -- 0.1 --
XXXXX
International EquityRisk vs. Return (3 Years) Period Ending: March 31, 2017
Merced County Employees’ Retirement Association 47

AnlzdReturn
AnlzdReturnRank
AnlzdStandardDeviation
AnlzdStandardDeviation
Rank
SharpeRatio
SharpeRatioRank
_
International Equity 5.2% 61 12.0% 18 0.4 54
MSCI ACWI ex US 5.3% 60 11.3% 4 0.5 44
InvestorForce All DB ex-USEq Gross Median 5.6% -- 12.5% -- 0.4 --
XXXXX
International EquityRisk vs. Return (5 Years) Period Ending: March 31, 2017
Merced County Employees’ Retirement Association 48
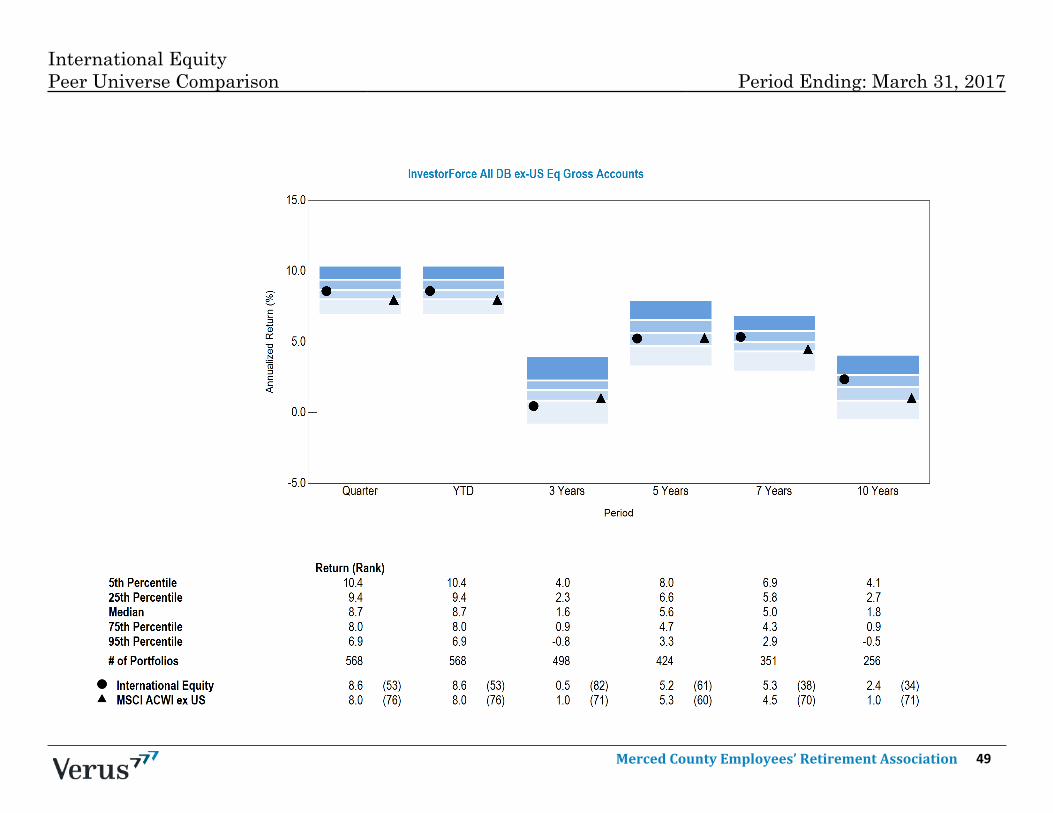
International EquityPeer Universe Comparison Period Ending: March 31, 2017
Merced County Employees’ Retirement Association 49

International EquityEquity Only Summary Statistics Period Ending: March 31, 2017
Best PerformersReturn %
_
SHARP (J:SH@N) 82.2%MOBILEYE (MBLY) 61.1%ULVAC 51.7%NEW ORIENTAL ED.& TECH. GP.ADS 1:1 43.4%YANGZIJIANG SHIPBUILDING(HOLDINGS) (T:YSHL) 43.4%
RUMO LOG.OPD.MULTIMODAL (BR:P3M) 42.7%BLUESCOPE STEEL (OTC) 42.7%MINEBEA 42.5%INTERPUMP GROUP 42.2%WHEELOCK AND CO. 40.4%
_
Top HoldingsSAMSUNG ELECTRONICS 1.7%NESTLE 'R' 1.1%TAIWAN SEMICON.SPN.ADR 1:5 0.9%CHINA MOBILE 0.9%AIA GROUP 0.8%ROCHE HOLDING 0.8%NOVARTIS 'R' 0.7%HSBC HDG. (ORD $0.50) 0.7%HDFC BANK ADR 1:3 0.7%CHINA LIFE INSURANCE 'H' 0.7%
Worst PerformersReturn %
_
SALMAR -28.1%ARYZTA (S:ARYN) -25.7%AURELIUS -25.1%BAKKAFROST (N:BAKK) -22.4%RPC GROUP -20.4%ASICS -19.8%SAIPEM (I:SPM) -19.4%BRAMBLES (A:BXBX) -19.3%FLETCHER BUILDING (Z:FBUZ) -19.0%IIDA GROUP HOLDINGS (J:IIGH) -18.0%
_
Characteristics
Portfolio MSCI ACWI ex USAGross
Number of Holdings 1,118 1,853Weighted Avg. Market Cap. ($B) 46.7 53.1Median Market Cap. ($B) 8.6 7.3Price To Earnings 22.3 20.7Price To Book 3.3 2.5Price To Sales 2.5 2.1Return on Equity (%) 15.7 13.2Yield (%) 2.6 2.9Beta (holdings; global) 1.1 1.0
Merced County Employees’ Retirement Association 50

EAFE Small Cap EquityPeer Universe Comparison Period Ending: March 31, 2017
Merced County Employees’ Retirement Association 51

Copper RockEquity Only Summary Statistics Period Ending: March 31, 2017
Top HoldingsCEMBRA MONEY BANK N ORD 2.5%IPSEN 2.2%RECORDATI INDUA.CHIMICA 1.9%TARKETT 1.7%AZBIL 1.7%INTRUM JUSTITIA 1.7%DIASORIN 1.6%ULVAC 1.6%OPTIMAL PAYMENTS 1.6%ALTEN 1.5%
Worst PerformersReturn %
_
SALMAR -28.1%AURELIUS -25.1%BAKKAFROST (N:BAKK) -22.4%RPC GROUP (UKIR:RPC) -20.4%TRAVELPORT WORLDWIDE (TVPT) -16.0%WHITECAP RESOURCES (C:WCP) -13.9%MARUICHI STEEL TUBE -11.5%RAGING RIVER EXPLORATION (C:RRX) -11.2%BILIA 'A' (W:BILI) -10.1%WIZZ AIR HOLDINGS (UKIR:WIZZ) -7.3%
_
Best PerformersReturn %
_
ULVAC 51.7%BLUESCOPE STEEL (OTC) 42.7%INTERPUMP GROUP 42.2%BANCA IFIS 40.1%IPSEN (F:IPN) 38.4%OPTIMAL PAYMENTS 27.4%KULICKE & SOFFA INDS. 27.4%DECHRA PHARMACEUTICALS 26.4%ASM INTERNATIONAL 25.1%GRAMMER 24.7%
_
Characteristics
Portfolio MSCI World ex USASmall Cap
Number of Holdings 90 2,442Weighted Avg. Market Cap. ($B) 3.1 2.3Median Market Cap. ($B) 2.5 1.0Price To Earnings 20.8 20.3Price To Book 3.1 2.4Price To Sales 2.0 2.1Return on Equity (%) 18.7 12.6Yield (%) 2.1 2.3Beta (holdings; global) 1.0 1.0
Merced County Employees’ Retirement Association 52

EAFE EquityPeer Universe Comparison Period Ending: March 31, 2017
Merced County Employees’ Retirement Association 53

Mellon InternationalEquity Only Summary Statistics Period Ending: March 31, 2017
Top HoldingsNESTLE 'R' 1.8%ROCHE HOLDING 1.4%NOVARTIS 'R' 1.3%HSBC HDG. (ORD $0.50) 1.3%TOYOTA MOTOR 1.1%BRITISH AMERICAN TOBACCO 1.0%COMMONWEALTH BK.OF AUS. 0.9%TOTAL 0.9%ROYAL DUTCH SHELL A(LON) 0.9%BP 0.8%
Best PerformersReturn %
_
SHARP 82.2%MOBILEYE 61.1%YANGZIJIANG SHIPBUILDING(HOLDINGS) 43.4%
MINEBEA (J:IA@N) 42.5%WHEELOCK AND CO. 40.4%SHANGRI-LA ASIA 38.1%STMICROELECTRONICS (PAR) 35.3%MIXI (J:MIXI) 33.7%RWE 33.3%AKZO NOBEL (H:AKZO) 32.7%
_
Worst PerformersReturn %
_
ARYZTA (S:ARYN) -25.7%ASICS (J:FD@N) -19.8%SAIPEM -19.4%BRAMBLES -19.3%FLETCHER BUILDING (Z:FBUZ) -19.0%IIDA GROUP HOLDINGS -18.0%COBHAM (UKIR:COB) -17.8%KAKAKU.COM (J:KAKA) -17.3%PEARSON (UKIR:PSON) -15.6%PANDORA (DK:PND) -14.3%
_
CharacteristicsPortfolio MSCI EAFE Gross
Number of Holdings 932 929Weighted Avg. Market Cap. ($B) 53.0 53.0Median Market Cap. ($B) 9.4 9.4Price To Earnings 22.8 21.2Price To Book 3.0 2.4Price To Sales 2.3 2.0Return on Equity (%) 14.3 12.5Yield (%) 3.0 3.0Beta (holdings; global) 1.1 1.1
Merced County Employees’ Retirement Association 54

Emerging Markets EquityPeer Universe Comparison Period Ending: March 31, 2017
Merced County Employees’ Retirement Association 55

Worst PerformersReturn %
_
BRF SPONSORED ADR 1:1 -17.0%MATAHARI DEPARTMENT SOE. (ID:MDS) -11.9%MAGNIT (RS:MGN) -8.8%LI NING -6.6%AMOREPACIFIC (KO:AMN) -5.8%LUKOIL OAO SPN.ADR 1:1 (LUKOY) -5.5%AVIVASA EMEKLILIK VE HAYAT -4.9%CNOOC -4.6%PETROCHINA 'H' (K:PECH) -1.8%RAIA DROGASIL ON -1.4%
_
Wells CapitalEquity Only Summary Statistics Period Ending: March 31, 2017
Top HoldingsSAMSUNG ELECTRONICS 6.0%TAIWAN SEMICON.SPN.ADR 1:5 3.3%CHINA MOBILE 3.1%HDFC BANK ADR 1:3 2.4%CHINA LIFE INSURANCE 'H' 2.4%FOM.ECO.MEXNO.SAB DE CV SPN.ADR1:10 2.4%
RELIANCE INDS.GDR 144A 2.3%NEW ORIENTAL ED.& TECH. GP.ADS 1:1 2.2%SINA 2.2%UNI-PRESIDENT ENTS. 2.1%
Best PerformersReturn %
_
NEW ORIENTAL ED.& TECH. GP.ADS 1:1 43.4%RUMO LOG.OPD.MULTIMODAL (BR:P3M) 42.7%MERCADOLIBRE 35.5%GRIDSUM HOLDING ADR (GSUM) 30.4%BLUEBIRD GROUP PT 30.1%WEIBO CLASS 'A' ADR (WB) 28.5%WALMART DE MEXICO 'V' 27.9%RELIANCE INDS.GDR 144A (UKIR:RIGD) 27.7%B2W COMPANHIA DIGITAL ON 27.1%PTT FB 25.9%
_
Characteristics
Portfolio MSCI Emerging MarketsGross
Number of Holdings 101 830Weighted Avg. Market Cap. ($B) 56.6 56.9Median Market Cap. ($B) 10.3 5.1Price To Earnings 22.0 19.4Price To Book 4.0 2.7Price To Sales 3.2 2.2Return on Equity (%) 17.2 15.8Yield (%) 1.9 2.4Beta (holdings; global) 1.1 0.9
Merced County Employees’ Retirement Association 56

US Fixed IncomeManager Allocation Analysis Period Ending: March 31, 2017
Actual Actual_
Barrow Hanley $112,292,850 76.1%Guggenheim Loan $35,190,583 23.9%Total $147,483,433 100.0%
_
Merced County Employees’ Retirement Association 57

AnlzdReturn
AnlzdReturnRank
AnlzdStandardDeviation
AnlzdStandardDeviation
Rank
SharpeRatio
SharpeRatioRank
_
US Fixed Income 3.2% 55 2.9% 50 1.1 36
US Fixed Custom 3.2% 56 3.2% 63 1.0 51
InvestorForce All DB US FixInc Gross Median 3.3% -- 2.9% -- 1.0 --
XXXXX
US Fixed IncomeRisk vs. Return (3 Years) Period Ending: March 31, 2017
Merced County Employees’ Retirement Association 58

AnlzdReturn
AnlzdReturnRank
AnlzdStandardDeviation
AnlzdStandardDeviation
Rank
SharpeRatio
SharpeRatioRank
_
US Fixed Income 3.5% 49 2.9% 44 1.2 28
US Fixed Custom 2.8% 72 3.0% 55 0.9 59
InvestorForce All DB US FixInc Gross Median 3.5% -- 2.9% -- 1.0 --
XXXXX
US Fixed IncomeRisk vs. Return (5 Years) Period Ending: March 31, 2017
Merced County Employees’ Retirement Association 59

US Fixed IncomePeer Universe Comparison Period Ending: March 31, 2017
Merced County Employees’ Retirement Association 60

US Fixed IncomeBond Summary Statistics Period Ending: March 31, 2017
Merced County Employees’ Retirement Association 61
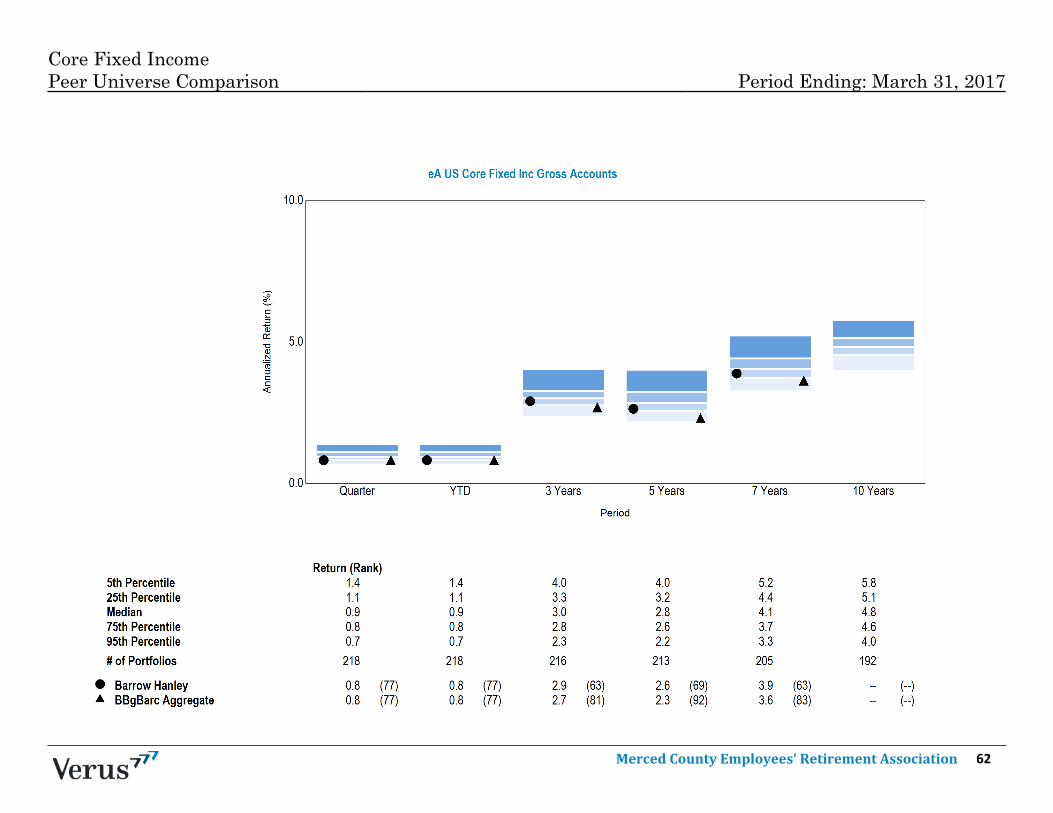
Core Fixed IncomePeer Universe Comparison Period Ending: March 31, 2017
Merced County Employees’ Retirement Association 62

Barrow HanleyBond Summary Statistics Period Ending: March 31, 2017
Merced County Employees’ Retirement Association 63
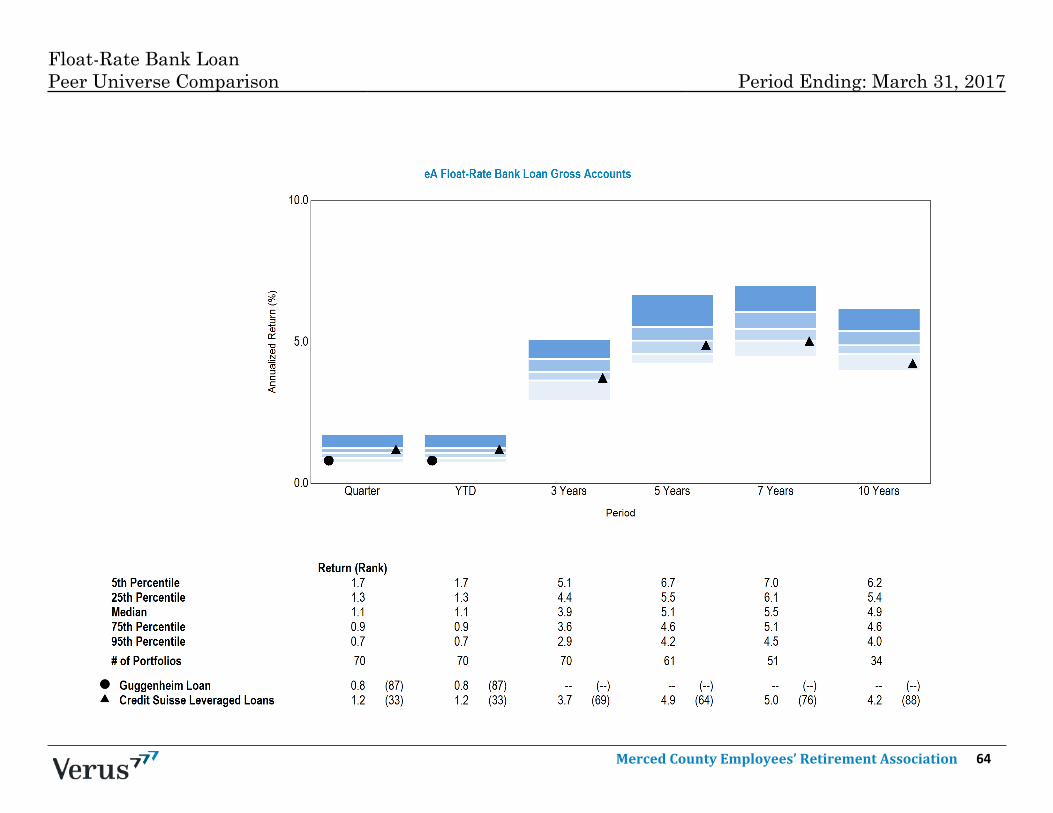
Float-Rate Bank LoanPeer Universe Comparison Period Ending: March 31, 2017
Merced County Employees’ Retirement Association 64

Hedge FundManager Allocation Analysis Period Ending: March 31, 2017
Actual Actual_
OZ Domestic II $15,861,608 100.0%Total $15,861,608 100.0%
_
Merced County Employees’ Retirement Association 65
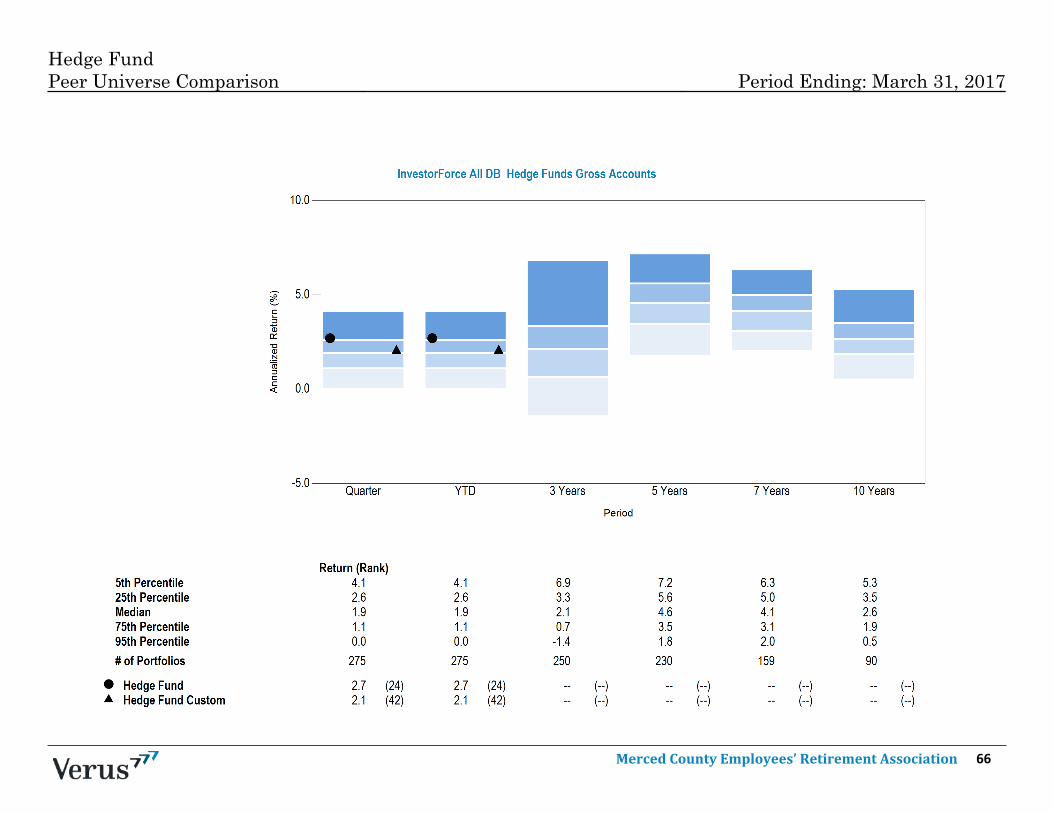
Hedge FundPeer Universe Comparison Period Ending: March 31, 2017
Merced County Employees’ Retirement Association 66
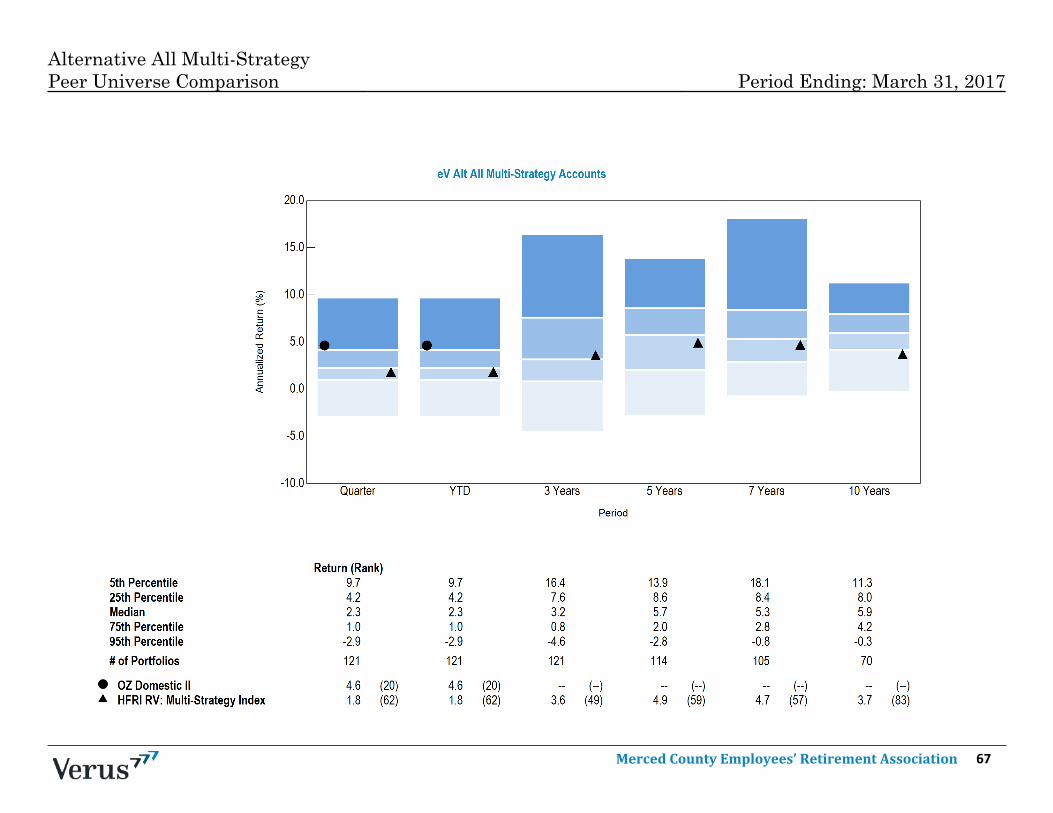
Alternative All Multi-StrategyPeer Universe Comparison Period Ending: March 31, 2017
Merced County Employees’ Retirement Association 67

Actual Actual_
BlackRock RE $4,000,308 6.8%Greenfield Gap VII $12,031,746 20.4%Patron Capital V $1,318,057 2.2%UBS Trumbull Property $41,496,327 70.5%Total $58,846,438 100.0%
_
Real Estate Manager Allocation Analysis Period Ending: March 31, 2017
Merced County Employees’ Retirement Association 68

Real Estate Peer Universe Comparison Period Ending: March 31, 2017
Merced County Employees’ Retirement Association 69

Private EquityManager Allocation Analysis Period Ending: March 31, 2017
Actual Actual_
Adams Street $8,639,480 24.2%Invesco IV $2,904,963 8.2%Invesco VI $4,578,998 12.8%Ocean Avenue II $5,586,136 15.7%Pantheon I $1,792,036 5.0%Pantheon II $3,709,906 10.4%Pantheon Secondary $1,980,103 5.6%Raven Asset Fund II $6,451,591 18.1%Total $35,643,213 100.0%
_
Merced County Employees’ Retirement Association 70
DB Private EquityPeer Universe Comparison Period Ending: March 31, 2017
Merced County Employees’ Retirement Association 71
Policy Index and Benchmark History Period Ending: March 31, 2017
Merced County Employees’ Retirement Association 72

Policy Index and Benchmark History Period Ending: March 31, 2017
Merced County Employees’ Retirement Association 73

Policy Index and Benchmark History Period Ending: March 31, 2017
Merced County Employees’ Retirement Association 74

Policy Index and Benchmark History Period Ending: March 31, 2017
Merced County Employees’ Retirement Association 75
Policy Index and Benchmark History Period Ending: March 31, 2017
Merced County Employees’ Retirement Association 76

Allocation Effect: An attribution effect that describes the amount attributable to the managers' asset allocation decisions, relative to the benchmark.
Alpha: The excess return of a portfolio after adjusting for market risk. This excess return is attributable to the selection skill of the portfolio manager. Alpha is calculated as: Portfolio Return - [Risk-free Rate +
Portfolio Beta x (Market Return - Risk-free Rate)].
Benchmark R-squared: Measures how well the Benchmark return series fits the manager's return series. The higher the Benchmark R-squared, the more appropriate the benchmark is for the manager.
Beta: A measure of systematic, or market risk; the part of risk in a portfolio or security that is attributable to general market movements. Beta is calculated by dividing the covariance of a security by the
variance of the market.
Book-to-Market: The ratio of book value per share to market price per share. Growth managers typically have low book-to-market ratios while value managers typically have high book-to-market ratios.
Capture Ratio: A statistical measure of an investment manager's overall performance in up or down markets. The capture ratio is used to evaluate how well an investment manager performed relative to an
index during periods when that index has risen (up market) or fallen (down market). The capture ratio is calculated by dividing the manager's returns by the returns of the index during the up/down market,
and multiplying that factor by 100.
Correlation: A measure of the relative movement of returns of one security or asset class relative to another over time. A correlation of 1 means the returns of two securities move in lock step, a correlation of
-1 means the returns of two securities move in the exact opposite direction over time. Correlation is used as a measure to help maximize the benefits of diversification when constructing an investment
portfolio.
Excess Return: A measure of the difference in appreciation or depreciation in the price of an investment compared to its benchmark, over a given time period. This is usually expressed as a percentage and
may be annualized over a number of years or represent a single period.
Information Ratio: A measure of a manager's ability to earn excess return without incurring additional risk. Information ratio is calculated as: excess return divided by tracking error.
Interaction Effect: An attribution effect that describes the portion of active management that is contributable to the cross interaction between the allocation and selection effect. This can also be explained as
an effect that cannot be easily traced to a source.
Portfolio Turnover: The percentage of a portfolio that is sold and replaced (turned over) during a given time period. Low portfolio turnover is indicative of a buy and hold strategy while high portfolio turnover
implies a more active form of management.
Price-to-Earnings Ratio (P/E): Also called the earnings multiplier, it is calculated by dividing the price of a company's stock into earnings per share. Growth managers typically hold stocks with high
price-to-earnings ratios whereas value managers hold stocks with low price-to-earnings ratios.
R-Squared: Also called the coefficient of determination, it measures the amount of variation in one variable explained by variations in another, i.e., the goodness of fit to a benchmark. In the case of
investments, the term is used to explain the amount of variation in a security or portfolio explained by movements in the market or the portfolio's benchmark.
Selection Effect: An attribution effect that describes the amount attributable to the managers' stock selection decisions, relative to the benchmark.
Sharpe Ratio: A measure of portfolio efficiency. The Sharpe Ratio indicates excess portfolio return for each unit of risk associated with achieving the excess return. The higher the Sharpe Ratio, the more
efficient the portfolio. Sharpe ratio is calculated as: Portfolio Excess Return / Portfolio Standard Deviation.
Sortino Ratio: Measures the risk-adjusted return of an investment, portfolio, or strategy. It is a modification of the Sharpe Ratio, but penalizes only those returns falling below a specified benchmark. The
Sortino Ratio uses downside deviation in the denominator rather than standard deviation, like the Sharpe Ratio.
Standard Deviation: A measure of volatility, or risk, inherent in a security or portfolio. The standard deviation of a series is a measure of the extent to which observations in the series differ from the arithmetic
mean of the series. For example, if a security has an average annual rate of return of 10% and a standard deviation of 5%, then two-thirds of the time, one would expect to receive an annual rate of return
between 5% and 15%.
Style Analysis: A return based analysis designed to identify combinations of passive investments to closely replicate the performance of funds
Style Map: A specialized form or scatter plot chart typically used to show where a Manager lies in relation to a set of style indices on a two-dimensional plane. This is simply a way of viewing the asset loadings
in a different context. The coordinates are calculated by rescaling the asset loadings to range from -1 to 1 on each axis and are dependent on the Style Indices comprising the Map.
Glossary
This report contains confidential and proprietary information and is subject to the terms and conditions of the Consulting Agreement. It is being provided for use solely by the customer. The reportmay not be sold or otherwise provided, in whole or in part, to any other person or entity without written permission from Verus Advisory, Inc., (hereinafter Verus) or as required by law or any
regulatory authority. The information presented does not constitute a recommendation by Verus and cannot be used for advertising or sales promotion purposes. This does not constitute an offer
or a solicitation of an offer to buy or sell securities, commodities or any other financial instruments or products.
The information presented has been prepared using data from third party sources that Verus believes to be reliable. While Verus exercised reasonable professional care in preparing the report, itcannot guarantee the accuracy of the information provided by third party sources. Therefore, Verus makes no representations or warranties as to the accuracy of the information presented. Verus
takes no responsibility or liability (including damages) for any error, omission, or inaccuracy in the data supplied by any third party. Nothing contained herein is, or should be relied on as a promise,
representation, or guarantee as to future performance or a particular outcome. Even with portfolio diversification, asset allocation, and a long-term approach, investing involves risk of loss that the
investor should be prepared to bear.
The information presented may be deemed to contain forward-looking information. Examples of forward looking information include, but are not limited to, (a) projections of or statementsregarding return on investment, future earnings, interest income, other income, growth prospects, capital structure and other financial terms, (b) statements of plans or objectives of management,
(c) statements of future economic performance, and (d) statements of assumptions, such as economic conditions underlying other statements. Such forward-looking information can be identified
by the use of forward looking terminology such as believes, expects, may, will, should, anticipates, or the negative of any of the foregoing or other variations thereon comparable terminology, or by
discussion of strategy. No assurance can be given that the future results described by the forward-looking information will be achieved. Such statements are subject to risks, uncertainties, and
other factors which could cause the actual results to differ materially from future results expressed or implied by such forward looking information. The findings, rankings, and opinions expressed
herein are the intellectual property of Verus and are subject to change without notice. The information presented does not claim to be all-inclusive, nor does it contain all information that clients
may desire for their purposes. The information presented should be read in conjunction with any other material provided by Verus, investment managers, and custodians.
Verus will make every reasonable effort to obtain and include accurate market values. However, if managers or custodians are unable to provide the reporting period's market values prior to thereport issuance, Verus may use the last reported market value or make estimates based on the manager's stated or estimated returns and other information available at the time. These estimates
may differ materially from the actual value. Hedge fund market values presented in this report are provided by the fund manager or custodian. Market values presented for private equity
investments reflect the last reported NAV by the custodian or manager net of capital calls and distributions as of the end of the reporting period. These values are estimates and may differ
materially from the investments actual value. Private equity managers report performance using an internal rate of return (IRR), which differs from the time-weighted rate of return (TWRR)
calculation done by Verus. It is inappropriate to compare IRR and TWRR to each other. IRR figures reported in the illiquid alternative pages are provided by the respective managers, and Verus has
not made any attempts to verify these returns. Until a partnership is liquidated (typically over 10-12 years), the IRR is only an interim estimated return. The actual IRR performance of any LP is not
known until the final liquidation.
Verus receives universe data from InvestorForce, eVestment Alliance, and Morningstar. We believe this data to be robust and appropriate for peer comparison. Nevertheless, these universes maynot be comprehensive of all peer investors/managers but rather of the investors/managers that comprise that database. The resulting universe composition is not static and will change over time.
Returns are annualized when they cover more than one year. Investment managers may revise their data after report distribution. Verus will make the appropriate correction to the client account
but may or may not disclose the change to the client based on the materiality of the change.
Disclaimer