mercer island 2015 2016 water quality monitoring in basin 10 island 2015–2016 water quality...
TRANSCRIPT

Mercer Island 2015–2016 Water Quality Monitoring in Basin 10
September 2016
Alternate Formats Available

This page intentionally left blank.

Mercer Island 2015-2016 Water Quality Monitoring in Basin 10
Prepared for: M. Patrick Yamashita, Mercer Island City Engineer, Development Services Group
Submitted by: Debra Bouchard King County Water and Land Resources Division Department of Natural Resources and Parks

This page intentionally left blank.

Mercer Island 2015–2016 Water Quality Monitoring in Basin 10
King County i September 2016
Acknowledgements Many King County Environmental Lab staff contributed time toward sample collection, laboratory analysis, quality assurance, and data verification. Other staff members from the King County Water and Land Resources Division provided report and data review.
Project Oversight
Debra Bouchard, King County Water Quality Planner Colin Elliott, King County Environmental Laboratory Project Manager
Sample Collection
Jean Power, Environmental Laboratory Scientist Stephanie Hess, Environmental Laboratory Scientist Dan Hutchens, Environmental Laboratory Scientist
Data Analysis, Technical Writing, Report Review, and Production
Debra Bouchard, King County Water Quality Planner III Dave Funke, King County Senior Engineer Richard Jack, King County Water Quality Planner III Carly Greyell, King County Water Quality Planner II Todd Klinka, King County Senior GIS Professional Tom Ventur, King County Graphic Designer
City of Mercer Island Supporting Staff
M. Patrick Yamashita, City Engineer, Development Services Group
Citation King County. 2016. Mercer Island 2015–2016 Water Quality Monitoring in Basin 10.
Prepared by Debra Bouchard, Water and Land Resources Division. Seattle, Washington.

Mercer Island 2015–2016 Water Quality Monitoring in Basin 10
King County ii September 2016
Table of Contents Executive Summary.............................................................................................................................................. v
1.0 Introduction .............................................................................................................................................. 1
1.1 Drainage in Basin 10 ......................................................................................................................... 4
2.0 Methods ................................................................................................................................................... 14
2.1 Rain events .........................................................................................................................................14
2.2 Flow Gages ..........................................................................................................................................15
2.3 Water Quality Criteria ....................................................................................................................15
2.3.1 Conventional Parameters ........................................................................................................ 16
2.3.2 Nutrients ........................................................................................................................................ 18
2.3.3 Bacteria ........................................................................................................................................... 18
2.3.4 Storm Event Organics ................................................................................................................ 19
2.3.5 Metal WQS and Hardness ........................................................................................................ 19
3.0 Results ...................................................................................................................................................... 20
3.1 Precipitation ......................................................................................................................................20
3.2 Baseflow sampling event ..............................................................................................................22
3.3 Storm Event Conventionals ..........................................................................................................24
3.3.1 Storm Event Nutrients .............................................................................................................. 26
3.3.2 Storm Event Organics ................................................................................................................ 27
3.3.3 Storm Event Bacteria ................................................................................................................. 31
3.3.4 Storm Event Metals .................................................................................................................... 32
3.4 Flows and Storm Event Loading ................................................................................................35
4.0 Discussion & Recommendations ................................................................................................... 39
4.1 Recommended Next Steps ............................................................................................................40
5.0 References .............................................................................................................................................. 41
Figures Figure 1. Mercer Island land use, drainage basins, and basin improvement projects. ........ 3
Figure 2. Map of basin 10 showing sampling stations and storm drainage system. ............ 5
Figure 3. Station 10 sub-drainage context map. ................................................................................. 7

Mercer Island 2015–2016 Water Quality Monitoring in Basin 10
King County iii September 2016
Figure 4. Station 10 street view map....................................................................................................... 8
Figure 5. Town center stormwater stations 10-647 (10C), 10-366, 10-648, and 10-108 sub-drainage context map. One baseflow sample collected at 10-368. ......... 9
Figure 6. Stations 10C, 10-366, 10-648, and 10-108 street view map . ...................................10
Figure 7. Station 10-77th sub-drainage context map.......................................................................11
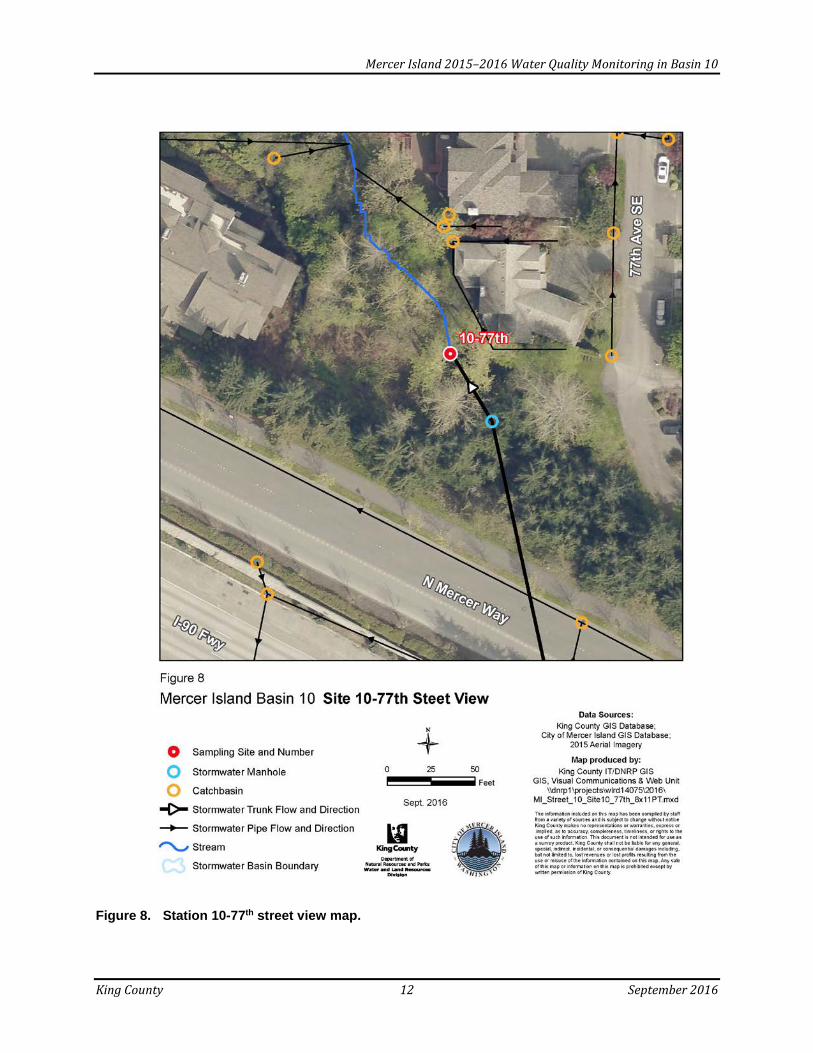
Figure 8. Station 10-77th street view map. ..........................................................................................12
Figure 9. Rainfall measured at the Mercer Island High School rain gauge (MERC) and the sampling events 2015-16. ...............................................................................................20
Figure 10. Seattle cummulative monthly rainfall in 2015 and 2016 (to date) compared with the 64 year historical average as measured at SeaTac Airport. (data source Seattle Weather Blog). ..................................................................21
Figure 11. Box plots showing median, 75th, and 25th percentiles of TSS, SRP, TP, SRP:TP, Nitrite-nitrate-N, TN, and Conductivity for each station in basin 10, 2015-16 stormwater monitoring events. ..................................................................29
Figure 12. Fecal coliform bacteria and Bacteroidales qPCR results measured at stations 10, 10-77th, and 10-647 in 2015 and 2016. ....................................................31
Figure 13. Box plots showing median, 75th, and 25th percentiles of dissolved copper, dissolved zinc, and hardness for each station in basin 10, 2015-16 stormwater monitoring events. ...........................................................................................34
Figures 14–18. Hydrograph of mean daily discharge, maximum discharge of the day, MERC daily rainfall daily flow data for stations 10, 10-108, 10-647, 10-366, and 10-648 in basin 10, 2015-16. ..............................................................................35
Tables Table 1. Basin 10 sampling sites in 2015 and 2016, with WA State Plane north
coordinates, listed downstream to upstream. ................................................................13
Table 2. Water quality standards (WQS) used. ................................................................................16
Table 3. Field observations of catch basin conditions. .................................................................22
Table 4. Results from non-storm sample collected at 10-647 and 10-638 on April 9, 2015. Highlighted values indicate where acute metals and conventional WQS were not met. ....................................................................................................................24
Table 5. Dissolved oxygen (DO), temperature, pH, conductivity and TSS measured in basin 10 during storm events, 2015-16. Highlighted values indicate where WQS were not met (see section 2.2).....................................................................26
Table 6. Detected volatile organics and total petroleum hydrocarbons in storm sample collected on October 7, 2015 in basin 10. .........................................................27

Mercer Island 2015–2016 Water Quality Monitoring in Basin 10
King County iv September 2016
Table 7. Hardness (mg/L CaCO3), dissolved metal (µg/L) concentrations in basin 10 stormwater, 2015-16. Highlighted values exceed acute criteria. <MDL = less than the method detection limit. .............................................................................33
Table 8. Total wet season volume (cf), mean dissolved metal concentration (µg/L) and loading (g) for basin 10 drainages, 2015-2016. ....................................................38
Appendices Appendix A. Flow Monitoring in Basin 10 ............................................................................................... A1
Appendix B. Summary of Precipitation from Mercer Island (MERC) rain gauge ..................... B1
Appendix C. Data Reports from King County Environmental Lab ................................................. C1

Mercer Island 2015–2016 Water Quality Monitoring in Basin 10
King County v September 2016
EXECUTIVE SUMMARY The 2015-16 stormwater monitoring effort in Mercer Island’s basin 10 continues the water quality work that King County has performed since 1999 (King County, 2011; King County, 2013; King County, 2015). A 2011 summary comparison of data collected in all five Mercer Island basins indicated that basins 10 and 32b reported the highest levels of both dissolved copper (dCu) and dissolved zinc (dZn) in stormwater runoff and consistently exceeded state acute water quality standards (WQS) (Wilhelm, 2009; King County 2011)(Figure 1). The 2013-14 monitoring effort also showed that concentrations of dCu were found to be significantly higher in specific town center drainages. Because of this, the 2015-16 monitoring effort focused on town center drainages. Flow monitoring was added at this time to determine the magnitude of stormwater pollutant loads and runoff volumes. The overall goal is to remedy a substantial portion of the stormwater quality exceedences and/or the loads of dissolved metals. An additional goal was to try and isolate segments of the lower reach of the basin to determine high fecal coliform bacteria sources. The City of Mercer Island’s efforts following this report will focus on securing funding to move forward on prescribed remedies.
During 2015-16, King County sampled four different stormwater catch basins in the town center area of basin 10 for dissolved metals (Figure 2). These four sites were selected to isolate sub-drainages flowing into the main trunk line that runs along 77th Avenue SE in the town center intersection. In addition, the historical location in the open stream channel along SE 22nd Street was monitored. Fecal coliforms and the human source tracking bacteria Bacteroidales were measured at three downstream stations in basin 10 to determine if the high bacteria counts may be from an illicit connection or some other human source.
Dissolved Cu concentrations and loadings were found to be highest at station 10-647 (10C). Concentrations of dZn were highest at station 10-108, while dZn loadings were similar at stations 10-108 and 10-647. Hardness values are relatively low at all of the town center sites compared with station 10 at the mouth of the basin. These low hardness values influence the calculated acute toxicity of the dissolved metals and all town center stations exceeded the dCu WQS, with one exception on December 7, 2015 at station 10-108. At station 10-108 high dZn concentrations combined with the low hardness resulted in all samples exceeding the dZn acute WQS.
The fecal coliform bacteria sampling in the downstream reach of basin 10 continues to indicate a source of fecal material entering the basin. High fecal coliform bacteria values were measured at station 10-77th and station 10. High Bacteriodales values (>10,000 copies/100 ml) were measured at station 10 twice and at station 10-77th once, indicating a source of human fecal material somewhere within this lower reach. To further isolate smaller segments within this section of the basin, additional targeted efforts are needed. Source tracking during non-storm events in late spring- early summer (when soils are saturated but there is less dilution from rainwater) is recommended in order to isolate potential illicit connections or other inputs. This effort could include the placement of conductivity and temperature data loggers deployed for extended periods of time. This method was used successfully in Thornton Creek by Seattle Public Utilities (Frodge, 2015)

Mercer Island 2015–2016 Water Quality Monitoring in Basin 10
King County vi September 2016
and future work to identify bacteria sources in other parts of the county will be incorporating these techniques.
Circumstances can vary greatly by location so it is important to have a wide variety of retrofit or other stormwater treatment options. In stormwater with low hardness levels, relatively low dissolved copper concentrations that exceed the WQS for copper can be difficult to reduce with current treatment techniques. In addition, some of the current treatment technologies do not sufficiently remove copper and/or require large capital expenditures. The Port of Seattle has found oyster shell amendments reduce copper concentrations and toxicity potential in stormwater. The Port’s monitoring also suggests this treatment requires minimal construction and maintenance effort. The treatment is fairly low cost, using local recycled materials, and could be implemented in a variety of situations across the region. As a result, the King County Water and Land Resources Division has submitted a proposal to receive funds from Ecology’s Regional Stormwater Monitoring Program (RSMP) to implement and measure the effectiveness of oyster shell amendments in Mercer Island catch basins. If funds are awarded, the effectiveness study will begin in fall 2017.

Mercer Island 2015–2016 Water Quality Monitoring in Basin 10
King County 1 September 2016
1.0 INTRODUCTION King County Water and Land Resources Division (WLRD) has performed water quality monitoring for Mercer Island since 1999 (King County, 2011; King County, 2013; King County 2015). Prior to 2011, sampling stations were located near the mouth of five separate drainage basins; basins 6, 10, 26, 32b, and 42 (Figure 1). In 2011-14, monitoring efforts shifted focus to look more closely at basin 10 and 32b since these two basins experienced the highest levels of both dissolved copper (dCu) and dissolved zinc (dZn) in stormwater runoff. These two basins consistently exceed the state acute water quality standards (WQS) for these metals (Wilhelm, 2009; King County 2011; King County 2013; King County 2015). Monitoring efforts in 2013-14 moved upstream to further evaluate potential sources of dissolved metals as well as high fecal coliform bacteria at the mouth of basin 10.
In the 2013-14 monitoring concentrations of dCu were found to be significantly higher in specific town center drainages. Because of this, continued monitoring focused in drainages and monitored flow as well as nutrients and dissolved metals in the town center area in basin 10 (King County, 2015). Specific monitoring objectives for monitoring in 2015-16 were:
1) Continued monitoring for dissolved copper and zinc at five stations in basin 10 (stations 10, 10-108, 10-647 (10C), 10-648, 10-366) for hardness, dissolved metal (copper, zinc, chromium and lead), TSS, and nutrients. Representative storms were to be sampled during five rain events, preferably sampling at least one wet weather event per quarter to document any seasonal patterns in the basin.
2) Sample for fecal coliform and human source tracing qPCR at two downstream sites (10 and 10-77th) in basin 10. The more specific qPCR human marker currently used by the King County Environmental laboratory (KCEL) combined with the fecal bacteria analysis will help determine if the high bacteria counts at station 10 are from a human source.
3) Because the city is concerned about nearby groundwater contamination from former drycleaners and gas stations in the town center leaking into the stormwater system (personal communication, Nov.2014), volatile organics and total petroleum hydrocarbons (TPH) were included in the first monitoring event.
4) To gain a better understanding of the conditions contributing to the dCu and dZn water quality exceedances, continuous flow monitoring was added to the program. The dissolved copper and zinc storm concentration data combined with the flow monitoring can estimate current pollutant loadings to downstream receiving waters.
5) Concentrations of dissolved copper and zinc, along with the flow and loading estimates were used to describe the magnitude of the water quality problems associated with the town center area runoff.

Mercer Island 2015–2016 Water Quality Monitoring in Basin 10
King County 2 September 2016
This report includes the specific information about the 2015-16 monitoring design and results. The magnitude of the stormwater pollutant loads and runoff volumes have been estimated.
The overall goal of the 2015-16 effort is to support development of remedies for a substantial portion of the stormwater quality exceedances and/or the loadings of dissolved metals and fecal coliforms to downstream waters in basin 10. Future efforts will focus on securing funding to move forward on pilot remedies.

Mercer Island 2015–2016 Water Quality Monitoring in Basin 10
King County 3 September 2016
Figure 1. Mercer Island land use, drainage basins, and basin improvement projects.
Note: previous monitoring efforts were focused on basin 6 (1999-2010), 29 (1999-2002), 42 (2003-2006), and 32b (1999-2014). This monitoring effort focused on basins 10 (1999-2016).

Mercer Island 2015–2016 Water Quality Monitoring in Basin 10
King County 4 September 2016
1.1 Drainage in Basin 10 Basin 10 drains the majority of the City’s business district as well as single-family and high-density residential neighborhoods (Figure 2). Drainage improvements made in 2003 to basin 10 were designed to increase capacity of the system just upstream of where the drainage enters Lake Washington in order to eliminate localized flooding during large storm events (Figure 1).
Monitoring in 2015-16 included samples collected at station 10 near the mouth of the drainage basin on SE 22nd Street (Table 1, Figures 3 and 4). Samples have been collected at this site since 1999. The focus of this effort was in the four sub-drainages connected with the stormwater gravity main trunk line (Table 1, Figures 5-7). These four sites located in catch basins within the town center intersection of SE 27th Street and 77th Ave SE were also part of the 2013-14 monitoring effort. These catch basins collect flows from streets, parking lots, and rooftops as described in Table 1. An additional site was added for the 2015-16 monitoring upstream of station 10 and downstream of town center to help isolate sources of fecal coliform bacteria in this lower reach of the basin (Figure 8).
As discussed in earlier reports, water quality concerns in basin 10 include high dCu and dZn found in stormwater and sediments (King County, 2013; King County, 2015). Concentrations water quality exceedences have been consistently higher in the catch basins upstream in the town center area.
Historically, both storm and baseflow events at station 10 had very high fecal coliform bacteria levels. Urban drainages with flashy flows often have high fecal coliform counts as stormwater runoff washes fecal material into surface waters from a variety of potential contributors. However, the presence of the human source tracking bacteria Bacteroidales at the station 10 indicated that human waste was entering the water in some way below town center (King County, 2015).

Mercer Island 2015–2016 Water Quality Monitoring in Basin 10
King County 5 September 2016
Figure 2. Map of basin 10 showing sampling stations and storm drainage system.

Mercer Island 2015–2016 Water Quality Monitoring in Basin 10
King County 6 September 2016
This page intentionally left blank.

Mercer Island 2015–2016 Water Quality Monitoring in Basin 10
King County 7 September 2016
Figure 3. Station 10 sub-drainage context map.

Mercer Island 2015–2016 Water Quality Monitoring in Basin 10
King County 8 September 2016
Figure 4. Station 10 street view map.

Mercer Island 2015–2016 Water Quality Monitoring in Basin 10
King County 9 September 2016
Figure 5. Town center stormwater stations 10-647 (10C), 10-366, 10-648, and 10-108
sub-drainage context map. One baseflow sample collected at 10-368.

Mercer Island 2015–2016 Water Quality Monitoring in Basin 10
King County 10 September 2016
Figure 6. Stations 10C, 10-366, 10-648, and 10-108 street view map .

Mercer Island 2015–2016 Water Quality Monitoring in Basin 10
King County 11 September 2016
Figure 7. Station 10-77th sub-drainage context map.
Mercer Island 2015–2016 Water Quality Monitoring in Basin 10
King County 12 September 2016
Figure 8. Station 10-77th street view map.

Mercer Island 2015–2016 Water Quality Monitoring in Basin 10
King County 13 September 2016
Table 1. Basin 10 sampling sites in 2015 and 2016, with WA State Plane north coordinates, listed downstream to upstream.
BASIN 10 Description State Plane North Coordinates in feet
10 historical site, open stream channel west of 77th Ave SE and upstream (south) end of the culvert at SE 22nd Street
1294333 / 218840
10-77th storm line off 77th Ave SE, collects water from the entire basin south of the I-90 bridge including town center and Mercerdale neighborhood. It does not include interstate road drainage
1294431 / 218315
10–647 (formerly 10C)
catch basin on NE corner of town center, collects flows from north east side of SE 27th St
1294568 / 217191
10-638 catch basin on north side of SE 27th St near the corner of SE 27th St and 78th Ave SE, collects drainage upstream of 10-647.
1294816 / 217181
10-366 catch basin on SE corner of town center, collects flows from the south east side of SE 27th St
1294571 / 217148
10-648 catch basin on SW corner of town center, collects flows from the south west side of SE 27th St
1294485 / 217152
10-108 catch basin on NW corner of town center, collects flows from the north west side of SE 27th St
1294479 / 217193

Mercer Island 2015–2016 Water Quality Monitoring in Basin 10
King County 14 September 2016
2.0 METHODS King County Environmental Laboratory staff collected water during five storm events to characterize water quality during periods of elevated surface water runoff in basin 10. Dates for those storm events are listed below. In addition, one baseflow event sample was collected on April 9, 2015 at station 10-368 and 10-647 to investigate water quality in the storm drainage system during non-storm conditions.
• April 9, 2015 – non-storm • October 7, 2015 • November 9, 2015 – no sample at 10-77th • December 7, 2015 • January 13, 2016 • March 1, 2016
Grab samples were taken and analyzed for the following parameters: total suspended solids (TSS), hardness and dissolved metals (copper, zinc, chromium, and lead) and nutrients at all sites except station 10-77th. Samples collected at the two downstream stations 10 and 10-77th were analyzed for fecal coliform bacteria and the human source tracking marker Bacteriodales.
KCEL staff collected and analyzed samples following Standard Operating Procedures (King County 2007 and King County 2008). Field parameters including water temperature, DO, pH, and conductivity, were collected using a YSI EXO sonde and data logger. A Hach 2100P turbidimeter was used to measure turbidity in the field. All water grab samples were collected and analyzed by the KCEL according to Quality Assurance/Quality Control (QA/QC) protocols provided (King County 2005). If a parameter is not detected for any given analysis, the laboratory flags it as being less than the method detection limits (<MDL). In other words, the parameter was not measurable given the limits of that particular laboratory method.
2.1 Rain events Field staff monitored real-time rainfall data to decide whether to sample during a particular storm. Ideally, samples would be collected after a specified period of antecedent dry weather (e.g., a three-day pre-storm period with an overall rainfall of 0.25 inches or less) and after the storm reached the forecasted cumulative precipitation threshold. However, real-time conditions did not conform to these strict constrictions and KCEL staff is limited to sampling during daylight hours.

Mercer Island 2015–2016 Water Quality Monitoring in Basin 10
King County 15 September 2016
Rainfall was recorded by a tipping bucket rain gage on the Mercer Island High School campus. Data from the rain gauge were downloaded from the King County Hydrologic Information Center1 (HIC) database under the locator MERC.
2.2 Flow Gages Flow monitoring gages were installed at four town center stations and at station 10 to support the water quality investigation. All five sites use the Onset model U20-04 water level data loggers to record water level at 15-minute intervals. Each gage is installed upstream in the stormwater conveyance system to measure discharge into the main drainage. A stage discharge relationship was determined for each site based on discharge measurements made during the monitoring period (April 2015–March 2016). Continuous flow at each site is then calculated by applying the stage-discharge relationship to the 15-minute water level record using automated routines developed by WLRD staff. The results of the flow computations and descriptions of each catch basin are presented in full in Appendix A and also are on the HIC database by locator.
2.3 Water Quality Criteria Water quality data reports for basin 10 were obtained from the KCEL. Data were compared with State water quality standards (WQS) and guidelines as noted in Table 2. The intent of this comparison is to characterize the data, not to evaluate compliance.
Washington State WQS are currently established only for certain parameters. The sample collection techniques (grab samples) used in this study limited the standards that could be used for comparison because they only reflected a snapshot in time. For example, temperature measured instantaneously during a sampling event does not provide context for how the temperature fluctuates diurnally or between sampling events. Temperature WQS are based on a continually recorded 7-day average, so the comparisons made in this report are to characterize the data and help screen for potential water quality problems.
Additionally, grab samples that are analyzed for dissolved metals are not appropriate to compare with chronic WQS because these standards are designed to represent what the organism would be exposed to continually over longer periods of time (days/weeks). Therefore, the water quality data were compared to acute WQS. As stated above, the intention of this comparison is to illustrate the parameters and land uses where stormwater improvements can be focused.
State WQS use species and life stage-specific criteria for aquatic life (WDOE 2011) and indicate that criteria for any tributary stream to Lake Washington be based on the “Core Salmonid Summer Habitat” designated use category. Adult salmonids do not enter and spawn in Mercer Island streams; however, the graveled stream mouths and nearshore areas in Lake Washington serve as important spawning and rearing habitat. Discharges could potentially alter water quality in receiving waters of Lake Washington. This study did
1 King County Hydrologic Information Center: http://green.kingcounty.gov/wlr/waterres/hydrology/ .

Mercer Island 2015–2016 Water Quality Monitoring in Basin 10
King County 16 September 2016
not measure water quality in the receiving waters and therefore cannot directly quantify the impact of stormwaters to Lake Washington. Table 2. Water quality standards (WQS) used.
Parameter Criteria/Guideline Reference
Temperature < 16 ° C, (7-DADMax)a. WAC 173-201A-200 Table 200(1)(c)
Dissolved oxygen > 9.5 mg/L WAC 173-201A-200 Table 200(1)(d)
pH 6.5 – 8.5 WAC 173-201A-200 Table 200(1)(g)
Conductivity n/a
TSS n/a
Total phosphorus n/a
SRP n/a
Total nitrogen n/a
Nitrate+nitrite nitrogen n/a
Ammonia nitrogen n/a
Fecal coliform <100 CFUb/100 ml WAC 173-201A-200 Table 200(2)(b)
Dissolved metals (Cr, Cu, Pb, Zn)
Hardness dependent 173-201A-240 Table 240(3) – acute standardsc
a 7-DADMax = 7-day average of the daily maximum temperatures b CFU = colony forming unit c Acute conditions are defined by WDOE as changes in the physical, chemical, or biologic environment which are expected or demonstrated to result in injury or death to an organism as a result of short-term exposure to the substance or detrimental environmental condition Chronic conditions are defined changes in the physical, chemical, or biologic environment which are expected or demonstrated to result in injury or death to an organism as a result of repeated or constant exposure over an extended period of time to a substance or detrimental environmental condition
2.3.1 Conventional Parameters Conventional parameters are the physical and chemical measurements that help define the characteristics of the aquatic environment. The following discussion describes these parameters and significance to water quality. As mentioned above, water temperature, dissolved oxygen, pH, and conductivity, and turbidity were measured in the field. The amount of total suspended solids was analyzed in the lab.

Mercer Island 2015–2016 Water Quality Monitoring in Basin 10
King County 17 September 2016
Temperature
Temperature is an important physical parameter for aquatic systems because it influences many of the chemical processes in water (e.g., dissolved oxygen concentration). Temperature also exerts a major influence on biological activity and growth, and therefore the survival of aquatic organisms.
Dissolved oxygen (DO)
Dissolved oxygen is critical to many of the chemical processes that are important in the aquatic environment. The concentration of dissolved oxygen is also important in determining the amount of habitat available for different types of aquatic organisms. pH
The pH of water is a measure of acidity, specifically, the concentration of hydrogen ions (H+). A value higher than seven (meaning there are fewer free hydrogen ions) is considered basic, pH of seven is considered neutral, and a pH less than seven is considered acidic. The pH of water determines the solubility and biological availability of chemical constituents such as heavy metals and nutrients. At lower pH values, nutrients are in soluble form and are therefore more readily available for take up by aquatic plants. Also, pH affects the rate of decomposition of organic matter. Conductivity
Conductivity is a measure of the passage of electric current through ions in water. The concentration of dissolved ions in water largely determines its conductivity. Conductivity is generally higher during baseflows in King County streams and decreases during storm events due to dilution from rainwater. Water in the Puget Sound region generally has low levels of dissolved minerals and relatively low conductivity compared to other regions with higher concentrations of dissolved minerals. Increases in conductivity can indicate the presence of dissolved ions potentially from pollutant sources. Conductivity is positively correlated with urbanization and though there is no WQS, trends can be meaningful.
Total Suspended Solids (TSS)
TSS is used as an indicator of the amount of suspended material in water, whether it is mineral (e.g., soil particles) or organic (e.g., plant material). Pollutants such as nutrients, metals, or bacteria can enter and be transported through water attached to particulate matter. Human activities within the watershed such as development that results in vegetation removal, increased erosion and stormwater runoff are generally the cause of higher TSS values. TSS is a measure of the actual weight of material per volume of water.
Turbidity
Turbidity is measured as the amount of light scattered in a water sample and is reported as nephelometeric turbidity units (NTU). The more material in the water, the greater the light scattering, and the higher NTU value. The turbidity criterion has been used primarily for assessing the impact of point discharges like wastewater treatment plants and is therefore not considered in this investigation.

Mercer Island 2015–2016 Water Quality Monitoring in Basin 10
King County 18 September 2016
2.3.2 Nutrients Nitrogen and phosphorus are often monitored in streams because of their potential impact on the aquatic plants and algae of receiving waters, in this case Lake Washington. While plants need both nitrogen and phosphorus, it is the availability of phosphorus that limits plant growth in Lake Washington. Lake Washington currently has low (moderate to good) levels of phosphorus following the diversion of wastewater in the 1960s. However, concerns remain that continued loading from non-point sources in its highly urbanized watershed may result in eutrophication and nuisance or potentially toxic algae blooms. Human activities such as poor gardening and animal management practices, or illicit sewer connections are linked to elevated nutrient concentrations.
Total phosphorus (TP)
TP includes all forms of the nutrient, including phosphorus bound in organic matter, attached to soil particles, and dissolved. When TSS is high, TP is also high, reflecting the amount of phosphorus that is bound to suspended sediments. Soluble reactive phosphorus (SRP) is a dissolved form of phosphorus which is readily available for plants and thus included in many fertilizers. However the Washington State legislature banned the sale of lawn fertilizer containing phosphorus in 2013 because phosphorus is very rarely a limiting nutrient for lawns and grasses yet can cause problems in the streams and lakes (e.g., eutrophication). Synthetic detergents are also sources of dissolved phosphorus. The fraction of SRP (SRP:TP ratio) can be used to identify potential sources of these pollutants in runoff.
Total Nitrogen (TN)
TN includes inorganic nitrogen as well as organic nitrogen. There are two forms of inorganic nitrogen (ammonia and nitrate+nitrite), both highly soluble in water and components of fertilizers, sewage effluents, and manure. Under natural conditions, the primary source of nitrate+nitrite in streams is from the decomposition of organic materials (e.g., leaf material) and therefore an increase in nitrogen in autumn would be expected. Likewise a decline in nitrogen through the growing season when plants are taking up nitrogen would be expected under natural conditions.
2.3.3 Bacteria The state WQS for bacterial pollution is based on using fecal coliform (FC) bacteria as an indicator of public health risk. However, high FC bacteria counts in water do not necessarily indicate human sewage pollution because many other mammals and birds also contribute fecal bacteria. Additionally, FC bacteria can persist and even increase in sediment and biofilms in drainage systems, and may be re-suspended during periods of high flows. Therefore it is common for urban streams with flashy and erosive flows to have high fecal coliform bacteria that exceed WQS during storm events.
The state Extraordinary Primary Contact Recreation criteria for fecal coliform bacteria reads as follows: “Fecal coliform organism levels must not exceed a geometric mean value of 50 colonies/100 mL, with not more than 10 percent of all samples (or any single sample when less than ten sample points exist) obtained for calculating the geometric mean value

Mercer Island 2015–2016 Water Quality Monitoring in Basin 10
King County 19 September 2016
exceeding 100 colonies/100 mL” (WAC 173-201A-200 Table 200 (2)(b)). It is not recommended to calculate the geomean when data is collected over thirty days apart. Therefore, the second part of the criteria (<100 CFU/100 mL) is used here for determining exceedances.
King County has been working on fine-tuning the use of a qPCR (quantitative Polymerase Chain Reaction) technology for bacteria source tracking studies. The current marker used by KCEL identifies and quantifies DNA of the most common human gut bacteria - Bacteriodales. Because Bacteriodales make up a significant component of human fecal material, and are anaerobic, when they are abundant in surface waters it indicates recent human pollution due to their short survival time and inability to reproduce in the environment. This particular human source marker (KCEL naming convention: Hu2Bac) has been studied throughout the nation for several years and the current marker used by KCEL is in its second generation. KCEL uses EPA Method B (Bacteroidales in Water for membrane filtration and PCR procedures (King County 2012). Samples from the two downstream stations in basin 10 were analyzed for Bacteroidales to determine if high values measured in this section of the basin could be from a human source such as a failing septic system, an illicit connection, or failing side sewer line.
2.3.4 Storm Event Organics Volatile organics and total petroleum hydrocarbon (TPH) were included during this monitoring effort because the city was concerned about nearby groundwater contamination from former drycleaners and gas stations in the town center leaking into the stormwater system (King County 2015).
2.3.5 Metal WQS and Hardness Standards for all metals evaluated here are hardness-dependent; toxicity increases as water hardness decreases based on the current state WQS. Dissolved metal concentrations were compared to hardness adjusted acute WQS for aquatic life. The state acute WQS are defined as “the 1-hour average concentration2 not to be exceeded more than once every 3 years on average.” (Hardness is calculated using the values for calcium and magnesium.) Water with low hardness is termed “soft water.” Soft water is common for Puget Sound lowland streams. There are several reasons for this, including very few carbonate rock formations in this area. In general, increased flows from rain and stormwater often result in decreased hardness due to dilution.
2 According to the WA Department of Ecology Water Quality Program Policy, measurements of instantaneous concentrations will be assumed to represent the averaging periods specified in Washington State surface water quality standards for both acute and chronic criteria unless additional measurements are available to calculate averages.

Mercer Island 2015–2016 Water Quality Monitoring in Basin 10
King County 20 September 2016
3.0 RESULTS Samples were collected during an eleven month period as listed below. All sampling events except for April 9, 2015 were wet weather events. Town center catch basins were vactored in February 2015 prior to any sampling.
• April 9, 2015 – non-storm sample collected at 10-647 and 10-368 only • October 7, 2015 • November 9, 2015 – no sample at 10-77th • December 7, 2015 • January 13, 2016 • March 1, 2016
3.1 Precipitation Rainfall collected at the MERC rain gauge plotted with the sampling events is shown in Figure 9. Daily precipitation measured at MERC during the 12 month monitoring period is shown in Appendix B. Regionally there was a record breaking drought in 2015 from April through June with cumulative rainfall far below the historical 64-year average as measured at SeaTac (Figure 10). Beginning in October 2015, the period sampled for this monitoring effort had higher than average cumulative rainfall.
Figure 9. Rainfall measured at the Mercer Island High School rain gauge (MERC) and
the sampling events 2015-16.

Mercer Island 2015–2016 Water Quality Monitoring in Basin 10
King County 21 September 2016
Figure 10. Seattle cummulative monthly rainfall in 2015 and 2016 (to date) compared
with the 64 year historical average as measured at SeaTac Airport. (data source Seattle Weather Blog).

Mercer Island 2015–2016 Water Quality Monitoring in Basin 10
King County 22 September 2016
Field staff record catch basin conditions observed during sampling events noting turbid water, odors, sheens, and sometimes flow conditions (Table 3). Results from these field measurements and laboratory analysis are presented in sections below for conventionals, bacteria, nutrients, and metals. Data reports from the King County Environmental Lab for each sampling event are shown in Appendix C.
Table 3. Field observations of catch basin conditions.
Date Site Field conditions
4-9-2015 10-647 water clear, minimal sediment
10-368 flow at same frequency as observed at 10-647
10-7-2015 10-647 good flow through pipe, not as turbid as other sites
10-366 very turbid
10-648 very turbid and lots of leaf debris
1-13-2016 10-648 not much flow, particularly dirty with a lot of leaf debris and oil
10-366 rain had essentially stopped, street flow still creating drainage
3-1-2016 10 turbid and somewhat milky in color
10-366 dirty
10-648 dirty and turbid
10-108 not too turbid (Construction on NW corner of building)
3.2 Baseflow sampling event Prior to collecting storm event samples, flow was recorded at regular intervals in catch basin 10-647 during non-storm conditions. This catch basin received frequent short duration inputs of flow through the inlet pipe. The timing and duration suggest a sump pump somewhere discharging to the stormwater system. Since this is a stormwater drainage system a periodic discharge is suspect and can be an indication of an illicit discharge. On April 9, 2015, during non-storm conditions, samples were collected from catch basin 10-647 and upstream at catch basin 10-368 (Figures 5 and 6). Field crew noted that the water flowing into each catch basin was clear with minimal sediment. Bacteria values were low in both samples (Table 4) and other parameters did not indicate an illicit discharge. Note that concentrations in most parameters measured at 10-647 are higher in the baseflow sample than the in previous and current storm samples. This is not unusual as

Mercer Island 2015–2016 Water Quality Monitoring in Basin 10
King County 23 September 2016
dry season samples generally have higher concentrations due to the lack of dilution from rainwater (Hobbs et. al., 2015). Results from this baseflow event are not included in the calculations of median stormwater events.

Mercer Island 2015–2016 Water Quality Monitoring in Basin 10
King County 24 September 2016
Table 4. Results from non-storm sample collected at 10-647 and 10-638 on April 9, 2015. Highlighted values indicate where acute metals and conventional WQS were not met.
Units Site 10-647 (10C) Site 10-638
Hardness mg CaCO3/L 108 85.9
Dissolved Chromium µg/L 0.55 0.50
Dissolved Copper µg/L 53.8 60.2
Dissolved Lead µg/L 0.18 0.13
Dissolved Zinc µg/L 26.3 16.1
Field Conductivity µmhos/cm 202 356
Dissolved Oxygen Saturation % 95.4 97.2
Dissolved Oxygen mg/L 9.6 9.4
pH pH 7.9 8.1
Temperature deg C 15.2 16.8
Total Suspended Solids mg/L 2 1
Turbidity NTU 2.3 0.9
Fecal Coliform bacteria CFU/100ml 280 0
Hu-2-bacteroides copies/100 ml
not detected not detected
Nitrite + Nitrate Nitrogen mg/L 1.04 0.48
Orthophosphate Phosphorus mg/L 0.189 0.102
Total Nitrogen mg/L 1.67 1.32
Total Phosphorus mg/L 0.241 0.147
3.3 Storm Event Conventionals Basin 10 does not support salmonids and therefore WQS for temperature and dissolved oxygen are not directly applicable but a comparison is used here to characterize the data. Temperatures in basin 10 varied between stations by roughly 1-3 degrees (Table 5) on any given storm event sampling date, ranging from 7.9 to 17.4°C. Temperatures were above the WQS of 16°C during the October 7th sampling event. Dissolved oxygen concentrations ranged from a low of 4.4 to 11.7 mg/L (Table 4). Station 10-648 was the only catch basin

Mercer Island 2015–2016 Water Quality Monitoring in Basin 10
King County 25 September 2016
with pH measurements below the WQS of 6.5. With the exception of the October 7, 2015 sample, dissolved oxygen and temperatures at station 10 were within the WQS just upstream of discharge to the lake.
Conductivity was generally below 100 μhmos/cm (Table 5) during storm events. TSS and turbidity varied between storm events, but were consistently higher at sites 10-366 and 10-648 (Table 5, Figure 11).
Station 10-648 had the lowest DO, pH, and the highest conductivity of all the catch basins, particularly on January 13, 2016 when the catch basin was noted to have very low flow with lots of leaf debris (Table 3, Appendix A). Decomposing plant material can result in oxygen depletion. The lack of dilution from rain water in the catch basin, as well as dissolved ions will result in higher conductivity. According to air temperature measurements made at the Weather Underground station located at South Ellis Pond (KWAMERCE12), temperatures dropped below freezing at the end of December 2015 and first few days of January 2016. If de-icing agents were applied to roads or sidewalks in the basin during the period of freezing temperatures, some may have remained during the relatively dry weeks prior to the sampling event and washed into the drainage during the storm causing a spike in conductivity.

Mercer Island 2015–2016 Water Quality Monitoring in Basin 10
King County 26 September 2016
Table 5. Dissolved oxygen (DO), temperature, pH, conductivity and TSS measured in basin 10
during storm events, 2015-16. Highlighted values indicate where WQS were not met (see section 2.2)
Locator Date Dissolved Oxygen Temperature pH Conductivity
Total Suspended Solids Turbidity
(mg/L (°C) - (μhmos/cm) (mg/L) (NTU)
WQS ==>
>9.5 (mg/L) <16.0 (°C) 6.5 - 8.5
10 10/7/2015 9.2 16.8 6.7 53 7.4 11.3
11/9/2015 9.7 12.6 7.3 143 3.7 10.1
12/7/2015 11.2 9.4 6.9 62 26.4 27.1
1/13/2016 11.6 8.0 6.8 123 13.1 28.4
3/1/2016 11.0 9.8 7.4 83 31.0 50.2
10-108 10/7/2015 9.3 17.1 6.8 25 7.4 10.3
11/9/2015 10.4 12.1 7.1 26 4.5 9.1
12/7/2015 11.2 9.3 6.9 21 11.8 9.2
1/13/2016 11.7 7.9 6.9 17 10.1 8.9
3/1/2016 10.9 10.0 7.2 25 14.0 12.7
10-647 4/9/2015 9.6 15.2 7.9 202 1.5 2.3
10/7/2015 9.3 17.4 7.1 52 7.2 11.8
11/9/2015 10.2 12.9 7.2 66 6.7 11.6
12/7/2015 11.2 9.7 6.9 20 8.8 7.6
1/13/2016 11.6 8.5 7.0 28 8.6 6.7
3/1/2016 10.8 11.1 7.4 35 24.0 22.7
10-366 10/7/2015 8.6 16.9 6.8 43 54.8 69.1
11/9/2015 9.6 11.3 7.0 49 180.0 198.0
12/7/2015 10.7 9.1 6.6 26 70.4 49.1
1/13/2016 11.1 8.0 7.0 41 57.6 67.1
3/1/2016 11.2 9.7 7.3 24 145.0 74.1
10-648 10/7/2015 7.9 16.9 6.6 48 110.0 73.7
11/9/2015 7.1 11.3 6.4 57 26.6 47.4
12/7/2015 11.2 9.1 6.6 21 128.0 58.1
1/13/2016 4.4 7.9 6.0 394 378.0 114.0
3/1/2016 11.2 9.9 7.2 24 193.0 78.9
3.3.1 Storm Event Nutrients The two town center stations, 10-366 and 10-648 that had higher TSS also had consistently higher TP and TN, with median concentrations of TP of 0.206 and 0.218 mg/L, and TN of

Mercer Island 2015–2016 Water Quality Monitoring in Basin 10
King County 27 September 2016
1.38 and 1.45 mg/L, respectively (Figure 11). Higher total nutrient concentrations are consistent with elevated TSS as nutrients bind readily to particulate matter.
Median nitrate-nitrite concentrations ranged from 0.073 mg/L at station 10-108 to 0.326 mg/L at station 10. Median SRP concentrations ranged from 0.014 mg/L at station 10-648 to 0.0645 mg/L at station 10. Station 10 had the highest median dissolved nutrient concentrations measured in the basin with SRP:TP of 0.065 mg/L and nitrite-nitrate-N:TN of 0.326 mg/L. Station 10-647 had the highest SRP:TP ratio with a median value over 0.6 indicating that more than half of the phosphorus at this station is in soluble form (Figure 11). This is consistent with results from the last monitoring effort (King County 2015). Two other stations, 10-108 and 10 also had relatively high SRP:TP. Station 10 had the highest Nitrite-Nitrate-N:TN ratio in the basin.
3.3.2 Storm Event Organics Volatile organics and total petroleum hydrocarbon (TPH) were monitored during the first storm event on October 7, 2015. There were only a few detections of these chemicals and concentrations (Table 6). Acetone was detected at all five stations. Lube oil was detected at all four town center stations. And toluene was detected at station 10-366 and 10-648.
Acetone and toluene detections are one to many orders of magnitude below concentrations known to impact the growth, reproduction, or survival of aquatic organisms (EPA 2016). Diesel range organic concentrations are also relatively low compared to, for instance, oil spill sites. But 2 mg/L concentrations have been shown to cause acute mortality in rainbow trout (Irwin et al. 1997). Thus there is potential for the diesel or oil spilled on roadways or parking lots like the one adjacent to catch basin 10-366 to cause toxicity to downstream aquatic life.
Table 6. Detected volatile organics and total petroleum hydrocarbons in storm sample
collected on October 7, 2015 in basin 10.
KCEL lab ID Locator Collection
Date Acetone Lube Oil Range (>C24) Toluene
µg/L mg/L µg/L
L62303-1 10 7-Oct-15 3.3
L62303-5 10-108 7-Oct-15 5.2 0.216
L62303-2 10-647 7-Oct-15 4.4 0.213
L62303-3 10-366 7-Oct-15 7.9 1.12 1.2
L62303-4 10-648 7-Oct-15 8 0.971 2.73

Mercer Island 2015–2016 Water Quality Monitoring in Basin 10
King County 28 September 2016
This page intentionally left blank.

Mercer Island 2015–2016 Water Quality Monitoring in Basin 10
King County 29 September 2016
Figure 11. Box plots showing median, 75th, and 25th percentiles of TSS, SRP, TP, SRP:TP, Nitrite-nitrate-N, TN, and Conductivity for each station in basin 10, 2015-16 stormwater monitoring events.

Mercer Island 2015–2016 Water Quality Monitoring in Basin 10
King County 30 September 2016
This page intentionally left blank.

Mercer Island 2015–2016 Water Quality Monitoring in Basin 10
King County 31 September 2016
3.3.3 Storm Event Bacteria Fecal coliform samples collected at the three basin 10 sites exhibited a great deal of variability between events but in general were higher downstream of the town center station 10-647 (Figure 12). The focus of this effort was to isolate particular areas of the lower end of the basin where there may be sources of bacteria from human sewage.
The state WQS to protect waters for human consumption from FC is 100 CFU/100 ml. For comparison, the value of 1000 CFU used in the King County Swimming Beach Monitoring Program as a threshold for prompting further management actions. King County. Swimming Beach closure protocol uses the “Ten State Standard” (King County 2016). The Ten State Standard is a geometric mean of 200 CFU/100ml (colony forming units per 100 milliliter) fecal coliform with no single sample exceeding 1000 CFU/100ml. Typically values for fecal coliform and Bacteroidales ranging in the tens of thousands would indicate human sewage issues. In this sampling effort there were two dates when high fecal coliform were associated also with high Bacteroidales at station 10. Furthermore, there were three occasions when Bacteroidales values were above 10,000 copies/100 ml (Figure 12). On October 7, 2015, the Bacteroidales at station 10 was 16,000 copies/100 ml with an associated fecal coliform count of 3,600 CFU/100 ml. On November 9, 2015, the station 10 sample had a very high Bacteroidales value of 150,000 copies/100 ml associated with a fecal coliform bacteria value of 380 CFU/100 ml. (Note that the field crew was unable to collect a sample from station 10-77th on this date.) And on March 1, 2016, station 10-77th had a Bacteroidales value of 13,000 copies/100 ml associated with a fecal coliform count of 1,500 CFU/100 ml. These high Bacteroidales values indicate a potential human source entering the surface water somewhere upstream of station 10-77th and station 10.
Figure 12. Fecal coliform bacteria and Bacteroidales qPCR results measured at
stations 10, 10-77th, and 10-647 in 2015 and 2016.

Mercer Island 2015–2016 Water Quality Monitoring in Basin 10
King County 32 September 2016
3.3.4 Storm Event Metals The dCu and dZn concentrations during the 2015-16 storm event monitoring in basin 10 ranged from 1.5 µg/L to 16.8 µg/L, and 11.9 µg/L to 187.0 µg/L, respectively. The median dCu concentrations at station 10-647 (9.4 µg/L) was higher than other basin 10 stations (Figure 13, Table 7) and is over three times higher than the median stormwater concentration reported for commercial/industrial watersheds in the Puget Sound Toxics Loading Analysis (2.28 µg/L) (Herrera 2011). Median dZn concentrations at stations 10-108 (111 µg/L ) was more than three times the amount of those reported for stormwater in regional commercial/industrial watersheds (29.1 µg/L) (Herrera 2011).
All sites in the basin exceeded the dCu WQS at least once and three of the town centers station (10-647, 10-366, and 10-648) exceeded the dCu WQS during each sampling event. Station 10-108 exceeded the dZn WQS during each sampling events with a median dZn more than twice the other stations in the basin (Figure 13). As mentioned in section 2.3.4, the acute standards for dCu and dZn are hardness-dependent where the toxicity of these metals increases as water hardness decreases. The dCu concentrations at station 10-108 were less than 8.0 µg/L during all events but because the hardness values are also very low (≤ 10 mg/L CaCO3/L), the dCu values are calculated to exceed the WQS (Table 7). Increased flows from rainwater will generally result in decreased hardness due to dilution. For example, baseflow samples collected at station 10-648 have hardness values at least four times those measured during rain events (Table 7).
Ecology’s comparison of all stormwater data submitted through the NPDES permit found that there were significantly higher concentrations and mass balance loadings of metals and nutrients during the dry season (May – September) providing strong evidence for an influence of seasonality or antecedent dry periods (Hobbs, et.al., 2015). The October 7, 2015 storm event sample was collected after a record setting drought with no substantial rainfall for 10 days prior to the sampling event.

Mercer Island 2015–2016 Water Quality Monitoring in Basin 10
King County 33 September 2016
Table 7. Hardness (mg/L CaCO3), dissolved metal (µg/L) concentrations in basin 10
stormwater, 2015-16. Highlighted values exceed acute criteria. <MDL = less than the method detection limit.
Locator Date Hardness Cr,
dissolved Cu,
dissolved Pb,
dissolved Zn,
dissolved
(mg/CaCO3/L) (μg/L) (μg/L) (μg/L) (μg/L)
10 10/7/2015 19 0.54 5.6 0.21 31.3
11/9/2015 57 0.85 4.2 0.15 40.4
12/7/2015 22 0.49 3.0 0.18 20.4
1/13/2016 50 0.80 4.7 0.25 19.5
3/1/2016 36 0.56 2.7 <MDL 11.9 10-108 10/7/2015 8 0.56 7.4 0.73 187.0
11/9/2015 10 0.34 3.8 0.51 173.0
12/7/2015 9 0.35 1.8 0.16 92.2
1/13/2016 6 0.26 1.5 0.16 81.8
3/1/2016 10 0.72 2.1 0.12 111.0
10-647 4/9/2015 108 0.55 53.8 0.18 26.3 base flow
10/7/2015 18 0.44 16.8 0.52 57.0
11/9/2015 27 0.49 12.5 0.30 57.0
12/7/2015 8 0.21 5.0 0.13 29.6
1/13/2016 10 0.24 9.3 0.22 46.1
3/1/2016 17 0.26 9.4 0.18 34.3
10-366 10/7/2015 14 0.86 13.0 0.57 47.8
11/9/2015 27 0.84 12.5 1.22 43.2
12/7/2015 12 0.25 3.1 0.23 21.5
1/13/2016 15 0.70 5.7 0.61 43.2
3/1/2016 12 0.36 3.1 0.10 19.0 10-648 10/7/2015 22 0.70 12.2 0.46 42.2
11/9/2015 21 0.64 8.4 0.38 38.2
12/7/2015 13 0.23 2.9 0.17 18.3
1/13/2016 25 0.46 5.7 0.29 49.0
3/1/2016 13 0.29 3.9 0.10 18.3

Mercer Island 2015–2016 Water Quality Monitoring in Basin 10
King County 34 September 2016
Figure 13. Box plots showing median, 75th, and 25th percentiles of dissolved copper, dissolved zinc, and hardness for each
station in basin 10, 2015-16 stormwater monitoring events.

Mercer Island 2015–2016 Water Quality Monitoring in Basin 10
King County 35 September 2016
3.4 Flows and Storm Event Loading This study collected samples during rain events to represent peak flows in this flashy system. Flows in basin 10 are flashy as illustrated at station 10 when flows went from near the minimum recorded value to the maximum of 26 cfs in five minutes due to a cloudburst on August 12, 2015, with the water level at the gage increasing two feet (Appendix A). Timing and duration of rain events is unpredictable and often samples were collected either just prior to or following peak flows as shown on hydrographs for each station (Figures 14-18). As noted in Table 3, there was very little flow at stations 10-648 and 10-366 on January 13, 2016. Most of the flow in catch basin 10-366 was generated from the surface gutter (Appendix A).
The two town center stations with the larger drainage areas had the highest stormwater flows -10-647 at 470,000 cf, and station 10-108 at 160,000 cf (Table 8) which is to be expected. The two smaller drainage areas also had flows comparable to one another – station 10-366 at 66,000 cf, and station 10-648 at 79,000.
Figures 14–18. Hydrograph of mean daily discharge, maximum discharge of the day,
MERC daily rainfall daily flow data for stations 10, 10-108, 10-647, 10-366, and 10-648 in basin 10, 2015-16.
0
0.5
1
1.5
2
2.5
3
3.5
4
4.5
50
5
10
15
20
25
Jan-15 Apr-15 Aug-15 Nov-15 Feb-16
Daily
Rai
nfal
l, in
ches
Gag
e M
I1 D
isch
arge
, cfs
MI_10 Daily Discharge 1/27/2015 - 5/10/2016Mean_Flow Max_Flow Sample MERC rain, daily total

Mercer Island 2015–2016 Water Quality Monitoring in Basin 10
King County 36 September 2016
0
0.5
1
1.5
2
2.5
3
3.5
4
4.5
50
0.4
0.8
1.2
1.6
2
Feb-15 May-15 Aug-15 Dec-15 Mar-16
Daily
Rai
nfal
l, in
ches
Gag
e M
I1 D
isch
arge
, cfs
MI_10-108 Daily Discharge 2/26/2015 -5/10/2016
Mean_Flow Max_Flow Sample MERC rain, daily total
0
0.5
1
1.5
2
2.5
3
3.5
4
4.5
50
0.4
0.8
1.2
1.6
2
Feb-15 May-15 Aug-15 Dec-15 Mar-16
Daily
Rai
nfal
l, in
ches
Gag
e M
I1 D
isch
arge
, cfs
MI_10-647 Daily Discharge 2/26/2015 -5/10/2016
Mean_Flow Max_Flow Sample MERC rain, daily total

Mercer Island 2015–2016 Water Quality Monitoring in Basin 10
King County 37 September 2016
0
0.5
1
1.5
2
2.5
3
3.5
4
4.5
50
0.07
0.14
0.21
0.28
0.35
Feb-15 May-15 Aug-15 Dec-15 Mar-16
Daily
Rai
nfal
l, in
ches
Gag
e M
I1 D
isch
arge
, cfs
MI_10-366 Daily Discharge 2/26/2015 -5/10/2016
Mean_Flow Max_Flow Sample MERC rain, daily total
0
0.5
1
1.5
2
2.5
3
3.5
4
4.5
50
0.07
0.14
0.21
0.28
0.35
Feb-15 May-15 Aug-15 Dec-15 Mar-16
Daily
Rai
nfal
l, in
ches
Gag
e M
I1 D
isch
arge
, cfs
MI_10-648 Daily Discharge 2/26/2015 -5/10/2016
Mean_Flow Max_Flow Sample MERC rain, daily total

Mercer Island 2015–2016 Water Quality Monitoring in Basin 10
King County 38 September 2016
Loading was calculated based on the mean flow for the sampling period adjusted to remove baseflow and the average of the concentrations for the five sample events (Table 8). 𝑇𝑇𝑇𝑇𝑇𝑇𝑇𝑇𝑇𝑇 𝑉𝑉𝑇𝑇𝑇𝑇𝑉𝑉𝑉𝑉𝑉𝑉 (𝑐𝑐𝑐𝑐) = (𝑉𝑉𝑉𝑉𝑇𝑇𝑚𝑚 𝑐𝑐𝑇𝑇𝑇𝑇𝑓𝑓 𝑐𝑐𝑐𝑐𝑐𝑐 − 𝑏𝑏𝑇𝑇𝑐𝑐𝑉𝑉𝑐𝑐𝑇𝑇𝑇𝑇𝑓𝑓 𝑐𝑐𝑐𝑐𝑐𝑐)𝑥𝑥 183 𝑑𝑑𝑇𝑇𝑑𝑑𝑐𝑐 𝑥𝑥 86,400 𝑐𝑐𝑉𝑉𝑐𝑐𝑇𝑇𝑚𝑚𝑑𝑑𝑐𝑐/𝑑𝑑𝑇𝑇𝑑𝑑
𝐿𝐿𝑇𝑇𝑇𝑇𝑑𝑑 (𝑔𝑔) = 𝑇𝑇𝑇𝑇𝑇𝑇𝑇𝑇𝑇𝑇 𝑐𝑐𝑇𝑇𝑇𝑇𝑓𝑓 𝑥𝑥 28.05𝐿𝐿𝑐𝑐𝑐𝑐𝑥𝑥 𝑐𝑐𝑇𝑇𝑚𝑚𝑐𝑐
µ𝐿𝐿𝑥𝑥
1𝑔𝑔100,000µ𝑔𝑔
Of the four town center catch basins, station 10-647 contributed the highest calculated wet season dCu wet load (142 grams) to stormwater gravity main trunk line (Table 8). Station 10-647 and station 10-108 both had high dZn loads at 601 grams and 584 grams, respectively (Table 7).
Table 8. Total wet season volume (cf), mean dissolved metal concentration (µg/L) and loading (g) for basin 10 drainages, 2015-2016.
dCr dCu dPb dZn Hardness 10
Wet season total volume (cf) 8,500,000
8,500,000
8,500,000
8,500,000
8,500,000
Mean concentration (µg/L) 0.6 4.0 0.2 24.7 2.5 Wet Season Loading (grams) 156 968 38 5944 603
10-108
Wet season total volume (cf) 160,000
160,000
160,000
160,000
160,000
Mean concentration (µg/L) 0.4 3.3 0.3 129.0 0.1 Wet Season Loading (grams) 2.0 15.0 1.5 584 0.44
10-647
Wet season total volume (cf) 470,000
470,000
470,000
470,000
470,000
Mean concentration (µg/L) 0.328 10.586 0.2698 44.8 0.196 Wet Season Loading (grams) 4.4 142 3.6 601 2.6
10-366
Wet season total volume (cf) 66,000
66,000
66,000
66,000
66,000
Mean concentration (µg/L) 0.602 7.482 0.5458 34.94 0.018 Wet Season Loading (grams) 1.1 14 1.0 65 0.034
10-648
Wet season total volume (cf) 79,000
79,000
79,000
79,000
79,000
Mean concentration (µg/L) 0.464 6.614 0.28 33.2 0.024 Wet Season Loading (grams) 1.0 15 0.63 74 0.05

Mercer Island 2015–2016 Water Quality Monitoring in Basin 10
King County 39 September 2016
4.0 DISCUSSION & RECOMMENDATIONS
Because the concentrations of dCu have been significantly greater in the town center drainages in past studies (King County, 2015), the 2015-16 monitoring effort was focused in these drainages. The overall goal of this effort being to remedy a substantial defined portion of the stormwater quality exceedences and/or the loadings of dissolved metals. With this goal in mind, flows were monitored to determine the magnitude of stormwater pollutant loads and runoff volumes. An additional goal was to try and isolate segments of the lower reach of the basin to determine sources of the high fecal coliform bacteria.. Future efforts will focus on securing funding to move forward on prescribed remedies.
For this 2015-16 monitoring dCu concentrations and loadings were found to be highest at station 10-647. Concentrations of dZn were highest at station 10-108, while dZn loadings were similar at stations 10-108 and 10-647. Hardness values are relatively low at all of the town center sites compared with station 10 at the mouth of the basin. These low hardness values influence the calculated acute toxicity of the dissolved metals and all town center stations exceeded the dCu WQS, with one exception on December 7, 2015 at station 10-108. At station 10-108 high dZn concentrations combined with the low hardness resulted in all samples exceeding the dZn acute WQS.
Landscaping practices can contribute significant amounts of metals and nutrients to surface water; copper-based pesticides are one of the largest anthropogenic sources of dCu to the environment and fertilizers are a primary source of phosphorus in runoff (Ecology and King County 2011, King County 2015). Of the town center sites, station 10-647 had the highest median dissolved phosphorus concentration (0.047 mg/L SRP) which is more than double the median of 0.022 mg/L SRP found in the NPDES Phase I Stormwater Permit Study (Hobbs et.al., 2015). This site also had the highest median SRP:TP ratio (0.66 SRP:TP). The drainage for station 10-647 is relatively small and very urbanized where landscaping practices would be limited to street side plantings.
Other major sources of copper in stormwater runoff besides pesticides are leaching from residential plumbing, brake pad abrasion, and roofing materials. Smaller releases of copper also occur following the use of copper compounds in fountains and spas as an algaecide and from chromated copper arsenate (CCA) and copper azole treated wood. Commercial land use was found to have significantly higher dCu concentrations that other land uses in the NPDES Phase I Stormwater Permit Study with a median of 6.25 µg/L, and wet season samples were found to be significantly lower than dry season (wet weather mean = 4.6 µg/L) (Hobbs et.al., 2015). In the Phase I study, all land uses and seasons combined, dCu concentrations ranged from 0.62 to 122 µg/L. In basin 10 wet weather dCu concentrations ranged from 1.5 µg/L (station 10-108) to 16.8 µg/L (station 10-647). The baseflow dCu in the one sample collected at station 10-647 was 53.8 µg/L. The sources of dCu in the four town center drainages investigated for this study are likely a combination of those described above.

Mercer Island 2015–2016 Water Quality Monitoring in Basin 10
King County 40 September 2016
Major sources of zinc potentially include roofing material leaching, particularly those with galvanized components, and vehicle tire abrasion. Concentrations of dZn in basin 10 ranged from 11.9 µg/L (station 10) to 187 µg/L (station 10-108). Roofing materials used on the building complex adjacent to the catch basin at station 10-108 may be contributing to the consistently high zinc concentrations in the drainage. The range of dZn in the NPDES Phase I Stormwater Permit Study, all land uses and seasons combined, was 0.22 to 1090 µg/L (Hobbs et.al, 2015). The NPDES Phase I study found that commercial and industrial land uses were significantly higher than other land uses, and were lower in the wet season (wet weather mean = 40.6 µg/L). The one baseflow sample collected at station 10-647 had a dZn concentration of 26.3 µg/L. The dry season mean dZn in the NPDES Phase I study was 105.4 µg/L.
4.1 Recommended Next Steps The primary objective of this monitoring effort was to inform the preliminary design of retrofits to treat metals from these sub-drainages before they connect with the trunk line. Since stormwater treatment needs can vary greatly by location, it is important to have a wide variety of retrofit options from which to choose. In stormwater with low hardness levels, even relatively low dissolved copper concentrations that exceed WQS copper can be difficult to reduce with current treatment techniques. In addition, some of the current treatment technologies do not sufficiently remove copper and/or require large capital improvement expenditures. The Port of Seattle (Dewell, Jane, Port of Seattle, personal communication, July 12, 2016) has found oyster shell amendments reduce copper concentrations and toxicity potential in stormwater. The Port’s monitoring also suggests this treatment requires minimal construction and maintenance effort. The treatment is fairly low cost, using local recycled materials, and could be implemented in a variety of situations across the region. King County Science Section Staff have submitted a proposal to receive funds from Ecology’s Regional Stormwater Monitoring Program (RSMP) to implement and measure the effectiveness of oyster shell amendments in Mercer Island catch basins. If funds are awarded, the effectiveness study will begin in fall 2017.
The fecal coliform bacteria sampling in the downstream reach of basin 10 continues to indicate a source of fecal material entering the basin. High fecal coliform bacteria values were measured at station 10-77th and station 10. High Bacteriodales values (>10,000 copies/100 ml) were measured at station 10 twice and at station 10-77th once, indicating a source of human fecal material somewhere within this lower reach. A more frequent and targeted effort to further isolate smaller segments within this section of the basin is needed. Source tracking during non-storm events in late spring- early summer (when soils are saturated but there is less dilution from rainwater) is recommended in order to isolate potential illicit connections or other inputs. This effort could include the placement of conductivity and temperature data loggers deployed for extended periods of time. This method was used successfully in Thornton Creek by Seattle Public Utilities (Frodge 2015) and will be explored in future work throughout the King County.

Mercer Island 2015–2016 Water Quality Monitoring in Basin 10
King County 41 September 2016
5.0 REFERENCES Ecology. December 2011. Focus on Pollution Prevention. The Better Brakes Law.
Washington State Department of Ecology Publication Number 11-04-026.
Ecology and King County, 2011. Control of Toxic Chemicals in Puget Sound: Assessment of Selected Toxic Chemicals in the Puget Sound Basin, 2007-2011. Washington State Department of Ecology, Olympia, WA and King County Department of Natural Resources, Seattle, WA. Ecology Publication No. 11-03-055. http://www.ecy.wa.gov/biblio/1103055.html
(EPA) Environmental Protection Agency. 2007. Aquatic life ambient freshwater quality criteria – Copper 2007 revision. United States Environmental Protection Agency, Washington, D.C.
EPA. 2016. Aquatox aquatic toxicity database, available online at: https://cfpub.epa.gov/ecotox/quick_query.htm Queried August 31, 2016.
Frodge, Jonathan. 2015. Seattle Public Utilities, presentation at the King County Science Seminar, Nov 5, 2015. Presentations can be viewed online: http://green.kingcounty.gov/WLR/Science/Seminar/Seminars.aspx
Herrera Environmental Consultants. 2011. Toxics in Surface Runoff to Puget Sound: Phase 3 Data and Load Estimates. Prepared for Washington State Department of Ecology. Ecology Publication No: 11-03-010. https://fortress.wa.gov/ecy/publications/publications/1103010.pdf
Hobbs, W., B. Lubliner, N. Kale, and E. Newell. 2015. Western Washington NPDES Phase 1 Stormwater Permit: Final Data Characterization 2009-2013. Washington State Department of Ecology, Olympia, WA. Publication No. 15-03-001. https://fortress.wa.gov/ecy/publications/SummaryPages/1503001.html.
Irwin, R.J., M. VanMouwerik, L. Stevens, M.D. Seese, and W. Basham. 1997. Environmental Contaminants Encyclopedia. National Park Service, Water Resources Division, Fort Collins, Colorado. Available online at: http://nature.nps.gov/hazardssafety/toxic/diesel.pdf Accessed August 31, 2016.
King County. 2005. Environmental laboratory quality assurance manual. Prepared by King County Department of Natural Resources and Parks, Water and Land Resources Division.

Mercer Island 2015–2016 Water Quality Monitoring in Basin 10
King County 42 September 2016
King County. 2007. Sampling Stream and River Water (SOP #214). Prepared by King County Department of Natural Resources and Parks, Water and Land Resources Division.
King County. 2008. Clean Sampling of Surface Water for Ultra Trace Metals and Trace Organics (SOP #222 - modified). Prepared by King County Department of Natural Resources and Parks, Water and Land Resources Division.
King County. 2011. Water quality monitoring of five Mercer Island drainage basins from 2008–2010. Prepared by Debra Bouchard, Water and Land Resources Division. Seattle, Washington.
King County. 2012. Draft Standard Operating Procedure for Bacteroides in Environmental Waters by Membrane Filtration and qPCR. SOP # 563V0. King County Environmental Lab.
King County. 2013. Mercer Island 2011–2012 Water Quality Monitoring Basins 10 and 32. Prepared by Debra Bouchard, Water and Land Resources Division for Patrick Yamashita, City of Mercer Island.
King County. 2015. Mercer Island 2013-2014 Water Quality Monitoring Basins 10 and 32b. Prepared by Debra Bouchard, Water and Land Resources Division. Seattle, WA.
King County. 2016. King County Swimming Beach Monitoring. King County Department of Natural Resources and Parks. Water and Land Resources Division. http://green2.kingcounty.gov/swimbeach/default.aspx.
Seattle Weather Blog. Data summaries using data collected from Sea-Tac Airport. http://www.seattleweatherblog.com.
Wilhelm, J. 2009. Dissolved Copper and Zinc Water Quality Summary 1999–2009. Report prepared by Jo Wilhelm, King County Water and Land Resources Division, for Patrick Yamashita, City of Mercer Island.

Mercer Island 2015–2016 Water Quality Monitoring in Basin 10
King County A-1 September 2016
Appendix A
Flow Monitoring in Basin 10

Mercer Island 2015–2016 Water Quality Monitoring in Basin 10
King County A-2 September 2016
This page intentionally left blank.

Mercer Island 2015–2016 Water Quality Monitoring in Basin 10
King County A-3 September 2016
FLOW DATA REPORT In February 2015 the WLRD stream monitoring program installed four flow monitoring stations in catch basins at the intersection of SE 27th ST and 77th AV SE and an open channel stream gage above the SE 22nd Street crossing of basin 10 drainage on Mercer Island. The flow monitoring was in support of the water quality investigation activities recommended in the 2003-14 Water Quality Monitoring Basins 10 and 32b report of 2015. The results of the flow monitoring are presented here. A screening level analysis of metals loading for each monitoring site was performed.
All five sites use Onset model U20L-04 water level data loggers to record water level at 5-minute intervals. A local gage datum was established at each site to use as a stream stage reference. Each catch basin site is installed upstream of a pipe in the stormwater conveyance system. A zero stage reading corresponds to the invert of the pipe at its entrance. The open channel gage was established at a stable cross section approximately 100 feet above the culvert entrance at SE 22nd Street. A stage – discharge relationship was determined for each site based on discharge measurements made during the monitoring period and equations for pipe flow. Continuous flow at each site was calculated by applying the stage – discharge relationship to the 5-minute water level record using automated routines developed by WLRD staff. The results are stored in the KC Hydrologic Information Center (HIC) database and are available publically at the website: http://green.kingcounty.gov/wlr/waterres/hydrology/. Rainfall is recorded with a tipping bucket rain gage at a site on the Mercer Island High School campus. Data from the rain gage are stored in the KC Hydrologic Information Center (HIC) database under the locator MERC.
The results of the flow computations are presented in charts. Each chart covers the time period February 26, 2015 through May 10, 2016 with the exception of Site10 which started January 27, 2015. The first set of charts (Figures A1–A5) displays mean daily discharge, maximum discharge of the day, daily rainfall daily flow data for the period of record, and water quality collection dates. The second set of charts (Figures A6–A10) displays flows measured every five minutes for the wet season sampling period October 1, 2015 through March 31, 2016, the water quality sampling dates, and the 24 hour rainfall proceeding the sample time. The third set of charts (Figures A11–A15) displays the metals concentration results from the water quality sampling at each site with the calculated flow at the time of the sample.
Table A1 presents the results of the metals loading calculations, based on the mean flow for the sampling period adjusted to remove baseflow and the average of the concentrations for the five sample events. Total Flow = Mean flow – baseflow adjustment (cubic feet/second)* 183(days) * 86,400 (seconds/day). Load (grams) = Total cubic feet * 28.05 (liters/cubic foot) * concentration (µg/liter) * 1 (gram/10^6 µg).
Though gages were in place, water quality sampling did not begin until October 2015 due to timing of the rain events and staff availability. No flow data were collected for the period 5/28/2015 – 8/7/2015 due to a data collection system error. However, very little rain

Mercer Island 2015–2016 Water Quality Monitoring in Basin 10
King County A-4 September 2016
(~0.5”) fell during the period. Mean daily discharge was estimated for the gage at stream location MI_10A for the period.
Site 10 - above SE 22nd Street, near mouth.
The flow gage for this location was installed about 100 feet upstream of the water quality station and the culvert under SE 22nd Street. A 2 inch diameter steel pipe is attached to a steel post well driven into the stream bed on the left bank. The water level recorder was suspended in the steel pipe and recorded water level at five minute intervals. Direct measurements of discharge were made at various locations in the channel depending on flow conditions. The channel is mostly broken rock ranging from fine grain to over 12 inches thick. The bank is covered with English Ivy on the left and a variety of non-native vines on the left bank. There is some undercutting of the bank in places.
The stream appears to be perennial, although it is not part of the either the WRIA 8 inventory of streams or the King County Sensitive Areas streams inventory. The mean flow for the period May 10, 2015 – May 10, 2016 was 0.37 cfs. The accuracy of the discharge record is poor (+/- 25%) for flows above 10 cfs and below 0.1 cfs. The complete flow monitoring period comprised 469 days (1/27/2015 – 5/10/2016). The instantaneous peak discharge for the monitoring period was 26 cfs. Flow exceeded 20 cfs for about 50 minutes during the period, exceeded 10 cfs for 12 hours in the monitoring period, and exceeded 5 cfs for 149 hours, or 1.3% of the time. Streamflow went from near the minimum recorded value to the maximum of 26 cfs in five minutes due to a cloudburst on August 12, 2015, with the water level at the gage increasing two feet.
Site 10-108 - cb 108 on the NW corner intersection of SE 27th ST and 77th AV SE
This flow gage measured water level in a rectangular catch basin above a 12 inch diameter round PVC pipe. A small baseflow was observed at times at this site. The water level record gives evidence that the catch basin leaks water to the surrounding ground. The mean flow for the period May 10, 2015 – May 10, 2016 was 0.01 cfs. The accuracy of the flow record above 0.5 cfs and below 0.05 cfs is poor (+/- 25%). The complete flow monitoring period comprised 440 days (2/26/2015 – 5/10/2016). The instantaneous peak discharge for the monitoring period was 1.0 cfs. Flow exceeded 0.9 cfs for about 60 minutes during the period, exceeded 0.5 cfs for about 10 hours in the monitoring period, and exceeded 0.1 cfs for 278 hours, or 2.6% of the time. 0 flow was recorded 70% of the time.
Site 10-647 - cb 647 NE corner of SE 27th ST and 77th AV SE
This flow gage measured water level in a rectangular catch basin above a 12 inch diameter round corrugated metal pipe. Flow enters the catch basin from a 12 inch pipe to the east. This catch basin received frequent short duration inputs of flow through the inlet pipe. The timing and duration suggest a sump pump somewhere discharging to the stormwater system. The mean flow for the period May 10, 2015 – May 10, 2016 was 0.02 cfs. The accuracy of the flow record above 0.5 cfs and below 0.05 cfs is poor (+/- 25%). The

Mercer Island 2015–2016 Water Quality Monitoring in Basin 10
King County A-5 September 2016
complete flow monitoring period comprised 440 days (2/26/2015 – 5/10/2016). The instantaneous peak discharge for the monitoring period was 2.6 cfs during the August 12, 2015 cloudburst. The next highest five minute peak flow was 1.5 cfs. Flow exceeded 1.0 cfs for about 120 minutes during the period, exceeded 0.5 cfs for about 31 hours in the monitoring period, and exceeded 0.1 cfs for 633 hours, or 6% of the time. 0 flow was recorded 61% of the time.
Site 10-366 - cb 366 SE corner intersection of SE 27th ST and 77th AV SE
This flow gage measured water level in a rectangular catch basin above a 12 inch diameter round corrugated metal pipe. Flow into the catch basin is from a smaller (~6 inch diameter) pipe placed about one foot above the outlet pipe invert. The invert to the outlet pipe is nearly 5 feet below street level. Most of the flow observed in the catch basin was from the surface gutter. The maximum water level above the invert of the outlet pipe was 0.25 feet. The discharge for that water level was estimated as 0.2 cfs. The mean flow for the period May 10, 2015 – May 10, 2016 was 0.002 cfs. The accuracy of the flow record is poor (+/- 25%). The complete flow monitoring period comprised 440 days (2/26/2015 – 5/10/2016). The instantaneous peak discharge for the monitoring period was 0.2 cfs. Flow exceeded 0.1 cfs for about four hours during the period, exceeded 0.05 cfs for about 70 hours in the monitoring period, and exceeded 0.01 cfs for 1260 hours, or 1 2% of the time. 0 flow was recorded 88% of the time.
Site 10-648 - cb 648 SW corner of SE 27th ST and 77th AV SE
This flow gage measured water level in a rectangular catch basin above a 12 inch diameter round corrugated metal pipe. Flow enters the catch basin from a six inch PVC pipe to the west. A larger metal pipe coming from the south did not seem to carry water. This catch basin had noticeable amounts of leaf debris that interfered with the water level measurements. The decaying organic matter and other scum seemed to degrade the functioning of the water level recorder in the later weeks of the study. Adjustments were made to the water level record to account for the periods when the debris elevated the readings indicating a baseflow when none was present, but the record likely still over estimates the quantity and duration of flow. The water level fluctuated 0.25 feet from zero to maximum flow. The site only flowed during and near times of active rainfall. The mean flow for the period May 10, 2015 – May 10, 2016 was 0.003 cfs. The accuracy of the flow record is poor (+/- 25%). The complete flow monitoring period comprised 440 days (2/26/2015 – 5/10/2016). The instantaneous peak discharge for the monitoring period was 0.16 cfs. Flow exceeded 0.1 cfs for about nine hours during the period, exceeded 0.5 cfs for 249 hours in the monitoring period, and exceeded 0.01 cfs for 1341 hours, or 13% of the time. 0 flow was recorded 87% of the time.

Mercer Island 2015–2016 Water Quality Monitoring in Basin 10
King County A-6 September 2016
Figure A1. Hydrograph of mean daily discharge, maximum discharge of the day,
MERC daily rainfall daily flow data for Site 10 from January 2015 through May 2016.
0
0.5
1
1.5
2
2.5
3
3.5
4
4.5
50
5
10
15
20
25
Jan-15 Apr-15 Aug-15 Nov-15 Feb-16
Daily
Rai
nfal
l, in
ches
Gag
e M
I1 D
isch
arge
, cfs
MI_10 Daily Discharge 1/27/2015 - 5/10/2016Mean_Flow Max_Flow Sample MERC rain, daily total

Mercer Island 2015–2016 Water Quality Monitoring in Basin 10
King County A-7 September 2016
Figure A2. Hydrograph of mean daily discharge, maximum discharge of the day,
MERC daily rainfall daily flow data for site 10-108 from January 2015 through May 2016.
0
0.5
1
1.5
2
2.5
3
3.5
4
4.5
50
0.4
0.8
1.2
1.6
2
Feb-15 May-15 Aug-15 Dec-15 Mar-16
Daily
Rai
nfal
l, in
ches
Gag
e M
I1 D
isch
arge
, cfs
MI_10-108 Daily Discharge 2/26/2015 -5/10/2016
Mean_Flow Max_Flow Sample MERC rain, daily total

Mercer Island 2015–2016 Water Quality Monitoring in Basin 10
King County A-8 September 2016
Figure A3. Hydrograph of mean daily discharge, maximum discharge of the day,
MERC daily rainfall daily flow data for site 10-647 from January 2015 through May 2016.
0
0.5
1
1.5
2
2.5
3
3.5
4
4.5
50
0.4
0.8
1.2
1.6
2
Feb-15 May-15 Aug-15 Dec-15 Mar-16
Daily
Rai
nfal
l, in
ches
Gag
e M
I1 D
isch
arge
, cfs
MI_10-647 Daily Discharge 2/26/2015 -5/10/2016
Mean_Flow Max_Flow Sample MERC rain, daily total

Mercer Island 2015–2016 Water Quality Monitoring in Basin 10
King County A-9 September 2016
Figure A4. Hydrograph of mean daily discharge, maximum discharge of the day,
MERC daily rainfall daily flow data for site 10-366 from January 2015 through May 2016.
0
0.5
1
1.5
2
2.5
3
3.5
4
4.5
50
0.07
0.14
0.21
0.28
0.35
Feb-15 May-15 Aug-15 Dec-15 Mar-16
Daily
Rai
nfal
l, in
ches
Gag
e M
I1 D
isch
arge
, cfs
MI_10-366 Daily Discharge 2/26/2015 -5/10/2016
Mean_Flow Max_Flow Sample MERC rain, daily total

Mercer Island 2015–2016 Water Quality Monitoring in Basin 10
King County A-10 September 2016
Figure A5. Hydrograph of mean daily discharge, maximum discharge of the day,
MERC daily rainfall daily flow data for site 10-648 from January 2015 through May 2016.
0
0.5
1
1.5
2
2.5
3
3.5
4
4.5
50
0.07
0.14
0.21
0.28
0.35
Feb-15 May-15 Aug-15 Dec-15 Mar-16
Daily
Rai
nfal
l, in
ches
Gag
e M
I1 D
isch
arge
, cfs
MI_10-648 Daily Discharge 2/26/2015 -5/10/2016
Mean_Flow Max_Flow Sample MERC rain, daily total

Mercer Island 2015–2016 Water Quality Monitoring in Basin 10
King County A-11 September 2016
Figure A6. Hydrograph flows measured every five minutes during the wet season
(October 1, 2015 through March 2016) at site 10 with sample event 24 hour MERC rain total.

Mercer Island 2015–2016 Water Quality Monitoring in Basin 10
King County A-12 September 2016
Figure A7. Hydrograph flows measured every five minutes during the wet season
(October 1, 2015 through March 2016) at site 10-108 with sample event 24 hour MERC rain total.
0
0.4
0.8
1.2
1.6
2
2.4
2.8
3.2
3.6
40
0.1
0.2
0.3
0.4
0.5
0.6
0.7
0.8
0.9
1
10/1 10/15 10/29 11/12 11/26 12/10 12/24 1/7 1/21 2/4 2/18 3/3 3/17 3/31
24 H
our R
ainf
all,
inch
es
5 M
inut
e St
ream
flow
, cfs
108 Discharge_cfsOctober 2015 - March 2016
108 Discharge_cfs Sample Event 24 hr. Rain Total

Mercer Island 2015–2016 Water Quality Monitoring in Basin 10
King County A-13 September 2016
Figure A8. Hydrograph flows measured every five minutes during the wet season
(October 1, 2015 through March 2016) at site 10-647 with sample event 24 hour MERC rain total.
0
0.4
0.8
1.2
1.6
2
2.4
2.8
3.2
3.6
40
0.02
0.04
0.06
0.08
0.1
0.12
0.14
0.16
0.18
0.2
10/1 10/15 10/29 11/12 11/26 12/10 12/24 1/7 1/21 2/4 2/18 3/3 3/17 3/31
5 M
inut
e St
ream
flow
, cfs
366 Discharge_cfsOctober 2015 - March 2016
366 Discharge_cfs Sample Event 24 hr. Rain Total

Mercer Island 2015–2016 Water Quality Monitoring in Basin 10
King County A-14 September 2016
Figure A9. Hydrograph flows measured every five minutes during the wet season
(October 1, 2015 through March 2016) at site 10-366 with sample event 24 hour MERC rain total.
0
0.4
0.8
1.2
1.6
2
2.4
2.8
3.2
3.6
40
0.2
0.4
0.6
0.8
1
1.2
1.4
1.6
1.8
2
10/1 10/15 10/29 11/12 11/26 12/10 12/24 1/7 1/21 2/4 2/18 3/3 3/17 3/31
24 H
our R
ainf
all,
inch
es
5 M
inut
e St
ream
flow
, cfs
647 Discharge_cfsOctober 2015 - March 2016
647 Discharge_cfs Sample Event 24 hr. Rain Total

Mercer Island 2015–2016 Water Quality Monitoring in Basin 10
King County A-15 September 2016
Figure A10. Hydrograph flows measured every five minutes during the wet season
(October 1, 2015 through March 2016) at site 10-648) with sample event 24 hour MERC rain total.
Figure A11. Metals concentrations at site 10 with the calculated flow at the time of the
sample.
0
0.4
0.8
1.2
1.6
2
2.4
2.8
3.2
3.6
40
0.02
0.04
0.06
0.08
0.1
0.12
0.14
0.16
0.18
0.2
10/1 10/15 10/29 11/12 11/26 12/10 12/24 1/7 1/21 2/4 2/18 3/3 3/17 3/31
24 H
our R
ainf
all,
inch
es
5 M
inut
e St
ream
flow
, cfs
648 Discharge_cfsOctober 2015 - March 2016
648 Discharge_cfs Sample Event 24 hr. Rain Total

Mercer Island 2015–2016 Water Quality Monitoring in Basin 10
King County A-16 September 2016
Figure A12. Metals concentrations at site 10-108 with the calculated flow at the time of the sample.
Figure A13. Metals concentrations at site 10-647 with the calculated flow at the time of the sample.

Mercer Island 2015–2016 Water Quality Monitoring in Basin 10
King County A-17 September 2016
Figure A14. Metals concentrations at site 10-366 with the calculated flow at the time of the sample.
Figure A15. Metals concentrations at site 10-648 with the calculated flow at the time of the sample.

Mercer Island 2015–2016 Water Quality Monitoring in Basin 10
King County A-18 September 2016
Table A-1. Total wet season volume (cf), mean dissolved metal concentration (µg/L) and loading
(g) for basin 10 drainages, 2015-2016.
dCr dCu dPb dZn Hardness 10
Wet season total volume (cf) 8,500,000
8,500,000
8,500,000
8,500,000
8,500,000
Mean concentration (µg/L) 0.6 4.0 0.2 24.7 2.5 Wet Season Loading (grams) 156 968 38 5944 603
10-108
Wet season total volume (cf) 160,000
160,000
160,000
160,000
160,000
Mean concentration (µg/L) 0.4 3.3 0.3 129.0 0.1 Wet Season Loading (grams) 2.0 15.0 1.5 584 0.44
10-647
Wet season total volume (cf) 470,000
470,000
470,000
470,000
470,000
Mean concentration (µg/L) 0.328 10.586 0.2698 44.8 0.196 Wet Season Loading (grams) 4.4 142 3.6 601 2.6
10-366
Wet season total volume (cf) 66,000
66,000
66,000
66,000
66,000
Mean concentration (µg/L) 0.602 7.482 0.5458 34.94 0.018 Wet Season Loading (grams) 1.1 14 1.0 65 0.034
10-648
Wet season total volume (cf) 79,000
79,000
79,000
79,000
79,000
Mean concentration (µg/L) 0.464 6.614 0.28 33.2 0.024 Wet Season Loading (grams) 1.0 15 0.63 74 0.05

Mercer Island 2015–2016 Water Quality Monitoring in Basin 10
King County A-19 September 2016
Chromium, Dissolved, ICP-MS
Copper, Dissolved, ICP-MS
Lead, Dissolved, ICP-MS
Zinc, Dissolved, ICP-MS
Hardness, Calc
MERCER10-108 Cr Cu Pb Zn
Wet season total cf 160,000 160,000 160,000 160,000 160,000 Mean concentration ug/L 0.446 3.318 0.3344 129 0.098Wet Season Loading, grams 2.0 15.0 1.5 584 0.44
MERCER10-366
Wet season total cf 66,000 66,000 66,000 66,000 66,000 Mean concentration ug/L 0.602 7.482 0.5458 34.94 0.018Wet Season Loading, grams 1.1 14 1.0 65 0.034
MERCER10-647_10C
Wet season total cf 470,000 470,000 470,000 470,000 470,000 Mean concentration ug/L 0.328 10.586 0.2698 44.8 0.196Wet Season Loading, grams 4.4 142 3.6 601 2.6
MERCER10-648
Wet season total cf 79,000 79,000 79,000 79,000 79,000 Mean concentration ug/L 0.464 6.614 0.28 33.2 0.024Wet Season Loading, grams 1.0 15 0.63 74 0.05
MERCER10-A
Wet season total cf 8,500,000 8,500,000 8,500,000 8,500,000 8,500,000 Mean concentration ug/L 0.648 4.022 0.158 24.7 2.504Wet Season Loading, grams 156 968 38 5944 603

Mercer Island 2015–2016 Water Quality Monitoring in Basin 10
King County A-20 September 2016
This page intentionally left blank.

Mercer Island 2015–2016 Water Quality Monitoring in Basin 10
King County B-1 September 2016
Appendix B Summary of Precipitation from
MERC rain gauge

Mercer Island 2015–2016 Water Quality Monitoring in Basin 10
King County B-2 September 2016
This page intentionally left blank.

Mercer Island 2015–2016 Water Quality Monitoring in Basin 10
King County B-3 September 2016

Mercer Island 2015–2016 Water Quality Monitoring in Basin 10
King County B-4 September 2016
This page intentionally left blank.

Mercer Island 2015–2016 Water Quality Monitoring in Basin 10
King County C-1 September 2016
Appendix C
Data Reports

Mercer Island 2015–2016 Water Quality Monitoring in Basin 10
King County C-2 September 2016
This page intentionally left blank.

FSU Field Observations – WG138872
Date: 4/9/2015
Reported By: J. Power
Sample #(s): L62560 1, 3-4
Project Name: Mercer Island Baseflow (Catchbasin flow investigation)
Project Number: 421195-180
Field Personnel: JP
Weather During Sampling Run
Precipitation No precipitation
Sunny
Overcast
On and off rain
Light Rain
Steady Rain
Heavy Rain
Snow
Other
Precipitation
totals No precipitation
Trace
0 - .25in
.25 - .50 in
.50 - .75 in
.75 – 1.0 in
Above 1.0 in
Temperature 20
o s
30o s
40o s
50o s
60o s
70o s
80o s
90o s
Wind No wind
0 – 5 knots
5 - 10 knots
10 - 15 knots
15 - 20 knots
20 - 25 knots
Above 25 knots
Variable to
N S E W
Tide NA
Ebbing
Flooding
High tide
Low Tide
Slack
Additional comments: Mostly dry over previous few days
Recent weather or conditions that may influence on water quality/quantity:
Precipitation No precipitation
Sunny
Overcast
On and off rain
Light Rain
Steady Rain
Heavy Rain
Snow
Other
Precipitation
totals No precipitation
Trace
0 - .25in
.25 - .50 in
.50 - .75 in
.75 – 1.0 in
Above 1.0 in
Temperature 20
o s
30o s
40o s
50o s
60o s
70o s
80o s
90o s
Wind No wind
0 – 5 knots
5 - 10 knots
10 - 15 knots
15 - 20 knots
20 - 25 knots
Above 25 knots
Variable to
N S E W
Tide NA
Ebbing
Flooding
High tide
Low Tide
Slack
Additional comments:

Specific observations that may affect results: L62560-3 samples were collected from catchbasin 10-368 (not
10-648 as intended by Bouchard).
Algae Bloom Observed Yes No
Type:
Flecks
Thin Film
Thick Scum
Small Clumps
Filamentous Green Algae
Marine
Location:
Equipment used for sampling: Pitcher and rope
Issues:
Specific settings:
Equipment used for field analysis: YSI EXO
Hach turbidity meter
Issues:
Specific settings:
Other observations:
Samples collected from catchbasin 647 (NE corner) as planned. Flow cycle from east seemed to be
about every 10-15 minutes. Water appeared clear. Catchbasin appeared to have only minimal sediment
on bottom after vactoring.
No samples collected from catchbasin 108 (NW corner) as there was no flow. Standing water at
bottom of conveyance line. Inflow pipe from west was wet at bottom but no actual flow. Observed for
about 20 minutes and gave up as no flow and traffic increasingly heavy.
Received call from Bouchard around 11:30 (just leaving downtown Mercer Island) requesting that I

attempt to collect a sample from 10-648 which is directly to the east at intersection of 78th
and 27th
.
Checked all catchbasins on north side of that intersection and sampled the only one that had flow.
Later ID'd as 10-368 (not 10-648). Flow into 368 at same frequency as observed in 647. Water
appeared clear.

King County Environmental Lab Analytical Report
Project: 421195-180 Project: 421195-180 Project: 421195-180
Locator: MERCERISL10 Locator: MERCER10-647_10C Locator: MERCER10-366
Descrip: SE 22ND ST, NEAR M Descrip: CATCHBASIN ON NE C Descrip: CATCHBASIN ON SE C
Sample: L62303-1 Sample: L62303-2 Sample: L62303-3
Matrix: LG STORM WTR Matrix: LG STORM WTR Matrix: LG STORM WTR
ColDate: 10/7/15 13:26 ColDate: 10/7/15 12:35 ColDate: 10/7/15 11:40
TimeSpan: TimeSpan: TimeSpan:
TotalSolid: TotalSolid: TotalSolid:
ClientLoc: ClientLoc: Same as MERCER10C ClientLoc:
SampDepth: SampDepth: SampDepth:
WET Weight Basis WET Weight Basis WET Weight Basis
Parameters Value Qual MDL RDL Units Value Qual MDL RDL Units Value Qual MDL RDL UnitsCV SM2540-D
Total Suspended Solids 7.4 0.5 1 mg/L 7.2 0.7 1.3 mg/L 54.8 2 4 mg/LCV SM4500-N-C
Total Nitrogen 0.809 0.05 0.1 mg/L 1.11 0.05 0.1 mg/L 2 0.15 0.3 mg/LCV SM4500-NO3-F
Nitrite + Nitrate Nitrogen 0.326 0.01 0.04 mg/L 0.41 0.01 0.04 mg/L 0.268 0.01 0.04 mg/LCV SM4500-P-B,F
Total Phosphorus 0.116 0.005 0.01 mg/L 0.169 0.005 0.01 mg/L 0.237 0.015 0.03 mg/LCV SM4500-P-F
Orthophosphate Phosphorus 0.0671 0.0005 0.002 mg/L 0.0658 0.005 0.02 mg/L 0.0627 0.0005 0.002 mg/LES NONE
Client Locator Same as MERCER10C none
Conductivity, Field 52.6 0.5 10 umhos/cm 52 0.5 10 umhos/cm 42.8 0.5 10 umhos/cm
Discharge Rate of Stream 2 0.05 0.1 cfs
Dissolved Oxygen Saturation, Field 95.1 % 97.4 % 88.4 %
Dissolved Oxygen, Field 9.2 0.5 1 mg/L 9.3 0.5 1 mg/L 8.6 0.5 1 mg/L
Field Personnel HF/SH none HF/SH none HF/SH none
pH, Field 6.73 pH 7.12 pH 6.78 pH
Sample Function
Sample Temperature, Field 16.8 deg C 17.4 deg C 16.9 deg C
Turbidity, Field 11.3 0.5 2 NTU 11.8 0.5 2 NTU 69.1 0.5 2 NTUMC MICRO SOP570VD
Hu-2-bacteroides 160 JU copies/ml <MDL 0.01 copies/mlMC SM 9222D 20TH
Fecal Coliform 3600 CFU/100ml 1300 CFU/100mlMT EPA 200.8*SW846 6020A
Calcium, Total, ICP-MS 5390 50 50 ug/L 5400 50 50 ug/L 4490 50 50 ug/L
Chromium, Dissolved, ICP-MS 0.54 <RDL 0.2 1 ug/L 0.44 <RDL 0.2 1 ug/L 0.86 <RDL 0.2 1 ug/L
Copper, Dissolved, ICP-MS 5.6 0.2 2 ug/L 16.8 0.2 2 ug/L 13 0.2 2 ug/L
Lead, Dissolved, ICP-MS 0.21 <RDL 0.1 0.5 ug/L 0.519 0.1 0.5 ug/L 0.57 0.1 0.5 ug/L
Magnesium, Total, ICP-MS 1450 50 50 ug/L 1130 50 50 ug/L 678 50 50 ug/L
Zinc, Dissolved, ICP-MS 31.3 0.5 2.5 ug/L 57 0.5 2.5 ug/L 47.8 0.5 2.5 ug/LMT EPA 200.8/SW846 6020A*SM2340B
Hardness, Calc 19.4 0.331 0.331 mg CaCO3/L 18.1 0.331 0.331 mg CaCO3/L 14 0.331 0.331 mg CaCO3/LOR EPA 624/SW846 5030C*8260C
1,1,1-Trichloroethane <MDL 1 2 ug/L <MDL 1 2 ug/L <MDL 1 2 ug/L
1,1,2,2-Tetrachloroethane <MDL 1 2 ug/L <MDL 1 2 ug/L <MDL 1 2 ug/L
1,1,2-Trichloroethane <MDL 1 2 ug/L <MDL 1 2 ug/L <MDL 1 2 ug/L
1,1,2-Trichloroethylene <MDL 1 2 ug/L <MDL 1 2 ug/L <MDL 1 2 ug/L
1,1-Dichloroethane <MDL 1 2 ug/L <MDL 1 2 ug/L <MDL 1 2 ug/L
1,1-Dichloroethylene <MDL 1 2 ug/L <MDL 1 2 ug/L <MDL 1 2 ug/L
1,2-Dibromoethane <MDL 1 2 ug/L <MDL 1 2 ug/L <MDL 1 2 ug/L
1,2-Dichlorobenzene <MDL 1 2 ug/L <MDL 1 2 ug/L <MDL 1 2 ug/L
12/11/2015 J:\L62303.XLS Information Systems And Data Analysis Page 1 of 5

King County Environmental Lab Analytical Report
Project: 421195-180 Project: 421195-180 Project: 421195-180
Locator: MERCERISL10 Locator: MERCER10-647_10C Locator: MERCER10-366
Descrip: SE 22ND ST, NEAR M Descrip: CATCHBASIN ON NE C Descrip: CATCHBASIN ON SE C
Sample: L62303-1 Sample: L62303-2 Sample: L62303-3
Matrix: LG STORM WTR Matrix: LG STORM WTR Matrix: LG STORM WTR
ColDate: 10/7/15 13:26 ColDate: 10/7/15 12:35 ColDate: 10/7/15 11:40
TimeSpan: TimeSpan: TimeSpan:
TotalSolid: TotalSolid: TotalSolid:
ClientLoc: ClientLoc: Same as MERCER10C ClientLoc:
SampDepth: SampDepth: SampDepth:
WET Weight Basis WET Weight Basis WET Weight Basis
Parameters Value Qual MDL RDL Units Value Qual MDL RDL Units Value Qual MDL RDL Units
1,2-Dichloroethane <MDL 1 2 ug/L <MDL 1 2 ug/L <MDL 1 2 ug/L
1,2-Dichloropropane <MDL 1 2 ug/L <MDL 1 2 ug/L <MDL 1 2 ug/L
1,3-Dichlorobenzene <MDL 1 2 ug/L <MDL 1 2 ug/L <MDL 1 2 ug/L
1,4-Dichlorobenzene <MDL 1 2 ug/L <MDL 1 2 ug/L <MDL 1 2 ug/L
2-Butanone (MEK) <MDL 5 10 ug/L <MDL 5 10 ug/L <MDL 5 10 ug/L
2-Chloroethylvinyl ether <MDL 1 2 ug/L <MDL 1 2 ug/L <MDL 1 2 ug/L
2-Hexanone <MDL 5 10 ug/L <MDL 5 10 ug/L <MDL 5 10 ug/L
4-Methyl-2-Pentanone (MIBK) <MDL 5 10 ug/L <MDL 5 10 ug/L <MDL 5 10 ug/L
Acetone 3.3 <RDL 2.5 10 ug/L 4.4 <RDL 2.5 10 ug/L 7.9 <RDL 2.5 10 ug/L
Acrolein <MDL 5 10 ug/L <MDL 5 10 ug/L <MDL 5 10 ug/L
Acrylonitrile <MDL 1 2 ug/L <MDL 1 2 ug/L <MDL 1 2 ug/L
Benzene <MDL 1 2 ug/L <MDL 1 2 ug/L <MDL 1 2 ug/L
Bromodichloromethane <MDL 1 2 ug/L <MDL 1 2 ug/L <MDL 1 2 ug/L
Bromoform <MDL 1 2 ug/L <MDL 1 2 ug/L <MDL 1 2 ug/L
Bromomethane <MDL 5 10 ug/L <MDL 5 10 ug/L <MDL 5 10 ug/L
Carbon Disulfide <MDL 1 2 ug/L <MDL 1 2 ug/L <MDL 1 2 ug/L
Carbon Tetrachloride <MDL 1 2 ug/L <MDL 1 2 ug/L <MDL 1 2 ug/L
Chlorobenzene <MDL 1 2 ug/L <MDL 1 2 ug/L <MDL 1 2 ug/L
Chlorodibromomethane <MDL 1 2 ug/L <MDL 1 2 ug/L <MDL 1 2 ug/L
Chloroethane <MDL 1 2 ug/L <MDL 1 2 ug/L <MDL 1 2 ug/L
Chloroform <MDL 1 2 ug/L <MDL 1 2 ug/L <MDL 1 2 ug/L
Chloromethane <MDL 1 2 ug/L <MDL 1 2 ug/L <MDL 1 2 ug/L
Cis-1,3-Dichloropropene <MDL 1 2 ug/L <MDL 1 2 ug/L <MDL 1 2 ug/L
Ethylbenzene <MDL 1 2 ug/L <MDL 1 2 ug/L <MDL 1 2 ug/L
M/P Xylenes <MDL 1 2 ug/L <MDL 1 2 ug/L <MDL 1 2 ug/L
Methylene Chloride <MDL 5 10 ug/L <MDL 5 10 ug/L <MDL 5 10 ug/L
Methyl-t-butyl Ether (MTBE) <MDL 1 2 ug/L <MDL 1 2 ug/L <MDL 1 2 ug/L
O-Xylene <MDL 1 2 ug/L <MDL 1 2 ug/L <MDL 1 2 ug/L
Styrene <MDL 1 2 ug/L <MDL 1 2 ug/L <MDL 1 2 ug/L
Tetrachloroethylene <MDL 1 2 ug/L <MDL 1 2 ug/L <MDL 1 2 ug/L
Toluene <MDL 1 2 ug/L <MDL 1 2 ug/L 1.2 <RDL 1 2 ug/L
Total Xylenes <MDL 1 2 ug/L <MDL 1 2 ug/L <MDL 1 2 ug/L
Trans-1,2-Dichloroethylene <MDL 1 2 ug/L <MDL 1 2 ug/L <MDL 1 2 ug/L
Trans-1,3-Dichloropropene <MDL 1 2 ug/L <MDL 1 2 ug/L <MDL 1 2 ug/L
Trichlorofluoromethane <MDL 1 2 ug/L <MDL 1 2 ug/L <MDL 1 2 ug/L
Vinyl Acetate <MDL 5 10 ug/L <MDL 5 10 ug/L <MDL 5 10 ug/L
Vinyl Chloride <MDL 1 2 ug/L <MDL 1 2 ug/L <MDL 1 2 ug/LOR WDOE NWTPH-DX
Diesel Range (>C12-C24) <MDL 0.189 0.189 mg/L <MDL 0.189 0.189 mg/L <MDL 0.189 0.189 mg/L
Lube Oil Range (>C24) <MDL 0.189 0.189 mg/L 0.213 0.189 0.189 mg/L 1.12 0.189 0.189 mg/LOR WDOE NWTPH-GX
Gasoline Range (C7-C12) <MDL 250 250 ug/L <MDL 250 250 ug/L <MDL 250 250 ug/L
12/11/2015 J:\L62303.XLS Information Systems And Data Analysis Page 2 of 5

King County Environmental Lab Analytical Report
ParametersCV SM2540-D
Total Suspended SolidsCV SM4500-N-C
Total NitrogenCV SM4500-NO3-F
Nitrite + Nitrate NitrogenCV SM4500-P-B,F
Total PhosphorusCV SM4500-P-F
Orthophosphate PhosphorusES NONE
Client Locator
Conductivity, Field
Discharge Rate of Stream
Dissolved Oxygen Saturation, Field
Dissolved Oxygen, Field
Field Personnel
pH, Field
Sample Function
Sample Temperature, Field
Turbidity, FieldMC MICRO SOP570VD
Hu-2-bacteroidesMC SM 9222D 20TH
Fecal ColiformMT EPA 200.8*SW846 6020A
Calcium, Total, ICP-MS
Chromium, Dissolved, ICP-MS
Copper, Dissolved, ICP-MS
Lead, Dissolved, ICP-MS
Magnesium, Total, ICP-MS
Zinc, Dissolved, ICP-MSMT EPA 200.8/SW846 6020A*SM2340B
Hardness, CalcOR EPA 624/SW846 5030C*8260C
1,1,1-Trichloroethane
1,1,2,2-Tetrachloroethane
1,1,2-Trichloroethane
1,1,2-Trichloroethylene
1,1-Dichloroethane
1,1-Dichloroethylene
1,2-Dibromoethane
1,2-Dichlorobenzene
Project: 421195-180 Project: 421195-180 Project: 421195-180
Locator: MERCER10-648 Locator: MERCER10-108 Locator: FFBLANK
Descrip: CATCHBASIN ON SW C Descrip: CATCHBASIN ON NW C Descrip: FIELD FILTER BLANK
Sample: L62303-4 Sample: L62303-5 Sample: L62303-6
Matrix: LG STORM WTR Matrix: LG STORM WTR Matrix: LN BLANK WTR
ColDate: 10/7/15 12:10 ColDate: 10/7/15 11:55 ColDate: 10/7/15 11:30
TimeSpan: TimeSpan: TimeSpan:
TotalSolid: TotalSolid: TotalSolid:
ClientLoc: ClientLoc: ClientLoc:
SampDepth: SampDepth: SampDepth:
WET Weight Basis WET Weight Basis WET Weight Basis
Value Qual MDL RDL Units Value Qual MDL RDL Units Value Qual MDL RDL Units
110 6 12 mg/L 7.37 0.5 1.1 mg/L
1.86 0.15 0.3 mg/L 0.71 0.05 0.1 mg/L
0.277 0.01 0.04 mg/L 0.167 0.01 0.04 mg/L <MDL 0.01 0.04 mg/L
0.221 0.015 0.03 mg/L 0.0854 0.005 0.01 mg/L
0.0574 0.0005 0.002 mg/L 0.0475 0.0005 0.002 mg/L 0.00056 <RDL 0.0005 0.002 mg/L
48.1 0.5 10 umhos/cm 25.2 0.5 10 umhos/cm
82 % 96.5 %
7.9 0.5 1 mg/L 9.3 0.5 1 mg/L
HF/SH none HF/SH none HF/SH none
6.55 pH 6.81 pH
FFB none
16.9 deg C 17.1 deg C
73.7 0.5 2 NTU 10.3 0.5 2 NTU
7060 50 50 ug/L 2760 50 50 ug/L
0.7 <RDL 0.2 1 ug/L 0.56 <RDL 0.2 1 ug/L
12.2 0.2 2 ug/L 7.38 0.2 2 ug/L
0.46 <RDL 0.1 0.5 ug/L 0.727 0.1 0.5 ug/L
942 50 50 ug/L 350 50 50 ug/L
42.2 0.5 2.5 ug/L 187 0.5 2.5 ug/L
21.5 0.331 0.331 mg CaCO3/L 8.32 0.331 0.331 mg CaCO3/L
<MDL 1 2 ug/L <MDL 1 2 ug/L
<MDL 1 2 ug/L <MDL 1 2 ug/L
<MDL 1 2 ug/L <MDL 1 2 ug/L
<MDL 1 2 ug/L <MDL 1 2 ug/L
<MDL 1 2 ug/L <MDL 1 2 ug/L
<MDL 1 2 ug/L <MDL 1 2 ug/L
<MDL 1 2 ug/L <MDL 1 2 ug/L
<MDL 1 2 ug/L <MDL 1 2 ug/L
12/11/2015 J:\L62303.XLS Information Systems And Data Analysis Page 3 of 5

King County Environmental Lab Analytical Report
Parameters
1,2-Dichloroethane
1,2-Dichloropropane
1,3-Dichlorobenzene
1,4-Dichlorobenzene
2-Butanone (MEK)
2-Chloroethylvinyl ether
2-Hexanone
4-Methyl-2-Pentanone (MIBK)
Acetone
Acrolein
Acrylonitrile
Benzene
Bromodichloromethane
Bromoform
Bromomethane
Carbon Disulfide
Carbon Tetrachloride
Chlorobenzene
Chlorodibromomethane
Chloroethane
Chloroform
Chloromethane
Cis-1,3-Dichloropropene
Ethylbenzene
M/P Xylenes
Methylene Chloride
Methyl-t-butyl Ether (MTBE)
O-Xylene
Styrene
Tetrachloroethylene
Toluene
Total Xylenes
Trans-1,2-Dichloroethylene
Trans-1,3-Dichloropropene
Trichlorofluoromethane
Vinyl Acetate
Vinyl ChlorideOR WDOE NWTPH-DX
Diesel Range (>C12-C24)
Lube Oil Range (>C24)OR WDOE NWTPH-GX
Gasoline Range (C7-C12)
Project: 421195-180 Project: 421195-180 Project: 421195-180
Locator: MERCER10-648 Locator: MERCER10-108 Locator: FFBLANK
Descrip: CATCHBASIN ON SW C Descrip: CATCHBASIN ON NW C Descrip: FIELD FILTER BLANK
Sample: L62303-4 Sample: L62303-5 Sample: L62303-6
Matrix: LG STORM WTR Matrix: LG STORM WTR Matrix: LN BLANK WTR
ColDate: 10/7/15 12:10 ColDate: 10/7/15 11:55 ColDate: 10/7/15 11:30
TimeSpan: TimeSpan: TimeSpan:
TotalSolid: TotalSolid: TotalSolid:
ClientLoc: ClientLoc: ClientLoc:
SampDepth: SampDepth: SampDepth:
WET Weight Basis WET Weight Basis WET Weight Basis
Value Qual MDL RDL Units Value Qual MDL RDL Units Value Qual MDL RDL Units
<MDL 1 2 ug/L <MDL 1 2 ug/L
<MDL 1 2 ug/L <MDL 1 2 ug/L
<MDL 1 2 ug/L <MDL 1 2 ug/L
<MDL 1 2 ug/L <MDL 1 2 ug/L
<MDL 5 10 ug/L <MDL 5 10 ug/L
<MDL 1 2 ug/L <MDL 1 2 ug/L
<MDL 5 10 ug/L <MDL 5 10 ug/L
<MDL 5 10 ug/L <MDL 5 10 ug/L
8 <RDL 2.5 10 ug/L 5.2 <RDL 2.5 10 ug/L
<MDL 5 10 ug/L <MDL 5 10 ug/L
<MDL 1 2 ug/L <MDL 1 2 ug/L
<MDL 1 2 ug/L <MDL 1 2 ug/L
<MDL 1 2 ug/L <MDL 1 2 ug/L
<MDL 1 2 ug/L <MDL 1 2 ug/L
<MDL 5 10 ug/L <MDL 5 10 ug/L
<MDL 1 2 ug/L <MDL 1 2 ug/L
<MDL 1 2 ug/L <MDL 1 2 ug/L
<MDL 1 2 ug/L <MDL 1 2 ug/L
<MDL 1 2 ug/L <MDL 1 2 ug/L
<MDL 1 2 ug/L <MDL 1 2 ug/L
<MDL 1 2 ug/L <MDL 1 2 ug/L
<MDL 1 2 ug/L <MDL 1 2 ug/L
<MDL 1 2 ug/L <MDL 1 2 ug/L
<MDL 1 2 ug/L <MDL 1 2 ug/L
<MDL 1 2 ug/L <MDL 1 2 ug/L
<MDL 5 10 ug/L <MDL 5 10 ug/L
<MDL 1 2 ug/L <MDL 1 2 ug/L
<MDL 1 2 ug/L <MDL 1 2 ug/L
<MDL 1 2 ug/L <MDL 1 2 ug/L
<MDL 1 2 ug/L <MDL 1 2 ug/L
2.73 1 2 ug/L <MDL 1 2 ug/L
<MDL 1 2 ug/L <MDL 1 2 ug/L
<MDL 1 2 ug/L <MDL 1 2 ug/L
<MDL 1 2 ug/L <MDL 1 2 ug/L
<MDL 1 2 ug/L <MDL 1 2 ug/L
<MDL 5 10 ug/L <MDL 5 10 ug/L
<MDL 1 2 ug/L <MDL 1 2 ug/L
<MDL 0.189 0.189 mg/L <MDL 0.189 0.189 mg/L
0.971 0.189 0.189 mg/L 0.216 0.189 0.189 mg/L
<MDL 250 250 ug/L <MDL 250 250 ug/L
12/11/2015 J:\L62303.XLS Information Systems And Data Analysis Page 4 of 5

King County Environmental Lab Analytical Report
ParametersCV SM2540-D
Total Suspended SolidsCV SM4500-N-C
Total NitrogenCV SM4500-NO3-F
Nitrite + Nitrate NitrogenCV SM4500-P-B,F
Total PhosphorusCV SM4500-P-F
Orthophosphate PhosphorusES NONE
Client Locator
Conductivity, Field
Discharge Rate of Stream
Dissolved Oxygen Saturation, Field
Dissolved Oxygen, Field
Field Personnel
pH, Field
Sample Function
Sample Temperature, Field
Turbidity, FieldMC MICRO SOP570VD
Hu-2-bacteroidesMC SM 9222D 20TH
Fecal ColiformMT EPA 200.8*SW846 6020A
Calcium, Total, ICP-MS
Chromium, Dissolved, ICP-MS
Copper, Dissolved, ICP-MS
Lead, Dissolved, ICP-MS
Magnesium, Total, ICP-MS
Zinc, Dissolved, ICP-MSMT EPA 200.8/SW846 6020A*SM2340B
Hardness, CalcOR EPA 624/SW846 5030C*8260C
1,1,1-Trichloroethane
1,1,2,2-Tetrachloroethane
1,1,2-Trichloroethane
1,1,2-Trichloroethylene
1,1-Dichloroethane
1,1-Dichloroethylene
1,2-Dibromoethane
1,2-Dichlorobenzene
Project: 421195-180
Locator: MERCER10-77TH
Descrip: STORM LINE OFF OF
Sample: L62303-7
Matrix: LG STORM WTR
ColDate: 10/7/15 14:05
TimeSpan:
TotalSolid:
ClientLoc:
SampDepth:
WET Weight Basis
Value Qual MDL RDL Units
54.8 0.5 10 umhos/cm
100.2 %
9.7 0.5 1 mg/L
SH none
7.03 pH
17 deg C
15.7 0.5 2 NTU
72 JU copies/ml
2400 CFU/100ml
12/11/2015 J:\L62303.XLS Information Systems And Data Analysis Page 5 of 5

King County Environmental Lab Analytical Report
Project: 421195-180 Project: 421195-180 Project: 421195-180
Locator: MERCER10-647_10C Locator: NONE Locator: FIELDBLANK
Descrip: CATCHBASIN ON NE C Descrip: UNKNOWN LOCATOR Descrip: FIELD BLANK
Sample: L62560-1 Sample: L62560-3 Sample: L62560-4
Matrix: LF SEWER WTR Matrix: LF SEWER WTR Matrix: LN BLANK WTR
ColDate: 4/9/15 10:45 ColDate: 4/9/15 12:50 ColDate: 4/9/15 11:40
TimeSpan: TimeSpan: TimeSpan:
TotalSolid: TotalSolid: TotalSolid:
ClientLoc: ClientLoc: Catch Basin # 10-368 ClientLoc:
SampDepth: SampDepth: SampDepth:
WET Weight Basis WET Weight Basis WET Weight Basis
Parameters Value Qual MDL RDL Units Value Qual MDL RDL Units Value Qual MDL RDL UnitsCV SM2540-D
Total Suspended Solids 1.5 <RDL 1 2 mg/L 1.04 0.5 1 mg/LCV SM4500-N-C
Total Nitrogen 1.67 0.05 0.1 mg/L 1.32 0.05 0.1 mg/LCV SM4500-NO3-F
Nitrite + Nitrate Nitrogen 1.04 0.05 0.2 mg/L 0.48 0.01 0.04 mg/L <MDL 0.01 0.04 mg/LCV SM4500-P-B,F
Total Phosphorus 0.241 0.005 0.01 mg/L 0.147 0.005 0.01 mg/LCV SM4500-P-F
Orthophosphate Phosphorus 0.189 0.0025 0.01 mg/L 0.102 0.0005 0.002 mg/L <MDL 0.0005 0.002 mg/LES NONE
Client Locator 10-368 none
Conductivity, Field 202 0.5 10 umhos/cm 356 0.5 10 umhos/cm
Dissolved Oxygen Saturation, Field 95.4 % 97.2 %
Dissolved Oxygen, Field 9.6 0.5 1 mg/L 9.4 0.5 1 mg/L
Field Personnel JP none JP none
pH, Field 7.85 pH 8.07 pH
Sample Temperature, Field 15.2 deg C 16.8 deg C
Turbidity, Field 2.3 0.5 2 NTU 0.89 <RDL 0.5 2 NTUMC MICRO SOP570VD
Hu-2-bacteroides <MDL 0.01 copies/ml <MDL 0.01 copies/mlMC SM 9222D 20TH
Fecal Coliform 280 CFU/100ml <MDL 1 CFU/100mlMT EPA 200.8*SW846 6020A
Calcium, Total, ICP-MS 22200 SH 50 50 ug/L 18300 SH 50 50 ug/L
Chromium, Dissolved, ICP-MS 0.55 <RDL 0.2 1 ug/L 0.5 <RDL 0.2 1 ug/L
Copper, Dissolved, ICP-MS 53.8 0.4 2 ug/L 60.2 0.4 2 ug/L
Lead, Dissolved, ICP-MS 0.18 <RDL 0.1 0.5 ug/L 0.13 <RDL 0.1 0.5 ug/L
Magnesium, Total, ICP-MS 12700 SH 50 50 ug/L 9790 SH 50 50 ug/L
Zinc, Dissolved, ICP-MS 26.3 0.5 2.5 ug/L 16.1 0.5 2.5 ug/LMT EPA 200.8/SW846 6020A*SM2340B
Hardness, Calc 108 SH 0.331 0.331 mg CaCO3/L 85.9 SH 0.331 0.331 mg CaCO3/L
SH = Bottle used for Hardness testing wasn't acid-cleaned.
5/13/2015 J:\L62560.XLS Page 1 of 1Information Systems And Data Analysis

King County Environmental Lab Analytical Report
Project: 421195-180 Project: 421195-180 Project: 421195-180
Locator: MERCERISL10 Locator: MERCER10-647_10C Locator: MERCER10-366
Descrip: SE 22ND ST, NEAR M Descrip: CATCHBASIN ON NE C Descrip: CATCHBASIN ON SE C
Sample: L63938-1 Sample: L63938-2 Sample: L63938-3
Matrix: LG STORM WTR Matrix: LG STORM WTR Matrix: LG STORM WTR
ColDate: 11/9/15 13:40 ColDate: 11/9/15 12:14 ColDate: 11/9/15 11:47
TimeSpan: TimeSpan: TimeSpan:
TotalSolid: TotalSolid: TotalSolid:
ClientLoc: ClientLoc: 10-647 ClientLoc:
SampDepth: SampDepth: SampDepth:
WET Weight Basis WET Weight Basis WET Weight Basis
Parameters Value Qual MDL RDL Units Value Qual MDL RDL Units Value Qual MDL RDL UnitsCV SM2540-D
Total Suspended Solids 3.67 0.8 1.7 mg/L 6.67 0.7 1.3 mg/L 180 14 29 mg/LCV SM4500-N-C
Total Nitrogen 1.07 0.05 0.1 mg/L 0.99 0.05 0.1 mg/L 3.12 0.15 0.3 mg/LCV SM4500-NO3-F
Nitrite + Nitrate Nitrogen 0.655 0.01 0.04 mg/L 0.419 0.01 0.04 mg/L 0.214 0.01 0.04 mg/LCV SM4500-P-B,F
Total Phosphorus 0.0799 0.005 0.01 mg/L 0.158 0.005 0.01 mg/L 0.452 0.015 0.03 mg/LCV SM4500-P-F
Orthophosphate Phosphorus 0.0645 0.0005 0.002 mg/L 0.126 0.005 0.02 mg/L 0.0411 0.0005 0.002 mg/LES NONE
Client Locator 10-647 none
Conductivity, Field 143 0.5 10 umhos/cm 66.1 0.5 10 umhos/cm 48.8 0.5 10 umhos/cm
Discharge Rate of Stream 0.7 0.05 0.1 cfs
Dissolved Oxygen Saturation, Field 91.1 % 96.3 % 87.4 %
Dissolved Oxygen, Field 9.7 0.5 1 mg/L 10.2 0.5 1 mg/L 9.6 0.5 1 mg/L
Field Personnel HF none HF none HF none
pH, Field 7.31 pH 7.23 pH 6.96 pH
Sample Function
Sample Information
Sample Temperature, Field 12.6 deg C 12.9 deg C 11.3 deg C
Turbidity, Field 10.1 0.5 2 NTU 11.6 0.5 2 NTU 198 0.5 2 NTUMC MICRO SOP570VD
Hu-2-bacteroides 1500 JU copies/ml <MDL 0.01 copies/mlMC SM 9222D 20TH
Fecal Coliform 380 C CFU/100ml 710 CFU/100mlMT EPA 200.8*SW846 6020A
Calcium, Total, ICP-MS 13600 50 50 ug/L 7230 50 50 ug/L 8070 50 50 ug/L
Chromium, Dissolved, ICP-MS 0.85 <RDL 0.2 1 ug/L 0.49 <RDL 0.2 1 ug/L 0.84 <RDL 0.2 1 ug/L
Copper, Dissolved, ICP-MS 4.19 0.2 2 ug/L 12.5 0.2 2 ug/L 12.5 0.2 2 ug/L
Lead, Dissolved, ICP-MS 0.15 <RDL 0.1 0.5 ug/L 0.3 <RDL 0.1 0.5 ug/L 1.22 0.1 0.5 ug/L
Magnesium, Total, ICP-MS 5660 50 50 ug/L 2070 50 50 ug/L 1590 50 50 ug/L
Zinc, Dissolved, ICP-MS 40.4 0.5 2.5 ug/L 57 0.5 2.5 ug/L 43.2 0.5 2.5 ug/LMT EPA 200.8/SW846 6020A*SM2340B
Hardness, Calc 57.2 0.331 0.331 mg CaCO3/L 26.6 0.331 0.331 mg CaCO3/L 26.7 0.331 0.331 mg CaCO3/L
12/11/2015 J:\L63938.XLS Page 1 of 3Information Systems And Data Analysis

King County Environmental Lab Analytical Report
ParametersCV SM2540-D
Total Suspended SolidsCV SM4500-N-C
Total NitrogenCV SM4500-NO3-F
Nitrite + Nitrate NitrogenCV SM4500-P-B,F
Total PhosphorusCV SM4500-P-F
Orthophosphate PhosphorusES NONE
Client Locator
Conductivity, Field
Discharge Rate of Stream
Dissolved Oxygen Saturation, Field
Dissolved Oxygen, Field
Field Personnel
pH, Field
Sample Function
Sample Information
Sample Temperature, Field
Turbidity, FieldMC MICRO SOP570VD
Hu-2-bacteroidesMC SM 9222D 20TH
Fecal ColiformMT EPA 200.8*SW846 6020A
Calcium, Total, ICP-MS
Chromium, Dissolved, ICP-MS
Copper, Dissolved, ICP-MS
Lead, Dissolved, ICP-MS
Magnesium, Total, ICP-MS
Zinc, Dissolved, ICP-MSMT EPA 200.8/SW846 6020A*SM2340B
Hardness, Calc
Project: 421195-180 Project: 421195-180 Project: 421195-180
Locator: MERCER10-648 Locator: MERCER10-108 Locator: FFBLANK
Descrip: CATCHBASIN ON SW C Descrip: CATCHBASIN ON NW C Descrip: FIELD FILTER BLANK
Sample: L63938-4 Sample: L63938-5 Sample: L63938-6
Matrix: LG STORM WTR Matrix: LG STORM WTR Matrix: LN BLANK WTR
ColDate: 11/9/15 12:49 ColDate: 11/9/15 12:30 ColDate: 11/9/15 11:40
TimeSpan: TimeSpan: TimeSpan:
TotalSolid: TotalSolid: TotalSolid:
ClientLoc: ClientLoc: ClientLoc:
SampDepth: SampDepth: SampDepth:
WET Weight Basis WET Weight Basis WET Weight Basis
Value Qual MDL RDL Units Value Qual MDL RDL Units Value Qual MDL RDL Units
26.6 1.7 3.4 mg/L 4.53 0.7 1.3 mg/L
0.879 0.05 0.1 mg/L 0.503 0.05 0.1 mg/L
0.113 0.01 0.04 mg/L 0.0569 0.01 0.04 mg/L <MDL 0.01 0.04 mg/L
0.0976 0.005 0.01 mg/L 0.0781 0.005 0.01 mg/L
0.0144 0.0005 0.002 mg/L 0.0493 0.0005 0.002 mg/L 0.00067 <RDL 0.0005 0.002 mg/L
56.9 0.5 10 umhos/cm 26.2 0.5 10 umhos/cm
64.4 % 96.4 %
7.1 0.5 1 mg/L 10.4 0.5 1 mg/L
HF none HF none
6.43 pH 7.1 pH
FFB none
11.3 deg C 12.1 deg C
47.4 0.5 2 NTU 9.1 0.5 2 NTU
6460 50 50 ug/L 3060 50 50 ug/L
0.64 <RDL 0.2 1 ug/L 0.34 <RDL 0.2 1 ug/L
8.38 0.2 2 ug/L 3.77 0.2 2 ug/L
0.38 <RDL 0.1 0.5 ug/L 0.505 0.1 0.5 ug/L
1130 50 50 ug/L 604 50 50 ug/L
38.2 0.5 2.5 ug/L 173 0.5 2.5 ug/L
20.8 0.331 0.331 mg CaCO3/L 10.1 0.331 0.331 mg CaCO3/L
12/11/2015 J:\L63938.XLS Page 2 of 3Information Systems And Data Analysis

King County Environmental Lab Analytical Report
ParametersCV SM2540-D
Total Suspended SolidsCV SM4500-N-C
Total NitrogenCV SM4500-NO3-F
Nitrite + Nitrate NitrogenCV SM4500-P-B,F
Total PhosphorusCV SM4500-P-F
Orthophosphate PhosphorusES NONE
Client Locator
Conductivity, Field
Discharge Rate of Stream
Dissolved Oxygen Saturation, Field
Dissolved Oxygen, Field
Field Personnel
pH, Field
Sample Function
Sample Information
Sample Temperature, Field
Turbidity, FieldMC MICRO SOP570VD
Hu-2-bacteroidesMC SM 9222D 20TH
Fecal ColiformMT EPA 200.8*SW846 6020A
Calcium, Total, ICP-MS
Chromium, Dissolved, ICP-MS
Copper, Dissolved, ICP-MS
Lead, Dissolved, ICP-MS
Magnesium, Total, ICP-MS
Zinc, Dissolved, ICP-MSMT EPA 200.8/SW846 6020A*SM2340B
Hardness, Calc
Project: 421195-180
Locator: MERCER10-77TH
Descrip: STORM LINE OFF OF
Sample: L63938-7
Matrix: LG STORM WTR
ColDate: 11/9/15 13:30
TimeSpan:
TotalSolid:
ClientLoc:
SampDepth:
WET Weight Basis
Value Qual MDL RDL Units
Sample not collected- access issues none
12/11/2015 J:\L63938.XLS Page 3 of 3Information Systems And Data Analysis

King County Environmental Lab Analytical Report
Project: 421195-180 Project: 421195-180 Project: 421195-180
Locator: MERCERISL10 Locator: MERCER10-647_10C Locator: MERCER10-366
Descrip: SE 22ND ST, NEAR M Descrip: CATCHBASIN ON NE C Descrip: CATCHBASIN ON SE C
Sample: L64397-1 Sample: L64397-2 Sample: L64397-3
Matrix: LG STORM WTR Matrix: LG STORM WTR Matrix: LG STORM WTR
ColDate: 1/13/16 13:10 ColDate: 1/13/16 11:30 ColDate: 1/13/16 12:30
TimeSpan: TimeSpan: TimeSpan:
TotalSolid: TotalSolid: TotalSolid:
ClientLoc: ClientLoc: Same as 10C ClientLoc:
SampDepth: SampDepth: SampDepth:
WET Weight Basis WET Weight Basis WET Weight Basis
Parameters Value Qual MDL RDL Units Value Qual MDL RDL Units Value Qual MDL RDL UnitsCV SM2540-D
Total Suspended Solids 13.1 0.9 1.8 mg/L 8.6 0.5 1 mg/L 57.6 2 4 mg/LCV SM4500-N-C
Total Nitrogen 1.16 0.05 0.1 mg/L 0.398 0.05 0.1 mg/L 1.06 0.05 0.1 mg/LCV SM4500-NO3-F
Nitrite + Nitrate Nitrogen 0.684 0.01 0.04 mg/L 0.122 0.01 0.04 mg/L 0.223 0.01 0.04 mg/LCV SM4500-P-B,F
Total Phosphorus 0.139 0.005 0.01 mg/L 0.0649 0.005 0.01 mg/L 0.104 0.005 0.01 mg/LCV SM4500-P-F
Orthophosphate Phosphorus 0.0775 0.0005 0.002 mg/L 0.0431 0.0005 0.002 mg/L 0.0101 0.0005 0.002 mg/LES NONE
Client Locator Same as 10C none
Conductivity, Field 123 0.5 10 umhos/cm 28 0.5 10 umhos/cm 41.3 0.5 10 umhos/cm
Dissolved Oxygen Saturation, Field 98.1 % 99.4 % 94.8 %
Dissolved Oxygen, Field 11.6 0.5 1 mg/L 11.6 0.5 1 mg/L 11.1 0.5 1 mg/L
Field Personnel JP none JP none JP none
pH, Field 6.82 pH 6.96 pH 6.95 pH
Sample Function
Sample Temperature, Field 8 deg C 8.5 deg C 8 deg C
Turbidity, Field 28.4 0.5 2 NTU 6.7 0.5 2 NTU 67.1 0.5 2 NTUMC MICRO SOP570VD
Hu-2-bacteroides 8.2 JU copies/ml 0.66 JU copies/mlMC SM 9222D 20TH
Fecal Coliform 1900 CFU/100ml 450 C CFU/100mlMT EPA 200.8*SW846 6020A
Calcium, Total, ICP-MS 11400 50 50 ug/L 3070 50 50 ug/L 4810 50 50 ug/L
Chromium, Dissolved, ICP-MS 0.8 <RDL 0.2 1 ug/L 0.24 <RDL 0.2 1 ug/L 0.7 <RDL 0.2 1 ug/L
Copper, Dissolved, ICP-MS 4.65 0.2 2 ug/L 9.25 0.2 2 ug/L 5.7 0.2 2 ug/L
Lead, Dissolved, ICP-MS 0.25 <RDL 0.1 0.5 ug/L 0.22 <RDL 0.1 0.5 ug/L 0.609 0.1 0.5 ug/L
Magnesium, Total, ICP-MS 5170 50 50 ug/L 541 50 50 ug/L 772 50 50 ug/L
Zinc, Dissolved, ICP-MS 19.5 0.5 2.5 ug/L 46.1 0.5 2.5 ug/L 43.2 0.5 2.5 ug/LMT EPA 200.8/SW846 6020A*SM2340B
Hardness, Calc 49.7 0.331 0.331 mg CaCO3/L 9.88 0.331 0.331 mg CaCO3/L 15.2 0.331 0.331 mg CaCO3/L
2/10/2016 J:\L64397X.XLS Page 1 of 3Information Systems And Data Analysis

King County Environmental Lab Analytical Report
ParametersCV SM2540-D
Total Suspended SolidsCV SM4500-N-C
Total NitrogenCV SM4500-NO3-F
Nitrite + Nitrate NitrogenCV SM4500-P-B,F
Total PhosphorusCV SM4500-P-F
Orthophosphate PhosphorusES NONE
Client Locator
Conductivity, Field
Dissolved Oxygen Saturation, Field
Dissolved Oxygen, Field
Field Personnel
pH, Field
Sample Function
Sample Temperature, Field
Turbidity, FieldMC MICRO SOP570VD
Hu-2-bacteroidesMC SM 9222D 20TH
Fecal ColiformMT EPA 200.8*SW846 6020A
Calcium, Total, ICP-MS
Chromium, Dissolved, ICP-MS
Copper, Dissolved, ICP-MS
Lead, Dissolved, ICP-MS
Magnesium, Total, ICP-MS
Zinc, Dissolved, ICP-MSMT EPA 200.8/SW846 6020A*SM2340B
Hardness, Calc
Project: 421195-180 Project: 421195-180 Project: 421195-180
Locator: MERCER10-648 Locator: MERCER10-108 Locator: FFBLANK
Descrip: CATCHBASIN ON SW C Descrip: CATCHBASIN ON NW C Descrip: FIELD FILTER BLANK
Sample: L64397-4 Sample: L64397-5 Sample: L64397-6
Matrix: LG STORM WTR Matrix: LG STORM WTR Matrix: LN BLANK WTR
ColDate: 1/13/16 12:05 ColDate: 1/13/16 11:45 ColDate: 1/13/16 11:02
TimeSpan: TimeSpan: TimeSpan:
TotalSolid: TotalSolid: TotalSolid:
ClientLoc: ClientLoc: ClientLoc:
SampDepth: SampDepth: SampDepth:
WET Weight Basis WET Weight Basis WET Weight Basis
Value Qual MDL RDL Units Value Qual MDL RDL Units Value Qual MDL RDL Units
378 4.5 8.9 mg/L 10.1 0.5 1 mg/L
1.56 0.05 0.1 mg/L 0.191 0.05 0.1 mg/L
0.114 0.01 0.04 mg/L 0.0411 0.01 0.04 mg/L <MDL 0.01 0.04 mg/L
0.218 0.005 0.01 mg/L 0.038 0.005 0.01 mg/L
0.00878 0.0005 0.002 mg/L 0.0187 0.0005 0.002 mg/L <MDL 0.0005 0.002 mg/L
394 0.5 10 umhos/cm 16.9 0.5 10 umhos/cm
37.2 % 98.3 %
4.4 0.5 1 mg/L 11.7 0.5 1 mg/L
JP none JP none
5.95 pH 6.89 pH
FFB none
7.9 deg C 7.9 deg C
114 0.5 2 NTU 8.9 0.5 2 NTU
7400 50 50 ug/L 1870 50 50 ug/L
0.46 <RDL 0.2 1 ug/L 0.26 <RDL 0.2 1 ug/L
5.7 0.2 2 ug/L 1.5 <RDL 0.2 2 ug/L
0.29 <RDL 0.1 0.5 ug/L 0.16 <RDL 0.1 0.5 ug/L
1550 50 50 ug/L 327 50 50 ug/L
49 0.5 2.5 ug/L 81.8 0.5 2.5 ug/L
24.9 0.331 0.331 mg CaCO3/L 6.01 0.331 0.331 mg CaCO3/L
2/10/2016 J:\L64397X.XLS Page 2 of 3Information Systems And Data Analysis

King County Environmental Lab Analytical Report
ParametersCV SM2540-D
Total Suspended SolidsCV SM4500-N-C
Total NitrogenCV SM4500-NO3-F
Nitrite + Nitrate NitrogenCV SM4500-P-B,F
Total PhosphorusCV SM4500-P-F
Orthophosphate PhosphorusES NONE
Client Locator
Conductivity, Field
Dissolved Oxygen Saturation, Field
Dissolved Oxygen, Field
Field Personnel
pH, Field
Sample Function
Sample Temperature, Field
Turbidity, FieldMC MICRO SOP570VD
Hu-2-bacteroidesMC SM 9222D 20TH
Fecal ColiformMT EPA 200.8*SW846 6020A
Calcium, Total, ICP-MS
Chromium, Dissolved, ICP-MS
Copper, Dissolved, ICP-MS
Lead, Dissolved, ICP-MS
Magnesium, Total, ICP-MS
Zinc, Dissolved, ICP-MSMT EPA 200.8/SW846 6020A*SM2340B
Hardness, Calc
Project: 421195-180
Locator: MERCER10-77TH
Descrip: STORM LINE OFF OF
Sample: L64397-7
Matrix: LG STORM WTR
ColDate: 1/13/16 13:30
TimeSpan:
TotalSolid:
ClientLoc:
SampDepth:
WET Weight Basis
Value Qual MDL RDL Units
133 0.5 10 umhos/cm
99.2 %
11.7 0.5 1 mg/L
JP none
7.14 pH
8.2 deg C
26.3 0.5 2 NTU
3.6 JU copies/ml
1000 CFU/100ml
2/10/2016 J:\L64397X.XLS Page 3 of 3Information Systems And Data Analysis

King County Environmental Lab Analytical Report
Project: 421195-180 Project: 421195-180 Project: 421195-180
Locator: MERCERISL10 Locator: MERCER10-647_10C Locator: MERCER10-366
Descrip: SE 22ND ST, NEAR M Descrip: CATCHBASIN ON NE C Descrip: CATCHBASIN ON SE C
Sample: L64714-1 Sample: L64714-2 Sample: L64714-3
Matrix: LG STORM WTR Matrix: LG STORM WTR Matrix: LG STORM WTR
ColDate: 3/1/16 12:30 ColDate: 3/1/16 10:50 ColDate: 3/1/16 11:10
TimeSpan: TimeSpan: TimeSpan:
TotalSolid: TotalSolid: TotalSolid:
ClientLoc: ClientLoc: ClientLoc:
SampDepth: SampDepth: SampDepth:
WET Weight Basis WET Weight Basis WET Weight Basis
Parameters Value Qual MDL RDL Units Value Qual MDL RDL Units Value Qual MDL RDL UnitsCV SM2540-D
Total Suspended Solids 31 2 4.1 mg/L 24 1.4 2.9 mg/L 145 3.3 6.7 mg/LCV SM4500-N-C
Total Nitrogen 0.665 0.05 0.1 mg/L 0.636 0.05 0.1 mg/L 1.38 0.05 0.1 mg/LCV SM4500-NO3-F
Nitrite + Nitrate Nitrogen 0.166 0.01 0.04 mg/L 0.125 0.01 0.04 mg/L 0.0402 0.01 0.04 mg/LCV SM4500-P-B,F
Total Phosphorus 0.127 0.005 0.01 mg/L 0.0816 0.005 0.01 mg/L 0.209 0.005 0.01 mg/LCV SM4500-P-F
Orthophosphate Phosphorus 0.0357 0.0005 0.002 mg/L 0.0283 0.0005 0.002 mg/L 0.0108 0.0005 0.002 mg/LES KCEL SOP# 245
Conductivity, Field 82.7 0.5 10 umhos/cm 35.4 0.5 10 umhos/cm 23.8 0.5 10 umhos/cm
Dissolved Oxygen Saturation, Field 96.7 % 98.3 % 98.7 %
Dissolved Oxygen, Field 11 0.5 1 mg/L 10.8 0.5 1 mg/L 11.2 0.5 1 mg/L
pH, Field 7.41 pH 7.36 pH 7.27 pH
Sample Temperature, Field 9.8 deg C 11.1 deg C 9.7 deg C
Turbidity, Field 50.2 0.5 2 NTU 22.7 0.5 2 NTU 74.1 0.5 2 NTUES NONE
Field Personnel JP none JP none JP none
Sample FunctionMC MICRO SOP570VD
Hu-2-bacteroides 19 JU copies/ml 4.3 JU copies/mlMC SM 9222D 20TH
Fecal Coliform 1300 CFU/100ml 1400 CFU/100mlMT EPA 200.8*SW846 6020A
Calcium, Total, ICP-MS 8150 50 50 ug/L 4660 50 50 ug/L 3270 50 50 ug/L
Chromium, Dissolved, ICP-MS 0.56 <RDL 0.2 1 ug/L 0.26 <RDL 0.2 1 ug/L 0.36 <RDL 0.2 1 ug/L
Copper, Dissolved, ICP-MS 2.72 0.2 2 ug/L 9.43 0.2 2 ug/L 3.13 0.2 2 ug/L
Lead, Dissolved, ICP-MS <MDL 0.1 0.5 ug/L 0.18 <RDL 0.1 0.5 ug/L 0.1 <RDL 0.1 0.5 ug/L
Magnesium, Total, ICP-MS 3900 50 50 ug/L 1310 50 50 ug/L 846 50 50 ug/L
Zinc, Dissolved, ICP-MS 11.9 0.5 2.5 ug/L 34.3 0.5 2.5 ug/L 19 0.5 2.5 ug/LMT EPA 200.8/SW846 6020A*SM2340B
Hardness, Calc 36.4 0.331 0.331 mg CaCO3/L 17 0.331 0.331 mg CaCO3/L 11.6 0.331 0.331 mg CaCO3/L
3/31/2016 J:\L64714.XLS Page 1 of 3Information Systems And Data Analysis

King County Environmental Lab Analytical Report
ParametersCV SM2540-D
Total Suspended SolidsCV SM4500-N-C
Total NitrogenCV SM4500-NO3-F
Nitrite + Nitrate NitrogenCV SM4500-P-B,F
Total PhosphorusCV SM4500-P-F
Orthophosphate PhosphorusES KCEL SOP# 245
Conductivity, Field
Dissolved Oxygen Saturation, Field
Dissolved Oxygen, Field
pH, Field
Sample Temperature, Field
Turbidity, FieldES NONE
Field Personnel
Sample FunctionMC MICRO SOP570VD
Hu-2-bacteroidesMC SM 9222D 20TH
Fecal ColiformMT EPA 200.8*SW846 6020A
Calcium, Total, ICP-MS
Chromium, Dissolved, ICP-MS
Copper, Dissolved, ICP-MS
Lead, Dissolved, ICP-MS
Magnesium, Total, ICP-MS
Zinc, Dissolved, ICP-MSMT EPA 200.8/SW846 6020A*SM2340B
Hardness, Calc
Project: 421195-180 Project: 421195-180 Project: 421195-180
Locator: MERCER10-648 Locator: MERCER10-108 Locator: FFBLANK
Descrip: CATCHBASIN ON SW C Descrip: CATCHBASIN ON NW C Descrip: FIELD FILTER BLANK
Sample: L64714-4 Sample: L64714-5 Sample: L64714-6
Matrix: LG STORM WTR Matrix: LG STORM WTR Matrix: LN BLANK WTR
ColDate: 3/1/16 11:25 ColDate: 3/1/16 11:45 ColDate: 3/1/16 10:20
TimeSpan: TimeSpan: TimeSpan:
TotalSolid: TotalSolid: TotalSolid:
ClientLoc: ClientLoc: ClientLoc:
SampDepth: SampDepth: SampDepth:
WET Weight Basis WET Weight Basis WET Weight Basis
Value Qual MDL RDL Units Value Qual MDL RDL Units Value Qual MDL RDL Units
193 2.5 5 mg/L 14 0.9 1.8 mg/L
1.45 0.05 0.1 mg/L 0.296 0.05 0.1 mg/L
0.0457 0.01 0.04 mg/L 0.025 <RDL 0.01 0.04 mg/L <MDL 0.01 0.04 mg/L
0.241 0.005 0.01 mg/L 0.038 0.005 0.01 mg/L
0.0125 0.0005 0.002 mg/L 0.0076 0.0005 0.002 mg/L <MDL 0.0005 0.002 mg/L
23.5 0.5 10 umhos/cm 24.9 0.5 10 umhos/cm
98.7 % 96.8 %
11.2 0.5 1 mg/L 10.9 0.5 1 mg/L
7.21 pH 7.23 pH
9.9 deg C 10 deg C
78.9 0.5 2 NTU 12.7 0.5 2 NTU
JP none JP none
FFB none
3730 50 50 ug/L 2790 50 50 ug/L
0.29 <RDL 0.2 1 ug/L 0.72 <RDL 0.2 1 ug/L
3.88 0.2 2 ug/L 2.14 0.2 2 ug/L
0.1 <RDL 0.1 0.5 ug/L 0.12 <RDL 0.1 0.5 ug/L
914 50 50 ug/L 783 50 50 ug/L
18.3 0.5 2.5 ug/L 111 0.5 2.5 ug/L
13.1 0.331 0.331 mg CaCO3/L 10.2 0.331 0.331 mg CaCO3/L
3/31/2016 J:\L64714.XLS Page 2 of 3Information Systems And Data Analysis

King County Environmental Lab Analytical Report
ParametersCV SM2540-D
Total Suspended SolidsCV SM4500-N-C
Total NitrogenCV SM4500-NO3-F
Nitrite + Nitrate NitrogenCV SM4500-P-B,F
Total PhosphorusCV SM4500-P-F
Orthophosphate PhosphorusES KCEL SOP# 245
Conductivity, Field
Dissolved Oxygen Saturation, Field
Dissolved Oxygen, Field
pH, Field
Sample Temperature, Field
Turbidity, FieldES NONE
Field Personnel
Sample FunctionMC MICRO SOP570VD
Hu-2-bacteroidesMC SM 9222D 20TH
Fecal ColiformMT EPA 200.8*SW846 6020A
Calcium, Total, ICP-MS
Chromium, Dissolved, ICP-MS
Copper, Dissolved, ICP-MS
Lead, Dissolved, ICP-MS
Magnesium, Total, ICP-MS
Zinc, Dissolved, ICP-MSMT EPA 200.8/SW846 6020A*SM2340B
Hardness, Calc
Project: 421195-180
Locator: MERCER10-77TH
Descrip: STORM LINE OFF OF
Sample: L64714-7
Matrix: LG STORM WTR
ColDate: 3/1/16 12:55
TimeSpan:
TotalSolid:
ClientLoc:
SampDepth:
WET Weight Basis
Value Qual MDL RDL Units
119 0.5 10 umhos/cm
97.4 %
11 0.5 1 mg/L
7.46 pH
9.8 deg C
31.2 0.5 2 NTU
JP none
130 JU copies/ml
1500 CFU/100ml
3/31/2016 J:\L64714.XLS Page 3 of 3Information Systems And Data Analysis