mercom capital group india solar market update · 400 mw telangana solar projects (telangana) -...
TRANSCRIPT
©2016 Mercom Capital Group, llc. ALL RIGHTS RESERVED. I www.mercomcapital.com I [email protected] I Page 1
Mercom Capital Group
India Solar Market Update
India Solar Quarterly Market Update
Indian Solar Market Picks Up Speed With More Than 4 GW Forecasted
in 2016 March 2016
KEY FINDINGS
� India solar installations totaled 2,133 MW in 2015, up from 883 MW installed in 2014, year-over-year (YoY)
growth of 142%.
� Mercom is forecasting 2016 installations to reach approximately 4 GW, almost 100% YoY growth.
� Auctions are being announced at a brisk pace even though delays and extensions are fairly common.
� Approximately 10 GW of solar projects are currently under development with about 8.4 GW more to be
auctioned over the next few months.
� So far, 16 states have principally agreed to join the UDAY debt restructuring program. Of these states, only
seven have signed a memorandum of understanding (MoU).
� The World Trade Organization (WTO) has ruled against India’s domestic content policy for solar cells and
modules.
� Aggressive bidding continues to be a major concern with the latest auctions hitting new lows at ₹4.34
($0.064)/kWh.
� The Clean Environment Cess (tax) has doubled from ₹200 (~$3)/ton to ₹400 (~$6)/ton in the 2016-17
budget.
� A national RPO of 8% by March 2022 has been approved by the Union Cabinet in the revised power tariff
policy 2016.
List of Charts/Tables
India Solar Installations (MW)……………………………………………………………..……………….. 2
India Solar Policy Map………..…….………………….…….…………………………………….……….. 4
Utility-Scale Solar Projects in India…………………………………………………………….................. 5
All India Cumulative Solar Installations By Policy Type (MW)……………………..…………………… 5
India Solar Project Pipeline (MW)…………………………….……………………………………….…… 6
JNNSM Phase II, Batch 2 Tenders/Auction Results ………………….................................................. 7
JNNSM Phase II, Batch 3 Tenders/Auction Results …………………................................................. 9
Solar Bids in Reverse Auctions in India (₹/kWh)……………………………..……...……...................... 11
Monthly Average Chinese Module Spot Prices……………………………………………...................... 11
Ministry-wise NCEF Fund Allocation By Years………………….………………………........................ 16
Haryana Auction Results……………………………………………..………………………...……….….. 21
India Solar Installations (MW) By Location (Feb 2016) ……………………………………………..….. 23

©2016 Mercom Capital Group, llc. ALL RIGHTS RESERVED. I www.mercomcapital.com I [email protected] I Page 2
Mercom Capital Group
India Solar Market Update
The Indian solar sector is finally emerging from hibernation with solar installations doubling in 2015 after three years
of flat growth. Solar installations totaled 2,133 MW in 2015, up from 883 MW installed in 2014, YoY growth of 142%.
Cumulative installations have crossed the 5 GW mark with 5.6 GW as of February 2016. There are currently over 10
GW of solar projects in various stages of development. Mercom is forecasting 2016 installations to reach
approximately 4 GW, almost 100% YoY growth.
Auctions are being announced at a brisk pace even though delays and extensions are fairly common. The
government, after a slow start, is demonstrating its commitment towards achieving the ambitious installation target of
100 GW by 2022. Currently, about 10 GW of solar projects are under development with about 8.4 GW more to be
auctioned over the next few months. With 5.6 GW installed as of February 2016, about 95 GW of solar will need to be
installed in seven years at a pace of 13.5 GW a year to reach 100 GW by 2022.
After years of slow growth, the Indian solar industry should be ecstatic with all the activity and forecasted growth but
developers and manufacturers are cautiously optimistic. Their major concern continues to be aggressive bidding with
the latest auctions hitting new lows at ₹4.34 ($0.064)/kWh, a drop of about 6% in the last three months. Projects with
tariffs below ₹5 (~$0.0735)/kWh, unless they are built at a cost of ₹5 crores (~$0.7 million) or below, are being
considered extremely risky and difficult to finance by lenders as well as by a majority of developers. Currently, most
domestic banks are unwilling to fund projects below ₹5 (~$0.0735)/kWh as they fear failed projects that could end up
on their books as non-performing assets. Some companies that have bid below ₹5 (~$0.0735)/kWh are now in
trouble and there could be more such cases in the future unless developers pull back and some sanity is restored.
Failed projects could freeze investments and slow down installations. The government looks very committed to solar
and the market is going to be very large; there is no reason for this race to the bottom.
6 12 172
986 1,004 883
2,133
4,054
8,178
8,970
9,500
10,500
0
10,000
20,000
30,000
40,000
50,000
0
2,000
4,000
6,000
8,000
10,000
12,000
2009 2010 2011 2012 2013 2014 2015 2016F 2017F 2018F 2019F 2020F
Cu
mu
lati
ve
In
sta
llati
on
s (M
W)
An
nu
al I
nst
alla
tio
ns
(MW
)
Source: Mercom Capital Group, llc
Annual Solar Installations
Cumulative Solar Installations
Feb 2016
Data derived from MNRE, Mercom Project Tracker & Public Sources
India Solar Installations (MW)

©2016 Mercom Capital Group, llc. ALL RIGHTS RESERVED. I www.mercomcapital.com I [email protected] I Page 3
Mercom Capital Group
India Solar Market Update
But most projects with bids below ₹5 (~$0.0735)/kWh are, however, expected to be commissioned in 2017 and
developers are hoping that module and Balance of System (BOS) costs will continue to drop along with interest rates
to make these projects feasible.
The Indian government’s recently announced budget did not include much for the solar sector. Accelerated
depreciation will be reduced from 80% to 40% starting in FY 2017, and will mostly affect the rooftop solar, some
large-scale solar and wind sectors. Investment into IREDA has been increased which will boost lending. The “Clean
Energy Cess,” now called the “Clean Environment Cess” (or coal tax), has been raised from ₹200 (~$3)/ton to ₹400
(~$6)/ton which will increase the cost of coal while making solar more cost-competitive. But as we have highlighted
before, almost half of the coal tax collected has been going towards river cleaning projects. Based on the figures so
far, we cannot assume that doubling the coal cess will result in all of the funds going to renewables. While budget
maneuverings happen, taxing the coal industry for CO2 emissions and diverting half of those funds to cleaning rivers
is not the right way to do it. The increased costs will eventually be passed on to the consumer in the form of higher
electricity bills.
A revised power tariff policy that guides government agencies was recently approved by the Union Cabinet. An
important highlight was the increase in the renewable purchase obligation (RPO) for solar to 8% by 2022. This is a
significant step towards achieving the 100 GW goal, but the RPO will remain just a number unless there is strict
enforcement.
The Ujwal DISCOM Assurance Yojana (UDAY), a program to improve the financial condition of DISCOMs, has so far
attracted 16 states which have agreed in principle to join the voluntary program; seven of these states have signed an
MoU. A lot rides on the success of UDAY as DISCOMs currently are sitting on about ₹4.3 lakh crore (~$63 billion) in
debt as of September, 2015. The poor financial condition of DISCOMs has resulted in low offtake of power and
delayed payments, increasing borrowing costs for developers.
The World Trade Organization (WTO) ruled against the domestic content policy of India regarding solar cells and
modules. The ruling was expected and will, in the short term, affect local manufacturers that were heavily dependent
on domestic content rules. Domestic Content Requirement (DCR) projects made up a small portion of the projects
auctioned and recently have had difficulty attracting developers. In the long term, the ruling should be a positive as it
opens up more non-DCR projects. Restricting the use of non-domestic cheaper components while expecting solar
power at the lowest possible price has never made sense. The Indian government is expected to appeal the WTO
ruling.
©2016 Mercom Capital Group, llc. ALL RIGHTS RESERVED. I www.mercomcapital.com I [email protected] I Page 4
Mercom Capital Group
India Solar Market Update
Source: Mercom Capital Group, llc
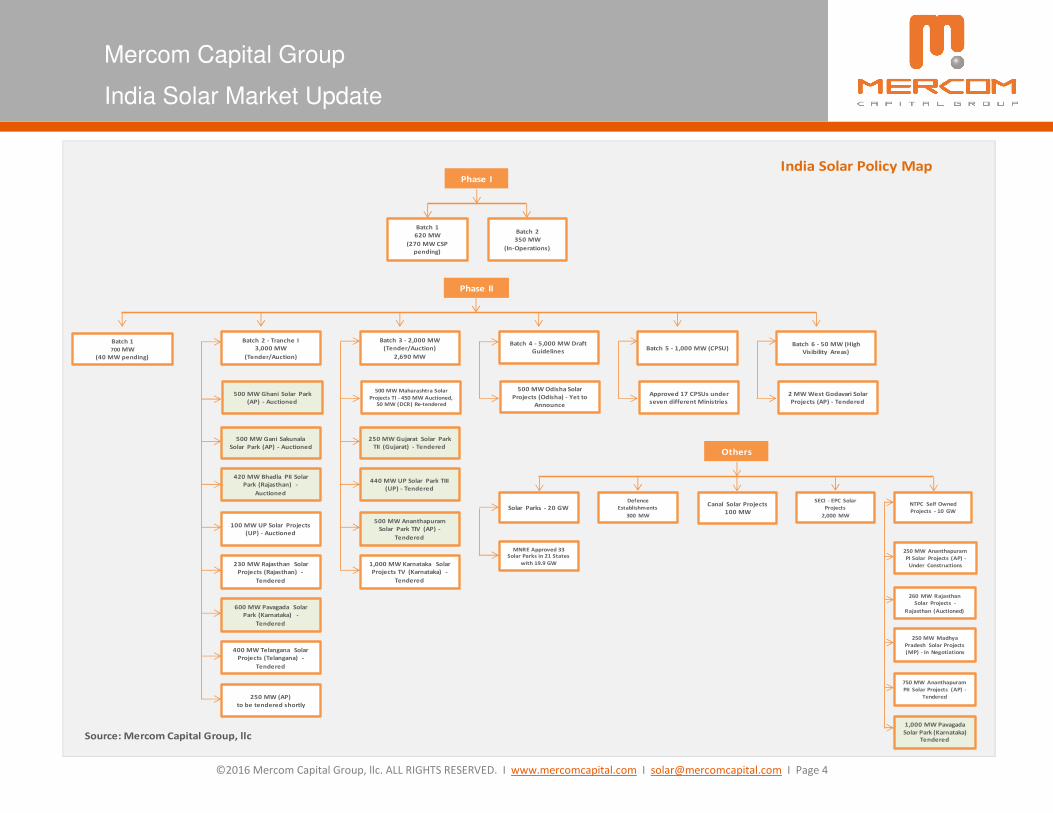
India Solar Policy Map
Batch 1
700 MW
(40 MW pending)
100 MW UP Solar Projects
(UP) - Auctioned
420 MW Bhadla PII Solar
Park (Rajasthan) -
Auctioned
500 MW Gani Sakunala
Solar Park (AP) - Auctioned
500 MW Ghani Solar Park
(AP) - Auctioned
Batch 2 - Tranche I
3,000 MW
(Tender/Auction)
230 MW Rajasthan Solar
Projects (Rajasthan) -
Tendered
Phase II
600 MW Pavagada Solar
Park (Karnataka) -
Tendered
400 MW Telangana Solar
Projects (Telangana) -
Tendered
250 MW (AP)
to be tendered shortly
500 MW Ananthapuram
Solar Park TIV (AP) -
Tendered
440 MW UP Solar Park TIII
(UP) - Tendered
250 MW Gujarat Solar Park
TII (Gujarat) - Tendered
500 MW Maharashtra Solar
Projects TI - 450 MW Auctioned, 50 MW (DCR) Re-tendered
Batch 3 - 2,000 MW
(Tender/Auction)
2,690 MW
1,000 MW Karnataka Solar
Projects TV (Karnataka) -
Tendered
500 MW Odisha Solar
Projects (Odisha) - Yet to
Announce
Batch 4 - 5,000 MW Draft
Guidelines
Approved 17 CPSUs under
seven different Ministries
Batch 5 - 1,000 MW (CPSU)
2 MW West Godavari Solar
Projects (AP) - Tendered
Batch 6 - 50 MW (High
Visibility Areas)
Batch 1
620 MW
(270 MW CSP
pending)
Batch 2
350 MW
(In-Operations)
Phase I
Defence
Establishments
300 MW
Canal Solar Projects
100 MW
Others
Solar Parks - 20 GW
SECI - EPC Solar
Projects
2,000 MW
MNRE Approved 33 Solar Parks in 21 States
with 19.9 GW
NTPC Self Owned
Projects - 10 GW
750 MW Ananthapuram
PII Solar Projects (AP) -
Tendered
250 MW Madhya
Pradesh Solar Projects
(MP) - In Negotiations
260 MW Rajasthan
Solar Projects -
Rajasthan (Auctioned)
250 MW Ananthapuram
PI Solar Projects (AP) -
Under Constructions
1,000 MW Pavagada
Solar Park (Karnataka) Tendered

©2016 Mercom Capital Group, llc. ALL RIGHTS RESERVED. I www.mercomcapital.com I [email protected] I Page 5
Mercom Capital Group
India Solar Market Update
Utility-Scale Solar Projects in India
Operational and Under Development
Feb 2016
Capacity (MW)
In Operation
Solar PV 5,423
Solar Thermal 209
Total 5,632
Under Development
Solar PV 9,970
Solar Thermal 280
Total 10,250
Source: Mercom Capital Group, llc
Policy Updates
JNNSM - Phase II Batch 1 (SECI)
700 MW were scheduled to be completed by May 2015 under this batch. We have confirmation of 660 MW having
been commissioned so far. The remaining 40 MW (20 MW – DCR and 20 MW – Open category) have yet to be
commissioned. According to our sources, a 10 MW project of this total is likely to be cancelled.
1,0
23
75
2
66
0
54
3
34
3
33
0
29
5
25
7
22
0
20
0
14
9
14
0
11
0
10
6
94
90
79
69
48
43
32
21
5 5 3 3 3 3 3 2 2 1
Source: Mercom Capital Group, llc (Feb 2016)
All India Cumulative Solar Installations By Policy Type (MW)
Cumulative Solar Installations
5,632 MW
©2016 Mercom Capital Group, llc. ALL RIGHTS RESERVED. I www.mercomcapital.com I [email protected] I Page 6
Mercom Capital Group
India Solar Market Update
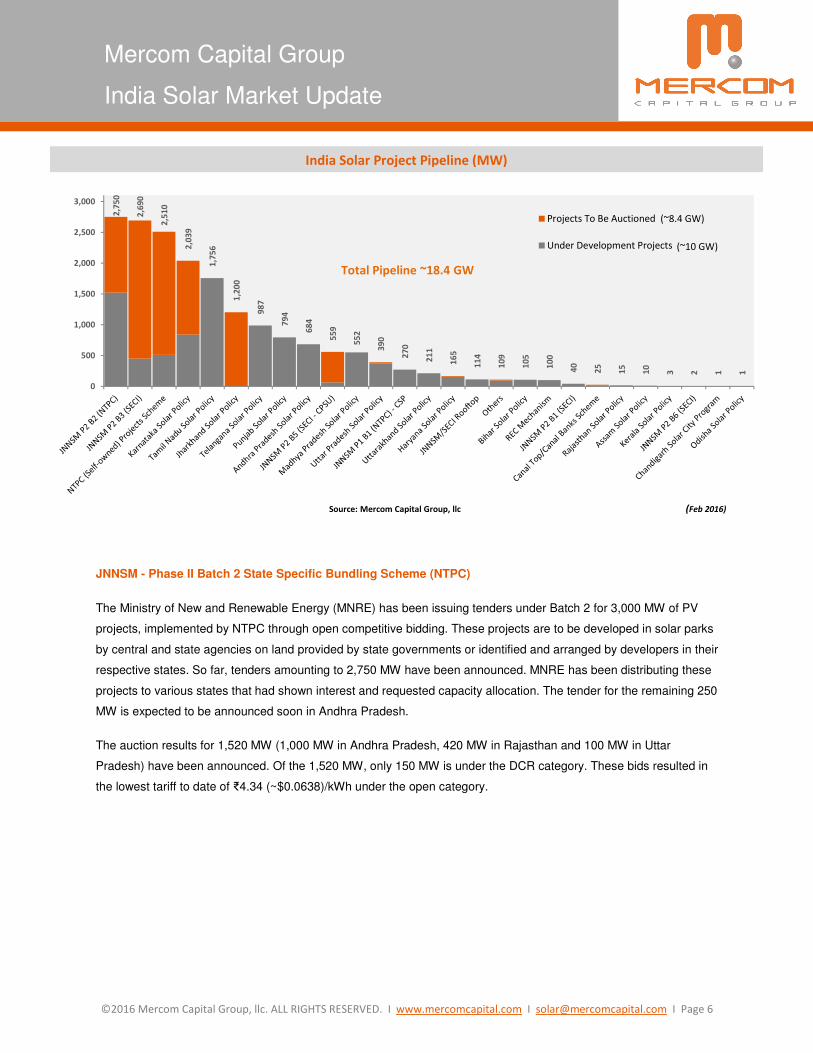
JNNSM - Phase II Batch 2 State Specific Bundling Scheme (NTPC)
The Ministry of New and Renewable Energy (MNRE) has been issuing tenders under Batch 2 for 3,000 MW of PV
projects, implemented by NTPC through open competitive bidding. These projects are to be developed in solar parks
by central and state agencies on land provided by state governments or identified and arranged by developers in their
respective states. So far, tenders amounting to 2,750 MW have been announced. MNRE has been distributing these
projects to various states that had shown interest and requested capacity allocation. The tender for the remaining 250
MW is expected to be announced soon in Andhra Pradesh.
The auction results for 1,520 MW (1,000 MW in Andhra Pradesh, 420 MW in Rajasthan and 100 MW in Uttar
Pradesh) have been announced. Of the 1,520 MW, only 150 MW is under the DCR category. These bids resulted in
the lowest tariff to date of ₹4.34 (~$0.0638)/kWh under the open category.
India Solar Project Pipeline (MW)
2,7
50
2,6
90
2,5
10
2,0
39
1,7
56
1,2
00
98
7
79
4
68
4
55
9
55
2
39
0
27
0
21
1
16
5
11
4
10
9
10
5
10
0
40
25
15
10
3 2 1 1
0
500
1,000
1,500
2,000
2,500
3,000
Projects To Be Auctioned
Under Development Projects
Total Pipeline ~18.4 GW
Source: Mercom Capital Group, llc (Feb 2016)
(~8.4 GW)
(~10 GW)
©2016 Mercom Capital Group, llc. ALL RIGHTS RESERVED. I www.mercomcapital.com I [email protected] I Page 7
Mercom Capital Group
India Solar Market Update
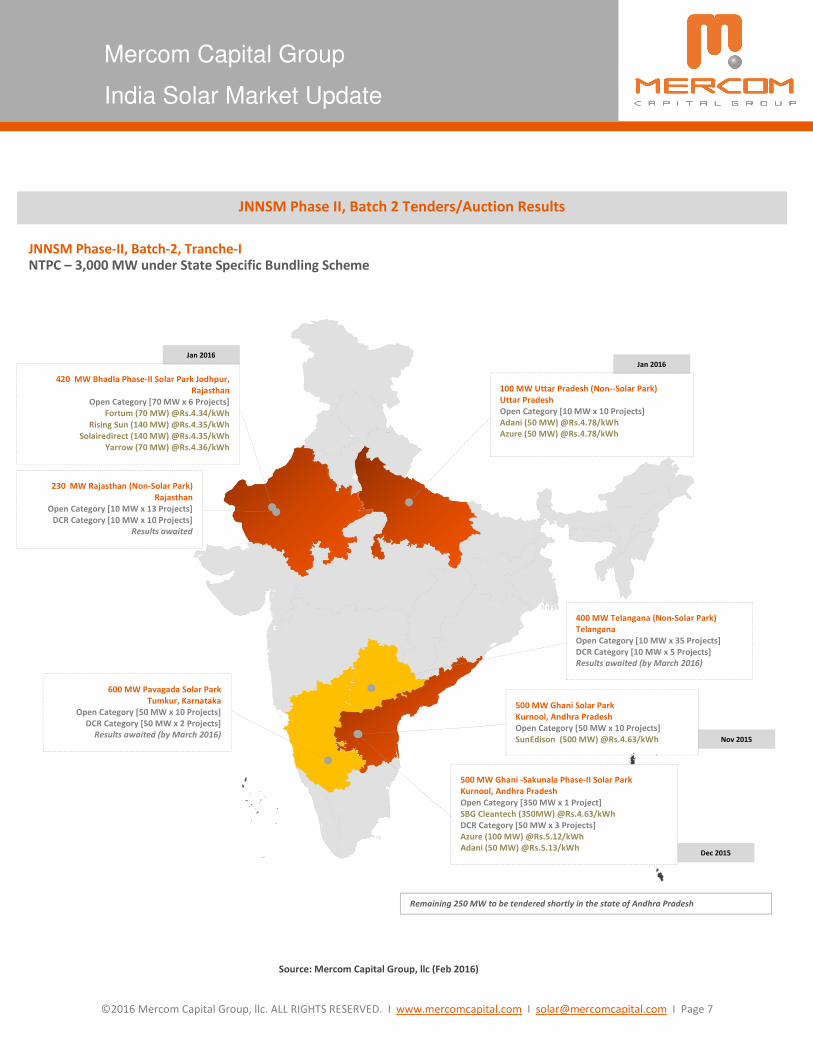
JNNSM Phase II, Batch 2 Tenders/Auction Results
Jan 2016
Jan 2016
JNNSM Phase-II, Batch-2, Tranche-I NTPC – 3,000 MW under State Specific Bundling Scheme
100 MW Uttar Pradesh (Non--Solar Park)
Uttar Pradesh
Open Category [10 MW x 10 Projects]
Adani (50 MW) @Rs.4.78/kWh
Azure (50 MW) @Rs.4.78/kWh
420 MW Bhadla Phase-II Solar Park Jodhpur,
Rajasthan
Open Category [70 MW x 6 Projects]
Fortum (70 MW) @Rs.4.34/kWh
Rising Sun (140 MW) @Rs.4.35/kWh
Solairedirect (140 MW) @Rs.4.35/kWh
Yarrow (70 MW) @Rs.4.36/kWh
230 MW Rajasthan (Non-Solar Park)
Rajasthan
Open Category [10 MW x 13 Projects]
DCR Category [10 MW x 10 Projects]
Results awaited
600 MW Pavagada Solar Park
Tumkur, Karnataka
Open Category [50 MW x 10 Projects]
DCR Category [50 MW x 2 Projects]
Results awaited (by March 2016)
400 MW Telangana (Non-Solar Park)
Telangana
Open Category [10 MW x 35 Projects]
DCR Category [10 MW x 5 Projects]
Results awaited (by March 2016)
500 MW Ghani -Sakunala Phase-II Solar Park
Kurnool, Andhra Pradesh
Open Category [350 MW x 1 Project]
SBG Cleantech (350MW) @Rs.4.63/kWh
DCR Category [50 MW x 3 Projects]
Azure (100 MW) @Rs.5.12/kWh
Adani (50 MW) @Rs.5.13/kWh
Nov 2015
Remaining 250 MW to be tendered shortly in the state of Andhra Pradesh
500 MW Ghani Solar Park
Kurnool, Andhra Pradesh
Open Category [50 MW x 10 Projects]
SunEdison (500 MW) @Rs.4.63/kWh
Dec 2015
Source: Mercom Capital Group, llc (Feb 2016)

©2016 Mercom Capital Group, llc. ALL RIGHTS RESERVED. I www.mercomcapital.com I [email protected] I Page 8
Mercom Capital Group
India Solar Market Update
JNNSM - Phase II Batch 3 (SECI)
Solar Energy Corporation of India (SECI), the implementing agency tasked with setting up 2,000 MW of grid-
connected solar PV power projects under JNNSM Phase II Batch 3 - “State Specific Viability Gap Funding (VGF)
Scheme,” issued tenders amounting to 2,690 MW. Auction results for 450 MW of projects to be developed in
Maharashtra under the open category were announced recently. The lowest tariff under this category was ₹4.41
(~$0.0649)/kWh against the base price of ₹4.43 (~$0.0651)/kWh. Tenders to develop 1,000 MW of solar projects
under this program in Karnataka have been issued and online bids are scheduled to be opened at the end of March
2016.
JNNSM - Phase II Batch 4 (SECI)
The Cabinet Committee on Economic Affairs has approved the construction of 5,000 MW of grid-connected solar PV
projects on a “build-own-operate” basis with VGF benefits. The estimated investment for this scheme is about
₹30,000 crore (~$4.4 billion). The draft guidelines for this batch were announced by MNRE recently and we expect a
tender of 500 MW to be issued under this scheme. These projects are proposed for development in Odisha.
JNNSM - Phase II Batch 5 - (SECI – CPSU)
Under Batch 5, the Central Public Sector Undertakings (CPSUs) and Government of India organizations’ self-use or
third-party sale or merchant sale has set a target for 1,000 MW of grid-connected solar PV projects, with VGF over a
span of three years from FY 2014-15 to 2016-17; DCR was mandatory but with the recent WTO ruling, it is unclear at
the moment how the DCR clause will play out.
MNRE has been approving projects under this program in Categories A, B and C based on the projects’ stages of
development. MNRE has approved 1,000 MW of projects to be developed by 17 CPSUs under seven different
ministries.
JNNSM - Phase II Batch 6 (SECI - High Visibility Areas)
MNRE announced another program for more than 50 MW of grid-connected solar projects in high-visibility areas
under this batch. SECI will be implementing these projects as per MNRE guidelines. The purpose of this scheme is to
develop awareness among the public about emerging solar technologies. These projects will be located in major
cities with technology parks, museums and main markets.

©2016 Mercom Capital Group, llc. ALL RIGHTS RESERVED. I www.mercomcapital.com I [email protected] I Page 9
Mercom Capital Group
India Solar Market Update
Jan 2016
JNNSM Phase II, Batch 3 Tenders/Auction Results
JNNSM Phase-II, Batch-3 SECI - 2,000 MW under VGF Scheme
250 MW Gujarat Solar Park Projects, Tranche-II
Charanka, Gujarat
Open Category [40 MW x 5 Projects
25 MW x 1 Project]
DCR Category [25 MW x 1 Project]
Results awaited (by the end of Feb 2016)
1,000 MW Karnataka Solar Projects, Tranche-V
Karnataka
Open Category [10 MW x 95 Projects]
DCR Category [10 MW x 5 Projects]
Technical Bid Opening on 30 Mar 2016
500 MW Ananthapuram Solar Park, Tranche-IV
Andhra Pradesh
Open Category [50 MW x 8 Projects]
DCR Category [50 MW x 2 Projects]
Results awaited (by mid of Mar 2016)
440 MW UP Solar Park, Tranche-III
Uttar Pradesh
Open Category [50 MW x 2 Projects
65 MW x 1 Project
75 MW x 3 Projects]
DCR Category [50 MW x 1 Projects]
Results awaited (by mid of March 2016)
500 MW Maharashtra Solar Projects, Tranche-I
Maharashtra
Open Category [10 MW x 45 Projects]
Bhageria Industries (30 MW) (VGF-0) @Rs.4.41
Talettutayi Solar (50 MW) Rs.46 Lakh/MW/@Rs.4.43
Orange Renewable (100 MW) Rs.47.7 Lakh/MW/@Rs.4.43
Sepset Constructions (40 MW) Rs.48.9 Lakh/MW/@Rs.4.43
Krishna Windfarm Developers (10 MW) Rs.53.5 Lakh/MW/@Rs.4.43
AMPL Cleantech (50 MW) Rs.53.7 Lakh/MW/@Rs.4.43
Welspun Renewables (100 MW) Rs.53.7 Lakh/MW/@Rs.4.43
Suzlon (70 MW) Rs.54 Lakh/MW/@Rs.4.43
DCR Category [10 MW x 5 Projects]
Re-tendered
Source: Mercom Capital Group, llc (Feb 2016)

©2016 Mercom Capital Group, llc. ALL RIGHTS RESERVED. I www.mercomcapital.com I [email protected] I Page 10
Mercom Capital Group
India Solar Market Update
Other Announced Solar Programs
Ultra Mega Projects in Solar Parks
MNRE established a plan to set up solar parks with a capacity of 500 MW and above, targeting 20,000 MW of
installed capacity over a span of five years beginning in FY 2014-15. According to the latest update, 21 states have
agreed to set up 33 solar parks with a combined capacity of 19,900 MW.
Public Sector Units
Among public sector units, NTPC alone has a target of 10,000 MW of solar projects. These projects will be developed
separately from the 1,000 MW under JNNSM Phase II Batch 5. NTPC has issued tenders for 2,510 MW so far. The
first batch of 250 MW of projects in Andhra Pradesh, which have signed PPAs as of April 2015, is expected to be
commissioned by April 2016.
Other Updates
Solar Bids
The most hotly debated topic in the sector is the aggressive low bids in various solar auctions around the country.
The lowest winning bid right now is ₹4.34 (~$0.0638)/kWh by Fortum in the JNNSM Phase II Batch 2 auction in
Rajasthan. In the last three months, the lowest bid has dropped again by ~6%. Crystalline silicon module prices
dropped by 7.5% in 2015 in the Chinese spot market (wafer shortages are being worked out) and by ~13% YoY in
the Indian market for comparison. However, module prices now have solidified and are forecasted to remain flat or
drop slightly over the next year. According to some developers, BOS costs have dropped sharply, by about 20%,
including inverters and material costs (such as steel). Developers feel that anything below a tariff of ₹5
(~$0.0735)/kWh at a project cost of ₹5 crores (~$0.7M) is not feasible, at least not at required IRRs.
To be fair, projects typically have 12 to 18 months from bidding to commissioning dates (with some delays to be
expected) and about six to twelve months for procurement. For all practical purposes these are post-dated bids for
2017. Developers are betting that component prices and borrowing rates will continue to fall to make these projects
financially viable. Solar parks were another reason given for the drop in bids but most developers indicated that solar
parks are expensive and the benefits that parks provide still do not equate to the level of tariff decreases.
Fears also remain that if a few of these projects fail or get cancelled due to poor project economics (there are many
examples of this in the infrastructure sector), it could have a domino effect and freeze investments into the sector.
The government, meanwhile, seems to be more than pleased with the rapidly falling tariffs. The Solar Energy
Corporation of India (SECI) and some states have revised their tariffs or are considering doing so based on recent
low bids, though it is difficult to compare them due to differences in solar insolation levels in various regions, land and
other costs like parks vs. non-parks, etc. The regulators need to be diligent and aware of current project economics
state by state, to be able to identify unworkable low bids and build a mechanism into the auction process to reject
these bids in order to send a positive signal to the market and weed out unqualified bidders.

©2016 Mercom Capital Group, llc. ALL RIGHTS RESERVED. I www.mercomcapital.com I [email protected] I Page 11
Mercom Capital Group
India Solar Market Update
12.76
9.448.98
8.508.05
9.50
7.818.05
6.97
8.71 8.74
8.10
9.33
5.99
8.73
7.74
6.90
7.99
9.33
7.12
5.64
7.72
7.167.56
5.87 5.89
8.60
5.98 5.99
5.13
4.36
10.95
7.49
7.00
7.94 7.90
7.28
5.54 5.51
6.47
7.207.67
6.45
8.01
5.25
7.87
6.666.45
6.85
8.94
6.71
5.05
7.29
6.68 6.68
5.495.17
7.02
5.09
5.57
4.63 4.635.12
4.344.78
4.415.00
3.54.04.55.05.56.06.57.07.58.08.59.09.5
10.010.511.011.512.012.513.0
NSM
PI
B1
(M
ah
)
NSM
PI
B2
(R
aj)
Od
ish
a B
1
Ka
rna
taka
PI
MP
PI
Od
ish
a B
2
Ch
ha
ttis
ga
rh
Ka
rna
taka
PII
MP
PII
Pu
nja
b P
I (C
1)
Pu
nja
b P
I (C
2)
Ra
jast
ha
n
UP
B1
AP
PII
Bih
ar
Ka
rna
taka
PII
I
Te
lan
ga
na
PI
Utt
ark
ha
nd
UP
B2
Ka
rna
taka
PIV
-No
v 1
4
MP
PII
I-Ju
l 1
5
*P
un
jab
PII
(C
1)-
Fe
b 1
5
*P
un
jab
PII
(C
2)-
Fe
b 1
5
*P
un
jab
PII
(C
3)-
Fe
b 1
5
Te
lan
ga
na
PII
G1
-Au
g 1
5
Te
lan
ga
na
PII
G2
-Au
g 1
5
UP
B3
-Se
p 1
5
Pu
nja
b P
III-
Se
p 1
5
Utt
ark
ha
nd
(T
yp
e-I
)-N
ov
15
NSM
PII
B2
(A
P)-
No
v 1
5
NSM
PII
B2
(A
P)-
De
c 1
5
NSM
PII
B2
(A
P)
DC
R-D
ec
15
NSM
PII
B2
(R
aj)
-Ja
n 1
6
NSM
PII
B2
(U
P)-
Jan
16
NSM
PII
B3
(M
ah
)-Ja
n 1
6
Ha
rya
na
-Ja
n 1
6
2010
-11
2011-12 2012-13 2013-14 2014-15 2015-16
Ta
riff
(₹
/kW
h)
High Tariff (₹/kWh) Low Tariff (₹/kWh)
Source: Mercom Capital Group, llc
Note: AP Phase II - The range of first-year tariffs offered by the successful bidders was Rs.5.25-5.99/kWh with a 3% per annum escalation for the first 10 years, then flat thereafter.
*Punjab PII (C1, C2, C3) Projects are estimated be commisioned in April 2016.
Feb 2016
Commissioning in 2017
Solar Bids in Reverse Auctions in India (₹/kWh)
Monthly Average Chinese Module Spot Prices
1.2
1
0.9
1
0.6
4 0.6
8
0.5
9
0.5
4
0.40
0.50
0.60
0.70
0.80
0.90
1.00
1.10
1.20
1.30
Au
g
Se
p
Oct
No
v
De
c
Jan
Fe
b
Ma
r
Ap
r
Ma
y
Jun
Jul
Au
g
Se
p
Oct
No
v
De
c
Jan
Fe
b
Ma
r
Ap
r
Ma
y
Jun
Jul
Au
g
Se
p
Oct
No
v
De
c
Jan
Fe
b
Ma
r
Ap
r
Ma
y
Jun
Jul
Au
g
Se
p
Oct
No
v
De
c
Jan
Fe
b
Ma
r
Ap
r
Ma
y
Jun
Jul
Au
g
Se
p
Oct
No
v
De
c
Jan
2011 2012 2013 2014 2015 2016
Module Prices ($/W)
*Data derived from PVinsights, Energy Trend, Digitimes and other public and private sources Mercom Capital Group, llc
0.6
4
0.5
9
0.5
1
India Module Prices ($/W)
~7% drop in Chinese spot prices yoy
~13% drop in Indian contract prices yoy

©2016 Mercom Capital Group, llc. ALL RIGHTS RESERVED. I www.mercomcapital.com I [email protected] I Page 12
Mercom Capital Group
India Solar Market Update
Changing Power Scenario
The power scenario in India has changed significantly on paper. According to the government figures, the power
deficit has dropped significantly on paper from 9.9% in January 2013 to 1.7% in December 2015.
Spot power tariffs remain at record lows on the Indian Energy Exchange (IEX) at ₹2.3 (~$0.0353)/kWh in February, a
4% drop month-over-month (MoM) and about a 19% drop YoY. One of the major reasons for the decrease in power
demand is reduced consumption by commercial and industrials due to slow growth (which runs contrary to India’s
new GDP numbers). Most of the industry believes that power deficits are still high in residential markets. Power cuts
are still a part of daily life in most parts of the country. Lower shortage figures in the residential power markets are a
result of unmet demand by DISCOMs which are in poor financial condition.
Coal prices, meanwhile, have dropped and coal generation has increased ~6% YoY. The cost of imported coal has
dropped ~28% YoY, while supplies have increased ~10% over last year, thanks to the National Democratic Alliance
(NDA) government’s efforts. Because of the low costs, more coal projects, which were previously in limbo, now are
coming online. Consequently, there has been a 7% reduction in coal imports (Apr-Dec 2015). Coal power producers
are already running at low (63%) plant load factor (PLF) due to low demand (up just 1.7% YoY) and increased supply
(~10% new capacity addition). With increased solar capacity forecasted from 2016-2022, coal PLFs are expected to
remain low unless demand increases significantly. Increased supply and lower coal prices will keep coal-based power
cheaper, putting additional pressure on solar tariffs. Coal-based power is being quoted at tariffs ~₹2 (~$0.0294), but
with the coal cess doubling in the recent budget, the cost advantage of coal will be negated to a certain extent.
It remains to be seen how this will affect the ability of solar off-takers like NTPC to attract investors as a public
company over the next one to two years as they deal with cheaper coal, abundant supplies, and low PLFs.
©2016 Mercom Capital Group, llc. ALL RIGHTS RESERVED. I www.mercomcapital.com I [email protected] I Page 13
Mercom Capital Group
India Solar Market Update
UDAY (Ujwal DISCOM Assurance Yojana) Update
The total outstanding debt of DISCOMs was a whopping ₹4.3 lakh crore (~$63 billion), as of September 30, 2015. To
tackle this problem, the Ministry of Power last November announced UDAY, a DISCOM (Power Distribution
Companies) turnaround plan that targets debt reduction and takeover of 75% of DISCOM debt by the States. The
UDAY program is also designed to achieve operational efficiencies in DISCOMs through various methods such as
smart metering and reduction of Aggregate Technical and Commercial (AT&C) losses, reducing the cost of power
through increased supply of cheaper domestic coal (this is already happening), reducing interest costs of DISCOMs
and enforcing financial discipline on DISCOMs through alignment with state finances.
So far, 16 states have principally agreed to join the UDAY program including Andhra Pradesh, Rajasthan, Jharkhand,
Madhya Pradesh, Uttarakhand, Himachal Pradesh, Punjab, Jammu & Kashmir, Haryana, Gujarat, Chhattisgarh, Uttar
Pradesh, Bihar, Odisha, Maharashtra and Telangana. Of these states, only seven have signed an MoU including
Chhattisgarh (debt of ₹1,740 crore/~$256 million), Uttar Pradesh (debt of ₹39,900 crore/~$5.9 billion), Rajasthan
(debt of ₹80,500 crore/~$11.8 billion), Jharkhand (debt of ₹1,165 crore/~$171 million), Bihar (debt of ₹3,110
crore/~$457 million), Punjab (debt of ₹20,838 crore/~$3.06 billion) and Gujarat. Debt totals are through September
30, 2015.
The UDAY program is a significant and commendable step taken by the government to improve the financial
condition of DISCOMs which, in turn, is expected to lift the entire power sector and might provide a one-time jolt to
power consumption. But it remains to be seen how far these reforms will go, or if there is the political will to address
the two main culprits: the subsidization of low-cost power in the agricultural sectors, and the pilfering of electricity
(either through lack of collections or power theft) in areas with high AT&C losses. Without deep and permanent
reforms, problems will likely remain.

©2016 Mercom Capital Group, llc. ALL RIGHTS RESERVED. I www.mercomcapital.com I [email protected] I Page 14
Mercom Capital Group
India Solar Market Update
Domestic Manufacturing
The World Trade Organization (WTO) has ruled against India’s domestic content policy for solar cells and modules.
The WTO ruled against India last August; India appealed the ruling and was directly engaged with the U.S. in a bid to
keep DCR rules in place for government procurement. The case against India was originally filed in 2013, following
the announcement of DCR in JNNSM Phase II policy and after India decided to file an anti-dumping case against the
U.S., China, Malaysia and Taiwan.
As we have expressed several times before, the DCR dispute has been an unwanted distraction. After Canada lost a
similar case to Japan and the E.U., we warned that this was a losing battle but the Indian government decided to
pursue the case, largely to protect domestic manufacturers.
The DCR policy has always been contradictory – the government doesn’t want cheaper imported panels, but wants
solar power at the lowest possible price.
Locally manufactured panels cost more, auctions with DCR usually end up with higher bids and the interest in these
higher-cost projects is waning. In the end, the offtaker has to willingly pay a higher tariff for DCR projects while non-
DCR projects cost less. Currently, you can buy DCR and non-DCR panels through the same vendor who will charge
10-15% more for a DCR panel.
In the short term, this will affect manufacturers who are overly dependent on the DCR market. In the long term, the
effect should be minimal, as DCR projects are a small part of the projects auctioned; manufacturers now have clarity
and can adjust their strategy accordingly in order to compete.
This is good news for developers as it opens up more projects under the non-DCR category. Currently, there is a
pipeline of 1.2 GW of solar projects to be auctioned under DCR between JNNSM Phase II Batch 2, Batch 3, NTPC
projects and SECI/Coal India Limited projects. About 660 MW of DCR projects were auctioned last year under
JNNSM Phase II Batch 2 and NTPC projects. At the time of this report, it is unclear as to how the ruling will be
implemented. But, according to a spokesperson for the Solar Energy Industry Association (SEIA), “these decisions
are not retroactive.”
In another development, the Indian government is also floating a plan to support setting up Polysilicon, Ingot and
Wafer manufacturing facilities in India, as it sees an opportunity to capture business emerging from the goal to install
100 GW by 2022. In our opinion, the government should reconsider venturing into the manufacturing business and
instead focus on removing hurdles like duties and provide world class infrastructure, and let the free markets work.
Manufacturing in the solar industry is a tough business, littered with skeletons of failed manufacturers over the last 10
years. In the United States, the government’s plan to support manufacturing by funding solar
technology/manufacturing companies ended disastrously, with most of the companies going bankrupt as they could
not compete with low cost panels from China. Things have not gone any better in Europe. Successful manufacturers
around the world have achieved massive scale and rapid efficiency improvements that have brought down costs.

©2016 Mercom Capital Group, llc. ALL RIGHTS RESERVED. I www.mercomcapital.com I [email protected] I Page 15
Mercom Capital Group
India Solar Market Update
Achieving economies of scale will require massive investments without guaranteed success. Chinese state owned
banks have provided over $50 billion (~₹3.4 lakh crore) in credit facilities to Chinese manufacturing companies since
2010 and still witnessed countless companies go out of business. These subsidies led to U.S. and Europe filing and
eventually winning the antidumping case against Chinese manufacturers.
Revised Tariff Policy 2016
A revised power tariff policy to guide government agencies was announced in January and the amendments were
approved by the Union Cabinet with multiple objectives and a strong focus on renewable energy. Some of the most
important highlights include:
Power Sector
• The most important goal is to achieve 24X7 power supply to all consumers; state governments and
regulators are required to develop a power supply plan to achieve this goal.
• The plan envisions providing power to remote, unconnected villages through microgrids until the grid
infrastructure reaches these areas.
• Transmission projects will be required to go through a competitive bidding process to lower costs.
• Smart meter installations will ramp up to enable “time of day” metering, reduce power theft and allow net
metering.
• Tariff determination to occur periodically on a monthly/quarterly basis by taking into account the variations
in costs, price of fuel and other factors with a goal to recover the cost of electricity.
• Existing power projects could be allowed a one-time expansion of up to 100% of existing capacity.
Renewable Energy
• Renewable Power Obligation (RPO): 8% of electricity consumption to be procured from solar energy by
March 2022.
• Renewable Generation Obligation (RGO): New coal-based thermal power plants are required to
establish/procure/purchase renewable capacity after specified date.
• Bundling of renewable power with power from projects whose PPAs have expired or completed their useful
life through competitive bidding.
• No inter-state transmission charges and losses to be imposed for solar and wind power.
• 100% of the power produced from waste-to-energy plants to be procured by DISCOMs.
©2016 Mercom Capital Group, llc. ALL RIGHTS RESERVED. I www.mercomcapital.com I [email protected] I Page 16
Mercom Capital Group
India Solar Market Update
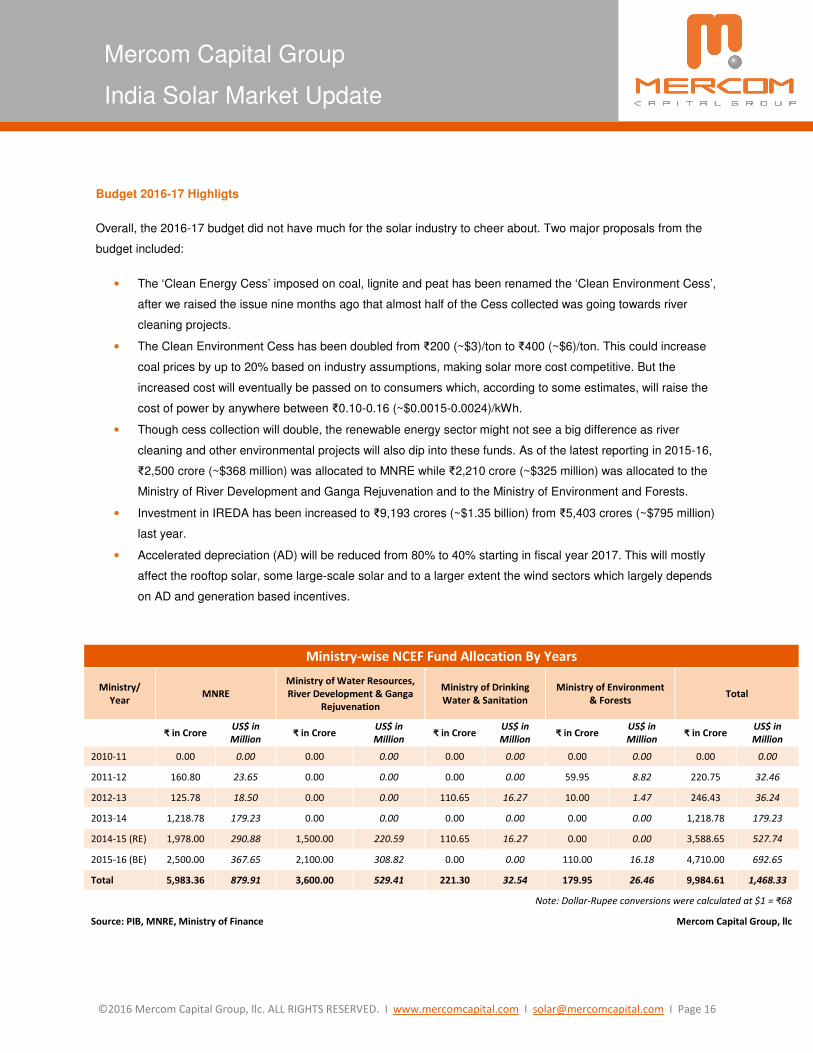
Budget 2016-17 Highligts
Overall, the 2016-17 budget did not have much for the solar industry to cheer about. Two major proposals from the
budget included:
• The ‘Clean Energy Cess’ imposed on coal, lignite and peat has been renamed the ‘Clean Environment Cess’,
after we raised the issue nine months ago that almost half of the Cess collected was going towards river
cleaning projects.
• The Clean Environment Cess has been doubled from ₹200 (~$3)/ton to ₹400 (~$6)/ton. This could increase
coal prices by up to 20% based on industry assumptions, making solar more cost competitive. But the
increased cost will eventually be passed on to consumers which, according to some estimates, will raise the
cost of power by anywhere between ₹0.10-0.16 (~$0.0015-0.0024)/kWh.
• Though cess collection will double, the renewable energy sector might not see a big difference as river
cleaning and other environmental projects will also dip into these funds. As of the latest reporting in 2015-16,
₹2,500 crore (~$368 million) was allocated to MNRE while ₹2,210 crore (~$325 million) was allocated to the
Ministry of River Development and Ganga Rejuvenation and to the Ministry of Environment and Forests.
• Investment in IREDA has been increased to ₹9,193 crores (~$1.35 billion) from ₹5,403 crores (~$795 million)
last year.
• Accelerated depreciation (AD) will be reduced from 80% to 40% starting in fiscal year 2017. This will mostly
affect the rooftop solar, some large-scale solar and to a larger extent the wind sectors which largely depends
on AD and generation based incentives.
Ministry-wise NCEF Fund Allocation By Years
Ministry/
Year MNRE
Ministry of Water Resources,
River Development & Ganga
Rejuvenation
Ministry of Drinking
Water & Sanitation
Ministry of Environment
& Forests Total
₹ in Crore US$ in
Million ₹ in Crore
US$ in
Million ₹ in Crore
US$ in
Million ₹ in Crore
US$ in
Million ₹ in Crore
US$ in
Million
2010-11 0.00 0.00 0.00 0.00 0.00 0.00 0.00 0.00 0.00 0.00
2011-12 160.80 23.65 0.00 0.00 0.00 0.00 59.95 8.82 220.75 32.46
2012-13 125.78 18.50 0.00 0.00 110.65 16.27 10.00 1.47 246.43 36.24
2013-14 1,218.78 179.23 0.00 0.00 0.00 0.00 0.00 0.00 1,218.78 179.23
2014-15 (RE) 1,978.00 290.88 1,500.00 220.59 110.65 16.27 0.00 0.00 3,588.65 527.74
2015-16 (BE) 2,500.00 367.65 2,100.00 308.82 0.00 0.00 110.00 16.18 4,710.00 692.65
Total 5,983.36 879.91 3,600.00 529.41 221.30 32.54 179.95 26.46 9,984.61 1,468.33
Note: Dollar-Rupee conversions were calculated at $1 = ₹68
Source: PIB, MNRE, Ministry of Finance Mercom Capital Group, llc

©2016 Mercom Capital Group, llc. ALL RIGHTS RESERVED. I www.mercomcapital.com I [email protected] I Page 17
Mercom Capital Group
India Solar Market Update
Industry Feedback
Below are the takeaways from our recent conversations with major developers, manufacturers and investors.
Developers
• Activity has picked up significantly and auctions are being announced regularly.
• Finally, there is now a market. On the flip side, low bids are unsustainable.
• Because there are no project size restrictions, reverse auctions are being won by one or two large
developers while smaller players are being shut out.
• Government agencies seem unprepared for the level of activity; delays and extensions are common and
some solar parks are not ready.
• In terms of execution, NVVN was better, NTPC is good and SECI is erratic. Payments are a concern with
SECI.
• Attractive state markets are Karnataka, Telangana and Andhra Pradesh.
• Unattractive state markets are Tamil Nadu due to payment issues and Jharkhand because of land issues.
• Some solar parks are expensive, especially SECI. Solar park costs are reaching ₹1.1-1.2 crore (~$0.16-0.18
million) in Gujarat. The Uttar Pradesh solar park is reported to be expensive, although construction has not
yet begun. The Andhra Pradesh solar park is also expensive.
• Solar parks are driving down bids even though park costs are high.
• Solar parks are delayed and are not ready for project construction.
• Foreign developers like the convenience of solar parks.
• Developers are only able to bid at the low tariff levels by cutting miscellaneous costs such as reducing the
height of structures, avoiding building solid roads and fencing walls, and by consolidating control rooms,
inverters and other BOS elements. Additionally, developers are seeing lower IRRs; they are sacrificing
returns in order to develop a pipeline.
• There is currently a consensus on a viable tariff of ₹5 (~$0.0735)/kWh at a project cost of ₹5 crore (~$0.7
million).
• Module prices are firming.
• BOS costs have come down approximately 20%.
• Current domestic borrowing rates are 10.25 to 12%.
• Domestic borrowing rates for larger projects are 9 to 10%.
• Current project IRRs are 13 to 15%. Domestic lenders are expecting 15 to 16% IRRs.
• Hedging costs are approximately 7%.
• Evacuation and curtailment is not a major issue at the moment except in Tamil Nadu (Rajasthan has some
issues but they are manageable). Solar power is prioritized.
• Payment issues are occurring mostly in Tamil Nadu, Uttar Pradesh and Rajasthan.
• The best states for timely payments are Karnataka, Madhya Pradesh and Gujarat.

©2016 Mercom Capital Group, llc. ALL RIGHTS RESERVED. I www.mercomcapital.com I [email protected] I Page 18
Mercom Capital Group
India Solar Market Update
• Current project costs are ₹4.5-5.2 crore (~$0.66-0.76 million). Project costs have dropped by about 10 to
15%.
Manufacturers
• Overall market activity has picked up significantly.
• Price pressure is still an issue as bids continue to drop in auctions.
• Developers are demanding modules at prices of ₹0.10 (~$0.0015)/W below the selling price in order to make
the low bids economically viable.
• Manufacturers fear abandoned projects because of aggressive bidding.
• Unless module prices drop by the third quarter of 2016, many developers will be in trouble.
• Average selling prices (ASP) for modules are $0.50-0.52/W (~₹34-35/W). ASP’s for DCR projects are $0.60-
62/W (~₹41-42/W).
• Average solar cell prices are $0.40-0.42/W (~₹27-28/W).
• Net margins are 0 to 7%.
• Cell and module prices are on an upward trend.
• Most local cell and module manufacturers are dependent on DCR policy for survival. Some will be in trouble
when it comes to debt management without DCR.
• Manufacturers want the government to help in other ways such as cheaper debt, tax relief and subsidies in
lieu of DCR.
©2016 Mercom Capital Group, llc. ALL RIGHTS RESERVED. I www.mercomcapital.com I [email protected] I Page 19
Mercom Capital Group
India Solar Market Update
Investors
• Projects will have a difficult time finding lenders at these low tariff levels. Lending tenures will get shorter.
• Current bids are extremely aggressive and are not sustainable. Many developers are still waiting for financial
closure for these low bid projects.
• The health of many domestic banks and lenders remain uncertain and we cannot see them taking on riskier
projects.
• These new low bids are assuming the prices of modules and inverters will fall significantly a year from now.
• Some developers are applying for lines of credit to import a portion of the modules and then are trying to find
long-term lenders for better terms.
• Some developers are factoring in interest rates at 11 to 12% initially, assuming that they can go back and
refinance after three years for 8 to 9%. There is a disconnect between developer assumptions and reality
when it comes to financing options.
• Due to quality concerns, lenders are starting their own “lenders acceptance program” for module certification
and standardization with tests that are two to three times tougher than the IEC.
• There have to be better technical qualifiers and barriers in auctions to maintain the quality of projects.
Currently there is a concern regarding quality.
• Some lenders are concerned that the low bids will lead to failed projects and eventually end up on the
lenders books as non-performing assets, which is already a problem in the banking sector.
• Some projects that are below ₹5 (~$0.0735)/kWh are already coming up for sale due to financing issues.
• Current lending rates are in the 10.75 to 12% range. Lenders are willing to go down to 10% for large
corporates and pure play solar companies with good credit profiles.
• Lenders do not plan to lower interest rates at the moment. In fact, rates may be raised in some cases
because of higher project risks due to aggressive bidding.
• Project IRRs have come down to 12 to 14%.
• Some banks are skeptical of UDAY and how much it will help – they want to wait and see.
• On the positive side, states are expanding the power infrastructure and building transmission lines.
• Overall, payment delays are not much of a concern except in Tamil Nadu and Rajasthan.
• Investors reported DISCOM payment delays of 30 to 45 days in Madhya Pradesh and Punjab.
©2016 Mercom Capital Group, llc. ALL RIGHTS RESERVED. I www.mercomcapital.com I [email protected] I Page 20
Mercom Capital Group
India Solar Market Update
State Programs
Uttar Pradesh: Currently, three different batches of projects totaling more than 500 MW are in various stages of
development in the state.
1. A Request for Proposal (RfP) to set up 300 MW of solar projects through a reverse auction was announced
in August 2014. PPAs were signed for 105 MW of projects in April 2015 with tariffs ranging between ₹8.93-
9.27 (~$0.1313-0.1363)/kWh. Of this, 15 MW of projects are expected to be commissioned by May 2016 and
90 MW of projects are expected to be commissioned by October 2016.
2. Another RfP to set up 215 MW of solar projects was announced in June 2015 and the PPAs were signed in
December 2015. Projects smaller than 20 MW in size (a total 75 MW) are expected to be commissioned by
January 2017 and projects larger than 20 MW in size (140 MW) are expected to be commissioned by June
2017.
Andhra Pradesh: About 750 MW of solar projects are being developed under two different programs in Andhra
Pradesh.
1. There are 140 MW of projects being developed under the first program. Of this, about 63 MW have been
commissioned and 62 MW are expected to be commissioned by March 2016. A 4 MW project has been
cancelled. The status of the remaining 11 MW is yet to be determined.
2. Andhra Pradesh DISCOMs have signed PPAs to develop 619 MW of projects with a first year tariff ranging
from ₹5.25 to ₹5.99 (~$0.0772 – 0.0881)/kWh with a 3% annual escalation over 10 years. Of these, 16 MW
have been commissioned to date and the remaining 603 MW of projects are expected to be commissioned
by May 2016.
Punjab: Phase I - Punjab signed PPAs for 250 MW of solar PV projects in December of 2013 with average tariffs
ranging between ₹8.20-8.40 (~$0.1206-0.1235)/kWh. Of these, about 195 MW are commissioned and a 4 MW
project is expected to be commissioned by March 2016. There is no progress as of yet on 35 MW of projects due to
legal issues, and work has not begun on the remaining 16 MW.
Phase II – Letter of Awards (LoA) for 282 MW of projects were signed in 2015 under three categories: 1 to 4 MW (29
MW), 5 to 24 MW (100 MW) and 25 to 50 MW (100 MW). Another 53 MW of rooftop projects are also estimated to
come under this phase. Of the 282 MW, 62 MW (including 12 MW of rooftop projects) have been commissioned. The
remaining 220 MW are expected to be commissioned by the end of 2016.

©2016 Mercom Capital Group, llc. ALL RIGHTS RESERVED. I www.mercomcapital.com I [email protected] I Page 21
Mercom Capital Group
India Solar Market Update
Punjab also issued an RfP for 500 MW of projects in June of last year, of which five developers have won bids with
tariffs ranging from ₹5.09-5.98 (~$0.0749-0.0879)/kWh. PPAs were signed in December 2015 and projects are
expected to be commissioned by early 2017.
Kerala: The Agency for Non-Conventional Energy and Rural Technology (ANERT), the renewable energy agency of
Kerala, announced a tender for 12 MW of grid-connected rooftop solar projects in 2015. All of these projects have
been commissioned including two MW on government buildings.
Madhya Pradesh: To date, there are 295 MW of solar projects installed under Madhya Pradesh’s state policy (200
MW – RPO and 95 MW – Phase II). Another 25 MW of projects under Phase II are expected to be commissioned by
March 2016.
Madhya Pradesh Power Management Company (MPPMCL) announced financial bids for 300 MW in July 2015 and,
to date, PPAs have been signed for 206 MW. These projects are expected to be commissioned by late 2016 or early
2017.
Haryana: Haryana Power Purchase Centre on behalf of Uttar Haryana Bijli Vitran Nigam (UHBVN) and Dakshin
Haryana Bijli Vitran Nigam (DHBVN) invited tender for 150 MW of solar projects. The list of bidders is finalized and
PPAs are expected to be signed shortly.
Haryana Auction Results
Developer Capacity
(in MW) Category
Tariff
in ₹/kWh in ~$/kWh
Acme 140 Open 5.00 0.074
Tapas Solar 1 Open 5.00 0.074
Geeta Rani 1 Open 5.00 0.074
Deepak Goyal 1 Open 5.00 0.074
Ramphal Bhardwaj 1 Open 5.00 0.074
Jile Singh 1 Open 5.00 0.074
Urmilla Jain 1 Open 5.00 0.074
Anita Singh 1 Open 5.00 0.074
Karan Singh 1 Open 5.00 0.074
Virender Rawal 1 Open 5.00 0.074
Lintax Marketing Services 1 Open 5.00 0.074
Narender Singh 1 Open 5.00 0.074
Yogendra 1 Open 5.00 0.074
Total 152 MW
Note: Rupee-Dollar Conversions were taken as $1 = ~₹68
Source: Mercom Capital Group, llc
©2016 Mercom Capital Group, llc. ALL RIGHTS RESERVED. I www.mercomcapital.com I [email protected] I Page 22
Mercom Capital Group
India Solar Market Update
Maharashtra: The state announced a renewable energy policy in 2015, through which they expect to develop 7,500
MW of solar power by 2020. New bids are expected to be invited only after March 2016.
Chhattisgarh: Chhattisgarh State Power Distribution Company Limited (CSPDCL) announced the bid results for 100
MW of solar projects in early 2014. Of these, only 64 MW of projects have PPAs signed though all of them have been
commissioned.
Karnataka: Karnataka announced 600 MW of projects to be developed under a program for farmers and unemployed
youth. Under this program, the state allotted 258 MW of solar energy projects to farmers and signed PPAs in July
2015 for ₹8.40 (~$0.1235)/kWh. The projects are expected to be commissioned in early 2017. Another 300 MW is
expected to be announced for allotment to unemployed youth.
Under Batch 5, tenders were issued recently for 1,200 MW, and the financial bids are expected to be announced by
March 2016.
Telangana: Telangana signed PPAs for 515 MW in March 2015 through reverse bidding. Of the total 515 MW, 43
MW of projects have been commissioned and the remaining projects are expected to be commissioned in the first
half of 2016.
The Southern Power Distribution Company of Telangana (TSSPDCL) invited 2,000 MW of bids on a “build-own-
operate” basis in April 2015. After a delay due to technical issues regarding transmission, the Letters of Intent (LoI)
are expected to be issued in March 2016.
Two tenders for 150 MW each could be announced after March 2016.
Tamil Nadu: According to our sources, Tamil Nadu Generation and Distribution Corporation (Tangedco), the state
utility, has signed PPAs for 1,500 MW, of which 496 MW are commissioned. The others are scheduled to be
commissioned by March 2016, but delays are expected.
The strict deadline of March 2016 has created anxiety among stakeholders. After that date, developers will no longer
receive the attractive tariff of ₹7.01 (~$0.1031)/kWh.
Uttarakhand: The government of Uttarakhand signed PPAs in March 2015 to develop 30 MW of solar projects in a
tariff-based competitive bidding process. These projects are expected to be commissioned by April 2016.
Uttarakhand Renewable Energy Development Agency (UREDA) issued RfPs to develop 170 MW of solar projects on
October 29, 2015. The LoI for these projects were issued in November 2015 and PPAs are expected to be signed by
March 2016. These projects have 12 months until commissioning.
Jharkhand: Jharkhand Renewable Energy Development Agency (JREDA) issued a tender to develop 1,200 MW of
solar projects in December 2015. The financial bids are expected to be opened by March 2016.

©2016 Mercom Capital Group, llc. ALL RIGHTS RESERVED. I www.mercomcapital.com I [email protected] I Page 23
Mercom Capital Group
India Solar Market Update
Himachal Pradesh: The state announced its Solar Power Policy 2016, and plans to develop 700 MW of solar
projects by 2022.
Note: Dollar-Rupee conversions were calculated at $1 = ₹68
0 100 200 300 400 500 600 700 800 900 1,000 1,100 1,200 1,300 1,400
Arunachal Pradesh
Jammu & Kashmir
Tripura
Chandigarh
Uttarakhand
West Bengal
New Delhi
Goa & UT
Kerala
Jharkhand
Haryana
Odisha
Chhattisgarh
Telangana
Uttar Pradesh
Karnataka
Punjab
Andhra Pradesh
Maharashtra
Tamil Nadu
Madhya Pradesh
Gujarat
Rajasthan
Source: Mercom Capital Group, llc
Total Solar Installation
5,632 MW
India Solar Installations (MW) By Location (Feb 2016)

©2016 Mercom Capital Group, llc. ALL RIGHTS RESERVED. I www.mercomcapital.com I [email protected] I Page 24
Mercom Capital Group
India Solar Market Update
About Mercom Capital Group
Mercom Capital Group, llc, is a global communications and consulting firm focused on Cleantech, Healthcare IT and
financial communications. Mercom’s consulting division advises companies on new market entry, overall strategic
decision-making, and provides custom market research. Mercom delivers highly respected industry market
intelligence reports covering Solar Energy, Wind Energy, Smart Grid and Healthcare IT. Our reports provide timely
industry happenings and ahead-of-the-curve analysis specifically for C-level decision making. Mercom’s
communications division helps companies and financial institutions build powerful relationships with media, analysts,
local communities and strategic partners. To receive Mercom’s popular market intelligence reports,
visit: http://www.mercomcapital.com.
©2016 Mercom Capital Group, llc. ALL RIGHTS RESERVED. I www.mercomcapital.com I [email protected] I Page 25
Mercom Capital Group
India Solar Market Update
Mercom Capital Group, llc
4611 Bee Caves Road, Suite 303
Austin, Texas 78746
t | +1.512.215.4452
w | www.mercomcapital.com
Mercom Communications India, Pvt. Ltd.
A subsidiary of Mercom Capital Group, llc
S-3, Harshita Arcade
No.138, First Main Road
Sheshadripuram
Bangalore-560020
t | +91.80.2356.0436
DISCLAIMER © 2016 by Mercom Capital Group, llc. All rights reserved. Strictly no redistribution allowed without prior written
permission of Mercom Capital Group. When quoting, please cite “Mercom Capital Group, llc”. Although information in
this report has been obtained from sources that we believe to be reliable, Mercom Capital Group does not guarantee
its accuracy. Published by Mercom Capital Group, llc, 4611 Bee Cave Rd, Suite 303, Austin, TX 78746 USA.
A copy of the full Terms and Conditions that you agreed to can be found at:
http://mercomcapital.com/termsandconditions.php. For information about this document, please contact us at: