mercury-selenium interactions in the environment/67531/metadc669953/m2/1/high... ·...
TRANSCRIPT

n
BNL-62 8 1 8 INFORMAL RlIPORT
RECEIVED MAR 2 5 1996 O S T I
MERCURY-SELENIUM INTERACTIONS IN THE ENVIRONMENT
Lawrence Saroffr, Frederick W. Lipfert, and P. D. Moskowitz
W. S. Department of Energy Office of Fossil Energy Clean Coal Technology Program
February 1996
BIOMEDICAL AND ENVIRONMENTAL ASSESSMENT GROUP
ANALYTICAL SCIENCES DIVISION
DEPARTMENT OF APPLIED SCIENCE
B R O O K H A V E N N A T I O N A L L A B O R A T O R Y UPTON, LONG ISLAND, NEW Y O R K 11973

DISCLAIMER
This report was prepared as an account of work sponsored by an agency of the United States Government. Neither the United States Government nor any agency thereof, nor any of their employees, not any of their contractors, sub- contractors, or their employees, makes any warranty, express or implied, or assumes any legal liability or responsibility for the accuracy, completeness, or usefulness of any information, apparatus, product, or process disclosed, or represents that its use would not infringe privately owned rights. Reference herein to any specific commercial product, process, or service by trade name, trademark, manufacturer, or otherwise, does not necessarily constitute or imply its endorsement, recommendation, or favoring by the United States Government or any agency, contractor, or subcontractor thereof. The views and opinions of authors expressed herein do not necessarily state or reflect those of the United States Government or any agency, contractor or subcontractor thereof.

MERCURY-SELENIUM INTERACTIONS IN THE ENVIRONMENT
Lawrence SarofP, Frederick W. Lipfert, and P. D. Moskowitz
*U. S. Department of Energy Office of Fossil Energy
Clean Coal Technology Program
February 1996
BIOMEDICAL AND ENVIRONMENTAL ASSESSMENT GROUP ANALYTICAL SCIENCES DIVISION
DEPARTMENT OF APPLIED SCIENCE BROOKHAVEN NATIONAL LABORATORY
ASSOCIATED UNIVERSITIES, INC.
Under Contract No. DE-AC02-76CH00016 with the U. S. Department of Energy
If# OlSTRlBUTlON OF THIS DOCUMENT IS UNtlMlTEO

Mercury-Selenium Interactions in the Environment
Lawrence Saroff U.S. Department of Energy Office of Fossil Energy Clean Coal Technology Program . Washington, DC 20585
Frederick W. Lipfert Paul D. Moskowitz Department of Applied Science Brookhaven National Laboratory Upton, NY 11973
INTRODUCTION
The Clean Air Act Amendments of 1990 (CAAA, 1990) require the U.S. Environmental Protection Agency (EPA) to consider the need to control emissions of trace elements and compounds emitted from coal combustion, including coal-fired power plants. Concern has been expressed about emissions of mercury and arsenic, for example, since health effects may be associated with exposure to some of these compounds (EPRI, 1994). By and large, effects of trace element emissions have been considered individually, without regard for possible interactions. To the extent that the relevant environmental pathways and health endpoints differ, this mode of analysis is appropriate. For example, arsenic is considered a carcinogen and mercury affects the brain. However, there may be compelling reasons to consider emissions of mercury (Hg) and selenium (Se) together:
Both Se and Hg are emitted from power plants primarily as vapors. Hg and Se are both found in fish, which is the primary pathway for Hg health effects. Se has been shown to suppress Hg methylation in aqueous systems, which is a necessary step for Hg health effects at current environmental concentrations. Se is a trace element that is essential for health but that can also be toxic at high concentrations; i t can thus have both beneficial and adverse health effects, depending on the dosage.
This paper reviews some of the salient characteristics and interactions of the Hg-Se system, to consider the hypothesis that the effects of emissions of these compounds should be considered jointly.
HEALTH EFFECTS OF MERCURY
The adverse health effects of mercury have been known or suspected since antiquity, and have been thoroughly explored (EPA, 1995). Although both inorganic and organic forms of Hg can have effects on the central nervous system (CNS), methylmercury (MeHg) comprises the current primary focus of concern, since MeHg can easily pass the blood-brain barrier and into the placenta. The latter property gives rise to concerns about congenital' health effects, since the brain of a developing fetus is much more sensitive to MeHg than that of an adult (Clarkson et al., 1994). A probabilistic risk assessment of MeHg from coal combustion found congenital effects to be about an order of magnitude more sensitive than effects on adults, although the absolute levels of risk were small in both cases (Lipfert et al., in press).
The primary environmental pathway of concern for Hg is through consumption of fish containing MeHg. Perhaps the best known cases of MeHg poisoning occurred in the 1950s in Minamata and Niigata, Japan. The fish contamination occurred there from direct industrial discharges of Hg into the water. The pathway involves MeHg bioconcentration along the aquatic food chain, from plankton up to predatory game fish. Direct industrial discharges of Hg have since been eliminated in the developed world, but the same qualitative process occurs in water bodies remote from direct industrial discharges through atmospheric deposition of Hg compounds. It has been estimated that the global background concentration of atmospheric Hg has increased by about a factor of 3 since pre-industrial times (Fitzgerald, 1995), resulting in
higher MeHg levels in large predatory fish. As a result, warnings have been issued to pregnant females to restrict their fish consumption. Because many health benefits have been attributed to eating fish, it is important to carefully quantify any health risks due to MeHg, especially because there are specific populations that rely on fish as their main source of protein.
Quantification of such risks requires knowledge of MeHg intake levels, the fate of MeHg in the body as a function of intake rate, and the risk of specific adverse health effects as a function of metabolic levels in the body. The equilibrium body burden of MeHg may be the best such indicator for steady rates of intake, but detailed data for epidemiological analysis are scarce. One of the main data sources has been a poisoning incident in Iraq (Bakir et al., 1973) involving consumption of bread baked from seed grain that had been treated with organic mercury fungicide. The dose-response functions that were developed from this incident have formed the basis of most of the fish consumption advisories that have since been promulgated.
A more appropriate source of data on health risks would be from at least reasonably steady consumption of fish containing known amounts of MeHg, rather than transient from consumption of contaminated grain. Several fish-eating populations have been studied with this goal in mind (Kjellstrom et al., 1986, 1989; McKeown-Eyssen et al., 1983; Marsh et al., 1995), but the resulting information on safe MeHg intake levels or on the implied risks has largely been equivocal. In one of the recent publications on fetal effects of MeHg, Marsh et al. (1995) speculated that the protective effect of Se in fish may be responsible ,for the perceived discrepancies between epidemiological studies based on fish and the Iraqi study that was based on contaminated grain. Since the underlying toxicity of MeHg (at sufficiently high dose levels) has been well established through various toxicological studies, the explanation of these equivocal studies must lie with the epidemiology, per se. Possible hypotheses include:
0 uncertain measures of intake 0 0 uncertain measures of response 0 0
insufficient statistical power (sample size)
uncontrolled confounding or intervening variables in the study response thresholds higher than previously thought.
Candidates for confounding or intervening variables include co-contaminants in fish, which could include lead, PCBs, other trace organics, or Se. This paper will consider the evidence for Se as an important co-contaminant in fish that could possibly ameliorate some of the adverse effects of MeHg.
HEALTH EFFECTS OF SELENIUM
The health effects of Se are less well-defined than those of Hg but have been discussed in detail by WHO (1987) and the ATSDR (1994a). Se toxicology has been studied in animals, but human health effects are based mainly on geographic differences in disease prevalence among areas naturally high or low in soil Se. Figure 1 is a map (due to Kubota and Allaway, 1972) showing high and low Se areas in the United States, for example. Beneficial effects of Se have been inferred by comparing the geographic prevalence of chronic diseases such as cancer and heart disease with the Se patterns. Because many of these diseases are more prevalent in the Eastern U.S. where Se levels tend to be low, epidemiological associations have been inferred (Shamberger and Willis, 197 1). There are also data available on human toxicological responses to high air concentrations of Se dust from manufacturing processes, which are not at issue here.
Environmental Pathways for Selenium
Se concentrations in air and drinking water are typically low, and the most important pathway for Se intake is through ingestion (WHO, 1987). However, there can be a wide range in dietary Se intake, from 11 to 5000 ug/d, as a result of the large differences in soil Se concentrations that exist throughout the world. Typical Se dietary intake levels range from
20-300 ug/d, and cereals and grains are an important source of dietary Se. Differences in soil Se can lead to differences in the Se content of forage crops that can also affect the nutritional needs of livestock. Among the foods examined (in Italy) by Rossi et al. (1976), the highest Se concentrations were found in freshwater fish, from 0.2-0.3 ppm. Although the Hg contents of these fish were usually higher than the Se contents, the estimated total urban dietary intakes were less than 15 ug/d for Hg and 32 ug/d for Se. ATSDR (1994a) estimates dietary intake of Se in the U.S. population to range from 20 ug/d for infants to 120 ug/d for adults. The recommended daily allowance of Se on a body mass basis is 0.87 ug/kg/d.
Effects of Selenium Deficiency
Animals raised in low Se areas may exhibit adverse effects that can be mitigated with dietary supplements. Animal studies form the basis of some of the anticipated health effects on humans. With respect to humans, Keshan disease (named for a low Se county in China) is a form of endemic cardiomyopathy; studies there showed a beneficial effect from administering sodium selenite supplements (WHO, 1987). Salonen (1987) reviewed the role of Se in ischemic heart disease (IHD) and concluded that the evidence for a protective role was "suggestive", at best. The critical intake level for Se deficiency is 20 ug/d (NAPAP, 1990). WHO (1987) also reported that 'dietary Se can protect against the toxicity of several heavy metals, such as mercury or cadmium, .... but the mechanism of these protective effects is not.known."
Various beneficial effects have been attributed to dietary selenium, hence its availability as a health food supplement along with other anti-oxidant substances such as beta-carotene. These benefits include reduced rates of cancer and heart disease (Jackson, 1988) and 'inconsistent evidence" of protection against asthma (Burney, 1995). However, many of the early studies ascribing health benefits to selenium were cross-sectional "ecological" studies that are known to be beset by problems with confounding variables (Lipfert, 1994).
Toxicity of Selenium
Effects of selenium toxicity in animals (from consuming plants that accumulate high levels of Se) include the "blind staggers", in which the animals have impaired vision, poor appetite and the tendency to wander about in circles (NAPAP, 1990). Effects in humans have included dental problems, skin discoloration and eruptions, and diseased finger and toe nails. The recommended safe maximum dietary Se intake level for humans is 200 ug/d. Typical dietary Se supplement dosages are 40-50 ug/d. Se concentrations in marine fish tend to be less than about 0.7 ug/g, so that consuming a 200 g fish meal daily would still be within the maximum recommended Se intake level.
Hypothetical Dose-Response Functions for Selenium
While dose-response functions for MeHg are often derived as "hockey-sticks", with a threshold above which health risks become more certain, such functions for Se would likely be U-shaped with an inflection point somewhere between 20 and 200 ug/d. For intake levels below this point, Se would be deemed beneficial. For intake levels above this point, some adverse health risks might be anticipated. One might expect that benefits or risks in the intermediate intake region will vary by individual and be poorly defined in general.
EMISSIONS AND PHYSICAL PROPERTIES OF H g AND Se FROM COAL COMBUSTION
Source Characteristics
Mercury is emitted from combustion processes mainly in the vapor phase, either as elemental Hg (Hg') or as divalent Hg (Hg'+), such as HgCI,. Since the divalent form is soluble and reactive, it tends to deposit relatively near the source, while Hgo is slowly oxidized, some
fraction of which may be particulate. Also, Hgo may be re-emitted from the surface, thus constituting a regional or global pollutant. The background concentration of airborne Hg in the northern hemisphere is about 2-4 ng/ms, with urban values somewhat higher.
According to EPRI (1994), Se in hot stack gases is in the form of SeO,, which is an acidic compound that sublimes at about 350OC. It thus likely condenses and binds to small fly ash particles, either in the stack or in the plume (Ondov et al., 1989). Se in background aerosols is used in the eastern United States as a marker for coal combustion, where it is found primarily in the fine particle fraction. However, Ondov et al. showed that the larger particles in a coal-fired power plant plume will deposit preferentially closer to the plant because of their higher gravitational settling rates; some of these will be coated with Se, so that local Se particle sizes and deposition rates could be substantially higher than those found in the background aerosol, even though they emanated from the same source.
As shown in Figure 2, the Hg and Se contents of bituminous coal are roughly proportional, based on data obtained from a literature survey (personal communication, EPRI, 1994). Subsequent data for actual Hg emissions using better analytical techniques were substantially lower. It appears that Se emissions tend to exceed Hg emissions by at least an order of magnitude; a linear regression of these data estimated a Se/Hg emissions ratio of 13 with a correlation coefficient of 0.44.
Coleman et al. (1993) reported somewhat lower Se contents in U.S. coals than the PISCES data from the literature, with a median of 1.7 ppm. The highest Se content coals were found in the eastern half of the country, especially in the South Central states. Most of the Se in coal is in organic form, but mineral forms are also found, including HgSe (tiemannite). Note that there seems to be no relationship between the geographic distribution of Se in coals, as described by Coleman et al., and that in soils (Figure 1). This suggests that Se deposition from coal burning has had little impact on soil Se content.
Chiou and Manuel (1985) collected aerosol samples over a 13-month period near a small coal-fired power plant, as well as coal and ash samples. The mean ambient Se concentration was 3.6 ng/ms and the measurements correlated very well with ambient sulfur content, with a near-zero intercept. The Se enrichment factor relative to soil was 2180. About 80% of the Se particles were in the fine size mode (< 2 um).
Ondov et al. (1989) performed a mass balance on Se for a 760 MWe coal-fired power plant in the Western U.S. They estimated a stack emission rate of 0.062 g/s with about 0.070 g/s being captured as fly and bottom ash. This emission rate would correspond to a peak annual concentration of about 0.04 ng/ms as particulate with perhaps a like amount as Se vapor.
It may be concluded from these various measurements'that atmospheric deposition of Hg from coal-fired power plant is likely to be accompanied by similar or larger amounts of atmospheric Se deposition. Both species may exhibit higher deposition rates closer to the plant.
Background and Urban Aerosol Characteristics
Measurements of trace elements in the atmosphere have been made for many years, usually based on analysis of suspended particles; low levels of trace gases may be more difficult to quantify accurately. Brimblecomb (1986) suggests that there may be both organic and inorganic forms of Se present in either phase. A useful way to place the typically low ambient concentrations of trace elements into context is to compare the aerosol composition to that of soils and rocks. Elements that are relatively more abundant in the aerosol are said to be "enriched" as quantified by an enrichment factor, and this usually suggests anthropogenic sources other than soil erosion.
Rahn (1976) presented a useful compendium of data on trace constituents in atmospheric aerosols. He reported an enrichment factor of 2000 for Se (indicating that air concentrations of Se tend to be about 2000 times as high as the relative abundance in geologic crustal material), which was one of the highest reported and clearly suggests anthropogenic influences. He reported a geometric mean mass median particle diameter (MMD) of 0.8 um (standard deviation = 0.6 urn based on 14 determinations), which in turn suggests a deposition velocity of about 0.2

cm/s (Sehmel, 1980). Of the 14 determinations of MMD for Se, only one was greater than 1 um, and this value was obtained in the highly industrial location of East Chicago, IN. Rahn also reported a median MMD value of 0.6 um for particulate Hg, based on 4 determinations. His estimated enrichment factor for particulate Hg was 780.
More recent air concentration data were reported by Dutkiewicz and Husain (1988), who showed that nonurban Se in the U.S. seem to peak at about 3 ng/m3 near Pittsburgh, falling off linearly to about 0.5 ng/ms at distances of 1000 km. According to EPRI data (1994), Pittsburgh may be near the center of the region in which the highest Se-content coals are found. Spengler and Thurston (1983) reported long-term average Se levels in 6 U.S. cities ranging from about 0.42 to 0.68 ng/ms, with one-third to one-half of the total in the coarse particle fraction.
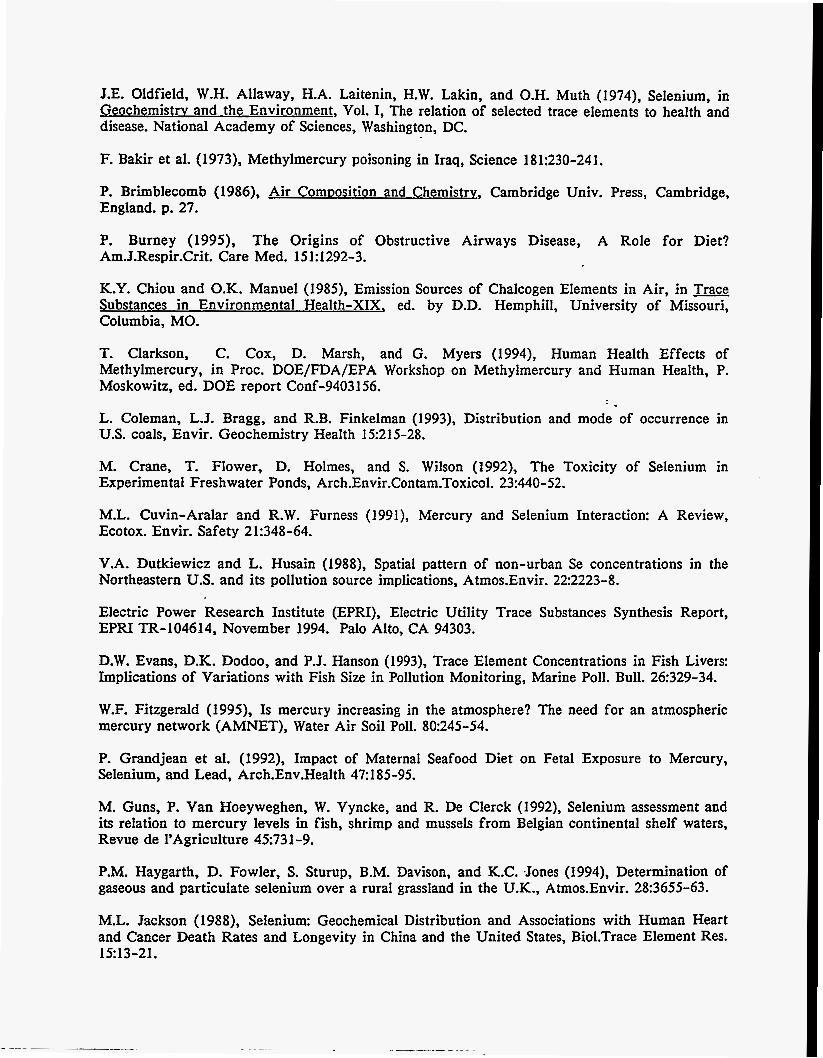
In Figure 3, the atmospheric aerosol concentration data presented by Rahn (1976) for Hg and Se are compared; most of these data were obtained prior to the major environmental cleanup campaigns of the 1970s and thus current concentrations are likely to be lower. Hg and Se show an approximately 1:l relationship in the ambient aerosol; however, if vapor phase Hg and Se were included, the Hg/Se ratio would likely be substantially higher. Given the much higher Se emissions from coal burning, the ambient data suggest either additional sources of atmospheric Hg (such as incinerators and re-emission) or else faster deposition of the Se. Note the very large range in ambient concentrations in Figure 3; the Se values in excess of about 1 ng/ms were all obtained in urban or industrial areas. The Se values less than 0.1 ng/ms were obtained in extremely remote background locations. Most of the particulate Hg data are grouped between 0.5 and 3 ng/m3; the two high values comprise a I-day "snapshot" in Chicago and some winter data from Paris and thus may not be representative of long-term averages in the United States. In Figure 4 (from Rahn, 1976), enrichment factors in coal are plotted against urban enrichment factors; note that Se has the highest enrichment in coal, but that Pb is the element most enriched in urban air (presumably because of input from vehicles). Rahn points out that coal combustion (at that time) controlled the relative composition of the urban aerosol, with certain exceptions such as Pb, V, Br, and Na. He also pointed out that iodine and selenium are depleted in urban aerosol compared to what would be expected from coal composition. One explanation is retention in the coal fly ash; EPRI (1994) estimates that about half of the coal Se is so retained.
Pierson et al. (1989) measured ambient values of 2.2 and 2.5 ng/ms for particulate Se at two rural sites in Pennsylvania. At both sites, Se was highly correlated with SO,, total particulate mass, aerosol acidity, and elemental carbon, suggesting that it is part of the "signature" of a polluted air mass. They identified Se as a "candidate marker for coal burning." They also estimated that about 90% of the Se was in the fine particle size fraction ( < 2.5 um).
More recent measurements of ambient Se include those of Haygarth et al. (1994), who measured both gaseous and particulate forms at a rural site in northwest England. They estimated that 20-50% of the Se was gaseous and noted that Se (like Hg) is volatilized from soils, plants, fresh and marine waters and sediments after methylation. They estimated dry deposition of about 2 ug/m2/y as particulate Se, with wet deposition perhaps two orders of magnitude greater. Their estimate of the dry deposition velocity of particulate Se (0.07 mm/s) is much smaller than our estimates based solely on particle size and those of Wu et al. (1994). Thus, larger values for dry deposition may be appropriate.
Wu et al. (1994) reported estimates of wet and dry deposition of background Se as 214 and 130-360 ug/m2/y, respectively. For comparison, background total deposition of atmospheric Hg has been estimated at around 10 ug/m2/y (Lipfert et al. 1994). It thus appears that background deposition rates of Se are also higher than those for Hg, although very little is known about wet deposition of Se.
Concentrations in Sea and Surface Waters
ATSDR (1994a) reports an average marine concentration for Se of 0.09 ug/L and that the highest value found in a subset of the EPA data base on major watersheds was 12 ug/L, with only 3.3% exceeding 1 ug/L. However, surface waters affected by agricultural run-off

may be considerably higher and can reach levels toxic to wildlife. Mercury concentrations in sea water tend to be lower than Se; ATSDR (1994b) cites a figure of < 0.002 ug/L, with slightly higher values for precipitation and freshwaters.
MERCURY-SELENIUM INTERACTIONS
A general review of Hg-Se interactions was presented by Cuvin- Aralar and Furness (1991), including possible mechanisms for the apparent protective effect of Se and the synergism between the two elements. There are interactions between methylated selenium and mercury and between selenium and methylmercury. Almost all of this information is based on manipulated experiments, in contrast to comparisons among differing natural environments.
.
Hg-Se Relationships in Fish
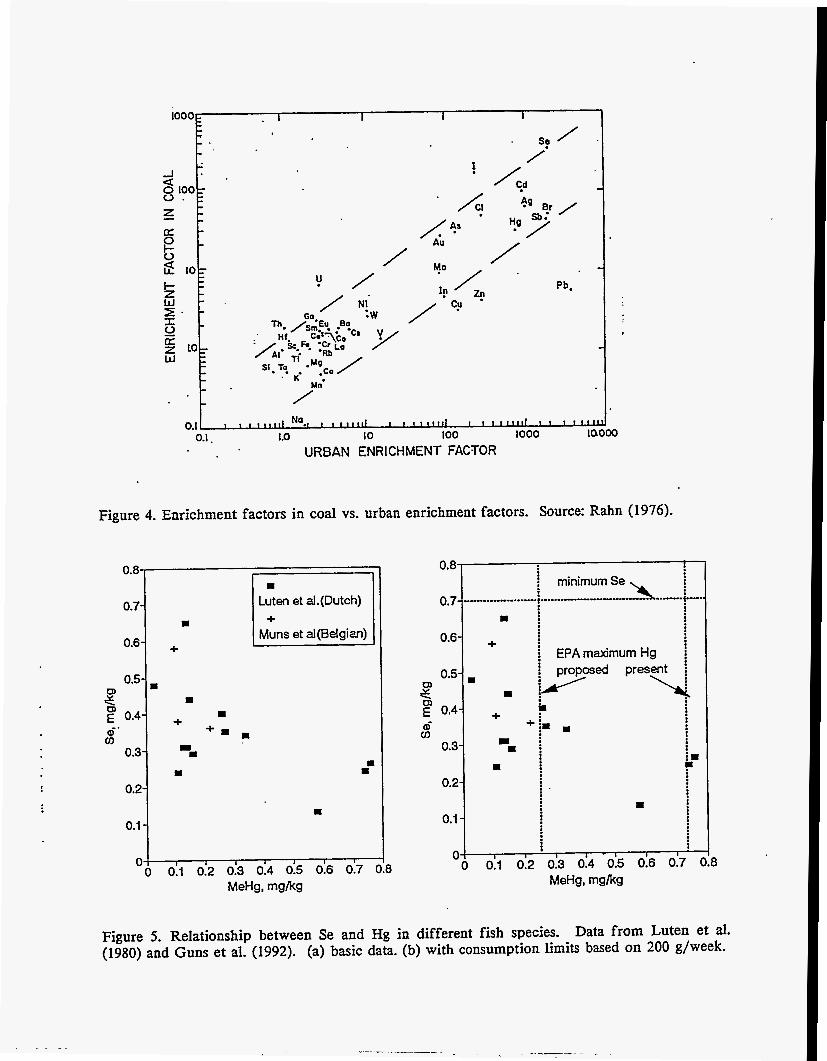
Compared to the amounts of data on Hg content, data on the Se content of fish are relatively sparse. Southworth et al. (1994) reported Se and Hg concentrations of 0.71 and 0.93 ug/g in largemouth bass in natural waters in Tennessee. Data by fish size for cod and flounder show almost no relationship; Hg increases directly with fish size while Se is relatively constant for flounder and increases only slightly for cod (Guns et al., 1992). The European data shown in Figure 5 support a weak negative relationship between Hg and Se, by species. The three high Hg data points on Figure 5(a) are for fresh-water species; no information was available on the Se content of the relevant waters. The dashed lines on Figure 5(b) indicate the concentration limits that would result from assuming intake based on a single 200 g fish meal per week. The "minimum Se" line is based on the recommended minimum dietary intake of Se of 20 ug/d. There are two "maximum" limits for Hg, based on EPA reference doses (RfDs), assuming a 70 kg person. The higher one is based on the existing reference dose of 0.3 ug/kg/d; the lower one is based on a recently proposed level of 0.1 ug/kg/d. Note that there are many other dietary sources of Se besides fish, but not of MeHg. Also, the EPA RfD.for MeHg is directed at pregnant females.
Figure 5 suggests that most marine species may be consumed more often than weekly without exceeding the existing EPA Hg limit (the proposed new RfD level would be considerably more restrictive), and that the concomitant additional Se would likely be in the "beneficial" range (Le., < 200 ug/d). Additional Se in freshwater species would also likely be beneficial; the extent to which additional Hg might be harmful depends on the pregnancy status of the consumer. The EPA limit is based on preventing congenital effects; otherwise, perhaps an order of magnitude more can safely be consumed.
Other data on Hg and Se fish contents show very high Se levels in Belgian blue mussels (2.2-2.9 ppm, Guns et al., 1992) and approximately 1:1 Hg/Se ratios in the livers of marine mammals (Skaare et al., 1994). Grandjean et al. (1992) found high MeHg levels in pilot whale consumed by Faroe Islanders (about 1.7 ug/g as MeHg) with approximately equimolar concentrations of Se (0.67 ug/g). However, the correlation between Hg and Se in the umbilical cord blood of the population studied by Grandjean et al. was only 0.35; Se levels were an order of magnitude higher than Hg. When stratified by fish consumption rate, however, the incremental changes in cord blood Hg and Se were about the same.
Manipulated Interaction Experiments
A more direct test of this hypothesis was reported by Southworth et al. (1994), in that the Hg content of largemouth bass in a quarry pond increased from 0.02 ppm to 0.17 ppm (adjusted for fish size) when dumping of slurried fly-ash containing Se was terminated. The Se content of the water decreased from 25 ug/L to less than 2 ug/L during this 3-y period of transition, but the Se content in the fish only decreased from 3 to 2.2 ppm. A Se concentration of 25 ug/L was found to be toxic to perch in experimental freshwater ponds by Crane et al. (1992), but that 10 ug/L was apparently safe.

Turner and Swick (1983) reported that pike fed food with elevated Se showed decreased body burdens of Hg. Paulsson and Lundbergh (1991) reported the results of Se treatment of 11 Swedish lakes, in which Hg concentrations in perch were reduced from a range of 0.04-0.29 ug/g before treatment to a range of 0.02-0.07 ug/g after 1-2 years of treatment. The lakes were also limed to control pH and sodium selenite was added to achieve Se concentrations of 3 to 5 ug/L in the lake water. The Hg reduction in pike was somewhat less, 28% after 2 years. The authors also concluded that a lower target Se concentration would be more effective. Lindqvist (1991) noted that the Se concentrations in water should not exceed 1-2 ug/L and the fish Se content should be kept below 2-3 ug/g.
CONCLUDING DISCUSSION
This paper poses the hypothesis that the environmental effects of atmospheric deposition of Hg from coal combustion should be considered jointly with the effects of Se deposition, rather than in isolation. Both elements are mainly in the gaseous state in furnace gases, and they may exhibit similar near-field deposition patterns. Local deposition of Hg may be limited to the reactive fraction (Hg"), which is highly soluble. Local deposition of Se may be limited to the largest fly-ash particles that become coated with vapor phase Se, the relative abundance of which will depend on the degree and type of particulate control equipment in place. The degree of emissions control achieved for Hg and Se will vary with the types of-devices used.
The ultimate fates of deposited Hg and Se depend on the nature of the receptor and the solubility of the deposits. To the extent that these deposits enter fish-producing waters, the Hg and Se contents of the fish will be affected as will the dietary intakes of people who eat these fish. Se not only can have its own dietary health benefits, it can also act to suppress the methylation of Hg and the Hg content of freshwater fish. Thus, at current environmental levels, there may be health benefits associated with Se deposition.
The health effects of Hg are uniformly adverse, but the normal cellular defenses act to produce effective thresholds below which adverse effects may be discounted. The effects of Se on human health may be either beneficial or adverse, depending on the individual and his total dietary Se intake from all sources. The available data suggest that the Se intakes of most people are below the levels at which adverse effects might be expected. The "normal" concentrations of Se and Hg in fish tend to be inversely related, such that consuming low-Hg fish will add more Se to the diet, well within the maximum recommended Se intake. Freshwater fish that are high in Hg tend to be low in Se, such that additional Se from the atmosphere could pose a benefit. The degree to which additional Hg would be harmful depends on the rate of consumption and the pregnancy status of the consumer.
It is thus possible that the simultaneous presence of Se along with Hg in power plant plumes offers a degree of health benefit that could outweigh at least part of the perception of risk at low levels of Hg intake. Future assessments of proposed environmental control scenarios should thus consider the combined net effects of changes in all the species emitted.
ACKNOWLEDGMENT
This research was sponsored by the U.S. Department of Energy, but the opinions expressed are those of the authors and no official endorsement should be inferred.
REFERENCES
Agency for Toxic Substances and Disease Registry (ATSDR), Toxicological Profile for Selenium (draft), U.S. Dept. of Health and Human Services, Atlanta, GA. August 1994.
Agency for Toxic Substances and Disease Registry (ATSDR), Toxicological Profile for Selenium (update), U.S. Dept. of Health and Human Services, Atlanta, GA. May 1994.
J.E. Oldfield, W.H. Allaway, H.A. Laitenin, H.W. Lakin, and O.H. Muth (1974), Selenium, in Geochemistrv and the Environment, Vol. I, The relation of selected trace elements to health and disease. National Academy of Sciences, Washington, DC.
F. Bakir et al. (1973), Methylmercury poisoning in Iraq, Science 181:230-241.
P. Brimblecomb (1 986), Air ComDosition and Chemistry, Cambridge Univ. Press, Cambridge, England. p. 27.
P. Burney (1995), The Origins of Obstructive Airways Disease, A Role for Diet? Am.J.Respir.Crit. Care Med. 151:1292-3.
K.Y. Chiou and O.K. Manuel (1985), Emission Sources of Chalcogen Elements in Air, in Trace Substances in Environmental Health-XIX, ed. by D.D. Hemphill, University of Missouri, Columbia, MO.
T. Clarkson, C. Cox, D. Marsh, and G. Myers (1994), Human Health Effects of Methylmercury, in Proc. DOE/FDA/EPA Workshop on Methylmercury and Human Health, P. Moskowitz, ed. DOE report Conf-9403156.
L. Coleman, L.J. Bragg, and R.B. Finkelman (1993), Distribution and mode of occurrence in U.S. coals, Envir. Geochemistry Health 15:215-28.
M. Crane, T. Flower, D. Holmes, and S. Wilson (1992), The Toxicity of Selenium in Experimental Freshwater Ponds, Arch.Envir.Contam.Toxico1. 23:440-52.
M.L. Cuvin-Aralar and R.W. Furness (1991), Mercury and Selenium Interaction: A Review, Ecotox. Envir. Safety 21:348-64.
V.A. Dutkiewicz and L. Husain (1988), Spatial pattern of non-urban Se concentrations in the Northeastern U.S. and its pollution source implications, Atmos.Envir. 22:2223-8.
Electric Power Research Institute (EPRI), Electric Utility Trace Substances Synthesis Report, EPRI TR-104614, November 1994. Palo Alto, CA 94303.
D.W. Evans, D.K. Dodoo, and P.J. Hanson (1993), Trace Element Concentrations in Fish Livers: Implications of Variations with Fish Size in Pollution Monitoring, Marine Poll. Bull. 26:329-34.
W.F. Fitzgerald (1995), Is mercury increasing in the atmosphere? The need for an atmospheric mercury network (AMNET), Water Air Soil Poll. 80245-54.
P. Grandjean et al. (1992), Impact of Maternal Seafood Diet on Fetal Exposure to Mercury, Selenium, and Lead, Arch.Env.Health 47: 185-95.
M. Guns, P. Van Hoeyweghen, W. Vyncke, and R. De Clerck (1992), Selenium assessment and its relation to mercury levels in fish, shrimp and mussels from Belgian continental shelf waters, Revue de 1’Agriculture 45:73 1-9.
P.M. Haygarth, D. Fowler, S. Sturup, B.M. Davison, and K.C. .Jones (1994), Determination of gaseous and particulate selenium over a rural grassland in the U.K., Atmos.Envir. 28:3655-63.
M.L. Jackson (1988), Selenium: Geochemical Distribution and Associations with Human Heart and Cancer Death Rates and Longevity in China and the United States, BioLTrace Element Res. 1513-21.

I
T. Kjellstrom, P. Kennedy, S. Wallis, and C. Mantell (1986), Physical and Mental Development of Children with Prenatal Exposure to Mercury from Fish. Stage 1: Preliminary Tests at Age 4. Report 3080, National Swedish Environmental Protection Board, Solna, Sweden.
T. Kjellstrom, P. Kennedy, S. Wallis, A. Stewart, L. Friburg, B. Lind, T. Wutherspoon, and C. Mantell (1989), Physical and Mental Development of Children with Prenatal Exposure to Mercury from Fish. Report 3642, National Swedish Environmental Protection Board, Solna, Sweden.
Stage 2 Interviews and Psychological Tests at Age 6.
J. Kubota and W.H. Allaway (1972), Geographic Distribution of Trace Elements, in Micronutrients in Agriculture, Soil Science Society of America, Madison, WI. p. 542.
0. Lindqvist (1991), Mercurv in the Swedish Environment, Water Air Soil Poll. 55:214.
F.W. Lipfert, Air PoIIution and Communitv Health, Van Nostrand Reinhold, New York (1994).
F.W. Lipfert, P.D. Moskowitz, V.M. Fthenakis, M.P. DePhillips, J. Viren, and L. Saroff, Assessment of Mercury Health Risks to Adults from Coal Combustion, BNL-60435, Brookhaven National Laboratory, Upton, NY. May 1994.
F.W. Lipfert, P.D. Moskowitz, V. Fthenakis, M. DePhillips, and L. Saroff (1996), Probabilistic Assessment of Health Risks of Methylmercury from Burning Coal, NeuroToxicology 17 (in press).
J.B. Luten, A. Ruiter, T.M. Ritskes, A.B. Rauchbar, and G. Riekel-Booy (1980), Mercury and selenium in marine and freshwater fish, J.Food Sci. 42416-9.
D.O. Marsh, M.D. Turner, J.C. Smith, P. Allen, and N. Richdale (1995), Fetal methylmercury Study in a Peruvian Fish-Eating Population, NeuroToxicology 16:7 18-24.
G.E. McKeown-Eyssen, 3. Ruedt, and A. Neims (1983), Methyl Mercury Exposure in Northern Quebec II. Neurologic Findings in Children, Am.J. Epidem. 118:470-9.
National Acid Precipitation Assessment Program (NAPAP), State-of-Science Report 23, Indirect Health Effects, p. 23-117, 1990.
J.M. Ondov et al. (1989), Atmospheric behavior of trace elements on particles emitted from a coal-fired power plant, Atmos.Envir. 2321 93-2204.
K. Paulsson and K. Lundbergh (1991), Treatment of Mercury Contaminated Fish by Selenium Addition, Water Air Soil Poll. 56833-41.
W.R. Pierson et al. (1989), Atmospheric acidity measurements on Allegheny Mountain and the origins of ambient acidity in the Northeastern United States, Atmos.Envir. 2343 1-59.
K.A. Rahn (1976), The Chemical Composition of the Atmospheric Aerosol, Graduate School of Oceanography, Univ. of Rhode Island, Kingston, RI 02881.
L.C. Rossi, G.F. Clemente, and G. Santaroni (1976), Mercury and Selenium Distribution in a Defined Area and in Its Population, Arch.Env.Health 22160-5.
J.K. Salonen (1 987), Selenium in Ischemic Heart Disease, 1nt.J.Epidem. 16 (Suppl.):323-8.

G.A. Sehmel (1980), Particle and Gas Dry Depositioa. A Review, Atmos.Envir. 14983-101 1.
R.J. Shamberger and C.E. Willis (197 l), Selenium Distribution and Human Cancer Mortality CRC Crit.Rev.CIin.Lab.Sci. June 197 1 , pp. 2 1 1-221.
J.U. Skaare, E. Degre, P.E. Aspholm, and K.I. Ugland (1994), Mercury and selenium in Arctic and coastal seals off the coast of Norway, Envir.Pol1. 85:153-60.
G.R. Southworth, M.J. Peterson, and R.R. Turner (1994), Changes in concentrations of selenium and mercury in largemouth bass following elimination of fly ash discharge to a quarry, Chemosphere 29:7 1-9.
J.D. Spengler and G.D. Thurston (1983), Mass and Elemental Composition of Fine and Coarse Particles in Six U.S. Cities, J.APCA 33:1162-71.
U.S. Environmental Protection Agency (EPA), Mercury Study Report to Congress (review draft., Jan. 1995), EPA/600/P-94/002AbY Office of Research and Development, Washington, DC 20460
World Health Organization (WHO), Selenium, Environmental Health Criteria 58, Geneva, 1987. 306 pp.
Z.Y. Wu, M. Han, Z.C. Lin, and J.M. Ondov (1994), Chesapeake Bay Atmospheric Deposition Study, Year 1: Sources and Dry Deposition of Selected Elements in Aerosol Particles, Atmos. Envir. 28:1471-86.
m. Low- approximately 80% of all forage and grain contain 40.05 ppm of selenium.
a Variable - approximately 50% contains >0.1 ppm.
0 Adequate - 80% of all forages and grain conlain >0.1 ppm of relenlum. . *
Local a r m s where selenium accumulator plants cantoin 750 ppm.
Figure 1. Map showing high and low selenium areas in the United States. Source: Oldfield et al., 1974.

3
n 6 I
1 . / I I
I I
1 I 1 1 1 1 1 1 1 I I I I 1 1 1
1 10 0.01 I’ I 8 I I 5 1 1 ”
0.1
Figure 2. Hg and Se concentrations in bituminous coal.
/ 100
0, I
I
10
Se concentration, ng/m3
Figure 3. Atmospheric aerosol concentrations of Se and Hg. Data source: Rahn (1976).
i
. AI Au
0.8
0.7-
0.6-
0.5- z ul E 0.4- 6 (I)
0.3-
0.2-
0.1
'? / z? / cy
I i i minimumSe
-._.__._._....._. ; : ._....- --_.-..--.-. ...-- 4.- ' r . i
I : i : i
i i EPAmaximumHg i I present i
c i I i
i = i I i
i I' I : :
I
I : i - :
i
: 8 .
/ .
/
Pb.
0.7-
0.6-
/
Luten et al.(Dutch)
Muns et al(Belgian) I
+
I 1 I I I l l 1 1 Na.l I 8 1 1 1 1 1 1 I I 1 1 1 1 1 1 1 I I I 1 1 1 1 1 1 I I 1 ' 1 1 1 0.1 . I .o 10 100 1000 10000 0.1
URBAN ENRICHMENT FACTOR
Figure 4. Enrichment factors in coal vs. urban enrichment factors. Source: Rahn (1976).
0.5- s E 0.4- 6. cn
0.3-
0.2-
0.1 -
0
I I
I + + = I I I
I I
I
1 I I I 1 1 0
3
: i I I 1 - 1 I I
+
I
+ I I
I
+
Figure 5. Relationship between Se and Hg in different fish species. Data from Luten et al. (1980) and Guns et al. (1992). (a) basic data. (b) with consumption limits based on 200 g/week.