mercury systems fy20 investor day presentation
TRANSCRIPT
© 2019 Mercury Systems, Inc.
Mercury SystemsFY20 Investor Day Presentation
December 3, 2019
Nasdaq MarketSite
New York, NY

2© 2019 Mercury Systems, Inc.
Forward-looking safe harbor statement
This presentation contains certain forward-looking statements, as that term is defined in the Private Securities Litigation Reform Act of 1995, including those relating to fiscal 2020 business performance and beyond and the Company’s plans for growth and improvement in profitability and cash flow. You can identify these statements by the use of the words “may,” “will,” “could,” “should,” “would,” “plans,” “expects,” “anticipates,” “continue,” “estimate,” “project,” “intend,” “likely,” “forecast,” “probable,” “potential,” and similar expressions. These forward-looking statements involve risks and uncertainties that could cause actual results to differ materially from those projected or anticipated. Such risks and uncertainties include, but are not limited to, continued funding of defense programs, the timing and amounts of such funding, general economic and business conditions, including unforeseen weakness in the Company’s markets, effects of any U.S. Federal government shutdown or extended continuing resolution, effects of continued geopolitical unrest and regional conflicts, competition, changes in technology and methods of marketing, delays in completing engineering and manufacturing programs, changes in customer order patterns, changes in product mix, continued success in technological advances and delivering technological innovations, changes in, or in the U.S. Government’s interpretation of, federal export control or procurement rules and regulations, market acceptance of the Company's products, shortages in components, production delays orunanticipated expenses due to performance quality issues with outsourced components, inability to fully realize the expected benefits from acquisitions and restructurings, or delays in realizing such benefits, challenges in integrating acquired businesses and achieving anticipated synergies, increases in interest rates, changes to cyber-security regulations and requirements, changes in tax rates or tax regulations, changes to interest rate swaps or other cash flow hedging arrangements, changes to generally accepted accountingprinciples, difficulties in retaining key employees and customers, unanticipated costs under fixed-price service and system integration engagements, and various other factors beyond our control. These risks and uncertainties also include such additional risk factors as are discussed in the Company's filings with the U.S. Securities and Exchange Commission, including its Annual Report on Form 10-K for the fiscal year ended June 30, 2019. The Company cautions readers not to place undue reliance upon any such forward-looking statements, which speak only as of the date made. The Company undertakes no obligation to update any forward-looking statement to reflect events or circumstances after the date on which such statement is made.
Use of Non-GAAP (Generally Accepted Accounting Principles) Financial MeasuresIn addition to reporting financial results in accordance with generally accepted accounting principles, or GAAP, the Company provides adjusted EBITDA, adjusted income, adjusted EPS, free cash flow, organic revenue and acquired revenue which are non-GAAP financial measures. Adjusted EBITDA, adjusted income, and adjusted EPS exclude certain non-cash and other specified charges. The Company believes these non-GAAP financial measures are useful to help investors better understand its past financial performance and prospects for the future. However, these non-GAAP measures should not be considered in isolation or as a substitute for financial information provided in accordance with GAAP. Management believes these non-GAAP measures assist in providing a more complete understanding of the Company’s underlying operational results and trends, and management uses these measures along with the corresponding GAAP financial measures to manage the Company’s business, to evaluate its performance compared to prior periodsand the marketplace, and to establish operational goals. A reconciliation of GAAP to non-GAAP financial results discussed in this presentation is contained in the Appendix hereto.

3© 2019 Mercury Systems, Inc. 3© 2019 Mercury Systems, Inc.
Agenda
• Strategy & Business Update– Mark Aslett
President & CEO
• Defense Industry Update– Dr. Bill Conley
Senior Vice President & CTO
• Growth Strategy in Action– Didier Thibaud
Executive Vice President & COO
• Financial Update– Mike Ruppert
Executive Vice President & CFO
• Q&A

4© 2019 Mercury Systems, Inc.
…to address the industry's challenges and opportunities
Pioneering a next-generation defense electronics company...
• Unique business model at the intersection of high-tech and Defense
• Make commercial technology profoundly more accessible
• Provide all trusted and secure computers for A&D
• Deployed on 300+ programs -serving defense Prime contractor outsourcing needs
• FY14 - FY19 CAGR:– 26% Revenue; ~10% Organic– 34% GAAP Net Income* – 46% Adj. EBITDA– 29% Backlog
• Defense industry’s highest Glassdoor employee ratings**
* GAAP Net Income CAGR FY15-FY19** Source: Capital Alpha Partners, “Glassdoor Data & Defense: Not Much Change Over the Past Year”, August 21, 2018

5© 2019 Mercury Systems, Inc. 5
• Innovative growth company at the intersection of high-tech and defense– Focused on large, growing and well-funded addressable markets
• Proven transformational business model for A&D industry– R&D levels 4-5x industry average as percent of revenue
– Reusable, trusted and secure mission-critical technologies for speed, reduced risk and affordability
– Industry-leading secure computing subsystems developed by a highly cleared workforce
– Developed and produced in trusted facilities with a trusted supply chain
– Destination employer and acquirer of choice
• Low-risk content expansion strategies delivering above-average organic revenue CAGR– Upward vertical expansion for outsourced Tier 2 subsystems driving large dollar content increases
– Horizontal adjacent market expansion into other platforms and programs with similar needs
– Unique chip-scale innovation driving future highest-margin content expansion
• Successful M&A strategy targeting new capabilities and market expansion– In-house deal origination, M&A execution and acquisition integration
– Full integration drives substantial cost and revenue synergies over time
– Multiple M&A themes ongoing
– Scalable business platform
Investment highlightsSpent $1.2B since fiscal 2014 creating a unique business and model for A&D industry
Our financial performance in top 5% of similarly sized public companies

6© 2019 Mercury Systems, Inc.
1,057
Mercury’s financial profile demonstrates our unique strategy
ALL NYSE AND NASDAQ U.S. LISTED COMPANIES WITH MARKET CAPITALIZATION BETWEEN $1B - $5B
34
122
390
LTM Adj. EBITDA Margin >20%
Revenue CAGR>10% 5-Year
LTMRevenueGrowth
>20%
22%Margin
27%Growth
30%Growth
Notes:• LTM figures for Mercury are based on the trailing four fiscal quarters using information reported in Mercury’s Form 10-Ks, Form 10-Qs and/or most recent earnings release. • All other data per FactSet as of October 25, 2019. 5-year CAGR for market participants calculated per FactSet for the trailing four fiscal quarters available as of October 25, 2019 and the comparable
historical period. Mercury 5-year CAGR calculated as the trailing four fiscal quarters ending fiscal Q1 2020 compared to the trailing four fiscal quarters ending fiscal Q1 2015. Financials represent reported results and are not adjusted for acquisitions or divestitures.
• TIER 2 DEFENSE INDEX: AAR, Aerojet Rocketdyne, AeroVironment, AXON Enterprises, Ball Aerospace, BWX Technologies, Comtech Telecom, Cubic, Curtiss Wright, Ducommun, Elbit Systems, FLIR Systems, HEICO, Hexcel, Honeywell Intl, Kaman, Kratos Defense, L3Harris Technologies, Maxar, Moog, Oshkosh, OSI Systems, Teledyne Technologies, Textron, TransDigm Group, Triumph Group, United Technologies, Viasat, Woodward Aerospace.
17%
4%
8%
TIER 2 DEFENSE INDEX MEDIAN
# of Companies

7© 2019 Mercury Systems, Inc.
Six major trends shaping the defense industry
Increased Defense Spending Cycle:Rising interest rates, healthcare and social spending remain long-term issues;Significant platform electronics modernization underway
Challenging Global Security Environment:Chinese militarization and power projection, resurgent Russia and Middle East instability
Innovation Challenges:Primes increasing headcount but recruitment challenges and aging workforce;Relatively low IRAD requires focused investment and increased outsourcing
Political Dysfunction:2019 Budget Control Act positive. Repeated Continuing Resolutions disrupting DoD budget process and spending. Possible Impeachment and 2020 Election
DoD needs more domestically-produced technologyLeverage high-tech commercial investment and innovation;Address supply chain globalization and need for trust, security and assurance
Defense Procurement Reform:DoD focused on speeding up rate of innovation and fieldingOther Transaction Authority (OTA) and Non-Traditional Defense Contractors (NTDCs)

8© 2019 Mercury Systems, Inc.
499
522 524
598
564581
606
671685
617
545558
707722
737718 714727
742747
706 708
$450
$500
$550
$600
$650
$700
$750
$800
2015 2016 2017 2018 2019 2020 2021 2022 2023 2024
Budget Control Act 2011 (Base) Actual funding (Base) Actual funding (Base + OCO)
FY20 Administration Request (Base) FY20 Administration Request (Base + OCO)
FY20 PB drop in base to remain under BCA caps
2019 Bipartisan Budget Act
2019 Bipartisan Budget Act ends BCA caps…
…with 3% DoD budget increase in FY20 but flat outlook for FY21
Topline Defense Budget vs. BCA Caps(Discretionary BA, Current $B)
Notes: Budget and BCA Caps represent the 051 account (DoD), FY18 and FY19 are estimated from enacted appropriations legislationSources: BBA 2019, FY20 PBR, CBO, CRS, OMB, FY20 DoD Green Book, FY18 & FY19 Defense Appropriations bills, RSAdvisors research & analysis
Defense (Base + OCO) CAGR2019 - 2024 1.7%2017 - 2024 3.0%2015 - 2024 3.2%

9© 2019 Mercury Systems, Inc.
The A&D electronics systems market has two major segments:C4I; Sensor and Effector Mission Systems
Aerospace & Defense Platform and Systems Electronics Content
C4I ($22.6B)* Sensor & Effector Mission Systems ($17.4B)*
Platform & Mission Mgmt
C2I Comms EW Radar EO/IR Acoustics Weapons
Avionics /Vetronics
Command & Control / Battle Management
Dedicated Communications
Electronic Warfare
RadarElectro-Optical/
InfraredAcoustics
Missiles/ Munitions
De
fin
itio
n Control &operation of platform &
mission systems
Processing &exploitation of
information
Dissemination of information
Offensive / defensive
exploitation of EM spectrum
Use of RF signal to detect, track, ID
Thermo-graphic camera with video
output
Sound pulses to determine object
location
Seekers, HEL, HPMNaval Launched
Air Launched
20
19
Mar
ket
($B
)
$28.1B $37.0B $17.1B $9.7B $10.4B $11.6B $4.0B $5.8B
4.0% 2.8% 3.7% 4.0% 3.4% 3.8% 5.2% 4.0%
‘19-24 CAGR ‘19-24 CAGR ‘19-24 CAGR ‘19-24 CAGR ‘19-24 CAGR ‘19-24 CAGR ‘19-24 CAGR ‘19-24 CAGR
20
19
Tie
r 2
* M
arke
t ($
B)
$7.1B $7.6B $7.9B $5.9B $5.3B $2.3B $1.0B $2.9B
4.8% 3.7% 3.8% 4.1% 3.7% 5.1% 6.0% 4.4%
‘19-24 CAGR ‘19-24 CAGR ‘19-24 CAGR ‘19-24 CAGR ‘19-24 CAGR ‘19-24 CAGR ‘19-24 CAGR ‘19-24 CAGR
Notes:*Tier 2 includes embedded computing and subsystems with RF content. Includes US Government and Global Defense & Commercial Aerospace MarketsSources: RSAdvisors research & analysis, November 2019. Numbers are rounded.

10© 2019 Mercury Systems, Inc.
Aerospace & Defense Platform and Systems Electronics Content
C4I ($22.6B)* Sensor & Effector Mission Systems ($17.4B)*
Platform & Mission Mgmt
C2I Comms EW Radar EO/IR Acoustics Weapons
Avionics /Vetronics
Command & Control / Battle Management
Dedicated Communications
Electronic Warfare
RadarElectro-Optical/
InfraredAcoustics
Missiles/ Munitions
De
fin
itio
n Control &operation of platform &
mission systems
Processing &exploitation of
information
Dissemination of information
Offensive / defensive
exploitation of EM spectrum
Use of RF signal to detect, track, ID
Thermo-graphic camera with video
output
Sound pulses to determine object
location
Seekers, HEL, HPMNaval Launched
Air Launched
20
19
Mar
ket
($B
)
$28.1B $37.0B $17.1B $9.7B $10.4B $11.6B $4.0B $5.8B
4.0% 2.8% 3.7% 4.0% 3.4% 3.8% 5.2% 4.0%
‘19-24 CAGR ‘19-24 CAGR ‘19-24 CAGR ‘19-24 CAGR ‘19-24 CAGR ‘19-24 CAGR ‘19-24 CAGR ‘19-24 CAGR
20
19
Tie
r 2
* M
arke
t ($
B)
$7.1B $7.6B $7.9B $5.9B $5.3B $2.3B $1.0B $2.9B
4.8% 3.7% 3.8% 4.1% 3.7% 5.1% 6.0% 4.4%
‘19-24 CAGR ‘19-24 CAGR ‘19-24 CAGR ‘19-24 CAGR ‘19-24 CAGR ‘19-24 CAGR ‘19-24 CAGR ‘19-24 CAGR
The A&D electronics systems market has two major segments:C4I; Sensor and Effector Mission Systems
Notes:*Tier 2 includes embedded computing and subsystems with RF content. Includes US Government and Global Defense & Commercial Aerospace MarketsSources: RSAdvisors research & analysis, November 2019. Numbers are rounded.

11© 2019 Mercury Systems, Inc.
Aerospace & Defense Platform and Systems Electronics Content
C4I ($22.6B)* Sensor & Effector Mission Systems ($17.4B)*
Platform & Mission Mgmt
C2I Comms EW Radar EO/IR Acoustics Weapons
Avionics /Vetronics
Command & Control / Battle Management
Dedicated Communications
Electronic Warfare
RadarElectro-Optical/
InfraredAcoustics
Missiles/ Munitions
De
fin
itio
n Control &operation of platform &
mission systems
Processing &exploitation of
information
Dissemination of information
Offensive / defensive
exploitation of EM spectrum
Use of RF signal to detect, track, ID
Thermo-graphic camera with video
output
Sound pulses to determine object
location
Seekers, HEL, HPMNaval Launched
Air Launched
20
19
Mar
ket
($B
)
$28.1B $37.0B $17.1B $9.7B $10.4B $11.6B $4.0B $5.8B
4.0% 2.8% 3.7% 4.0% 3.4% 3.8% 5.2% 4.0%
‘19-24 CAGR ‘19-24 CAGR ‘19-24 CAGR ‘19-24 CAGR ‘19-24 CAGR ‘19-24 CAGR ‘19-24 CAGR ‘19-24 CAGR
20
19
Tie
r 2
* M
arke
t ($
B)
$7.1B $7.6B $7.9B $5.9B $5.3B $2.3B $1.0B $2.9B
4.8% 3.7% 3.8% 4.1% 3.7% 5.1% 6.0% 4.4%
‘19-24 CAGR ‘19-24 CAGR ‘19-24 CAGR ‘19-24 CAGR ‘19-24 CAGR ‘19-24 CAGR ‘19-24 CAGR ‘19-24 CAGR
Mercury participates at the Tier 2 and 3 levels for RF and Computing
Notes:*Tier 2 includes embedded computing and subsystems with RF content. Includes US Government and Global Defense & Commercial Aerospace MarketsSources: RSAdvisors research & analysis, November 2019. Numbers are rounded.

12© 2019 Mercury Systems, Inc.
Aerospace & Defense Platform and Systems Electronics Content
C4I ($22.6B)* Sensor & Effector Mission Systems ($17.4B)*
Platform & Mission Mgmt
C2I Comms EW Radar EO/IR Acoustics Weapons
Avionics /Vetronics
Command & Control / Battle Management
Dedicated Communications
Electronic Warfare
RadarElectro-Optical/
InfraredAcoustics
Missiles/ Munitions
De
fin
itio
n Control &operation of platform &
mission systems
Processing &exploitation of
information
Dissemination of information
Offensive / defensive
exploitation of EM spectrum
Use of RF signal to detect, track, ID
Thermo-graphic camera with video
output
Sound pulses to determine object
location
Seekers, HEL, HPMNaval Launched
Air Launched
20
19
Mar
ket
($B
)
$28.1B $37.0B $17.1B $9.7B $10.4B $11.6B $4.0B $5.8B
4.0% 2.8% 3.7% 4.0% 3.4% 3.8% 5.2% 4.0%
‘19-24 CAGR ‘19-24 CAGR ‘19-24 CAGR ‘19-24 CAGR ‘19-24 CAGR ‘19-24 CAGR ‘19-24 CAGR ‘19-24 CAGR
20
19
Tie
r 2
* M
arke
t ($
B)
$7.1B $7.6B $7.9B $5.9B $5.3B $2.3B $1.0B $2.9B
4.8% 3.7% 3.8% 4.1% 3.7% 5.1% 6.0% 4.4%
‘19-24 CAGR ‘19-24 CAGR ‘19-24 CAGR ‘19-24 CAGR ‘19-24 CAGR ‘19-24 CAGR ‘19-24 CAGR ‘19-24 CAGR
Translated market expansion into growth well above industry average
Notes:*Tier 2 includes embedded computing and subsystems with RF content. Includes US Government and Global Defense & Commercial Aerospace MarketsSources: RSAdvisors research & analysis, November 2019. Numbers are rounded.

13© 2019 Mercury Systems, Inc.
Aerospace & Defense Platform and Systems Electronics Content
C4I ($22.6B)* Sensor & Effector Mission Systems ($17.4B)*
Platform & Mission Mgmt
C2I Comms EW Radar EO/IR Acoustics Weapons
Avionics /Vetronics
Command & Control / Battle Management
Dedicated Communications
Electronic Warfare
RadarElectro-Optical/
InfraredAcoustics
Missiles/ Munitions
De
fin
itio
n Control &operation of platform &
mission systems
Processing &exploitation of
information
Dissemination of information
Offensive / defensive
exploitation of EM spectrum
Use of RF signal to detect, track, ID
Thermo-graphic camera with video
output
Sound pulses to determine object
location
Seekers, HEL, HPMNaval Launched
Air Launched
20
19
Mar
ket
($B
)
$28.1B $37.0B $17.1B $9.7B $10.4B $11.6B $4.0B $5.8B
4.0% 2.8% 3.7% 4.0% 3.4% 3.8% 5.2% 4.0%
‘19-24 CAGR ‘19-24 CAGR ‘19-24 CAGR ‘19-24 CAGR ‘19-24 CAGR ‘19-24 CAGR ‘19-24 CAGR ‘19-24 CAGR
20
19
Tie
r 2
* M
arke
t ($
B)
$7.1B $7.6B $7.9B $5.9B $5.3B $2.3B $1.0B $2.9B
4.8% 3.7% 3.8% 4.1% 3.7% 5.1% 6.0% 4.4%
‘19-24 CAGR ‘19-24 CAGR ‘19-24 CAGR ‘19-24 CAGR ‘19-24 CAGR ‘19-24 CAGR ‘19-24 CAGR ‘19-24 CAGR
Penetrating new markets larger than our traditional ones
Notes:*Tier 2 includes embedded computing and subsystems with RF content. Includes US Government and Global Defense & Commercial Aerospace MarketsSources: RSAdvisors research & analysis, November 2019. Numbers are rounded.

14© 2019 Mercury Systems, Inc.
We are deployed on 300+ programs with 25+ PrimesC
4I
Sen
sor
& E
ffec
tor
Mis
sio
n S
yste
ms
JLTV KC-46 A330 MRTTWIN-T
C-130
MALD-J SM2/3/6PavewayStormbreaker PGK
Triton AegisLTAMDSF-16 Reaper/Gorgon Stare
Global Hawk SEWIPBadger/BuzzardF-35
Aegis
Aerospace & Defense Platform and Systems Electronics Content

15© 2019 Mercury Systems, Inc.
Our purpose connects our vision, positioning, culture & values…
...and strategies to how we create value for shareholders
OUR PURPOSEInnovation That Matters
OUR VISIONProvide all processing solutions on every system that requires trusted and secure computing
OUR POSITIONINGMercury Systems is the leader in making trusted, secure mission-critical technologies profoundly more accessible to Aerospace and Defense.
®

16© 2019 Mercury Systems, Inc.
Strategy delivering above-average growth and profitability
1Invest to grow organically
Invest in our people, processes, systems and trusted manufacturing assetsto support continued organic growth
2Expand capabilities, market access and penetration through M&A
Create value through disciplined M&A and full acquisition integration todrive cost and revenue synergies
3Invest in trusted secure innovations that matter
Commercially develop leading-edge technologies, customized for Aerospaceand Defense applications, through above-industry investment in R&D
4Continuously improve operational capability and scalability
Deploy Mercury Operating System to drive transformational and sustainable business improvements and value creation across the enterprise
5Attract and retain the right talent
Support and promote our culture and values to attract, retain and engagethe right talent

17© 2019 Mercury Systems, Inc.
Innovating and making mission-critical technologies profoundly...
...more accessible for systems that require trusted, secure computing
SWaP SOFTWARE
SECURITY
SAFETY Highest Safety Design Assurance Levels (DAL)
Highest Performance Processing & RFM
Best Size, Weight & Power with State-of-
the-Art Cooling Technology
Industry-leading
Embedded Security
Open Software for
Low Risk Integration, Investment Protection
Trusted and Secure Mission-Critical Technologies and Subsystems
ACQUIRE DIGITIZE PROCESS STORAGE EXPLOIT DISSEMINATE
SILICON
SPEED
Leading conduit for commercial silicon innovation
into A&D market

18© 2019 Mercury Systems, Inc.
Sensor Processing
...Tier 2 provider of pre-integrated sensor processing subsystems
Acquisitions initially transformed Mercury into a...
• Acquired capabilities significantly expanded addressable market
• Moved up the value chain
• Model facilitates greater customer outsourcing
• Accelerates customer supply chain transformation
• Disintermediate traditional product-level competitors
• Low-risk, content expansion organic growth strategy
• Future M&A opportunities
Sensor Processing

19© 2019 Mercury Systems, Inc.
Our overarching strategy however is to provide all types...
...of processing subsystems requiring trusted, secure computing
C3I
M
Sensor ProcessingPlatform & Mission
Management

20© 2019 Mercury Systems, Inc.
Our goal is to also uniquely replicate our sensor...
...processing subsystem integration strategy at chip scale
Trusted and Secure SolutionsChip-Scale Application-Specific Customization
Sensor Processing

21© 2019 Mercury Systems, Inc.
This game-changing capability will enable new applications...
...and an additional dimension of highest-margin future growth
New Modular IP Library Enables Rapid Affordable CustomizationOpen systems at chip scale allows unprecedented configurability and flexibility
Chiplets Trusted and Secure SolutionsBest-of-breed Ecosystem from Multiple Vendors Application-Specific Customization

22© 2019 Mercury Systems, Inc.
The first driver of growth is content expansion driven...
...by M&A, customer outsourcing, share gains and system complexity
1
Trusted and Secure
Computing
Up to a 12x increase in content per system as customers outsource more due to secure computing requirements and as system complexity grows
23© 2019 Mercury Systems, Inc.
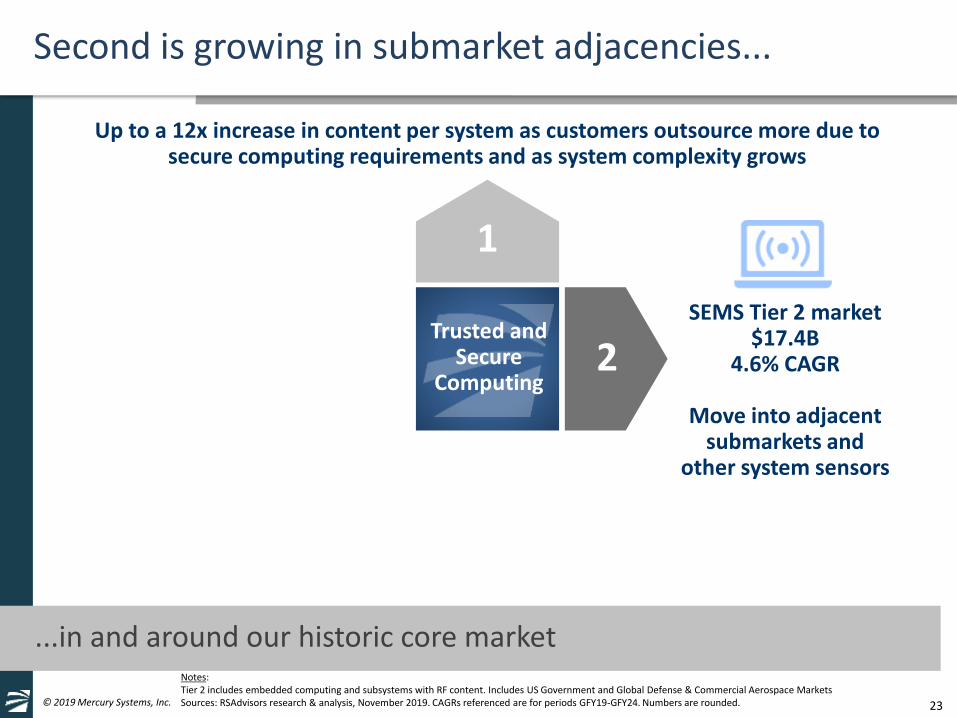
Second is growing in submarket adjacencies...
...in and around our historic core market
4
1
2Trusted and
Secure Computing
Up to a 12x increase in content per system as customers outsource more due to secure computing requirements and as system complexity grows
SEMS Tier 2 market $17.4B
4.6% CAGR
Move into adjacent submarkets and
other system sensors
Notes:Tier 2 includes embedded computing and subsystems with RF content. Includes US Government and Global Defense & Commercial Aerospace MarketsSources: RSAdvisors research & analysis, November 2019. CAGRs referenced are for periods GFY19-GFY24. Numbers are rounded.

24© 2019 Mercury Systems, Inc.
Third is expanding into all other systems...
...that require trusted, secure computing
4
1
23Trusted and
Secure Computing
Up to a 12x increase in content per system as customers outsource more due to secure computing requirements and as system complexity grows
SEMS Tier 2 market $17.4B
4.6% CAGR
Move into adjacent submarkets and
other system sensors
C4I Tier 2 market $22.6B
4.1% CAGR
Provide all other computers that need trust, security, safety
Notes:Tier 2 includes embedded computing and subsystems with RF content. Includes US Government and Global Defense & Commercial Aerospace MarketsSources: RSAdvisors research & analysis, November 2019. CAGRs referenced are for periods GFY19-GFY24. Numbers are rounded.
25© 2019 Mercury Systems, Inc.
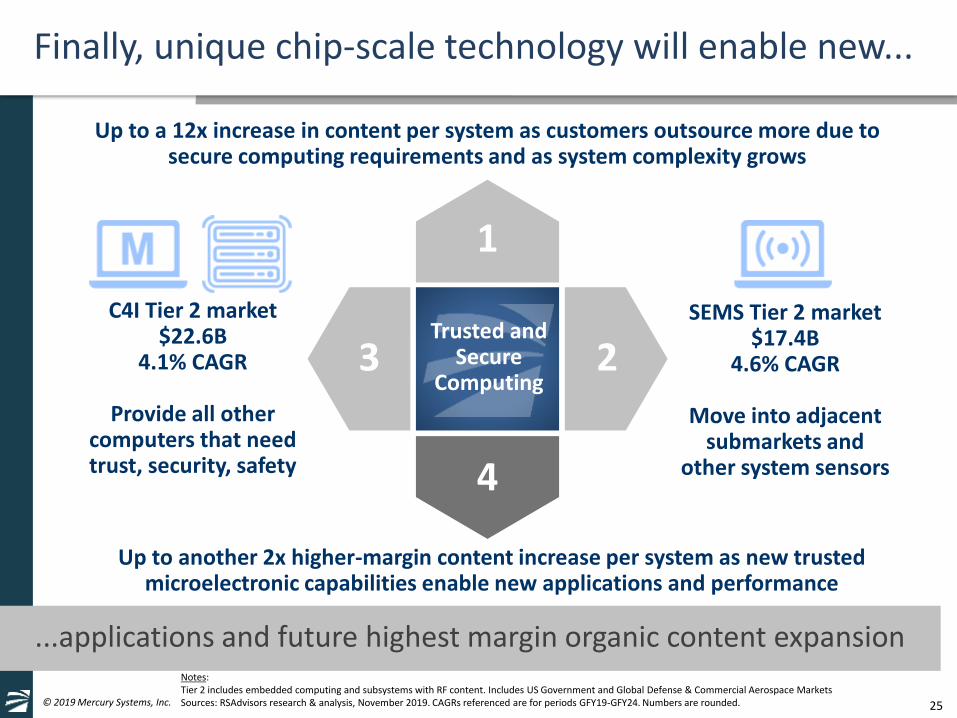
Finally, unique chip-scale technology will enable new...
...applications and future highest margin organic content expansion
4
Up to another 2x higher-margin content increase per system as new trusted microelectronic capabilities enable new applications and performance
1
4
23Trusted and
Secure Computing
Up to a 12x increase in content per system as customers outsource more due to secure computing requirements and as system complexity grows
SEMS Tier 2 market $17.4B
4.6% CAGR
Move into adjacent submarkets and
other system sensors
C4I Tier 2 market $22.6B
4.1% CAGR
Provide all other computers that need trust, security, safety
Notes:Tier 2 includes embedded computing and subsystems with RF content. Includes US Government and Global Defense & Commercial Aerospace MarketsSources: RSAdvisors research & analysis, November 2019. CAGRs referenced are for periods GFY19-GFY24. Numbers are rounded.

26© 2019 Mercury Systems, Inc.
Sensor Processing
Our M&A sensor processing content expansion strategy...
...has worked well yet we’re in the early phases of market penetration
Capability
MarketPenetration
Note: Capability and Market Penetration for illustration purposes only
C3I
M
Platform & MissionManagement

27© 2019 Mercury Systems, Inc.
Sensor Processing
Our C3I content and market expansion began in fiscal 2018...
...still in early stages of M&A content and organic market penetration
Capability
MarketPenetration
Note: Capability and Market Penetration for illustration purposes only
C3I
M
Platform & MissionManagement
Capability
MarketPenetration

28© 2019 Mercury Systems, Inc.
Sensor Processing
Similarly, our platform and mission management expansion began in fiscal 2017…
...still in early stages of M&A content and organic market penetration
Capability
MarketPenetration
Note: Capability and Market Penetration for illustration purposes only
C3I
M
Platform & MissionManagement
CapabilityMarket
Penetration Capability
MarketPenetration

29© 2019 Mercury Systems, Inc.
Business model built for speed, innovation and affordability...
...as customers outsource pre-integrated mission subsystems
Primes
Trusted and Secure MissionCritical Technologies
and Subsystems
Mercury Pre-integrated Trusted and Secure
Computer Subsystem
Government
Prime Traditional COTSProduct Integration
36+ months Time to Market
12 months Time to Market
Open Middleware & APIs
Operating System
Vendor A
COTSVendor B
COTSVendor C
COTS
Proprietary Middleware
Classified Prime/Gov’t IPINTEGRATION
LessRisk
Lower Initial Cost
LessTime
Lower Lifecycle
Cost
Trusted Microelectronics
Classified Prime/Gov’t IP

30© 2019 Mercury Systems, Inc.
We can apply the same subsystem pre-integration model...
...to C3I and platform and mission management solutions
Primes
Trusted and Secure MissionCritical Technologies
and Subsystems
Mercury Pre-integrated Trusted and Secure
Computer Subsystem
12 months Time to Market
Open Middleware & APIsLessRisk
Lower Initial Cost
LessTime
Lower Lifecycle
Cost
Trusted Microelectronics
Classified Prime/Gov’t IP
Sensor Processing
C3I
M
Platform & MissionManagement

31© 2019 Mercury Systems, Inc.
We’ve built trusted manufacturing and integration capabilities
Rugged Servers
Mission Systems
Secure Processing
Custom Microelectronics
RFM
Storage
Avionics
Displays
Manufacturing Capabilities W. Caldwell,
NJFremont,
CAOxnard,
CACypress,
CAPhoenix,
AZMesa,
AZAlpharetta,
GAHudson,
NHChantilly,
VAAndover,
MAGeneva,
Switz.Huntsville,
AL
Rugged Servers
Mission Computer (C2)
Secure Processing
Custom Microelectronics
RFM
Storage
Avionics Computer
Displays
32© 2019 Mercury Systems, Inc.
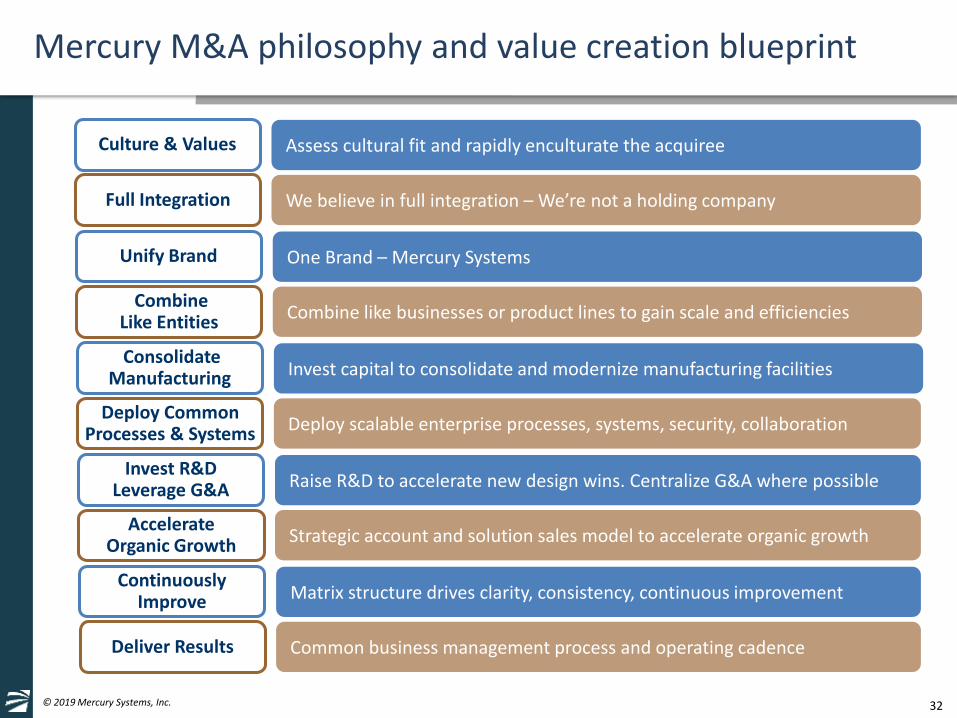
Mercury M&A philosophy and value creation blueprint
Assess cultural fit and rapidly enculturate the acquiree Culture & Values
We believe in full integration – We’re not a holding companyFull Integration
One Brand – Mercury Systems Unify Brand
Combine like businesses or product lines to gain scale and efficienciesCombine
Like Entities
Invest capital to consolidate and modernize manufacturing facilitiesConsolidate
Manufacturing
Deploy scalable enterprise processes, systems, security, collaborationDeploy Common
Processes & Systems
Raise R&D to accelerate new design wins. Centralize G&A where possibleInvest R&D
Leverage G&A
Strategic account and solution sales model to accelerate organic growthAccelerate
Organic Growth
Matrix structure drives clarity, consistency, continuous improvementContinuously
Improve
Common business management process and operating cadenceDeliver Results
33© 2019 Mercury Systems, Inc.
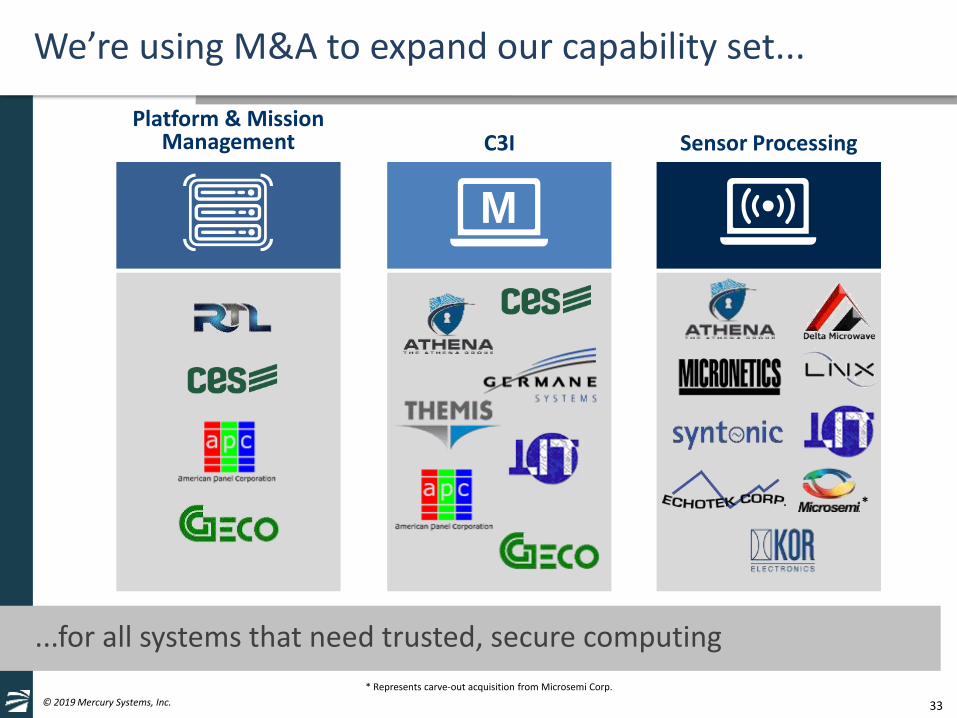
We’re using M&A to expand our capability set...
...for all systems that need trusted, secure computing
Platform & MissionManagement C3I
M
Sensor Processing
*
* Represents carve-out acquisition from Microsemi Corp.
34© 2019 Mercury Systems, Inc.
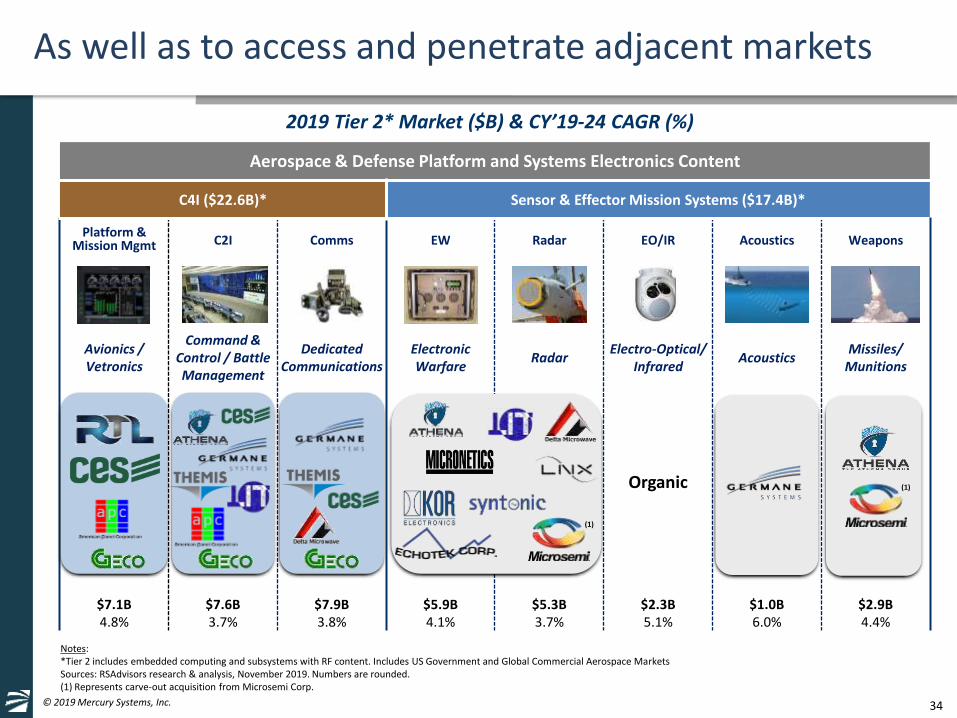
As well as to access and penetrate adjacent markets
Aerospace & Defense Platform and Systems Electronics Content
C4I ($22.6B)* Sensor & Effector Mission Systems ($17.4B)*
Platform & Mission Mgmt C2I Comms EW Radar EO/IR Acoustics Weapons
Avionics /Vetronics
Command & Control / Battle Management
Dedicated Communications
Electronic Warfare
RadarElectro-Optical/
InfraredAcoustics
Missiles/ Munitions
Organic
$7.1B4.8%
$7.6B3.7%
$7.9B3.8%
$5.9B4.1%
$5.3B3.7%
$2.3B5.1%
$1.0B6.0%
$2.9B4.4%
Notes:*Tier 2 includes embedded computing and subsystems with RF content. Includes US Government and Global Commercial Aerospace MarketsSources: RSAdvisors research & analysis, November 2019. Numbers are rounded.(1) Represents carve-out acquisition from Microsemi Corp.
2019 Tier 2* Market ($B) & CY’19-24 CAGR (%)
(1)
(1)

35© 2019 Mercury Systems, Inc.
Glassdoor current employee ratingsValidates Mercury’s destination employer and acquirer of choice status
MercurySystems
Glassdoor Average
ProxyPeer Group(1)
Tier 2 Defense Company Index(2)
Overall Rating 4.4 3.4 3.4 3.5
Culture & Values 4.5 3.4 3.2 3.4
Work-Life Balance 3.9 3.4 3.3 3.5
Senior Management 4.3 3.1 3.4 3.1
Compensation & Benefits 4.3 3.1 3.0 3.5
Career Opportunities 4.3 3.0 3.6 3.3
Recommend to Friend 87% 62% 61% 66%
CEO Approval 94% 70% 72% 75%
Positive Business Outlook 92% 49% 50% 56%
Source: Glassdoor, Inc., November 20, 2019
(2) TIER 2 DEFENSE INDEX: AAR Corporation, Aerojet Rocketdyne, AeroVironment, AXON Enterprises, Ball Aerospace, BXW Technologies, Comtech Telecom, Cubic Corp, Curtiss Wright Corp, Ducommun, Elbit Systems, FLIR Systems, Harris Corp, Heico, Hexcel, Honeywell Intl, Kaman, KBR, Kratos Defense, L-3 Technologies, Maxar, MOOG, Oshkosh Defense, OSI Systems, Teledyne Technologies, Textron, Transdigm Group, Triumph Group, United Technologies, Vectrus, Viasat, Woodward Aerospace.
(1) PROXY PEER GROUP: ADTRAN, Inc., Astronics Corp., Brooks Automation, Inc., Cognex Corp., Comtech Telecommunications Corp., Cray, Inc., CTS Corp, Diodes Inc, Ducommun, Inc., II-VI Inc., Infinera, iRobot Corp., Kratos Defense & Security Solutions, Inc., MACOM Technology Solutions Holdings, Inc., Methode Electronics, Inc., MKS Instruments, Inc., NETGEAR, Inc., NetScout Systems, Inc., Novanta, Inc., OSI Systems, Inc., Ribbon Communications Inc., Rogers Corporation.

36© 2019 Mercury Systems, Inc.
…with DoD investment priorities and overall industry trends
Our capabilities and growth dimensions are well-aligned…
• Addressable market growing faster than DoD budget
• Content per system increasing due to greater outsourcing, share gains and threat driven system complexity
• Acquisitions adding new capabilities, market accessand increased penetration
• Winning new platforms and programs as customers proliferate our solutions
• Adding new strategic accounts and strengthening product line sales to grow acquisitions
• Growing with customers internationally
A&D Industry
Content
Market
Platform
Customer
Program
Geography
GROWTH DIMENSIONS

37© 2019 Mercury Systems, Inc.
Transforming components and modules into integrated subsystems
Revenue growth rates by content and tier
• Integrated subsystem revenue up 73% in last twelve months – now 46% of total company revenue
• Majority of new designs winsat the subsystem level
• Modules provide ability to differentiate in open systems
• Security dominates P-win
• Doubled size of Microsemi microelectronic component business since acquisition
• New trusted microelectronic components technology leadership and future growth
Notes: Fiscal years ended June 30; FY14-19 figures are as reported in the Company’s Form 10-Ks and/or internal Company data. LTM figures are based on the trailing four fiscal quarters using information reported in the Company’s Form 10-Ks, Form 10-Qs and/or most recent earnings release. Percent of total may not equal 100% due to other non-categorized revenue. Numbers are rounded. As additional information related to the Company’s products by end user, application and/or product grouping is attained, the categorization of these products can vary over time. When this occurs, the Company reclassifies revenue by end user, application and/or product grouping for prior periods.

38© 2019 Mercury Systems, Inc.
Revenue growth rates by market
• Significant C4I and SEMS modernizations underway
– Radar: 10% 5 year CAGR
– EW: 23% 5 year CAGR
– Weapons: 117% 5 year CAGR
– Comm’s: 32% 5 year CAGR
– C2I: 192% 5 year CAGR
• Rapid and affordable means to add new warfighting capability
• Secure, trusted systems critical
• Software-defined open mission architectures disaggregates system allowing rapid upgrades
• Increased processing density needed for AI and autonomy
• Next-generation systems will require new edge processing capabilities and safety certs
Notes: Fiscal years ended June 30; FY14-19 figures are as reported in the Company’s Form 10-Ks and/or internal Company data. LTM figures are based on the trailing four fiscal quarters using information reported in the Company’s Form 10-Ks, Form 10-Qs and/or most recent earnings release. Percent of total may not equal 100% due to other non-categorized revenue. Numbers are rounded. As additional information related to the Company’s products by end user, application and/or product grouping is attained, the categorization of these products can vary over time. When this occurs, the Company reclassifies revenue by end user, application and/or product grouping for prior periods.
39© 2019 Mercury Systems, Inc.
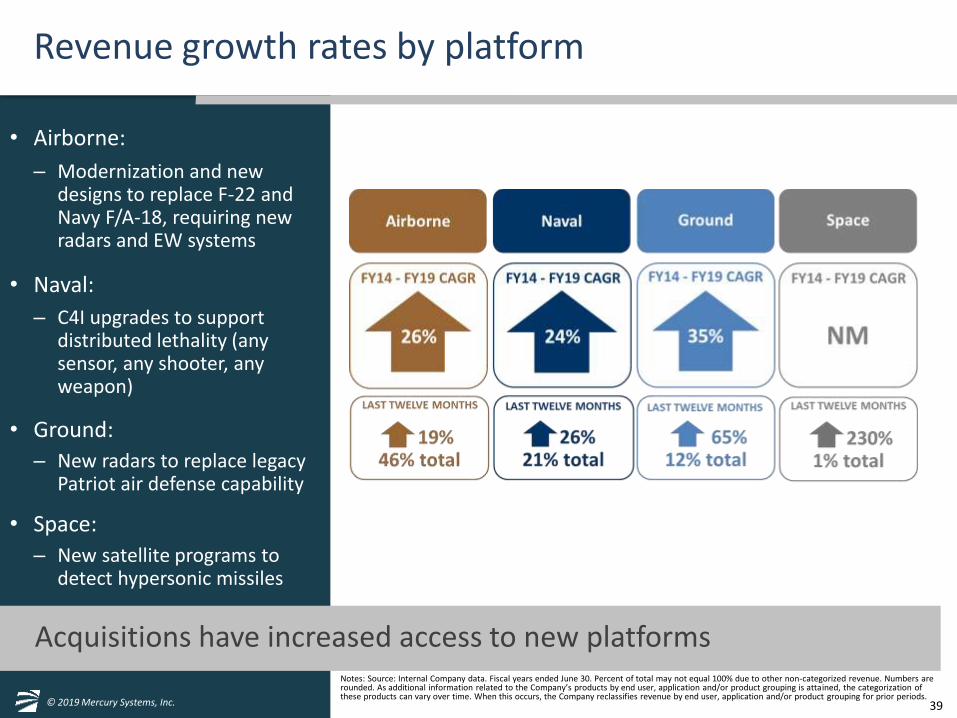
Acquisitions have increased access to new platforms
Revenue growth rates by platform
• Airborne:
– Modernization and new designs to replace F-22 and Navy F/A-18, requiring new radars and EW systems
• Naval:
– C4I upgrades to support distributed lethality (any sensor, any shooter, any weapon)
• Ground:
– New radars to replace legacy Patriot air defense capability
• Space:
– New satellite programs to detect hypersonic missiles
Notes: Source: Internal Company data. Fiscal years ended June 30. Percent of total may not equal 100% due to other non-categorized revenue. Numbers are rounded. As additional information related to the Company’s products by end user, application and/or product grouping is attained, the categorization of these products can vary over time. When this occurs, the Company reclassifies revenue by end user, application and/or product grouping for prior periods.

40© 2019 Mercury Systems, Inc.
Valued partner to top defense prime contractors
Revenue growth rates by top customer
• Increased Tier 2 outsourcing: – Upfront partner IRAD
– Lower integration risk / cost
– Faster time to field
– Lower lifecycle costs
– Lack of resources and skills
• Flight to quality suppliers:– Trusted, secure computing
– Safety certifiable processing
– RF design, develop and build
– Trusted microelectronics
• Supply chain delayering:– Non-traditional suppliers
– Access to rapid innovation
– Reduce profit layers
Notes: Fiscal years ended June 30. Top customers ranked based on cumulative revenue for the period FY14-FY19. Percent of total may not equal 100% due to other non-categorized revenue. Numbers are rounded.

41© 2019 Mercury Systems, Inc.
Increasingly diverse portfolio of franchise programs
Revenue growth rates by top programs
• Tracking well over 100 active programs
• Top 25 and top 50 programs growing faster than top 10
• Content expansion underway across top programs
• Top programs growing faster than total company revenue
• Top program LTM revenue growing faster as programs move from development to production
Notes: Fiscal years ended June 30. Top programs ranked based on cumulative revenue for the period FY14-FY19. Percent of total may not equal 100% due to other non-categorized revenue. Numbers are rounded.

42© 2019 Mercury Systems, Inc.
...which in turn is driving strong results
Acquisitions and investments driving significant opportunity growth...
• Total potential value grew >5.2x to $10.6B in 6 years
• Significant Radar, EW, C4I, EO/IR and Weapons opportunity pipeline
• Acquisitions bring new programs and capabilities
• Larger, more diversified, program base reduces risk
• Content expansion driving above-average growth
• Outsourced integrated subsystems 63% of top 30 program lifetime value
Note: Refer to Appendix for definitions of “Probable”, “Possible”, “Pursuit”, and “Won”.Probable and Possible values are as of the beginning of the referenced fiscal year. Numbers are rounded.
4,900 2,045
5,717
2,303
1,442
1,823
1,801
915
288
0
2,000
4,000
6,000
8,000
10,000
12,000
FY14 FY14-FY20 Increase FY20
Top 30 Programs & Pursuits Estimated Lifetime Value ($M)Radar EW C4I Weapons EO/IR Other
10,617
Probable
5, 717Possible
TotalPipeline
8,572
Pursuit3,135
Won7,842

43© 2019 Mercury Systems, Inc.
Radar 3,085 29%
EW2,705 25%
C4I1,823 17% Weapons
1,801 17% EO/IR
915 9%
Other288 3%
C4I183 28%
Weapons64
10% EO/IR111%
Radar16425%
EW129
20%
Other104
16%
Submarket
Acquisitions and investments driving significant potential...
...for continued organic growth across multiple dimensions
Top 30 Programs & Pursuits, Estimated Lifetime Value (in $ millions, % of total)
Submarket Platform Content
ContentPlatform
FY19 Revenue (in $ millions, % of total)
Notes: Fiscal years ended June 30; FY19 figures are as reported in the Company’s Form 10-Ks and/or internal Company data. Weapons and EO/IR revenue is classified within Other Sensor and Effector products which include all Sensor and Effector end markets other than Radar and Electronic Warfare. Percent of total may not equal 100% due to other non-categorized revenue. Numbers are rounded. As additional information related to the Company’s products by end user, application and/or product grouping is attained, the categorization of these products can vary over time. When this occurs, the Company reclassifies revenue by end user, application and/or product grouping for prior periods. Refer to Appendix for definitions of “Probable”, “Possible”, “Pursuit”, and “Won”. Probable and Possible values are as of the beginning of the referenced fiscal year.
Naval137 21%
Ground83
12%Airborne306 47%
Other129
20%
Modules18128%
Components185 28%
Subsystems 289 44%
Airborne6,320 60%
Naval920 9% Ground
2,814 26%
Other562 5%
Subsystems6,726 63%
Modules2,692 26%
Components1,199 11%

44© 2019 Mercury Systems, Inc. 44
We’re a leader in trusted, secure technologies and subsystems
Innovative growth company at intersection of high tech and defense
Proven transformational business model for A&D industry
Low-risk content expansion strategies with substantial headroom
Successful M&A strategy targeting new capabilities and market expansion
Financial performance in top 5% of similarly sized public companies

45© 2019 Mercury Systems, Inc. 45© 2019 Mercury Systems, Inc.
Agenda
• Strategy & Business Update– Mark Aslett
President & CEO
• Defense Industry Update– Dr. Bill Conley
Senior Vice President & CTO
• Growth Strategy in Action– Didier Thibaud
Executive Vice President & COO
• Financial Update– Mike Ruppert
Executive Vice President & CFO
• Q&A

46© 2019 Mercury Systems, Inc.
The threat is changing...
...and requires the US to be agile, fast, and affordable
Time to market challenges
Time to decision challenges
Time to adapt
3 generations of threat to single generation of aircraft
Hypersonic weapons –hard to track, maneuver throughout flight (hard to know what the target is)
• US forces must be able to operate globally
• Each competitor has unique challenges
• Electronics supply chain must be secure
• Electronics must not be vulnerable to exploitation
US F-22 Russian Surface to
Air Missiles
1981
1990
2000
2011
Requirement
1st flight of prototype
Production begins
Production ends
SA-10
SA-20
SA-21

47© 2019 Mercury Systems, Inc.
...nation-state competitive environment different than during Cold War
Global economic trends make...
• Economic parity
• R&D investment parity
• US defense investment exceeds Chinese State
• US investment supports global goals; China’s supports regional goals
• Chinese State investment in defense adequate for modernization programs
• Chinese defense spending ~2% of GDP
– US ~3%
– Russia ~4%
– USSR in Cold War >10%
US
GD
P (
$T)
US
Spen
din
g ($
B)
Defense
Analysis notes:• All values are in 2018 Dollars• All ratios use Purchase Power
Parity (PPP) conversion values
Ch
ines
e St
ate/
Un
ited
Sta
tes

48© 2019 Mercury Systems, Inc.
...supporting Mercury’s organic growth strategy
Commercial R&D growth outpaces Defense...
• Commercial R&D investments dominate since Cold War ended
• Today, dual-use technologies transition from commercial to defense applications
• Electronics / semiconductors markets are dominated by commercial investment
• Defense dependencies on electronics increasing
• In 2015, military market share was <1%; Tier 2 & 3 merchant suppliers provided necessary scale
DoD RDT&E
3x
2x
1.0
1/2x
1/3x
Federal funding
dominates
Commercial funding
dominates
Ratio of Commercial to Federal R&D
Commercial Semiconductor Marketvs. US Defense Investment
500
250
0
Inve
stm
ent
(20
18
$B
)
1960 1970 1980 1990 2000 2010
1985 1995 2005 2015Source: WSTS End Use Report, 2015Note: Military is <1% and is included in Industrial/Gov’t

49© 2019 Mercury Systems, Inc.
It’s difficult to line up, synchronize and deliver programmatically on things that make sense at the right time for the force.
—RADM Steve Parode, 2019Director, Warfare Integration
The Air Force must be able to collect and decipher information and produce dilemmas for our adversaries at a rate they can never keep up with.
—Gen Stephen Wilson, 2018Vice Chief of Staff of the Air Force
Integrated circuit-related products and services shall be procured from a trusted supplier using trusted processes accredited by the Defense Microelectronics Activity (DMEA) when they are custom-designed, custom-manufactured, or tailored for a specific DoD military end use.
—DoD Instruction 5200.44, 2018
We envision a much more specialized, secure, and heavily automated electronics community.
—Dr. William Chappell, 2018Director, Microsystem Technology Office (former)
Mercury is poised to address US Government’s priorities…
...by making trusted, secure mission-critical technologies more accessible

50© 2019 Mercury Systems, Inc. 50© 2019 Mercury Systems, Inc.
Agenda
• Strategy & Business Update– Mark Aslett
President & CEO
• Defense Industry Update– Dr. Bill Conley
Senior Vice President & CTO
• Growth Strategy in Action– Didier Thibaud
Executive Vice President & COO
• Financial Update– Mike Ruppert
Executive Vice President & CFO
• Q&A

51© 2019 Mercury Systems, Inc. 51
Growth strategy in action with Aegis Naval Fleet
Our largest program ($100M) 10 years ago
Radar:• SPY-1 Radar processing• FMS processing refresh

52© 2019 Mercury Systems, Inc. 52
EW content expansion
M&A strategies in RFM drove 2.5x content expansion
Radar:• SPY-1 Radar processing• FMS processing refresh
EW:
• EP/ES: SEWIP Block 2
• EA: SEWIP Block 3
• SIGINT: SSEE add-on
53© 2019 Mercury Systems, Inc. 53
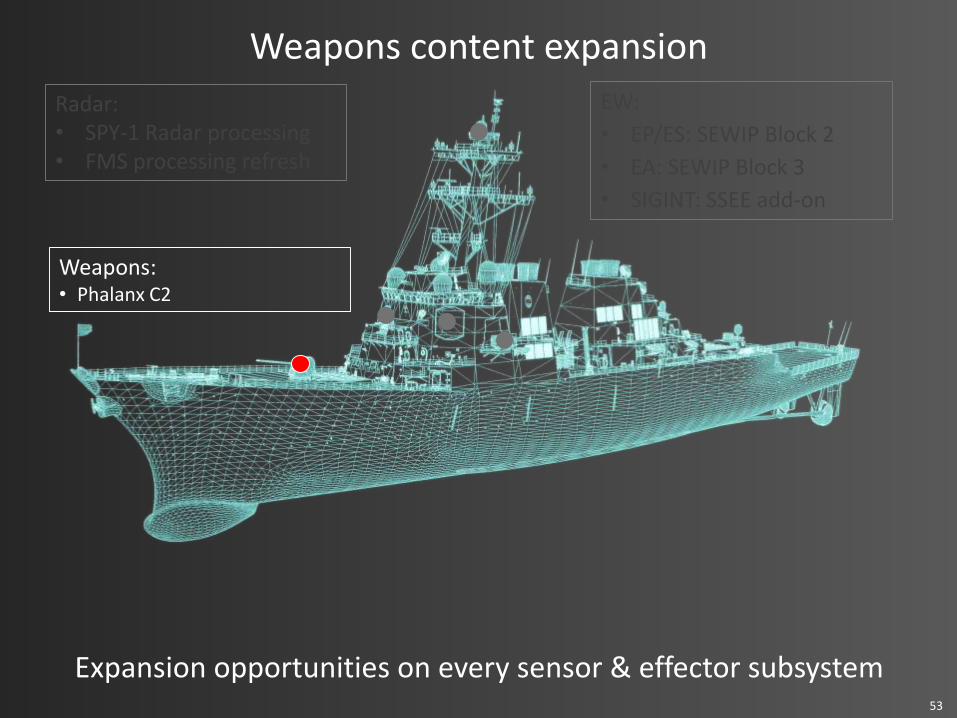
Weapons content expansion
Expansion opportunities on every sensor & effector subsystem
Radar:• SPY-1 Radar processing• FMS processing refresh
EW:
• EP/ES: SEWIP Block 2
• EA: SEWIP Block 3
• SIGINT: SSEE add-on
Weapons:• Phalanx C2

54© 2019 Mercury Systems, Inc. 54
C3I market expansion
M&A doubled content and expanded market into C3I from Radar
Radar:• SPY-1 Radar processing• FMS processing refresh
EW:
• EP/ES: SEWIP Block 2
• EA: SEWIP Block 3
• SIGINT: SSEE add-on
C3I:• C2I: CPS and CDS
• Comms:– Navy Multiband Terminal
– IFF interrogators
Weapons:• Phalanx C2
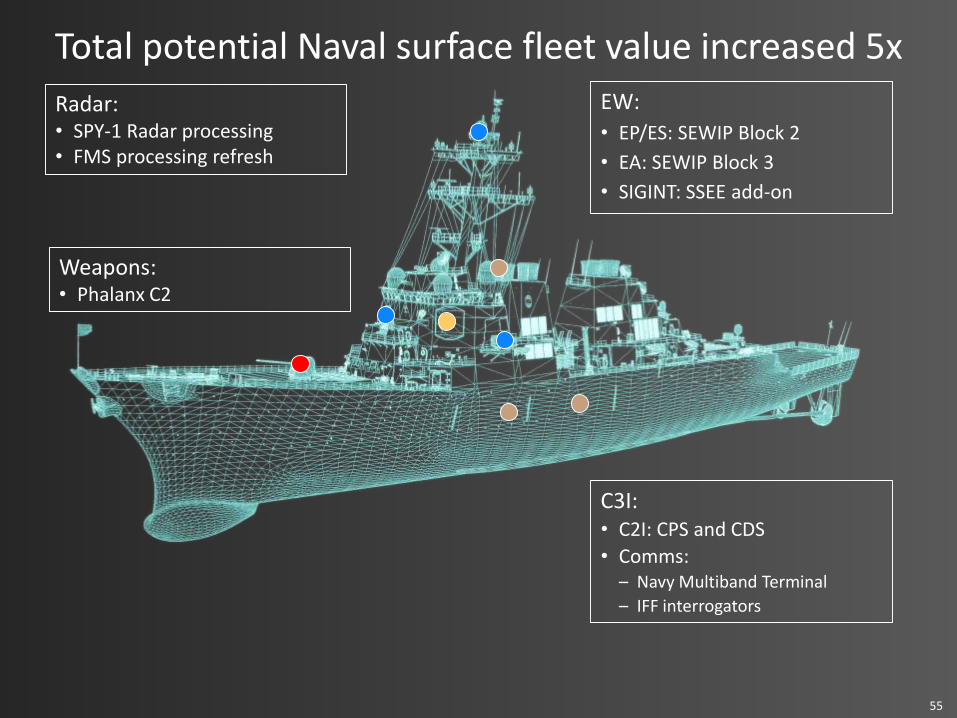
55© 2019 Mercury Systems, Inc. 55
Total potential Naval surface fleet value increased 5x
Radar:• SPY-1 Radar processing• FMS processing refresh
EW:
• EP/ES: SEWIP Block 2
• EA: SEWIP Block 3
• SIGINT: SSEE add-on
Weapons:• Phalanx C2
C3I:• C2I: CPS and CDS
• Comms:– Navy Multiband Terminal
– IFF interrogators
56© 2019 Mercury Systems, Inc. 56
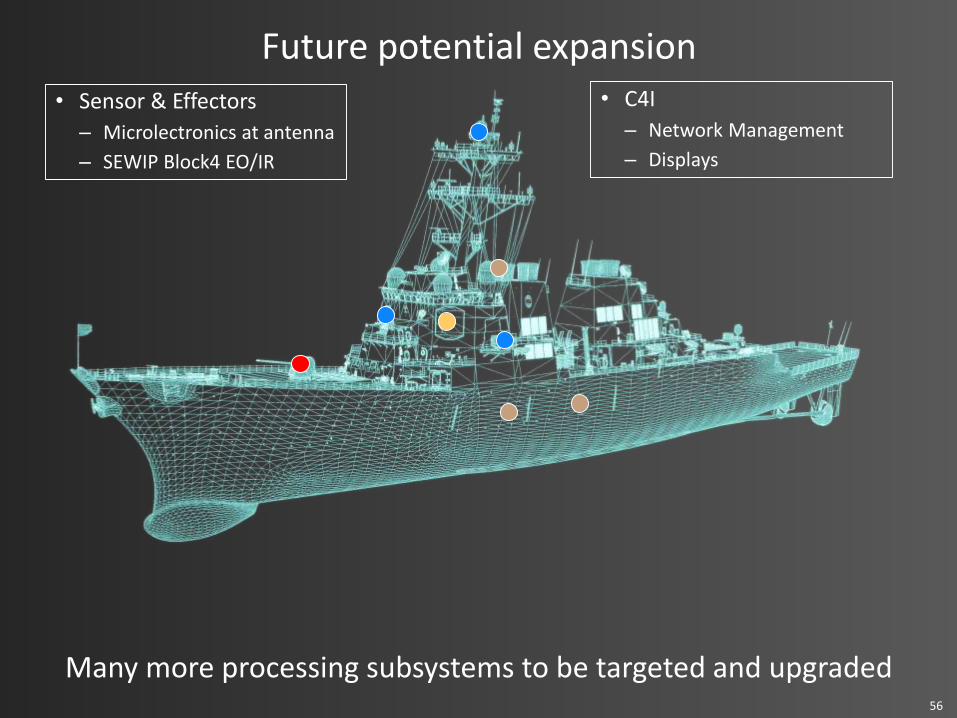
Future potential expansion
Many more processing subsystems to be targeted and upgraded
• Sensor & Effectors
– Microlectronics at antenna
– SEWIP Block4 EO/IR
• C4I
– Network Management
– Displays

57© 2019 Mercury Systems, Inc. 57
Another important example: Patriot Radar
Initial outsourcing at subsystem level drove >$100M to Mercury
Ground mobile Radar: • Radar Processing

58© 2019 Mercury Systems, Inc. 58
Major design win as key supplier to RTN on LTAMDS
Next-generation drives additional substantial processing needs
Ground mobile Radar: • Radar Processing
Next-generation LTAMDS:
• Radar processing >4x

59© 2019 Mercury Systems, Inc. 59
New threats driving new needs
EW/EP needs enabling substantial content expansion
Ground mobile Radar: • Radar Processing
Next-generation LTAMDS:
• Radar processing 5x
• EP processing expansion >4x

60© 2019 Mercury Systems, Inc. 60
Additional content expansion based on broad range of capabilities
Total content expansion increased >10x from Patriot to LTAMDS
Next-generation LTAMDS:
• Radar processing 5x
• EP processing expansion 5x
• RF content expansion 2x
Ground mobile Radar: • Radar Processing

61© 2019 Mercury Systems, Inc. 61
New microlectronics capabilities enabling potential future content expansion
Could double our content in future
Next-generation LTAMDS:
• Radar processing 5x
• EP processing expansion 5x
• RF content expansion 2x
Ground mobile Radar: • Radar Processing
Future potential expansion
• Microelectronics processing at the antenna
62© 2019 Mercury Systems, Inc. 62
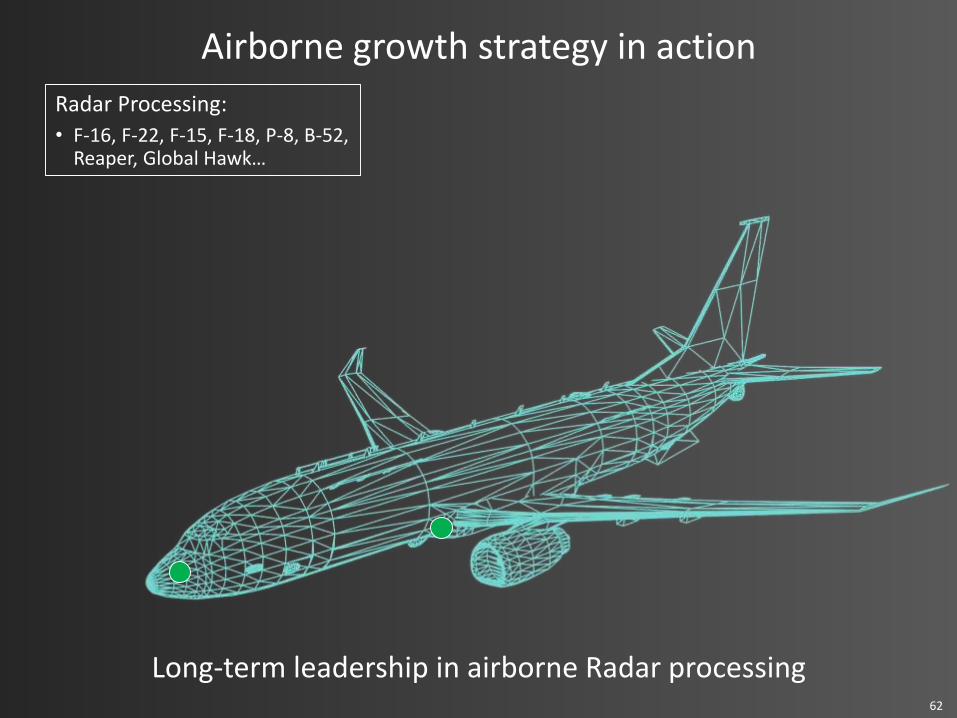
Airborne growth strategy in action
Long-term leadership in airborne Radar processing
Radar Processing:
• F-16, F-22, F-15, F-18, P-8, B-52, Reaper, Global Hawk…

63© 2019 Mercury Systems, Inc. 63
Content and market expansion in EW, EO/IR, weapons
Platform sensor electronics upgrades and leadership in sensor processing driving growth through content expansion with M&A
Radar Processing:
• F-16, F-22, F-15, F-18, P-8, B-52, Reaper, Global Hawk…
Electronic warfare:
• Fighter: F15, F16, F35, F18
• Rotary-wing
• ISR Platforms
EO/IR
Weapons:
• Paveway, Stormbreaker

64© 2019 Mercury Systems, Inc. 64
Additional market expansion in C4I
M&A in C4I driving additional market expansion
Radar Processing:
• F-16, F-22, F-15, F-18, P-8, B-52, Reaper, Global Hawk…
Electronic warfare:
• Fighter: F15, F16, F35, F18…
• Helicopter
• ISR Platforms
EO/IR
Weapons:
• Paveway, Stormbreaker
C4i including displays:
• Fighters: F-35, F-18, F-15, A-10
• Tankers: KC-46, MRTT
• Helicopters: Apache, H225
• ISR Platforms: P-8, Black
• Transports: C-130, C-17
• Weapons
• UAV, UAM

65© 2019 Mercury Systems, Inc. 65
• Modernization of legacy systems to address new threats
• LTAMDS over 10x more content expansion than Patriot
• Digital convergence driving more processing demand in C4I market
• Broad product portfolio including servers to address processing demand
• State-of-the-art secure IP driving growth in all markets
• Microelectronics capabilities to expand to chip-scale processing needs
• DMEA-accredited trusted U.S. microelectronics manufacturing
Summary

66© 2019 Mercury Systems, Inc. 66© 2019 Mercury Systems, Inc.
Agenda
• Strategy & Business Update– Mark Aslett
President & CEO
• Defense Industry Update– Dr. Bill Conley
Senior Vice President & CTO
• Growth Strategy in Action– Didier Thibaud
Executive Vice President & COO
• Financial Update– Mike Ruppert
Executive Vice President & CFO
• Q&A
67© 2019 Mercury Systems, Inc.
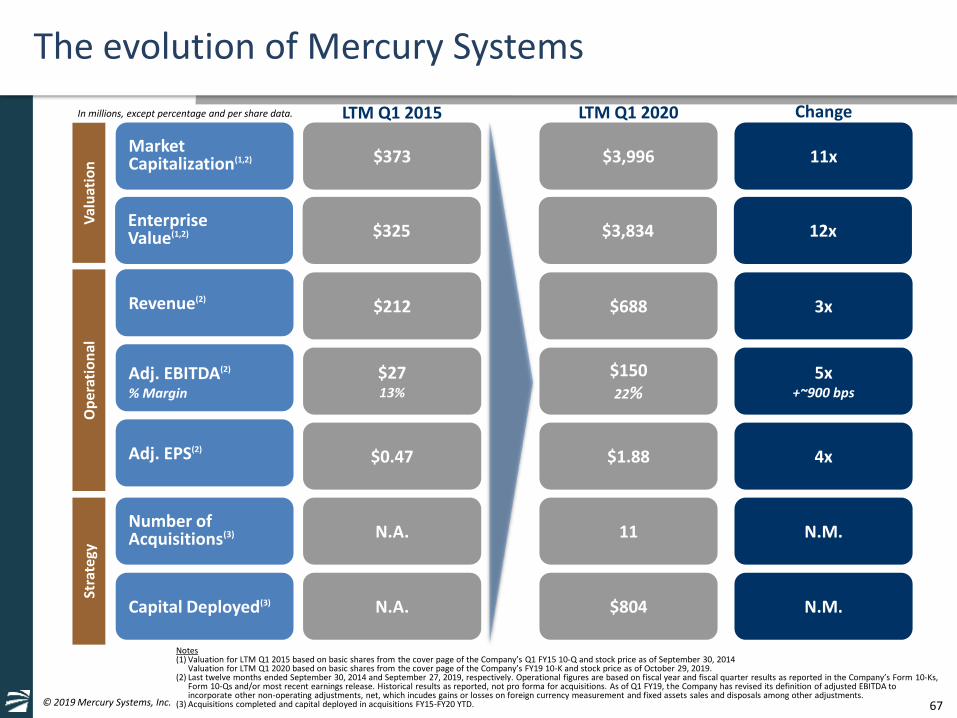
The evolution of Mercury Systems
11xMarket Capitalization(1,2) $373 $3,996
3xRevenue(2)$212 $688
5x+~900 bps
Adj. EBITDA(2)
% Margin
$2713%
$15022%
4xAdj. EPS(2)$0.47 $1.88
Val
uat
ion
Op
erat
ion
al
In millions, except percentage and per share data.
Notes(1) Valuation for LTM Q1 2015 based on basic shares from the cover page of the Company’s Q1 FY15 10-Q and stock price as of September 30, 2014
Valuation for LTM Q1 2020 based on basic shares from the cover page of the Company’s FY19 10-K and stock price as of October 29, 2019.(2) Last twelve months ended September 30, 2014 and September 27, 2019, respectively. Operational figures are based on fiscal year and fiscal quarter results as reported in the Company’s Form 10-Ks,
Form 10-Qs and/or most recent earnings release. Historical results as reported, not pro forma for acquisitions. As of Q1 FY19, the Company has revised its definition of adjusted EBITDA to incorporate other non-operating adjustments, net, which incudes gains or losses on foreign currency measurement and fixed assets sales and disposals among other adjustments.
(3) Acquisitions completed and capital deployed in acquisitions FY15-FY20 YTD.
LTM Q1 2020LTM Q1 2015 Change
N.M.N.A. $804Capital Deployed(3)
Stra
tegy
N.M.N.A. 11Number of Acquisitions(3)
12xEnterpriseValue(1,2) $325 $3,834

68© 2019 Mercury Systems, Inc.
Mercury has delivered strong financial results
Notes: For the fiscal years ended June 30, as reported in the Company’s Form 10-Ks. CAGR figures for the period FY14-FY19. LTM and YoY figures are based on the trailing four fiscal quarters using information reported in the Company’s Form 10-Ks, Form 10-Qs and/or most recent earnings release. Numbers are rounded. Per share data is presented on a fully diluted basis. As of July 1, 2018, the Company has revised its definition of adjusted EBITDA to incorporate other non-operating adjustments, net, which includes gains or losses on foreign currency remeasurement and fixed assets sales and disposals among other adjustments. Adjusted EBITDA for prior periods has been recast for comparative purposes.
209 235270
409
493
655 688
FY14 FY15 FY16 FY17 FY18 FY19 LTMQ1FY20
Revenue
30% YoY
(4.1)
14.4 19.7
24.9
40.9
46.8
58.5
FY14 FY15 FY16 FY17 FY18 FY19 LTMQ1FY20
GAAP Net Income
93% YoY
0.38
0.820.96
1.15
1.42
1.84 1.88
FY14 FY15 FY16 FY17 FY18 FY19 LTMQ1FY20
Adj. EPS
31% YoY
22
4456
93
115
145 150
11%
19% 21% 23% 23% 22% 22%
FY14 FY15 FY16 FY17 FY18 FY19 LTMQ1FY20
Adj. EBITDA
24%YoY
174208
288357
447
625
712
FY14 FY15 FY16 FY17 FY18 FY19 LTMQ1FY20
Backlog
40%YoY
(0.13)
0.44 0.56 0.58
0.86 0.96
1.15
FY14 FY15 FY16 FY17 FY18 FY19 LTMQ1FY20
GAAP EPS
80% YoY

69© 2019 Mercury Systems, Inc.
LTM Q1 FY20 performance
Notes:(1) LTM figures are based on the trailing four fiscal quarters using information reported in the Company’s Form 10-Ks, Form 10-Qs and/or most recent earnings release.(2) Organic revenue represents total company revenue excluding net revenue from acquisitions for the first four full quarters since the entities’ acquisition date (which excludes any
intercompany transactions). After the completion of four fiscal quarters, acquired businesses are treated as organic for current and comparable historical periods.(3) Non-GAAP, see reconciliation table.
In $ millions, except percentage and per share dataLTM
Q1 FY19⁽¹⁾
LTM Q1 FY20⁽¹⁾
Change
Bookings $635.0 $820.0 29%
Book-to-Bill 1.20 1.19
Backlog $507.9 $711.8 40%
12-Month Backlog $377.8 $499.2
Revenue $531.2 $688.0 30%
Organic Revenue Growth(2) 22% 19%
GAAP Net Income $30.4 $58.5 93%
GAAP EPS $0.64 $1.15 80%
Adjusted EPS(3) $1.44 $1.88 31%
Adj. EBITDA(3) $120.9 $150.4 24%
% of Revenue 22.8% 21.9%
Operating Cash Flow $55.3 $101.8 84%
Free Cash Flow(3) $40.1 $69.2 73%

70© 2019 Mercury Systems, Inc.
Q1 FY20 capitalization
In $ millions(1) Actual 9/30/18
Sources and Uses
Actual as of 9/27/19
(3)Free Cash Flow
AcquisitionsOther
FinancingActivities
Cash and cash equivalents 72.9 69.2 (177.3) 196.5 161.3
Long-term debt, including current portion
240.0 - - (240.0) -
Net Debt / (Cash) 167.1 (69.2) 177.3 (436.5) (161.3)
LTM EBITDA 120.9 - - - 150.4
Net Debt (Cash) /LTM EBITDA
1.4x - - - (1.1x)
Notes:(1) Numbers are rounded.(2) Reflects acquisitions of GECO Avionics, LLC, The Athena Group, Inc., Syntonic Microwave, LLC and American Panel Corporation. Also reflects cash acquired in those acquisitions.(3) Reflects repayment of debt with proceeds from the May 2019 common stock offering.

71© 2019 Mercury Systems, Inc.
Total Capital Deployed: $ 804
Mercury recent acquisition history
CompanyExpansion
Primary ThemeClosing
DatePurchase
Price ($M)Ending
Debt Balance Funding
Security Dec-2015 $ 10 $ 0 Cash on Hand
Weapons, EW,Security
May-2016 $ 300 -Term Loan
Cash on Hand
April 2016Equity Offering
($ 93) $ 200 Equity Offering
Platform/Mission, Comm’s
Nov-2016 $ 39 $ 190 Cash on Hand
January 2017Equity Offering
($ 216) $ 0(2)
Equity Offering
EW,Space
Apr-2017 $ 41 $ 0(2)
Cash on Hand
Platform/Mission Jul-2017 $ 6 $ 0 Cash on Hand
C2I, Comm’s
Feb-2018 $ 180 $ 195 Revolver
C2I, Acoustics
Jul-2018 $ 45 $ 240 Revolver
Platform/Mission Jan-2019 $ 37 $ 277 Revolver
Security Apr-2019
$ 46 $ 325 Revolver
EW Apr-2019
May 2019Equity Offering
($ 455) $ 0(3)
Equity Offering
Platform/Mission,Vectronics
Sep-2019 $ 100 $ 0(4) Cash on Hand
Source: Company filings, Company investor presentations (1) Represents carve-out acquisition from Microsemi Corp.(2) On June 27, 2017, Mercury amended its senior secured credit facility, increasing and extending the revolving credit facility and utilizing the January 2017 equity
offering proceeds to repay the remaining principal on the existing term loan.(3) Reflects repayment of debt with proceeds from the May 2019 common stock offering.(4) Acquisition of American Panel Corporation completed on September 23, 2019. ~$161M net cash position as of September 27, 2019.
(1)

72© 2019 Mercury Systems, Inc.
FY20 annual guidance
In $ millions, except percentage and per share data FY19(1) FY20(2)(5) Change
Revenue $654.7 $775.0 - $790.0 18% - 21%
GAAP Net IncomeEffective tax rate(3)
$46.821.4%
$72.9 - $77.826%
56% - 66%
GAAP EPS $0.96 $1.32 - $1.41 38% - 47%Weighted-average diluted shares outstanding 48.5 55.2
Adjusted EPS(4) $1.84 $2.03 - $2.11 10% - 15%
Adj. EBITDA(4)
% of revenue
$145.322.2%
$169.5 - $175.521.9-22.2%
17% - 21%
Notes:(1) FY19 figures are as reported in the Company’s earnings release dated July 30, 2019.(2) The guidance included herein is from the Company’s earnings release dated October 29, 2019. For purposes of modeling and guidance, we have assumed no incremental
restructuring, acquisition, other non-operating adjustments or non-recurring financing-related expenses. (3) The effective tax rate in the guidance included herein excludes discrete items.(4) Non-GAAP, see reconciliation table.(5) Effective as of July 1, 2019, the Company's fiscal year has changed to the 52-week or 53-week period ending on the Friday closest to the last day in June. All references in this
presentation to the second quarter of fiscal 2020 are to the quarter ending December 27, 2019 and to fiscal 2020 are to the fiscal year ending July 3, 2020.
73© 2019 Mercury Systems, Inc.
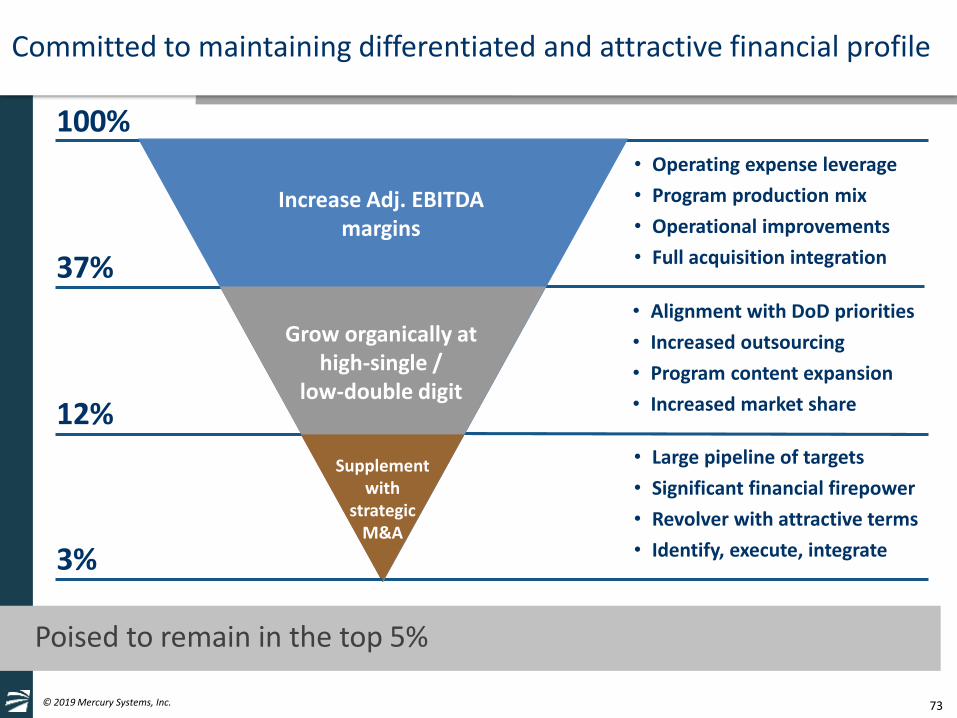
Committed to maintaining differentiated and attractive financial profile
Poised to remain in the top 5%
Supplementwith
strategic M&A
Increase Adj. EBITDA margins
Grow organically at high-single /
low-double digit
• Operating expense leverage
• Program production mix
• Operational improvements
• Full acquisition integration
100%
3%
12%
37%• Alignment with DoD priorities
• Increased outsourcing
• Program content expansion
• Increased market share
• Large pipeline of targets
• Significant financial firepower
• Revolver with attractive terms
• Identify, execute, integrate

74© 2019 Mercury Systems, Inc.
Clear path to increasing Adj. EBITDA margins
• Operating leverage:
– Revenue growing faster than operating expenses
– SG&A declined from 21% of sales in FY15 to 17% in FY19
• Program mix:
– Programs transitioning from development to production
– FY19 47% CRAD increase highlights new start volume
• Operating efficiencies:
– Invested capex in new facilities
– Invested in operations team
• Acquisition integration:
– Track record of synergies
• Prioritizing new design wins
Future
Current
Operating Leverage
ProgramMix
OperatingEfficiencies
Acquisition Integration
Adjusted EBITDA Margin Expansion

75© 2019 Mercury Systems, Inc.
Clear path to continuing above market-average growth rates
Strategy driving above market growth
• Positioned in fast-growing segments of defense electronics market
• Business model facilitates outsourcing trend and content expansion
• Expanding into adjacent markets leveraging technology investments
– C4I 28% of FY19 total revenue vs. 4% in FY14
• Significant investment in trusted microelectronics expected to lead to additional content expansion
ContentExpansion
Custom Microelectronics Enabling Content
Expansion
Sensor and Effector Mission Systems
Tier 2 Market Expansion
C4I Tier 2 Market
Expansion
1
4
23Trusted and
Secure Computing
76© 2019 Mercury Systems, Inc.
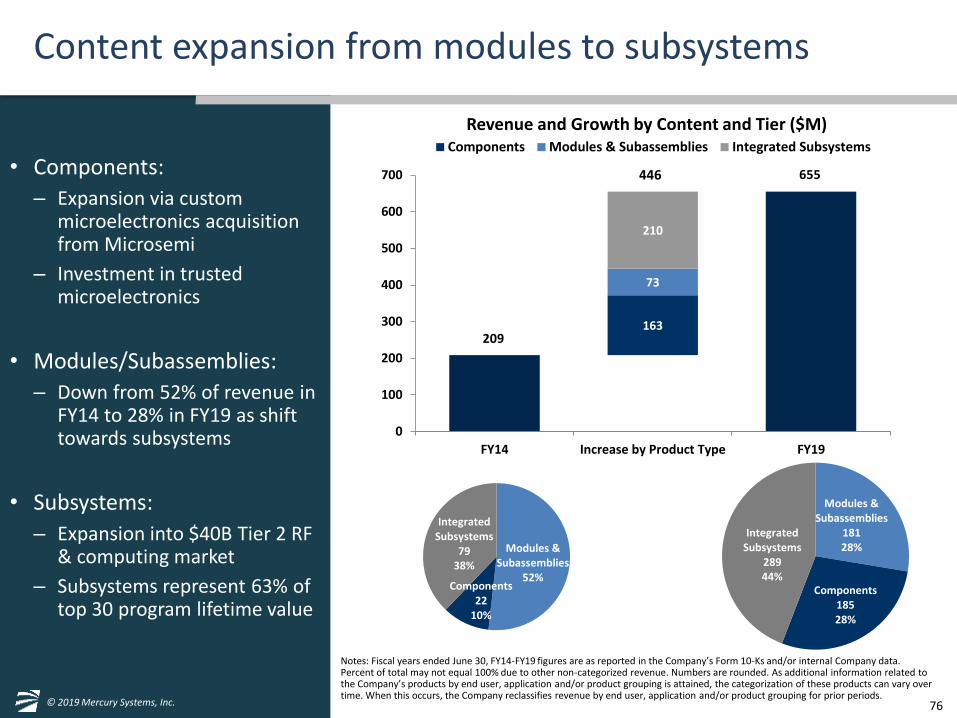
Content expansion from modules to subsystems
• Components:
– Expansion via custom microelectronics acquisition from Microsemi
– Investment in trusted microelectronics
• Modules/Subassemblies:
– Down from 52% of revenue in FY14 to 28% in FY19 as shift towards subsystems
• Subsystems:
– Expansion into $40B Tier 2 RF & computing market
– Subsystems represent 63% of top 30 program lifetime value
Modules & Subassemblies
52%Components
22 10%
Integrated Subsystems
7938%
Modules & Subassemblies
181 28%
Components185 28%
Integrated Subsystems
289 44%
Notes: Fiscal years ended June 30, FY14-FY19 figures are as reported in the Company’s Form 10-Ks and/or internal Company data. Percent of total may not equal 100% due to other non-categorized revenue. Numbers are rounded. As additional information related to the Company’s products by end user, application and/or product grouping is attained, the categorization of these products can vary over time. When this occurs, the Company reclassifies revenue by end user, application and/or product grouping for prior periods.
209
655
163
73
210
0
100
200
300
400
500
600
700
FY14 Increase by Product Type FY19
Revenue and Growth by Content and Tier ($M)Components Modules & Subassemblies Integrated Subsystems
446

77© 2019 Mercury Systems, Inc.
Expanding into new markets
• Continued growth in core markets
• Expansion into adjacent markets and leveraging current capabilities
• Additional capabilities drive content expansion
• Broader program and customer base
• Vastly larger addressable market
• Consistently driving above market growth rates
Notes: Fiscal years ended June 30, FY14-FY19 figures are as reported in the Company’s Form 10-Ks. Weapons revenue is classified within Other Sensor and Effector products which include all Sensor and Effector end markets other than Radar and Electronic Warfare. Percent of total may not equal 100% due to other non-categorized revenue. Numbers are rounded. As additional information related to the Company’s products by end user, application and/or product grouping is attained, the categorization of these products can vary over time. When this occurs, the Company reclassifies revenue by end user, application and/or product grouping for prior periods.
209
655
63
83
175
63
62
0
100
200
300
400
500
600
700
FY14 Increase by Market FY19
Revenue and Growth by Market ($M)Radar EW C4I Weapons Other
446
Radar 101 48%
EW 46
22%
C4I 9
4%
Other 53
26%
Radar164 25%
EW129 20%
C4I183 28%
Weapons64
10%
Other114 17%
78© 2019 Mercury Systems, Inc.
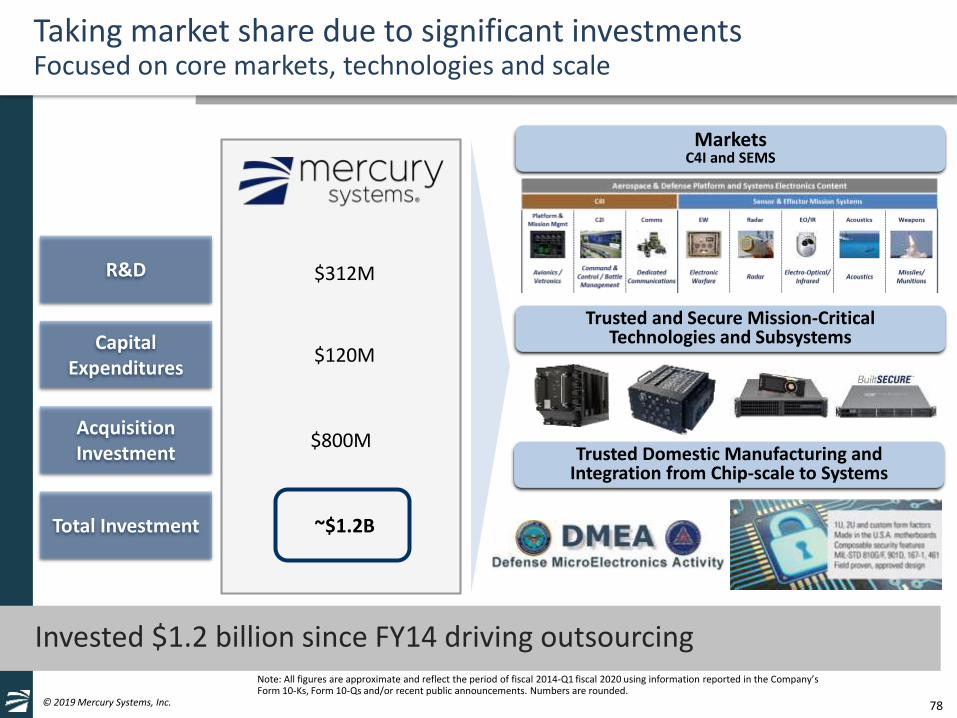
Taking market share due to significant investmentsFocused on core markets, technologies and scale
Invested $1.2 billion since FY14 driving outsourcing
R&D
Note: All figures are approximate and reflect the period of fiscal 2014-Q1 fiscal 2020 using information reported in the Company’s Form 10-Ks, Form 10-Qs and/or recent public announcements. Numbers are rounded.
Capital Expenditures
Acquisition Investment
Total Investment
$312M
$120M
$800M
~$1.2B
MarketsC4I and SEMS
Trusted and Secure Mission-CriticalTechnologies and Subsystems
Trusted Domestic Manufacturing andIntegration from Chip-scale to Systems
79© 2019 Mercury Systems, Inc.
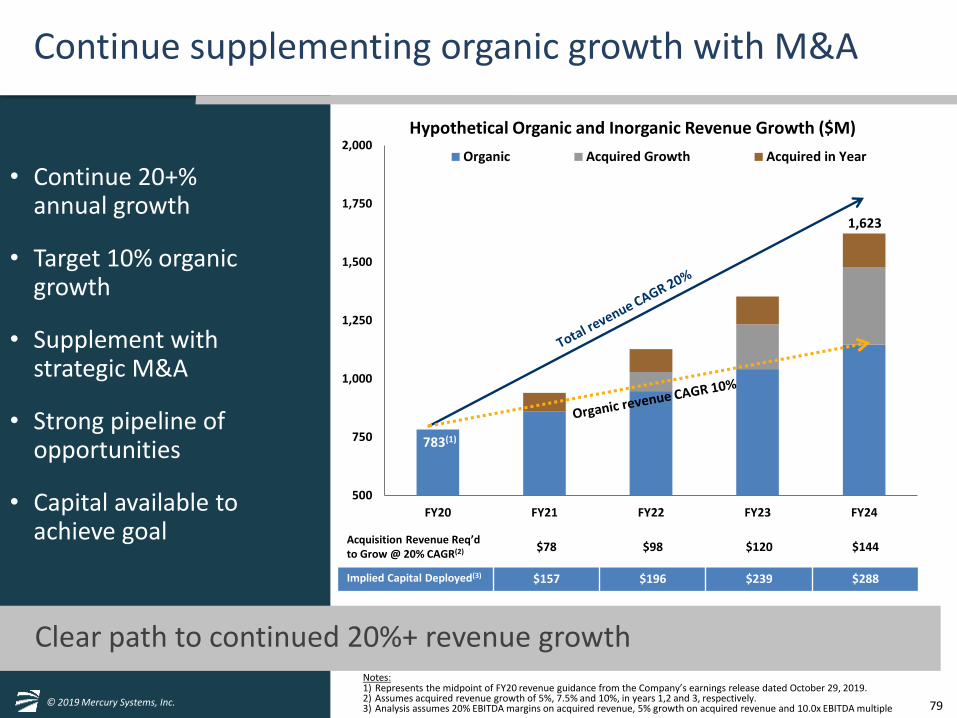
Clear path to continued 20%+ revenue growth
Continue supplementing organic growth with M&A
• Continue 20+%annual growth
• Target 10% organic growth
• Supplement withstrategic M&A
• Strong pipeline of opportunities
• Capital available to achieve goal
500
750
1,000
1,250
1,500
1,750
2,000
FY20 FY21 FY22 FY23 FY24
Hypothetical Organic and Inorganic Revenue Growth ($M)
Organic Acquired Growth Acquired in Year
Acquisition Revenue Req’d to Grow @ 20% CAGR(2) $78 $98 $120 $144
Implied Capital Deployed(3) $157 $196 $239 $288
Notes:1) Represents the midpoint of FY20 revenue guidance from the Company’s earnings release dated October 29, 2019.2) Assumes acquired revenue growth of 5%, 7.5% and 10%, in years 1,2 and 3, respectively.3) Analysis assumes 20% EBITDA margins on acquired revenue, 5% growth on acquired revenue and 10.0x EBITDA multiple
783(1)
1,623

80© 2019 Mercury Systems, Inc.
As we expand inorganically into new markets…
…our M&A pipeline continues to grow significantly
Sensor & Effector Mission Systems
Tier 2 Market$17.4B
C3ITier 2 Market
$15.5B
Platform and Mission MgmtTier 2 Market
$7.1B

81© 2019 Mercury Systems, Inc.
M&A is an integral part of our model
Our strategy contemplated M&A at the outset for this ‘environment’M&AVision
Dedicated M&A team to identify and originate proprietary deals
Superior in-house market, technical and business diligence capabilities supplemented with external objective advisors and analysis
Sophisticated internal M&A, finance and legal expertise capable of valuing and executing public, private and carve out M&A transactions
In-house M&A, finance and legal teams supplemented with top tier investment banking relationships for debt and equity transactions
Full in-house business process and systems integration team
Origination
Diligence
Execution
Financing
Integration
Mercury management system to achieve value creation blueprint (cost and revenue synergies) and ongoing performance improvements
Management

82© 2019 Mercury Systems, Inc.
We have created significant value through M&A
FY16 and FY17 FY18 and FY19 FY19 and FY20 YTD
Acquisitions
Purchase Price $396M $225M $183M
EV / EBITDA
Avg. Mkt.(1) 11.6x 13.4x 11.6x
@ Close(2) 10.2x 12.4x 10.4x
PFw/Synergies(3) 7.3x 9.2x 10.4x
FY19(4) 6.8x 8.4x (strong FY20 performance YTD)
Commentary
• Accelerated growth rate due to sales channel expansion and additional R&D investment
• Strong growth driven by security, trust and demand for safety-critical avionics
• Realizing cost synergies from West Coast AMC build-out & USMO
• Created rugged server platform to access C4I programs in air, on ground, on sea and underwater
• Integration complete – platform exceeding plan for growth and profitability
• Scaled safety-critical avionics platform
• Capability tuck-ins in embedded security and RF/EW poised to drive growth
• Opportunity for synergistic M&A
(1) Per Factset. Average next twelve months EV/EBITDA for the defense primes over the twelve month period from July 1 to June 30 in the period indicated. Primes index includes LMT, RTN, NOC, GD.(2) Represents purchase price divided by the Adj. EBITDA used for the basis of valuation at the time of deal announcement net of estimated present value of tax benefits at the time of deal
announcement, as applicable.(3) Represents purchase price at close net of estimated present value of tax benefits and estimated future annual run-rate cost synergies at the time of deal announcement.(4) Represents purchase price net of estimated present value of tax benefits at time of deal announcement divided by the estimated Adj. EBITDA for FY19 associated with the listed acquisitions.
Germane Systems presented pro forma for full year FY19 contribution. LIT and Microsemi Security Solutions excluded as these acquisitions are immaterial

83© 2019 Mercury Systems, Inc. 83
Strategy and business model delivering financial performance well above industry average
Track record of strong organic growth, profitability and strategic M&A
Significant investment over last 5 years competitive differentiator
Poised for continued organic growth and margin expansion
Well positioned for future M&A with strong pipeline and financial flexibility
Clear strategy to continue to maintain unique financial profile

© 2019 Mercury Systems, Inc.
Q&A
Thank you for attending our FY20 Investor Day!

© 2019 Mercury Systems, Inc.
Appendix

86© 2019 Mercury Systems, Inc.
Balance sheet
As of
(In $ millions)(1) 9/30/18 12/31/18 3/31/19 6/30/19 9/27/19
ASSETS
Cash & cash equivalents $72.9 $93.9 $112.5 $257.9 $161.3
Accounts receivable, net 153.9 168.3 170.7 176.2 177.5
Inventory, net 121.2 126.4 131.7 137.1 148.5
PP&E, net 50.8 53.1 55.9 60.0 65.9
Goodwill and intangibles, net 704.2 696.3 724.3 768.3 847.4
Other(2) 24.0 18.6 17.3 17.4 73.3
TOTAL ASSETS $1,127.0 $1,156.6 $1,212.4 $1,417.0 $1,473.9
LIABILITIES AND S/E
AP and accrued expenses(2) $61.2 $70.7 $83.1 $86.7 $84.8
Other liabilities(2) 49.2 49.9 40.4 45.5 93.7
Debt 240.0 240.0 276.5 - -
Total liabilities 350.4 360.6 400.0 132.2 178.5
Stockholders' equity 776.6 796.1 812.4 1,284.7 1,295.3TOTAL LIABILITIES AND S/E $1,127.0 $1,156.6 $1,212.4 $1,417.0 $1,473.9
Notes:(1) Rounded amounts used(2) Effective July 1, 2019, the Company has adopted ASC 842 - Leases using the optional transition method. Prior periods were not changed. As a result of this adoption, the Company has recorded
Right-of-use assets of $51.3 million, which is included in Other assets and total Lease liabilities of $60.2 million, of which $7.1 million is included in Accrued Expenses and $53.1 million is included in Other liabilities, as of September 27, 2019.

87© 2019 Mercury Systems, Inc.
Cash flow summary
For the Fiscal Quarters Ended
(In $ millions)(1) 9/30/18 12/31/18 3/31/19 6/30/19 9/27/19
Net Income $7.5 $12.4 $14.1 $12.8 $19.2
Depreciation and amortization 11.5 11.7 11.6 11.6 11.4
Other non-cash items, net 5.5 4.6 6.3 5.1 6.4
Changes in Operating Assets and Liabilities
Accounts receivable, unbilled receivables, and costs in excess of billings
(5.9) (15.0) (1.2) (6.0) 2.2
Inventory (4.6) (4.9) (4.0) (3.3) 0.4
Accounts payable and accrued expenses (2.0) 9.2 8.0 2.7 (6.3)
Other 8.0 7.3 (8.6) (2.2) (9.0)
(4.5) (3.4) (5.8) (9.0) (12.8)
Operating Cash Flow 20.0 25.3 26.2 26.0 24.3
Capital expenditures (3.7) (7.1) (7.1) (8.8) (9.6)
Free Cash Flow(2) $16.3 $18.2 $19.2 $17.1 $14.7Free Cash Flow(2) / Adjusted EBITDA(2) 52% 49% 49% 45% 40%
Free Cash Flow(2) / GAAP Net Income 218% 147% 136% 134% 76%
Notes:(1) Rounded amounts used.(2) Non-GAAP, see reconciliation table.

88© 2019 Mercury Systems, Inc.
Adjusted EPS reconciliation
(In thousands, except per share data) Q1 FY19 Q1 FY20 LTM Q1 FY19 LTM Q1 FY20 Low High Low High
Earnings per share(1) 0.16$ 0.35$ 0.64$ 1.15$ 0.25$ 0.28$ 1.32$ 1.41$
Net Income 7,479$ 19,247$ 30,409$ 58,543$ 13,900$ 15,400$ 72,900$ 77,800$
Amortization of intangible assets 7,181 7,019 27,548 27,752 7,900 7,900 30,400 30,400
Restructuring and other charges 504 648 3,568 704 - - 600 600
Impairment of long-lived assets - - - - - - - -
Acquisition and financing costs 1,043 2,236 5,117 10,821 800 800 4,500 4,500
Fair value adjustments from purchase accounting 620 - 2,103 93 - - - - Litigation and settlement expense, net - 313 - 657 - - 300 300
Stock-based and other non-cash compensation expense 4,743 5,776 17,662 20,654 6,400 6,400 25,400 25,400
Impact to income taxes(3) (3,073) (10,849) (18,391) (24,328) (3,900) (3,900) (22,300) (22,800)
Adjusted income 18,497$ 24,390$ 68,016$ 94,896$ 25,100$ 26,600$ 111,800$ 116,200$
Adjusted earnings per share(1)
0.39$ 0.44$ 1.44$ 1.88$ 0.46$ 0.48$ 2.03$ 2.11$
Weighted-average shares outstanding:
Basic 47,048 54,388
Diluted 47,697 55,078 55,000 55,000 55,200 55,200
Notes:
(1) Per share information is presented on a fully diluted basis.
(2) Rounded amounts used.
Q2 FY20(2)(4)
FY20(2)(4)
(3) Impact to income taxes is calculated by recasting income before income taxes to include the add-backs involved in determining adjusted income and recalculating the income
tax provision using this adjusted income from operations before income taxes. The recalculation also adjusts for any discrete tax expense or benefit related to the add-backs.
(4) Effective as of July 1, 2019, the Company's fiscal year has changed to the 52-week or 53-week period ending on the Friday closest to the last day in June. All references in this
presentation to the second quarter of fiscal 2020 are to the quarter ending Decemberr 27, 2019 and to fiscal 2020 are to the fiscal year ending July 3, 2020.

89© 2019 Mercury Systems, Inc.
Adjusted EBITDA reconciliation
(In thousands) Q1 FY19 Q1 FY20 LTM Q1 FY19 LTM Q1 FY20 Low High Low High
Net Income 7,479$ 19,247$ 30,409$ 58,543$ 13,900$ 15,400$ 72,900$ 77,800$
Other non-operating adjustments, net(1)
365 301 (652) 300 - - 300 300
Interest (income) expense, net 2,193 (1,187) 5,027 4,797 (500) (500) (2,800) (2,800)
Income tax (benefit) provision 3,129 (2,018) 13,200 7,605 4,900 5,400 17,100 18,200
Depreciation 4,365 4,362 16,938 18,475 5,100 5,100 20,800 20,800
Amortization of intangible assets 7,181 7,019 27,548 27,752 7,900 7,900 30,400 30,400
Restructuring and other charges 504 648 3,568 704 - - 600 600
Impairment of long-lived assets - - - - - - - -
Acquisition and financing costs 1,043 2,236 5,117 10,821 800 800 4,500 4,500
Fair value adjustments from purchase accounting 620 - 2,103 93 - - - -
Litigation and settlement expense, net - 313 - 657 - - 300 300
Stock-based and other non-cash compensation expense 4,743 5,776 17,662 20,654 6,400 6,400 25,400 25,400
Adjusted EBITDA 31,622$ 36,697$ 120,920$ 150,401$ 38,500$ 40,500$ 169,500$ 175,500$
Notes:
(3) Effective as of July 1, 2019, the Company's fiscal year has changed to the 52-week or 53-week period ending on the Friday closest to the last day in June. All
references in this presentation to the second quarter of fiscal 2020 are to the quarter ending December 27, 2019 and to fiscal 2020 are to the fiscal year ending July 3,
2020.
Q2 FY20(2)(3)
FY20(2)(3)
(2) Rounded amounts used.
(1) As of July 1, 2018, the Company has revised its definition of adjusted EBITDA to incorporate other non-operating adjustments, net, which includes gains or losses on
foreign currency remeasurement and fixed assets sales and disposals among other adjustments. Adjusted EBITDA for prior periods has been recast for comparative
purposes.

90© 2019 Mercury Systems, Inc.
Free cash flow reconciliation
(In thousands) Q1 FY19 Q1 FY20 LTM Q1 FY19 LTM Q1 FY20
Cash provided by operating activities $ 20,029 $ 24,310 $ 55,322 $ 101,798
Purchases of property and equipment (3,727) (9,595) (15,205) (32,559)
Free cash flow 16,302$ 14,715$ 40,117$ 69,239$

91© 2019 Mercury Systems, Inc.
Organic revenue reconciliation
(In thousands) Q1 FY19 Q1 FY20 LTM Q1 FY19 LTM Q1 FY20
Organic revenue(1) $ 135,062 $ 158,053 $ 522,177 $ 622,087
Acquired revenue 8,994 19,251 8,994 65,905
Net revenues 144,056$ 177,304$ 531,171$ 687,992$
Notes:
(1) Organic revenue represents total company revenue excluding net revenue from acquisitions for the first four full quarters since the
entities’ acquisition date (which excludes any intercompany transactions). After the completion of four fiscal quarters, acquired
businesses are treated as organic for current and comparable historical periods.

92© 2019 Mercury Systems, Inc.
Glossary
AEGIS Aegis Ballistic Missile Defense System EO/IR Electro-optical / Infrared NTCD Non-traditional Defense Contractor
AESA Active Electronically Scanned Array EP Electronic Protection O&M Operations & Maintenance
AMC Advanced Microelectronics Center ES Electronic Support OpenVPXSystem-level specification for VPX, initiated by Mercury
BCA Budget Control Act EW Electronic Warfare OTA Other Transaction Authority
C2I Command, Control, Intelligence FMS Foreign Military Sales PBR President's Budget Request
C3ICommand, Control, Communications, Intelligence
FPGA Field Programmable Gate Array PGK Precision Guidance Kit
C4ISRCommand, Control, Communications, Computers, Intelligence, Surveillance, Reconnaissance
GAM Global Account Manager RF Radio Frequency
CDS Common Display System GPU Graphics Processing Unit RoW Rest of World
COTS Commercial off-the Shelf HEL High Energy Laser SEMS Sensor and Effector Mission Systems
CPS Common Processing System HPM High Power Microwave SEWIPSurface Electronic Warfare Improvement Program
CPU Central Processing Unit IMA Integrated Microwave Assembly SIGINT Signals Intelligence
DAL Design Assurance Level IRAD Internal Research And Development SM Standard Missile
DFARSDefense Federal Acquisition Regulation Supplement
JLTV Joint Light Tactical Vehicle SSEE Ship's Signal Exploitation Equipment
DMEA Defense Microelectronics Activity LRU Line Replaceable Unit SWaP Size Weight and Power
DRFM Digital Radio Frequency Memory LTAMDSLower Tier Air and Missile Defense System
UAM Urban Air Mobility
EA Electronic Attack MALD Miniature Air Launched Decoy UAV Unmanned Aerial Vehicle
EDM Engineering Data Management MMA Multimission Maritime Aircraft USMO US Manufacturing Operations
EM Electromagnetic MRTT Multi Role Tanker Transport WIN-T Warfighter Information Network-Tactical