mercury use in the goldmining industry - massey university · mercury use in the goldmining...
TRANSCRIPT

Copyright is owned by the Author of the thesis. Permission is given for a copy to be downloaded by an individual for the purpose of research and private study only. The thesis may not be reproduced elsewhere without the permission of the Author.

Mercury Use in the GoldminingIndustry
A retrospective examination of elementalmercury use in the gold mining industry of the
West Coast of New Zealand in the period1984 – 1988.
A thesis submitted in partial fulfilment of the requirement for the degree of
Master of Philosophy(Science)
AtMassey University
WellingtonNew Zealand
By
Vernon Claude Newcombe
2008

ii
Acknowledgements.
I would like to thank my Supervisors Associate Professor Philip Dickinson and
Mr Stuart McLaren of Massey University for their support and advice.
My thanks also go to Dr. Cheryl Brunton, Medical Officer of Health, West
Coast for her support.
I am indebted to my employer, Community & Public Health, a department of
the Canterbury District Health Board for allowing me the time to research the
thesis.
Massey University Human Ethics Committee:
This project has been evaluated by peer review and judged to be low risk.
Consequently it has not been reviewed by one of the University’s Human
Ethics Committees. The researcher named above is responsible for the
ethical conduct of this research.
If you have any concerns about the conduct of this research that you wish to
raise with someone other than the researcher, please contact Professor
Sylivia Rumball, Assistant to the Vice-chancellor (Ethics & Equity), telephone
06.3505249, e-mail [email protected].

iii
Contents:
Contents……………………………………………………………………page iii
Figures……………………………………………………………………..page viii
Tables…………………………………………………………………….. page x
Glossary……………………………………………………………………page xi
Properties of mercury……………………………………………………..page xviii
Executive summary……………………………………………………….page 2
Chapter 1. Introduction ….…………………………………………….....page 6
1.1. Outline of thesis………………………………………………page 8
1.2. Literature search……………………………………………..page 9
1.3. Methodology………………………………………………….page 9
1.4. Results………………………………………………………...page 9
1.5. Discussion…………………………………………………….page 9
1.6. Conclusion…………………………………………………….page 9
1.7. Recommendation…………………………………………….page 10
1.8. Limitations…………………………………………………….page 10
1.9. Future research………………………………………………page 10

iv
Chapter 2. Introduction to the West Coast .…………………………….page 11
2.1. West Coast land mass……………………………………….page 12
2.2. Climate………………………………………………………...page 13
2.3. Land coverage………………………………………………...page 14
2.4. Minerals ………………………………………………………..page 15
2.5. Mining ………………………………………………………….page 17
2.6. Economy ………………………………………………………page 19
Chapter 3. Gold …..………………………………………………………...page 20
3.1. The metal……………………………………………………….page 20
3.2. Location of gold ………………………………………………page 21
3.3. Demand ………………………………………………………page 22
3.4. Modern mining ………………………………………………..page 22
3.5. Treatment of gold wash……………………………………….page 28
3.6. Retort process ………………………………………………..page 29
Chapter 4. Mercury …..…………………………………………………….page 31
4.1. History of mercury……………………………………………..page 31
4.2. Alchemy ………………………………………………………..page 32
4.3. Historical use…………………………………………………..page 33
4.4. Contamination…………………………………………………page 34
4.5. Mercury impact ………………………………………………..page 39
4.6. Mercury uses…………………………………………………..page 43
4.7. Mercury properties…………………………………………….page 46
4.7.1. The metal…………………………………………….page 46
4.7.2. Chemical properties ……………………………….page 46
4.7.3. Occurrence ………………………………………….page 47
4.7.4. Chemical state………………………………………page 48
4.8. Production of mercury …………………………………….….page 49
4.8.1. Source……………………………………………..…page 49
4.8.2. Process……………………………………………….page 49

v
Chapter 5.Toxicity …………………………………………………………page 53
5.1. Hazard ……………………………………………………….page 53
5.2. Psychological effects ……………………………………….page 54
5.3. Dose……………………………………………………………page 55
5.4. Body burden…………………………………………………..page 56
5.5. Absorbtion……………………………………………………. page 57
5.6. Carcinogenicity ……………………………………………….page 59
5.7. Dermal ……………………………………………………….page 60
5.8. Excretion……………………………………………………….page 61
5.9. Acute poisoning……………………………………………….page 62
5.9.1. Mercury poisoning cases…………………………………..page 62
Chapter 6. Environment …………………………………………………..page 64
6.1. General………………………………………………………...page 64
6.2. Airborne mercury……………………………………………..page 64
6.3. Pollutant ……………………………………………………….page 66
6.4. Mining………………………………………………………….page 67
6.5. Artisanal ……………………………………………………….page 68
6.6. Food chain…………………………………………………….page 69
6.7. Atmospheric mercury ……………………………………….page 71
6.7.1. Mercury cycle……………………………………….page 71
6.7.2. Anthropogenic pollution……………………………page 74
6.7.3. Speciation…………………………………………...page 75
Chapter 7. Amalgamation………………………………………………….page 77
7.1. History…………………………………………………………..page 77
7.2. Theory of amalgamation ……………………………………..page 77
7.3. New Zealand mine & amalgamation………………………...page 82
Chapter 8. Objectives ……………………………………………………..page 83
8.1. General…………………………………………………………page 83
8.2. Specific objectives…………………………………………….page 83

vi
Chapter 9. Health & safety ………………………………………………page 84
9.1. General……………………………………………………….page 84
9.2. Occupational safety…………………………………………page 84
9.2.1. Legislation………………………………………….page 84
9.2.2. Administration……………………………………...page 85
9.2.3. Compliance…………………………………………page 87
9.2.4. Current legislation…………………………………page 88
Chapter 10. Methodology …..……………………………………………page 92
10.1. General………………………………………………………page 92
10.2. Cohort………………………………………………………..page 94
10.3. Control……………………………………………………….page 95
10.4. Observation ………………………………………………page 95
10.5. Biological sampling ………………………………………page 96
10.6. Urinalysis…………………………………………………….page 97
10.7. Literature search……………………………………………page 98
10.8. Questionnaire ………………………………………………page 98
10.9. Employee discussion………………………………………page 99
10.10. Environmental monitoring ………………………………page 99
10.11. Mercury meter……………………………………………..page 100
10.12. Personal dose badges……………………………………page 102
10.13. Dräger & smoke tubes……………………………………page 104
10.14. Air flow……………………………………………………..page 105
10.14.1. Anemometers.………………………………….page 105
10.14.2. Smoke tubes..…………………………………..page 106
Chapter 11. Results ….…………………………………………………..page 108
11.1. General………………………………………………………page 108
11.2. Personal protective equipment……………………………page 108
11.2.1. Masks...……………………………………………page 109
11.2.2. Clothing……………………………………………page 110
11.3. Change/wash rooms……………………………………….page 114
11.4. Work rooms….……………………………………………...page 114

vii
11.5. Ventilation…………………………………………………...page 116
11.6. Mercury in air measurement……………………………....page 119
11.6.1. Work room air measurement…………………....page 120
11.6.2. Non–retort air measurement…………………….page 122
11.6.3. Retort air measurement………………………….page 124
11.6.4. Breathing zone monitoring………………………page 127
11.7. Off site contamination………………………………………page 128
11.8. Mercury in urine levels……………………………………..page 130
11.8.1 Biological exposure indices. BEI…………………page 130
11.8.2 Non retort urine results…………………………...page 132
11.8.3. Retort operator urine results………………….…page 142
11.8.4. Controls urine results…………………………….page 154
11.8.5. Questionnaire……………………………………..page 155
Chapter 12. Discussion ..…………………………………………………page 160
12.1. General………………………………………………………page 160
12.2. Mercury in air & mercury urine relationship……………...page 169
12.3. Microenvironment…………………………………………..page 172
12.4. Questionnaire ………………………………………………page 175
12.5. Environmental pollution…………………………………….page 178
Chapter 13. Conclusions …………………………………………………page 182
13.1. General………………………………………………………page 182
13.2. Specific………………………………………………………page 183
Chapter 14. Recommendations …………………………………………page 187
14.1. General………………………………………………………page 187
14.2. Specific………………………………………………………page 191
Chapter 15. Limitations and bias ……..………………………………..page 193
15.1. Limitations…………………………………………………..page 193
15.2. Bias………………………………………………………….page 195

viii
Chapter 16. Areas for additional research ..…………………………..page 197
16.1. Gaps……………………………………………………….. page 197
References………………………………………………………………..page 199
Appendices ………………………………………………………………page 214
Appendix 1. Mercury questionnaire…………………………….page 214Appendix 2. Mercury vapour analyzer…………………………..page 215Appendix 3. Mercury material safety data sheet……………….page 216
Figures.
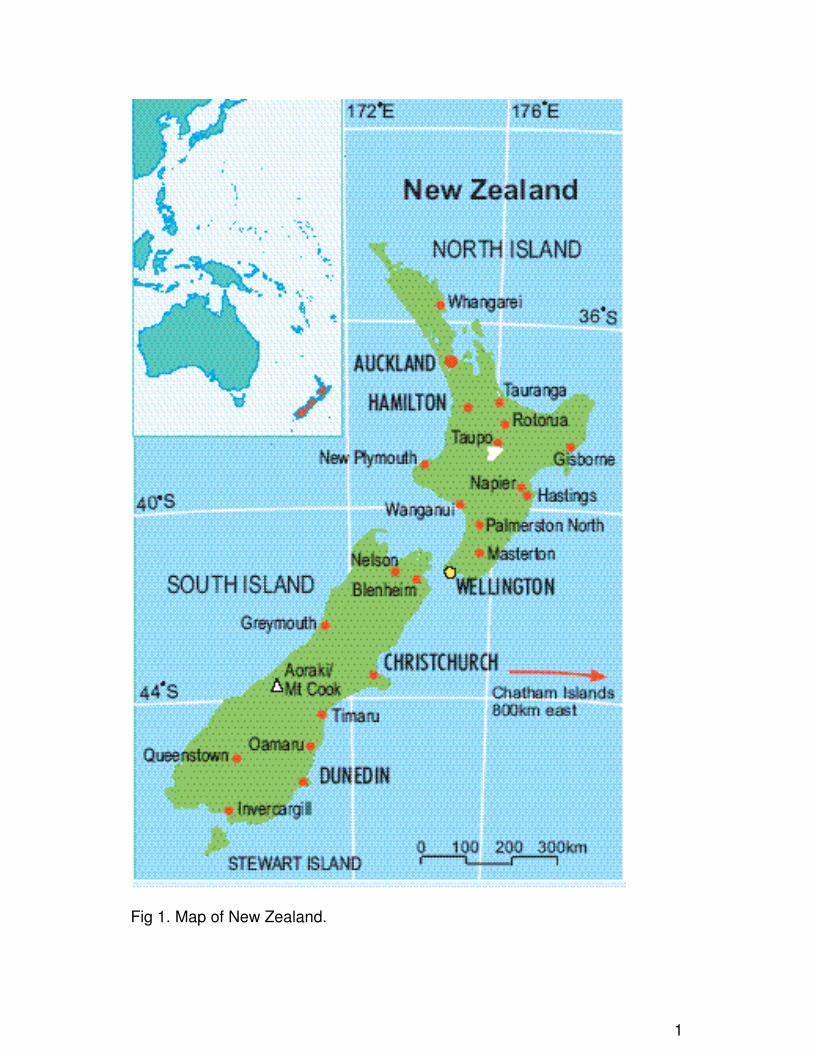
Fig.1. Map of New Zealand…………………………………….…page 1
Fig.2. Map of the gold mining area of the Westcoastcovered by this study……………………………………...page 11
Fig.3. West Coast land cover……………………………………page 14
Fig. 4. Value of minerals to New Zealand economy 1860-2004……………………………………….page 16
Fig.5. Total gold production in New Zealand 1855 to 1995. ……………………………………………page18
Fig. 6. Small gold nuggets……………………………………….page 21
Fig.7. Floating gold screen…………………………………… page 26
Fig.8. Gold mining process……………………………………..page 27
Fig.9. Retorting process ……………………………………….page 28
Fig.10. Retort diagram…………………………………………..page 29
Fig.11. Retort in use………………………………………………page 30
Fig.12. Alchemy sign………………………………………………page 32
Fig.13. Map of mercury sources in New Zealand………………page 42
Fig.14. Mercury production diagram……………………………..page 52
Fig 15. Total global mercury emissions………………………….page 65

ix
Fig.16. Food chain biomagnifications……………………………page 70
Fig.17. Mercury cycle……………………………………………....page 73
Fig 18. Mercury global emissions …………………………….…..page 75
Fig. 19a. Diagram of gold saving process………………………..page 79
Fig.19b. Use of mercury plates……………………………………page 80
Fig. 20. Mercury lapel badge……………………………………...page 102
Fig. 21. Dräger tubes………………………………………………page 104
Fig. 22. Smoke tube kit...………………………………………….page 107
Figs. 23-25. Graphs of workplace equipment use……………..page 113
Figs. 26-29. Graphs of standard of workplaces……………..…page 115-116
Fig. 30. Ventilation graph………………………………………….page 117
Fig. 31. Graph of non-retort mercury handlers urine analysis levels 1988-1988…………………page 133
Figs. 32-39. Graphs of individual non-retort mercury handlers results 1984-1988 …………………………page 134-141
Fig. 40. Graph of retort mercury handlers urinary levels 1984-1988 …………………………………………page 143
Figs. 41-48. Graphs of individual retort mercury handlers results 1984-1988…………………page 144-151
Fig. 49. Graph of normal/action/suspension levels of workers 1984-1988 & totals…….……………..page 152
Fig. 50. Graph of % of total urinary mercury samples ………....page 153
Fig. 51. Graph of number of study participants from total workforce…………………………………………….page 154
Fig. 52. Graph of control mean/min/max urinary mercury levels……………………………………………..page 155
Fig 53. Graph of control and worker subjective response to questionnaire 1986-88…………………….page 159

x
Tables.
Table 1. Vapour pressure saturation concentration of mercury ………………………...page 47
Table 2. Absorption of mercury by route of contact………page 58
Table 3. Estimated average daily intake of mercury .. ……………………………………….page 61
Table 4. Grab sample results for non-retortmercury in air measurements……………………page 123
Table 5. Grab sample results for retortmercury in air measurements…………………….page 125
Table 6. Range and mean of individual mercury In air measurements………………………………page 126
Table 7. Dosimeter results for mercury in air …………….page 127
Table 8. Non workroom mercury in air measurement…..page 129
Table 9. Questionnaire results for action level……………page 157
Table 10. Questionnaire results for suspension level……..page 157
Table 11. Questionnaire results for controls ………………page 158
Table 12. Total subjective responses toquestionnaire by all participants…………………page 158

xi
Glossary.
The terms, acronyms and abbreviations below appear in this document.
< - Less than;
> - Greater than;
°C - Degree Celsius [centigrade];
µg – microgram [10-6 gram];
µg/kg body weight per day – Micrograms per kilogram body weight per day;
units used for describing intakes (or doses) of mercury such as intakes that
are considered safe for humans.
µmol - micromole is 1 millionth of a mole;
ADI - Acceptable daily intake;
AMAP - The Arctic Monitoring and Assessment Programme;
ATSDR – USA Agency for Toxic Substances and Disease Registry;
Balance - Totality of quantitative estimates of input and output substance
fluxes for a given geophysical reservoir or societal entity;
bw - Body weight;
Dry deposition – The transport of trace gases and particles to the earth's
surface which is an important loss process for many reactive and soluble
trace gases. It is of a continuous character independent of the occurrence or
absence of atmospheric precipitation;

xii
EC – European Community. Now called European Union with 27 member
states.
EMEP – Co-operative Programme for Monitoring and Evaluation of the Long-
Range Transmission of Air Pollutants in Europe (under the LRTAP
Convention);
ESP – Electrostatic precipitator; equipment used to reduce emissions of
certain pollutants from combustion flue gases;
FAO – Food and Agriculture Organization;
FF - Fabric filter; filter type used to capture particulate matter (here: from
combustion flue gases);
FGD – Flue gas desulphurization; process of/equipment for primarily
minimizing emissions of sulphur from combustion flue gases;
GEF - Global Environment Facility;
Hg – Mercury;
Hg0 - Elemental mercury;
Hg2+ - Divalent mercury - the dominating mercury form in organic and
inorganic mercury compounds. In the atmosphere, mercury species with
divalent mercury are more easily washed out of the air with precipitation and
deposited than elemental mercury;
Hgp - Particulate mercury - mercury bound in, or adsorbed on, particulate
material. In the atmosphere, particulate mercury is deposited much faster than
elemental mercury;
IARC - International Agency for Research on Cancer;
ILO - International Labor Organization;
IPCS – International Programme on Chemical Safety;

xiii
kg – kilogram;
l or L – Litre;
LC50 - Lethal concentration, 50%; concentration of toxic substance in a
medium (for example water) at which 50% of the individuals in the toxicity test
sample die; a unit used to describe the level of toxicity of a substance to a
specific species, for example fish;
LD50 - Lethal dose, 50%; dose (intake) of a toxic substance at which 50% of
the individuals in the toxicity test sample die; a unit used to describe the level
of toxicity of a substance to a specific species, for example in laboratory tests
on mice, birds or other animals;
Life-time - In atmospheric physio-chemistry: Time during which the first order
processes (or totality of the first order processes) of scavenging results in
mercury species mass reduction in e times in a geophysical reservoir; for a
reservoir with homogeneous mercury species distribution the life-time is equal
to the ratio of the mass contained in the reservoir to scavenging rate. Since
the mass of mercury in the reservoir left to be reacted or removed decreases
over time, the amount reacted or removed per unit of time decreases in a
natural logarithmic fashion. For example, a lifetime of mercury of one year,
does not mean that it would all be gone in one year if emissions were zero. It
means that the rate of removal at the start of the time period in terms of mass
per unit time would remove it all in one year, but since the rate of removal
decreases as the mass of mercury left decreased, the amount of mercury left
after one year would be (1/e) times the initial mass, where "e" is 2.71828183
defined to 8 decimals. In descriptions of life-cycles of products: The time
span from when the product is put into use (usually time of purchase) until it is
no longer used or discarded;
LNB – Low-NOx burner; utility boiler combustion technology designed
specifically to generate relatively low levels of nitrogen oxides;

xiv
Load - The intensity of input of pollutants to a given ecosystem from the
environment; atmospheric load - the intensity of input from the atmosphere;
LOEL - Lowest observed effect level (also called LOAEL – lowest observed
adverse effect level); for toxic or other effects imposed on organisms or
experienced by humans;
LRTAP Convention – Convention on Long-Range Transboundary Air
Pollution;
MBL – Marine boundary layer; the air right over the ocean surface, where
exchange of mercury between the two compartments takes place;
MethylHg or MeHg – Methyl mercury;
Metric ton or tonne – 1000 kg;
mg – milligram (10-3 gram);
Mol or mole - is the atomic weight of a molecule of the chemical in grams.
E.g. 1 mole of mercury is 200.59g.
MRL – Minimum risk level; term used in evaluation of risk of toxic effects from
various chemicals (such as methylmercury) on humans; the MRL is defined
by US ATSDR as an estimate of the level of human exposure to a chemical
that does not entail appreciable risk of adverse non-cancer health effects (see
section 4.2);
MSW – Municipal solid waste;
MW – Megawatt a unit of electrical power;
MWC – Municipal waste combustor;

xv
MWh – Megawatt-hour is a unit of energy most commonly used to express
amounts of energy.
Natural emission - Input to the atmosphere, which is not connected with
current or previous human activity;
NEMA – National Electrical Manufacturers Association (in the USA)
ng – nanogram (10-9 gram);
NGO - Non-governmental organization;
NOEL - No observed effect level (also called NOAEL – no observed adverse
effect level); for toxic or other effects imposed on organisms or experienced
by humans;
NRC – National Research Council of the United States of America is under
the auspices of the National Academy of Sciences (NAS), the National
Academy of Engineering (NAE), and the Institute of Medicine (IOM). The
NAS, NAE, IOM, and NRC are part of a private, no-profit institution that
provides science, technology and health policy advice under a congressional
charter signed by President Abraham Lincoln that was originally granted to
the NAS in 1863. Under this charter, the NRC was established in 1916, the
NAE in 1964, and the IOM in 1970. The four organizations are collectively
referred to as the National Academies
OECD - Organization for Economic Cooperation and Development;
pg – picogram (10-12 gram);
POPs - Persistent Organic Pollutants;
ppb – parts per billion;
ppm - parts per million;

xvi
Pre-industrial state - A conventional term implying the state of the natural
[mercury] cycle before the beginning of human industrial activity; in Europe
the beginning of a noticeable production and consumption of mercury is
related to medieval centuries;
PS - Particle scrubber; equipment designed to reduce emissions of particles
from combustion flue gases
Re-emission - Secondary input to the atmosphere from geochemical
reservoirs (soil, sea water, fresh water bodies) where mercury has been
accumulating as a result of previous and current human activity;
RfD – Reference dose; term used in evaluation of risk of toxic effects various
chemicals [such as methylmercury] on humans; the RfD is defined by US EPA
as an estimate [with uncertainty spanning perhaps an order of magnitude] of a
daily exposure to the human population (including sensitive subgroups) that is
likely to be without an appreciable risk of deleterious effects during a lifetime;
SCR - Selective catalytic reduction; equipment designed to reduce emissions
of certain pollutants from combustion flue gases;
SDA - Spray dryer adsorber system; equipment designed to reduce emissions
of certain pollutants from combustion flue gases;
Slag – A substance produced by mixing chemicals with metal that has been
heated until it is liquid in order to remove unwanted substances from it.
SNCR - Selective non-catalytic reduction; equipment designed to reduce
emissions of certain pollutants from combustion flue gases;
xvii
TLV - Threshold limit values are guidelines [not standards] prepared by the
American Conference of Governmental industrial Hygienists, Inc [ACGIH] to
assist industrial hygienists in making decisions regarding safe levels of
exposure to various hazards found in the workplace. They reflect the level of
exposure that the typical worker can experience without an unreasonable risk
of disease or injury. TLVs are not quantitative estimates of risk at different
exposure levels or by different routes of exposure;
Torr - Is a non-SI unit of pressure defined as 1/760 of an atmosphere;
TWA - Time weighted average. The average exposure to a contaminant that a
worker may be exposed to without adverse effect over a period such of an 8
hour day or 40 hour week. E.g. mercury vapour TWA is 0.05 µmol/m3;
UN - United Nations;
UNCED - United Nations Conference on Environment and Development;
UNEP - United Nations Environment Programme;
US EPA – Environmental Protection Agency of the United States of America;
USA – United States of America;
Wet deposition - Flux of substance from the atmosphere onto the underlying
surface with atmospheric precipitation;
WHO - World Health Organization.

xviii
Properties of mercury.
Atomic number: 80
Density: 13.5336 grams per cubic centimetre
Melting point: -38.830C [234.32K ] -37.890F
Description: Silvery, odourless, heavy liquid
Molecular formula: Hg
Molecular weight: 200.59 g / mol
Period number: 6
Group number 12
Boiling point: 356.7 °C [629.880 K] 674.11°F
Phase at room temperature: Liquid
Element classification: Metal
Vapour pressure: 0.002 torr @ 25°C
Vanderwaals radius: 0.157nm
Solubility: Soluble in concentrated nitric and hot sulphuric acid; dissolves to
some extent in lipids
CAS number: 7439-97-6
Oxidation states: +2, +1
Inhalation reference exposure level: 0.09 mg / m3
TWA : 0.05 mg / m3
1
Fig 1. Map of New Zealand.

2
Executive Summary.
The use of toxic metallic mercury for gold recovery through amalgamation and
retorting is a well known process and has been in use around the World for
centuries (Malm 1998). In New Zealand it has been in use since the early gold
rushes of the 1870s. Its toxicity to humans and the environment has been well
researched world-wide with mercury vapour reported to have killed 15 miners
and made many more ill in a Turkish mercury mine (Trakhenberg 1974). The
notification of a gold worker with mercury poisoning in the West Coast town
of Greymouth, New Zealand in late 1985, the first such notification in New
Zealand, raised the author’s interest in the local gold mining industry and the
use of mercury to save gold. The manner in which mercury was used in New
Zealand in the early years of gold recovery has not been researched and
although no records have been kept it was known to be used extensively.
In this historical 1980s study that is being re-examined, the effects of mercury
usage on workers has been observed via on- site visits, observation of work
processes, worker discussion, urinalysis, air measurement, personal dose
measurement and the use of a subjective questionnaire to record participant’s
symptoms. Participants [n =16] were selected from different companies to
take part in the study and a control group [n =12] was used. Altogether a total
of 25 mining sites were involved in the study.
3
The research identified sources of mercury contamination and problem areas
in the gold mining industry that were a cause for concern that needed to be
addressed. However, a collapse of the gold price in late 1988 led to the
cessation of gold mining in New Zealand almost overnight and the results of
the study were never published. Small scale gold mining is once again being
considered as a viable industry within New Zealand due to the high price of
gold and as mercury is still considered easy to use, and cheap, it will remain
the main means of recovering gold. This view is reinforced by current
research papers (EPA 1997; Agency 1999; Hentschel et al. 2002). Gold is still
plentiful in the West Coast region but, because it is in the ground, it is
expensive to get out.
The study covered the years 1984–1988 and found health risks for users of
metallic mercury with a poor understanding among all users of the hazards of
mercury. Mercury use in the gold mining industry in New Zealand was not well
managed and created a risk to the health of workers through high mercury in
air levels [Hg–air] in the work environment, from spillage of mercury and poor
work practices. The study proved the existence of a microenvironment that
contaminated worker’s breathing zones. This microenvironment was not
acknowledged within the industry and if we are to ensure that worker’s total
exposure dose is measured, it is very important that it be acknowledged and
acted on. The mercury urine levels [Hg–U] and mercury air levels [Hg–air]
4
were found to have a good relationship. This correlation between mercury
vapour exposure and urinalysis results has been proved by others (Piotrowski
1975; Yoshida 1985; Roels et al. 1987; Naleway et al. 1991).
The use of a subjective questionnaire, in conjunction with the urinalysis, to
capture the feelings of workers was a useful tool for evaluating the overall
health effects of mercury contamination. This reinforced work done in earlier
studies (Smith et al. 1970; Roels at al. 1985; Rosenman et al. 1986).
Conclusions and recommendations are made to ensure future use of metallic
mercury in the gold mining industry does not present a risk to users.
Mercury was known to be used on the West coast in vast quantities
[unfortunately, no records of quantity exist] and due to spillage and
carelessness in handling, much of it was lost to the waterways and general
environment. Once in the silts it undergoes changes that make it available to
the food chain and it has been found in local fish stocks. High mercury levels
in fish, amphibians and invertebrates downstream of mining sites are a
consequence of historic mercury use (USGS 2007). This environmental
contamination can, and does, have a detrimental effect on the health of
animals and humans (WHO 1976; WHO 1991; UNEP 2002; UNEP 2005).
Recent studies give a better understanding of mercury distribution, transport
and transformation processes in old gold mining sites (UNEP 2005).

5
This study has not been previously published and the findings have not been
made widely known although the industry was kept abreast of the study at the
time. This thesis has brought together the data from the earlier study and
evaluated it with some recent / modern research.

6
Chapter 1. Introduction.
New Zealand was colonised primarily for agricultural land rather than for its
mineral wealth. As an increasing number of European settlers arrived after
1840, they started to search for metals [particularly gold] and coal. Gold
rushes in the 1860s led to the migration of men to hitherto remote areas in
Otago, the West Coast, and Coromandel. New Zealand is self-sufficient in
many mineral resources, and exports substantial amounts of gold, silver, iron
sands and high-grade coal. The mining industry contributes to several major
sectors of the economy, including agriculture, energy, construction, transport
and manufacturing (Statistics New Zealand 2006).
The West Coast of New Zealand’s South Island was opened up in the 1860s
by the discovery of gold. Although the easy gold was worked out, there has
always remained those hardy souls who have carried on trying to find another
El Dorado. It is acknowledged that there is more gold left on the West Coast
than was ever taken out, however, much of it requires removing tonnes of
overburden to get (MED 2007) and, as this requires the use of heavy
machinery, is not economic unless the World gold price is high.

7
The last gold rush on the West Coast took place in the late 1890s with the last
remaining quartz gold mine at Waiuta ceasing work in 1951 (May 1962). After
that time the price of gold remained low and it was not until late 1970 early
1980 that the gold price began to increase to a level that made it economical
to work the deeper claims. In the period 1982-1988 a mini gold rush occurred
on the West Coast and over 200 licences were issued to mine or prospect for
gold (MED 2007), however, not all these were worked at the same time as
some were purely speculative.
The main means of recovering gold during this period involved the use of
elemental mercury and amalgamation. The mining industry had little
knowledge of the hazards of mercury but knew that it was an easy and cheap
way of recovering gold. The extent of employee’s knowledge covered
methods of use with limited safety instruction and no information on the
metal’s toxicity.
In 1985 a case of severe mercury poisoning in a person working in the gold
mining industry was notified to the Mines Inspectorate responsible for mine
safety. This period was before the establishment of Occupational Safety and
Health [OSH] in New Zealand and, at that time, the local Health Authority
provided advice to the Mining Inspectorate on health and occupational

8
related issues. This poisoning notification was the catalyst for the author’s
decision to carry out a study of mercury use in the local mining industry. The
study was carried out over the period [1984–1988]. In 1988 the world price of
gold dropped below an economic level and mining ceased almost overnight. It
is this 1984-1988 study that is being re-examined and re-evaluated in this
thesis.
The World gold price [2007] has risen to a level [NZ$1000] that makes it
profitable for mining with new mines being opened up and old claims being
reworked. Although there are new methods available to save gold that do not
involve mercury, they are expensive and more time consuming, and more
likely to be used by large companies that can afford the financial outlay. It is
probable that small scale mining, the majority in this region, will again use
mercury as the main means for their gold recovery. This renewed interest in
gold mining justifies re-examining the 1984-1988 study so that risks/ problems
identified can be addressed if the New Zealand industry is restarted.
1.1 Outline of thesis.
The thesis begins with an introduction and brief history to give the reader a
little back ground. The area of the West Coast covered by this thesis is shown
on the map on page 11. In the original study a small number [n=25] of West
Coast mine sites were visited governed by time, workplace and travel
constraints. Participants were a representative sample of the industry as a
whole.

9
1.2. Literature search.
A literature search on mercury covered the history, uses, properties, and
problems associated with its use by man. Research papers were reviewed
and the World Wide Web [www] was utilised.
1.3. Methodology.
The methodology used is discussed in detail with a description of the methods
involved, equipment used and their technical specifications.
1.4. Results.
The results are provided in graph and table format with discussion of the
findings as they relate to each section.
1.5. Discussion.
The discussion covers the findings of the research in depth and the results
are evaluated. The impact of mercury use, based on these findings, on the
safety of workers employed in the gold mining industry is covered.
1.6. Conclusion.
The conclusions summarize the main points that have been identified and the
importance of each one is explained.

10
1.7. Recommendations.
A number of recommendations are made with a view to encouraging their
discussion and adoption by the industry and authorities.
1.8. Limitations.
Limitations and possible bias were identified, noted and discussed.
1.9. Future research.
During the study gaps in knowledge were identified and these have been
noted with possible areas of further study briefly discussed.

11
Chapter 2 . Introduction to the West Coast.
The area of the West Coast covered by this study is shown in green in the
map of Fig 2 below.
Fig. 2. Study area in which mine sites visited were located.

12
2.1. West Coast land mass.
The West Coast region [Te Kaunihera Whakakotahi O Te Tai Poutini1] of New
Zealand’s South Island is a narrow wedge of land located between the
Southern Alps and the Tasman Sea. Geographically remote and bounded by
mountain ranges to the east and the Tasman Sea to the west, the West Coast
is a World Heritage Area - a region of snow clad peaks, lakes, glaciers, rivers
and forests. It extends over a distance of 600 km from Kahurangi Point in the
north to Awarua Point in the south. It has a land area of 23,000 square
kilometres, [2.300,000 hectares] or 8.5% of New Zealand’s land area. The
West Coast is the third largest region by land mass in New Zealand but, with
only 1% of New Zealand’s population at 31,326 (Statistics 2006) it is the most
sparsely populated province in the country. It has a density of 1.4 people per
sq km compared to 13.1 people per sq km nationally. Prior to the discovery of
gold, the West Coast was home to Maori, the original native inhabitants of
New Zealand, who had settlements along the coast. Isolated from other
regions such as Canterbury to the east and Nelson to the north by high
mountains [the Southern Alps], it is a region distinguished from the rest of
New Zealand by geography, climate, terrain, history and way of life.
1 Maori are the indigenous people of New Zealand and this is their name for the West Coast
13
With a thin elongated shape the region does not exceed 100 km at its widest
but is over 600 km long. Of the total landmass, 87% is Crown owned with only
13% private property. The Alpine Fault, an earthquake fault-line, runs north /
south through the length of the region and to the East of the fault are deeply
dissected, forested mountain ranges. Rivers and streams are steeply graded
with plains areas in river valleys and along the coast. Most habitation is along
the Coast and on the river flats (WCRC 2007).
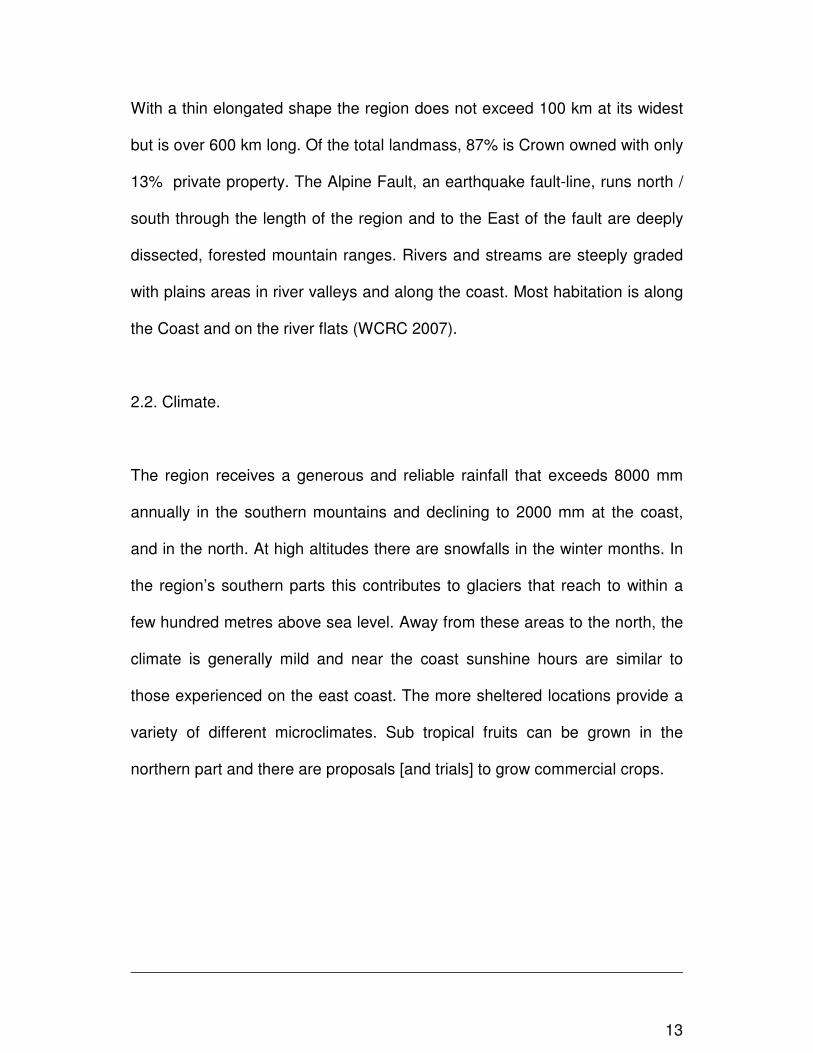
2.2. Climate.
The region receives a generous and reliable rainfall that exceeds 8000 mm
annually in the southern mountains and declining to 2000 mm at the coast,
and in the north. At high altitudes there are snowfalls in the winter months. In
the region’s southern parts this contributes to glaciers that reach to within a
few hundred metres above sea level. Away from these areas to the north, the
climate is generally mild and near the coast sunshine hours are similar to
those experienced on the east coast. The more sheltered locations provide a
variety of different microclimates. Sub tropical fruits can be grown in the
northern part and there are proposals [and trials] to grow commercial crops.

14
2.3. Land coverage
The West Coast is a region different to the rest of New Zealand in that
approximately 60% of the land mass is covered in native forest. There are
small areas of exotic forestry, mainly pines that were established as the
milling industry moved away from native timbers. Natural pasture land is rare
and wetlands, once common, are being drained for farmland. West Coast
native forest, the largest in New Zealand, is protected from logging. The
farmed land is used mainly for dairy and dry stock production.
Fig. 3. West Coast land cover as of 1985.
Source: WCRC 2007.

15
2.4. Minerals.
The New Zealand government owns all naturally occurring petroleum
[including both oil and gas], radioactive minerals, and gold and silver in New
Zealand. Any individual or company wanting to prospect, explore or mine
these substances must obtain a permit under the Crown Minerals Act 1991
and pay the specified fees and royalties. The same rules apply to coal and all
other metallic and non-metallic minerals and aggregates on Crown-owned
land. Mining of minerals and aggregates other than petroleum, radioactive
minerals and gold and silver on privately owned land requires the consent of
the landowner together with resource consents from local authorities granted
under provisions of the Resource Management Act [p 23].
Substantial deposits of coal, gold and industrial minerals are to be found in
the region. Coal and gold are of a national and regional economic importance
and contribute significantly to the region, and the nations, welfare as a raw
material source for local use, employment and export. The West Coast has a
range of other minerals present that includes asbestos, pitchblende [a
radioactive material], bismuth, beryl, dolomite, corundum and silica. However,
it is not economically feasible to mine them all due to the rugged nature of the
country in which they are found. Coal and gold are the exception and have
been the strength of the West Coast economy for the last hundred years.

16
There has been a steady increase in the total value of mineral production
since 1920 although the proportions of different commodities have changed.
In particular, the value of gold production dropped sharply after 1940, but this
was more than offset by the rise in production of non-metals.
The graph [Fig 4] shows the value of minerals to the New Zealand economy
between 1860 and 2004. Values have been adjusted for inflation to 2004, and
have been averaged over five-yearly intervals to minimise the effect of small
fluctuations.
Fig. 4. Value of minerals to New Zealand economy 1860-2004.
Source: Annual Parliamentary reports of the Mines Department (later Ministry
of Energy, then Crown Minerals, Ministry of Economic Development)

17
2.5. Mining.
Coal and gold mining have sustained the West Coast community for the last
century. Coal went through a decline in the 1960s and 1970s but is now a big
industry with millions of tonnes exported per year. The West Coast has the
largest reserves of quality coal in New Zealand (MED 2007).
Gold mining in New Zealand dates back to the 1850s, and on the West Coast
to 1864. Gold mining on the West Coast has had a long and colourful history
and the mining area covered a distance of some 300 kilometres from above
the town of Westport in the north, to below the settlement of Okarito in the
south. Waiuta is the site of the last and longest worked underground goldmine
in the West Coast region being closed in 1951 (Railton & Walter 1990).
The discovery of alluvial gold in 1864 led to the first of a number of gold
rushes on the West Coast and was the beginning of the mining industry in the
region (May 1962). Gold mining in its various forms and, to a lesser degree
coal, was the reason that the “wild and inhospitable country of the West Coast
was opened up” (Gordon 1906). Without gold and coal there may well have
been no West Coast as it is today. Coal is a major export and brings in wealth
and employment to the region in the 21st Century.

18
The gold industry in New Zealand has gone through boom and bust periods.
The West Coast has been part of these. In the 1980s the West Coast enjoyed
its last boom, with the Ministry of Economic Development issuing 800 mining
licences over 10 years with approximately 100 being worked at any one time.
Graph 2 shows there were 735,000 ounces [22 tonne] of gold produced in
New Zealand in 1866, a quantity that has not been repeated since. West
Coast production would be included in this (MED 2007).
In Fig 5 the graph shows the total gold production in New Zealand 1855 to
1995 and as can be seen in the latter part of the 19th Century, gold of great
value was mined.
Fig.5. Total gold production in New Zealand 1855-1995.
Source: Ministry of Economic Development. 2006

19
The Ministry of Economic Development has estimated the total in-ground
[placer 2 ] gold reserves of the West Coast at more than 300 tonne, so there is
obviously potential for a big increase in production. With the rise in the
international gold price it has once again become economically feasible to
mine for gold on the West Coast. Gold miners are now starting to actively look
for gold and this may be the start of another mini-gold boom. A large
international gold miner has reopened an old quartz3 gold mine out of Reefton
where they are open-casting the mine to access the gold bearing quartz from
a deep pit. Being a big multi-national company the gold recovery process is a
modern, mechanical process that does not use mercury.
2.6. Economy.
The West Coast has a strong tradition of reliance primarily on its natural
resources, mainly extractive industries, and great wealth has been taken out
of the region. The West Coast has built a diverse secondary industry and
service sector base to augment these natural endowments. The current West
Coast driver industries include dairying and mining, and it is dependent on the
success of these primary industries in the international commodity markets .
2 Placer is the name for gold-bearing beds of sand and gravel.3 Quartz is the most common mineral on the face of the Earth and is a very hard rock with the
gold imbedded in it. It requires crushing to release the gold. It is a silicate called silicondioxide[ SiO2] ]

20
Chapter 3. Gold.
3.1. The metal.
Gold is an unusual metal because it exists in the earth as the element and not
chemically combined with other elements. Silver and copper are the only
other metals naturally found in their elemental form. Gold and silver are
thought to be the first metals to be worked by humans and have been sought
after and treasured since ancient times for wealth and status. Jewellery
accounts for approximately 70 percent of the gold demand being extremely
profitable at over $44 billion dollars in 2006; making gold Jewellery one of the
world's largest categories of consumer goods (Bystrianyk 2007). In times of
economic downturn investers hoard gold as a hedge against financial loss – it
is seen as a safe investment.
Gold is a relatively rare element, making up only 0.0000004% of the Earth’s
crust [by mass] and is valuable simply because it is scarce and difficult to
extract (Bystrianyk 2007). It is un-reactive and doesn’t tarnish like most other
metals and is extremely heavy, with a density of 19.4 grams per cubic
centimetre [heavier than mercury]. It is this heaviness that plays a crucial part

21
in many of the physical methods used to extract it from its sources. Gold is the
most malleable element known. Just 1 gram of gold, which would be the size
of a grain of rice, can be beaten into a thin film covering over 10 square feet
[0.93m2]. Pure gold is an extremely ductile, soft metal that is easy to scratch
(World of Chemistry 2007).
3.2. Location of gold.
Gold is often found in underground veins of quartz and, less frequently, in
other minerals such as pyrite, granite and mica slate (MED 2007). The veins
can be anything from half an inch to several feet wide. There are also large
deposits of gold above the ground. Alluvial gold is found as small yellow
grains and flakes, or even small nuggets, on the beds of fast-flowing rivers
and streams. Due to natural erosion, flooding, glacial movement and
weathering, the gold is broken free from its source. Carried downstream by
the water, the gold-bearing rock is broken
up into small pieces releasing the gold. As
it is carried downstream the gold particles
become smaller.
Fig. 6. Small gold nuggets.
22
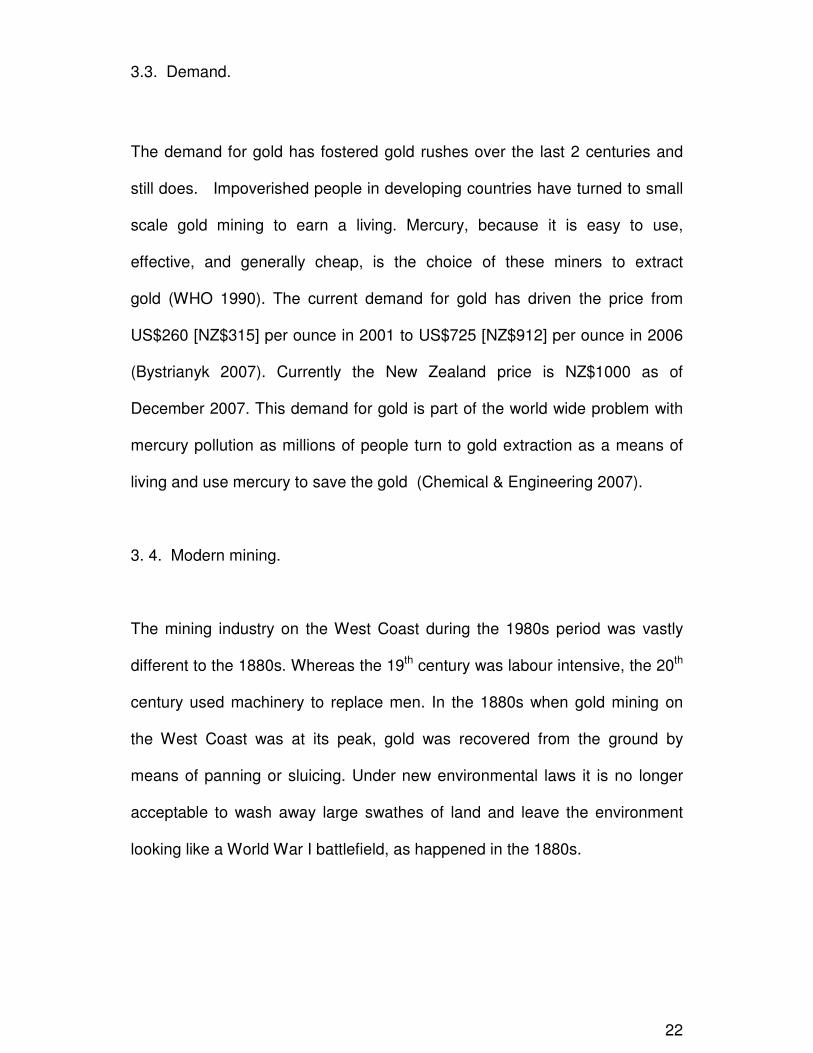
3.3. Demand.
The demand for gold has fostered gold rushes over the last 2 centuries and
still does. Impoverished people in developing countries have turned to small
scale gold mining to earn a living. Mercury, because it is easy to use,
effective, and generally cheap, is the choice of these miners to extract
gold (WHO 1990). The current demand for gold has driven the price from
US$260 [NZ$315] per ounce in 2001 to US$725 [NZ$912] per ounce in 2006
(Bystrianyk 2007). Currently the New Zealand price is NZ$1000 as of
December 2007. This demand for gold is part of the world wide problem with
mercury pollution as millions of people turn to gold extraction as a means of
living and use mercury to save the gold (Chemical & Engineering 2007).
3. 4. Modern mining.
The mining industry on the West Coast during the 1980s period was vastly
different to the 1880s. Whereas the 19th century was labour intensive, the 20th
century used machinery to replace men. In the 1880s when gold mining on
the West Coast was at its peak, gold was recovered from the ground by
means of panning or sluicing. Under new environmental laws it is no longer
acceptable to wash away large swathes of land and leave the environment
looking like a World War I battlefield, as happened in the 1880s.

23
Mining, like other land uses, can cause significant environmental problems.
Some past mining practices were highly destructive. For example, dredging in
Otago and on the West Coast destroyed large areas of river flats, leaving
behind unsightly trails of tailings. Protests and community concerns about the
effects of mining have gradually resulted in higher environmental standards.
All mining proposals are now evaluated in terms of the Resource
Management Act 1991.
The Resource Management Act 1991 and amendments are the major piece of
environmental legislation that controls the use of land and the discharge of
pollutants to air, land and water, in New Zealand. It has a comprehensive
framework for the development and protection of almost all physical and
natural features. Mineral extraction is excluded from the sustainability
provision of the Act, but as mining invariably involves the use and modification
of land, all other parts apply. Territorial authorities [district and regional
councils] are responsible for administering the Resource Management Act.
Most authorities have incorporated local rules and guidelines for mineral
extraction in their district plans.
Mining permits now include requirements to undertake land rehabilitation after
mining has been completed. At its best, land that has been mined and
rehabilitated is not easily distinguished from land that has never been mined.
New Zealand agricultural scientists and engineers have developed
considerable expertise in land rehabilitation

24
Goldmining is part of the West Coast culture and mining today is carried out
by small companies employing 5–20 men with most of the small companies
consisting of the owner[s] and some employees. Women were not employed
in the industry. Modern gold mining involves heavy, tracked excavators and
floating, revolving screens, or trommels, [called “floating” because they sit on
pontoons that float on the water from the excavated pit]. The heavy, tracked
excavators were used to remove the top soils to enable the gold bearing
gravels on the bottom4 to be accessed. These gold bearing gravels are
loaded onto the floating screen where the fine gravels and gold are able to be
sieved out through mesh and the coarse material moved to waste back into
the pit.
The fine gravels, after passing through the screen are passed over riffle boxes
/ tables [small box channels that have matting on the bottom and small batons
laid horizontally to catch the gold]. The principle here is that gold is heavy and
will settle out and be caught by the batons and matting whilst the fine gravels
and silts, being lighter, will flow away with the water. The water velocity was
set so that it carried the majority of the gravels away to waste and the gold,
due to its weight can settle out. At the end of the day the “wash up” takes
place. This involves picking out any big pieces of gold and then gathering up
the fine sands [called” wash dirt” or just “wash”] left over for further treatment.
4 “Bottom” is the hard area through which the gold can not pass, normally rock / clay .

25
Fig 7 [p 26] shows a floating screen/ trommel in action on the West Coast.
This is a common arrangement on the local gold fields and the machinery was
all made locally to suit local conditions. As can be seen they were not labour
intensive and could be operated by a minimum of two men. They also require
a continuous and large supply of water and this was usually pumped from the
pond on which they float and returned to the pond after use. The West Coast
has a generous rainfall and numerous rivers so water is not a scarce
commodity. The pond was used as a silt trap to prevent the fine silts polluting
waterways, a common environmental effect from this industry. In fact water
pollution is seen as the major environmental effect from this industry and
today is monitored frequently by the Authorities. Chemicals called flocculants
are added to the discharge water to help settle out small particles by enabling
them to coalesce together into heavier solids that can settle out.

26
Fig.7. Floating screen/ trommel in action.

27
Fig 8 is a flow chart of the processes used in both rock and alluvial mining and
shows the process from mining through to the refined or finished gold. The
ore crushing stage is not a necessary step in alluvial mining.
Fig 8. Diagram of the stages of the gold mining process.
Source: personal paper.

28
3.5. Treatment of gold wash.
Once the large gold is set aside the “wash” is prepared for amalgamation by
separating the sand from the gold in the “wash”. This is achieved in a number
of ways, the most common being to put mercury into a pan with the “wash”
and, using water, to gradually swirl away the fine sand leaving the
gold/mercury mix [amalgam] behind. Another method is to put mercury into a
bucket of “wash” and mix with a wide piece of wood. The mercury absorbs the
gold and forms an amalgam mass that is squeezed through a cloth, usually a
chamois or leather, and the surplus mercury collected. The mass is then
transferred to the retort to remove the mercury and free the gold. After
retorting the gold is reheated to >1062 0C [1943 0F] [melting point of gold] for
30 minutes to ensure that any impurities are removed to give pure gold and
poured into moulds. The retorting process is shown in fig 9 below.
Fig 9. Retorting process. Source: personal papers.
Gold & mercury mix.Amalgam

29
3.6. Retort process.
Retorting is a process that has been around as long as the use of mercury in
the gold industry. Basically it involves heating the amalgam mass to between
7500C– 8500C [1382-1569 0F] This required the use of specially manufactured
retorts of cast iron that consisted of a bottom section into which the amalgam
was placed and a top half with a water jacket condenser attached. Once the
amalgam was placed the two sections were bolted together with an asbestos
or clay seal as shown in fig 10 below.
Fig 10. Diagram of cast iron retort and water jacket. [UNIDO]
This is similar to the type of retort manufactured and used locally on the West
Coast. The only difference is that the water cooler shown was replaced by a
hose connection from a water supply to the water jacket and the water was
run continuously through the jacket during the retort.

30
Fig 11. Retort in use. Source: personal papers.
Once the amalgam was ready
the retort was put into the
heating facility where it was
positioned over the heat source
and the mercury driven off via
the water jacket. The outlet of
the water jacket was placed into
a bucket of water to help
condense any vapour that was
not condensed by the water
jacket. The diagram in fig 11 is
an example of a retort in use. There is a slight difference in that the retort
used locally would look more like fig 10 [p 29- no cooling cloth used].
After heating the retort is opened, the gold removed for reheating for about 30
minutes to purify it, and poured into ingots where it is marked with the
company identification. The mercury is collected for reuse. In most of the
small 2–3 man mining companies the retorting and amalgamating are done by
the same person
31
Chapter 4. Mercury.
4.1. History of mercury.
Because they exist in nature in the free state, or as easily decomposable
compounds, mercury and the other noble metals [gold & silver] were the first
elements to be discovered and utilized by humans. Aristotle discussed the
use of 'fluid silver' for religious ceremonies and Hippocrates was said to have
used mercury for medicinal purposes. Mercury was considered the basis of
metals, close to gold and it was named after the planet Mercurius, which was
the planet nearest to the sun [gold]. Others say that because of its mobility it
is named after Mercurius, the messenger of the gods in Roman mythology,
and that the identification came later (Weeks 1956).
The element mercury has been known for thousands of years and is the only
liquid metal. Known in Antiquity by the Chinese and in India, it has been found
in Egyptian graves that date from around 1500 BC. The Greek philosopher
Theophrastus [372-287BC] described a method for preparing mercury by
rubbing cinnabar [Cinnabar is a vermillion–red mineral found in fine granular
masses or disseminated through the host rock] with vinegar in a clay dish and
he also described a method of distillation that involved heating the cinnabar in
an iron shell and collecting the condensation on a convex lid. (Takacs 2000;
World of Chemistry 2007).

32
4.2. Alchemy.
Mercury is the only metal for which the alchemical planetary name became
the ordinary name. Its chemical symbol Hg is derived from the Greek word
Hydrargyrum which means liquid quicksilver and mercury’s Alchemy sign is
also known as "quicksilver," a reference to its mobility. Mercury is one of the
elements which has an alchemical symbol, shown in Fig 12. Speed and
mobility were characteristics of the Roman god, Mercury, who served as a
messenger to all the other gods and shared his name with the planet nearest
the sun.
Fig 12. Alchemical symbol for mercury.
In the ancient art of alchemy, mercury, sulphur, and salt were the Earth’s
three principle substances. Because they believed that mercury was at the
core of all metals, alchemists supposed that gold, silver, copper, tin, lead and
iron were all mixtures of mercury and other substances. The central themes to
European alchemy was the belief that the correct combination of mercury and
other ingredients would yield riches of gold (Goldwater 1972)

33
4.3. Historical use.
The Romans used their mercury mines as penal institutions for criminals,
slaves, and other undesirables. Warders at these mines were among the first
to recognize that there was a high likelihood that prisoners would become
poisoned and so spare the authorities the need for formal executions. A
person put to work in a mine seldom survived more than 3 years (Takacs
2000). Mercury and its compounds have been used in medicine for centuries,
and as the toxic effects of mercury and its compounds became more widely
known and understood they were no longer considered safe (Goldwater
1972). Mercury was administered to children as a laxative, de-wormer, and
teething powder for infants in the early 20th century (EPA.2007).
Mercury has been widely applied in industry and agriculture, as well as in
medicine, for centuries. The Romans used vermillion [the red-coloured
sulphur salt of mercury] extracted from the Almadén cinnabar mines as a
cosmetic and decorative (Nriagu 1979). The history of it’s discovery are filled
with trial and error methods that are followed by the discovery of its negative
side effects. In the fifteenth century mercury was used to treat syphilis and
trained physicians continued to prescribe mercury to cure syphilis in the mid-
nineteenth century (Syphilis 2007).

34
A less well documented source of exposure to inorganic mercury among the
general population is its use in ethnic, religious, magical, and ritualistic
practices and in herbal remedies. The unique properties of elemental mercury
or quicksilver have led people to attribute magical and spiritual powers to it
through the ages. Mercury has long been used in Chinese herbal preparations
and is also used in some Hispanic practices for medical and/or religious
reasons, as well as in some Indian ethnic remedies (Kew et al. 1993).
Mercury was viewed as an essential component of the alchemical triad of
mercury, sulphur, and air and has been associated with the Hindu god Shiva
(Little 1997). Elemental mercury is also used in the spiritual practices
associated with Santeria, Voodoo, Espiritismo, Palo Mayumbo, and other
Afro-Caribbean syncretic religions (EPA 2002).
4.4. Contamination.
Although humans have long put an economic value on metals, it is only
recently that they have paid any attention to the health issues. Metals have
been, and still are, involved in human, plant and animal health. Most of us will
have consumed metals during our lifetime. Many are beneficial but exposure
to mercury has a history of causing health problems and the dangers of
mercury use were known to people centuries ago. In the 19th century hat
making industry workers were exposed to mercury fumes from the felting
process and suffered from central nervous system damage giving the phrase

35
“mad as a hatter”. Most of what we know about mercury poisoning has come
from accidental and occuptaional exposure. However, it was not until 1956
that the first official case of mercury affected "disease" was documented in the
small fishing village of Minamata on a small island in Japan, which is now
referred to as the Minamata Disease. By the time this exposure was brought
to world attention the damages, ranging from minor to severe , and from short
–term to long-term were already irreversible (EPA 2007).
The Minamata Bay exposure in Japan was a classic exposure from industry
discharged waste [containing mercury], into the environment. The Minamata
incident is important because it had tragic results and because it was the first
documented large scale mercury pollution of the environment. It provided
important information on the effects of mercury poisoning and the relationship
between the environment and man’s actions. The mercury poisoning
[originally called Minamata disease after the city in which it occurred],
appeared in the news in the 1970s. Minamata is located on the Western coast
of Kyushu, Japan's southernmost island. After World War II Japan was
making great efforts to recover from the effects of the war and to become a
manufacturing nation. In the rush to achieve its goals environmental
considerations were not at the top of the agenda.

36
In 1932 the Chisso Corporation began to manufacture acetaldehyde, a
chemical used to make plastics. Waste from the production process was
discharged into the local bay; we now know that the waste contained mercury
a by-product of the process. When acetaldehyde was made from acetylene
and water, methylmercury was by-produced in the reaction chamber.
Methylmercury contaminated the vacuum evapolater, the first still, and even
the second still, and was then discharged into the bay. (National Institute for
Minamata Diseases 2007).
Though not known until decades later, the heavy metal was converted into
methylmercury chloride, an organic form that was able to enter the food chain.
Minamata residents relied on fish and shellfish from the bay as a source of
protein and these fish were contaminated by the mercury. Unlike elemental
mercury, methylmercury can penetrate into mammalian cells because it
mimics a common amino acid . It interferes with nerve cell division thereby
making prenatal and childhood exposure more damaging than adult exposure
(EPA 2001. 2007). After World War II, production of acetaldehyde increased
at a rapid pace. As this increase was occurring it was noted that fish began to
die and float in Minamata Bay. It was noted at this time that local cats began
to show strange behaviour that sometimes resulted in their falling into the sea
and drowning (Smith & Smith. 1975).
37
Kumamoto University reported [Nov. 3, 1956] that the cause of the disease
was intoxication caused by eating fish and shellfish contaminated with a kind
of heavy metal, but it took a long time to determine the cause of the strange
disease as methylmercury poisoning. ( Minamata Disease Archives 2007).
The Minamata case is a good example of the ecological consequences of
environmental pollution because the effects of the effluent led back to
humans. Disasters such as the massive release of methyl isocyanate gas
from Union Carbide’s plant in Bhopal, India and Chernobyl, concentrates our
minds on the human and environmental risks of pollution. However, we do not
take the threat posed by low level but more sustained release of chemicals,
such as the use worldwide of mercury in the gold recovery industry, as
seriously.
Another incident involving mercury occurred in Iraq in 1972 where people
were fed bread made from grain treated with an anti-fungal agent containing
mercury. Over 400 people died in the weeks that followed (Bakir et al. 1973;
EPA 2001).
The toxicity of a chemical is determined by the dose or amount taken into the
body. The specific effects further depend on the amount, or concentration,
that reaches specific organs such as the brain or kidney that are sensitive to
38
poisoning by the chemical. Factors that affect the amount of mercury reaching
an organ are the rate at which it enters the bloodstream [absorption efficiency]
through the skin, the lungs or the gastrointestinal system; the rate at which it
is distributed to the different body organs; and changes in its chemical
structure that may occur in the different organs due to metabolism (WHO
1991; EPA 2007).
After absorption, the vaporized metallic mercury is excreted in the breath with
trace amounts going to urine and faeces. Once transformed to inorganic
mercury, excretion is through urine and faeces. After it is absorbed into the
body the amount of metallic mercury present is reduced by half every 1-2
months [half-life]. Larger amounts of mercury in the body [body burden] take
longer to be removed than smaller amounts. Different organs release
accumulated mercury at different rates; brain and kidney have been found to
retain mercury for a lifetime. Unsteadiness and tremor when trying to move or
to hold objects [intention tremor] and various manifestations of excitability can
develop after a long latent period (Ashe 1953; Piikivi et al. 1984; WHO 1991).
The assessment of risks due to elemental mercury is based mainly on
investigations among exposed humans; therefore the uncertainty of
interspecific extrapolation is mostly avoided (WHO 1991).

39
Chronic exposure to lower levels of mercury vapour affects the central
nervous system. Symptoms of chronic poisoning vary, but may include
tremors, psychological changes, insomnia, loss of appetite, irritability,
headache and short-term memory loss. Mercury has a number of effects on
humans, that can be simplified into the following main effects:
Disruption of the nervous system; damage to brain functions;
DNA damage and chromosomal damage; allergic reactions, resulting in skin
rashes, tiredness and headaches; negative reproductive effects, such as
sperm damage, birth defects and miscarriages (Roels et al. 1982; Kishi et al.
1993).
4.5. Mercury impact.
Nothing has a higher affinity for mercury than elemental gold. Amalgamation
with mercury is one of the oldest methods of extracting gold from its ores. The
extraction of silver by amalgamation is generally attributed to the Spanish in
Latin America in the late sixteenth century (Takacs 2000). Mercury was
known to be used in gold and silver mining since Roman times. The invention
of a refining method [the "patio" process] in Spanish colonial America enabled
silver and gold to be produced on a large scale in many countries (Takacs
2000). Mercury released to the biosphere due to this ancient activity may
have reached over 260,000 metric tons in the period from 1550 to 1930
(UNEP 2005).

40
An estimated 10 to 15 million small-scale miners rely on mercury to
separate grains of gold from small bits of sand and rock using pans or
other small scale equipment (UNEP 2005). Michael T. Bender (2007),
executive director of the Mercury Policy Project (2007), a group promoting the
elimination, reduced use, exposure to, and trade of mercury, stated "up to half
these miners have symptoms of mercury poisoning."
According to UNEP (2005) "Mercury is readily available in most countries and
relatively inexpensive to obtain. In some cases, it is given for free, contingent
on the recovered gold being sold to the mercury provider." This largely
unregulated flow of mercury is polluting waterways, land, and the miners
themselves throughout Africa, South America, and Asia. UNEP (2007)
estimated that small-scale gold mining released between 650 and 1,000
metric tons of mercury per year, and that this pollution accounts for about one
third of all mercury released to the environment from human activities. It is
found in mine tailings, soil, plants, sediments, waterways and around mine
plants & machinery. Scoullos et al. (2000) stated that in the early 1990’s it
was estimated that at least 95 % of mercury used was lost to the environment,
where it contributed to the continuing global atmospheric re-mobilisation and
cycling of mercury.

41
The optimal mercury to gold ratio [Hg:Au] when using mercury to save gold is
about 1 v/v, but greater quantities are often added to ensure that all available
gold is amalgamated. In some areas of Brazil, for example, the Hg:Au ratio is
estimated to range between 1.32 and 2.0 (Bidone et al. 1997). Some
researchers argue that the official figure of 1.32 is an underestimation, and
that ratios as high as 6.0 or even 10.0 are more realistic estimations (Malm et
al.1990).
Mercury has been mined in New Zealand as shown in fig 13 [p 42]
(Henderson 1922; Williams 1974; Brathwaite & Pirajno 1993). The main
mercury deposits are found in sinters5, lakebeds and volcanic and
sedimentary rocks associated with extinct and active hot springs at Huia,
Puketi, Puhipuhi and Ngawha in Northland and Mackaytown on the
Coromandel Peninsula (Officers of the New Zealand Geological Survey
1970). Mercury minerals found in New Zealand include: cinnabar,
coloradoite6, livingstonite, metacinnabar and native mercury ( Railton &
Watters 1990).
5 Sinters - When hot springs overflow they often form layers of sinter – a rock made of veryfine-grained silica – that takes the form of flats, terraces and mounds.
6 Coloradoite is a mineral consisting of the compound mercury telluride (HgTe) .

42
Fig 13. Map of mercury ore sources in New Zealand.
Source: Railton & Watters 1990.
43
4.6. Mercury uses.
Liquid at room temperature, mercury is a good electrical conductor with high
density and surface tension and is able to expand and contract uniformly over
its entire liquid range in response to changes in pressure and temperature.
Being toxic to micro-organisms [including pathogenic organisms] and other
pests, mercury is an excellent material for many agricultural purposes.
The use to which mercury and mercury containing compounds can be put is
considerable. It is widely used in barometers, thermometers, hydrometers,
and pyrometers. It is used in mercury arc lamps producing ultraviolet rays and
in fluorescent lamps. The mercury dry-cell battery developed during World
War II led to the extensive use of the metal in alkaline batteries until recently.
Mercury was essential to the development of the incandescent lamp by
Thomas Edison and remains a principal component of fluorescent light
fixtures (Carpi 1997). It is used as a catalyst in oxidation of organic
compounds, extracting gold and silver from ores, electric rectifiers, and as a
cathode in electrolysis. It is also used in pulp and paper manufacturing,
batteries, amalgams [dental preparations], lubricants, caustic soda, chlorine,
and in the manufacture of switching devices such as oscillators. The
agricultural chemical industries have used it to treat seeds, and antifouling
paints use its properties to prevent growth on boat hulls. (ACGIH 1991).

44
Compounds of mercury are used for:
• Fungicides
• Pharmaceuticals e.g. black mercurous oxide [Hg2O] is used in skin
ointments and Mercurochrome [C20H8O6Na2Br2Hg], a green crystalline
powder that turns to a brilliant red when dissolved in water is used as
an antiseptic
• Paint pigments e.g. Mercury sulphide [HgS] is a brilliant red pigment.
• Explosives.
• Mercuric chloride [HgCl2] an extremely poisonous white crystalline
powder, water and alcohol soluble, used as a wood preservative,
insecticide, rat poison, in tanning, and as a caustic antiseptic in
medicine.
The predominant use of mercury in pre-industrial times was for the extraction
and purification of gold and silver because of its affinity for those precious
metals (Farrar & Williams 1977). Greenpeace (1994) estimated the total
world-wide consumption of mercury for gold mining at 400-500 metric
tons/year in 1993-94. This estimate was considered too high by some in the
industry and too low by others, with suggestions that 500 to 1000 metric tons
annually may be consumed by gold and silver miners with a very high
percentage lost to the environment, (MMSD 2007).

45
Small-scale or artisanal7 mining for gold is a world-wide phenomenon, which
directly and indirectly supports in excess of 100 million people. 50 years ago,
mercury was not utilised in artisanal gold extraction and only began some 25
years ago when it became too difficult to extract gold from rocks (WHO 1990).
Millions of people have become artisanal miners, despite the risks of working
in small tunnels or on steep hills and being exposed to mercury spilling mills,
toxic vapours and explosives. The worldwide demand for gold is presently
high, 44 percent above the total annual production of the world's gold mines.
In South America, over a million people are directly involved in small-scale
gold mining operations. If Africa and Asia are also considered, there could be
as many as six million artisanal miners worldwide, women among them
(UNIDO 2002).
7 A recently coined word to describe small itinerant miners in Asia and Latin America.

46
4. 7. Mercury properties.
4.7.1 The metal.
Mercury is a rare transition metal and the only pure metal that is liquid at room
temperature. It is classified as a heavy metal. The term heavy metal refers to
any metallic chemical element that has a relatively high density and is toxic or
poisonous at low concentrations (MMSD 2002 accessed 2007). They
are natural components of the Earth's crust that cannot be degraded or
destroyed (Goldwater 1972). Once mercury has been liberated from ores,
fossil fuel or mineral deposits and released into the biosphere, it can be highly
mobile, cycling between the earth’s surface and the atmosphere (WHO 1991;
UNEP 2002).
4.7.2. Chemical properties.
Metallic mercury [Hg0] can be changed to positively charged inorganic forms
Hg+ ands Hg2+ as a result of a chemical process known as oxidation (Lindberg
2001). Inorganic forms of mercury can be changed to metallic mercury by a
process called reduction or can be combined with a carbon atom [as the
carbon in a methyl group - CH3] to form organic mercury compounds (Farrar
1977). Organic mercury compounds can themselves be metabolized so that
the carbon is removed from the mercury. Mercury can be bound to other
compounds as monovalent Hg+ or divalent mercury Hg2+ (NAS 1978). Many
inorganic and organic compounds of mercury can be formed from Hg2+.
47
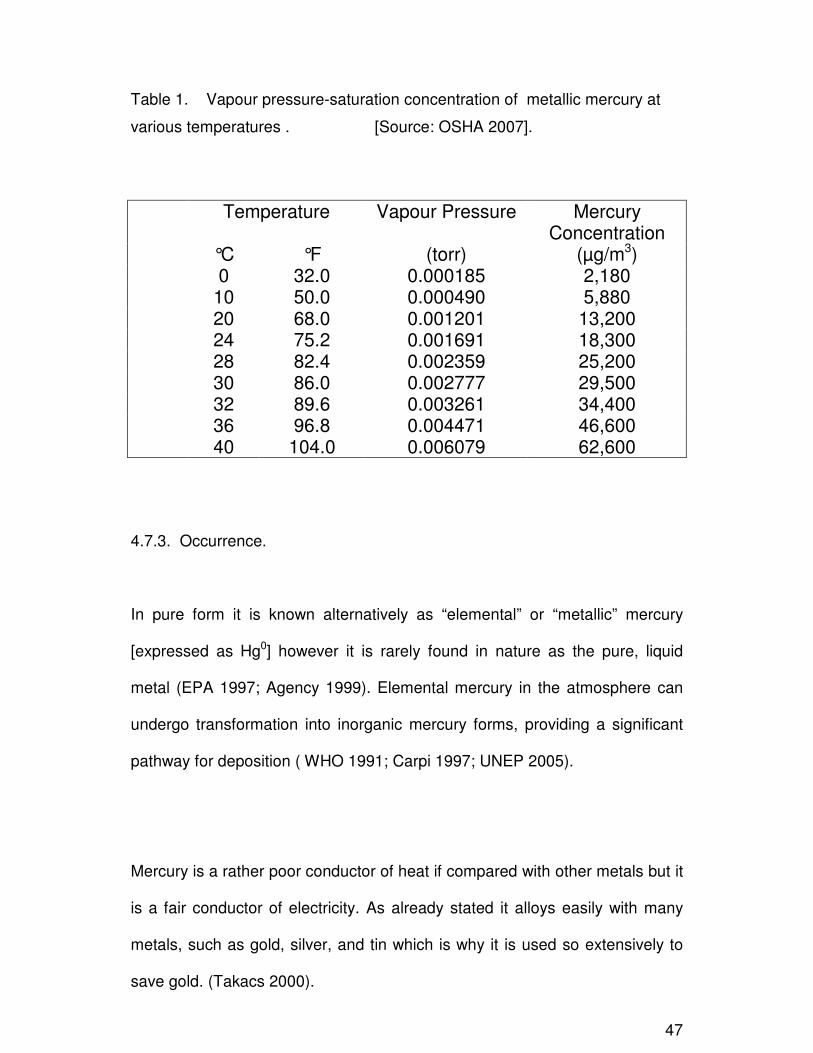
Table 1. Vapour pressure-saturation concentration of metallic mercury at
various temperatures . [Source: OSHA 2007].
Temperature Vapour Pressure MercuryConcentration
°C °F (torr) (µg/m3)0 32.0 0.000185 2,180
10 50.0 0.000490 5,88020 68.0 0.001201 13,20024 75.2 0.001691 18,30028 82.4 0.002359 25,20030 86.0 0.002777 29,50032 89.6 0.003261 34,40036 96.8 0.004471 46,60040 104.0 0.006079 62,600
4.7.3. Occurrence.
In pure form it is known alternatively as “elemental” or “metallic” mercury
[expressed as Hg0] however it is rarely found in nature as the pure, liquid
metal (EPA 1997; Agency 1999). Elemental mercury in the atmosphere can
undergo transformation into inorganic mercury forms, providing a significant
pathway for deposition ( WHO 1991; Carpi 1997; UNEP 2005).
Mercury is a rather poor conductor of heat if compared with other metals but it
is a fair conductor of electricity. As already stated it alloys easily with many
metals, such as gold, silver, and tin which is why it is used so extensively to
save gold. (Takacs 2000).

48
4.7.4. Chemical state.
Being an element, mercury cannot be broken down or degraded into harmless
substances (EPA 1997; Lacerda 1997). Several forms of mercury occur
naturally in the environment. and the most common forms of mercury found
are metallic mercury [Hg], mercuric sulphide [HgS], mercuric chloride [HgCl2]
and methylmercury [HgCH3]. Some microorganisms and natural processes
can change the mercury from one form to another (EPA 1997). Mercury is
released into the atmosphere from natural sources such as volcanoes and off-
gassing from the earth’s crust, etc. (EPA 1996; UNEP 2002).
Mercury exists in the following main states under natural conditions:
(WHO 1991; EPA 1996).
• As metallic vapour and liquid/elemental mercury
• Bound in mercury containing minerals [solid]; e.g. coal
• As ions in solution or bound in ionic compounds [inorganic and organic
salts];
• As soluble ion complexes;
• As gaseous or dissolved non-ionic organic compounds
• Bound to inorganic or organic particles/matter by ionic, electrophilic or
lipophilic adsorption.

49
4.8. Production of mercury.
4.8.1. Source.
Mercury is a natural component of the earth, with an average abundance of
approximately 0.05 mg/kg in the Earth’s crust, with significant local variations.
World production of mercury is about 8000 tonnes / year and reserves are
thought to be about 600,000 tonnes (EPA 1997). Spain and Italy are the
traditional sources of mercury (World of Chemistry 2007). The Spanish mines
at Almadén and the Italian [now Slovenian] mines at Idria have been worked
continuously since Roman times (Goldwater 1972).
Mercury ores that are mined generally contain about 1% mercury, although
the strata mined in Spain typically contain up to 12-14% mercury. There are
25 principal mercury minerals known but the only deposits that have been
harvested for the extraction of mercury are cinnabar [HgS] (WHO 1991).

50
4.8.2. Process.
The most economical way to produce mercury is to roast the ore with lime
[CaO], or iron metal [Fe], or air [O2], which oxidizes the sulphur to [SO2] or
[FeS], and volatilizes the mercury, which is then condensed and collected.
The reaction begins at about 250°C [4820F] and is complete by 800°C
[14720F]. The metal is usually extracted by heating cinnabar in a current of air
and condensing the vapour.
The equation for this extraction is:
HgS + O2 → Hg + SO2
Because cinnabar ore is relatively concentrated, it can be processed directly
without any intermediate steps to remove waste material.
The first step is to roast the ore:
• The ore is first crushed in a cone crusher.
• The crushed ore is then ground even smaller by a series of mills.
• The finely powdered ore is fed into a furnace or kiln to be heated.
• Heat is provided in the lower portion of the furnace or kiln.
• The heated cinnabar [HgS] reacts with the oxygen [02] in the air to
produce sulphur dioxide [SO2], allowing the mercury to rise as a
vapour.

51
The next stage is to condense the mercury:
• The mercury vapour rises up and out of the furnace or kiln along with
the sulphur dioxide, water vapour, and other products of combustion.
• The hot furnace exhaust passes through a water-cooled condenser. As
the exhaust cools, the mercury with a boiling point of 357°C, [675°F] is
the first to condense into a liquid, leaving the other gases
and vapours to be vented or to be processed further to reduce air
pollution.
• The liquid mercury is collected. Because mercury has a very high
specific gravity, any impurities tend to rise to the surface and form a
dark film or scum.
• These impurities are removed by filtration, leaving liquid mercury that is
about 99.9% pure. The impurities are treated with lime to separate and
capture any mercury, which may have formed compounds (Stwertka
1996).
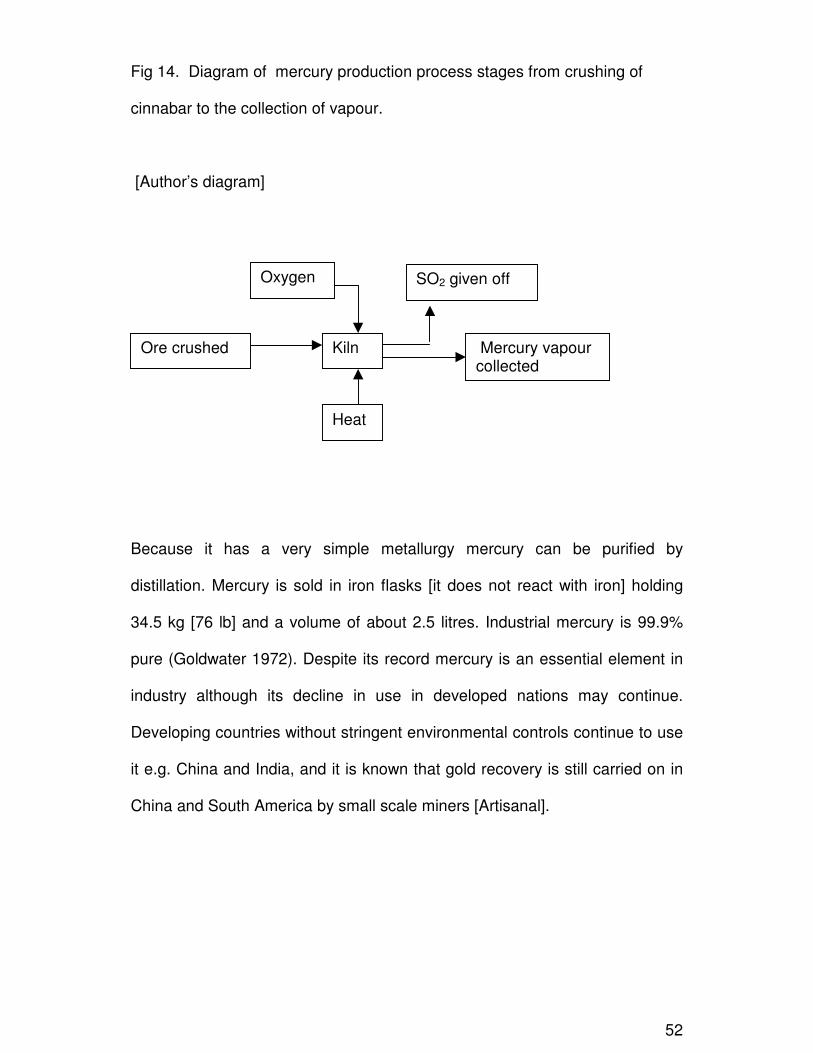
52
Fig 14. Diagram of mercury production process stages from crushing of
cinnabar to the collection of vapour.
[Author’s diagram]
Because it has a very simple metallurgy mercury can be purified by
distillation. Mercury is sold in iron flasks [it does not react with iron] holding
34.5 kg [76 lb] and a volume of about 2.5 litres. Industrial mercury is 99.9%
pure (Goldwater 1972). Despite its record mercury is an essential element in
industry although its decline in use in developed nations may continue.
Developing countries without stringent environmental controls continue to use
it e.g. China and India, and it is known that gold recovery is still carried on in
China and South America by small scale miners [Artisanal].
Ore crushed Kiln
Heat
Oxygen
Mercury vapourcollected
SO2 given off

53
Chapter 5. Toxicity.
5.1. Hazard.
It was in the mining of the element that mercury first became associated with
human illness (Goldwater 1972). Mr. John Welsh, a Mines Inspector with
Worksafe Australia {Australian Government department] in 1976, reported
that many miners in Australia were still using mercury in their gold saving
processes and some had been doing so for 40 years. He stated that he had
noticed a number of health problems associated with them including loss of
teeth, lethargy and similar problems to those listed in symptoms of mercury
poisoning (personal correspondence).
Mercury is of significant concern as an environmental pollutant that can bio-
accumulate [an increase in the concentration of a chemical in a biological
organism over time, compared to the chemical's concentration in the
environment]. It can enter our bodies via food, drinking water and air. As trace
elements, some heavy metals are essential to maintain the metabolism of the
human body, but at higher concentrations they can have a detrimental effect.
Mercury has no known biological function to human biochemistry or
physiology and does not occur naturally in living organisms (EPA 1997).

54
For adults, mercury poisoning is usually [but not always] a reversible problem.
The body can rid itself of mercury if the exposure to mercury is halted.
However, for children and developing fetuses, mercury poisoning can cause
long-term neurological problems. Mercury exposure before birth has been
linked to lower intelligence and delays in learning motor skills (WHO 1990;
EPA 1997).
5.2. Psychological effects.
Excitability and tremors are results of the deposition of mercury in the nervous
system (Barragard 1991). There is a rapid transfer of the vaporized form from
blood to the brain; transformation of metallic mercury to the inorganic form in
the brain results in accumulation (Bluhm et al. 1992). Both forms may be toxic
in the brain. Unsteadiness and tremor when trying to move or to hold objects
[intention tremor] and various manifestations of excitability can develop after a
long latent period (Roels et al. 1982).
Damaged brain functions can cause degradation of learning abilities,
personality changes, tremors, vision changes, deafness, muscle un-
coordination and memory loss (Piikivi & Tolonen 1989). Limited information
from deceased miners showed mercury concentrations in the brain, years
after cessation of exposure, of several mg/kg, with still higher values in
some parts of the brain (Kishi et al. 1993).

55
Compounds accumulate in living things any time they are taken up and stored
faster than they are broken down [metabolised] or excreted. Metals have
played an important role in medicine for years throughout history and, as
already noted, many are essential in our diets in varying quantities, although
people have only recently realised their significance. This could probably be
attributed to our increased awareness of personal and family health. However,
at the other extreme, certain metals which can enter the body via a variety of
routes are toxic, even in trace amounts, leading to toxicity (Goldwater 1972).
Because it is a neurotoxin8 it is highly toxic to humans, animals, and the
environment (Piotrowski et al. 1975; WHO 1990).
The form in which mercury occurs determines how toxic it is. Inhalation of
elemental mercury vapours is one of the main causes of toxicity in humans,
as mercury is well absorbed by the lungs. To develop problems by inhalation
you need either a large one-time exposure or a long-term exposure (Hursh et
al. 1976).
5.3. Dose.
The toxicity of a chemical is determined by the dose or amount taken into the
body and the specific effects depend on the amount or concentration that
8 A neurotoxin is a toxin that acts specifically on nerve cells called neurons.

56
reaches the organs that are sensitive to the chemical e.g. brain and kidneys
(Piiviki et al. 1989; Kishi et al. 1993). The dose needed to bring about a
definite undesirable result on a body differs from person to person. Toxicity
assessment is made difficult by biological variation. Ethically we can not carry
out objective tests on humans so the best methods available rely on
observing the results of accidents and animal experimentation. Because
humans will not necessarily show the same reactions as animals we have to
be very careful when extrapolating from animal experiments. In the case of
metallic mercury we are interested in the concentration [LC 50] due to the
vapour being the main risk factor. The TLV in New Zealand for mercury is a
time weighted average [TWA] of 0.05 mg/m3 (OSH 1994), this is below the US
figure of 1.0 mg/m3 (OSHA 2007). There is no short term exposure level
[STEL] for mercury in New Zealand.
5.4. Body burden.
The general population is primarily exposed to mercury through the diet and
dental amalgam. WHO (1976) estimated that in industrial countries about
3% of the total consumption of mercury was used for dental amalgam.
Mercury amalgam has been used extensively as a tooth - filling material for
more than 150 years and accounts for 75-80% of all single tooth
restorations (Bauer & First 1982; Wolff et al. 1983).

57
Factors that affect the amount of mercury reaching an organ are the rate at
which it enters the bloodstream; the rate at which it is distributed to the
different body organs; and changes in its chemical structure that may occur in
the different organs due to metabolism (Piotrowski et al. 1975). Other
chemicals in the body can alter the rate of transformation from metallic
mercury to inorganic mercury and the distribution to different body organs
(WHO 1990). Mercury distributes to all tissues and reaches peak levels within
24 hours, except in the brain, where peak levels are achieved within 23 days
(Hursh et al. 1976)
Methylmercury incorporated into biological tissues is most toxic to humans.
The concentration of CH3Hg generally increases with each step up the food
chain. Therefore, even though the concentrations in water may be very low
and deemed safe for human consumption as drinking water, the concentration
levels in food, especially fish, may reach levels that are considered potentially
harmful to humans. In New Zealand the levels for mercury in food is 0.5mg/kg
(NZFSA 2006) and in water, 2 mg/L (DW guidelines 2005).
5.5. Absorption.
When inhaled, about 80 percent of elemental mercury is absorbed into the
blood stream through the alveoli (Kishi 1993). When ingested, only a small
amount [0.01%] is absorbed through the gastrointestinal tract, making toxicity
from this route rare (Hursh et al. 1976). Dermal absorption also is negligible.

58
Mercury exists in several different forms that can be changed to others and
these different forms have an effect on how they are absorbed (WHO 1991).
The charge and chemical form of mercury affect how it is absorbed and
transported in the body (WHO 1991). Uncharged mercury can move into cells
readily ( Piikivi et al. 1989). In the body, conversion to the charged, inorganic
form predominates but other transformations can occur (Ashe 1953). In
contrast, metallic and organic mercury can more readily cause brain damage
since they can pass through the protective blood-brain barrier (Piikivi et al.
1989). These compounds can also cause kidney toxicity in part because they
are readily transformed to inorganic mercury in the body (NAS 1978). Organic
mercury compounds can accumulate in living organisms such as fish [part of
the food chain] (WHO 1991). The kidneys eventually accumulate a major
proportion of the total body burden due to their rich blood supply (Roels et al.
1982).
Table 2. Absorption of metallic mercury by route of contact.
Source: WHO 1991.
Ingestion Dermal contact Inhalation
Low for liquid form Moderate for vapour High for vapour

59
Although elemental mercury dissolves in the blood upon inhalation some
remains unchanged and may remain in plasma where it can be transported to
organs such as the brain (Clarkson 1989). It may also enter red blood cells,
where it is readily transformed to the inorganic form. Inorganic mercury can
either return to the blood plasma and combine with carrier proteins there or
remain in the red blood cell (Halbach & Clarkson 1978) Once inhaled into the
lungs, elemental mercury vapours rapidly enter the bloodstream and
dissolved vapour can undergo rapid oxidation (Clarkson 1989).
5.6. Carcinogenicity.
The effects of elemental mercury on the central nervous system have been
extensively studied. However, much less is known, from either humans or
experimental animals, of its reproductive toxicity, genotoxicity, or
carcinogenicity; the limited information that is available would tend to indicate
that such effects are unlikely at exposure levels that do not cause central
nervous system effects. Most of the studies rely on assessment of exposure
at the time of study, which may not be fully informative, as mercury has a long
half-life in the body and thus accumulates in continuous exposure.
Furthermore, it is possible that the exposure has decreased over time, and
thus the exposure measured at the time of the study may represent an
underestimate. However, the few studies that have measured data on
exposure over long periods of time yield very similar results, despite having
only a single point estimate of the exposure (Seigneur et al. 2004).

60
In 1993, IARC evaluated metallic mercury and inorganic mercury compounds
and found that there was inadequate evidence in experimental animals to
show carcinogenicity of metallic mercury. Pirrone et al. (2001) cited a number
of studies of occupational mercury exposure, including studies done after the
IARC evaluation in 1993, and concluded that lung cancer is the only cancer
form, which seems to have consistently increased among various groups of
workers exposed to metallic and inorganic mercury. WHO (1991) reported
that while carcinogenicity and mutagenicity are not commonly associated with
mercury exposure. Mercury can cross the placental barrier where exposure
can lead to spontaneous abortion, congenital malformations and severe
neurological defects such as cerebral palsy (WHO 1991).
5.7. Dermal.
Direct contact of the skin with mercury can lead to dermatitis. Dermal
absorption of elemental mercury is limited and Hursh et al. (1989) estimated
that dermal absorption contributes approximately 2.6% of absorbed mercury.
Exposure to elemental mercury vapours for acute or intermediate duration can
result in a response known as acrodynia or "pink disease" (Schwartz et al.
1992). This is characterized by peeling hands and soles of feet, excessive
perspiration, itching, rash, joint pain and weakness, elevated blood pressure
and tachycardia (Bluhm et al. 1992). Rash and stomatitis have been reported
after high inhalation exposures (Barregard et al. 1996).

61
5.8. Excretion.
Elimination of mercury occurs primarily through the urine and faeces, with
expired air, sweat, and saliva contributing to a much lesser extent (EPA
2007). Urine and faeces are the main excretory pathways in humans, with an
absorbed dose half-life of approximately 1– 2 months (Clarkson 1989). After a
short-term high-level mercury exposure in humans, urinary excretion accounts
for 13% of the total body burden. After long-term exposure, urinary excretion
increases to 58% (Hursh et al. 1976). Exhalation through the lungs and
secretion in saliva, bile, and sweat may also contribute a small portion to the
excretion process (Joselow et al. 1968).
Table 3. Estimated average daily intake and retention [µg/day] of total
metallic mercury in the general American population not occupationally
exposed to mercury.
Exposure Elemental mercury vapour
AirFood Fish Non – fishDrinking waterDental amalgams
0.03 [0.024]0003.8 – 21 [3 – 17]
Total 3.9 – 21 [3.1 17]
Table 3 from: Environmental Health Criteria 101: Methyl mercury (WHO
1990). Values given are the estimated average daily intake; the figures in
parentheses represent the estimated amount retained in the body of an adult.

62
5.9. Acute poisoning.
Many reports of acute poisonings in both adults and children after various
exposure scenarios have been, and continue to be, published (ATSDR,
1999). However, only a limited number of reports that have information on the
dose or exposure levels are available.
5.9.1. Mercury poisoning cases.
A case involved mercury poisoning in a family of four after an in-home
smelting operation involving the freeing of gold from amalgam by one of the
family members. Two of the victims exhibited shortness of breath, malaise,
nausea, vomiting, and diarrhoea within 24 hours of exposure. Three days
after exposure, the patients, [one male, one female] showed signs of adult
respiratory distress syndrome. On day 5, chelation therapy was begun. One of
the patients died on day 7 and the other on day 9 from cerebral oedema. Two
other victims, a woman and a man, died from cardiac arrest after 21 and 23
days, respectively. The serum and urinary mercury levels prior to chelation
therapy for the woman were 3.2 and 34 nmol/litre, respectively. The blood and
urinary levels of mercury for the man prior to chelation were 4.0 and 105
nmol/litre respectively, (Gottlieb & Kanuluen, 1991).
The author was involved in a case where a teacher broke a thermometer in
his car and the mercury became dispersed inside. He continued to drive the

63
car in the winter with heater on and windows up. He became unwell and was
lethargic. Eventually his doctor took a blood test that revealed high blood
mercury levels. On measurement his car was found to have mercury vapour
levels of 0.7 mg/m3. Once the car was decontaminated his symptoms
disappeared.
An occupational case involved a 29-year-old male who was employed for 5
years in a lamp socket manufacturing facility in Taiwan. His pre-treatment
urinary and blood mercury concentrations were 610 µg/litre and 23.7 µg/dl,
respectively. The man displayed a variety of symptoms, including blurred
vision, dysarthria9, prominent gingivitis10, tremor (usually postural and
intentional), unsteady gait, and slow mental response. The time-weighted
average (TWA) concentration of mercury in the air in the room where this
individual spent most of his working time during his employment was
0.945 mg/m3. A 27-year-old female who had been on the job in the same
Taiwanese lamp socket manufacturing facility for 1.5 years also showed a
variety of symptoms, including gum pain, dizziness, poor attention, bad
temper, some numbness, hypersalivation, hyperhidrosis, and fatigue. This
individual, whose work had been primarily in a room having a TWA mercury
air concentration of 0.709 mg/m3, had initial urinary and blood mercury levels
of 408 µg/litre and 10.5 µg/dl, respectively, but did not require chelation. Her
symptoms abated fully approximately 2 months following discontinuation of
exposure (Yang et al. 1994).
9 Dysarthria - the term used to describe difficulty with speech production.
10 Gingivitis – is an inflammation of the gums – the initial stage of gum disease.

64
Chapter 6. Environment.
6.1 General.
It is well known that there are large areas of the world where there are
naturally elevated levels of trace metals that have resulted in metal excesses
and chronic poisoning in people / animals that live in the area (Scoullos et al.
2000; UNEP 2002). Man’s use of the earth’s resources has been very
inefficient and wasteful. Through a lack of knowledge, and in some cases a
lack of care, he has contaminated the environment with industrial waste in the
rush to make money and exploit those resources. Environmental pollution is
increased by this attitude, and a combination of man made and natural
mercury releases to the environment has resulted in high levels of
contamination of land, water, air and food.
6.2. Airborne mercury.
Mercury in the air eventually ends up in rivers and lakes where it can be
readily taken up into the food chain. Lacerda (1997) estimated the yearly
global releases of mercury to the environment from gold extraction at up to
460 metric tonnes / year in the late 1980’s and early 1990’s, being equivalent
to about 10 % of total global anthropogenic releases. Mercury is present at
very low levels throughout the biosphere and its absorption by plants may

65
account for the presence of mercury within fossil fuels like coal, oil and gas
(WHO 1990; NTIS 2007). Nearer to New Zealand, Dhindsa et al. (2003)
estimated that 1903 tonnes of mercury was released to the environment at
Gympie in Queensland, Australia during 60 years of gold mining and, of that,
1236 tonnes were released into the air.
Recent estimates, which are highly uncertain, of annual total global mercury
emissions from all sources, natural and anthropogenic, are about 4,400 to
7,500 metric tonnes emitted per year. Fig 15 below provides information
about the worldwide distribution of mercury emissions.
Fig 15.
Source: Presentation by J. Pacyna and J. Munthe at mercury workshop in
Brussels, March 29-30, 2004 quoted by USEPA mercury emissions: The
global context .

66
6.3. Mercury as a pollutant.
Mercury is a global pollutant with complex and unusual chemical and physical
properties. The major natural source of mercury is the degassing of the
Earth’s crust, emissions from volcanoes and evaporation from natural bodies
of water. The non–natural causes are man made.
Mercury is mostly present in the atmosphere in a relatively unreactive form as
a gaseous element (WHO 1991). The long atmospheric lifetime of its gaseous
form means the emission, transport and deposition of mercury is a global
issue (Lacerda 1997). Once in the environment, mercury is persistent, it never
goes away and mercury vapour is converted to soluble forms and deposited
by rain onto soil and water. The atmospheric residence time for mercury
vapour is up to 3 years, whereas soluble forms have a residence time of only
a few weeks (WHO 1990). Mercury will bioaccumulate and increase the
concentration in the environment and any biological organism exposed to that
environment over time (Heiserman 1992). Mercury occurs in three valence
states in nature: elemental mercury [metallic, Hg°], monovalent mercury
[mercurous, Hg2+2 ] and divalent mercury [mercuric, Hg2+]. Of the two ionized
states, monovalent and divalent mercury, the latter is more stable and more
common in the environment (NAS 1978).

67
The earth’s surface soils, water bodies and bottom sediments are thought to
be the primary biospheric sinks for mercury (UNEP 2002). The adsorption of
mercury to soil is dependent upon the organic content of the particular soil or
sediment (Blume & Brummer 1991).
6.4. Mining.
Gold mining is a source of mercury discharge to the environment as well as
being a source of harm to the health of the handlers. Mercury that is not
inhaled or washed away during the amalgamation process settles into the
surrounding environment, where it is absorbed and processed by a variety of
living organisms, this process transforms elemental mercury into methyl
mercury, one of the most toxic organic compounds and a powerful neurotoxin
and food chain bioaccumulator (UNEP 2005). Approximately 95% of all
mercury used in small-scale gold mining is released into the environment,
constituting a danger on all fronts - economic, environmental and human
health (EPA 1997). It is estimated that over 13 million people work as
artisanal miners [S6.5 p 68] worldwide (Agency 1999) and many of those are
exposed in a manner that leads to health problems.

68
6 .5. Artisanal.
Hentschel et al. (2002) has described artisanal mining as, “small-scale mining
by individuals, groups, families or cooperatives with minimal or no
mechanisation, often in the informal [illegal] sector of the market.” Artisanal
gold mining is a significant source of mercury release into the environment in
the developing world, with at least a quarter of the world's total gold supply
coming from such sources, according to the Basil Action Network (BAN
2007). Small-scale gold miners combine mercury with gold-carrying silt to
form an amalgam to make gold recovery easier. Much of the retorting to
recover gold from the mercury is done in the home using very primitive
equipment and polluting the home. A Chemical & Engineering (2007) report
stated 220 - 250 metric tonnes of mercury are discharged into the atmosphere
from gold mining in China, with Indonesia discharging 100-150 tonnes and a
number of other countries discharging variable amounts between 10 -30
tonnes. [Fig 15 page 65].
It is very difficult to pour mercury without splashing or spilling. Falling drops
break into small droplets, many of which are too small to be seen with the
naked eye. Such small droplets will not agglomerate, so that decontamination
of an area where mercury has been spilt is extremely difficult (Goldwater
1972).

69
6. 6 Food chain.
A very important factor in the impact of mercury to the environment is its
ability to build up in organisms and the food chain. Although all forms of
mercury can accumulate to some degree, methylmercury is absorbed and
accumulates to a greater extent than other forms. Whereas absorption is a
property of the body, bioavailability reflects the nature of the medium or matrix
(ATSDR 1999). Inorganic mercury can also be absorbed, but is generally
taken up at a slower rate and with lower efficiency than is methylmercury
(EPA 1997). Elemental mercury can be converted to methylmercury [CH3Hg]
in aquatic environments by microbial metabolism [biotic processes] such as
by certain bacteria and by chemical processes that do not involve living
organisms (Lindberg et al. 2001; Ullrich et al. 2001)
A typical pattern of biomagnification is shown in figure 16 on page 70.
“Inorganic mercury settles to the bottom sediment where bacteria transform it
to methylmercury through the process of biomethylation. It begins with a
hypothetical water concentration of 1ng/kg [or 1 part per trillion, 1ppt]. After
methylation, the methylmercury [CH3Hg] is readily absorbed and retained by
any organism in the food chain. Each organism eventually bioaccumulates
mercury to a concentration of about 10 times greater than in its food. Hence
bacteria phytoplankton would have 10 ng/kg [or 10 part per trillion, 10 ppt].
70
The next, protozoa and zooplankton, would accumulate 100 ng/kg and so on
up the food chain and human or other predators (illustrated by a kingfisher)
consume fish with 1 million ng/kg [1 ppm] concentration. The entire process is
referred to as food chain biomagnification” (ATSDR 1999).
Fig 16. Typical Pattern of Mercury Biomagnification up the food chain.

71
Source: ATSDR 1999.

72
6.7. Atmospheric mercury.
The atmosphere is essential to man’s wellbeing and the pollution of it is
directly related to increased industrialisation and growing urban populations
and these are a greater source than natural pollution [e.g. global warming or
volcanic eruption].
6.7.1. Mercury cycle.
The environmental mercury cycle is further complicated because certain
forms of mercury are volatile (Heiserman 1992). Unlike most metal pollutants
whose movement is limited to erosion or leaching pathways, mercury is
readily transported in the atmosphere (Carpi 1997) and has an atmospheric
half-life of approximately one year (Lindqvist & Rodhe 1985). Elemental
mercury is eventually removed from the atmosphere by oxidation to water
soluble species and by dry deposition (Carpi 1997).
There are two main types of reactions in the mercury cycle that convert
mercury through its various forms: oxidation-reduction and methylation-
demethylation. In oxidation-reduction reactions, mercury is either oxidized to a
higher valence state [e.g. from relatively inert Hg0 to the more reactive Hg2+]

73
through the loss of electrons, or mercury is reduced, the reverse of being
oxidized, to a lower valence state (Environment Canada 2007).
The oxidation of Hg0 in the atmosphere is an important mechanism involved in
the deposition of mercury on land and water. Elemental mercury Hg0 can
volatilize relatively easily and be emitted to the atmosphere, where it may be
transported on wind currents for a year or more and be re-deposited in the
environment for further cycling. In contrast, Hg2+ has an atmospheric
residence time of less than two weeks due to its solubility in water, low
volatility and reactive properties. Hence, when Hg0 is converted to Hg2+, it can
be rapidly taken up in rain water, snow, or adsorbed onto small particles, and
be subsequently deposited in the environment through "wet" or "dry"
deposition (Environment Canada. 2007).
The partition of mercury is affected by environmental parameters such as pH,
temperature, redox changes, availability of nutrients and complexing agents
(Ullrich et al. 2001). Inorganic mercury has a propensity to bind with mineral
particle and detrital organic matter, whereas methylmercury tends to bind with
biogenic particles (Meili 1997).

74
Fig 17. Pctorial depiction of the mercury cycle showing the deposition and
volatisation of mercury.
Source: Environment Canada 2007.

75
Fig 17 is a simplified mercury cycle that shows the transport and fate of
mercury and any contaminated sediments into waterways. It includes overall
methylation reactions and bioaccumulation. The actual cycle is much more
complex.
6.7.2. Anthropogenic pollution.
Anthropogenic effects or processes are derived from human activities, as
opposed to natural effects or processes that occur in the environment without
human influences. The atmospheric total of vapour-phase mercury is
attributed to anthropogenic and natural sources (Nriagu 1989). Important
anthropogenic sources of mercury include the combustion of coal, municipal
solid waste and sewage sludge, mining and smelting of metals, and
production of chloralkali (EPA 1997). Natural sources of atmospheric mercury
include volcanoes, degassing from mercury mineral deposits, emission from
surface waters and natural terrestrial emission. In addition, water and soil are
affected by atmospheric deposition and thus are integral to the continual
global cycling of environmental mercury (WHO 1990).
In fig 18 on page 75 the anthropogenic emissions are roughly divided
between re-emitted emissions from previous human activity, natural
emissions and direct emissions from current human activity (Seigneur et al.
2004). This graph would indicate that 2/3rds of the emissions are caused by
man’s activities past and present.

76
Fig 18. Natural and man made global mercury emissions.
Source: Seigneur et al. 2004. Mason and Sheu 2002 quoted by
USEPA mercury emissions: The global context .
6.7.3. Speciation.
Speciation is the term commonly used to represent the distribution of a
quantity of mercury among various species of which the main groups are
elemental mercury, inorganic and organic forms (Carpi 1997). Speciation
plays an important part in the toxicity and exposure of mercury to living

77
organisms especially its biomagnification (Nriagu 1989). Atmospheric
speciation plays an important role in the long-range transport of mercury,
[Fig 16 page 70] as well as in deposition mechanisms (Lindqvist & Rodhe
1985)
The atmospheric chemistry of mercury involves several interactions (Pirrone
et al. 2001):
• Gas and aqueous phase reactions;
• Partitioning of elemental and oxidised mercury species between the
gas and solid phases; the gas and aqueous phases; and also the solid
and aqueous phases
The change in speciation of mercury from inorganic to methylated forms is the
first step in the aquatic bioaccumulation process (Pirrone et al. 2001). This
can occur non-enzymically or through microbial action. (Carpi,1997; Pirrone et
al. 2001a). Organic matter affects the level of methyl mercury through
influencing the microbial activity and controlling the partition of Hg between
solid and dissolved phase by serving as complexing agents for Hg2+ and
methylmercury (Lambertsson & Nilsson 2006).
78
Chapter 7. Amalgamation.
7.1. History.
Amalgamation is one of the oldest methods of extracting gold from its
ores. According to Malm (1998) it has been used for more than 4500
years. Because mercury alloys easily with many metals, such as gold,
silver, and tin it is a very desirable and cheap means of recovering fine
gold. An article in Chemical & Engineering News (2007) stated
“Amalgamation of gold ores as described by Agricola in De Re Metallica,
which was published in 1556, is essentially the same as modern practice.
The only changes are in the machinery employed and the source of
power to grind, mix, and separate. However, although the chemical and
physical processes are more clearly understood by more recent authors,
the actual hands on instructions are remarkably similar and De Re
Metallica can still be used as a reference.”
7.2. Theory of amalgamation.

79
Although the physical and/or chemical characteristics that make
amalgamation work are not clearly understood, it is known that if clean
mercury is brought into contact with clean gold, they combine or amalgamate.
This gives an alloy of gold and mercury called amalgam. The gold can be
removed from the amalgam by dissolving mercury in nitric acid or by driving it
off as vapour using heat and leaving the gold behind. For amalgamation to
take place the gold and mercury must be brought into contact with each other.
To achieve this, gold particles need to be separated from the fine mix of sand
and silt and the gold and mercury kept clean and bright. Once the amalgam
has coalesced it can be treated to extract the gold (Baird 1987).
Amalgamation works best on relatively coarse gold that is clean. Mercury will
not penetrate into minute crevasses or pores so the ore must be ground fine
enough to expose the gold at the surface. Very fine gold is often hard to save
using mercury, and other methods are usually required, [cyanide process].
The presence of sulphides of arsenic, antimony or bismuth [impurities in gold]
will cause the mercury to become “dirty” and this makes the recovery of gold
by amalgamation difficult.
If the mercury will not wet, or take up the gold, or coalesce into larger globules
it is described as being “sick“ - most likely caused by impurities in, or on, the
surface of the mercury (Baird 1987). Baird calls this “flouring” which is the
division of the mercury into extremely small globules that gives it a white flour-
like appearance. This makes the mercury more susceptible to sickening while
it is in the finely divided state and it will not coalesce. Any gold that was

80
combined with the mercury before it sickened is likely to be lost. This’ “dirty”
mercury can be purified by distillation or a dilute nitric acid wash which will
remove base metals, or it can be filtered through chamois skin to remove
impurities (Beard 1987).
The stages of the manual amalgamation process are shown in the schematic
diagram in Fig 19a. This diagram has been drawn up by the author based on
the information contained in this document
Fig 19a. Diagram of the gold saving process after gold is crushed and
mercury added to form amalgam.
Source: Author diagram.
Gold crushed and cleaned
Gold/mercury slurry mixedby hand to amalgamate
Amalgam treated to separategold and mercury
Mercury saved for reuse
Waste
Gold
Mercury

81
In the larger mining companies the amalgamation process, where used, is
more mechanised and each of the above steps is incorporated using a
continuous process. A method used on the early New Zealand goldfields
involved the stamp mill where the ore was crushed and the gold slurry was
directed over amalgamation plates. The stamp mill was replaced in the 1930s
by the ball mill where mercury was fed into the tumbler of the mill with the ore
and then passed over prepared plates.
The plates, which are pure annealed copper are scoured with sand and lye to
remove any coating or oxidation, then rinsed with clean water and washed
with a 2% to 3% solution of cyanide. A mixture of sal ammoniac and fine sand
in solution with mercury is scrubbed onto the plate and as much mercury as
the plate can hold is added. After coating, the plate is washed with clean
water and rinsed with the cyanide solution .
Fig 19b. Use of mercury plates to continuously save gold. [Author diagram].
Ore crushed to release gold
Gold from slurry combineswith mercury on platesMercury
added toplates

82
The gold slurry mix flows over the plates where the gold sticks to the mercury
and gradually dissolves to form amalgam. When the plates are loaded with
amalgam, mercury is sprinkled on the surface to soften it and the whole
surface scraped with a hard wood or rubber scraper to remove the amalgam.
The whole process of adding mercury to the plates is done again and the
plate returned to service.
After the amalgam is collected the larger globules are separated from the
slurry. Gravity separation is usually employed. Sluices, jigs, tables,
wheels, pans or any other gravity devices are used. The excess mercury
is removed by squeezing it though a damp chamois or canvas leaving a
hard lump of amalgam ready for retorting (Beard 1987).
Plates are no longer used but the manual process is still used by small gold
miners to recover gold from placer / alluvial deposits. This method requires no
advanced equipment or procedures, just an amalgamation table, some
buckets, and the mercury as shown in Fig 19a, p 79. It is a wasteful
procedure, and not only is fine gold lost, but more importantly, so is mercury
Mercury/gold amalgamscraped from plates
Mercury saved for reuse
Waste
Gold

83
to the environment. UNEP (2005) estimated 100 tons of metallic mercury is
dispersed to the environment in the Brazil region every year by small miners.
No quantification of the gold lost has been done. Apart from the environmental
damage from the lost mercury there is a financial cost from the loss of fine
gold that is carried off to waste with the mercury.
7.3. New Zealand mines & amalgamation.
Amalgamation plates were used in New Zealand historically into the early
1900s and then they were phased out in favour of the cyanide process. This
process was too expensive and labour intensive for the small miners who
continued to use mercury with the manual process. Currently in New Zealand
[2007] mercury appears to still be the chemical of choice for small miners to
save gold.
During the period of this study all participants were using the manual mercury
amalgamation process as their means of gold recovery. [S3.5. p 28]

84
Chapter 8. Research Objectives.
8.1. General.
A literature search carried out during the study, and since it was revisited, did
not find any research into the New Zealand gold mining industry. The author
decided to carry out a study of the gold mining industry on the West Coast of
New Zealand’s South Island with the intent of investigating the use of metallic
mercury. This was the first and, to-date, only study on the subject within a
New Zealand context. We know that mercury affects the environment and the
food chain as research has been done on this (Carpi 1987; WHO 1990; EPA
1997; Ulrich et al. 2001.) The toxicity of metallic mercury and its effects on
humans has also been well researched (NAS 1978; Roels 1982; Clarkson
1989; WHO 1991).
8.2. Specific objectives of this study were to:
• Investigate the use of mercury in the West Coast gold mining industry.
• Identify any problems associated with its use.
• Make recommendations based on the study findings.
• Identify areas for future research.
Accessibility to mining sites and their distances from the office created
difficulties in carrying out this research. A lack of resources as well as a
reluctance of some miners to be involved in the research [for various reasons]
added to the problems that had to be overcome before a meaningful study
was started. Months were spent in overcoming miner resistance/ suspicion
and obtaining the minimum of resources.

85
Chapter 9. Health and Safety.
9.1. General
Modern gold mining is an industry that has risk associated with it. Risk that is
known and planned for is the operation of heavy machinery, heavy lifting and
slips or falls. Chemicals are an essential part of the industry but often risk is
ignored due to a lack of knowledge, or the need to get the job done. Mercury
is one of the chemicals used and Larcerda (1997) states that over 20,000
people were afflicted by mercury poisoning over a 40 year period and most of
this was industrially based. History shows that mercury, whilst being of benefit
in some industry, creates many problems (WHO 1991; WHO/IPCS 2002).
9.2. Occupational Safety.
9.2.1 Legislation.
At the time the study was undertaken [1984-88] the relevant New Zealand
legislation covering the gold mining industry were, The Mining Act 1971, The
Factories and Commercial Premises Act 1981 and the Quarries and Tunnels
Act of 1982 and Regulations made under those Acts. A Workplace Standard
based on the American Conference of Government Industrial Hygienists
(ACGIH 1976) that set a TLV [see glossary] for chemicals in occupational use,
was adopted by the New Zealand Government. These Standards set a level
for mercury in air of 0.05 mg/m3 in the workplace and were used by the Health
Department and Labour Department for air measurement compliance. There

86
have been major changes to Health and Safety legislation since this study
was carried out. [S9.2.4].
9.2.2. Administration.
As stated above, during the period of the survey [1984-88] the main Health
and Safety legislation in force were:
• The Mining Act 1971, The Quarries and Tunnels Act 1982, and
Regulations under those Acts, administered by the Mining Inspectorate
of the New Zealand Mines Department, a Government department.
The mining industry on the West Coast was the largest in New Zealand
and it covered both coal and gold mining. There were [3] three mining
inspectors based in Greymouth to service the West Coast region.
• The Factories and Commercial Premises Act 1981 and Regulations,
administered by the Labour Department, a Government department
with an office in Greymouth staffed by [3] three Factory Inspectors.
• The Health Act 1956 and Regulations, administered by the Department
of Health, a Government department, with an office in Greymouth
staffed by one [1] Inspector of Health.
These [3] three Government departments were responsible for the
administration of all occupational health legislation anywhere in New Zealand.
At the time of the survey the Department of Health had specific occupational
health responsibilities in regards to worker’s health under Regulations made

87
pursuant to the Health Act 1956, but mining was not one of them. The author
was the resident Senior Inspector of Health in the Greymouth office at the
time of the survey. Due to the fact that the specific Statutes were administered
only by the department responsible for that legislation during the period, the
oversight of gold miner’s health and safety was split between the Mines
Department and the Labour Department. The Mines Department had the main
responsibility for mine safety with the power to prosecute. Although the Health
Department had an involvement in occupational health generally, it only had a
limited role in the mining industry as an advisor to the other Government
departments.
Some companies had mining, gold processing and administration on the one
site and other companies had their gold processing facilities and
administration at a site away from the mine. The Mines Department
Inspectorate was responsible for any site that was part of the mining licence
with the Labour Department Inspectorate responsible for any work site that
was not part of the mining licence. The Health Department Inspectorate
collaborated with these two Government departments as consultants, carrying
out measurements and providing advice on results, but did not enforce
legislation in mining. This complicated matters in that it increased the number
of officials involved and added to the problem of administering the legislation
to ensure worker’s health and safety was not compromised.

88
9.2.3. Compliance.
The legislation at the time of the survey was adequate to cover physical work
type incidents but not to cover the use of mercury [or other chemicals] in the
gold mining industry. There had been a long period between the goldfield
activity of the late 19th Century and the new activity of the 1980s [approx 60
years]. With an industry in decline there was no need for new legislation that
specifically covered mercury use in gold mining, so when the new gold rush
occurred the “Inspectorate” was not legislatively equipped, or trained, to deal
with it. The Mining Act 1971 and The Quarries and Tunnels Act 1982 were
promulgated to cover coal mining and had little relevance to gold mining.
Because of this time lag between the “gold rushes”, The Mines and Labour
inspectorate, although qualified to carry out their respective roles as it related
to the legislation they policed, had no experience or knowledge of mercury as
used in the gold mining industry.
Prior to this study being done [1984-88], no investigation of mercury use in the
New Zealand gold mining industry had been undertaken. The Mining
Inspectorate had more interest in coal mining which was a major industry at
the time and where their expertise and knowledge was based. The Labour
Department Inspectorate’s expertise was in physical safety, mainly in factories
and forestry, and they had no experience in air monitoring or personal
sampling technique. The Mines Inspectorate had carried out some routine
urine sampling of mining personnel but this information was filed without any
follow up or analysis of the results. No workplace measurements were carried

89
out by either Inspectorate. Consequently the level of compliance with
Standards was not known prior to this study. Very little research was available
on the gold mining industry at all. As the study has shown, the level of
compliance was not good and it was more by good luck than good
management that the level of non-compliance found was not greater.
9.2.4. Current legislation.
There has been a major change in legislation relating to Health delivery in
New Zealand since this survey and this has had implications for occupational
safety. Beginning in 1983, New Zealand’s health system was subjected to two
decades of reform. Up until the 1980s, Hospital Boards had a strictly hospital
focus and were publicly elected [the Department of Health ran non-hospital
public health and some mental health services]. The Government of the day
decided to integrate hospital board curative services with the preventative
focus of district health offices. Fourteen [14] Area Health Boards [AHBs] were
created to provide funding to each region on a population basis. This reform
continued through the 1980s and was characterised by an explosion of
acronyms. Area Health Boards combined hospital and public health services
and their boards were partly publicly elected and partly appointed by the
Government (MOH website visited 10.09.08).
On 1 July 1993 a massive reform took place and the 14 Area Health Boards
became 23 Crown Health Enterprises [CHEs]. CHEs were expected to
compete via the market and meet service for money targets. Four Regional

90
Health Authorities [RHAs] were set up to provide the funding to CHEs; they in
turn came under a Public Health Commission [PHC], under the renamed
Ministry of Health [MOH, as opposed to the old DOH]. CHEs were renamed
Hospital and Health Services [HHSs] in 1996, with greater emphasis on
service provision. However, the idea that hospitals should compete remained
a major part of Government thinking (MOH website visited 10.09.08).
In 1999 the final round of reform was carried out replacing HHSs with the
current District Health Boards [DHBs]. They are responsible for providing [or
funding the provision of] Government funded health care services for the
population of a specific geographical area. There are 21 DHBs in New
Zealand.
The statutory objectives of DHBs include improving, promoting and protecting
the health of communities, promoting the integration of health services,
especially primary and secondary care services, and promoting effective care
or support of those in need of personal health services or disability support
(H&D Act 2000). Unfortunately the DHBs still have a curative approach to
health care that does not sit well with their public health role (MOH website
visited 10.09.08).
With the Department of Health [formerly containing field staff] undergoing
reforms during the same period and becoming a Ministry [comprised of
advisors], there have been changes to field staff. Inspectors of Health have
now become Health Protection Officers [HPOs] with much reduced powers

91
and roles. Support staff for the field officers in head office have been made
redundant and replaced by the afore-mentioned advisors. Legislation
administered by HPOs has gradually been revoked, or incorporated in other
legislation administered by other departments or local authorities. The splitting
off of Health Protection activities to other bodies has resulted in fragmentation
of health delivery and health protection.
Coinciding with this major change to health delivery other changes took place.
In 1990 the New Zealand Government decided that the current situation,
whereby occupational health and safety delivery was fragmented over a
number of Government departments, was not delivering a good service. It
decided that the only way to improve occupational health and safety delivery
was to put responsibility under one department. It chose the Department of
Labour [previously called Labour Department] as the controlling authority. An
Occupational Safety & Health [OSH] branch was set up under the umbrella of
the Department of Labour and The Health and Safety in Employment Act
[HSE] was passed in 1992. This Act consolidated current health and safety
requirements by revoking all the old legislation [The Mining Act 1971, The
Quarries and Tunnels Act 1982, and Regulations under those Acts; The
Factories and Commercial Premises Act 1981 and Regulations; and various
occupational Regulations under the Health Act 1956]. Specific rules were
promulgated for mining in the HSE [Mining Administration] Regulations 1996.

92
The aim of the new Health and Safety in Employment Act 1992 is:
… to promote the health and safety of everyone at work and of other
people in or around places of work. To achieve this, it requires people
who are responsible for work and those who do the work to take steps
to ensure their own health and safety and that of others. The Act also
recognises that employees have a valuable contribution in making
workplaces safe.
The Department of Labour revoked the old 1976 Standards [S9.2.1. p 84] and
replaced them with The Workplace Exposure Standards which became
effective from 1994 [updated in 2002]. Mercury is included among the
substances that have been assigned a TLV in these Standards. However,
compliance with the Standards does not guarantee protection from ill-health
outcomes for all workers, due to the wide range of individual tolerance. The
publication has detailed information on how the Standards are set and how
they should be used. They are a guide only under the Health and Safety in
Employment Act 1992, but under the Hazardous Substances and New
Organisms Act 1996 [HSNO] and subsequent Regulations, they are
enforceable as part of a hazardous substance control. With the promulgation
of the Health and Safety in Employment Act 1992, Health Protection Officers
ceased to have any involvement in occupational health.
The effect of these changes to occupational health delivery and legislation on
present day gold mine worker’s health is further covered under S14.

93
Chapter 10. Methodology.
10.1 General.
The gold mining workforce consisted entirely of males and with an age group
range of 18 years to >60 years, and a mean of 26 years. The gold mining
experience of employees involved in the study ranged from a few months to
many years with a mean of 20 months. Work periods were all very similar in
hours worked [40 hours per week average]. However, some worked shifts that
alternated between night and day time on a week about and others worked
just day time. All participants in this study were involved with mercury for at
least 6 months at time of selection.
This study examined the use of mercury in the gold mining industry through
work place air measurement, observation of processes and procedures,
personal monitoring, and discussion with employees. It looked at the
exposure of employees to mercury through their work processes. Exposure in
this study refers to any direct or indirect contact with mercury. As the study
required the collection of different data over the period of interest, and
employee and company time was involved, it was critical that the mining
companies were brought on board and that there was minimal interference
with their work. To obtain and keep the goodwill of the personnel involved,
especially management, worker involvement was kept to a level consistent
with obtaining meaningful results.

94
To achieve this, visits were kept to a minimum and some personal and
company data was obtained from historical files [1984 – 1986].
Although the period of interest is 1984–1988, the monitoring was carried out
between January 1986–June 1988. Personal sampling data relating back to
1984 was made anonymous before being received and was collected from
historical files. To achieve the objectives of the study the following methods
were used:
• Biological monitoring of employee urine samples [Hg-U].
• A subjective questionnaire designed by the author.
• Work place monitoring of mercury vapour in air levels [Hg–air].
• Personal mercury vapour exposure sampling.
• Observation of worker’s methods and processes used.
• Observation and examination of protective equipment provided to
workers.
• Observation of the work rooms and facilities.
• Discussions with workers and management.
• A literature search involving publications and web search.
Laboratory analysis of biological samples was carried out at the Department
of Scientific & Industrial Research [DSIR], now called the Institute of
Environmental Science & Research [ESR] a Crown research institute.

95
10.2. Cohort.
The participants [n=16] chosen to take part in this study were all men as no
women were employed in this industry. They ranged in age from 20 to >60
years of age and had been involved in the gold mining industry between 1 and
40 years. All had been involved with mercury for at least 6 months before the
study. They were a representative sample of those involved in the industry
despite the fact that not all those that were considered ideal were willing to
take part. Due to the number of employees in the small companies the choice
was limited in that only one person handled the mercury.
Altogether 16 participants were chosen, 8 who handled mercury but did no
retorting and 8 who did retorting. All were from different companies giving a
total of 16 companies involved in this part of the study. Each participant was
given a random identification number that enabled all data relevant to that
person to be kept together and ensured that identification of the person
remained confidential. Participants were spoken to individually and informed
about the study, what it wanted to achieve, and how it would impact on them.
They were given the opportunity to ask questions and raise any issues of
concern and were kept up to date with progress of the study. They were also
given the right to see all information and data collected regarding them.
96
10.3. Control.
The control group was made up of up of employees [n =12] who worked within
the gold mining industry and were of a similar makeup to the cohort under
study, but not involved with mercury. This was made up of 6 personnel from
separate companies and 2 each from 3 companies. Because of the possibility
of cross contamination by mercury in the work place, all these participants
were chosen from field workers. The controls were given a random
identification number and supplied a 24 hour urine sample each year [3
samples per person in total] and they were asked to fill out the questionnaire.
The results from this group were used as a comparison with the mercury
handlers/ retorters. They were also given the right to see all information and
personal data collected about them.
10.4. Observation.
An important part of the study, this was undertaken at the first visit to a
premise and involved a walk through inspection of work places to look at
facilities, processes / practices and protective equipment. A plan of action was
drawn up for each work place. At the time of the study there were no
mandatory standards for building structures or retort ventilation in regard to
mercury use. The use of protective equipment was based on general safety
rules rather than any specific to mercury. Visits were also made to observe,
rather than measure to pick up on any crucial changes to process that might
impinge on the original plan for the site.10.5.
97
10.5. Biological sampling.
Biological monitoring is the measurement of a chemical agent in the blood,
urine, or other body tissue of exposed individuals to determine how much of
the chemical has been absorbed into the body. It serves as an additional
evaluation of environmental exposures and is important because air
measurements can’t assess skin exposure or the effects of work practice. It is
a better estimate of risk than air monitoring since it measures the actual
amount absorbed into the body (WHO 1990).
Blood and urine levels are used as markers to determine exposure to mercury
(Piotrowski 1975; ATSDR 1999). Urine sampling was used instead of blood
sampling because the drawing of blood is an invasive technique. Mercury
levels in the blood decrease by ½ every 3 days if source is removed therefore
blood is more useful as an indication of recent exposure than for long term or
continuing exposure (Roels 1982; OSHA 2007). This study covered long term
usage, and 24 hour urine samples give an average past history of metallic
mercury exposure (WHO 1976).
Exposure to heavy metals through daily living results in the body of an
average person exposed to natural environmental sources reaching a steady
state, through absorption and excretion (WHO 1976). Therefore, we would
expect to find a small amount of mercury in people’s urine. In the workplace,
sampling of urine for mercury will give a meaningful picture of exposure for
research (WHO 1976). It is easy to collect and non -intrusive.

98
10.6. Urinalysis [Hg-U].
The objective of the sampling was discussed with each participant and none
objected to supplying 24 hour samples. Spot sampling of urine for mercury
was considered to be inferior to 24 hour sampling which is the recognised
method for meaningful results (Roels 1987).
Past urinalysis had been carried out on workers handling mercury as part of
the Ministry of Mine’s work place checks and, inclusive of these, a total of 153
samples were analysed over the period of interest 1984–1988. These
included samples already done for Long-term employees as part of the on-
going check by the Inspectorate in 1984-85 and the participants in the study.
Samples were anonymised to prevent identification of persons. Samples [40]
analysed before the start of this study [1984–85] were historical and obtained
from Mines Department records with the permission of employees, and those
from January 1986 [113] were collected as part of the study. The historical
samples were all 24 hour volume, as were those taken throughout the study.
As mentioned earlier the rationale behind 24 hour urine sampling was
explained and the participants were given instructions regarding the collection
of urine over the 24 hour period and how to prevent contamination of the
sample from their clothes, skin or workplace. Sample containers [containing a
preservative] were supplied by the laboratory for collection of urine. All
samples were collected by the author and dispatched to the laboratory.
99
10.7. Literature search.
Between 1986–1988 a literature search reviewed reports, documents and
research papers on mercury to obtain information on the chemical and its
toxicity to humans and the environment. With the study revisited for this thesis
in 2007 a further literature search was undertaken and the World Wide Web
[www] was also used. From the initial literature search in 1986-88 it was
thought, by the author, that the amalgamation process was likely to be a
lesser problem of mercury contamination than that of retorting. Based on this
perceived risk difference the mercury handlers were split into [2] two groups,
non–retort operators and retort operators. This identification has been used
throughout this study and enabled the risks associated with each operation to
be separately quantified.
10.8. Questionnaire.
A simple questionnaire that was drawn up by the author and not peer
reviewed [appendix 1] was used in conjunction with urine monitoring.
Symptoms recognised as being part of the suite of symptoms associated with
mercury poisoning were included. The questionnaire was designed to be
subjective and the participants were asked to indicate if they suffered from
any of the listed symptoms at the time of giving a sample of urine. No clinical
testing was carried out to prove or disprove the questionnaire responses.

100
10.9. Employee discussion.
Discussions were held with employees of the sites [n=25] visited to obtain an
indication of the experience, knowledge, training and work procedures that
were employed when handling mercury. Any concerns that they had regarding
mercury were also canvassed at this time.
10.10. Environmental monitoring.
Environmental monitoring involved gathering data from the work place
environment of the mercury handling employees by:
1. Measurement of mercury in air levels [Hg–air] using a portable
mercury analyser.
2. Ventilation readings on extraction systems using velocity meters and
smoke tubes.
3. Dräger hand pump and mercury tubes for mercury in air levels
[Hg-air].
4. Limited use of personal mercury dose badges.
In this study Dräger tubes were used to measure workroom mercury in air
[Hg–air] levels when the detection limit of the mercury meter was reached.

101
Smoke tubes were used to indicate air current direction and the efficiency of
vapour capture by ventilation hoods and fans. Anemometers were used to
measure air flow in work places where mechanical ventilation was in use and
to check their efficiency.
10.11. Mercury meter.
The Gold Film Mercury Vapor Analyzer [mercury sniffer], model 411 [appendix
2] was designed for the easy and accurate analysis of mercury vapour in the
workplace environment and for the location of mercury spills. The minimum
detection level was 0.001 mg/m3 Hg @ 0.75 L/min of air and the top detection
limit was 1mg/m3. It was powered by a rechargeable battery pack that gave 6
hours of operation. The analyzer had a 10 second sample mode that provided
an integrated, direct reading of mercury vapour concentrations in mg/m3 and a
1 second survey mode that enabled qualitative determination of mercury
levels. A microprocessor automatically re-zeroed the meter at the start of
each sample cycle and prevented drift between samples. Sample results were
displayed on the screen. An internal charcoal filter was provided for calibrating
purposes.
The analyzer contained a thin gold film that in the presence of mercury vapour
underwent an increase in electrical resistance proportional to the mass of
mercury in the sample. This gold film was selective in its adsorption of
elemental mercury and this eliminated interferences such as water vapour,
102
particulates, cigarette smoke, magnetic fields and organic solvents. As
mercury was adsorbed onto the sensor, the percentage of saturation was
indicated by pressing the sensor status button. Limitations of this machine
were that it could be overloaded due to high mercury vapour levels; and,
vapour levels had to be read at the time of measurement as there was no
memory or recording mechanism.
Approximately forty 40 X 10 second samples containing 0.1 mg/m3 of mercury
could be taken before the sensor was saturated. Cleaning of the sensor
[desorbing] required a 15 minute heat cycle to be manually activated to
remove the saturation.
The analyzer was used as a handheld mercury meter in walk about
measurements [Hg–air]. An advantage of this analyzer was that it could be
positioned anywhere and give a direct reading, being especially useful for
grab sampling. The meter was used for measuring worker’s breathing zone
levels, clothing contamination, work surface contamination and room air
measurement.

103
10.12. Personal dose badges.
Fig 20. Sampler badge.
Diffusive monitors [Fig.20] have been used for
workplace air monitoring for many years, and have
been found to be valid and cost-effective alternatives
to conventional pumped or ‘active’ samplers (Brown
1993). A diffusive sampler is a device which is
capable of taking samples of gas or vapour pollutants from the atmosphere at
a rate controlled by a physical process, such as diffusion through a static air
layer or permeation through a membrane, but which does not involve the
active movement of the air through the sampler (Berlin et al. 1989). The
sampling rate of the dosimeter badge at 20°C was 0.020 L/min when used in
face velocities normally seen in industrial environments with a detection limit
of 0.002 mg/m3. The sampling rate can vary with ambient temperature
changes that affect the diffusion rate. This is a small effect but may be
significant if sampling at very high/ low temperatures. Precision and accuracy
was 0.061 to 0.20 mg/m3 with an overall error rate of ± 8.6% and a bias of
+0.008 (US Dept of Labor 1989).
These badges were used to obtain a time related dose for individual workers.
They were a lightweight, reusable lapel badge containing a sorbent capsule.
The sorbent material [Hydrar] collected mercury in air through controlled
diffusion by chemical interaction due to an irreversible affinity for mercury. The
mercury was collected on a solid Hydrar sorbent capsule in a plastic housing.

104
The Hydrar was analysed by cold vapour and the capsule was discarded and
the plastic housing was decontaminated for reuse. No pumps were required
and this made for ease of use. Sampling intervals could be as little as 15
minutes or as long as a week depending on expected mercury concentrations.
In this survey they were used in 2 x 4 hour periods. They had the advantage
of sample stability due to the irreversible affinity of mercury with the hydrar
and were not affected by moisture.
Measurement function was achieved by chemically desorbing the mercury
into a solution and analysing this by Flameless Atomic Absorption. The mass
of mercury on the Hydrar is directly proportional to the concentration in the
original atmosphere over the sampling period and a simple calculation
allowed a time weighted average [TWA] to be determined. These badges
were in short supply and were used in selected cases, usually where previous
Hg–U results did not appear to have a direct relationship with recorded
mercury in air levels [Hg–air].
When in use they were attached to the collar, or as close as possible to the
breathing zone of the wearer. They were left in place for the nominated time
period and then removed and dispatched to the laboratory for analysis.

105
10.13. Dräger Tube
Fig.21. Dräger bellows pump with tube in place.
The Dräger tube system [Fig. 21] is an
established method for measuring and
detecting contaminants in the soil, water
and air. The Dräger tube method of
measurement can be used for gas/
vapour analysis. Dräger tubes are glass
vials filled with a chemical reagent that
reacts to a specific chemical or family of
chemicals. A calibrated 100 ml sample of
air is drawn through the tube with the
handheld Dräger bellows pump. If the
chemical [mercury] is present the
reagent in the tube changes colour and the length of the colour change
typically indicates the measured concentration.
The measuring range for mercury tubes was 0.1 mg/L to 2 mg/L. Sampling
the air required that both ends of the tube were broken off and the tube
positioned into a Dräger pump; the air was drawn through the tube by the
required number of pump strokes [marked on tube]. The mercury in the air
sample drawn through the tube reacted with a chemical in the tube to give a
colour change.

106
The actual concentration of mercury in the sample was calculated by checking
the length of the colour change in the tube and, using the formula mg/m3 Hg =
2/n where n equals the number of strokes used, arriving at a measurement.
They were easy to use and inexpensive.
10.14. Air flow.
Exposure assessment is a critical part of epidemiological studies and air
sampling is important for occupational assessment. Air movement within a
workroom can have a big impact on worker’s health in that it can transport
vapours around a room. Knowledge of air currents provide information as to
where vapours flow within a room. It is important to know where mercury
vapours will be transported by the air currents within the room to enable
systems to be designed to remove them. As part of this strategy for vapour
control it is essential that fresh air is used to make up the air that is removed
when using a local exhaust system. To collect this information anemometers
and smoke tubes were used.
10.14.1. Anemometers.
These instruments measure air speed and need to be calibrated against
recognised standards. A rotating vane anemometer records the linear
movement of air in metres or feet over a period of time. The rotating vane
inside the instrument forms part of an electronic transducer, which offers little

107
resistance to flow and provides good average readings. The design allows for
the measured velocity to be displayed instantaneously on the screen.
To have a “safe” work room it is necessary to have the right number of air
changes, and more importantly, to ensure that the airflow into the room is
sufficient. Although air changes per hour give an indication of air supply, they
relate to the volume of the room, which is an incorrect unit of measurement.
Measuring air velocity is a more accurate way of determining the cleanliness
of the room: the higher the velocity, the cleaner the room. However, for
personal comfort it is essential that velocity of air is not such that it creates a
draft and uncomfortable working conditions. That in themselves can cause
other occupational problems. The measurement range of the instrument was
1 to 30 m/s.
10.14.2. Smoke tubes.
Smoke tubes [fig 22 p 107] produce a harmless cloud of white smoke that
floats freely and easily, because it has the same density as ambient air. Using
a smoke tube for airflow indication was a simple, cheap and effective method
for tracing and determining the source, direction, and dispersion of air
currents.

108
Fig.22. Smoke tube kit.
The highly visible white smoke
provides an immediate and
obvious direction to the pattern of
air currents and the slightest air
movement becomes visible. Use
of the tubes required breaking off
the tube ends, inserting the tube
into the hand bellow and
squeezing the bulb to force out the smoke. They were ideal for checking
ventilation or air conditioning systems, or detecting leaks in industrial
equipment. Detection of contaminants in work areas and finding the best
locations for measurement of contaminant concentration requires knowledge
of air movements.
Smoke tubes were used extensively during the study. They also had the
advantage of being used as an educational accessory, due to the high
visibility of the smoke, to show employers and employees what was
happening with vapours in particular workrooms.

109
Chapter 11. Results.
11.1. General
This section brings together the results of all measurement and historical data
collected, and observations made, over the period of the study 1984-1988. All
figures and tables of measurements are positioned within this chapter. Further
reference is made to the data in the discussion section [Chapter 12, p 160].
11.2. Personal protective equipment. [PPE].
Personal protective equipment, or PPE, is designed to protect employees
from serious workplace injuries or illnesses resulting from contact with
chemical, radiological, physical, electrical, mechanical, or other workplace
hazards. Besides face shields, safety glasses, hard hats, and safety shoes,
PPE includes a variety of devices and garments such as goggles, overalls,
gloves, vests, earplugs, and respirators. Using PPE is often essential, but
should be the last line of defence after engineering controls and good work
practices to reduce worker exposure. PPE should never be used as a
replacement for taking all practical steps to reduce adverse effects on
worker’s health by other means.
110
Workers should use appropriate personal protective clothing and equipment
that must be carefully selected, used, and maintained to be effective in
preventing skin contact or inhalation of mercury vapour (US DoL 1985). The
equipment recommended by the New Zealand Department of Labour in the
1980s for chemicals in general were, gloves, overalls and masks. The quality
of these basic protective items, where provided, varied considerably. Very
little training was given on use and maintenance and there was no follow up
by management to ensure that staff used any protective equipment. The
current exposure standard [TLV] for elemental mercury in New Zealand is
0.05 mg/m3 and is a time weighted average [TWA] concentration for an eight
hour day, five day week (DOL 1975).
The current situation requires that for adequate worker protection PPE must:
• Be appropriate for the task.
• Prevent or sufficiently reduce the risk.
• Fit the wearer and be comfortable.
If PPE is supplied the employees must be required by management to use it,
11.2.1. Masks.
When engineering controls are not feasible, workers must use appropriate
respirators to protect against adverse health effects caused by breathing air
contaminated with harmful mercury vapours. Respirators generally cover the

111
nose and mouth or the entire face or head to help prevent contamination and
illness. A proper fit is essential for respirators to be effective and all
employees required to wear respirators need to undergo a fitting session to
ensure that the respirator fits their face profile. This will ensure that the mask
will not leak and let contaminated air in. This is especially important where the
wearer has a beard as beards prevent the mask seal from being effective.
At the time of this study PPE rules did not exist. Disposable masks were used
in situations where they were ineffective, giving a false sense of security to
the wearer. Some masks were only suitable for dust and not vapours. Where
cartridge filter masks were used some had the wrong cartridge type fitted. No
records were kept of when a cartridge was changed or how much use a mask
had, and in many cases no instruction was given to the employee on use and
maintenance of masks. Masks were seldom protected from contamination
when not in use, often left in the retort room and no cleaning schedules
existed to ensure masks were washed and cleaned between uses.
Regrettably, procurement of masks and filters was carried out with limited
knowledge of the types required and how to maintain their effectiveness.
11.2.2. Clothing.
Protective clothing is essential in this industry but was not always supplied.
Gloves and eye protection were not provided in many work places. Most
employees wore overalls, usually their own, but few workplaces had a policy
for daily changing or washing of work clothes. Employees wore the same

112
overalls for days and, if washed, they were taken home to be done. Overalls
are part of protective clothing and if contaminated the wearer is constantly
exposed to that contamination until they are changed or washed. It became
obvious early in the study that work clothing was being contaminated by
mercury.
When the author became aware of the possibility that contaminated clothing
was a source of personal contamination to the wearer, a series of tests were
designed to measure clothing contamination levels. The overall wearers were
removed to another room where no mercury was present, or into the outside
air, and the mercury meter was used to “sniff” the clothing to see if any vapour
was given off. Overalls were monitored first thing in the morning before
workers put them on to see if any residue remained.
An example of how this clothing measurement was carried out: measuring
the Hg–air level in the retort room at the start of a shift gave a reading of
0.035 mg.Hg/m3air prior to starting the retort. The room temperature was 18
0C [ 640F] and within ½ an hour of firing the retort at 1030 hours the room
temperature had risen to 240C [750F] with a mercury in air level of 0.45
mg.Hg/m3air. Prior to entering the room the worker’s overall collar and chest
area [these overalls had already been worn for 3 days prior] was “sniffed” with
the meter and gave a reading of 0.02 mg.Hg/m3air.

113
At the finish of the retort and having been in the room for 1 hour the overall
was “sniffed” at the collar level in the outside air and gave a reading of 0.08
mg/m3air, ½ an hour later the level had dropped to 0.066 mg.Hg/m3air and by
the end of the day still registered a level of 0.02 mg.Hg/m3air.
This experiment was repeated in a limited way over a period of 1 year at
different mine sites and with different workers and, although results varied,
contamination was noted, especially around cuffs, chest and collars, the very
areas in close contact with a worker’s breathing zone. Levels up to a
maximum of 0.08 mg.Hg/m3air were recorded with a mean of 0.02
mg.Hg/m3air [n=10]. This contamination of clothing provided a mini–zone or
microenvironment that was available to contaminate a worker’s breathing
zone when wearing contaminated overalls. This was a source of
contamination the wearer was not aware of and continued to contaminate his
breathing zone whilst he was wearing them even when away from mercury.
As reported above the provision of safety or protective clothing [PPE]
although essential was not always provided by employers and Figs 23-25
p 113, show the percentage of companies [n=25] providing the basic
protective equipment of gloves, overalls and masks. Even where supplied
some of the clothing/protective equipment was not up to standard and/or was
not well maintained.
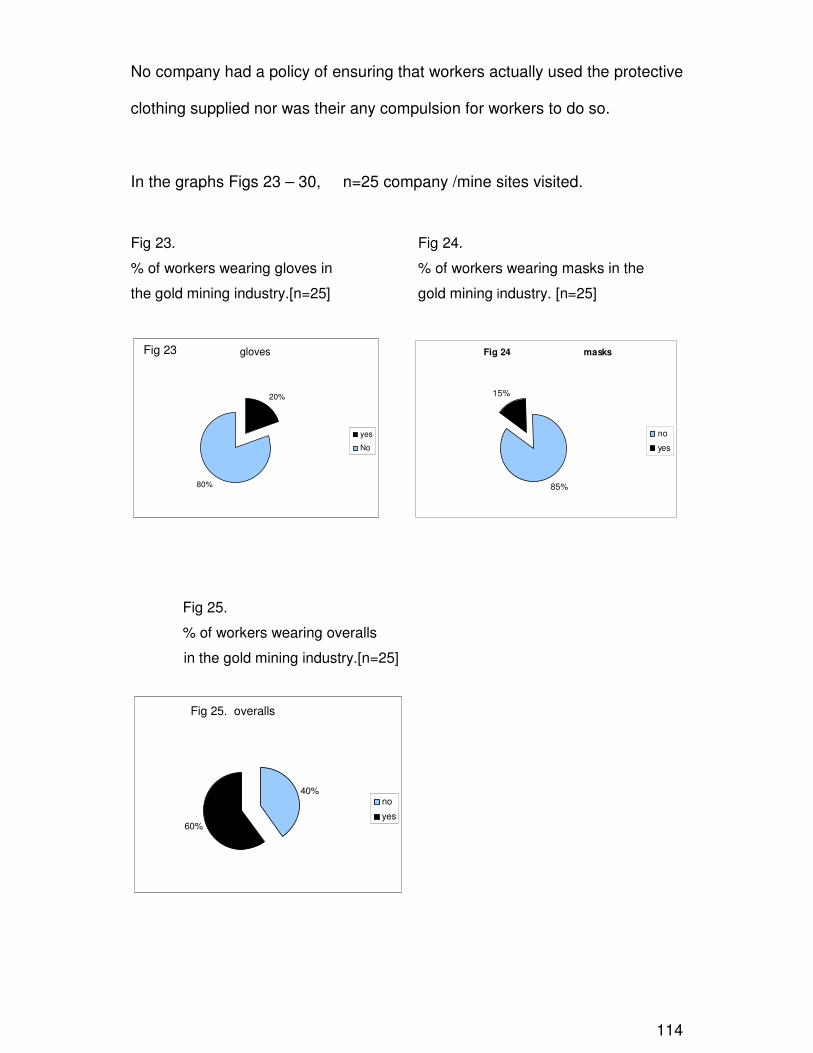
114
No company had a policy of ensuring that workers actually used the protective
clothing supplied nor was their any compulsion for workers to do so.
In the graphs Figs 23 – 30, n=25 company /mine sites visited.
Fig 23. Fig 24.
% of workers wearing gloves in % of workers wearing masks in the
the gold mining industry.[n=25] gold mining industry. [n=25]
Fig 24 masks
85%
15%
no
yes
Fig 25.
% of workers wearing overalls
in the gold mining industry.[n=25]
Fig 25. overalls
40%
60%
no
yes
Fig 23 gloves
20%
80%
yes
No
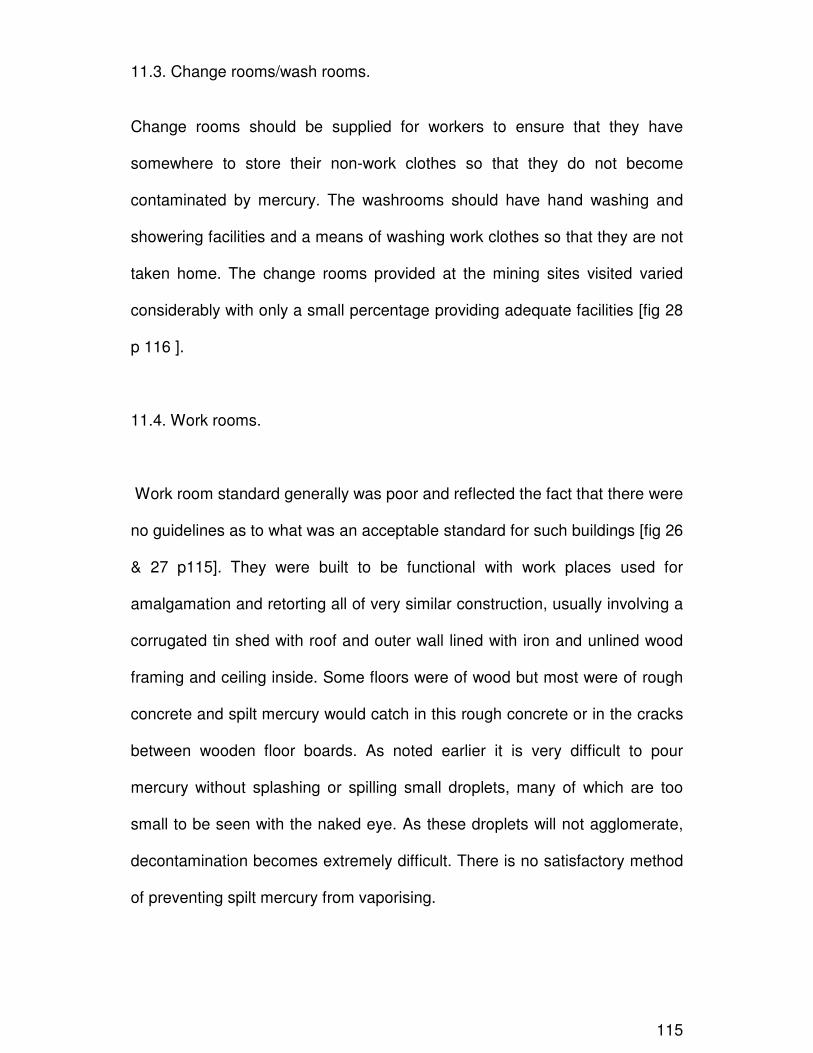
115
11.3. Change rooms/wash rooms.
Change rooms should be supplied for workers to ensure that they have
somewhere to store their non-work clothes so that they do not become
contaminated by mercury. The washrooms should have hand washing and
showering facilities and a means of washing work clothes so that they are not
taken home. The change rooms provided at the mining sites visited varied
considerably with only a small percentage providing adequate facilities [fig 28
p 116 ].
11.4. Work rooms.
Work room standard generally was poor and reflected the fact that there were
no guidelines as to what was an acceptable standard for such buildings [fig 26
& 27 p115]. They were built to be functional with work places used for
amalgamation and retorting all of very similar construction, usually involving a
corrugated tin shed with roof and outer wall lined with iron and unlined wood
framing and ceiling inside. Some floors were of wood but most were of rough
concrete and spilt mercury would catch in this rough concrete or in the cracks
between wooden floor boards. As noted earlier it is very difficult to pour
mercury without splashing or spilling small droplets, many of which are too
small to be seen with the naked eye. As these droplets will not agglomerate,
decontamination becomes extremely difficult. There is no satisfactory method
of preventing spilt mercury from vaporising.

116
In summer these buildings absorbed heat and acted like ovens with the
temperature inside rising very quickly due to the tin cladding, vaporising any
spilt or exposed mercury. The mercury adhered to organic materials such as
wood, and work surfaces were usually wood or similar pervious material. The
poor standard of buildings is reflected in the results of mercury vapour
readings discussed further in this document.
Figs 26 to 29 give an indication of the standard of the work places. The level
of compliance with these basic requirements was generally very poor and
even the 35% recorded as kept clean should have been better.
Fig 26. Fig 27.
% of workplaces kept clean % of workplaces with smooth,
in the gold mining industry. [n=25] impervious walls, ceilings and floors
in the gold mining industry. [n=25]
All work places provided personal washing facilities [toilets and wash-hand
basins], but few provided showers [fig 28, p 116] and none provided clothes
washing equipment for laundering overalls.
Fig 26. % of workplaces kept clean
65%
35%
no
yes
Fig 27. % of work places withsmooth, impervious walls,ceilings & floors
90%
10%
no
yes
117
Fig 28. Fig 29.
% of workplaces with showers %of workplaces with easily cleaned,
in the gold mining industry.[n=25] impervious work surfaces in the gold
mining industry.[n=25]
11.5. Ventilation.
Good ventilation is critical for work places using mercury. The containment
and removal of mercury fumes is the first principle of control and prevention of
mercury contamination of the workplace. The US Department of Mines
suggests a minimum of 40 m/min as a reasonable air velocity where no
general room ventilation is provided (personal papers). Some work places
[Fig. 30 p 117] had mechanical ventilation, including extraction ventilation over
retorts but most relied on natural convection currents via open doors and
windows. Where natural ventilation was used smoke tests often showed some
areas of still air i.e. no air movement. Air currents short circuited between
windows and doors in a direct line leaving pockets of still air in corners and
this was often where the retort was situated or mercury vapour accumulated.
Fig 29. % of work places with easilycleaned and impervious work surfaces
60%
40%no
yes
Fig 28. % of work places with shower
85%
15%
no
yes

118
Where mechanical ventilation was used, smoke tubes indicated that air was
pulled into the extraction fan close to the hood when doors and windows were
closed, creating air movement around the room. However, if doors and
windows were left open there was a tendency for the air to flow from these
openings toward the extraction fan leaving some areas of poor quality air with
little to no movement, usually in corners.
Fig 30 shows the percentage of work place ventilation systems [n=25] in
operation. Ventilation is an essential part of the protective equipment that
should be supplied to prevent build-up of mercury vapour in work rooms and,
as can be seen by Fig 30, only 25% of workplaces had any type of forced
ventilation. Not all the ventilation systems supplied were 100% effective.
Fig 30.
% of workplaces providing extraction ventilation in the gold mining
industry. [n=25]
Fig 30. % of work placesproviding extraction ventilation
75%
25%
no
yes

119
The effectiveness of the mechanical ventilation depended on the size of the
fan used and the design factors of the extraction hood, but not all extraction
systems in use had a hood. If a fan was too small, or the extraction hood
exhaust pipe too small, the amount of air moved was reduced, or restricted.
This affected the efficiency of the system and left areas of the work room
where air movement was poor. None of the ventilation systems in operation
were designed by ventilation engineers, being usually made by the company
staff or bought off the shelf. Measurement of airflow within work rooms in this
study was carried out using an anemometer with smoke tubes to indicate
current direction and movement. Natural air changes in work rooms were as
low as 2 or 3 air changes per hour with air flows between 5 and 8 m/min.
Where fans were in use air flow was measured up to 60 m/min. Unfortunately
fans tended to be used only whilst retorting was being carried out and, when
turned off, any spilt mercury still in the room continued to vaporise and be
available to contaminate workers.
The inefficiency of work place air extraction resulted in high levels of mercury
vapour accumulating in work rooms. Visual observation of work places found
spilt mercury on floors and bench surfaces with walls having a metallic grey
sheen that gave mercury readings when “sniffed” with the meter. The lack of
good housekeeping added to these problems, allowing spilt mercury to
accumulate and contaminate the workrooms.

120
As explained before, mercury is very difficult to collect once spilt (US DoL
1985) and the condition of these work places added to this difficulty. If spilt
mercury is not cleaned up quickly and completely it will be easily spread
round the site. It forms droplets that can accumulate in the smallest of spaces,
e.g. cracks in floorboards and concrete.
11. 6. Mercury in air measurement. [Hg–air].
The key to prevention of mercury contamination is reducing the risk of
mercury escaping into the environment. Spillage of mercury, poor equipment,
sub standard buildings, poor seals on crucibles, poor work practice, storage of
mercury contaminated equipment in work rooms, and inadequate ventilation
all added to mercury vapour levels in work rooms. Workrooms were often
divided into amalgamation and retorting areas and poor ventilation systems,
or lack of ventilation, compounded the problem. Most mercury in air
measurements were made with the mercury meter with limited grab sampling
employed in certain locations.
In most of the systems for setting Occupational Exposure Limits (OEL) two
types of limit values are established:
- time weighted average concentrations (TWA), intended to protect all
or nearly all workers from adverse health effects of occupational
exposure:
- short-term exposure limits (STEL) peak limitations, intended as
supplementary to TWA and protecting against short-time effects.

121
In New Zealand, only TWA is used for mercury measurements as there is no
STEL for mercury. The TLV for mercury in air was 0.05 mg/m3 as a TWA
(DOL 1975), and measurement data for the sites are shown in table 4 p123
and table 5 on p 125.
11.6.1. Work room air measurements.
Mercury in air measurements [Hg–air] were monitored at the premises where
the employees supplying the urine samples worked. There was some difficulty
in obtaining results in this industry because of the way that the work day was
structured. Mercury use was not a day long operation and the timing of these
varied as the person handling the mercury also performed other tasks.
Employees were often required to work in the same room where the mercury
handling occurred [multipurpose workrooms] after mercury handling had
finished for the day and they could continue to be exposed to mercury vapour.
This type of operation leads to peaks and troughs in mercury vapour levels
and exposures, so mercury in air grab samples were taken at periods over a
work day with statistical evaluation done to give an average that could be
compared with the TLV (NIOSH 1975).
Grab sampling enabled an average of a fluctuating daily level to be calculated
but, it did not identify peaks unless one occurred during the measurement
period and was observed. The intention was that where possible, a mercury in
air measurement would be carried out in each work place at the time a urine

122
sample was collected. In reality only 1 air measurement was carried out for
every 5 urine samples collected. As mentioned above the level of vapour in
work rooms was directly related to the amount of mercury released by various
sources within the room. One source was the use of mercury to recover gold
through the retorting process. Other sources involved spilt mercury,
contaminated surfaces and equipment, poor workplace hygiene and poor
work practices.
As the temperature in work rooms increased a corresponding rise in mercury
vapour levels were measured. The vapour pressure of mercury increases
rapidly with temperature and enough vapour can be produced at room
temperature to contaminate any person in the room. A saturated atmosphere
at 200C contains approximately 15 mg.Hg/m3air, 300 times greater than the
TLV of 0.05 mg/m3 (WHO 1990).
Rising room temperatures were brought about by a combination of the heat
from the retorts and the building absorbing heat from the sun [S11.4. p 114].
Mercury vapour levels were higher in work rooms, and remained high for
longer, in the summer than in winter. This was partly due to the buildings
acting like ovens in summer and refrigerators in winter. This is covered further
in the discussion section [Chapter 12, p 165].

123
11.6.2. Non–retort area measurements.
This area was usually separate from the retorting area, although in many
cases there were no doors between, and it was here that the gold was
cleaned up and mixed with mercury to form an amalgam. The process used
water and was partially a wet process. In most sites the floor was wet during
the amalgamating work and this reduced the vaporising of spilt mercury. Air
measurements within these rooms indicated that the work place did become
contaminated by mercury even with this wet area.
Mercury in air measurements [Hg–air] for the non-retort group reflects this use
of water on the floor and less contact with mercury. Where air levels were
high it reflected the standard of housekeeping and poor ventilation. Limited
grab sampling of mercury in air levels were measured in these non–retort
areas. From the measurements 5 out of the 8 work rooms tested [63 %] were
over the TLV for mercury [0.05 mg./m3] as an average using NIOSH statistical
evaluation criteria (NIOSH 1975). The remaining 3 measurements gave 2 at
just below the TLV and 1 equal to the TLV.
The NIOSH [1975] handbook provides an easy to follow procedure for making
decisions regarding the average of a time varying industrial contaminant
exposure level and whether a non-compliance, or trend, occurs. The
procedure is useful where there is no clear trend in the measurements or
where it can not be decided whether non-compliance has occurred by looking
at the data. The contaminant data in this study are a set of breathing zone

124
grab air samples from a time varying industrial environment [workrooms]. The
measurements are set out as per table 4 below and table 5 [page 125] and,
using the steps in the handbook and the nomographs provided with the
handbook an average for the collected data was calculated. Individual grab
samples of mercury vapour levels [mg.Hg/m3air] measured at time varying
intervals in the non-retort area of mining sites are shown with an average level
for the day in table 4 .
Table 4. Individual grab samples taken at time varying intervals [1986-88] of
mercury vapour levels [mg.Hg/m3air] in the non-retort area with an average
level for the day. [TLV= 0.05 mg/m3]
[n=8]
Table 4.
Time [hrs]: 0800. 0900. 1000. 1100. 1200. 1300. 1400. 1500. 1600. 1700.
Time index: 1 2 3 4 5 6 7 8
Average
[NIOSH]
Work place mg.Hg/m3 air
1 0.06 0.08 0.13 0.15 0.16
2 0.03 0.04 0.04 0.1 0.05
3 0.03 0.04 0.08 0.04 0.03
4 0.04 0.04 0.12 0.1 0.05
5 0.01 0.11 0.13 0.09 0.08
6 0.05 0.05 0.07 0.06 0.03
7 0.03 0.04 0.07 0.04 0.02
8 0.02 0.04 0.1 0.1 0.05
mg.Hg/m3
0.11
0.05
0.04
0.07
0.08
0.05
0.04
0.06
125
11.6.3. Retort area measurements.
As already mentioned [fig 10 p29 ] the retort was a cast iron, moulded crucible
with a top that contained a water jacket to condense mercury vapour in which
the gold/mercury amalgam was heated @ 7500C–8500C [13820F -15620F].
[fig 9 p28]. During a retort the temperature in the room was noticed to rise
rapidly with the heat given off from the fire under the retort. In the height of
summer the room temperature could exceed 350C [950F].
Table 5 p125 indicates the grab sample mercury in air levels measured in
retorting areas at the mine sites. All 8 work rooms tested [100 %] were above
the TLV >0.05 mg/m3 as an average, using statistical evaluation criteria
(NIOSH 1975).
High mercury in air levels in work rooms usually coincided with the retort
being operated. In the summer months [the worst case scenario] work rooms
had mercury vapour readings above the TLV with high building temperatures
vaporising spilt mercury without any retorts operating or mercury being used.
When the heat of the retort was added to this naturally created building heat
the temperature inside could be very high, in excess of 350C [950F] being not
uncommon.
Mercury in air [Hg–air] measurements from retort rooms confirm that, industry
wide, the control of mercury vapour was ineffective. These measurements

126
were reflected in the urinalysis [Hg–U] results and this is further reinforced by
the dosimeter badge results. This is examined further in the discussion in
chapter 12.
Table 5.
Individual grab samples taken at time varying intervals [1986-88] of mercury in
air levels [mg.Hg/m3air] in the retort area and showing an average for the day.
[TLV = 0.05 mg/m3] [n=8]
Table 5.
Time [hrs] 0800 0900 1000 1100 1200 1300 1400 1500 1600 1700
Time index: 1 2 3 4 5 6 7 8
Average
[NIOSH]
Work place mg.Hg/m3 air
1 0.12 0.13 0.41 1.0 0.5 0.2
2 0.04 0.05 0.26 0.17 0.08 0.07
3 0.24 0.64 0.71 0.33 0.29
4 0.03 0.26 0.21 0.10 0.04
5 0.05 0.23 0.15 0.11 0.09
6 0.11 0.61 0.36 0.20 0.14
7 0.21 0.41 0.38 0.3 0.20
8 0.12 0.14 0.19 0.25 0.23
mg.Hg/m3
0.39
0.11
0.37
0.13
0.13
0.28
0.3
0.19
The range and mean of all mercury in air [Hg–air] measurements taken at the
time of urine collection in 1986–1988 are shown in table 6 p 126. When

127
the study was planned it was intended that the participant’s work place would
have a spot air measurement of ½ hour duration at the time his urine sample
was collected. This was not a practicable proposition and only a small number
of measurements were carried out in this situation [n=32]. The data from
these measurements has been condensed to give a range and mean and is
included in table 6 below. The data from tables 4 & 5 is not included in this
table.
Table 6.
Range and mean of individual mercury measurements [mg.Hg/m3air] of air
samples taken during urine collection in the period 1986-1988 from listed work
sites.
[Does not include table 5 & 6 results].
[TLV = 0.05 mg/m3] [n=32]
Table 6.
Workplace site
mg.Hg/m3
Range Mean
General work rooms
Amalgamating room
Cold day
Hot day
Retort room not operating
Hot day
Cold day
Retort room operating
0.01 - 0.07 0.04
0.03 - 0.19 0.12
0.06 - 0.24 0.19
0.04 - 0.38 0.25
0.03 0.17 0.1
0.16 - > 1.0 ** 0.7
**this was the detection limit of the hand held meter.

128
11.6.4. Breathing zone monitoring.
Mercury dosimeter badges [Fig.21 p102] were used to obtain worker’s total
exposure to mercury vapour during a working day. They were worn on the
lapel of the overalls as close as possible to the mouth [breathing zone.]
Because they were in limited supply, only 10 were used in this study.
Obtaining a meaningful time scale of exposure with these badges was difficult
as the wearer often moved in and out of the mercury zone. This limited
monitoring [table 7 below] does indicate that worker exposure levels were too
high. The mean of the 10 samples from different employees is 0.136
mg.Hg/m3air with the highest level being 0.61 mg.Hg/m3air [TLV = 0.05mg/
m3].
Table 7.
Dosimeter results using lapel badges [sorbent type] with range and mean of
measurements [mg.Hg/m3air] in period 1986-88.
[TLV = 0.05 mg/m3] [n=10].
Table 7.
Number of samples: range mgHg/m3air Mean mgHg/m3air
10 0.03 – 0.61 0.136
Time period = 4 hours monitoring per person per day [8 hour work day].
129
Personal monitoring using lapel badges gave an indication of a person’s total
daily load but no indication of peak loads. It is possible that large
concentrations of vapour, such as that released on opening a retort, could
overload the personal monitoring device so that they only reflected that peak
and not the total daily load. This was an acknowledged limitation in using
these badges and there was no way of recording such incidents unless the
wearer was under observation whilst wearing the badge.
As the number of badges available was limited the hand held meter and
Dräger adsorption tubes were also used for breathing zone measurements.
Observation of the retorting process had noted that when the retort was
opened a grey vapour was given off. The meter recorded this fume as
mercury vapour but the level went off screen due to overload of the meter
[>1mg/m3]. Using the Dräger tubes to give instant readings at crucible
opening times, levels as high as 2 mg.Hg/m3air were recorded. However, this
was the top of the range for these tubes so the level could have been higher
[see table 1 p 47].
11.7. Off site contamination.
Mercury contamination can also be transferred to other work places where
workers may be unaware that they are at risk. Spilt mercury, not cleaned up
immediately was spread around the site via footwear. The contaminated
footwear transferred the mercury to other areas of the work site e.g. offices,
vehicles and even lunch rooms. Once the author became aware of the

130
footwear transfer of mercury from room to room a series of air measurements
were carried out in a carpeted office [where a secretary/receptionist was
based] of a company that did retorting & amalgamation for other miners. Hg–
air levels of 0.035 mg.Hg/m3air were measured at a height of 200 mm above
the carpet. Based on this result a limited number of workrooms at other sites
that were thought to be free of mercury, including lunch rooms, were
measured and found to have significant levels on warm days. A number
[n=16] of non-mercury workplaces were measured over 1 year and the
concentration of Hg–air in these rooms ranged from 0.023 - 0.15 mg.Hg/m3air
with a mean 0.085 mg.Hg/m3air [table 8]. This was over the 0.05 mg/m3 limit
of the workplace TLV set in the standards and these rooms were supposed to
be mercury free.
Table 8. Non- workroom mercury in air measurement levels 1987.
n=16. [8 change rooms & 8 lunch rooms].
Site Range. mg.Hg/m3air Mean. mg.Hg/m3airLunch room 0.023 – 0.09 0.06
Change room 0.08 – 0.15 0.085
The longer people breathe contaminated air, the greater the risk to their
health. Metallic mercury and its vapours are extremely difficult to remove from
clothes, furniture, carpet, and other porous items. If these items are not
properly removed, or cleaned, mercury will remain for long periods and
continue to be a health hazard to anyone in the room. An example of this was
carpet causing a problem in an office where it continued to give off mercury
despite attempts at cleaning. Eventually it had to be replaced because of the
difficulty in removing all traces of mercury trodden in.

131
11.8. Mercury in urine [Hg–U].
Mercury in urine [Hg-U] levels are directly related to the level of mercury a
person has been exposed to and is a good indicator of past work practice.
The urine sampling programme in this study was carried out in line with the
conditions of Piotrowski (1975) and National Health Institute [NHI] guidelines,
giving results that are meaningful and, in conjunction with my discussions,
reinforces the conclusions reached. Urine levels are shown in Figs 33-40
pp134-141 and Figs 42-49 on pp144-151.
11.8.1. Biological Exposure Indices [BEI].
The New Zealand Department of Labour BEIs are reference values used as
guidelines for the evaluation of occupational exposure within the New Zealand
work force (OSH 1994). They are adopted from ACGHI published data.
BEIs are health based values that are established by committees that
review existing published and peer-reviewed literature in various
scientific disciplines (e.g., industrial hygiene, toxicology, occupational
medicine, and epidemiology). Based on the available information they
formulate a conclusion on the level of exposure that the typical worker
can experience without adverse health effects. The BEIs represent
132
conditions under which health authorities believe that nearly all workers
may be repeatedly exposed without adverse health effects.
They are not fine lines between safe and dangerous exposures, nor
are they a relative index of toxicology. BEIs are not quantitative
estimates of risk at different exposure levels or by different routes of
exposure. They are based solely on health factors with no
consideration given to economic or technical feasibility (ACGIH 2008)
Biological monitoring of exposure to chemicals in the workplace is an
important component of exposure assessment and prevention of adverse
health effects. During this study biological monitoring was employed in
conjunction with ambient air monitoring to provide information on the worker’s
absorbed dose of mercury and the effect of all routes of exposure.
At the time of this study [1984-1988] the New Zealand BEI for metallic
mercury was 0.25 µmol/L. The Action level, [the level at which some action
needed to be taken to reduce personal levels] was >0.25 µmol/L; and the
Suspension level [the level at which the employee is suspended from working
with mercury until their body burden falls] was > 0.5 µmol/L (DOL 1974).
133
11.8.2. Non–retorters.
From January 1986 to June 1988 a group of employees [n=8] who handled
mercury but did not do retorting, were chosen to be participants in the study.
Each one was from a different company and they were classed as non–
retorters to identify them from those who did retorting. Over the period of the
study [2.5 years] each participant gave 24 hour urine samples at an average 4
monthly interval. The lowest Hg–U level for this group was 0.05 µmol/L and
the highest was 0.19 µmol/L, with a mean of 0.075 µmol/L [Fig. 31 p 133].
This group remained below the action level of >0.25 µmol/L for the study
period. Fig 31 includes the historical sampling carried out over the 1984/1985
period as well as those samples collected from participants in the study 1986 -
88. The graph gives an indication of the industry wide situation. The levels
reflect the lower exposure to mercury of this group of participants.
The 8 participants in the urinalysis testing supplied 7 samples each over the
period [2.5 years] and were identified by a code [#A, #B, etc.] to ensure
anonymity. This code letter appears on the individual’s graph and was used
on all data collected in the study for that person.

134
Fig 31.
Graph of the group mean, minimum and maximum levels of all non-retorting
mercury handler’s urinalysis over the period 1984-1988 [includes historical
samples 1984-85].
n= total samples collected.
[n=77] [µmol/L]
1984 n=10. 1985 n=11. 1986 n=24. 1987 n=24. 1988 n=8.
Fig 31 graphs the non-retorting mercury handler’s total samples as a group
and indicates that they were all below the Action level of > 0.25 µmol/L.
The individual non–retort participant’s mercury urinalysis levels that are part of
fig 31 from January 1986 to June 1988 are shown in figs 32- 39 pp 134-141.
The 1984 and 1985 levels in fig 31 are historical and not included in the
individual graphs.
Fig 31. Mercury handlers non - retorters urine levels. 1984-88.Includes historical samples 1984-85.
0
0.02
0.04
0.06
0.08
0.1
0.12
0.14
0.16
0.18
0.2
1984 1985 1986 1987 1988
µmol/L
minimum
mean
maximum

135
Fig. 32.
Graph of individual non–retort participant’s mercury urinalysis [Hg–U] January
1986 to June 1988.
n = total number of samples for period.
Mean for period 1986 -88 = 0.067 µmol/L. [n=7]
All this participant’s samples were below the Action level> 0.25 µmol/L.
Fig 32. mercury handlers non - retorters # A.1986-88.
0
0.01
0.02
0.03
0.04
0.05
0.06
0.07
0.08
0.09
0 2 4 6 8
sample number
µmol / litre

136
Fig 33.
Graph of individual non–retort participant’s mercury urinalysis [Hg–U]
January 1986 to June 1988.
n = total number of samples for period.
Mean for period 1986 -88 = 0.073 µmol/L [n=7]
All this participant’s samples were below the Action level >0.25 µmol/L.
Fig 33. Mercury handlers non - retorters # B.1986-88.
0
0.02
0.04
0.06
0.08
0.1
0 2 4 6 8
sample number
µmol / litre

137
Fig 34.
Graph of individual non–retort participant’s mercury urinalysis [Hg–U]
January 1986 to June 1988.
n = total number of samples for period.
Mean for period 1986 -88 = 0.069 µmol/L [n=7]
All this participant’s samples were below the Action level >0.25 µmol/L.
Fig 34. Mercury handlers non - retorters # C.1986-88.
0
0.02
0.04
0.06
0.08
0.1
0.12
0.14
0 2 4 6 8
sample number
µmol / litre

138
Fig 35.
Graph of individual non–retort participant’s mercury urinalysis [Hg–U]
January 1986 to June 1988.
n = total number of samples for period.
Mean for period 1986 -88 = 0.073 µmol/L [n=7]
All this participant’s samples were below the Action level >0.25 µmol/L.
Fig 35. Mercury handlers non - retorters # D.1986-88.
0
0.02
0.04
0.06
0.08
0.1
0 2 4 6 8
sample number
µmol / litre

139
Fig 36.
Graph of individual non–retort participant’s mercury urinalysis [Hg–U]
January 1986 to June 1988.
n = total number of samples for period.
Mean for period 1986 -88 = 0.069 µmol/L [n=7]
All this participant’s samples were below the Action level >0.25 µmol/L.
Fig 36. Mercury handlers non - retorters # E.1986-88.
0
0.02
0.04
0.06
0.08
0.1
0.12
0 2 4 6 8
sample number
µmol / litre

140
Fig 37.
Graph of individual non–retort participant’s mercury urinalysis [Hg–U] January
1986 to June 1988.
n = total number of samples for period.
Mean for period 1986 -88 = 0.12 µmol/L [n=7]
All this participant’s samples were below the Action level >0.25 µmol/L.
Fig 37. Mercury handlers non - retorters # F.1986-88.
0
0.02
0.04
0.06
0.08
0.1
0.12
0.14
0.16
0 2 4 6 8
sample number
µmol / litre

141
Fig 38.
Graph of individual non–retort participant’s mercury urinalysis [Hg–U]
January 1986 to June 1988.
n = total number of samples for period.
Mean for period 1986 -88 = 0.064 µmol/L [n=7]
All this participant’s samples were below the Action level >0.25 µmol/L.
Fig 38. Mercury handlers non - retorters # G.1986-88.
0
0.01
0.02
0.03
0.04
0.05
0.06
0.07
0.08
0.09
0 2 4 6 8
sample number
µmol / litre

142
Fig 39.
Graph of individual non–retort participant’s mercury urinalysis [Hg–U]
January 1986 to June 1988.
n = total number of samples for period.
Mean for period 1986 -88 = 0.059 µmol/L [n=7]
All this participant’s samples were below the Action level >0.25 µmol/L.
Individual urinalysis [Hg–U] from the non–retorting mercury handlers gave
levels below the BEI [page 130]. These were comparable as a group [Fig 31
p133] with the control group [Fig 52 p
155] however, the mean was slightly higher. On an industry basis the results
in Fig 31 indicates that the group mean is below the guideline level and close
Fig 39. Mercury handlers non - retorters # H.1986-88.
0
0.01
0.02
0.03
0.04
0.05
0.06
0.07
0.08
0 2 4 6 8
sample number
µmol / litre

143
to the norm of the control group. This reflects the lower level of contact with
mercury by this non-retort group.
11.8.3. Retort operators.
From January 1986 to June 1988 a group of employees [n=8] who were
responsible for retorting, were chosen to be participants in the study. They
were from different companies to the non–retorters and they were classed as
retorters as a means of identification. This group had more contact with
mercury vapour than the non-retort group and this is reflected in their urine
levels.
The retort group urine analysis levels over the period 1986-88 [n=58 ] with
1984-85 levels [n=20] included, are shown in Fig 40 p 143. The lowest level
for this group was 0.05 µmol/L and the highest was 3.2 µmol/L, with a variable
mean year to year of 0.25 µmol/L to 0.9 µmol/L. The BEI was exceeded by all
1986-88 participants at some stage of the study with 4 out of the 8 being
above the Suspension level of >0.5 µmol/L at various times with the remaining
4 being above the Action level of >0.25 µmol/L. The 1986-88 levels are in the
individual participant’s graphs in Figs 41-48 pp 144 – 151.
Total sample results taken [n=78] in period 1984-88 inclusive of historical
samples as per the group graph in Fig 40 p143 gave:
• Suspension level [>0.5 µmol/L] 228/78 = 36% above;
• Action level [>0.25 µmol/L] 28/78 = 36% above;

144
Fig 40.
Graph of the group mean, minimum and maximum urinalysis levels for the
retorting mercury handlers in the 1984-1988 period [includes historical
samples 1984-85].
n= total samples collected.

145
[n=78]
1984 n=10. 1985 n=10. 1986 n=24. 1987 n=24. 1988 n=10
Fig 40 includes the historical samples 1984-1985 and the participants from
1986-1988.
Fig 40 Retorter group mercury urine levels 1984-88
0
0.5
1
1.5
2
2.5
3
3.5
4
1984 1985 1986 1987 1988
µmol/L
minimum
mean
maximum

146
Figs 41 to 48 pp 144-151 show the results of the individual retort operator’s
urinary mercury levels collected during the study 1986-88.
Fig 41
Graph of individual retorting participant’s mercury urinalysis [Hg–U] January
1986 to June 1988.
n = Total number of samples taken over period 1986-88.
Mean for period = 0.26 µmol/L [n=8]
No samples were above the Suspension level [>0.5 µmol/L].
5 out of the 8 samples were above the Action level [>0.25 µmol/L]
3 out of 8 samples were below the Action level.
Fig 41. Retorter urine mercury level #A.1986-88
0
0.05
0.1
0.15
0.2
0.25
0.3
0.35
0.4
0.45
0 2 4 6 8 10
sample number
µmol/litre
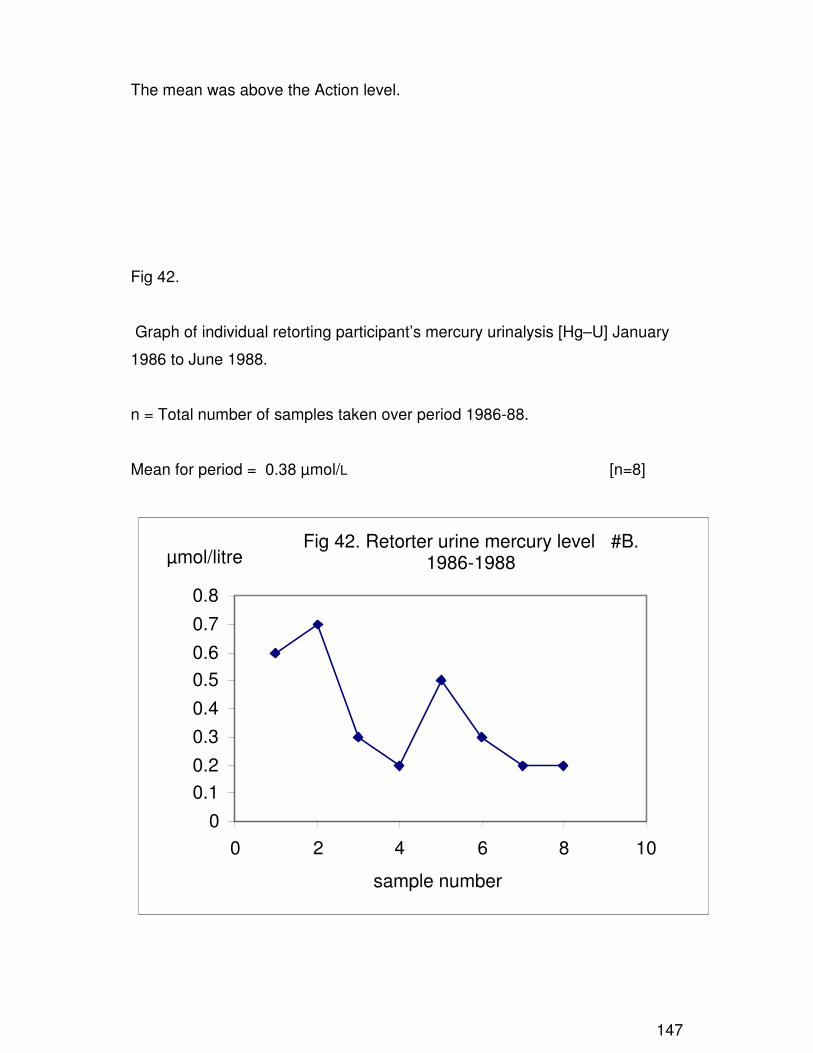
147
The mean was above the Action level.
Fig 42.
Graph of individual retorting participant’s mercury urinalysis [Hg–U] January
1986 to June 1988.
n = Total number of samples taken over period 1986-88.
Mean for period = 0.38 µmol/L [n=8]
Fig 42. Retorter urine mercury level #B.1986-1988
0
0.1
0.2
0.3
0.4
0.5
0.6
0.7
0.8
0 2 4 6 8 10
sample number
µmol/litre

148
2 out of 8 samples were above the Suspension level [>0.5 µmol/L].
3 out of 8 samples were above the Action level [>0.25 µmol/L ].
3 out 8 samples were below the Action level.
The mean was above the Action level.
Fig 43.
Graph of individual retorting participant’s mercury urinalysis [Hg–U] January
1986 to June 1988.
n = Total number of samples taken over period 1986-88.
Mean for period =0.19 µmol/L [n=8]
No samples were above the Suspension level [ >0.5 µmol/L].
Fig 43. Retorter urine mercury level #C.1986-88
0
0.05
0.1
0.15
0.2
0.25
0.3
0.35
0 2 4 6 8 10
sample number
µmol/litre

149
1 out of 8 samples were above the Action level [ >0.25 µmol/L].
7 out of 8 samples were below the Action level.
Mean was below Action level.
Fig 44.
Graph of individual retorting participant’s mercury urinalysis [Hg–U] January
1986 to June 1988.
n = Total number of samples taken over period 1986-88.
Mean for period =0.31 µmol/L [n=8]
Fig 44. Retorter urine mercury level # D.1986-88
0
0.1
0.2
0.3
0.4
0.5
0.6
0 2 4 6 8 10
sample number
µmol/litre
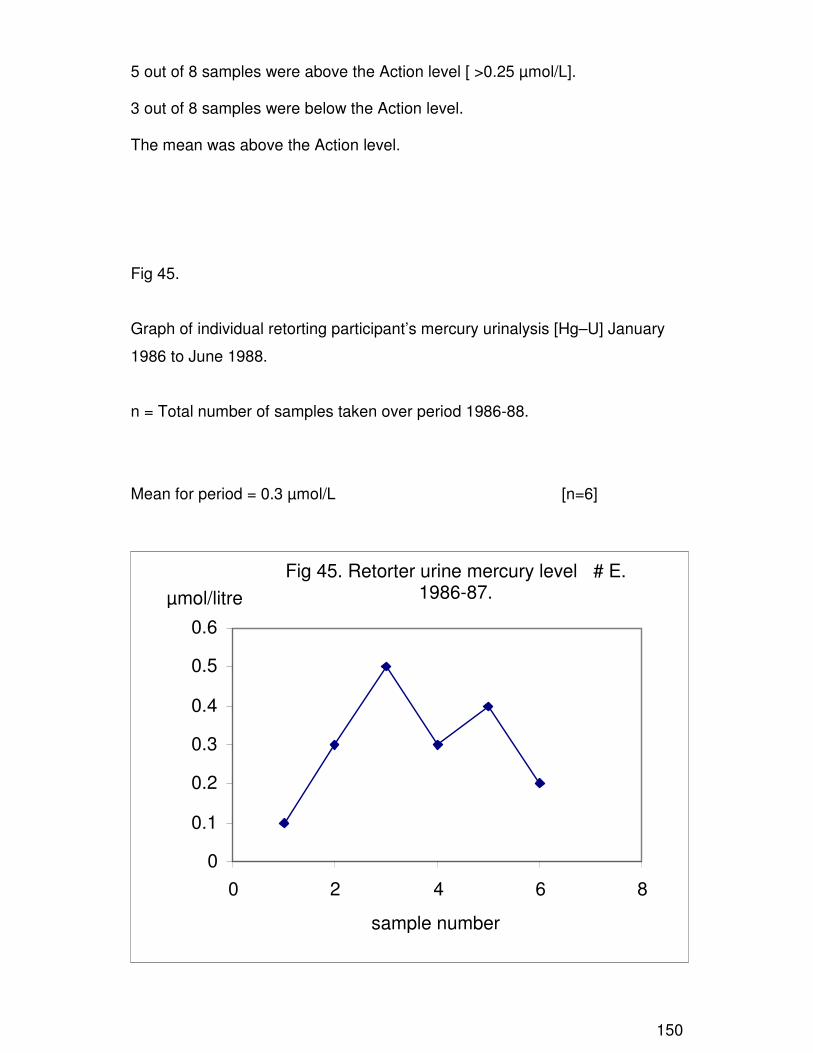
150
5 out of 8 samples were above the Action level [ >0.25 µmol/L].
3 out of 8 samples were below the Action level.
The mean was above the Action level.
Fig 45.
Graph of individual retorting participant’s mercury urinalysis [Hg–U] January
1986 to June 1988.
n = Total number of samples taken over period 1986-88.
Mean for period = 0.3 µmol/L [n=6]
Fig 45. Retorter urine mercury level # E.1986-87.
0
0.1
0.2
0.3
0.4
0.5
0.6
0 2 4 6 8
sample number
µmol/litre
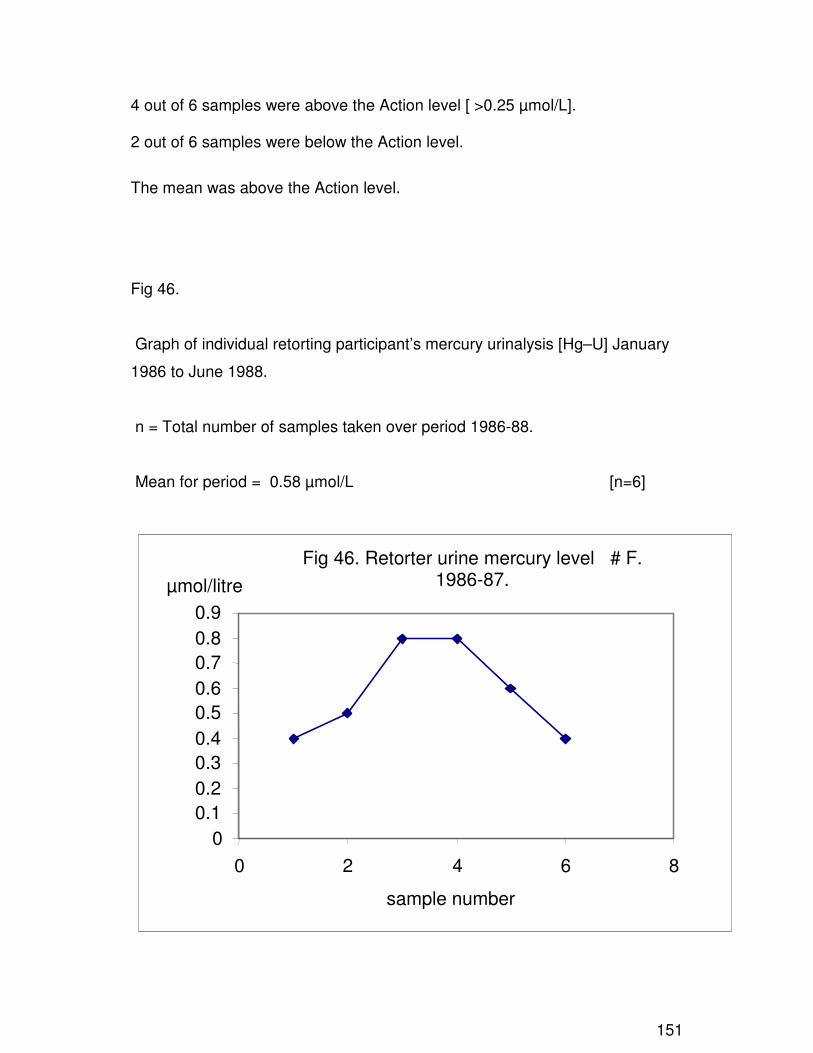
151
4 out of 6 samples were above the Action level [ >0.25 µmol/L].
2 out of 6 samples were below the Action level.
The mean was above the Action level.
Fig 46.
Graph of individual retorting participant’s mercury urinalysis [Hg–U] January
1986 to June 1988.
n = Total number of samples taken over period 1986-88.
Mean for period = 0.58 µmol/L [n=6]
Fig 46. Retorter urine mercury level # F.1986-87.
0
0.1
0.2
0.3
0.4
0.5
0.6
0.7
0.8
0.9
0 2 4 6 8
sample number
µmol/litre

152
3 out of 6 samples were above the Suspension level [ >0.5 µmol/L].
3 out of 6 samples were above the Action level [ >0.25 µmol/L].
No samples were below the Action level.
The mean was above the Suspension level.
Fig 47.
Graph of individual retorting participant’s mercury urinalysis [Hg–U] January
1986 to June 1988.
n = Total number of samples taken over period 1986-88.
Mean for period = 0.89 µmol/L [n=8]
Fig 47. Retorter urine mercury level # G.1986-88.
0
0.2
0.4
0.6
0.8
1
1.2
1.4
1.6
1.8
2
0 2 4 6 8 10
sample number
µmol/litre

153
5 out of 8 samples were above the Suspension level [ >0.5 µmol/L].
1 sample was above the Action level [ >0.25 µmol/L].
2 out of 8 samples were below the Action level.
The mean was above the Suspension level.
Fig 48.
Graph of individual retorting participant’s mercury urinalysis [Hg–U] January
1986 to June 1988.
n = Total number of samples taken over period 1986-88.
Mean for period =1.57 µmol/L [n=6]
Fig 48. Retorter urine mercury level # H.1986-88.
00.20.40.60.8
11.21.41.61.8
22.22.42.62.8
3
0 2 4 6 8
sample number
µmol/litre

154
6 out of 6 samples were above the Suspension level [ >0.5 µmol/L].
The mean was above the Suspension level.
The urinalysis results indicate that where individuals were monitored on a
regular basis over a period of time, their [Hg-U] were high. When Fig. 40 p143
is compared with the controls, Fig 52 p 155, they were well above the norm.
The mean of the individual urinalysis were, in the majority of cases, in the
Action level range or above the Suspension level, some were very high.
When used to assess occupational exposure on an industry basis, the
urinalysis results for the retort operators with a mean above the New Zealand
OSH guideline levels [BEI], indicates that the control methods in use were
ineffective in protecting workers from mercury contamination. On a group
basis the mean should be much lower if safety precautions and protective
methods are working.
Fig 49.
This graph indicates the BEI Normal, Action and Suspension levels measured
for retort operators in µmol/L for the period 1984-1988 and total number [n]
of samples /year. [includes 1984-85 historical data].

155
Fig 48. Total number of retort operator samples
1984-88
0
2
4
6
8
10
12
1984 1985 1986 1987 1988
um
ol/L
normal <0.25 µmol / L
action 0.25 to < 0.5 µmol / L
suspension > 0.5 µmol / L
1984 n = 10; 1985 n =10; 1986 n = 24; 1987 n = 24; 1988 n = 10
N.B. No graph has been created for the non-retorters as they were all below
the Action level [ >0.25 µmol/L].
In Fig 49, 1984 showed high levels with all samples indicating Action level
[>0.25 µmol/L] or Suspension level [>05 µmol/L] categories. In the following
years there is a mix of categories but predominately in Action and Suspension
levels. Given the risks from mercury poisoning these levels are too high.
These figures reinforce the ambient air measurements, personal dose
measurements and microenvironment measurements that are included in the
discussion section [Chapter 12 p 160].
Fig 50.

156
Graph of the percentage of total urine sample analysis in µmol/L for all study
participants [retort operators and non–retort mercury handler’s] 1984-1988.
[Controls not included but historical data from 1984-85 is included].
1984 n = 20; 1985 n = 21; 1986 n = 48; 1987 n = 48; 1988 n = 18.
Fig 51.
Graph of total number of mercury handlers [retort & non-retort] participating in
the study as a percentage of the total gold mining workforce/year.
n = yearly total workforce.
Fig 50. Urine mercury levels in µmol/L as percentageof total samples taken per year.
0
1020
30
4050
60
7080
90
1984 1985 1986 1987 1988
%
normal 0.25 µmol / L
action >0.25 µmol / L
suspension >0.5 µmol / L

157
Fig 51. Percentage of mercury handlers in work
force particpating in study.
0
2
4
6
8
10
12
14
16
1984 1985 1986 1987 1988
%
1984 n = 200; 1985 n = 250; 1986 n = 300; 1987 n = 350; 1988 n = 200.
11.8.4 Control.
Control mercury urine [Hg-U] levels are shown in Fig 52 p 155 and are similar
to what would be expected in the non-exposed general population <10 µgm/L
[0.05 µmol/L] (WHO 1991). These represent 1 sample per year for 2.5 years,
a total of 3 samples per control, and were used as comparison with the non–
retorting and retorting group results, Fig 31 p133 & Fig 40 p143.
Fig 52.
The control group mean, minimum and maximum urinary mercury levels in
µmol/L in the period 1986-1988.
n = total number of samples per year.

158
1986 n=12; 1987 n=12; 1988 n=12.
11.8.5. Questionnaire.
Questionnaire responses are tabulated in tables 9–12 pp 157-158 and relate
to the BEI Action level >0.25 µmol/L; Suspension level >0.5 µmol/L; and
Controls. The normal or below Action levels [0.25 µmol/L] have not been
tabulated. There are also no questionnaires for the historical samples 1984-
85. All questionnaire responses for Action [n=22] and Suspension [n=16]
criteria are included in tables 9 & 10 on p 157.
When a sample was collected the participant was asked to fill out a
questionnaire and the tables indicate the subjective feelings of the participants
at the time. There were a total of 16 mercury worker participants [8 retort and
8 non-retort workers] and they supplied 114 urine samples between January
Fig 52. Control urinary mercury levels1986-88.
0
0.005
0.01
0.015
0.02
0.025
0.03
0.035
0.04
1986 1987 1988
µmol/Lumo
mean
min
max

159
1986 and June 1988. Over the study period [2.5 years] a total of 95
questionnaires [83%] were returned. The Control group [n=12] gave 36 urine
samples in the 2.5 year period and returned 24 [67%] questionnaires as per
table 11 p 158.
Only the questionnaire responses of the participants who recorded Action or
Suspension level Hg-U results are included in the questionnaire tables 9 & 10
p157. In total 22 Action level [table 9] and 16 Suspension level responses
[table 10] are recorded.
Tables 9-11 pp 157-158 record the listed symptoms that participants felt that
they experienced at the time of urine collection. Table 12 p 158 shows a %
increase in the numbers of mercury handlers experiencing symptoms as a
comparison with the Controls. As their Hg–U levels rose their symptoms
increased, namely: insomnia, fatigue, poor appetite and irritability. Some of
these symptoms can be caused by sources other than mercury but, although
not conclusive, the trend upward in some symptoms coinciding with
increasing urinary mercury level is of interest and concern, and requires
further attention. Tables 9 & 10 relate to the number of positive samples for
Action or Suspension levels.
Table 9 records the number of questionnaires [n=22] returned indicating
subjective responses for those workers above the Action level [>0.25 µmol/L]
in period 1986-88.
Table 9. Number of subjective responses [n = 22] for Action level participants.
Symptoms no occasionally often

160
Headache 14 8 0
Insomnia 15 6 1
Fatigue 16 6 0
Stomach problems 19 3 0
Poor appetite 15 7 0
Gum problems 22 0 0
Tremor 21 1 0
Irritability 14 7 1
Table 10 records the number of questionnaires [n = 16] returned indicating
subjective responses for those workers above the Suspension level [>0.5
µmol/L] in period 1986-88.
Table 10. Number of subjective responses [n = 16] for Suspension level participants
Symptoms no occasionally often
Headache 6 8 2
Insomnia 10 6 0
Fatigue 7 6 3
Stomach problems 11 4 1
Poor appetite 8 6 2
Gum problems 13 2 1
Tremor 14 2 0
Irritability 6 8 2
Table 11 records the number of questionnaires [n] returned indicating
subjective responses for Control participants in period 1986-88.
Table 11. Number of subjective responses [n=24] for Controls.
Symptoms no occasionally often

161
Headache 16 6 2
Insomnia 16 6 2
Fatigue 14 8 2
Stomach problems 20 3 1
Poor appetite 18 5 1
Gum problems 23 1 0
Tremor 24 0 0
Irritability 16 6 2
Table 12 records the % of workers [Action & Suspension level] and controls
indicating subjective responses in the questionnaire.
Table 12. % of subjective response.
Symptoms Control Action level Suspension level n = 24 n = 22 n = 16 % % %Headache 33 37 63
Insomnia 33 32 38
Fatigue 41 27 56
Stomach problems 16 14 31
Poor appetite 25 32 50
Gum problems 4 0 19
Tremor 0 4 13
Irritability 33 36 62
Fig 53 graphs the percentage comparison between the responses of the
Control, Action and Suspension level participants in this study. This graph
relates to table 12.

162
Fig 53. Control and worker subjective response
to questionaire 1986-88.
010203040506070
Hea
dach
e
Inso
mnia
fatig
ue
stom
ach
prob
lem
s
Poor a
ppet
ite
Gum
pro
blem
s
Trem
or
Irrita
bility
symptom
%
Control
Action
Suspension
Control n = 24; Action level n = 22; Suspension level n = 16.
The percentage of questionnaire responses indicating some subjective
feelings is too large to be ignored, especially when they are related to high
mercury body burden as indicated by responder’s mercury urine results. In
particular, the increases in subjective feelings among the participants with
results above the Suspension level should be taken seriously. This is a trend
that needs to be researched further and in depth.
Chapter 12. Discussion.
12.1. General.

163
This study identified sources of mercury contamination and problem areas in
the New Zealand gold mining industry that are a cause for concern. The
World price of gold is a catalyst for gold mining becoming a viable industry
within New Zealand once more. The concerns identified in this study need to
be addressed to ensure that workers are protected from mercury toxicity.
Mercury is still available and considered easy and cheap to use so it will
remain the main means of recovering gold. This view is reinforced by current
research papers (EPA 1997; Agency 1999; Hentschel et al. 2002).
We know mercury is not essential to living cells and performs no known
biological function (NAS 1978) and most human exposure to biologically
significant amounts of elemental mercury occurs in the workplace (Stopford et
al. 1978; Roels et al. 1991). In the gold mining industry mercury is considered
just another means to an end, a tool to achieve a desired result, with little
thought given to the hazards associated with its use. In fact very little is known
about its hazards by those required to use it.
In the gold mining industry mercury is released into the environment and work
place through spillage, poor ventilation, bad work practice and poor house
keeping. Mercury vapour released into the atmosphere upon heating may

164
condense when cooled and form small droplets on surfaces. Workers are
exposed to mercury vapour levels in work rooms at levels above the TLV
[0.05 mg/m3]. Every work place visited during this study had a spillage
problem. Most surfaces are not wetted by mercury so that drops tend to roll,
enter small holes and cracks and mix easily with dust, or penetrate such
substances as wood or brickwork. Pouring mercury without splashing or
spilling is almost impossible, and any drops will break into smaller droplets too
small to be seen but still available to vaporise. Because of the high surface
tension of mercury, droplets are impossible to pick up making
decontamination of an area where mercury has been spilt very difficult. At
work sites visited spilt mercury was not cleaned up immediately and was
spread around the site via footwear. In work places, mercury could be seen
on work benches and floors where it was trapped in rough surfaces and
cracks. Because of the large surface area of small droplets, the mercury
easily re-vaporised and exceeded the TLV when the workplace temperature
increased.
The retorting process added to the mercury vapour level in work rooms due to
poor seals in the retorts that allowed significant amounts of mercury vapour to
escape. Many retorts leaked and where there was no local ventilation system
to exhaust this vapour outside it added to the existing room level. When a
retort was opened a small cloud of grey vapour was seen to escape into the
air space of the room. Measurement of this vapour confirmed that it was
mercury. Dropping retorts on the floor after use was observed to result in

165
small mercury droplets that had adhered to the inside of the condenser
spilling onto the floor.
Spilt mercury is a major source of vapour that is added to by other sources,
e.g. retorting, poor housekeeping and poor storage of mercury contaminated
equipment. These sources, combined with poor ventilation systems and
poorly constructed work rooms, resulted in a contaminated work environment
and a risk to worker’s health. This risk was transferred, via footwear, to other
work places where occupiers were unaware of the contamination. On
observation of the transfer of mercury from room to room by footwear,
arrangements were made to include air measurements of other than work
rooms at some sites [ table 8 p 129]. Air measurements were carried out as
mentioned in the result section [see 11.7. p 128]. Rooms that were thought to
be free of mercury were found to have significant levels of mercury vapour on
hot days when the room temperature rose. Hg–air levels in these rooms
ranged between 0.03-0.15 mg.Hg/m3air with a mean 0.085 mg.Hg/m3air. This
is a significant finding because unmonitored workers were exposed to
mercury contamination without their knowledge and, as this had not
previously been recognised, no steps were being taken to prevent exposure
or protect occupants in these rooms.
Although outside this study’s objectives and not followed up, it is worth
mentioning the transfer of mercury off-site. Many workplaces did not provide
clothes washing facilities and the workers took their clothes home to be

166
washed. The contamination of footwear and clothing could create another
health problem unrelated to the workplace; the potential for transfer of
mercury from the workplace to the home thereby creating a risk to other family
members. There is also the non-mercury handlers who have been shown to
be at risk through inter-workplace transfer of mercury taking it home on their
footwear and not being aware of this. As an example of the ease with which
toxic materials can be unwittingly transferred to a home, the author was
involved in an investigation of a lead poisoning case in a child some years
ago. The child had no known contact with lead but investigation found high
lead levels within the house and these were eventually traced to the father’s
clothing and boots which he wore at work and brought home. The mother
would shake the overalls in the house to remove any loose dirt before
washing them and the footwear was often worn into the house before being
removed.
An article in USA Today (10/11/2000), gives an indication of the ease with
which the transfer of toxic materials into homes can happen. The articles
author Stephanie Armour, stated that an investigation found that employees in
35 States had unwittingly transported toxins away from work sites to their
homes; and that families remain at risk in part because the health hazard has
been widely ignored (personal papers). Mercury was mentioned as one of
those toxic materials. When transported off-site toxins are invisible or too
small to be noticed, so family members may never know they’ve been put at

167
risk. They may be exposed if they touch a contaminated worker, handle his or
her clothing or clean a house that contains hazards tracked in from the job.
Family members who clean the home can raise their risks or spread the
hazard. When work clothes are washed the laundry area can become
contaminated. Decontamination may be inadequate because small amounts
of mercury can adhere to car seats, rugs, couches and other surfaces.
Vacuuming up mercury can disperse the substance in the air, making it more
readily absorbed.
Workplace substances that affect male workers may also indirectly cause
harm to their families. Mercury unintentionally brought home by a worker may
affect a woman's reproductive system or the health of an unborn child.
Exposure to relatively high Hg° vapour concentrations has been reported to
cause reproductive dysfunction in women and in laboratory animals (Schuurs
1999). It is not well known, however, that a man's exposure to substances in
the workplace can affect his ability to have healthy children by altering
hormones and sexual performance (NIOSH 1997). This needs to be
investigated further and brought to worker’s and management’s attention.
The significance of the building construction and poor housekeeping of work
rooms had a direct effect on the vaporisation of mercury. If there was no
spillage then the building structure would be of no concern from a mercury
168
perspective. Being constructed of galvanised iron with no internal lining the
building acted like an oven in summer when outside temperatures could reach
>300C [860F] raising the inside temperature. These temperatures vaporised
spilt mercury and room levels quickly rose above the TLV. The unlined wood
structure inside was porous and absorbed mercury. In winter the building
structure had less effect on mercury levels due to the colder outside
temperatures.
Poor ventilation, or lack of, coupled with ongoing spillage added mercury to
the room faster than it was removed and it was continually recycled. High
mercury levels in workplaces were not always indicative of actual mercury
usage and workers were exposed to higher levels than they were aware of.
Good ventilation is essential to ensure that vapours are removed from the
work environment and only mechanical ventilation can achieve this. The
release of mercury vapour into the work environment must be controlled by
engineering methods to the extent reasonably practicable. The most effective
control method is to enclose operations where mercury vapour may be
released and to provide local exhaust ventilation and filtration. In an
environment where there is little air movement, even at low temperatures, a
high level of mercury vapour can accumulate as found in this study.
Increased overall ventilation will increase vaporisation rates so all point
sources of mercury, e.g. retorts, need local exhaust ventilation. Given the
potential for increased evaporation of mercury due to increased air
movement, other sources of vapour, such as spillages, need to be controlled

169
and removed. Good house keeping is critical and most sites visited had poor
housekeeping processes allowing spilt mercury to be added to that already
available for vaporisation. Measurements and observation proved that
ventilation systems within the industry did not achieve adequate air changes
with too much reliance put on natural ventilation as a means of mercury
vapour removal and dilution. The release of mercury vapour into the work
environment must be controlled by engineering methods where practicable
and this should involve enclosing operations where mercury vapour may be
released. Forced extraction systems, where provided, were usually
associated with the retorting process and were switched off when retorting
finished. They were not used to achieve room air changes to remove all
mercury.
Mercury vapour in air levels [Hg–air] were the combined product of all the
mercury sources previously mentioned created mercury vapour sources that
continually added to the pool of mercury available to vaporise. It is worth
repeating that poor ventilation was a critical factor in work rooms exceeding
the TLV. Volatile metallic mercury, in a saturated atmosphere, contains
approximately 18 mgHg/m3
air at 240C [750F]. The exposure standard [0.05
mg/m3]
can easily be exceeded when metallic mercury is freely exposed to air,
creating a risk of mercury poisoning by inhalation (Marsden 1992).
Mercury in air results in tables 4–6 on pp 123-126 confirm that, industry wide,
the control of mercury vapour was ineffective and that this industry has a
problem that needs attention. Evaluation of mercury in grab sample

170
measurements in tables 4 & 5 pp 123-125 give individual and group means
that exceeded the TLV and are supported by the urinalysis levels. The study
proved that work room vapour levels consistently exceeded the TLV and were
a risk to worker’s health. This is further confirmed in table 6 p 126 that
records the ongoing Hg–air sampling that was done at the time of urine
collection. This data was collated as a range and a mean for the period rather
than each individual measurement being recorded and indicates that the
mean for the group exceeded the TLV. The purpose of obtaining air samples
is to determine specific sources of mercury vapour within the plant and to
ascertain the effectiveness of clean-up and equipment decontamination
procedures. The study proves the in-effectiveness of safety procedures in use
in this industry.
Air samples should not be used as a substitute for personal exposure
sampling as the purpose of personal air monitoring is to determine an
individual’s exposure to airborne metallic mercury vapour. The lack of suitable
equipment to monitor peaks, as distinct from total concentration, was a major
problem in this study and was only partially overcome by the use of personal
monitors and instant reading of meters. There is a school of thought that
personal samplers actually give better results than static samplers. Roels et al
(1987) compared results obtained with the use of static samplers with results
from personal samplers and found that, in most of the workplaces, personal
samplers yielded higher exposure levels [TWA] than did static samplers.
As no peaks were recorded in this study there is no way of knowing whether

171
the workers were exposed to the concentration measured in one exposure or
over the period that they wore the monitor.
Because of the inability to record peaks, the use of static, or grab samples,
may have caused an error resulting in some measurements not being a true
indication of individual exposure. However, any error would be under reporting
rather than over reporting and, based on measurements, work sites were
found to be a risk to workers. In some cases the meter was used to compare
air measurements with the personal badge results. In most cases the badge
showed higher exposure than monitoring with the meter. In only one out of six
cases where this was done did the meter come close to the badge result.
Whilst air sampling can be used as a guide to good housekeeping it is not an
absolute measure of personal exposure. Air sampling does not take into
account the small amounts of mercury that can be absorbed through the skin
or continued exposure outside work hours through the wearing of
contaminated clothing. Contaminated skin and clothing are additional sources
of mercury vapour that can be inhaled and such contamination can cause
mercury vapour concentrations in the microenvironment of a worker that are
several times higher than the concentration of the workplace air. Therefore,
breathing zone/ personal air samples should be used to estimate worker
exposure where-ever possible.

172
12.2. Mercury in air & mercury in urine relationship.
A literature search noted that some of the early researchers (Smith 1970;
Evans 1975) were of the opinion that the determination of mercury
concentration in urine could only be used to estimate the exposure of a group
of workers using the results on the basis of the geometric mean of a group
being above or below a set figure to indicate whether compliance is being
met. Piotrowski et al. (1975) demonstrated that the urinary mercury excretion
in an individual may be assessed precisely enough provided that urine
sampling is always performed at the same time, the concentration is corrected
for specific gravity and the subject has been exposed for a sufficiently long
time. Roels et al. (1987) stated that they had conclusive evidence, that
excellent relationships could be established, on an individual basis between
the daily intensity of mercury vapour exposure and daily mercury in urine
levels. In this study the participants had all worked in the industry for at least 6
months before selection and the collection and analysis of samples in this
study complied with current literature of the period.
There are a number of variables that should be considered in the collection
and interpretation of the sampling results as mercury excretion from the body
fluctuates considerably independent from exposure. Urinary mercury
measurement is considered reliable, simple and able to provide rapid
identification of elevated mercury levels in an individual (Roels et al. 1987;
Naleway et al. 1991). Yoshida (1985) found that urinary mercury levels

173
correlated better with exposure than blood mercury concentrations following
long-term, low-level occupational exposure to elemental mercury vapour.
Despite some minor differing of opinion many studies now agree that urine as
an indicator of mercury in air exposure gives reliable results and that those
results can be used to show exposure to high mercury in air levels (Lindstedt
et al. 1979; Roels et al.1987; Barregård L. 1993; Nordhagen et al. 1994).
There is also agreement that a good correlation exists between urinary
mercury levels and mercury in air levels (Stopford et al. 1978; Roels et al.
1987; Ehrenbeg et al. 1991; Tsjui et al. 2003).
In Figs 32-39 pp 134-141 the non - retorting mercury handlers had much
lower mercury urine levels [Hg–U ] than the retort handlers. This was
expected due to their restricted handling of the metal and less time in mercury
contaminated environments. Their Hg–U levels were higher than the Control
group but, below the BEI and they were lower than the retort operator’s
minimum level. On an industry basis Fig 31 p 133, urinalysis results show the
non–retort group mean below the guideline levels [BEI] and close to the
maximum of the Control group Fig 52 p 155.
Figs 41-48 pp 144-151, indicate that where retort workers were monitored on
a regular basis their Hg–U levels were high. When compared with the

174
Controls they were well above the “norm”. The mean of the retort workers
ranged above the Action or Suspension levels. Using these results on a group
basis Fig 40 p 143 the group mean was above the accepted level. The Hg-U
levels, in conjunction with the Hg–air results, confirm that, on an industry
basis, the control methods in use were ineffective and that workers were
exposed to un-necessary risk from mercury contamination.
The correlation between the Hg–air and Hg–U in this study, confirm the
relationship mentioned earlier (Lindstedt et al. 1979; Roels et al. 1987;
Barregård L. 1993; Nordhagen et al. 1994), that urine as an indicator of
mercury in air exposure gives reliable levels and that those results can be
used to identify exposure to high mercury in air levels.
The study found that these workers had ongoing exposures and thereby were
subjected to possible cumulative body burden unless their exposures were
reduced. Without ongoing monitoring of work places by management, and an
in place site plan of protective actions to be taken, such an event is highly
probable. Discussions with management at the time of the study found that
unless they were forced to do so by legislation nothing much would change
and employees would remain at risk.
12.3. Microenvironment.

175
During the study it was observed that some participant’s urine results were
higher than could be explained by Hg–air measurements given the
relationship between Hg–U and Hg-air. Long exposure periods were not the
only cause of high biological levels of mercury in worker’s as short exposure
to high levels occurred frequently in this industry. In some cases the biological
levels of workers rose rapidly between samples yet, on observation and
measurement, they did not appear to be exposed to high Hg–air levels or, be
exposed to contaminated environments for long periods.
Observation of process and practice led to concern that the measurement of
mercury vapour within the work place might not be a true reflection of the
worker’s exposure level. To identify why/how this was occurring, it was
decided to look closer at the personal environment of the individual worker i.e.
his breathing zone. One area of interest was the possible contamination of
clothing, especially overalls, which were known to be worn for long periods
without washing or changing. This contamination of the clothing occurred
during handling of the mercury and from being in the vapour contaminated
rooms where the clothing absorbed mercury vapour. After work the overalls
were often left in the work room where they continued to absorb vapours.
Contamination of the skin and clothing can produce a source of mercury
vapour than can be inhaled as it will be continuously released into the
worker’s breathing zone.
Another source of high environmental loading that could be associated with a
microenvironment is the opening of the retort crucibles after retorting is

176
finished. The crucible was always removed from the retort to the floor to open
and as mentioned in the result section a grey vapour, confirmed as mercury
vapour, was observed to be released from the retort on opening. Because the
retort operator stood bent over the retort to remove the crucible lid he was
directly in line with the vapour coming off. This vapour was available as a high
dose to breathe in at the time of retort opening and also contaminate clothing
from where it was available to slowly release into the breathing zone of the
wearer for the period that the clothing was worn. Breathing a high volume of
mercury in a short time can poison the inhaler quickly. Contamination of
clothing did not show up as part of the general room measurement and was
not recorded as part of the worker’s daily dose. The fact that a worker could
go on breathing the vapours given off from his clothes after he had finished
working with mercury, or being in a mercury contaminated room, was not
acknowledged. If Hg–air levels are monitored, without reference to worker’s
microenvironments, it gives a false picture of their total dose. For this reason it
is repeated that, breathing zone air samples should be used to estimate
worker’s true exposure to their total mercury burden.
This study confirmed that not only was a microenvironment created by the
contamination of worker’s clothing and that this contaminated a worker’s
breathing zone, but, that it continued to do so after they left contaminated
rooms. Failure to consider the existence and importance of this
microenvironment meant that a work room environmental measurement may

177
have complied with the TLV for mercury vapour, but the detrimental effect on
the worker was not recognised nor was his true body burden measured. The
existence of a microenvironment explains the discrepancy between the earlier
high Hg–U levels and the Hg–air measurements in this study. Stopford et al.
(1978) postulated on the basis of their research, that it was possible that the
individual variability in mercury excretion is a true reflection of the variability of
the external microenvironment of the worker that is not reflected by measuring
the airborne concentration of mercury in the general work area. Roels et al.
(1987) mentioned microenvironments and their contribution to overall
exposures and the fact that microenvironment existence had been overlooked
in earlier studies, particularly Smith et al. 1970. The existence of a
microenvironment contamination is proven in this study and is evidence to
account for some of the high urine levels in workers who were recorded as
being exposed to low Hg–air levels. This is especially so where no other
sources can be found.
Microenvironment have not been mentioned in recent studies, but it is noted
that MOSHAB (2006) [ Mines Occupational Safety & Health Board] in Western
Australia have reinforced the need to consider microenvironments by stating
in their Mining Guide, “that contaminated skin and clothing can produce
additional sources of mercury vapour that can be inhaled and that such
contamination can result in mercury vapour concentrations in a person’s
microenvironment several times higher than the concentration in air of the
general work environment.

178
Air sampling does not take into account the small amount of mercury that can
be absorbed through the skin or continued exposure outside work hours
through wearing contaminated clothing” (MOSHAB 2006). Senn (1996) also
refers to microenvironments in her mining guide.
Microenvironments are an area of worker exposure that should be
investigated and considered especially where high Hg–U levels can not be
explained by measured Hg–air levels. They should be considered as part of
any measurement program that looks at personal contamination or body
burden. The carrying home of contaminated clothing and the potential to
contaminate the home should also be given more attention.
12.4. Questionnaire.
The questionnaire used in this study was designed by the author and listed
symptoms that are common to mercury poisoning. It was not peer reviewed
and was used as an indicator of the subjective feelings of the worker’s health
at the time of urine collection and workers were not subjected to any medical,
physiological or neurological examination. Roels et al. (1985) used a self
administered questionnaire to detect symptoms of nervous system
disturbances in their study of Belgian factory workers exposed to metallic
mercury.
Although it is difficult to prove the presence of these symptoms were related
to mercury contamination, or toxicity, without objective clinical testing, they

179
should not be ignored. Smith et al. (1970) found a significant relationship
between mercury and the prevalence of various signs and symptoms [loss of
appetite, tremor and insomnia] with 39% of his workers having an Hg–U of 0.5
µmol/L [100 µg/L] or greater. This study found 75% of workers with Hg-U
levels 0.5 µmol/L or greater with similar symptoms. Roels et al. (1987) also
found correlation between urine mercury levels and reported subjective
symptoms of insomnia, tremor and loss of appetite.
Previous research has shown that in cases where low biological levels were
found in mercury exposed workers, and no subjective response was
indicated, the same workers, when asked to perform sensitive and objective
tests showed signs of function impairment (Evans et al. 1975; Rosenman et
al.1986). Studies with chronically exposed populations to high concentrations
of mercury have shown cognitive, personality, sensory and motor function
effects (Roels et al. 1982; Ehrenberg et al. 1991) and, whilst most people
seem to recover if taken away from the source, not all do. There are studies
that show that some effects [tremors and cognitive deficits] can still be
observed 10 – 30 years after exposure (Albers et al. 1998; Mathiesen et al.
1999; Letz et al. 2000). Even where exposed workers do recover it can take a
long period (McFarlane & Reigel 1978; Lilis et al.1985). Neurological testing of
gold mine workers exposed to mercury is a subject for further research.
There is cause for concern that these subjective symptoms were being
ignored, especially where consistently high Hg–U were involved, and there
was a reluctance by management to consider that symptoms may have been

180
caused by mercury contamination. It is known that due to physiological
variations, unusual sensitivity, or even some previous disease problems in
individual cases, people can display symptoms at different biological levels
and that these levels will range above and below the BEI. Some of these
symptoms can be caused by other than mercury and, though it is not
conclusive, the consistent indication by workers of these symptoms [insomnia,
fatigue, poor appetite and irritability] coinciding with a rise in their urinalysis
results is a worrying trend. Such trends should be followed up to ensure the
workers are not being exposed to a life long problem. These symptoms are
mentioned in other studies (Roels et al. 1987). In an assessment of studies on
the exposure - response relationship between inhaled mercury vapour and
adverse health effects, IPCS (2002) concluded that several studies
consistently demonstrate subtle effects on the central nervous system in long-
term occupational exposures to mercury vapour at exposure levels of
approximately 20 µg/m3 [0.02 mg/m3] this figure is below the TLV (WHO/IPCS
2002). As this study measured consistently high mercury vapour levels in
work rooms to which workers were exposed, and high urinalysis levels, the
questionnaire responses have validity and need to be given serious
consideration.
The lack of clinical testing of workers with high urinalysis results is an
oversight that needs addressing and it should be mandatory for anyone with

181
an urinalysis result >0.5 µmol/L to have a clinical test. If such testing is not
carried out the worker could have problems later in life. This is especially
relevant given that tremor has been reported with long-term exposure to
relatively low concentrations of mercury vapour (Chapman et al. 1990) and
mild tremor may constitute an early adverse effect (Netterstrøm et al. 1996;
Biernat et al. 1999).
Clinical testing is important when workers with consistently high biological
levels are known to be working in an environment with high vapour levels, but,
show no obvious symptoms. Without clinical testing at a set Action level, a
progression to irreversible side effect is a possibility given current research.
12.5. Environmental pollution.
Although environmental pollution from mercury was not part of this study it is
of interest and concern to note that environmental pollution did occur. It is
known that mercury, along with cyanide, another gold saving chemical, was
discharged to our waterways by the old miners (WCRC 2007). During this
study the author was approached by a local ranger for the Acclimatisation
Society [responsible for looking after game fish stocks in New Zealand rivers
and streams] regarding the finding of high levels of mercury in some trout
caught in the local Grey river. A major waterway on the West Coast, the Grey
River is fed by other smaller rivers that were associated with gold mining in
the past and currently.

182
There were 5 trout involved and the largest 1.05kg in weight had a level of
0.73 mg/kg. This was above the WHO maximum recommended limit of 0.5
mg/kg (WHO 1991). The other 4 trout were between 0.45 and 0.5 kg in weight
and had levels between 0.05 and 0.14 mg/kg. All had been caught in the Grey
River by local anglers.
Gold mining is a known source of mercury discharge to the environment as
well as being a source of harm to the health of the handlers (WHO 1990;
ATSDR 1999; UNEP 2005). Mercury which is not inhaled or collected during
the gold saving process settles into the surrounding environment where it is
absorbed and processed by a variety of living organisms. As mentioned in the
toxicology review of mercury earlier in this study [chapter 5], this process
transforms elemental mercury into methyl mercury, one of the most toxic
organic compounds and a powerful neurotoxin (UNEP 2005). Due to
bioaccumulation any biological organism exposed to that environment will
take up mercury (Heiserman 1992). Since approximately 95% of all mercury
used in small-scale gold mining around the world is released into the
environment EPA (1997), this is an environmental as well as a human danger.
A very important factor in the impact of mercury on the environment is its
ability to build up in the organisms and the food chain Lacerda (1997).
Inorganic mercury can also be absorbed, but is generally taken up at a slower
rate and with lower efficiency than is methylmercury (EPA 1997). Because
elemental mercury can be converted to methylmercury in aquatic

183
environments (Lindberg et al. 2001; Ullrich et al. 2001) this is what has
happened in this local situation to contaminate the trout.
The Acclimatisation Society and the West Coast Regional Council decided to
carry out some further research into the contamination of fish stock by
mercury. Long finned eels, [Anguilla dieffenbachia] were considered the top
predator in the local waterways and 11 eels were taken from 4 major
waterways that had, at some time, gold mining in their catchments. The
results showed levels of mercury from 0.1 to 0.5 mg/kg. The author of the
report concluded that whilst there was some mercury pollution in the fish
stock, the levels were not high enough to constitute a risk to humans
consuming the fish unless they ate a large quantity. He did, however, add that
it would only take a slight increase in biologically active mercury to put some
fish into the critical zone. (Ryan 1989). This opinion is similar to one in a DSIR
report that looked at mercury in trout in North Island waterways (Brooks et al.
1976).
The quantity of spilt mercury seen at gold mining sites during this survey,
indicates that it is highly probable that most of this spillage is being washed
into waterways directly and indirectly. A common way of trying to clean up a
site was to hose it down and wash everything into the ground. The drains had
no sumps or traps to capture wash down sediments before discharge to the
environment. On some mining sites mercury was used outside and any spilt
mercury was lost to the ground. At the time of the study the rules covering

184
discharges to the environment were weak and no one authority was
responsible for oversight. This resulted in no monitoring of discharges.

185
Chapter 13. Conclusions.
13.1. General.
The use of mercury in the New Zealand gold mining industry creates a risk to
the health of workers required to handle the metal. This study found that the
risk increased through lack of knowledge regarding mercury’s toxic properties
and the work practices of the companies involved. High levels of mercury
vapour were found in work rooms and on the clothing of workers, and a lack
of basic safety procedures and equipment was noted. Microenvironments that
were not acknowledged exist and add to worker’s body burden of mercury.
Mercury contamination was measured in areas away from mercury
workrooms e.g. staff rooms, lunch rooms and offices through transfer of spilt
mercury via footwear and clothing. It is highly probable that mercury was
transferred to worker’s homes via footwear and contaminated clothing worn,
or taken home to be washed.
Prevention of hazardous environments is essential to protect worker’s health.
The control of mercury would be more effective if a program for work place
health and safety was available at all mining sites. As part of such a program
an exposure control plan that will ensure staff are protected from over-
exposure is required. The plan should set out procedures for on going
monitoring of staff and environment.

186
13.2. Specific.
1. The gold mining industry creates a risk to the health of employees
through contamination of work environments with metallic mercury.
This is either directly from handling or working with the metal, including
being in the mercury workroom or, indirectly through contamination of
their work place by carry over of spilt mercury on footwear.
2. Spilt mercury was not cleaned up immediately making it available to be
transported around work rooms, work site and off-site where it
vaporised when room temperatures rose. Room mercury vapour levels
were well above the New Zealand Threshold Limit value [TLV] making
rooms a source of mercury exposure to anyone who entered.
3. Employees who did not work with mercury were put at unknown risk
through the transfer of spilt mercury via footwear throughout the work
site. Workers were not aware of this risk and not being monitored.
4. There is a high probability that mercury was transferred to worker’s
homes via footwear and clothing and family members were put at risk
unknowingly. This was not followed up as it was not part of this study.
187
5. Mercury vapour levels in work rooms increased according to the type of
building construction, with tin clad rooms absorbing the sun’s heat and
acting like ovens on hot days. This exposed workers to mercury vapour
when no handling of mercury was taking place. As they were not aware
of the situation the workers would take no precautions to protect
themselves.
6. The industry as a whole failed to acknowledge the significance of poor
work & hygiene practices in handling mercury. There was a large
information gap in the knowledge of all people in this industry regarding
the toxicity and properties of mercury and correct handling procedures.
Workers who have contact with mercury must be made aware of toxic
properties, the associated risk with handling it and protective
procedures.
7. Subjective symptoms were ignored and not taken seriously, or as valid
reasons to look at work practices and implement protective measures.
The use of questionnaires to evaluate individual and group exposure is
an essential tool in worker health monitoring in this industry.
8. Microenvironments are an important, but unacknowledged, source of
contamination of a worker’s breathing zone and increased body
burden. Contaminated clothing was the main source of this
microenvironment and such zones are a continuing source of worker
contamination for as long as the clothes are worn.
188
Despite being a major source of contamination, microenvironments are
easy to control by simply changing clothing daily and
ensuring that they are washed at work and clean overalls supplied
each day. Worker education regarding this is also an essential part.
9. There is a relationship between mercury urine levels and mercury air
measurements that justifies using mercury urine results as a means of
monitoring worker’s mercury exposure. This ensures that a worker’s
total body burden is being measured and considered.
10. The use of the New Zealand BEI [Biological Exposure Indices] as a
means to monitor and control mercury exposure in individual cases is
acceptable so long as it is carried out according to recognised
parameters. In conjunction with the other methods e.g. personal dose
measurements and air measurements they will give useful data.
11. Well designed, forced air ventilation systems are essential in mercury
work rooms and must provide minimum air changes. These should be
supplied in conjunction with a filtered extraction system over the retort.
Engineering technology should be used where needed as the use of
respirators should be a last resort where there are no engineered
solutions.

189
12. Scrupulous work practices and work room hygiene is essential to avoid
the spillage of mercury and its transfer around work sites.
13. Despite the use of currently valid and acceptable methods of mercury
measurement this study has shown that we may not always obtain a
true/valid indication of a worker’s exposure to mercury unless we have
a monitoring plan that includes both personal and environmental air
monitoring, measuring a worker’s body burden and periodic medical
monitoring in conjunction with testing worker’s neurological symptoms.
14. The use and spillage of mercury, poor housekeeping, poor hygiene,
carelessness and disposal of mercury waste, is a cause of mercury
contamination of our waterways and the environment.

190
Chapter 14. Recommendations.
14.1. General.
The new Health and Safety in Employment Act 1992 [HSE] and the HSNO11
Act 1996 are better tools for controlling compliance than the old legislation
which they have replaced, so long as they are well administered. From 1992
OSH procedure has developed from, a hands on approach whereby
inspectors visited sites and gave instruction on what was needed to comply;
to one whereby self policing by companies is involved with minimal oversight
by inspectors. This has led to a situation whereby OSH involvement is more
an investigation after an accident, or incident, rather than prevention. If gold
mining is to start again then this type of approach will not lead to improvement
in the conditions/ problems found in the 1984-88 survey.
The Health and Safety in Employment Act 1992 [HSE] provides the authority
for action to prevent and control most of the problems found in the survey and
could be effective. However, this effectiveness can only be assured if OSH
carry out their responsibilities and do not allow self policing to take place.
During the original survey the mine owners had a vested interest in ensuring
that costs were kept down [gold mining can be capital intensive] and they took
shortcuts because no one checked them. Given that the same culture is
191
possible today, onsite visits and hands on control by inspectors will be
necessary. OSH is the only department that has authority under both Acts
[HSE & HSNO] in all workplaces therefore they are well placed to enforce the
legislation. Goldmines are now workplaces, whereas at the time of the survey
they were excluded due to the Mining legislation of the day placing them
under the supervision of the mines inspectorate.
Section 12 of the HSE Act requires that employers must provide information
about chemicals, their health and safety hazards, how to use the chemicals
correctly and safely, and how to respond in emergency situations. The
employer must ensure that the information is presented in a form the
employee can understand and in a way that it is always readily available. The
employer must also provide training in the safe use of chemicals and the
protective clothing and equipment that the employee is required to use.
Information is best provided as a Material Safety Data Sheet [MSDS] for the
chemical concerned. A MSDS [which should be available from the chemical
supplier or manufacturer – see appendix 3] has concise information on:
• Identification of name, formula, uses, physical description/properties,
and ingredients:
• Health hazard information e.g. health effects, acute and chronic; first
aid:
11
The HSNO Act 1996 covers the importation and use of all hazardous substances andorganisms within New Zealand. Regulations under the Act cover importation/ use anddestruction.

192
• Precautions for use e.g. exposure standards, engineering controls,
personal protection, flammability:
• Safe handling information e.g. storage and transport, spills and
disposal, fire/explosion hazard.
The enforcement of this section of the Act by OSH would ensure that
employers met their obligation to make their employees aware of the hazards
involved with the use of mercury, a major omission identified in the survey.
The HSE Act also requires that where a worksite has significant hazards that
could result in harm to an employee, the employer must provide suitable
protective equipment and/ or suitable personal protective clothing. Section 7
of the HSE Act requires the employer to have in place effective methods to
systematically identify and assess hazards. To carry out a thorough
assessment of the hazards created by the storage, handling, use and disposal
of hazardous substances to enable adequate control measures to be
implemented. Employers need to determine the magnitude of the risks to
employees and then ensure that all practicable steps are taken to minimise
those risks. OSH enforcement of this section would bring the lack of protective
equipment and inadequate facilities previously identified under control and
reduce the likelihood of worker contamination and possible home transfer of
mercury.
Another method of controlling harm to employees is the use of Managing
Substances Hazardous to Health codes [MOSHH]. These codes require
employers to consider two [2] types of monitoring:

193
1. Measuring employee’s exposure to a hazardous substance; and
2. Checking employee’s health in relation to the exposure. Both
workplace exposure monitoring and health surveillance may be
necessary to ensure that exposure to hazardous substances is being
adequately controlled.
The use of MOSHH would go some way to ensuring that goldminers were
being monitored on a regular basis and that action was taken on those
results. Given adequate involvement by OSH and the drawing up of approved
sampling programmes, personal contamination and microenvironments could
be measured and controlled. Determined use of the HSE Act by OSH would
mean that mine owners would have to clean up their operations and provide
proper facilities and workrooms for the safe use of mercury. The HSE Act
provides the power to control gold mining and prevent the problems identified
in the 1984-88 survey so long as the authorities insist on using and enforcing
the legislation.
The HSNO Act and Regulations provides adequate controls to ensure that
mercury, as a controlled substance, has its use recorded from importation,
through use, to disposal. This would prevent much of the waste to the
atmosphere and ground and water pollution. Again this can only happen if the
Authorities police the legislation as intended. This new legislation gives OSH
many powers and they are the one organisation that can use both the HSNO
and HSE Acts in the workplace.
The legislation available today means that if gold mining is started again
mercury use should be better controlled, and worker’s health should not be at

194
risk, as it was in the 1980s. However, self policing by the industry as a means
of protecting worker safety should not be allowed. This has not worked in the
past and will not work in the future. There is too much vested interest by mine
owners. Worker safety will only be achieved if the OSH inspectorate is
involved in visiting the mines on a regular basis, ensuring that monitoring
takes place and legislation is enforced. The new legislation sets out many
requirements and the penalties are high for failure to comply. Prosecution
should be mandatory for any employer who willingly fails to protect their
workers. The prevention of harm to workers must be paramount in this
industry. It is the author’s opinion that, despite HSE and HSNO requirements,
without the regular presence of OSH inspectors on site, and enforcement of
conditions, there will be minimal change in this industry.
Based on the findings of this study the following recommendations should be
acted on to ensure that any use of mercury in the New Zealand gold mining
industry does not put workers, and/or others, at risk.
14.2. Specific.
1. The control and remedying of problems found in this study can only
be achieved by an enforceable code of practice, good education,
policing, and strict application of the legislation by OSH.
2. The industry must be monitored more regularly by the Authorities
as self policing has not worked in the past. This will require
a change in mind set by the Authorities.

195
3. There are efficient, modern, mechanical methods of saving gold
available that should be made known to the industry as a
replacement for mercury. The use of these should be encouraged.
4. Subjective symptoms should be accepted as part of the monitoring
of mercury exposure where urinary results are over the BEI action
level.
5. A total sampling regime should be established by employers in
collaboration with OSH that takes account of subjective feelings
[from questionnaire or other means], mercury in urine, personal air
monitoring, air measurement and microenvironments, and where
necessary, neurological testing. As mentioned in 14.1.the
existence of MOSHH in the legislation makes this possible.
6. Microenvironments must be acknowledged and accepted as a
critical part of any monitoring program in 5 above. Not including
them will make any measurement of a worker’s exposure incomplete
and will not give a complete indication of their total mercury
exposure.
7. Clinical testing should be mandatory for any person with an
urinalysis result >0.5 µmol/L [BEI].
8. Sumps to catch any sediment during wash down of mercury
contaminated areas must be a compulsory part of any licence to use
mercury. Disposal of waste from these sumps must be to approved
facilities. HSNO legislation should be used to achieve this.
9. Mercury is a classified toxic substance under HSNO [class 6;8;9].
OSH policing of HSNO in terms of workplaces/ operations would
ensure that the use of this chemical was controlled.

196
Chapter 15. Limitations and Bias.
15.1. Limitations.
This study was restricted by several limitations. These include:
• The shortage of personal dose badges. This was a supply and finance
problem and was not able to be overcome. A larger supply of badges
would have enabled more sampling of personal air zones and given a
better indication of the true level of personal contamination.
• The overloading of the mercury meter. Because of the high levels of
mercury vapour found in work rooms during this study the meter often
became overloaded. This was a technical limitation of the instrument
as it worked on a gold foil absorption process and the gold foil became
overloaded/ saturated if mercury vapours were too high [>1 mg/m3].
When this occurred the instrument had to be cleansed by burning off
the foil, an internal process in the instrument that was manually
initiated. This took time, sometimes as long as 15 minutes, and made
measurement difficult when used in saturated work places.

197
• The inability to log any measured peak loadings meant that there was
no way of knowing whether an unattended reading was influenced by a
sudden release of vapour , was the days accumulated measurement.
At the time of the study there were limited instruments available to
carry out any measurement of peak loadings. The equipment available
was too expensive to hire given the length and funding availability of
this study and they were in short supply. As this study had limited funds
and was over a long time period, they were not utilised.
• Finance was short so the use of equipment to carry out measurements
was restricted to what was available in the local office and what could
be borrowed from other offices/ departments.
• The necessity of fitting visits in with gold mining company work
schedules and some restricted access made for difficulties in carrying
out some measurements to fit within the study timeframe.
• The lack of control; over some of the sampling data. e.g. The use of
lapel badges meant that the wearer was not observed all day and there
was no way of telling whether some of the higher reading were not
deliberate contamination. Trust was a big part of this study.

198
15.2. Bias.
A method of categorising systematic research errors is by classifying them in
to two general classes: Selection and Observation bias (Hennekens & Buring
1987).
1. Selection bias.
Site choice: The work sites were chosen to be representative of size and
type but a limitation was that they had to be reasonably accessible and
within a reasonable travel distance. This meant that some of the more
isolated and distant sites were not included. Some companies put
restrictions on access that ruled them out of contention. There was also a
cost factor in travel to sites that ruled distant sites out.
Site visits: The mine sites could only be studied if the mine owners were
willing to allow visits. Those that were not willing may have been sites
where conditions were bad or they may have thought that my presence
would interrupt work. The number of sites that were willing to allow visits
was considered representative enough to ensure validity to the finding.
Participant choice: The selection of participants was largely controlled by
the willingness of both companies and workers to be involved.

199
2. Observation bias.
Observing:
Observation of work practice was a necessary part of this study but, it is
possible that although the employees being observed were willing
participants, they may have changed consciously or un-
consciously their routine to fit in with what they perceived the study to be
looking for.
Interviewing:
Interviewing employees could bias an observer in favour of the employees
and affect the attitude to the company. Some of the interview questions,
especially in regard to personal health and work conditions, were sensitive
to the participants. The question of honesty in answers given is a critical
factor and not one that is easy to determine.
Some of the bias was difficult to overcome during the study, mainly due to
lack of recognition at the start and a limitation on time and finance. Most of
them could be overcome in future research where confounding issues could
be accounted for.
200
Chapter 16. Areas for Additional Research.
16.1. Gaps.
Identified gaps in knowledge:
1. The existence of microenvironments. This is an area of research that
needs to be developed further. Failure to acknowledge the existence of
microenvironments that affect a worker’s breathing zone will mean that
a worker’s true exposure to mercury vapour is not measured. If reliance
is given to just measuring room vapour levels then exposed workers
will continue to be at risk and monitoring will not be valid or moral.
2. Worker’s subjective symptoms can have a relationship to their mercury
exposure. Subjective feelings should be acknowledged and followed
up. More work needs to be done on this and the clinical testing of
mercury handlers and those exposed to mercury.
3. The likelihood that workers could carry mercury off-site and thereby
contaminate their home environment is an issue that this study
observed as a distinct probability. It needs to be researched further to
identify if this is happening and if it is, to what extent. Such
contamination could be a risk to families without them being aware.

201
4. The identification of alternative methods of recovering gold from the
sediments needs to be explored. Although there appears to be other
methods mentioned during this study it was difficult to find any freely
available information on them.

202
References.
ACGIH 1991.Inorganic Mercury. Cincinnati. Ohio. US.
ACGIH 2008. American Conference of Government Industrial Hygienists
Website. http://www.acghi.org?products/beiintro.htm. visited 14/01/08.
Agency for Toxic Substances and Disease Registry. 1999. Toxicological
Profile for Mercury (Update). Washington, DC: U.S. Department of
Health and Human Services.
Albers J W. Kallenbach L R. Fine L J. Langolf G D. Wolfe R A. Donofrio P D.
Alessi A G. Stolp-Smith K A. Bromberg M B & the Mercury Workers
Study Group. 1988. Neurological abnormalities associated with remote
occupational elemental mercury exposure. Ann. Neurol. 24. 651 – 659.
Alpers N. Hunerlach P. May T. Hothem L. 2005. Mercury from historical gold
mining in California. USGS. Fact sheet 2005-3014. V1.1.
Ashe WF, Largent EJ, Dutra FR, Hubbard DM, Blackstone M. 1953.
Behaviour of mercury in the animal organism following inhalation. AMA
Arch Ind Hyg Occup Med. Jan. 7: 1. 19 – 43.
ATSDR 1999. Public health statement for mercury. Agency for Toxic
Substances & Disease Registry. Department of Health and Human
Services Centre for Disease Control. Atlanta. GA:30333. US.
Bakir F. Damluji SF. Amin-Zaki L. Murtadha M. Khalidi A. al-Rawi NY. Tikriti
S. Dahahir HI. Clarkson TW. Smith JC. Doherty RA. Methylmercury
poisoning in Iraq. Science. 1973. Jul. 181(96). 230–241.
BAN 2007. Basil Action Network. Website accessed 22/0/2007.
http://www.ban.org/main/about_BAN.html

203
Barregard L. 1991. Occupational exposure to inorganic mercury in chloralkali
workers. Studies on metabolism and health effect. Thesis: University of
Göteborg [Sweden], Department of Occupational Medicine. Cited in
Lauwerys RR and Hoet P. 1993. Industrial chemical exposure:
guidelines for biological monitoring, 2nd ed. Boca Raton: Lewis
Publishers.
Barregård L. 1993. Biological monitoring of exposure to mercury vapor. Scand
J Work Environ Health 19 (suppl 1): 45 - 49.
Bauer JG & First HA. 1982. The toxicity of mercury in dental amalgam.
California dent. J. June. 10: 6. 47 - 61.
Beard RR. 1987. Treating Gold Ores by Amalgamation. Circular No. 27,
March. Arizona Department of Mines and Mineral Resources.
Bender Michael T. 2007. Executive Director. Executive Director. Mercury
Policy Project. Sierra Club. Montpelier, VT. Washington, DC.
www.mercurypolicy.org Website accessed 12/06/07.
Berlin A. Brown RH. Saunders KJ. (Eds). 1989. Diffusive sampling: An
alternative approach to workplace air monitoring. CEC Publication. No.
10555EN. Commission of the European Communities. Brussels-
Luxenbourg.
Bidone E.D. Castilhos ZC. Cid de Souza TM. Lacerda LD. Fish
contamination and human exposure to mercury in the Tapajos river
basin, Para state, Amazon, Brazil: a screening approach. Bull. Environ.
Contam. Toxicol. 59 1997. pp. 194–201.

204
Biernat H. Ellias SA. Wermuth L. Cleary D. De Oliveira Santos EC.
Jørgensen PJ. 1999. Tremor frequency patterns in mercury vapour
exposure, compared with early Parkinson's disease and essential
tremor, Neurotoxicology 20. pp. 945–952.
Bluhm RE. Bobbitt RG. Welch LW. Wood AJ. Bonfiglio JF. Sarzen C. Heath
AJ. Branch RA. 1992. Elemental mercury vapour toxicity, treatment,
and prognosis after acute, intensive exposure in chloralkali plant
workers. Part I: History, neuropsychological findings and chelator
effects. Hum Exp Toxicol 11. 201-210.
Blume H & Brummer G. 1991. Prediction of heavy metal behaviour in soil by
Means of simple field tests. Ecotoxicology and Environmental Safety.
22: 164-174.
Braithwaite RL & Pirajno F. 1993. Metallogenic map of New Zealand.
1:1,000,000. Institute of Geological and Nuclear Sciences monograph
3.
Brooks RR. Lewis JR. Reeves RD. 1976. Mercury and other heavy metals in
trout of central North Island, New Zealand. New Zealand Journal of
Marine and Freshwater Research. 10. 2. 233-244. Department of
Scientific and Industrial Research. Wellington. New Zealand.
Brown RH. 1993. The use of diffusive samplers for monitoring of ambient air.
Pure & Appl. Chem. Vol 65. 8. 1859-1874.
Bystrianyk R. 2007. Toxic jewelry – the gold mercury connection. Health
Sentinel. June 8.
Carpi, A. 1997 Mercury from Combustion Sources: A Review of the Chemical
Species Emitted and Their Transport in the Atmosphere. Water Air and
Soil Pollution. 98: 3/4.241-254.
205
Chapman LJ. Sauter SL. Henning RA. Dodson VN. Reddan W.G. Matthews
C.G. 1990. Difference in frequency of finger tremor in otherwise
asymptomatic mercury workers, Br J Ind Med 47. pp. 838–843.
Chemical & Engineering News. 2007. May 28. 85: 22. 26-29
Clarkson TW. Friberg L. Hursh J.B. Nylander M. l988. The prediction of
intake of mercury vapour from amalgams. In: Clarkson TW. Friberg L..
Nordberg GF. Sager P. (ed.) Biological monitoring of metals. New
York, London. Plenum Press. 247-264.
Clarkson, T. W. 1989. Mercury. J. Am. Coll. Toxicol. 8: 1291-1295.
Dhindsa HS, Battle AR, Prytz S. 2003. Environmental Emission of Mercury
intake of mercury vapour from amalgams. In: Clarkson TW. Friberg L..
Nordberg GF. Sager P. (ed.) Biological monitoring of metals. New
York, London. Plenum Press. 247-264.
H&D Act. 2000. Health and Disability Act. Ministry of Health. Wellington.
New Zealand.
Ehrenberg RL, Vogt RL, Smith AB, Brondum J, Brightwell WS, Hudson PJ,
McManu KP, Hannon WH, Phipps FC. 1991. Effects of elemental
mercury exposure at a thermometer plant. 19: 4. 495 – 507.
Environment Canada. http://www.ec.gc.ca/MERCURY/EH/EN/eh-b.cfm
Website visited 17/12/07.
Environmental Health Criteria 101: Methyl mercury . WHO 1990.
http://www.epa.gov/waterscience/criteria/ Website accessed
01/07/2007.
206
EPA 1984. U.S. Environmental Protection Agency. Mercury health effects
update — health issue assessment. Washington, DC: Office of Health
and Environment, EPA. EPA 600/8-84-019F
EPA 1996. 104: 8. Report.
EPA. August 1997. U.S. Environmental Protection Agency 1997.
Report to Congress on Mercury. http://www.epa.gov/oar/mercury.html.
Website accessed 20/03/07.
EPA. Environmental Protection Agency. 2001. Mercury Updata: Impact on
Fish Advisories. USEPA. Office of Water. 4305.
EPA. 2007. Mercury: Human exposure. Website accessed 20/06/2007.
http://www.epa.gov/mercury/exposure.htm
Evans HL, Laties VG and Weiss B. 1975. Behavioural affects of mercury.
Applied Pharmacy Journal 41.
Farrar, WV. & Williams AR. 1977. A history of mercury. In The Chemistry of
Mercury, McAuliffe, CA. (ed.) MacMillan, London.
Goldwater, L. J. 1972. Mercury, a history of quicksilver, York Press,
Baltimore, Maryland.
Gotllieb C & Kanluen S. 1991. A clinical pathological study of four adult cases
of acute mercury inhalation toxicity. Archives of Pathology and
Laboratory Medicine. 115. 56-60.
Greenpeace 1994. Greenpeace inventory of toxic technologies - mercury
amalgamation process in gold production. As cited by Scoullos et al,
2000.
207
Halbach S & Clarkson TW. 1978. Enzymatic oxidation of mercury
vapours by erythrocytes. Biochem. Biophys. Acta, 523: 2. 522-531
Handbook of New Zealand Mines. 1906. HA Gordon. Mines Department.
Wellington. New Zealand.
Heiserman DL. 1992. Exploring Chemical Elements and Their Compounds:
Blue Ridge Summit, Pa. TAB Books.
Henderson J. 1922. Cinnabar in New Zealand. NZ Geological Survey annual
report 16.
Hennekens CH. & Buring JE.1987. Epidemiology in Medicine, Little, Brown.
Boston. MA.
Hentschel T, Hrushchka F. Priester M. 2002. Global report on artisanal &
small scale mining. MMSD. January. No 70.
Hursh JB. Clarkson TW. Cherian MG. Vostal JV . Mallie RV. 1976.
Clearance of mercury vapour inhaled by human subjects. Arch.
Environ. Health, 31. 302-309.
Hursh JB. Clarkson TW. Miles E. Goldsmith L A. 1989.
Percutaneous absorption of mercury vapour by man. Arch. Environ.
Health. 44: 2. 120 -127.
IARC 1987. Overall evaluation of carcinogenicity: An updating of IARC
monographs volumes 1 to 42, Lyon, International agency for
Research on Cancer, 440.
Joselow M M. Goldwater L J. Alvarez A. Herndon J. 1968 Absorption and
excretion of mercury in man: XIV. Salivary excretion and its relationship
to blood and urine mercury. Archives of Environmental Health, 17: 35 –
38.

208
Joselow M M. Goldwater L J. Alvarez A. Herndon J. 1968 Absorption and
excretion of mercury in man: XV. Occupational exposure among
dentists. Archives of Environmental Health, 17: 39 – 43.
Kew J. Morris C. Aihie A. Fysh R. Jones S. Brooks D. 1993. Lesson of the
Week: Arsenic and mercury intoxication due to Indian ethnic remedies.
British Medical Journal. 306. 506-507.
Kishi R. Hashimoto K. Shimizu S. Kobayashi M. 1978. Behavioural changes
and mercury concentrations in tissues of rats exposed to mercury
vapour. Toxicol. Appl. Pharmacol. 46. 555 - 566.
Kishi R. Doi R. Fukuchi Y. 1993. Subjective symptoms and neuro-behavioural
performance of ex-mercury miners at an average of 18 years after
cessation of chronic exposure to mercury vapour. Envionmental
Research. 62. 289 – 302.
Lacerda LD. 1997. Global mercury emissions from gold and silver mining.
Water, Air and Soil pollution 97. 247 – 255. Kluwer Academic
Publishers. The Netherlands.
Lambertsson L. & Nilsson M. 2006. Organic material: The primary control on
Mercury methylation and ambient methyl mercury concentrations in
estuarine sediments. Environmental Science & Technology 40. 6:
1822-1829.
Letz R. Gerr F. Cragle D. Green RC. Watkins J. Fidler A. 2000. Residual
neurologic deficits 30 years after occupational exposure to elemental
mercury. Neurotoxicology 21: 4. 459-474.
Lilis R. Miller A. Lerman Y. 1985. Acute mercury poisoning with severe
chronic pulmonary manifestations. Chest. 88. 2. 306 – 309.

209
Lindberg S E, Wallschlager D, Prestbo E M, Bloom N S, Price J & Reinhart D.
2001. Methylated mercury species in municipal waste landfill gas
sampled in Florida, USA, Atmospheric Environment 35. 4011-4015.
Lindstedt G. Gottberg I. Holmgren B. Jonsson T. Karlsson G. 1979. Individual
mercury exposure of chloralkali workers and its relation to blood and
urinary mercury levels. Scand J Work Environ Health 5.1: 59 - 69.
Lindqvist, O & Rodhe, H. 1985. Atmospheric mercury - a review. Tellus 37B:
136 -159
Little L. 1997. An introduction to the Tamil Siddhas: their tantric
alchemy, poetry, and the true nature of their heresy within the context
of South Indian Shaivite Society. Web site accessed 20.10.07.
http://www.levity.com/alchemy/tamil_si.html
Malm O. Pfeiffer WC. Souza MM. Reuther R. Mercury pollution due to gold
mining in the Madeira River Basin, Brazil. Ambio 19. 1990. pp. 11–15.
Malm O. 1998. Gold mining as a source of mercury exposure in the Brazilian
Amazon. Environmental Research. Section A. 77. 73 – 78.
Marsden J. & House I. 1992. The chemistry of gold extraction. Ellis Horwood
Ltd. Chichester. West Sussex. England.
Mason R P & Fitzgerald W F. 1993. The Distribution and Biogeochemical
Cycling of Mercury in the Equatorial Pacific-Ocean. Deep-Sea
Research Part I-Oceanographic Research Papers 40.9. 1897-1924.
Mathiesen T. Ellingsen DG. Kjuus H. 1999. Neuropsychological effects
associated with exposure to mercury vapour among former chloralkali
workers. Scandinavian Journal of Work, Environment, and Health.
25 . 4.
May PR. 1962. West Coast Gold Rushes. Pegasus Press. Christchurch.
New Zealand.

210
McFarlane RB & Reigel H. 1978. Chronic mercury poisoning from a single
brief exposure. J Occup Med. 20: 8. 532 -534.
Meil, M. 1997. Mercury in lakes and rivers. Metal Ions in Biological Systems.
brief exposure. J Occup Med. 20: 8. 532 -534.
Minerals of New Zealand. Railton GL & Walter WA. Geological Survey
Bulletin. No. 104. 1990.
MED 2007. Ministry of Economic Development. Wellington. New Zealand.
http://www.med.govt.nz/ Website accessed June 2007.
Minamata DiseaseArchives. http://www.nimd.go.jp/archives/english/index.html
Website accessed 05/12/07.
MMSD 2002. Breaking New Ground: Mining, Minerals, and Sustainable
Development. International Institute for Environment and Development,
http://www.iied.org/mmsd/finalreport/index.html Website accessed
June 13. 2007.
MOSHAB 2006. Management of exposure to inorganic mercury in gold
plants. Guideline. Department of Industry and Resources. Government
of Western Australia.
MOH. Ministry of Health web site visited 10.09.08. www. Moh.govt.nz.
Naleway C, Chou HN, Muller T, Dabney J, Roxe D, Farrida S. 1991. On-site
plants. Guideline. Department of Industry and Resources. Government
of Western Australia.
NAS. 1978. An assessment of mercury in the environment. National Academy
of Sciences Press. Washington. DC.

211
Netterstrom B. Guldager B. Heeboll J. 1996. Acute mercury intoxication
examined with coordination ability and tremor. Neurotoxicol Teratol 18.
505-509.
NIOSH.1973. National Institute for Occupational Safety and Health Criteria for
a recommended standard: Occupational exposure to inorganic
mercury. U.S. Department of Health, Education, and Welfare
Publication No. HSM 73-11024, GPO No. 017-033-00022, U.S.
Government Printing Office, Washington, D.C.
NIOSH. 1975. Handbook of Statistical Tests for Evaluating Employee
Exposure to Air Contaminants. NIOSH Technical Information. CDC.
Atlanta. USA.
NIOSH. The Effects of Workplace Hazards on Male Reproductive Health.
DHHS Publication No. 96-132
Nriagu, JO. 1989. A global assessment of natural sources of atmospheric
trace metal. Nature 338: 47-49.
NTIS 2007. http://www.ntis.gov/products/specialty/bom.asp Website
accessed May 10. 2007
Nordhagen HP. Ellingsen DG. Kjuus H. 1994. Production and surveillance of
mercury exposure over 40 years at a chloralkali plant. Ann Occup Hyg
38: 777- 788.
Officers of the New Zealand Geological Survey 1970: Minerals of New
Zealand (part A: Metallics). New Zealand Geological Survey report
38A.
OSH 1994. Workplace exposure standards. Department of Labour.
Wellington. New Zealand.

212
OSHA 2007. US. Department of labour. Occupational Safety and Health
Administration. Washington DC. www.osh.gov Website accessed
28/06/07.
Piikivi L. & Tolonen U. 1989. EEG findings in chlor-alkali workers subjected to
low long term exposure to mercury vapour. Br. J. Ind. Med. 46:
370 -375.
Piikivi L. & Hanninen H. 1989. Subjective symptoms and psychological
performance of chlorin-alkali workers. Scand. J. Work. Environ.
Health. 15. 69 -74.
Piotrowski JK. Trojanowska B. Mogilnicka EM. 1975. Excretion kinetics
and variability in urinary mercury in workers exposed to mercury
vapour. Internat. Arch. Occupational and Environmental Health
Journal. 35. 245 - 256.
Pirrone N, Pacyna JM, & Barth H. 2001. Atmospheric mercury research in
Europe. Special Issue of Atmospheric Environment 35. 17. Elsevier
Science [Publisher]. Amsterdam. Netherlands.
Pirrone N. Costa P.,Pacyna J.M. Ferrara R. 2001a. Mercury emissions to the
atmosphere from natural and anthropogenic sources in the
Mediterranean region. Atmospheric Environment. 3. 2997 - 3006.
Railton GT & Watters WA. 1990. Minerals of New Zealand. New Zealand
Geological Survey bulletin 104.
Roels HA. Lauwerys R. Buchet JP. 1982. Comparison of renal functions and
psychomotor performance in workers exposed to elemental mercury.
International Archives of Occupational & Environmental Health. 50
77 – 93.

213
Roels H. Abdeladium S. Ceulemans E. Lauwerys R. 1987. Relationships
between the concentration of mercury in air and in blood or urine in
workers exposed to mercury vapour. Ann. Occup.Hyg. 31. No2.
135 -145.
Rosenman WD, Valcickas JA, Glickman L, Meyers BR, Cinoli A. Sensitive
indicatory of inorganic mercury toxicity. Arch Environ Health. 1986. 41
(14). 208 – 215.
Ryan PA. 1989. Mercury in Grey and Buller river catchments. West Coast
Regional Council report. Greymouth. New Zealand.
Schuurs A H B. 1999. Reproductive toxicity of occupational mercury. A
review of the literature. J. Dentistry 27, 249–256
Schwartz J G. Snider TE. Montiel M M. 1992. Toxicity of a family from
vacuumed mercury. Am J Emerg Med. 10: 258-261.
Scoullos M. Vonkeman G. Thornton .Makuch Z. Arsenikos S.
Constantianos V. Docx P. Karavoltsos S. MacDonald K. Mantzara B.
Maxson P. Rautiu R. Roniotes S. Sakellari A. Zeri C. 2000.
EUPHEMET - Towards an integrated EU policy for heavy metals. For
the European Commission DG12 - Research Directorate – General.
Brussels.
Seigneur C. Vijayaraghavan K. Lohman K. Karamchandani P. Scott C.
Global source attribution for mercury deposition in the United States,
Environ. Sci. Technol. 38 (2) 2004. 555–569.
Senn EP. 1996. Controlling metallic mercury exposure in the workplace. A
guide for Employers. New Jersey Department of Health Occupational
Health Service. CN 360. Trenten New Jersey.

214
Smith RG, Vorwald AJ, Patil LS, Mooney TF. 1970. Effects of exposure to
mercury in chlorine manufacture. Am Ind Hyg Assoc J. 31: 687 – 700.
Smith W E & Smith A M. 1975. Minamata. Chatto & Windus, Ltd. London.
ISBN 7011-2131-9.
Statistics 2006. Statistic. New Zealand. www.statistics Website accessed
21.5.07.
Stopford W. Bundy SD. Goldwater LJ. Bittikofer JA. 1978. Microenvironmental
exposure to mercury vapour. Am Ind Hyg Assoc J. 39: 378 – 384.
Stwertka A. 1996. .A Guide to the Elements. Oxford University Press.
Syphilis. 2007. Syphilis in History. Website accessed 22.06.2007http://wisdomtools.com/poynter/syphilis.html.
Takacs L. 2000. Quicksilver from cinnabar: The first documented
mechanochemical reaction? Journal of Metals. Jan 2000. 12–13.
Trakhtenberg L.M. 1974.Chronic effects of mercury on organisms. U.S.
Department of Health, Education and Welfare. Public Health Service.
National Institute of Health. DHEW Publication No. (NIH) 74–473.
Tsuji SJ. Williams PRD. Edwards MR. Allamneni KP. Kelsh MA. Paustenbach
DJ. Sheehan PJ. 2003. Evaluation of mercury in urine as an indicator
of exposure to low levels of mercury vapour. Environmental Health
Perspectives. 111: 4.
Ullrich S M, Tanton TW & Abdrashitova S A. 2001. Mercury in the Aquatic
Environment: A review of factors affecting methylation. Critical
Reviews in Environmental Science and Technology 31. 3. 241-293
UNEP 2002. Global mercury assessment. December, Summary of the Report,
paragraphs 57-58.

215
UNEP 2005. Global mercury assessment. United Nations Environment
Programme. Geneva. Switzerland.
UNEP 2005. United Nations Environment Programme. Geneva. Switzerland.
UNIDO 2002. United Nations Industrial development Organization. Global
mercury project.EG/GLO?01/G34. Removal of Barriers to Introduction
of Cleaner Artisanal Gold Mining and Extraction Technologies.
Equipment Specification for the Demonstration Units in Zimbabwe.
Marcello Veiga, Vienna, Austria.
US Department of Labour. 1985. Occupational Safety and Health
Administration. Occupational safety and health guideline for mercury
vapour. technical sheet.
US Department of Labour. 1987. Report ID-140. Evaluation of a solid sorbent
passive dosimeter for collecting mercury vapour. Division of Physical
Measurement & Inorganic Analysis. OSHA. Technical Centre. Sandy .
Utah. USA.
USEPA. Mercury emissions: The global context. Web site visited 04/12/07.
http://www.epa.gov/mercury/control_emissions/global.htm
U.S. EPA 2002. Ritualistic Uses of Mercury Task Force Report. EPA/540-R-
01-005. Washington, DC:U.S. Environmental Protection Agency.
WCRC 2007. www.WCRC.govt.nz Website accessed January 2007.
Weeks Mary Elvira. 1956. Discovery of the Elements. Easton, Pennsylvania:
Journal of Chemical Education.
WHO 1976. Environmental Health Criteria 1: Mercury, Geneva. World
Health Organization. 131.
216
WHO. 1990. International Programme on Chemical Safety. World Health
Organization. Geneva.
WHO. 1991.Inorganic mercury. Environmental Health Criteria . Inorganic
Mercury. 118. World Health Organization, Geneva.
WHO / IPCS 2002. Elemental mercury and inorganic mercury compounds.
Concise International Chemical assessment Document No. 50. World
Health Organisation, Geneva, Switzerland.
Wikipedia. 2007. en.wikipedia.org/wiki/Anthropogenic Website accessed
25.06.07
Williams GJ. 1974. Economic geology of New Zealand. Australasian Institute
of Mining and Metallurgy monograph 4.
Wolff M. Osborne JW & Hanson AL. 1983. Mercury toxicity and dental
amalgam. Neurotoxicology, 4 (3). 201-204.
World of Chemistry 2007. http://www.bookrags.com/research/mercury-woc/
Website accessed 13th June. 2007.
Yang Y. Huang C. Shih T. Yang S. 1994. Chronic elemental mercury
intoxication: clinical and field studies in lampsocket manufacturers.
Occupational and Environmental Medicine. 51. 4. 267-270.
Yoshida M. 1985. Relation of mercury exposure to elemental mercury levels
in the urine and blood. Scan J Work Environ Health. 11: 33 – 37.

217
Appendix 1.
Mercury questionnaire.
Would you please answer the following questions. The results will be used as
part of our assessment. This information is confidential. Thank you.
Smoker yes / no Age: F / M
Do you suffer from any of the following symptoms?
1. Headache no / occasionally / often
2. Insomnia no / occasionally / often
3. Fatigue no / occasionally / often
4. Stomach problems no / occasionally / often
5. poor appetite no / occasionally / often
6. Gum problems no / occasionally / often
7. Tremors / shakes no / occasionally / often
8. Irritability no / occasionally / often
Are there any other health problems you have noticed since handling
mercury?

218
Appendix 2.
Mercury Vapour Sniffer [analyser]

219
Appendix 3.
Material Safety Data SheetMercurySection 1: Chemical Product and Company IdentificationProduct Name: MercuryCatalog Codes: SLM3505, SLM1363CAS#: 7439-97-6RTECS: OV4550000TSCA: TSCA 8(b) inventory: MercuryCI#: Not applicable.Synonym: Quick Silver; Colloidal Mercury; MetallicMercury; Liquid Silver; HydragyrumChemical Name: MercuryChemical Formula: HgContact Information:Sciencelab.com, Inc.14025 Smith Rd.Houston, Texas 77396US Sales: 1-800-901-7247International Sales: 1-281-441-4400Order Online: ScienceLab.comCHEMTREC (24HR Emergency Telephone), call:1-800-424-9300International CHEMTREC, call: 1-703-527-3887For non-emergency assistance, call: 1-281-441-4400Section 2: Composition and Information on IngredientsComposition:NameCAS #% by WeightMercury7439-97-6100Toxicological Data on Ingredients: Mercury LD50: Not available. LC50: Notavailable.Section 3: Hazards IdentificationPotential Acute Health Effects:Very hazardous in case of skin contact (irritant), of eye contact (irritant), ofingestion, of inhalation. Hazardous in case of skin contact (corrosive,permeator). Liquid or spray mist may produce tissue damage particularly onmucous membranes of eyes, mouth and respiratory tract. Skin contact mayproduce burns. Inhalation of the spray mist may produce severe irritation ofrespiratory tract, characterized by coughing, choking, or shortness of breath.Severe over-exposure can result in death. Inflammation of the eye ischaracterized by redness, watering, and itching. Skin inflammation ischaracterized by itching, scaling, reddening, or, occasionally, blistering.

220
Potential Chronic Health Effects:Hazardous in case of skin contact (permeator).CARCINOGENIC EFFECTS: Classified A5 (Not suspected for human.) byACGIH. 3 (Not classifiable forhuman.) by IARC.MUTAGENIC EFFECTS: Not available.TERATOGENIC EFFECTS: Not available.
DEVELOPMENTAL TOXICITY: Not available.The substance may be toxic to blood, kidneys, liver, brain, peripheral nervoussystem, central nervous system (CNS). Repeated or prolonged exposure tothe substance can produce target organs damage. Repeated or prolongedcontact with spray mist may produce chronic eye irritation and severe skinirritation. Repeated or prolonged exposure to spray mist may producerespiratory tract irritation leading to frequent attacks of bronchial infection.Repeated exposure to a highly toxic material may produce generaldeterioration of health by an accumulation in one or many human organs.Section 4: First Aid MeasuresEye Contact:Check for and remove any contact lenses. In case of contact, immediatelyflush eyes with plenty of water for at least 15 minutes. Cold water may beused. WARM water MUST be used. Get medical attention immediately.Skin Contact:In case of contact, immediately flush skin with plenty of water for at least 15minutes while removing contaminated clothing and shoes. Cover the irritatedskin with an emollient. Wash clothing before reuse. Thoroughly clean shoesbefore reuse. Get medical attention immediately.Serious Skin Contact:Wash with a disinfectant soap and cover the contaminated skin with an anti-bacterial cream. Seek immediate medical attention.Inhalation:If inhaled, remove to fresh air. If not breathing, give artificial respiration. Ifbreathing is difficult, give oxygen. Get medical attention immediately.Serious Inhalation:Evacuate the victim to a safe area as soon as possible. Loosen tight clothingsuch as a collar, tie, belt or waistband. If breathing is difficult, administeroxygen. If the victim is not breathing, perform mouth-to-mouth resuscitation.WARNING: It may be hazardous to the person providing aid to give mouth-to-mouth resuscitation when the inhaled material is toxic, infectious or corrosive.Seek immediate medical attention.Ingestion:Do NOT induce vomiting unless directed to do so by medical personnel.Never give anything by mouth to an unconscious person. If large quantities ofthis material are swallowed, call a physician immediately. Loosen tightclothing such as a collar, tie, belt or waistband.Serious Ingestion: Not available.Section 5: Fire and Explosion DataFlammability of the Product: Non-flammable.Auto-Ignition Temperature: Not applicable.

221
Flash Points: Not applicable.Flammable Limits: Not applicable.Products of Combustion: Not available.Fire Hazards in Presence of Various Substances: Not applicable.Explosion Hazards in Presence of Various Substances:Risks of explosion of the product in presence of mechanical impact: Notavailable. Risks of explosion of the product in presence of static discharge:Not available.Fire Fighting Media and Instructions: Not applicable.
Special Remarks on Fire Hazards:When thrown into mercury vapor, boron phosphodiiodide ignites at once.Flame forms with chlorine jet over mercury surface at 200 deg to 300 deg C.Mercury undergoes hazardous reactions in the presence of heat and sparksor ignition.Special Remarks on Explosion Hazards:A violent exothermic reaction or possible explosion occurs when mercurycomes in contact with lithium and rubidium.CHLORINE DIOXIDE & LIQUID HG, WHEN MIXED, EXPLODE VIOLENTLY.Mercury and Ammonia can produce an explosive compound.A mixture of the dry carbonyl and oxygen will explode on vigorous shakingwith mercury. Methyl azide in the presence of mercury was shown to bepotentially explosive.Section 6: Accidental Release MeasuresSmall Spill: Absorb with an inert material and put the spilled material in anappropriate waste disposal.Large Spill:Corrosive liquid. Poisonous liquid.Stop leak if without risk. Absorb with DRY earth, sand or other non-combustible material. Do not get water inside container. Do not touch spilledmaterial. Use water spray curtain to divert vapor drift. Use water spray toreduce vapors. Prevent entry into sewers, basements or confined areas; dikeif needed. Call for assistance on disposal. Be careful that the product is notpresent at a concentration level above TLV. Check TLV on the MSDS andwith local authorities.Section 7: Handling and StoragePrecautions:Keep locked up.. Keep container dry. Do not ingest. Do not breathegas/fumes/ vapor/spray. Never add water to this product. In case ofinsufficient ventilation, wear suitable respiratory equipment. If ingested, seekmedical advice immediately and show the container or the label. Avoidcontact with skin and eyes. Keep away from incompatibles such as oxidizingagents, metals.Storage: Keep container tightly closed. Keep container in a cool, well-ventilated area. Do not store above 25°C (77°F).

222
Section 8: Exposure Controls/Personal ProtectionEngineering Controls:Provide exhaust ventilation or other engineering controls to keep the airborneconcentrations of vapors below their respective threshold limit value. Ensurethat eyewash stations and safety showers are proximal to the work-stationlocation.Personal Protection:Face shield. Full suit. Vapor respirator. Be sure to use an approved/certifiedrespirator or equivalent. Gloves. Boots.Personal Protection in Case of a Large Spill:Splash goggles. Full suit. Vapor respirator. Boots. Gloves. A self containedbreathing apparatus should be used to avoid inhalation of the product.Suggested protective clothing might not be sufficient; consult a specialistBEFORE handling this product.Exposure Limits:TWA: 0.025 from ACGIH (TLV) [United States] SKINTWA: 0.05 CEIL: 0.1 (mg/m3) from OSHA (PEL) [United States] InhalationTWA: 0.025 (mg/m3) [United Kingdom (UK)]Consult local authorities for acceptable exposure limits.
Section 9: Physical and Chemical PropertiesPhysical state and appearance: Liquid. (Heavy liquid)Odor: Odorless.Taste: Not available.Molecular Weight: 200.59 g/moleColor: Silver-whitepH (1% soln/water): Not available.Boiling Point: 356.73°C (674.1°F)Melting Point: -38.87°C (-38°F)Critical Temperature: 1462°C (2663.6°F)Specific Gravity: 13.55 (Water = 1)Vapor Pressure: Not available.Vapor Density: 6.93 (Air = 1)Volatility: Not available.Odor Threshold: Not available.Water/Oil Dist. Coeff.: Not available.Ionicity (in Water): Not available.Dispersion Properties: Not available.Solubility: Very slightly soluble in cold water.Section 10: Stability and Reactivity DataStability: The product is stable.Instability Temperature: Not available.Conditions of Instability: Incompatible materialsIncompatibility with various substances: Reactive with oxidizing agents,metals.Corrosivity: Non-corrosive in presence of glass.

223
Special Remarks on Reactivity:Ground mixtures of sodium carbide and mercury, aluminum, lead, or iron canreact vigorously. A violent exothermic reaction or possible explosion occurswhen mercury comes in contact with lithium and rubidium.Incompatible with boron diiodophosphide; ethylene oxide; metal oxides,metals(aluminum, potassium, lithium, sodium, rubidium); methyl azide;methylsilane, oxygen; oxidants(bromine, peroxyformic acid, chlorine dioxide,nitric acid, tetracarbonynickel, nitromethane, silver perchlorate, chlorates,sulfuric acid, nitrates,); tetracarbonylnickel, oxygen, acetylinic compounds,ammonia, ethylene oxide, methylsiliane, calcium,Special Remarks on Corrosivity:The high mobility and tendency to dispersion exhibited by mercury, and theease with which it forms alloys (amalga) with many laboratory and electricalcontact metals, can cause severe corrosion problems in laboratories.Special precautions: Mercury can attack copper and copper alloy materials.Polymerization: Will not occur.Section 11: Toxicological InformationRoutes of Entry: Absorbed through skin. Dermal contact. Eye contact.Inhalation. Ingestion.Toxicity to Animals:LD50: Not available.LC50: Not available.Chronic Effects on Humans:CARCINOGENIC EFFECTS: Classified A5 (Not suspected for human.) byACGIH. 3 (Not classifiable forhuman.) by IARC.May cause damage to the following organs: blood, kidneys, liver, brain,peripheral nervous system, central nervous system (CNS).Other Toxic Effects on Humans:Very hazardous in case of skin contact (irritant), of ingestion, of inhalation.Hazardous in case of skin contact (corrosive, permeator).Special Remarks on Toxicity to Animals: Not available.Special Remarks on Chronic Effects on Humans:May affect genetic material.May cause cancer based on animal data.Passes through the placental barrier in animal.May cause adverse reproductive effects(paternal effects- spermatogenesis;effects on fertility - fetotoxicity, post-implantation mortality), and birth defects.Special Remarks on other Toxic Effects on Humans:Section 12: Ecological InformationEcotoxicity: Not available.BOD5 and COD: Not available.Products of Biodegradation:Possibly hazardous short term degradation products are not likely. However,long term degradation products may arise.Toxicity of the Products of Biodegradation: The products of degradationare less toxic than the product itself.Special Remarks on the Products of Biodegradation: Not available.

224
Section 13: Disposal ConsiderationsWaste Disposal:Waste must be disposed of in accordance with federal, state and localenvironmental control regulations.Section 14: Transport InformationDOT Classification: Class 8: Corrosive material
Identification: : Mercury UNNA: 2809 PG: IIISpecial Provisions for Transport: Not available.Section 15: Other Regulatory InformationFederal and State Regulations:California prop. 65: This product contains the following ingredients for whichthe State of California has found to cause cancer, birth defects or otherreproductive harm, which would require a warning under the statute: MercuryCalifornia prop. 65: This product contains the following ingredients for whichthe State of California has found to cause birth defects which would require awarning under the statute: MercuryConnecticut hazardous material survey.: MercuryIllinois toxic substances disclosure to employee act: MercuryIllinois chemical safety act: MercuryNew York acutely hazardous substances: MercuryRhode Island RTK hazardous substances: MercuryPennsylvania RTK: MercuryMinnesota: MercuryMassachusetts RTK: MercuryNew Jersey: MercuryNew Jersey spill list: MercuryLouisiana spill reporting: MercuryCalifornia Director's List of Hazardous Substances.: MercuryTSCA 8(b) inventory: MercurySARA 313 toxic chemical notification and release reporting: MercuryCERCLA: Hazardous substances.: Mercury: 1 lbs. (0.4536 kg)Other Regulations:OSHA: Hazardous by definition of Hazard Communication Standard (29 CFR1910.1200).EINECS: This product is on the European Inventory of Existing CommercialChemical Substances.Other Classifications:WHMIS (Canada):CLASS D-1A: Material causing immediate and serious toxic effects (VERYTOXIC).CLASS D-2A: Material causing other toxic effects (VERY TOXIC).CLASS E: Corrosive liquid.DSCL (EEC):R23- Toxic by inhalation.R33- Danger of cumulative effects.R38- Irritating to skin.R41- Risk of serious damage to eyes.R50/53- Very toxic to aquatic organisms, may cause long-termadverse effects in the aquatic environment.

225
S2- Keep out of the reach of children.S7- Keep container tightly closed.S26- In case of contact with eyes, rinse immediately with plenty of water andseek medical advice.S39- Wear eye/face protection.S45- In case of accident or if you feel unwell, seek medical adviceimmediately (show the label where possible).S46- If swallowed, seek medical advice immediately and show this containeror label.S60- This material and its container must be disposed of as hazardous waste.
S61- Avoid release to the environment. Refer to special instructions/Safetydata sheets.HMIS (U.S.A.):Health Hazard: 3Fire Hazard: 0Reactivity: 0Personal Protection:National Fire Protection Association (U.S.A.):Health: 3Flammability: 0Reactivity: 0Specific hazard:Protective Equipment:Gloves.Full suit.Vapor respirator. Be sure to use an approved/certified respirator orequivalent. Wear appropriate respirator when ventilation is inadequate.Face shield.Section 16: Other InformationReferences: Not available.Other Special Considerations: Not available.Created: 10/10/2005 08:22 PMLast Updated: 10/10/2005 08:22 PM
The information above is believed to be accurate and represents the bestinformation currently available to us. However, we make no warranty ofmerchantability or any other warranty, express or implied, with respect to suchinformation, and we assume no liability resulting from its use. Users shouldmake their own investigations to determine the suitability of the information fortheir particular purposes. In no event shall ScienceLab.com be liable for anyclaims, losses, or damages of any third party or for lost profits or any special,indirect, incidental, consequential or exemplary damages, howsoever arising,even if ScienceLab.com has been advised of the possibility of such damages.