mergedfile - envictus · page 2 of 17 1(a) (i) consolidated statement of comprehensive income...
TRANSCRIPT

Financial Statements and Related Announcement::First Quarter Results
Issuer & Securities
Issuer/ Manager ENVICTUS INTERNATIONAL HOLDINGS LIMITED
Securities ENVICTUS INTERNATIONAL HLDGLTD - SG1CF4000007 - BQD
Stapled Security No
Announcement Details
Announcement Title Financial Statements and Related Announcement
Date & Time of Broadcast 09-Feb-2018 18:09:31
Status New
Announcement Sub Title First Quarter Results
Announcement Reference SG180209OTHRUWLN
Submitted By (Co./ Ind. Name) S SURENTHIRARAJ AND KOK MOR KEAT
Designation COMPANY SECRETARIES
Description (Please provide a detailed description of the event in the box below - Refer to the Online help for the format)
Please refer to the attachment.
Additional Details
For Financial Period Ended 31/12/2017
AttachmentsEIH_ Q1FY2018.pdf
EIH_New Release.pdf
Total size =416K
Page 1 of 1Financial Statements and Related Announcement::First Quarter Results
09/02/2018http://infopub.sgx.com/Apps?A=COW_CorpAnnouncement_Content&B=Announce...

Page 1 of 17
ENVICTUS INTERNATIONAL HOLDINGS LIMITED (Company Registration No: 200313131Z)
UNAUDITED FULL YEAR RESULTS FOR THE FINANCIAL PERIOD ENDED 31 DECEMBER 2017 PART 1 – INFORMATION REQUIRED FOR ANNOUNCEMENTS OF QUARTERLY (Q1, Q2 & Q3), HALF YEAR AND FULL YEAR RESULTS 1(a) (i) Consolidated Statement of Comprehensive Income 3 months
ended 31.12.2017
3 months ended
31.12.2016
Change
RM’000 RM’000 %
Revenue 109,081 101,613 7.3 Cost of goods sold (69,222) (68,042) 1.7
Gross profit 39,859 33,571 18.7 Other operating income
3,708 3,724 (0.4)
Operating expenses
Administrative expenses (11,893) (10,314) 15.3 Selling and marketing expenses Warehouse and distribution expenses
(26,909) (6,806)
(19,371) (6,668)
38.9 2.1
Research and development expenses Other operating expenses
(239) (332) (28.0) (595) (684) (13.0)
(46,442) (37,369) 24.3
Loss before interest and tax (2,875) (74) >100
Finance costs (1,268) (1,158) 9.5
Loss before income tax (4,143) (1,232) >100 Income tax expense (604) (407) 48.4
Loss for the financial period (4,747) (1,639) >100

Page 2 of 17
1(a) (i) Consolidated Statement of Comprehensive Income (continued) 3 months
ended 31.12.2017
3 months ended
31.12.2016
Change
RM’000 RM’000 % Loss for the financial period (4,747) (1,639) >100 Other comprehensive income:
Items that may be reclassified subsequently to profit or loss:
Exchange differences on translating foreign operations
(2,308)
4,098
>100
Net fair value changes on available-for-sale financial assets
(48)
9,191
>100
Other comprehensive income, net of tax (2,356) 13,289 >100
Total comprehensive income for the financial period
(7,103)
11,650
>100
Loss attributable to : Owners of the Company (4,624) (1,429) >100 Non-controlling interests (123) (210) (41.4)
(4,747) (1,639) >100
Total comprehensive income attributable to: Owners of the Company (7,504) 12,203 >100 Non-controlling interests 401 (553) >100
(7,103) 11,650 >100
1(a) (ii) Loss before income tax is arrived at after charging/(crediting) the following :
3 months ended
31.12.2017 RM’000
3 months ended
31.12.2016 RM’000
Change %
Allowance for doubtful receivables 168 266 (36.8) Allowance for doubtful receivables, no longer required, now written back (5) (130) (96.2) Amortisation of intangible assets 127 137 (7.3) Depreciation of property, plant and equipment 6,588 4,501 46.4 Depreciation of investment properties 133 117 13.7 Dividend income (119) (780) (84.7) Fair value loss/(gain) on held-for-trading investments, net 588 (1,334) >100
Foreign currency exchange (gain)/loss, net (401) 677 >100 Gain on disposal of held-for-trading investments (13) (262) (95.0) Gain on disposal of property, plant and equipment - (157) N/A Finance costs 1,268 1,158 9.5 Interest income (277) (277) - Inventories written off 114 61 86.9 Property, plant and equipment written off 7 43 (83.7) Gain on disposal of subsidiaries (1,837) - N/A
Page 3 of 17
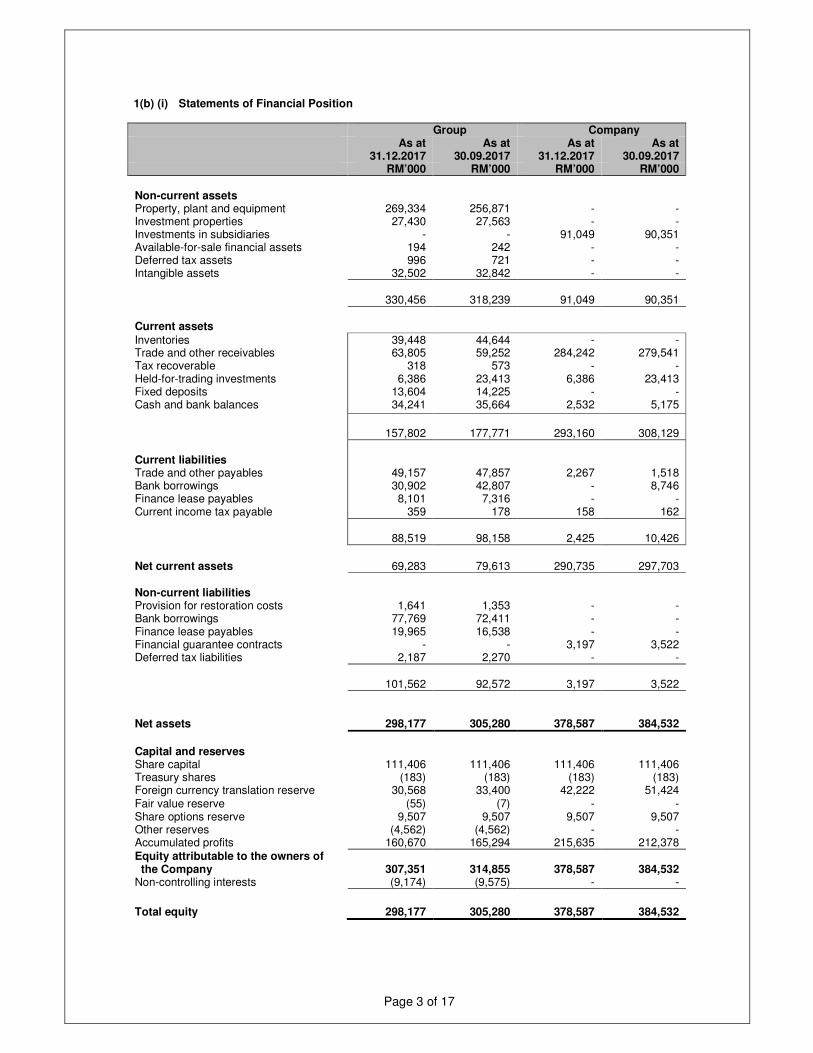
1(b) (i) Statements of Financial Position Group Company
As at 31.12.2017
As at 30.09.2017
As at 31.12.2017
As at 30.09.2017
RM’000 RM’000 RM’000 RM’000 Non-current assets Property, plant and equipment 269,334 256,871 - - Investment properties 27,430 27,563 - - Investments in subsidiaries - - 91,049 90,351 Available-for-sale financial assets 194 242 - - Deferred tax assets 996 721 - - Intangible assets 32,502 32,842 - -
330,456 318,239 91,049 90,351
Current assets
Inventories 39,448 44,644 - - Trade and other receivables 63,805 59,252 284,242 279,541 Tax recoverable 318 573 - - Held-for-trading investments 6,386 23,413 6,386 23,413 Fixed deposits 13,604 14,225 - - Cash and bank balances 34,241 35,664 2,532 5,175
157,802 177,771 293,160 308,129
Current liabilities Trade and other payables 49,157 47,857 2,267 1,518 Bank borrowings 30,902 42,807 - 8,746 Finance lease payables 8,101 7,316 - - Current income tax payable 359 178 158 162
88,519
98,158
2,425
10,426
Net current assets 69,283 79,613 290,735 297,703
Non-current liabilities Provision for restoration costs 1,641 1,353 - - Bank borrowings 77,769 72,411 - - Finance lease payables 19,965 16,538 - - Financial guarantee contracts - - 3,197 3,522 Deferred tax liabilities 2,187 2,270 - -
101,562 92,572 3,197 3,522
Net assets 298,177 305,280 378,587 384,532
Capital and reserves Share capital 111,406 111,406 111,406 111,406 Treasury shares (183) (183) (183) (183) Foreign currency translation reserve 30,568 33,400 42,222 51,424 Fair value reserve Share options reserve
(55) 9,507
(7) 9,507
- 9,507
- 9,507
Other reserves (4,562) (4,562) - - Accumulated profits 160,670 165,294 215,635 212,378
Equity attributable to the owners of the Company
307,351
314,855
378,587
384,532
Non-controlling interests (9,174) (9,575) - -
Total equity 298,177 305,280 378,587 384,532

Page 4 of 17
1(b) (ii) Aggregate amount of the Group’s borrowings and debt securities. Secured
As at 31.12.2017
As at 30.09.2017
RM’000 RM’000 Amount payable within one year Bank borrowings 30,902 42,807 Finance lease payables 8,101 7,316
39,003 50,123
Amount payable after one year Bank borrowings 77,769 72,411 Finance lease payables 19,965 16,538
97,734 88,949
Total 136,737 139,072
The Group’s bank borrowings as at 31 December 2017 are secured against the following:
� Pledge of leasehold land, buildings and assets under construction; � Pledge of shares of a subsidiary; � Debenture comprising fixed and floating charge over all future and present assets of a subsidiary; � Pledge of available-for-sale financial assets; and � Company’s Corporate Guarantees, except for a secured term loan of RM102,000 in the previous financial
year. The Group’s finance lease payables are secured by way of a charge against the respective machineries and motor vehicles under finance leases.

Page 5 of 17
1(c) Consolidated Statement of Cash Flows 3 months
Ended 31.12.2017
3 months ended
31.12.2016 RM’000 RM’000 Operating activities Loss before income tax (4,143) (1,232) Adjustments for:
Allowance for doubtful receivables 168 266 Allowance for doubtful receivables no longer required, now written back
(5)
(130)
Amortisation of intangible assets 127 137 Depreciation of property, plant and equipment 6,588 4,501 Depreciation of investment properties 133 117 Dividend income (119) (780) Fair value loss/(gain) on held-for-trading investments, net 588 (1,334) Foreign currency exchange (gain)/loss, net (711) 1,291 Gain on disposal of held-for-trading investments (13) (262) Gain on disposal of property, plant and equipment - (157) Gain on disposal of subsidiaries (1,837) - Finance costs 1,268 1,158 Interest income (277) (277) Inventories written off 114 61 Property, plant and equipment written off 7 43
Operating profit before working capital changes 1,888
3,402
Working capital changes: Inventories 4,187 4,602 Trade and other receivables (7,496) (5,501) Trade and other payables 5,720 (562)
Cash generated from operations 4,299 1,941
Interest paid (232) (355) Income tax (paid)/refund, net (853) 258
Net cash generated from operating activities 3,214 1,844
Investing activities Acquisition of subsidiaries, net of cash acquired - (139) Disposal of subsidiaries, net of cash disposed (Note 1(c)(i)) 723 - Dividends received 119 780 Interest received 277 277 Proceeds from disposal of held-for-trading investments 16,112 3,954 Proceeds from disposal of property, plant and equipment 1 157 Purchase of intangible assets (70) (197) Purchase of property, plant and equipment (12,921) (18,545) Net changes in fixed deposits pledged to bank (2) - Net cash generated from/(used in) investing activities 4,239 (13,713)
Page 6 of 17
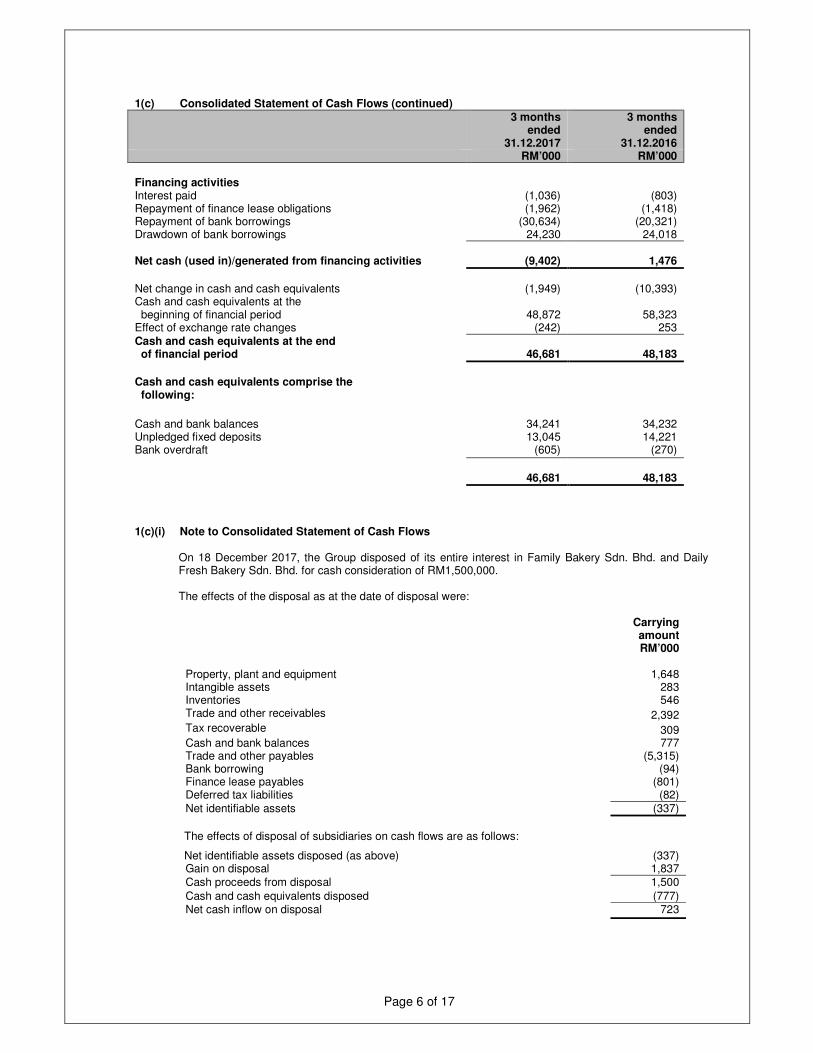
1(c) Consolidated Statement of Cash Flows (continued) 3 months
ended 31.12.2017
3 months ended
31.12.2016 RM’000 RM’000 Financing activities Interest paid (1,036) (803) Repayment of finance lease obligations (1,962) (1,418) Repayment of bank borrowings (30,634) (20,321) Drawdown of bank borrowings 24,230 24,018
Net cash (used in)/generated from financing activities
(9,402)
1,476
Net change in cash and cash equivalents (1,949) (10,393) Cash and cash equivalents at the beginning of financial period
48,872
58,323
Effect of exchange rate changes (242) 253
Cash and cash equivalents at the end of financial period
46,681
48,183
Cash and cash equivalents comprise the following:
Cash and bank balances 34,241 34,232 Unpledged fixed deposits 13,045 14,221 Bank overdraft (605) (270)
46,681 48,183
1(c)(i) Note to Consolidated Statement of Cash Flows
On 18 December 2017, the Group disposed of its entire interest in Family Bakery Sdn. Bhd. and Daily Fresh Bakery Sdn. Bhd. for cash consideration of RM1,500,000.
The effects of the disposal as at the date of disposal were:
Carrying
amount RM’000
Property, plant and equipment 1,648 Intangible assets 283 Inventories 546 Trade and other receivables 2,392 Tax recoverable 309 Cash and bank balances 777 Trade and other payables (5,315) Bank borrowing (94) Finance lease payables (801) Deferred tax liabilities (82)
Net identifiable assets (337)
The effects of disposal of subsidiaries on cash flows are as follows:
Net identifiable assets disposed (as above) (337) Gain on disposal 1,837
Cash proceeds from disposal 1,500
Cash and cash equivalents disposed (777) Net cash inflow on disposal 723

Page 7 of 17
1(d) (i) Statements of Changes in Equity
Group Share
capital Treasury
shares Foreign
currency translation
reserve
Fair value reserve
Share options reserve
Other reserves
Accumulated profits
Total attributable
to owners of the
Company
Non-controlling
interests
Total equity
RM’000 RM’000 RM’000 RM’000 RM’000 RM’000 RM’000 RM’000 RM’000 RM’000
At 1 October 2017 111,406 (183) 33,400 (7) 9,507 (4,562) 165,294 314,855 (9,575) 305,280
Loss for the financial period - - - - - - (4,624) (4,624) (123) (4,747)
Other comprehensive income :
Exchange differences on translation of foreign operations
-
-
(2,832)
-
-
-
-
(2,832)
524
(2,308)
Available-for-sale financial assets
-
-
-
(48)
-
-
-
(48)
-
(48)
Total other comprehensive Income
-
-
(2,832)
(48)
-
-
-
(2,880)
524
(2,356)
Total comprehensive income for the financial period
-
-
(2,832)
(48)
-
-
(4,624)
(7,504)
401
(7,103)
At 31 December 2017 111,406 (183) 30,568 (55) 9,507 (4,562) 160,670 307,351 (9,174) 298,177
At 1 October 2016
111,406
(183)
31,791
(15,727)
9,507
(4,562)
218,282
350,514
(8,315)
342,199
Loss for the financial period - - - - - - (1,429) (1,429) (210) (1,639)
Other comprehensive Income:
Exchange differences on translation of foreign operations
-
-
4,826
(385)
-
-
-
4,441
(343)
4,098
Available-for-sale financial assets
-
-
-
9,191
-
-
-
9,191
-
9,191
Total other comprehensive income
-
-
4,826
8,806
-
-
-
13,632
(343)
13,289
Total comprehensive income for the financial period
-
-
4,826
8,806
-
-
(1,429)
12,203
(553)
11,650
At 31 December 2016
111,406
(183)
36,617
(6,921)
9,507
(4,562)
216,853
362,717
(8,868)
353,849
Page 8 of 17
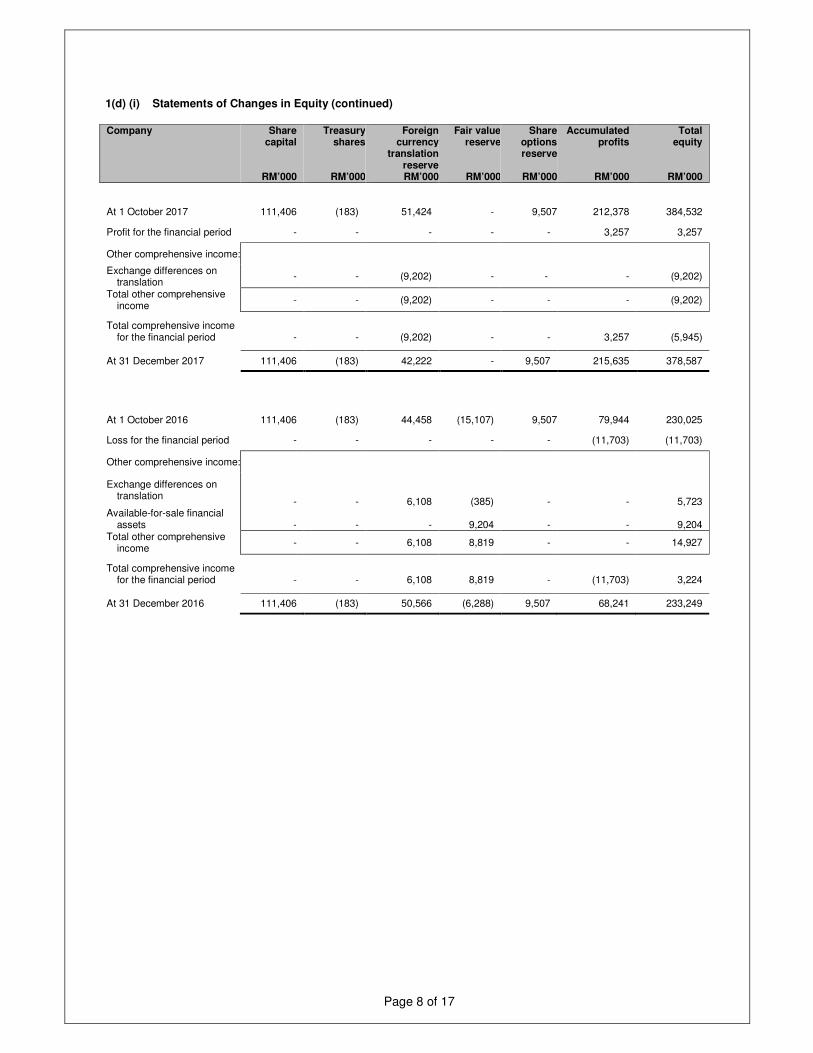
1(d) (i) Statements of Changes in Equity (continued)
Company Share capital
RM’000
Treasury shares
RM’000
Foreign currency
translation reserve RM’000
Fair value reserve
RM’000
Share optionsreserve
RM’000
Accumulated profits
RM’000
Total equity
RM’000
At 1 October 2017 111,406 (183) 51,424 - 9,507 212,378 384,532
Profit for the financial period - - - - - 3,257 3,257
Other comprehensive income:
Exchange differences on translation
- - (9,202) - - - (9,202)
Total other comprehensive income
- - (9,202) - - - (9,202)
Total comprehensive income for the financial period
-
-
(9,202)
-
-
3,257
(5,945)
At 31 December 2017 111,406 (183) 42,222 - 9,507 215,635 378,587
At 1 October 2016 111,406 (183) 44,458 (15,107) 9,507 79,944 230,025
Loss for the financial period - - - - - (11,703) (11,703)
Other comprehensive income:
Exchange differences on translation
-
-
6,108
(385)
-
-
5,723 Available-for-sale financial
assets
-
-
-
9,204
-
-
9,204 Total other comprehensive
income - - 6,108 8,819 - - 14,927
Total comprehensive income for the financial period
-
-
6,108
8,819
-
(11,703)
3,224
At 31 December 2016 111,406 (183) 50,566 (6,288) 9,507 68,241 233,249
Page 9 of 17
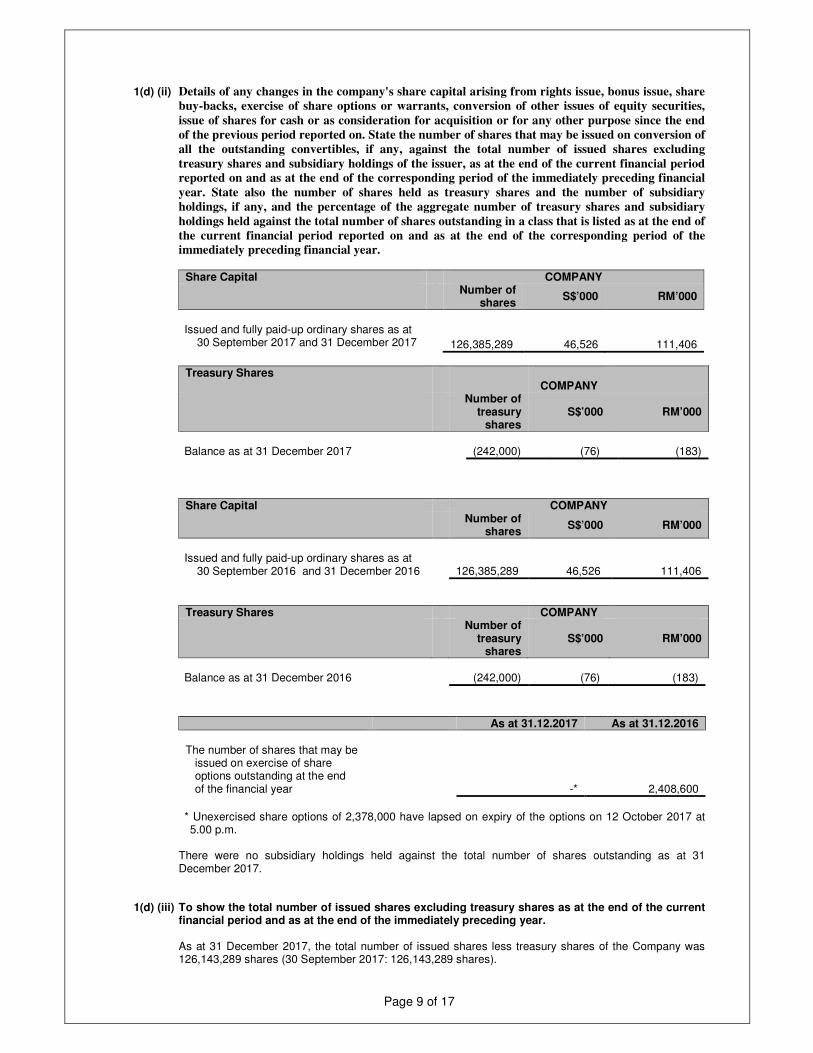
1(d) (ii) Details of any changes in the company's share capital arising from rights issue, bonus issue, share
buy-backs, exercise of share options or warrants, conversion of other issues of equity securities,
issue of shares for cash or as consideration for acquisition or for any other purpose since the end
of the previous period reported on. State the number of shares that may be issued on conversion of
all the outstanding convertibles, if any, against the total number of issued shares excluding
treasury shares and subsidiary holdings of the issuer, as at the end of the current financial period
reported on and as at the end of the corresponding period of the immediately preceding financial
year. State also the number of shares held as treasury shares and the number of subsidiary
holdings, if any, and the percentage of the aggregate number of treasury shares and subsidiary
holdings held against the total number of shares outstanding in a class that is listed as at the end of
the current financial period reported on and as at the end of the corresponding period of the
immediately preceding financial year.
Share Capital COMPANY Number of
shares S$’000 RM’000
Issued and fully paid-up ordinary shares as at 30 September 2017 and 31 December 2017
126,385,289
46,526
111,406
Treasury Shares
COMPANY
Number of treasury
shares S$’000 RM’000
Balance as at 31 December 2017 (242,000) (76) (183)
Share Capital COMPANY Number of
shares S$’000 RM’000
Issued and fully paid-up ordinary shares as at 30 September 2016 and 31 December 2016
126,385,289
46,526
111,406
Treasury Shares COMPANY Number of
treasury shares
S$’000 RM’000
Balance as at 31 December 2016 (242,000) (76) (183)
As at 31.12.2017 As at 31.12.2016 The number of shares that may be issued on exercise of share options outstanding at the end of the financial year
-*
2,408,600
* Unexercised share options of 2,378,000 have lapsed on expiry of the options on 12 October 2017 at 5.00 p.m.
There were no subsidiary holdings held against the total number of shares outstanding as at 31
December 2017. 1(d) (iii) To show the total number of issued shares excluding treasury shares as at the end of the current
financial period and as at the end of the immediately preceding year. As at 31 December 2017, the total number of issued shares less treasury shares of the Company was
126,143,289 shares (30 September 2017: 126,143,289 shares).
Page 10 of 17
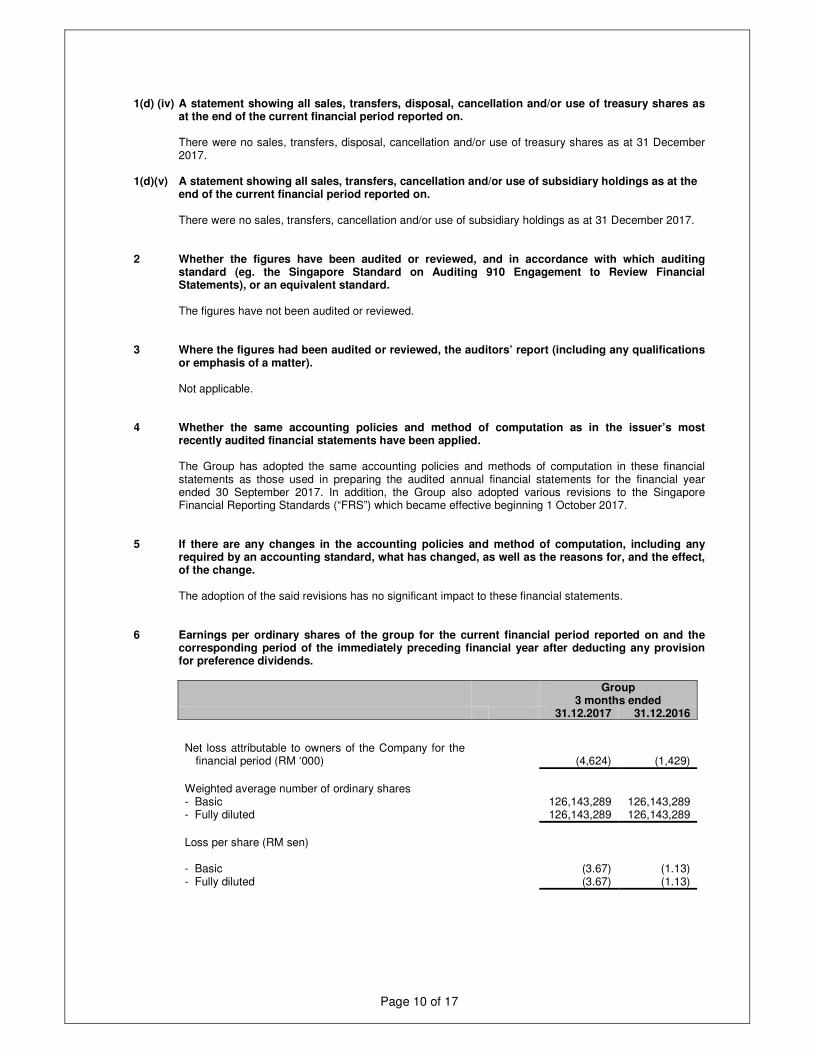
1(d) (iv) A statement showing all sales, transfers, disposal, cancellation and/or use of treasury shares as
at the end of the current financial period reported on. There were no sales, transfers, disposal, cancellation and/or use of treasury shares as at 31 December
2017. 1(d)(v) A statement showing all sales, transfers, cancellation and/or use of subsidiary holdings as at the
end of the current financial period reported on. There were no sales, transfers, cancellation and/or use of subsidiary holdings as at 31 December 2017. 2 Whether the figures have been audited or reviewed, and in accordance with which auditing
standard (eg. the Singapore Standard on Auditing 910 Engagement to Review Financial Statements), or an equivalent standard.
The figures have not been audited or reviewed. 3 Where the figures had been audited or reviewed, the auditors’ report (including any qualifications
or emphasis of a matter). Not applicable. 4 Whether the same accounting policies and method of computation as in the issuer’s most
recently audited financial statements have been applied.
The Group has adopted the same accounting policies and methods of computation in these financial statements as those used in preparing the audited annual financial statements for the financial year ended 30 September 2017. In addition, the Group also adopted various revisions to the Singapore Financial Reporting Standards (“FRS”) which became effective beginning 1 October 2017.
5 If there are any changes in the accounting policies and method of computation, including any
required by an accounting standard, what has changed, as well as the reasons for, and the effect, of the change.
The adoption of the said revisions has no significant impact to these financial statements. 6 Earnings per ordinary shares of the group for the current financial period reported on and the
corresponding period of the immediately preceding financial year after deducting any provision for preference dividends.
Group
3 months ended 31.12.2017 31.12.2016
Net loss attributable to owners of the Company for the financial period (RM ‘000)
(4,624)
(1,429)
Weighted average number of ordinary shares - Basic 126,143,289 126,143,289 - Fully diluted 126,143,289 126,143,289
Loss per share (RM sen)
- Basic (3.67) (1.13) - Fully diluted (3.67) (1.13)

Page 11 of 17
7 Net asset value (for issuer and group) per ordinary share based on the total number of issued
shares excluding treasury shares of the issuer at the end of the (a) current financial period reported on; and (b) immediately preceding financial year.
Group Company As at As at As at As at
31.12.2017 30.09.2017 31.12.2017 30.09.2017 RM RM RM RM Net asset value per ordinary share based on
issued share capital at the end of the financial period/year
2.36
2.42
3.00
3.05
8 A review of the performance of the group, to the extent necessary for a reasonable understanding
of the group’s business. It must include a discussion of the following:- (a) any significant factors that affected the turnover, costs, and earnings of the group for the
current financial period reported on, including (where applicable) seasonal or cyclical factors; and
(b) any material factors that affected the cashflow, working capital, assets or liabilities of the group during the current financial period.
Business Segments The Group’s core business segments are as follows: a) Trading and Frozen Food Division; b) Food Services Division – Texas Chicken, San Francisco Coffee and Delicious; c) Nutrition Division; and d) Food Processing Division comprising of: - bakery; - butchery; - beverages; and - contract Packing for Dairy and Juice based drinks.
Performance Review
Review on Consolidated Statement of Comprehensive Income
The Group recorded a revenue of RM109.1 million for the first quarter ended 31 December 2017 (“Q1FY2018”), an increase of RM7.5 million or 7.3% as compared to RM101.6 million in the corresponding quarter ended 31 December 2016 (“Q1FY2017”) on the back of strong performance of its Food Services Division. Food Services Division continued to achieve significant growth in topline by RM13.4 million or 47.7%, from RM28.1 million to RM41.5 million. Texas Chicken remains to be top performer in the Division with an increase in revenue from RM22.0 million to RM32.6 million, representing an increase of RM10.6 million or 48.2% as a result of the improvement in sales of its existing stores and the opening of ten new stores to 43 stores from 33 stores in Q1FY2017. The improved sales performance of Texas Chicken was driven by the success of the operations executions, good market acceptance of its products quality, value and brand recognition. San Francisco Coffee chain too has grown from 29 stores in Q1FY2017 to 38 stores, which contributed an additional RM2.0 million or 38.5% to the topline growth from RM5.2 million to RM7.2 million. Delicious restaurant business also contributed to an increase in topline from RM0.9 million to RM1.8 million following the completion of the rebranding exercise. However, the performance of the Food Service Division was partially offset by lower revenue contribution from the Trading and Frozen, Nutrition and Food Processing Divisions. The Trading and Frozen Food Division’s topline had fallen by RM2.8 million or 6.3%, from RM44.3 million to RM41.5 million which is largely due to shortage of meat supplies as a result of the suspension of meat plants by Department of Islamic Development Malaysia (JAKIM) and shortage of dairy products in the market. The Nutrition Division reported a decline in revenue of RM1.8 million or 18.9%, from RM9.5 million to RM7.7 million. For some period now Nutrition Division has lost market share in the traditional distribution channel primarily due to more competitively priced US brands as well as a significant increase in dealings by Australian and New Zealand brands as they compete to retain market share. Additionally, market
Page 12 of 17
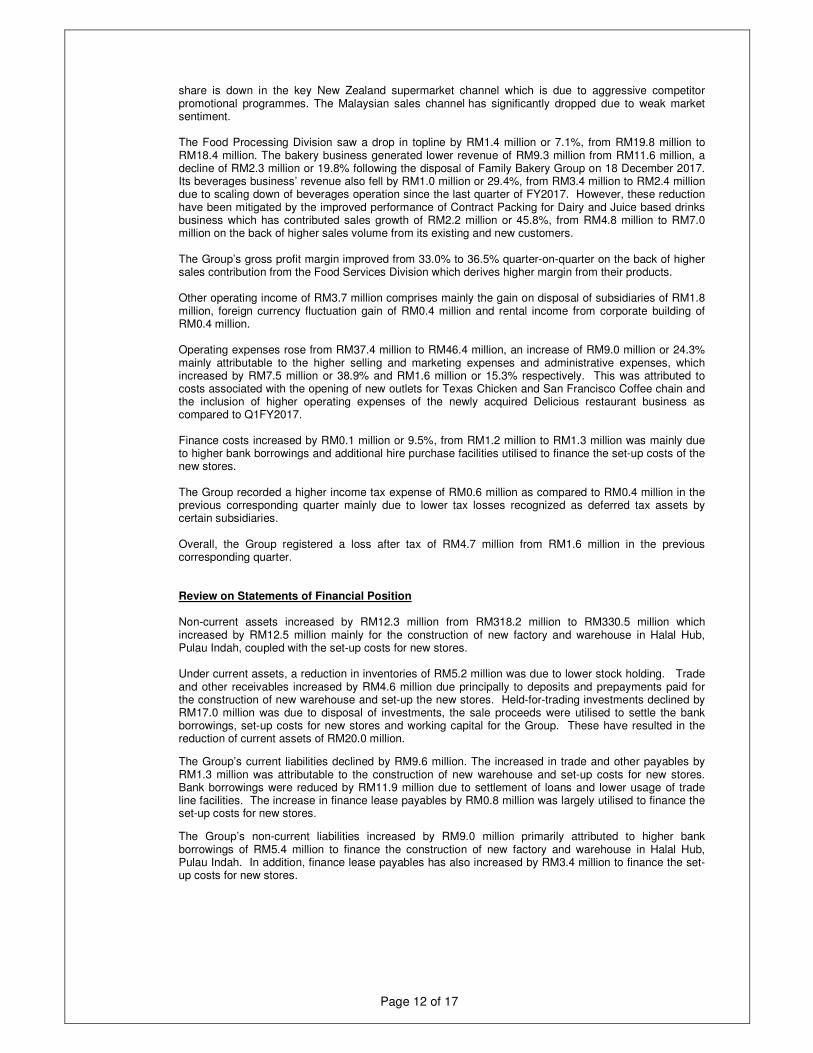
share is down in the key New Zealand supermarket channel which is due to aggressive competitor promotional programmes. The Malaysian sales channel has significantly dropped due to weak market sentiment. The Food Processing Division saw a drop in topline by RM1.4 million or 7.1%, from RM19.8 million to RM18.4 million. The bakery business generated lower revenue of RM9.3 million from RM11.6 million, a decline of RM2.3 million or 19.8% following the disposal of Family Bakery Group on 18 December 2017. Its beverages business’ revenue also fell by RM1.0 million or 29.4%, from RM3.4 million to RM2.4 million due to scaling down of beverages operation since the last quarter of FY2017. However, these reduction have been mitigated by the improved performance of Contract Packing for Dairy and Juice based drinks business which has contributed sales growth of RM2.2 million or 45.8%, from RM4.8 million to RM7.0 million on the back of higher sales volume from its existing and new customers. The Group’s gross profit margin improved from 33.0% to 36.5% quarter-on-quarter on the back of higher sales contribution from the Food Services Division which derives higher margin from their products. Other operating income of RM3.7 million comprises mainly the gain on disposal of subsidiaries of RM1.8 million, foreign currency fluctuation gain of RM0.4 million and rental income from corporate building of RM0.4 million. Operating expenses rose from RM37.4 million to RM46.4 million, an increase of RM9.0 million or 24.3% mainly attributable to the higher selling and marketing expenses and administrative expenses, which increased by RM7.5 million or 38.9% and RM1.6 million or 15.3% respectively. This was attributed to costs associated with the opening of new outlets for Texas Chicken and San Francisco Coffee chain and the inclusion of higher operating expenses of the newly acquired Delicious restaurant business as compared to Q1FY2017. Finance costs increased by RM0.1 million or 9.5%, from RM1.2 million to RM1.3 million was mainly due to higher bank borrowings and additional hire purchase facilities utilised to finance the set-up costs of the new stores. The Group recorded a higher income tax expense of RM0.6 million as compared to RM0.4 million in the previous corresponding quarter mainly due to lower tax losses recognized as deferred tax assets by certain subsidiaries. Overall, the Group registered a loss after tax of RM4.7 million from RM1.6 million in the previous corresponding quarter. Review on Statements of Financial Position Non-current assets increased by RM12.3 million from RM318.2 million to RM330.5 million which increased by RM12.5 million mainly for the construction of new factory and warehouse in Halal Hub, Pulau Indah, coupled with the set-up costs for new stores. Under current assets, a reduction in inventories of RM5.2 million was due to lower stock holding. Trade and other receivables increased by RM4.6 million due principally to deposits and prepayments paid for the construction of new warehouse and set-up the new stores. Held-for-trading investments declined by RM17.0 million was due to disposal of investments, the sale proceeds were utilised to settle the bank borrowings, set-up costs for new stores and working capital for the Group. These have resulted in the reduction of current assets of RM20.0 million.
The Group’s current liabilities declined by RM9.6 million. The increased in trade and other payables by RM1.3 million was attributable to the construction of new warehouse and set-up costs for new stores. Bank borrowings were reduced by RM11.9 million due to settlement of loans and lower usage of trade line facilities. The increase in finance lease payables by RM0.8 million was largely utilised to finance the set-up costs for new stores.
The Group’s non-current liabilities increased by RM9.0 million primarily attributed to higher bank borrowings of RM5.4 million to finance the construction of new factory and warehouse in Halal Hub, Pulau Indah. In addition, finance lease payables has also increased by RM3.4 million to finance the set-up costs for new stores.

Page 13 of 17
Review on Consolidated Statement of Cash Flows The Group recorded a net decrease in cash and cash equivalents of RM1.9 million for the current quarter ended 31 December 2017. Net cash generated from operating activities amounted to RM3.2 million which was derived from the operating profit of RM1.9 million, reduction in inventories of RM4.2 million and increase in trade and other payables of RM5.7 million. This was partially offset against the increase in receivables of RM7.5 million, interest and income tax payments of RM1.1 million. For investing activities, cash amounting to RM17.2 million was largely raised from the disposal of held-for-trading investments, dividend and interest received. This was utilised to purchase property, plant and equipment and intangible assets of RM13.0 million which resulted the net cash generated from investing activities of RM4.2 million. For financing activities, the Group has drawdown the bank facilities of RM24.2 million to finance the construction of new factory and warehouse. The Group utilised RM33.6 million for the settlement of bank borrowings, hire purchase payables and interest payments. These resulted in the net cash used in financing activities amounting to RM9.4 million.
9 Where a forecast, or a prospect statement, has been previously disclosed to shareholders, any
variance between it and the actual results. Not applicable. 10 A commentary at the date of the announcement of the significant trends and competitive
conditions of the industry in which the group operates and any known factors or events that may affect the group in the next reporting period and the next 12 months.
a) Trading and Frozen Food Division
The Malaysian Ringgit has continued to strengthen against the US Dollar, particularly in the month of December 2017. However, this has not prevent majority of food costs from increasing. Supplies of meat and dairy products have not improved since the suspension of two beef plants by the Department of Islamic Development Malaysia (JAKIM) and the Department of Veterinary Services Malaysia (DVS), and high shortage of milk in Australia and other countries has not abated. Prices of lamb and mutton from Australia and New Zealand have stabilized since the significant increase in FY2017. However, it is uncertain whether the prices will be able to sustain at this level as most plants are still closed for the holiday season. The main supplier for cheese and butter from Australia has temporary suspended production citing severe shortage of milk. Efforts to source from other countries were also met with the same reason or prices quoted are generally significantly higher. This has impacted the revenue for cheese and butter. Pok Brothers has moved into its new warehouse facility in Selangor Halal Hub, located in Pulau Indah in the first week of December 2017, which will cater for the expansion and growth of Pok Brothers and the Group. The existing facility in Glenmarie will continue to serve as the central distribution point for Klang Valley. Moving forward, it is expected that operating costs associated with a bigger facility will impact the bottom line until revenue increased accordingly. In addition, unless there is improvement on the supplies side, the next twelve months will be very challenging for the division to maintain or improve its performance. On the other hand, the continued strengthening of Ringgit against major trading partners will help to reduce the cost of imported goods.
b) Food Services Division
Prices of most raw materials have been stable with the recovery of the Ringgit against US Dollar. Consumers’ sentiment remains weak following the implementation of the GST which has triggered increase in prices of goods and services compounded with the increase in toll charges, reduction in rebate for electricity charges and increase in fuel price. All these factors have resulted in a slower retail market with consumers tightening on spending. Despite these factors, Texas Chicken is able to sustain healthy sales due to market acceptance of its brand, products quality, value and services.
Page 14 of 17
Price for beverage drinks has increased slightly while others remained unchanged based on existing contracts. Higher rebates have been obtained from certain suppliers on achievement of targeted volume. Overall, Texas Chicken should be able to negotiate for better prices of most food costs to mitigate any price increase as it will be in a better bargaining position as volume grows in tandem with the increasing number of outlets. Texas also constantly source for new suppliers to complement its growing business to ensure the lowest prices are obtained. The top line of existing stores continues to strengthen on the back of the success of the operations executions, marketing strategy and limited time offers together with the growing number of outlets. Because of the continuing strength of Texas Chicken and the growing number of malls compounded by the current slower retail trade, it has been attracting offers from malls and shop lots in and outside the Klang Valley. This has enable Texas Chicken to improve the site selections and rental terms. For the current quarter, Texas has opened another four stores located in Bandar Baru Ampang, One Utama, KLCC and Skyavenue Genting. Recently, it has opened two more stores at Kulim Central Kedah and Sunshine Square, Bayan Baru Penang, bringing to date a total of 45 stores. For the next three quarters, Texas Chicken is expected to open another four stores. For San Francisco Coffee, prices of raw materials have been stable. Price of imported green beans has seen a slight reduction as a result of the strengthening Ringgit Malaysia against the US Dollar. Cost savings has been achieved with alternative suppliers for syrups, local cups and lids. Milk price remains unchanged. Competition has heated up with the openings of new coffee chains Doutor, Costa and Paul Coffee from Japan, United Kingdom and France, respectively and local homegrown brand, Espresso Lab, has started to compete with San Francisco Coffee by targeting office buildings. Prices of its drinks are on par with major competitors while food prices are lower to drive traffic to the stores. To date, San Francisco Coffee has opened 39 stores. The latest store was opened on 3 January 2018 at Arcoris Mont’ Kiara and it has plan to open another ten stores in the next three quarters.
c) Nutrition Division
Dairy ingredients in the form of milk powders and highly specialised whey proteins form a significant component of the division’s costs.
International prices for milk powder have been falling steadily in recent months reflecting a continuation of the widely-held view that the worldwide supply position is now considered strong. Prices for specialised whey proteins purchased for the manufacture of Horleys products do not always directly follow the price trends for Whole and Skim milk. After a period of stable prices for these ingredients they have recently increased significantly reflecting strong demand on the back of increased awareness of the key role of protein in the diet. The company predominantly draws their specialised protein ingredients exclusively from Fonterra Cooperative, New Zealand’s pre-eminent dairy product supplier - Fonterra have recently launched a full range of ‘Protein’ products to capitalise on this opportunity. All remaining raw materials and packaging requirements are actively tendered via the company’s contracted powder products manufacturer on an open book costing basis.
The Division markets their range of sports nutrition and weight management products under the Horleys brand. The Horleys brand had been losing market share in the key New Zealand supermarket channel for a period and is now 22.4%* market share of New Zealand key accounts. The aggressive promotional programme being activated by key competitor, Vitaco, continues to be the primary reason for the loss of market share. (* reference obtained from Aztec Data dated Dec 2017)
In the traditional channel for sales of sports and weight management supplements being gyms, health food and supplement shop channel Horleys have for some period lost market share. This has been primarily due to more competitively priced US brands as well as significant increase in dealing by Australian and New Zealand brands as they fight desperately to retain some market share. The Horleys marketing team have reviewed each of Horleys product sub ranges and are progressively relaunching these ranges to better address consumer needs and strengthen and simplify the ‘call outs’ on the product labels. To date they have completed the re-launch of the ‘Training Series’ product range which are entry level products sold primarily in supermarkets as well as the ‘Sculpt’ women’s shaping protein range. The current focus is on the re-development of products within the Elite range which are targeted at heavier users. A significant effort has been made by the Horleys product development team to reduce the cost of goods while not materially compromising the quality of the product offering with some substantial achievements in this area. The planned re-launch of this range is scheduled for the end of the first quarter of 2018 calendar

Page 15 of 17
year. Indications from the trade are very positive as the Horleys range will be more competitive while offering the trade satisfactory margins.
d) Food Processing Division
(i) Bakery
Prices of raw materials, like butter and flour are on the uptrend while sugar and yeast prices are stable for the moment. The local market is a little bit slow, especially in the quick service restaurants due to the holidays season and for the next quarter with Chinese New Year and public holidays, sales will be affected. In addition, to hire sufficient labor is a challenge which is compounded by the levy which is to be borne by the employee. To mitigate the slow market in the next quarter, more sales personnel have been engaged to penetrate into a wider market in the entire Peninsular Malaysia for getting international schools, hospitals, entertainment, restaurants and café chains. Logistic has improved with the addition of a few more lorries. In order to interact with customers, bake off sessions have been held with them to introduce quality products of Deluxe Food.
(ii) Butchery
The continued increase in prices of imported meat has weighed down on the revenue and profit margins. Selling prices have been very competitive and are also controlled by the Price Control and Anti-Profiteering Act. However, with newer and more efficient machineries and equipment, there were savings in production costs to mitigate the impact on the increased costs. The retail pack of 100 grams of Gourmessa home grown brand has been successful in capturing substantially the market in that segment and will be launching the new packaging soon to sustain the market position. In addition, Gourmessa is in the process of appointing a distributor in Singapore to distribute its products to the supermarkets, independent grocery stores, restaurant and hotels. Gourmessa has completed the construction of its factory building in the Selangor Halal Hub, located in Pulau Indah. However, it will only be relocating to its new and bigger facility after completion of inspection and audit, including getting its halal certification by all the relevant authorities, which will most probably be in the third quarter of FY2018.
(iii) Beverages
Due to the continued poor local and export sales, management has decided to scale down the operations from the last quarter of FY2017.
(iv) Contract Packing for Dairy and Juice Based Drinks
Demand for PET Aseptic co-packing continues to grow within Australia and New Zealand. The demand is mostly coming from traditional tetra brik offerings such as Up and Go and Nippys who have recently converted to PET.
There are several new players entering the PET Aseptic market both in New Zealand and Australia including new co-packers. The new players include some of our existing co-pack customers who will take production in-house. Some of EDNZ flavoured milk customers are exiting the market due to poor margins and high milk costs and transport costs with NZ. EDNZ still enjoy strong demand for supply of high value added Aseptic PET bottled products especially white milk for Asia region but competition from new manufacturers can be expected to impact sometime in late 2018 as they come online and offer competing services
Page 16 of 17
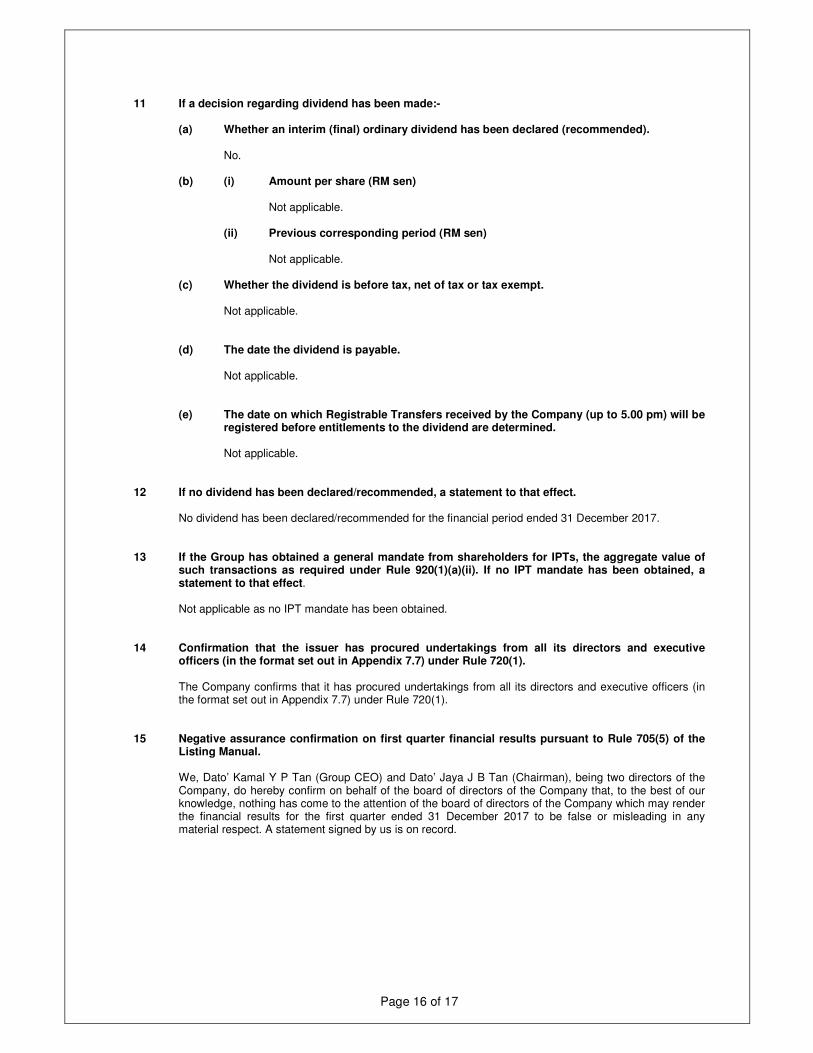
11 If a decision regarding dividend has been made:-
(a) Whether an interim (final) ordinary dividend has been declared (recommended). No.
(b) (i) Amount per share (RM sen) Not applicable.
(ii) Previous corresponding period (RM sen) Not applicable.
(c) Whether the dividend is before tax, net of tax or tax exempt.
Not applicable.
(d) The date the dividend is payable. Not applicable.
(e) The date on which Registrable Transfers received by the Company (up to 5.00 pm) will be
registered before entitlements to the dividend are determined. Not applicable.
12 If no dividend has been declared/recommended, a statement to that effect. No dividend has been declared/recommended for the financial period ended 31 December 2017. 13 If the Group has obtained a general mandate from shareholders for IPTs, the aggregate value of
such transactions as required under Rule 920(1)(a)(ii). If no IPT mandate has been obtained, a statement to that effect.
Not applicable as no IPT mandate has been obtained.
14 Confirmation that the issuer has procured undertakings from all its directors and executive
officers (in the format set out in Appendix 7.7) under Rule 720(1).
The Company confirms that it has procured undertakings from all its directors and executive officers (in the format set out in Appendix 7.7) under Rule 720(1).
15 Negative assurance confirmation on first quarter financial results pursuant to Rule 705(5) of the
Listing Manual.
We, Dato’ Kamal Y P Tan (Group CEO) and Dato’ Jaya J B Tan (Chairman), being two directors of the Company, do hereby confirm on behalf of the board of directors of the Company that, to the best of our knowledge, nothing has come to the attention of the board of directors of the Company which may render the financial results for the first quarter ended 31 December 2017 to be false or misleading in any material respect. A statement signed by us is on record.
Page 17 of 17
BY ORDER OF THE BOARD ENVICTUS INTERNATIONAL HOLDINGS LIMITED Dato’ Kamal Y P Tan Group CEO 09 February 2018

Page 1 of 7
NEWS RELEASE
ENVICTUS POSTS 7.3% TOPLINE GROWTH TO RM109.1 MILLION1 IN Q1FY2018
- Food Services Division’s 47.7% revenue growth driven by higher revenue
contributions from Texas Chicken, San Francisco Coffee chain and
Delicious restaurant business
- Gross profit margin up 3.5 percentage points to 36.5% from increased
sales of higher margin products in Food Services Division
- Total store count of 45 Texas Chicken outlets to date; expects to open
another four outlets over the next three quarters
- Total store count under San Francisco Coffee at 39 to date; plans to open
another 10 stores within the current financial year
Singapore, 9 February 2018 – Envictus International Holdings Limited (“Envictus”
“恒益徳國際控股有限公司” or the “Group”), an established Food & Beverage (“F&B”)
Group, today announced a revenue growth of 7.3% to RM109.1 million for the three
months ended 31 December 2017 (“Q1FY2018”) compared to RM101.6 million in the
previous corresponding period (“Q1FY2017”). However, the Group posted a loss after
tax of RM4.7 million in Q1FY2018, due largely to the 24.3% higher operating
expenses.
Envictus’ Group Chairman, Dato’ Jaya Tan said, “Texas Chicken remains the top
performer under our Food Services Division. Its sustained strong revenue growth is
driven by the strong execution of our operations, high brand recognition and market
satisfaction with its quality good value. To date, we have achieved positive EBITDA
for majority of our Texas Chicken stores. We expect Texas Chicken to turn profitable
on the back of more store openings over the medium term.
1 Approximately S$37.0 million. Currency conversion based on S$1.00 = RM2.95

Page 2 of 7
“As for our newly acquired business unit, Delicious Restaurant, where we are still at
the early phase of growth, we will require a longer lead time operationally to cover
costs. Additionally, we look forward to the continued growth momentum and demand
for our quality beverage, food and service at San Francisco Coffee and Delicious
restaurant business, following the completion of the rebranding exercise implemented
for each respective brand in 2017.
“Separately, we are stepping up our marketing efforts for our bakery brand, Hearty
Bake, under our Food Processing Division and we expect sales to pick up over the
near and medium term.”
Financial Review
In Q1FY2018, the Food Services Division recorded revenue growth of RM13.4 million
to RM41.5 million. The 47.7% robust growth was driven by the Texas Chicken outlets
which achieved 48.2% higher revenue of RM32.6 million, as a result of the opening of
ten additional new restaurant outlets since Q1FY2017 and improved sales
performance attributed to well-executed operations, high brand awareness and the
favourable market reception of its quality product and value. Concurrently, the San
Francisco Coffee chain posted an additional sales of RM2.0 million to the division’s
revenue whilst the Delicious restaurant business contributed a revenue of RM1.8
million, doubling from RM0.9 million following the completion of the rebranding
exercise.
However, the performance of the Food Services Division was partially offset by lower
revenue contribution from the Trading and Frozen Food, Nutrition and Food
Processing Divisions. The Trading and Frozen Food Division’s revenue declined 6.3%
from RM44.3 million in Q1FY2017 to RM41.5 million in Q1FY2018, which is largely
due to the shortage of meat supplies as a result of the suspension of meat plants by
Department of Islamic Development Malaysia (JAKIM) and shortage of dairy products
in the market.
Page 3 of 7
The Nutrition Division posted a revenue of RM7.7 million in Q1FY2018 as compared
to RM9.5 million recorded in Q1FY2017. The lower revenue was primary due to more
competitively priced US brands as well as a significant increase in dealings by
Australian and New Zealand brands as they compete to retain market share.
The Food Processing Division recorded a lower sales of RM18.4 million as compared
to RM19.8 million in Q1FY2017. This was mainly due to a decline in revenue
contribution from both the bakery and beverage businesses. Following the disposal of
Family Bakery Group in December last year, the bakery segment achieved a revenue
of RM9.3 million against RM11.6 million in Q1FY2017. Similarly, the beverage
segment posted a 29.4% lower revenue of RM2.4 million in Q1FY2018 after scaling
down its operations. However, the lower sales from the bakery and beverage
businesses have been mitigated by the improved performance of Contract Packing for
Dairy and Juice based drinks business, which recorded a sales growth of 45.8% to
RM7.0 million, driven by the higher demand from its existing and new customers.
Gross profit margin rose 3.5 percentage points to 36.5% in Q1FY2018 on the back of
increased sales of higher margin products from the Food Services Division.
Other operating income of RM3.7 million comprises mainly of the gain on disposal of
subsidiaries of RM1.8 million, foreign currency fluctuation gain of RM0.4 million and
rental income of RM0.4 million from the corporate building.
Operating expenses rose from RM37.4 million to RM46.4 million in Q1FY2018 mainly
due to higher selling, marketing and administrative expenses attributed to costs
associated with the opening of new outlets for Texas Chicken and San Francisco
Coffee chain and the inclusion of higher operating expenses of the newly acquired
Delicious restaurant business as compared to Q1FY2017.
Finance costs rose RM0.1 million to RM1.3 million due to higher bank borrowings and
additional hire purchase facilities utilised for expansion of new restaurant outlets.
Page 4 of 7
Overall, the Group recorded a loss after tax of RM4.7 million from RM1.6 million in
Q1FY2017.
For Q1FY2018, the Group’s cash and cash equivalents stood at RM46.7 million while
shareholders’ equity was RM298.2 million as at 31 December 2017.
Outlook
For the Trading and Frozen Food Division, the Group’s wholly-owned subsidiary, Pok
Brothers Sdn Bhd has moved into its new warehouse facility in the Selangor Halal Hub
in Pulau Indah in December last year, and this will cater for the expansion and growth
of the sale of frozen and premium food. While the operating costs associated with a
bigger facility will impact the bottom line until revenue increases accordingly, the
continued strengthening of Ringgit against major trading partners will help to reduce
the cost of imported goods.
Commenting on the Group’s best performing Food Services Division, Group Chief
Executive Officer, Dato’ Kamal Tan said, “Since Q1FY2017, we have opened 10 new
Texas Chicken outlets and during the current quarter, we opened four stores. We now
have a footprint of 45 outlets to date, including two outlets that were opened in January
and February this year. As we continue to expand our Texas Chicken business, we
will leverage on its established brand name and strong market position to improve site
selections and rental terms by opening another four stores over the next three
quarters.”
“San Francisco Coffee has 39 outlets to date, with the latest store opened in January
this year. We plan to open another 10 stores in the next three quarters of FY2018
since the coffee chain is making good progress following its rebranding, refreshed
menu and new concepts. With competition heating up, the new concept and dining
experience will enable the brand to expand its presence beyond office buildings and
penetrate the malls and lifestyle market.”
Page 5 of 7
The Food Processing Division’s businesses are pressured by factors such as
increasing prices of some raw materials and imported meat, lacklustre consumer
demand as well as manpower shortage and levies. Under the division’s butchery
business, Gourmessa is in the process of appointing a distributor in Singapore to
distribute its products to the supermarkets, independent grocery stores, restaurant and
hotels. Also, Gourmessa will be relocating to its new factory building in the Selangor
Halal Hub, located in Pulau Indah, upon the completion of inspection and audit checks,
including obtaining its halal certification from all the relevant authorities, which will
likely be in the third quarter of FY2018.
ABOUT ENVICTUS INTERNATIONAL HOLDINGS LIMITED
Listed on SGX Catalist in 2004, and upgraded to the Mainboard in 2009, Envictus
International Holdings Limited, is an established Food & Beverage (“F&B”) Group. The
Group has an established portfolio of businesses and brands operating under its four
business divisions – Trading and Frozen Food, Food Services, Nutrition and Food
Processing.
For the Trading and Frozen Food Division, the Group’s wholly-owned subsidiary, Pok
Brothers Sdn Bhd, is one of Malaysia’s leading frozen food and premium food
wholesaler and is a supplier to several major American restaurant chains in Malaysia.
In addition, the division also distributes the Gourmessa quality cold cuts across
supermarkets and hypermart chains in Malaysia.
Under the Group’s Food Services Division, Envictus holds exclusive rights for a 10-
year period since July 2012 to develop and operate the fast growing American-styled
Texas Chicken fast food restaurant chains in Malaysia and Brunei. Since its first
flagship outlet opened in January 2013 at Aeon Bukit Tinggi Shopping Centre, Klang,
Malaysia, the robust demand for the Texas Chicken restaurant concept has driven the
Group to expand its store footprint at a healthy pace. Envictus also owns Malaysian
homegrown specialty coffee chain business – San Francisco Coffee – which serves
house roasted coffee in Malaysia. Lastly, we have the Delicious Group of restaurants
which are new lifestyle restaurants serving hearty Western and Asian-fusion cuisine.
Page 6 of 7
For Nutrition, under Naturalac Nutrition Limited (“NNL”), the Group markets its range
of branded sports nutrition and weight management food products for mass consumer
markets. This includes the Horleys™ brand name and other proprietary brands such
as Sculpt™ (a weight management product tailored for women), Replace™ (only
available in powdered format) and Covet™ range of nut milks. In New Zealand, NNL’s
products are primarily distributed through the route channels (gyms, health food
shops, specialty stores and specialty nutrition shops) and retail channels
(supermarkets, oil and convenience retail outlets) whilst its Australian sales are made
predominantly through the route channels.
The Group’s Food Processing Division comprises of the business segments – Bakery,
Butchery, Beverages as well as Contract Packing for Dairy and Juice based Drinks.
Held under the Bakery segment, De-luxe Food Services Sdn Bhd, is the Group’s
wholly-owned subsidiary which produces frozen bakery items under the brand name
of Hearty Bake. The Group’s Butchery business manufactures and processes cold
cuts, sausages, portion control meat and smoked salmon for distribution to
supermarkets, hotels and restaurants under the brand name, Gourmessa. For the
Beverages business, the Group’s canned beverages are produced by Polygold
Beverages Sdn Bhd in Seremban, Negeri Sembilan. The business’ stable of products
include the Polygold brand of carbonated and non-carbonated drinks, Air Champ
energy drink and Power Champ isotonic sports drink.
The Group is in the ready-to-drink segment via our subsidiary, Envictus Dairies NZ
Limited, which operates New Zealand’s first state-of-art, UHT Aseptic PET bottling line
for dairy, juice and water products at the Whakatu Industrial Park. The plant currently
produces UHT white milk for the China and Taiwan markets, flavoured milk (typically
chocolate, coffee, strawberry and banana) for Australasia, pet milk (a lactose free
formulation suitable for cats and dogs) and fruit juice (typically from apple or kiwifruit -
fresh or concentrate) for local and Asian markets.

Page 7 of 7
For more details, please visit the Group’s corporate website at www.envictus-intl.com.
ISSUED ON BEHALF OF : Envictus International Holdings Limited
BY : Citigate Dewe Rogerson Singapore Pte Ltd
55 Market Street
#02-01
SINGAPORE 048941
CONTACT : Ms Dolores Phua / Ms Carol Chong
at telephone
DURING OFFICE HOURS : 6534-5122
EMAIL : [email protected] /
9 February 2018