merger value is frequently evaluated in single market ... · multimarket firm environment. the...
TRANSCRIPT

econstorMake Your Publications Visible.
A Service of
zbwLeibniz-InformationszentrumWirtschaftLeibniz Information Centrefor Economics
Linde, Sebastian; Siebert, Ralph
Working Paper
Do Mergers Among Multimarket Firms Create Value?
CESifo Working Paper, No. 6139
Provided in Cooperation with:Ifo Institute – Leibniz Institute for Economic Research at the University ofMunich
Suggested Citation: Linde, Sebastian; Siebert, Ralph (2016) : Do Mergers Among MultimarketFirms Create Value?, CESifo Working Paper, No. 6139
This Version is available at:http://hdl.handle.net/10419/147393
Standard-Nutzungsbedingungen:
Die Dokumente auf EconStor dürfen zu eigenen wissenschaftlichenZwecken und zum Privatgebrauch gespeichert und kopiert werden.
Sie dürfen die Dokumente nicht für öffentliche oder kommerzielleZwecke vervielfältigen, öffentlich ausstellen, öffentlich zugänglichmachen, vertreiben oder anderweitig nutzen.
Sofern die Verfasser die Dokumente unter Open-Content-Lizenzen(insbesondere CC-Lizenzen) zur Verfügung gestellt haben sollten,gelten abweichend von diesen Nutzungsbedingungen die in der dortgenannten Lizenz gewährten Nutzungsrechte.
Terms of use:
Documents in EconStor may be saved and copied for yourpersonal and scholarly purposes.
You are not to copy documents for public or commercialpurposes, to exhibit the documents publicly, to make thempublicly available on the internet, or to distribute or otherwiseuse the documents in public.
If the documents have been made available under an OpenContent Licence (especially Creative Commons Licences), youmay exercise further usage rights as specified in the indicatedlicence.
www.econstor.eu

Do Mergers Among Multimarket Firms Create Value?
Sebastian Linde Ralph Siebert
CESIFO WORKING PAPER NO. 6139 CATEGORY 11: INDUSTRIAL ORGANISATION
OCTOBER 2016
An electronic version of the paper may be downloaded • from the SSRN website: www.SSRN.com • from the RePEc website: www.RePEc.org
• from the CESifo website: Twww.CESifo-group.org/wp T
ISSN 2364-1428

CESifo Working Paper No. 6139
Do Mergers Among Multimarket Firms Create Value?
Abstract Merger value is frequently evaluated in single market contexts without considering possible gains stemming from firms’ multimarket presence. This study concentrates on the question through which channels, and of which magnitude, mergers among multimarket firms create incremental value. We establish a simple theoretical model that determines merger value in a multimarket firm environment. The model enables us to derive merger values as being independent of post-merger market shares, but rather dependent on pre-merger market shares. We test our hypotheses using a comprehensive dataset that encompasses information on mergers and firm-level multimarket production and innovation within the semiconductor industry. Using the pairwise stable equilibrium concept, we estimate firms’ structural value functions. Our results show that multimarket effects contribute, on average, 20% of the total merger value added. Moreover, we find that multimarket efficiency gains dominate multimarket power effects by contributing majority of the value added. We also find that our estimated merger values are well aligned with the merging firms’ post-merger stock market performance.
JEL-Codes: L100, L130, L200.
Keywords: efficiency gains, market power, matching, merger formation, merger value, multimarket competition.
Sebastian Linde
Purdue University Department of Economics
Krannert School of Management 403 West State Street
USA – West Lafayette, IN 47907-2056 [email protected]
Ralph Siebert Purdue University
Department of Economics Krannert School of Management
403 West State Street USA – West Lafayette, IN 47907-2056
[email protected] October, 2016

1 Introduction
Mergers have long been a popular strategy among firms, and they have become increasingly
important over time involving trillions of dollars spent on merger transactions every year. A well-
established fact in the merger literature is that a consolidation between firms can create value, see,
e.g., Stigler (1950), Williamson (1968), Perry and Porter (1985), and Farrell and Shapiro (1990),
Hitt et al. (2001), and King et al. (2004) among many others. While most studies concentrate
on merger value creation in single markets, mergers usually take place between firms operating
in multiple product markets. The multimarket firm character can be attributed to product and
geographic market diversification (Gimeno and Woo 1999). For example, a vast majority of
firms in the semiconductor dynamic random access (DRAM) industry are also present in other
markets such as static random access memories, Flash memories etc.1 Recent studies emphasize
that mergers among multimarket firms can soften competition via coordinated effects (Miller and
Weinberg (2015), Kim and Singal (1993), and Singal (1996)). Despite the prevalence of mergers
among multimarket firms, mergers are frequently evaluated in single market contexts without
considering possible gains stemming from firms’ multimarket presence. The multimarket merger
aspect has received little attention in the merger literature and more insight is desired. This
study concentrates on the question through which channels mergers among firms competing in
multiple markets create additional value.
A well established argument that increases merger value is the market power effect. Merg-
ing firms can internalize the competitive externalities they imposed on each other pre-merger,
which allows them to raise their price above the pre-merger equilibrium price (see Stigler (1950),
Williamson (1968), Salant et al. (1983), Perry and Porter (1985), Farrell and Shapiro (1990), and
McAfee and Williamson (1992)). The extent to which competitive externalities can be internal-
ized and market power can be achieved through mergers will likely be augmented in the number
of markets that merging firms operate in.
A further argument that can add value to a merger is the achievement of merger-specific
efficiency gains. The efficiency gains can be originated by economies of scale and scope, production
rationalization, and innovation.2 It is reasonable to believe that firms’ multimarket presence1Most pharmaceutical firms operating in the therapeutic market cancer are also active in other markets such
as cardiovascular etc. Many more examples can be provided for other industries.2See also Ravenscraft and Scherer (1987), Farrell and Shapiro (1990), Focarelli and Panetta (2003), Harrison et
2
determine efficiency gains and merger value.
A third merger value-increasing argument is related to the fact that multimarket activity
across firms can have several strategic implications on firms’ behavior.3 First, firms competing
against each other in multiple markets can refrain from engaging in aggressive pricing behavior
in one market to avoid aggressive responses in other mutual markets, also referred to as tacit
collusion or mutual forbearance. Hence, multimarket contact can help support tacit collusion
among firms and result in softer competition (see Edwards (1955), Bernheim and Whinston
(1990), Hughes and Oughton (1993), and Evans and Kessides (1994)).4 If a merger is formed
among multimarket firms, these firms will give away the possibility to engage in tacit collusion
or mutual forbearance practices with the merging partner, which might reduce the value of the
merger. A second strategic aspect that could have an effect on merger value among multiproduct
firms is that mergers leave fewer firms competing in the market, which facilitates collusion in
product markets. Therefore, multimarket activity further expands collusion possibilities, which
may add merger value. A third strategic aspect of mergers between multimarket firms is that
these firms may be better informed about one another given their close interdependence across
multiple markets. Better information may translate into less uncertainty which, in turn, may
benefit the merger value.
To what extent the above-mentioned multimarket firm arguments create incremental merger
value is an empirical question which forms the center of our study. Ideally, we would like to
compare pre- and post-merger values of firms with differing degrees of multimarket contacts.
This approach, however, is empirically challenging for several reasons. First, the post-merger
value depends on post-merger market shares and closed form solutions are difficult to derive
and highly complex even in the simplest settings. A closed form solution for post-merger shares
will depend on costs and realized efficiency gains which data are frequently not available. To
overcome this problem, we establish a simple theoretical model that determines merger value in
al. (1991), Hitt et al. (1998), Larsson and Finkelstein (1999), Datta, Pinches, and Narayanan (1992), Ramaswamy(1997), Shelton (1988), and Singh and Montgomery (1987).
3For more information on multimarket competition, see Karnani and Wernerfelt (1985: 87).4The majority of empirical studies find that multimarket contact weakens product market competition and
enables firms to sustain higher levels of profits and prices (see, e.g., Busse (2000) and Parker and Roeller (1997)on the telecommunications industry, Evans and Kessides (1994), Singal (1993), Miller (2010), and Ciliberto andWilliams (2014) on the airline industry, and Heggestad and Rhoades (1978) and Rhoades and Heggestad (1985)on the banking industry). Further empirical studies are Azar et al. (2015), Schmitt (2015), Parker and Roller(1997), Jans and Rosenbaum (1994), Hughes and Oughton (1993), and Scott (1991), among others.
3

a multimarket firm environment. We apply a conventional approach in the merger literature,
and evaluate merger values based on infinitesimal output changes, see e.g., Farrell and Shapiro
(1990). This approach enables us to derive merger values as being independent of post-merger
market shares, but rather dependent on pre-merger market shares. Our model provides us with
a set of results that illustrate how mergers among multimarket firms can generate incremental
value, i.e., multimarket activity interacted with efficiency gains and market power effects as well
as multimarket strategic effects in isolation. The results are hypothesized and tested in our
empirical model. The basic theoretical model also serves as a basis for the specification of our
empirical model.
The empirical evaluation of merger value is afflicted with several challenges for econome-
tricians. While merger value is the driving force in firms’ merger decisions, it is frequently
unobserved, and quantifying the value that mergers create is difficult. Another challenge is that
strategic interactions between firms that compete within the merger market and which affect the
resulting merger assignments are also difficult to account for. Strategic interactions result from
the fact that in forming mergers, firms take into consideration not only the characteristics of
their merger partner, but also the characteristics–and merger decisions–of all other firms within
the merger market. To overcome these challenges, we estimate a structural matching model in
which mergers are the result of a mutual agreement where each merging firm searches for the best
match of a merging partner that maximizes profits. The observed sorting of firms into merger
pairs, that is based on merger value, enables us to recover the unobserved merger value.5 The
choice of the structural matching model also takes care of strategic interactions between forward
looking firms, i.e., merger decisions do not only depend on the characteristics of the merging firms
under consideration, but also on the characteristics of other firms and on the consequences on
other mergers formed among other firms (see, e.g., Hall (1988), Park (2013), Akkus et al. (2015),
and Baccara et al. (2012)). We assume that the mergers between firms in the data represent an
equilibrium outcome that is pairwise stable. Using the pairwise stable equilibrium concept, we
estimate a one-to-one, one-sided matching game with transferable utility.6
5For additional background on the relevant matching literature, see Appendix B. For an overview of thisliterature, see Fox (2009) and Graham (2011).
6One-to-one means that each merging firm merges with another one firm. One-sided relates to the fact thatevery firm is allowed to be a potential acquirer. Transferable utility indicates that each acquiring firm gives moneyto its target firm, and both merging firms express their utilities in terms of money.
4

Our empirical model concentrates on estimating the merger value-enhancing impact of mul-
timarket firm arguments using a comprehensive dataset on the semiconductor industry. Our
dataset comprises 115 mergers for the years 1991-2004, as well as detailed firm-level production
data across different product markets and innovation data across different technology markets.
Based on firms’ matching and sorting patterns into mergers and the specification derived from
our basic theoretical model, our study explores the estimation of structural value functions, which
represent the preferences of merging firms over the characteristics of potential merging partners.
Our empirical model evaluates to what extent multimarket efficiency gains, multimarket power ef-
fects, and multimarket strategic arguments will create value in mergers among multimarket firms.
Most interestingly, we find multimarket effects contribute, on average, 20% of the total merger
specific value added. We also find that multimarket efficiency gains contribute more value added
than do multimarket power effects, and that our estimated merger values are positively correlated
with the acquiring firm’s post-merger stock market performance, which provides support for our
estimation procedure and for mergers being motivated by merger value creation.
The remainder of this paper is organized as follows: Section 2 presents our basic theoretical
model. Section 3 describes the industry and data sources, outlines our variable definitions, and
presents data descriptives. Section 4 outlines the matching model and describes the estimation
procedure. We report our results in Section 5 and conclude in Section 6.
2 Basic Model
In the following, we introduce our basic theoretical model, which purpose is threefold: First, it
introduces the arguments through which multimarket firms can add value to mergers. Second,
the model allows us to use pre-merger market shares and avoids endogenizing the changes of
post-merger equilibrium market shares. Third, it serves as a basis for specifying our empirical
framework.
Our model is related to the study by Farrell and Shapiro (1990) which uses infinitesimal
changes in firms’ pre-merger outputs for their merger analysis. We consider a setting where
firms operate in multiple markets m ∈ M . Nm is the set of firms that are active producers
within-market m, and we also define Mi ⊆ M as the subset of markets that firm i is present in.
Goods within each market are homogeneous. Let the inverse demand in each market be given
5

by Pm(Qm), where Pm is price in market m, Qm is market output in market m, and the inverse
demand is downward sloping P ′m(Qm) < 0. Let qim denote firm i′s output and Q−im denote the
output in market m of all firms except firm i. Total cost, TCm(qim), of firm i, in market m, is
an increasing function of firm i′s output qim (∂TCm∂qim> 0). It should be noted that total costs
are market specific. As such, we do not allow for scope economies across markets. Firms choose
quantities in order to maximize profits. The single market profit of firm i that operates in market
m is:
πim = Pm(qim +Q−im)qim − TCm(qim).
To summarize, we assume an oligopolistic model in which quantity-setting firms are allowed to
operate across different product markets that can differ in their demand and cost structures.
Merger Value
Merger value is defined as the difference between post- and pre-merger profits. To be able
to formally describe these profits, we first need to define a few relevant sets and terms. Let
Kij = {m | m ∈ Mi ∧m ∈ Mj} be the set of markets that firms i and j have in common and
let Ki = {m | m ∈ Mi ∧m /∈ Mj} be the set of markets that firm i is active in, but not firm j.
Similarly, we define Kj = {m | m /∈Mi∧m ∈Mj} the set of markets that only firm j operates in.
Moreover, |.| denotes the absolute value for scalars and the cardinality for the sets. For example,
|Kij | denotes the number of common markets for firms i and j (i.e., the number of elements of
Kij). The pre-merger profit of firm i that operates in markets Mi is given by:
Πi =∑m∈Mi
πim. (1)
We model a merger as a complete combination of the merging firms’ assets and of the control of
the merging firms. Hence, the post-merger (PM) profit of firms i and j is:7
ΠPMij =
∑m∈Kij
πPMijm +
∑m∈Ki
πPMim +∑m∈Kj
πPMjm
, (2)
7Note, a superscript PM refers to post-merger variables, while no superscript refers to pre-merger variables.
6
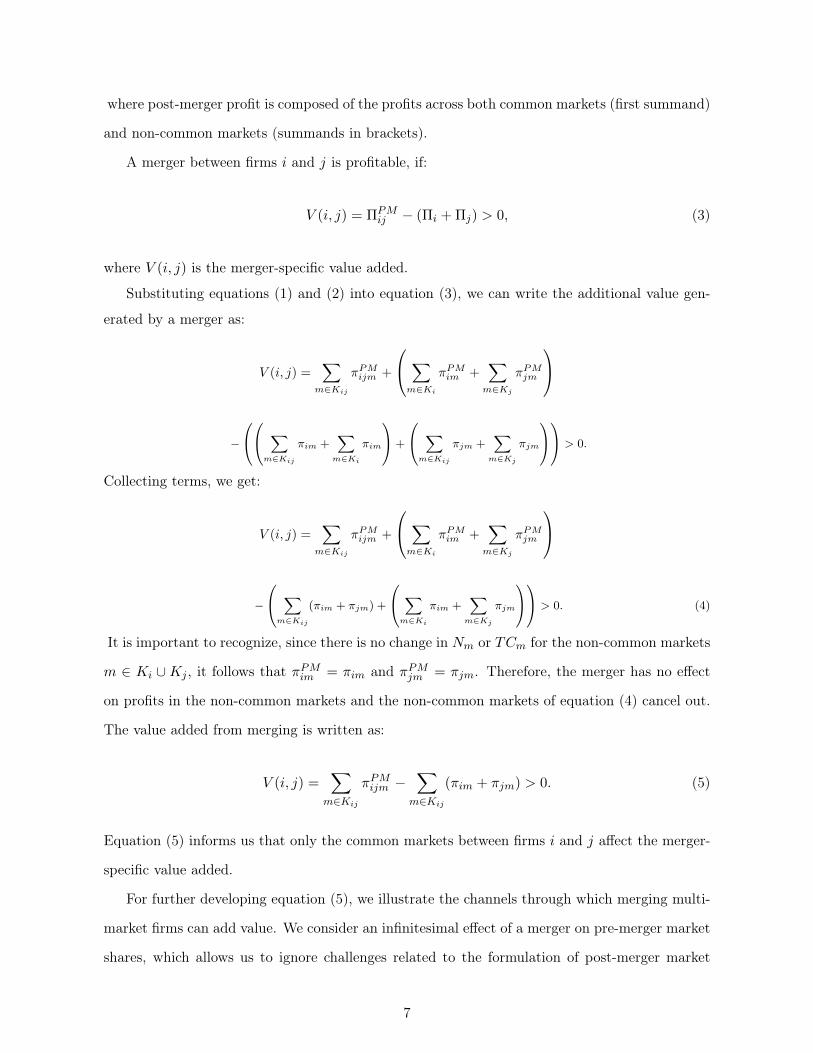
where post-merger profit is composed of the profits across both common markets (first summand)
and non-common markets (summands in brackets).
A merger between firms i and j is profitable, if:
V (i, j) = ΠPMij − (Πi + Πj) > 0, (3)
where V (i, j) is the merger-specific value added.
Substituting equations (1) and (2) into equation (3), we can write the additional value gen-
erated by a merger as:
V (i, j) =∑
m∈Kij
πPMijm +
∑m∈Ki
πPMim +∑m∈Kj
πPMjm
−
∑m∈Kij
πim +∑m∈Ki
πim
+
∑m∈Kij
πjm +∑m∈Kj
πjm
> 0.
Collecting terms, we get:
V (i, j) =∑
m∈Kij
πPMijm +
∑m∈Ki
πPMim +∑m∈Kj
πPMjm
−
∑m∈Kij
(πim + πjm) +
∑m∈Ki
πim +∑m∈Kj
πjm
> 0. (4)
It is important to recognize, since there is no change in Nm or TCm for the non-common markets
m ∈ Ki ∪Kj , it follows that πPMim = πim and πPMjm = πjm. Therefore, the merger has no effect
on profits in the non-common markets and the non-common markets of equation (4) cancel out.
The value added from merging is written as:
V (i, j) =∑
m∈Kij
πPMijm −∑
m∈Kij
(πim + πjm) > 0. (5)
Equation (5) informs us that only the common markets between firms i and j affect the merger-
specific value added.
For further developing equation (5), we illustrate the channels through which merging multi-
market firms can add value. We consider an infinitesimal effect of a merger on pre-merger market
shares, which allows us to ignore challenges related to the formulation of post-merger market
7

shares, such as solving for post-merger market shares in closed form or to endogenize post-merger
market shares with regard to market power and efficiency arguments.8 Since pre-merger market
shares can be smaller or larger than post-merger market shares, we will have to consider the two
cases of output-reducing and output-increasing mergers. For each case, we explore the conditions
that need to apply for equation (5) to hold. The first case, output-reducing merger, is summarized
by Proposition 1 as follows:
Proposition 1:
Suppose that multiproduct firms i and j are involved in an output-reducing merger, i.e., qPMijm <
qim+qjm, where m refers to the common markets between firms i and j. A merger will add value,
if:
V (i, j) =∑
m∈Kij
|1 + λm|
(sim + sjm∣∣ηQpm∣∣
)−(
∆TCm +mrmmrm
) > 0, (6)
where λm is the conjectural variation, sim and sjm denote firm i′s and firm j′s pre-merger
market shares,∣∣ηQpm∣∣ is the absolute price elasticity of demand, mrm is the change in revenues,
and ∆TCm is the difference between post-merger and pre-merger total costs evaluated at the
corresponding pre- and post-merger equilibrium outputs. It is important to recognize, since we
consider an output-reducing merger qPMijm < qim+qjm, and given that ∂TCm/∂qi,jm > 0, it follows
that ∆TCm = TCm(qi+ qj− ε)−TCm(qi)−TCm(qj) < 0 must apply, even in the absence of any
merger-specific efficiency gains. The consideration of merger-specific efficiencies would provide
further support for equation (5) to be satisfied since it further reduces ∆TCm which increases
πPMijm .
Proof: See Appendix A1.
In the following, we discuss four arguments that determine merger surplus in the output-
reducing merger case as shown in Proposition 1.
First, as shown in equation (6), merging firms characterized by larger pre-merger market shares
in their common markets m (sim + sjm) add more value to mergers. In economic terms, larger
firms impose higher negative competitive externalities on each other which can be internalized8The endogeneity of post-merger market shares is conflicted by the challenge to separately identify market
power and efficiency gains.
8

through merging, further reduces post-merger output and raises post-merger price and profits,
also known as the market power effect. Moreover, larger merging firms leave smaller firms outside
the merger, causing smaller post-merger output responses which are less harmful to the merging
firms’ profits.9 The market power effect becomes more powerful and further increases merger
value if firms merge in markets with less elastic demands. With less elastic demands, markups
are larger and more profits to gain. The fraction of market shares weighed by the elasticity of
demand is also commonly referred to as the Lerner index in the economics literature and used as
a proxy for firms’ market power. The market power incentive, as shown in equation (6), scales
in the number of markets that the merging firms have in common (Kij). This is plausible since
a merger between multimarket firms removes, by definition, a competitor from multiple markets,
which increases market power across multiple markets and adds incremental value to a merger.
Hence, the merger value increases in the market power argument interacted with the number
of common markets, which we refer to as multimarket power effects. It should be noted that
equation (6) expresses the increase in merger value, as originated by the market power effect and
the internalization of competitive externalities, using pre-merger market shares, price elasticities
of demand and the set of common markets. No post-merger market shares enter the equation and
no closed form solution of post-merger market shares or further information on how post-merger
market shares were generated are needed.
Second, equation (6) shows that the merger value is increasing in the potential merger-specific
cost savings (∆TCm) within common markets. The efficiency gains shift the merging firms’
reaction functions outwards and increase output and profits. This efficiency effect is also known
from previous merger studies that concentrated on single markets. Merger-specific cost savings
could be caused by the merging firms’ rationalization of production, economies of scale, the
unification of knowledge, or other technological complementarities.
Third, equation (6) shows that merger value increases in merger-specific cost savings (∆TCm)
achieved across common product markets Kij . The efficiency effect of merging multimarket firms
scales in the number of jointly operated product markets, which we refer to as multimarket
efficiency gain effects.
Fourth, equation (6) indicates that merger value is determined by strategic aspects related9Salant et al. (1983) show that the output response of non-merging firms matters for the profitability of a
merger, i.e., smaller output responses are more valuable to merging firms.
9

to firms’ degree of competitiveness in product markets. These effects are captured by the multi-
market component (Kij), and we refer to this as multimarket strategic effects. The combination
of both aspects relates to an argument stemming from the multimarket contact literature, i.e.,
multimarket contact can serve as a strategic device by firms to soften competition (also known
as tacit collusion or mutual forbearance). In the context of a merger between multimarket firms,
which lowers the degree of post-merger multimarket contact, this argument implies that merging
firms give away the possibility to engage in tacit collusion or mutual forbearance practices with
the merging partner. As a result, the post-merger market may become more competitive, which
will be reflected by a change in the conjectural variation (λm), and reduces the incentives of
multimarket firms to merge. A further strategic aspect having a potential impact on the post-
merger conjectural variation (λm) and merger value is explained as follows. A merger leaves
fewer firms in the product market, which facilitates collusion in product markets making mergers
more valuable. Finally, an increase in the firms’ common markets Kij can increase knowledge of
each merging firm’s operations, reduce merger-specific uncertainty and may increase the value of
mergers.
The second case concentrates on an output-reducing merger, which is summarized by Propo-
sition 2.
Proposition 2:
Suppose that multiproduct firms i and j are involved in an output-increasing merger qPMijm >
qim+ qjm where m refers to the common markets between firms i and j. A merger will add value,
if:
V (i, j) =∑
m∈Kij
(1 + λm)
(sim + sjm∣∣ηQpm∣∣
)−(
∆TCm −mrmmrm
) > 0, (7)
where all the terms are defined as in equation (6).
Proof: See Appendix A2.
Equation 7 is similar to equation 6, and confirms that merger value depends on market power,
potential efficiency gain, and multimarket contact arguments. Moreover, the earlier argument is
confirmed that market power and the associated potential internalization of competitive exter-
nalities matter impact merger value, which can be solely expressed by using pre-merger market
10

shares and elasticities. Hence, equations 6 and 7 require no information on how post-merger mar-
ket shares are realized. The model provides guidance for our empirical specification and provides
us with the following four hypotheses.
Hypothesis 1: (Multimarket Power Effects) Merger value increases in the merging firms’ market
power which scales with the number of markets that the merging firms have in common.
Hypothesis 1 is based on the fact that merging multimarket firms gain from internalizing their
negative competitive externalities which scale with the number of markets that the merging firms
are active in together.
Hypothesis 2: (Efficiency Gains) The value of mergers increases in efficiency gains achieved
within markets.
Hypothesis 2 states that merger-specific efficiency gains increase merger value, which is a
common argument in standard merger literature.
Hypothesis 3: (Multimarket Efficiency Gains) The merger value increases in efficiency gains
which scale with the number of markets that the merging firms have in common.
Hypothesis 3 states that mergers generate value via merger-specific efficiency gains which
scale with the number of jointly operated markets.
Hypothesis 4: (Multimarket Strategic Effect) The merger value is determined by strategic effects
between firms across markets.
Hypothesis 4 reflects the fact that the value of mergers is determined via strategic aspects
between multimarket firms.
The goal of our empirical model is to test these hypotheses. Next, we present details on the
industry, our data sources, variable definitions, and descriptive statistics.
3 Industry and Data Descriptives
The semiconductor industry presents an appropriate setting for empirically exploring the deter-
minants of the merger value for several reasons. First, and importantly for our purposes, it is
11
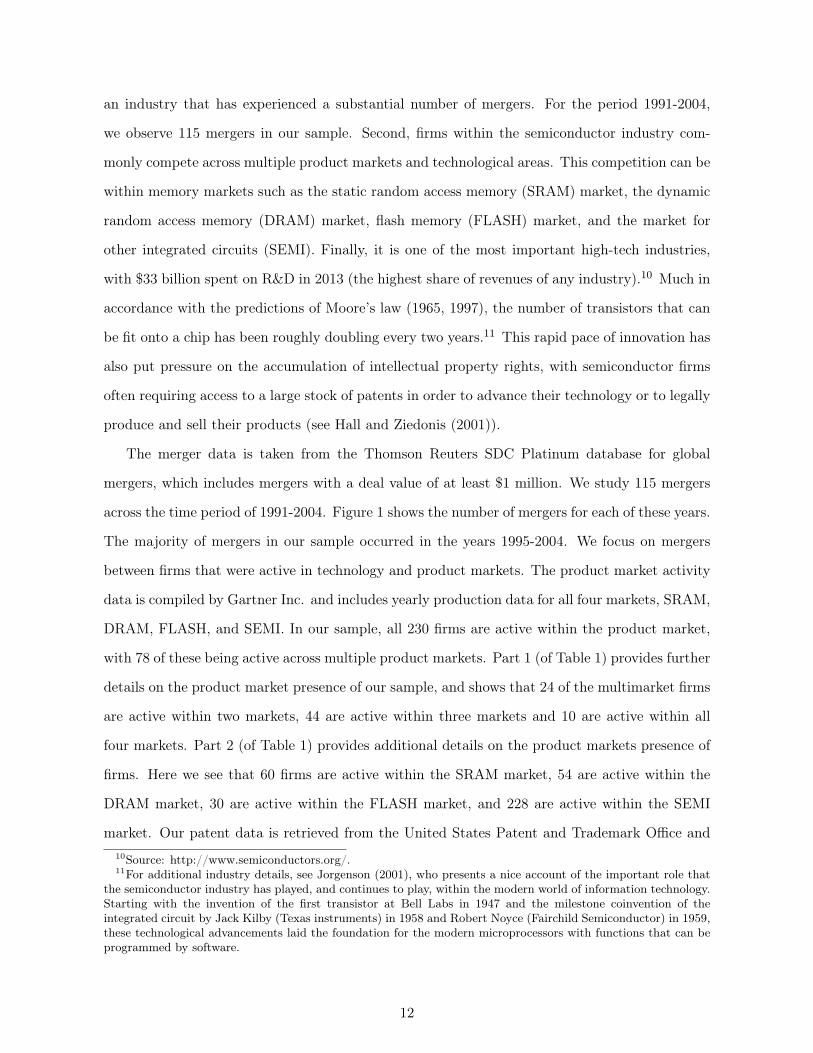
an industry that has experienced a substantial number of mergers. For the period 1991-2004,
we observe 115 mergers in our sample. Second, firms within the semiconductor industry com-
monly compete across multiple product markets and technological areas. This competition can be
within memory markets such as the static random access memory (SRAM) market, the dynamic
random access memory (DRAM) market, flash memory (FLASH) market, and the market for
other integrated circuits (SEMI). Finally, it is one of the most important high-tech industries,
with $33 billion spent on R&D in 2013 (the highest share of revenues of any industry).10 Much in
accordance with the predictions of Moore’s law (1965, 1997), the number of transistors that can
be fit onto a chip has been roughly doubling every two years.11 This rapid pace of innovation has
also put pressure on the accumulation of intellectual property rights, with semiconductor firms
often requiring access to a large stock of patents in order to advance their technology or to legally
produce and sell their products (see Hall and Ziedonis (2001)).
The merger data is taken from the Thomson Reuters SDC Platinum database for global
mergers, which includes mergers with a deal value of at least $1 million. We study 115 mergers
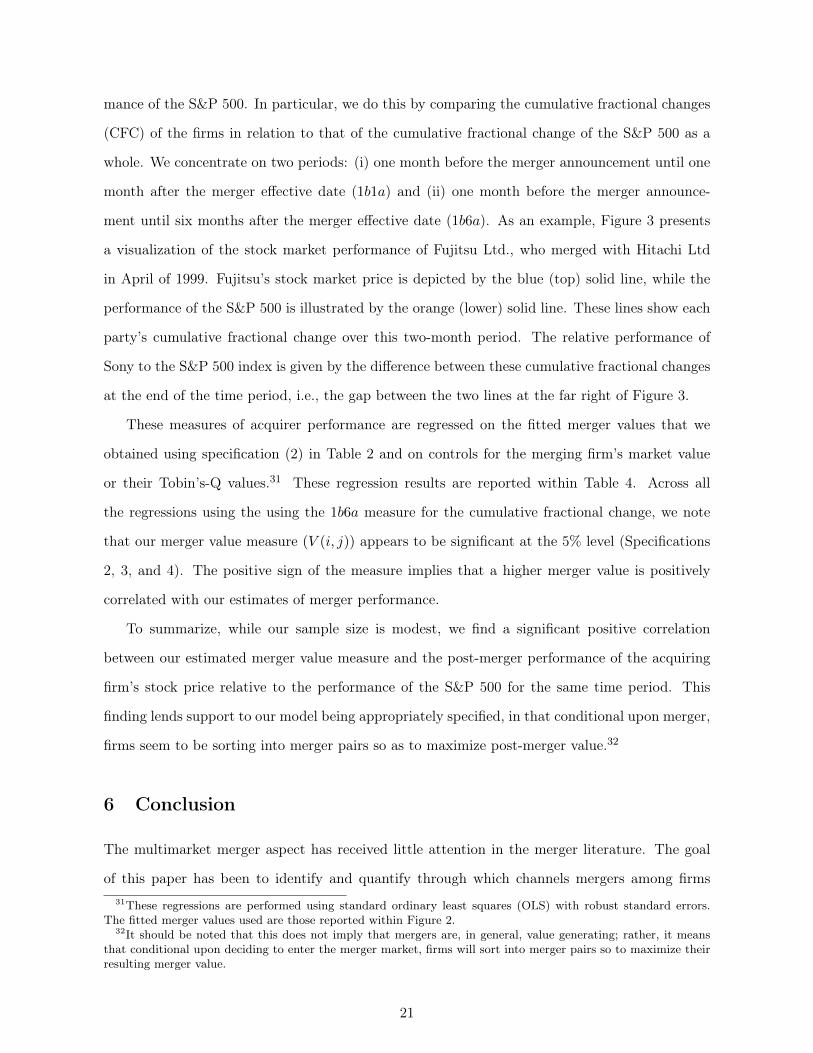
across the time period of 1991-2004. Figure 1 shows the number of mergers for each of these years.
The majority of mergers in our sample occurred in the years 1995-2004. We focus on mergers
between firms that were active in technology and product markets. The product market activity
data is compiled by Gartner Inc. and includes yearly production data for all four markets, SRAM,
DRAM, FLASH, and SEMI. In our sample, all 230 firms are active within the product market,
with 78 of these being active across multiple product markets. Part 1 (of Table 1) provides further
details on the product market presence of our sample, and shows that 24 of the multimarket firms
are active within two markets, 44 are active within three markets and 10 are active within all
four markets. Part 2 (of Table 1) provides additional details on the product markets presence of
firms. Here we see that 60 firms are active within the SRAM market, 54 are active within the
DRAM market, 30 are active within the FLASH market, and 228 are active within the SEMI
market. Our patent data is retrieved from the United States Patent and Trademark Office and10Source: http://www.semiconductors.org/.11For additional industry details, see Jorgenson (2001), who presents a nice account of the important role that
the semiconductor industry has played, and continues to play, within the modern world of information technology.Starting with the invention of the first transistor at Bell Labs in 1947 and the milestone coinvention of theintegrated circuit by Jack Kilby (Texas instruments) in 1958 and Robert Noyce (Fairchild Semiconductor) in 1959,these technological advancements laid the foundation for the modern microprocessors with functions that can beprogrammed by software.
12

was obtained from the National Bureau of Economic Research (NBER) Patent Database (for
details on this database, see Hall, Jaffe, and Trajtenberg (2001)).12 All firms within our sample
are active technology firms with positive patent stocks. Finally, our firm-level financial data is
from Compustat at WRDS, DataStream, and Wolfram Research.
Using our data on intellectual property rights and product market activity, we define five
merger-specific measures in order to empirically test the hypotheses of Section 2.
To test our first hypothesis, we control for multimarket power effects (MMP ) as follows:
First, let sim denote firm i′s market share in product market
m ∈ {SRAM,DRAM,FLASH,SEMI}. Given the market presence of firms i and j, we define
our multimarket power effect (MMP ) measure as the summed interaction of firm i′s and firm
j′s market shares:
MMP ij =∑
m∈Kij
sim ∗ sjm∣∣ηQpm∣∣ ,
where the sum is taken over all the markets m ∈ Kij that firms i and j have in common, and
ηQpm refers to the price elasticity of demand within market m.13,14
The second hypothesis states that firms sort into merger pairs on the basis of efficiency
gains. To empirically approximate this notion of efficiency, we draw upon Cohen and Levinthal’s
(1990) idea of absorptive capacity, which states that more similar firms are better able to extract
value from one another’s activities. As such, firms that are more “similar” in terms of their
technologies (or knowledge) may be better able to extract value from one another when merging.
We refer to this notion of knowledge relatedness as technological proximity (TP). To capture the
technological proximity of firms, we use the uncentered correlation between firm i′s and firm j′s
patent portfolios. We let Γi = (Γi1,Γi2, ...) be firm i′s patent portfolio, where Γik denotes the
number of patents that firm i holds in patent class k.15 Our technological proximity measure12A crosswalk was devised to match firms within the production dataset to firms within the patent data. This
matching was done using the firm names.13In choosing our ηQpm measures we draw upon the literature and use the following values: -3.3 for SRAM, -2.4
for DRAM, -3.5 for FLASH and -2 for SEMI.14It should be noted that this specification of our MMP measure uses the product between the market shares
rather than the sum of these market shares (which was suggested by our theoretical model). The reason forthis is due to an empirical limitation of the matching approach that we employ within our empirical analysis–inparticular, these models are unable to identify a parameter on a firm characteristic that is not interacted with thecharacteristic of any other firm (see Fox (2010a: 15)).
15We used data on the following 10 patent classes: 257 (active solid state drives), 326 (electronic digital logitcircuitry), 438 (semi-devices manufacturing process), 505 (super conductor technology apparatus, material, andprocesses), 360 (dynamic magnetic information storage and retrieval), 365 (SRAM), 369 (DRAM), 711 (FLASH),712 (computer processors etc.), and 714 (error detection and correction).
13

is:16
TP ij =(ΓiΓ
′j)
(ΓiΓ′i)
12 (ΓjΓ
′j)
12
,
where TPij ∈ [0, 1] is increasing in the degree of patent portfolio overlap of firms i and j.17 In
addition to technological proximity, we also want to control for the scale of firms’ patent stocks.
The reason for this is that larger patent stocks may provide more opportunities for meaningfully
recombining firms’ patents in order to derive additional merger value. Our patent stock measure
is simply defined as the product of the two firms’ individual log patent stocks:
PSij = log (PatStocki) ∗ log (PatStockj) ,
where PatStocki denotes the discounted patent stock of firm i.18
The third hypothesis refers to the multimarket efficiency gains (MME) caused by the inter-
action of multimarket competition and the aforementioned efficiency gain benefits. As such, we
define our MME measure as the interaction between the number of common markets and our
technological proximity measure (TP ):
MMEij =∑
m∈Kij
1[m ∈ Kij ] ∗ TPij ,
where 1[.] is an indicator function taking the value of 1 if the market m is common to both firms
and 0 otherwise.
The fourth hypothesis states that the merger-specific value will also depend on the merging
firms’ multimarket strategic effect. As such, we need another measure that will simply capture
the degree of multimarket contact (MMS) between the merging firms i and j. This is defined
as:
MMSij =∑
m∈Kij
1[m ∈ Kij ],
16To ensure that TPij is defined for all possible match pairs within our dataset, we consider only firms withnon-zero patent portfolios, i.e., we focus on technology firms. Also, to avoid endogeneity concerns related to ourtechnology and market share measures, we use lagged values of these measures (i.e., for the market share at yeart, we use that in period t− 1).
17For uses of this proximity measure within the industrial organization literature, see, for example, the originalapplication in Jaffe (1969), and, more recently, Bloom, Schankerman, and Van Reenen (2010) and Siebert andRoy (2015).
18The patent stock measures have been discounted using a discount factor of 0.85 (see Hall, Jaffe, and Trajtenberg(2001)).
14

which is a commonly applied measure of multimarket contact (see also Evans and Kessides (1994)
and Gimeno and Woo (1996)).
Next, Table 2 provides summary statistics for our variables across two samples. The first
sample consists of our 109 realized mergers. The second sample considers hypothesized mergers
of randomly merged firms.
Comparing Columns (1) and (2) in Table 2, we note that merged firms tend to match on the
size of their (log) patent stocks (means: 24.50 > 23.42), their technological proximity (0.57 >
0.49), multimarket efficiency gains (0.81 > 0.57), multimarket power effects (0.003 > 0.001), and
multimarket strategic effects (1.30 > 1.11).19 These findings are well aligned with our hypotheses.
4 Empirical Matching Model
This section presents the matching model, introduces the match value function, and outlines how
we estimate the parameters using a maximum score estimation method. We also discuss the
consistency of the estimates and the applied numerical optimization method.20
4.1 Matching Model
We consider a finite set of firms F and an observable merger assignment µ : F 7→ F that assigns
firms into merger pairs. A merged pair (i, j) receives merger value of V (i, j). If the observed
matches are based on a pairwise stable equilibrium concept, then it must be the case that firm i
seeks to maximize V (i, j) across all potential partner firms j ∈ F\{i} and, likewise, that firm j
seeks to maximize V (i, j) across its possible partner firms i ∈ F\{j}.21 Building on this concept,
it follows that for any two observed merger pairs µij = (i, j) and µkl = (k, l), there cannot exist
a transfer t from µij to µkl such that the bilateral exchange of partners specified by µ improves
the outcomes of the firm-pairs. Therefore, for any transfer t the following conditions apply:
V (i, j) ≥ V (i, k)− t ∧ V (k, l) ≥ V (j, l) + t, (8)19Note that the relevant sample means are reported within the parentheses.20See Appendix B for a brief review of the closely related matching literature.21We focus on the notion of a merger as a bilateral agreement between two firms, as such, V (i, j) = V (j, i)
applies.
15

and
V (i, j) ≥ V (i, l)− t ∧ V (k, l) ≥ V (k, j) + t. (9)
Adding the inequalities in equation (8),
V (i, j) + V (k, l) ≥ V (i, k) + V (j, l), (10)
must hold. Adding the inequalities in equation (9),
V (i, j) + V (k, l) ≥ V (i, l) + V (j, k), (11)
must apply. An assignment that satisfies both inequalities as shown in equations (10) and (11)
is pairwise stable.22
4.2 Match Value Function Specification
Firms are matched according to the following match value function V (i, j). In choosing a func-
tional form, we follow our model and previous work on mergers and specify a linear form for our
match value function:23
V (i, j) = θ1PSij + θ2TPij + θ3MMSij + θ4MMP ij + θ5MMEij . (12)
This functional form is specified in accordance with the set of hypotheses derived in Section 2.
Our main focus relates to the effects due to firms’ technological proximity (TP ), multimarket
efficiency gains (MME), multimarket power effects (MMP ), and the merging firms’ multimarket
strategic effects (MMS). We also control for firms’ technological stocks using the interaction of
the merging firms’ patent stocks (PS).
4.3 Maximum Score Estimation
Given our parametric form for V (i, j) in equation (12), we take the inequalities implied by
equations (10) and (11) and estimate the parameters using a semiparametric maximum score22Pairwise stability was first used by Gale and Shapley (1962) as a stability notion within matching. Our notion
of stability is similar to that of Baccara et al. (2012). See Appendix B for additional details on the relevantmatching literature.
23See, for example, Baccara et al. (2012) and Akkus et al. (2015).
16

estimation technique.24 Our objective function is given by:
Q(θ) =∑t∈T
∑µij∈Mt
∑µkl∈Mt
1 [V (i, j) + V (k, l) ≥ V (i, k) + V (j, l)] + 1 [V (i, j) + V (k, l) ≥ V (i, l) + V (j, k)]
,
(13)
where θ′ = {θ1, θ2, θ3, θ4, θ5} denotes the parameter vector of interest, and the inner two sums
are taken over all possible match pair combinations within the match market (set) Mt.25 The
index t of Mt refers to the year t ∈ T = {1991, 1992, ..., 2004}. The outer sum is then taken over
all of these separate matching markets (or years). The estimates θ̂ maximize the number of times
that the inequalities in equation (13) apply; that is, we choose θ̂ to maximize the score Q(θ̂) in
equation (13).
This methodology was proposed by Fox (2010a and 2010b), who provides consistency results
for two cases: (i) when the matching market is defined as one large market and (ii) when there are
many individual markets. The choice of model framework affects whether the asymptotics of the
consistency results relate to the number of firms (within the one market) or across the number of
markets (within the many small markets case). Within our setup, we choose to treat each year
as a separate merger market, and as such, the consistency in our cases depends on the number of
individual markets. We choose this approach for two reasons. First, comparing possible merger
swaps across years does not seem desirable within a market where technological progress is drastic
such that comparison across time would be problematic. Second, by considering within-market
(year) swaps, our setup effectively controls for time fixed effects. If we instead pooled all mergers
into one market we would not be able to control for time effects, something that could bias our
estimates.
In terms of identification, this estimation approach allows us to identify the relative impact
of different covariates on the merger value V (i, j) and the relative scale of these values across
different mergers. Another benefit of this approach is that any omitted variable that affects
firms’ merger value from merging with a particular firm equally is differenced out of the previous
inequalities in equations (10) and (11) and, therefore, does not bias the parameter estimates from
equation (13). This is a particularly appealing feature of this estimator since it essentially means24This estimation procedure was introduced by Manski (1975, 1985).25Within our application the match market set Mt includes all theoretically feasible inequalities due to pairwise
swaps, however, since some years contain firms that are part of multiple mergers we do not include pairwise swapsacross matches that contain a common firm since these are not theoretically feasible.
17
that the omission of firm-specific fixed effects does not bias the estimates.26
Lastly, it should be noted that our objective function in equation (13) is not smooth. Conse-
quently, numerical techniques are required to find parameter values that maximize the objective
function. We follow the recommendation by Fox (2010a) and employ a method known as differ-
ential evolution to find our parameter estimates.27
5 Results
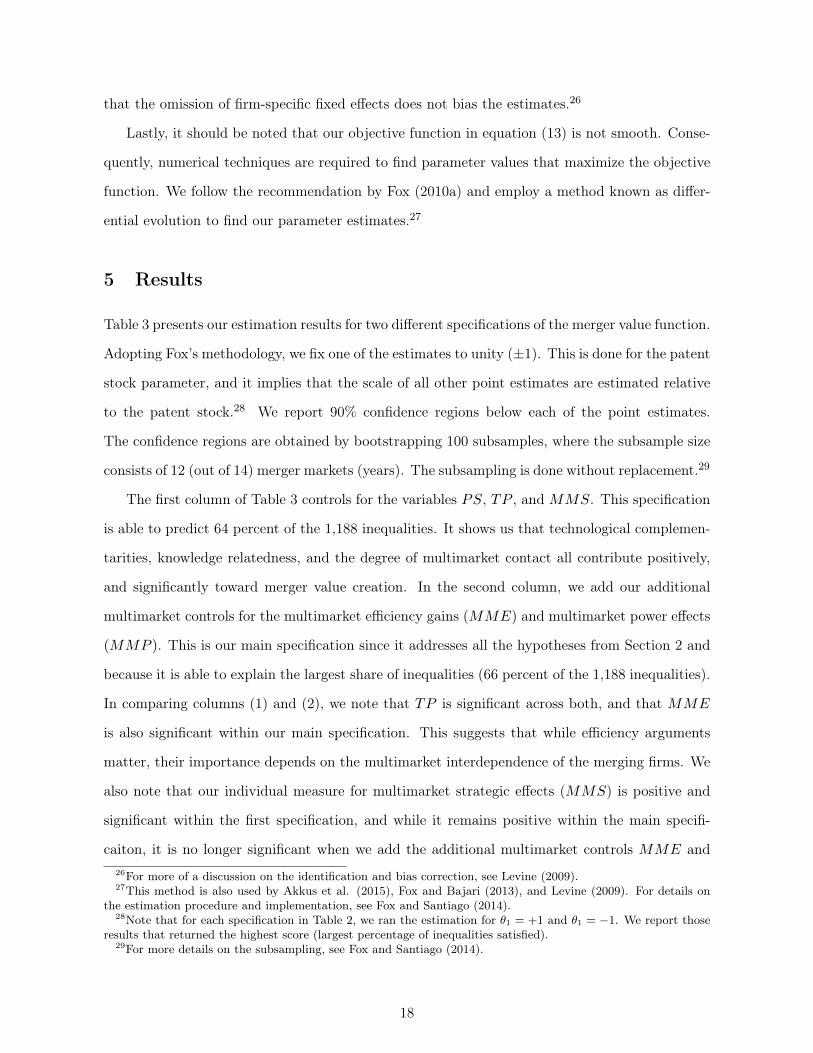
Table 3 presents our estimation results for two different specifications of the merger value function.
Adopting Fox’s methodology, we fix one of the estimates to unity (±1). This is done for the patent
stock parameter, and it implies that the scale of all other point estimates are estimated relative
to the patent stock.28 We report 90% confidence regions below each of the point estimates.
The confidence regions are obtained by bootstrapping 100 subsamples, where the subsample size
consists of 12 (out of 14) merger markets (years). The subsampling is done without replacement.29
The first column of Table 3 controls for the variables PS, TP , and MMS. This specification
is able to predict 64 percent of the 1,188 inequalities. It shows us that technological complemen-
tarities, knowledge relatedness, and the degree of multimarket contact all contribute positively,
and significantly toward merger value creation. In the second column, we add our additional
multimarket controls for the multimarket efficiency gains (MME) and multimarket power effects
(MMP ). This is our main specification since it addresses all the hypotheses from Section 2 and
because it is able to explain the largest share of inequalities (66 percent of the 1,188 inequalities).
In comparing columns (1) and (2), we note that TP is significant across both, and that MME
is also significant within our main specification. This suggests that while efficiency arguments
matter, their importance depends on the multimarket interdependence of the merging firms. We
also note that our individual measure for multimarket strategic effects (MMS) is positive and
significant within the first specification, and while it remains positive within the main specifi-
caiton, it is no longer significant when we add the additional multimarket controls MME and26For more of a discussion on the identification and bias correction, see Levine (2009).27This method is also used by Akkus et al. (2015), Fox and Bajari (2013), and Levine (2009). For details on
the estimation procedure and implementation, see Fox and Santiago (2014).28Note that for each specification in Table 2, we ran the estimation for θ1 = +1 and θ1 = −1. We report those
results that returned the highest score (largest percentage of inequalities satisfied).29For more details on the subsampling, see Fox and Santiago (2014).
18

MMP . We now relate these results to our hypotheses of Section 2 to derive further economic
content.
The first hypothesis holds that firms will seek to merge due to multimarket power effects
that can help create value from increased post-merger market power. Our main specification in
column (2) controls for these effects using MMP , which we find to be a strong, and significant,
positive influencer of merger matching behavior within the semiconductor industry.
Our second hypothesis describes that firms will match so to benefit from merger-specific cost
savings and efficiencies. Such cost efficiencies may derive from rationalization of production,
economies of scale, and the degree of technological relatedness between the two firms, and this
is what we seek to capture with our TP and PS measures–both of which are found to have
positive, and significant, point estimates across both specificaitons. As such, we conjecture that
these efficiency gains may importantly depend upon the multimarket interaction of merging firms.
This is what we seek to address with our third hypothesis.
The third hypothesis states that merger value derives from multimarket efficiency gain argu-
ments, i.e., within a multimarket setting, these effects will scale with the degree of multimarket
competition between the merging firms. Our main specification in column (2) (of Table 3) pro-
vides support for this hypothesis by showing a positive and statistically significant multimarket
efficiency gain (MME) effect. Thus, we find that both multimarket efficiency gains and multi-
market power effects importantly contribute towards the merger-specific value.
The fourth hypothesis implies that merger value will depend on firms’ level of multimarket
strategic effects. However, we argued that the anticipated effect on the resulting merger value
may be ambiguous due to the fact that it may capture negative effects (due to the reduction of
multimarket contact post-merger) and positive effects (due to a reduction of competitors across
multiple markets; better informational certainty from merging with a multimarket competitor).
Looking at our two specifications, we see that we obtain a positive point estimate for our MMS
variable in both column (1) and column (2) of Table 3, however, the effect is not statistically
significant when we include our other multimarket controls (MME and MMP ) within the main
specification of column (2). This finding suggests that the positive and negative merger effects
that are proxied by the MMS variable tend to cancel out.
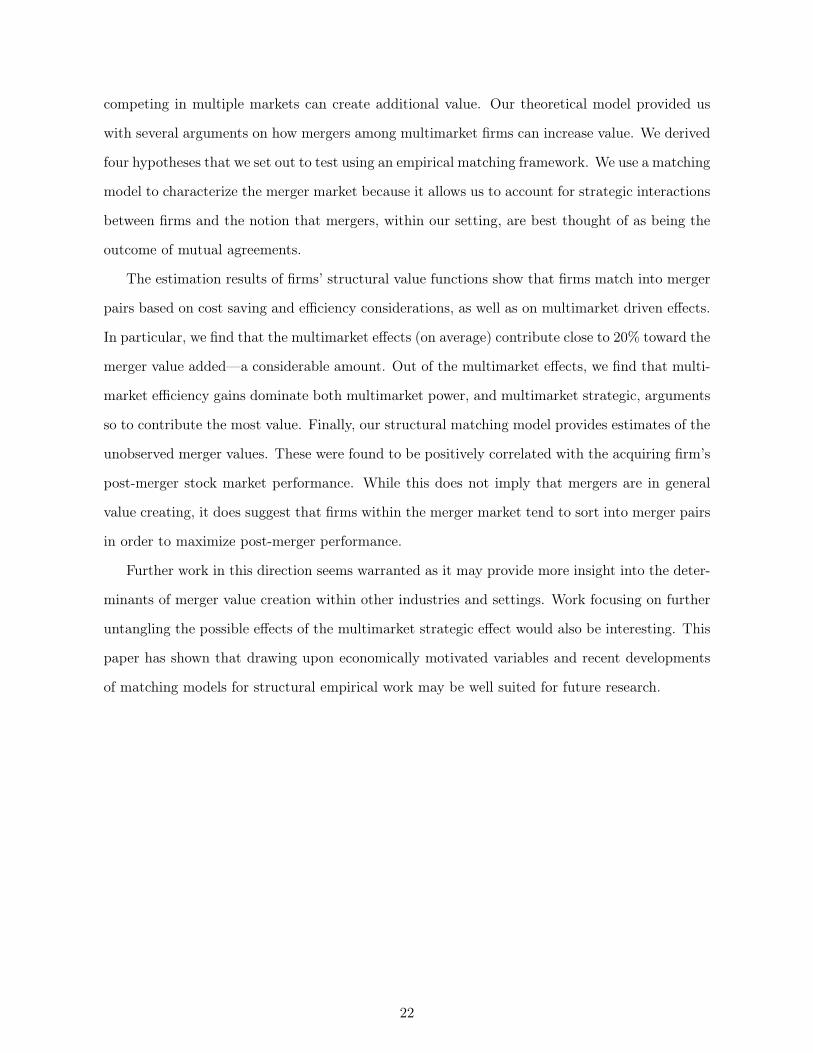
The estimation results in Table 3 are further used to obtain estimates of the unobserved
19

merger values. These are showcased in Figure 2. Note that since only the relative difference of
these values matters, we have scaled them by the median merger value. As such, the median firm
has a value of 1, while half of the merger values are located to the left (and right) of the median
merger. Figure 2 shows that the values range from 0.03 to 3.0, which indicates a substantial
amount of heterogeneity between the merger values. The long right tail within this distribution
further indicates that there are some mergers that result in exceptionally high merger values. This
finding is interesting because it suggests that firms face scarcity in the number of good matches,
something that may induce them to compete for attractive partner firms. As we have previously
argued, these strategic interactions have implications for the resulting merger assignment and,
therefore, need to be controlled for within the empirical approach–something we have done by
virtue of using a matching model.
Lastly, we want to investigate the relative contribution of each of our controls towards the
total additional merger specific value added. This is done by dividing the mean contribution of
each control by the mean merger value, Vi,j .30 This analysis informs us that multimarket effects
(MME, MMP and MMS) contribute close to 20% of the total additional merger value, while
the remaining value is contributed by merger-specific cost savings and efficiencies (given by the
PS and TP controls). These findings suggest that within multimarket settings firms merger
decisions will be influenced by the firms multimarket characteristics. Of particular interest is
the finding that the multimarket efficiency effects (MME) dominate both multimarket power
(MMP ) and multimarket strategic arguments (MMS).
5.1 Merger Value and Merger Performance
We are interested in exploring whether our fitted merger values hold any information regarding
the eventual performance of the post-merger firm. We view this as a specification test in that a
positive correlation between our estimated merger value and the post-merger performance of the
acquiring firm provides support for our value function being appropriately specified.
To explore this relationship, we take our fitted merger values and use them to predict merger
performance. We define merger performance as the difference between the acquiring firm’s stock
market price relative to the performance of the general market, which we proxy using the perfor-
30For example, to assess the relative contribution of PS we compute(θ̂1 ∗ PS
)/V (i, j) = (1 ∗ 24.5) /60.3 = 0.4,
where PS is the average PS across all realized mergers, and V (i, j) is similarly defined.
20
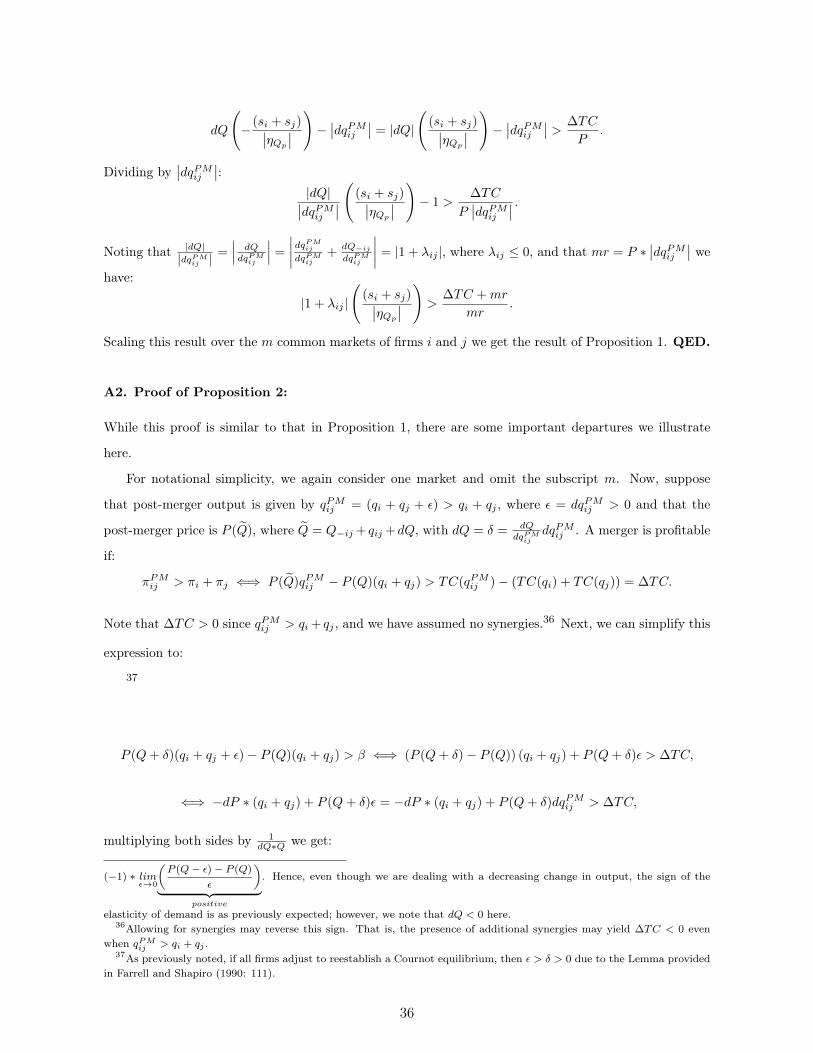
mance of the S&P 500. In particular, we do this by comparing the cumulative fractional changes
(CFC) of the firms in relation to that of the cumulative fractional change of the S&P 500 as a
whole. We concentrate on two periods: (i) one month before the merger announcement until one
month after the merger effective date (1b1a) and (ii) one month before the merger announce-
ment until six months after the merger effective date (1b6a). As an example, Figure 3 presents
a visualization of the stock market performance of Fujitsu Ltd., who merged with Hitachi Ltd
in April of 1999. Fujitsu’s stock market price is depicted by the blue (top) solid line, while the
performance of the S&P 500 is illustrated by the orange (lower) solid line. These lines show each
party’s cumulative fractional change over this two-month period. The relative performance of
Sony to the S&P 500 index is given by the difference between these cumulative fractional changes
at the end of the time period, i.e., the gap between the two lines at the far right of Figure 3.
These measures of acquirer performance are regressed on the fitted merger values that we
obtained using specification (2) in Table 2 and on controls for the merging firm’s market value
or their Tobin’s-Q values.31 These regression results are reported within Table 4. Across all
the regressions using the using the 1b6a measure for the cumulative fractional change, we note
that our merger value measure (V (i, j)) appears to be significant at the 5% level (Specifications
2, 3, and 4). The positive sign of the measure implies that a higher merger value is positively
correlated with our estimates of merger performance.
To summarize, while our sample size is modest, we find a significant positive correlation
between our estimated merger value measure and the post-merger performance of the acquiring
firm’s stock price relative to the performance of the S&P 500 for the same time period. This
finding lends support to our model being appropriately specified, in that conditional upon merger,
firms seem to be sorting into merger pairs so as to maximize post-merger value.32
6 Conclusion
The multimarket merger aspect has received little attention in the merger literature. The goal
of this paper has been to identify and quantify through which channels mergers among firms31These regressions are performed using standard ordinary least squares (OLS) with robust standard errors.
The fitted merger values used are those reported within Figure 2.32It should be noted that this does not imply that mergers are, in general, value generating; rather, it means
that conditional upon deciding to enter the merger market, firms will sort into merger pairs so to maximize theirresulting merger value.
21
competing in multiple markets can create additional value. Our theoretical model provided us
with several arguments on how mergers among multimarket firms can increase value. We derived
four hypotheses that we set out to test using an empirical matching framework. We use a matching
model to characterize the merger market because it allows us to account for strategic interactions
between firms and the notion that mergers, within our setting, are best thought of as being the
outcome of mutual agreements.
The estimation results of firms’ structural value functions show that firms match into merger
pairs based on cost saving and efficiency considerations, as well as on multimarket driven effects.
In particular, we find that the multimarket effects (on average) contribute close to 20% toward the
merger value added—a considerable amount. Out of the multimarket effects, we find that multi-
market efficiency gains dominate both multimarket power, and multimarket strategic, arguments
so to contribute the most value. Finally, our structural matching model provides estimates of the
unobserved merger values. These were found to be positively correlated with the acquiring firm’s
post-merger stock market performance. While this does not imply that mergers are in general
value creating, it does suggest that firms within the merger market tend to sort into merger pairs
in order to maximize post-merger performance.
Further work in this direction seems warranted as it may provide more insight into the deter-
minants of merger value creation within other industries and settings. Work focusing on further
untangling the possible effects of the multimarket strategic effect would also be interesting. This
paper has shown that drawing upon economically motivated variables and recent developments
of matching models for structural empirical work may be well suited for future research.
22

References
Ahlin, C., 2009, “Matching for Credit: Risk and Diversification in Thai Microcredit Groups”,
Thesis.
Akkus, O., A.J. Cookson, and A. Hortacsu, 2014, “The Determinants of Bank Mergers: A
Revealed Preference Analysis”, Mimeo, pp. 1-26.
Azar, J., M.C. Schmalz, and I. Tecu, 2015, “Anti-Competitive Effects of Common Ownership
Anti-Competitive Effects Of Common Ownership”, Mimeo.
Baccara, M., A. Imorohoroglu, A. Wilson and L. Yariv, 2012, “A Field Study on Matching with
Network Externalities”, American Economic Review, Vol. 102, No. 5, pp. 1773-1804.
Becker, G.S., 1973, “A Theory of Marriage”, Journal of Political Economy, Vol. 81, No. 4, pp.
813-846.
Bernheim, D. and M. Whinston, 1990, “Multimarket Contact and Collusive Behavior”, Rand
Journal of Economics, Vol. 21, No. Spring, pp. 1-26.
Bloom, N., M. Schankerman, and J. Van Reenen, 2013, “Identifying Technology Spillovers and
Product Market Rivalry”, Econometrica, Vol. 81, No. 1984, pp. 1-66.
Bulow, J., J. Geanakoplos, and P. Klemperer, 1985, “Multimarket Oligopoly: Strategic Substi-
tutes and Complements.” Journal of Political Economy, Vol. 93, No. 3, p. 488.
Busse, M.R., 2000, “Multimarket Contact and Price Coordination in the Cellular Telephone
Industry”, Journal of Economics and Management Strategy, Vol. 9, No. 3, pp. 287-320.
Capron, L., 1999, “the Long-Term Performance of Horizontal Acquisitions”, Strategic Manage-
ment Journal, Vol. 20, pp. 987-1018.
Ciliberto, F. and W. Jonathan, 2010, “Limited Access to Airport Facilities and Market Power
in the Airline Industry”, Journal of Law and Economics, Vol. 53, No. 3, pp. 467-495.
Cohen, W. and D. Levinthal, 1990, “Absorptive Capacity: A New Perspective on Learning and
Innovation”, Administrative Science Quarterly, Vol. 35, No. 1, pp. 128-152. Dantzig, G.B.,
1963, Linear Programming. Vol. 50. No. 1. Rand Corporation, pp. 42-47.
23

Datta, D., G.E. Pinches, V.K. Narayanan, 1992, “Factors Influencing Wealth Creation from
Mergers and Acquisitions: A Meta-Analysis”, Strategic Management Journal, Vol. 13, No.
1, pp. 67-84.
Davidson, C. and B. Ferrett, 2007, “Mergers in Multidimensional Competition”, Economica, Vol.
74, No. 296, pp. 695-712.
Edwards, C.D., 1955, “Conglomerate Bigness as a Source of Power ”, Business Concentration
and Price Policy, Vol. 1, pp. 329-358.
Evans, W.N. and I. Kessides, 1994, “Living by the "Golden Rule": Multimarket Contact in the
U.S. Airline Industry”, The Quarterly Journal of Economics, Vol. 109, No. 2, pp. 341-366.
Farrell, J. and C. Shapiro, 1990a, “Horizontal Mergers: An Equilibrium Analysis”, American
Economic Review, Vol. 80, No. 1, pp. 107-126.
Focarelli, D. and F. Panetta, 2003, “Are Mergers Beneficial to Consumers? Evidence from the
Market for Bank Deposits”, American Economic Review, Vol. 93, No. 4, pp. 1152-1172.
Fox, J.T., 2008, “Estimating Matching Games with Transfers”, Mimeo, pp. 1-43.
Fox, J.T., , 2009, “Structural Empirical Work Using Matching Models”, New Palgrave Dictionary
of Economics. No. August, pp. 1-9.
Fox, J.T., 2010, “Identification in Matching Games”, Quantitative Economics, Vol. 1, No. 2, pp.
203-254.
Fox, J.T. and P. Bajari, 2013, “Measuring the Efficiency of an FCC Spectrum Auction”, American
Economic Journal: Microeconomics, Vol. 5, No. 1, pp. 100-146.
Fox, J.T. and D. Santiago, 2014, “A Toolkit for Matching Maximum Score Estimation and
Point and Set Identified Subsampling Inference”, FTC and DOJ, 2010, Horizontal Merger
Guidelines. Tech. rep.
Gale, D. and L.S. Shapley, 1962, “College Admissions and the Stability of Marrige”, The Amer-
ican Mathematical Monthly, Vol. 69, No. 1, pp. 9-15.
24

Gimeno, J. and C.Y. Woo, 1999, “Multimarket contact, economies of scope, and firm perfor-
mance”, Academy of Management Journal, Vol. 42, No. 3, pp. 239-259.
Graham, B.S., 2011, Econometric Methods for the Analysis of Assignment Problems in the
Presence of Complementarity and Social Spillovers. 1st ed. Vol. 1. No. 1. Elsevier, pp.
965-1052.
Griliches, Z., 1992, “The Search for R&D Spillovers”, Scandinavian Journal of Economics, Vol.
94, pp. 29-47.
Haleblian, J. et al., 2009, “Taking Stock of What We Know About Mergers and Acquisitions: A
Review and Research Agenda”, Journal of Management, Vol. 35, No. 3, pp. 469-502.
Hall, B., 1988, “Estimation of the Probability of Acquisition in an Equilibrium Setting”, Mimeo,
pp. 1-54.
Hall, B., A.B. Jaffe, and M. Trajtenberg, 2001, “The NBER Patent Citations Data File: Lessons,
Insights and Methodological Tools”, NBER working paper 8498, pp. 1-74.
Haspeslagh, P., D.B. Jemison, 1991, “The Challenge of Renewal Through Acquisitions”, Planning
Review, Vol. 19, Issue March/April, pp. 27-33.
Hitt, M., J. Harrison, et al., 1998, “Attributes of Successful and Unsuccessful Acquisitions of US
Firms”, British Journal of Management, Vol. 9, No. 2, pp. 91-114.
Hitt, M., R. Ireland, and J. Harrison, 2001, “Mergers and acquisitions: A value creating or value
destroying strategy ”, Blackwell Handbook of Strategic Management, pp. 384-408.
Hughes, K. and C. Oughton, 1993, “Diversification, Multimarket Contact and Profitability”,
Economica, Vol. 60, No. 238, pp. 203-224.
Investopedia, 2008, The Industry Handbook: The Semiconductor Industry.
Jaffe, A., 1986, “Technological Opportunity and Spillovers of R and D: Evidence from Firms?
Patents, Profits, and Market Value”, The American economic review, Vol. 76, No. 5, pp.
984-1001.
25

Jans, I. and D.I. Rosenbaum, 1996, “Multimarket Contact and Pricing: Evidence from the U.S.
Cement Industry”, International Journal of Industrial Organization, Vol. 15, pp. 391-412.
Jeffrey, S. et al., 1991, “Synergies and Post-Acquisition Performance: Differences Versus Simi-
larities in”, Journal of Management, Vol. 17, No. 1, pp. 173-190.
Jorgenson, D.W., 2001, “Information Technology and the U.S. Economy”, American Economic
Review, Vol. 91, No. 1, pp. 1-32.
Kamien, M.I., E. Muller, and I. Zang, 1992, “Research Joint Ventures and R and D Cartels”,
The American Economic Review, Vol. 82, No. 5, pp. 1293-1306.
Kamien, M.I. and I. Zang, 2000, “Meet Me Halfway: Research Joint Ventures and Ab- sorptive
Capacity”, International Journal of Industrial Organization, Vol. 18, pp. 995- 1012.
Kim, H. and V. Singal, 1993, “Mergers and Market Power: Evidence from the Airline Industry”,
American Economic Review, Vol. 83, No. 3, pp. 549-569.
King, D.R. et al., 2004, “Meta-Analyses of Post-Acquisition Performance: Indications of Uniden-
tified Moderators”, Strategic Management Journal, Vol. 25, No. 2, pp. 187-200.
Larsson, R. and S. Finkelstein, 1999, “Integrating Strategic, Organizational, and Hu- man Re-
source Perspectives on Mergers and Acquisitions: A Case Survey of Synergy Realization”,
Organization Science, Vol. 10, No. 1, pp. 1-26.
Levine, A., 2009, “Licensing and Scale Economies in the Biotechnology Pharmaceutical Indus-
try”, Mimeo, pp. 1-42.
Manski, C.F., 1975, “Maximum Score Estimation of the Stochastic Utility Model of Choice”,
Journal of Econometrics, Vol. 3, No. 3, pp. 205-228.
McAfee, P.R. and M.A. Williams, 1992, “Horizontal Mergers and Antitrust Policy”, The Journal
of Industrial Economics, Vol. 40, No. 2, pp. 181-187.
Miller, N.H. and M.C. Weinberg, 2015, “Mergers Facilitate Tacit Collusion: Empirical Evidence
from the U.S. Brewing Industry”, Mimeo, pp. 1-58.
26

Mindruta, C.D., 2013, “Markets For Research: A Matching Approach to University-Industry
Research Collaborations”, PhD thesis, pp. 1-144.
Moore, G.E., 1965, “Cramming More Components Onto Integrated Circuits”, Electronics, Vol.
38, No. 8.
Moore, G.E., 1997, An Update on Moore’s Law. url: http://www.intel.com/pressroom/ archive/
speeches/gem93097.htm.
Park, M., 2013, “Understanding merger incentives and outcomes in the US mutual fund indus-
try”, Journal of Banking and Finance, Vol. 37, No. 11, pp. 4368-4380.
Parker, P.M. and L.H. Roller, 1997, “Collusive Conduct in Duopolies: Multimarket Contact and
Cross-Ownership in the Mobile Telephone Industry”, RAND Journal of Economics, Vol. 28,
No. 2, pp. 304-322.
Perry, M. and Porter R., 1985, “Oligopoly and the Incentive for Horizontal Merger”, The Amer-
ican Economic Review, Vol. 75, No. 1, pp. 219-227.
Ramaswamy, K., 1997, “The Performance Impact of Strategic Similarity in Horizon- tal Mergers:
Evidence from the U.S. Banking Industry”, Academy of Management Journal, Vol. 40, No.
3, pp. 697-715.
Ravenscraft, D.J. and F.M. Scherer, 1989, “The profitability of mergers”, International Journal
of Industrial Organization, Vol. 7, No. 1, pp. 101-116.
Rhoades, S.A., and A. A. Heggestad, 1985, “Multimarket interdependence and performance in
banking: Two tests”, Antitrust bulletin, Vol. 30, p. 975
Roth, A.E. and Sotomayor M.A., 1990, Two-Sided Matching: A study in Game-Theoretic Mod-
eling and Analysis. Cambridge University Press, pp. 1-261.
Roth, A.E. and M.A. Sotomayor, 1992, “Two-Sided Matching”, Handbook of Game Theory, Vol.
1, pp. 485-535.
Salant, S.W., S. Switzer, and R.J. Reynolds, 1983, “Losses from Horizontal Merger: The Ef-
fects of an Exogenous Change in Industry Structure on Cournot-Nash Equilibrium”, The
Quarterly Journal of Economics, Vol. 98, No. 2, pp. 185-199.
27

Schmitt, M., 2015, “Multimarket Contact in the Hospital Industry”, Mimeo.
Scott, J.T., 1991, “Multimarket Contact Among Diversified Oligopolists”, International Journal
of Industrial Organization, Vol. 9, No. 2, pp. 225-238.
Shapley, L.S. and Shubik M., 1971, “The Assignment Game I: The Core”, International Journal
of Game Theory, Vol. 1, No. 1, pp. 111-130.
Shelton, L.M., 1988, “Strategic business fits corporate acquisition: Empirical evidence”, Strategic
Management Journal Vol. 9, pp. 279-287.
SIA, 2014, “Semiconductor Industry Association: Factbook”, Tech. rep. url: http://www.
semiconductors.org/.
Singal, V., 1996, “Airline Mergers and Multimarket Contact”, Managerial and Decision Eco-
nomics, Vol. 17, No. 6, pp. 559-574.
Singh, H., and C. Montgomery, 1987, “Corporate Acquisitions and Economic Performance”,
Strategic Management Journal Vol. 8, pp. 377-386.
Siebert, R. and M. Roy, 2015, “The Competitive Effects of Horizontal Mergers with Firm Het-
erogeneities”, Mimeo, pp. 1-40.
Singal, V., 1996, “Airline Mergers and Multimarket Contact”, Managerial and Decision Eco-
nomics, Vol. 17, No. 6, pp. 559-574.
Sorensen, M., 2007, “How Smart Is Smart Money? A Two Sided Matching Model of Venture
Capital”, The Journal of Finance, Vol. 62, No. 6, pp. 2725-2762.
Stigler, G., 1950, “Monopoly and Oligopoly by Merger”, American Economic Review, Vol. 40,
No. 2, pp. 23-34.
Uetake, K. and Y. Watanabe, 2012, “Entry by Merger: Estimates from a Two-Sided Matching
Model with Externalities”, Mimeo, pp. 1-45.
Williamson, O.E., 1968, “Economies as an Antitrust Defense: The Welfare Tradeoffs”, The
American Economic Review, Vol. 58, No. 1, pp. 18-36.
28

Yang, Y., M. Shi, and A. Goldfar, 2009, “Estimating the Value of Brand Alliances in Professional
Team Sports”, Marketing Science, Vol. 28, No. Feb 2015, pp. 1095-1111.
29
Figures
1991 1992 1993 1994 1995 1996 1997 1998 1999 2000 2001 2002 2003 20040
5
10
15
Year
NumberofMergers
Figure 1: Merger Distribution Over Time (1990-2004).
0.0 0.5 1.0 1.5 2.0 2.5 3.00
2
4
6
8
10
12
14
Merger Value V(i,j)
NumberofMergers
Figure 2: Realized Merger Value Distribution.
30

CFC
Year = 1999
S&P 500
Merger Announcement
Date
Merger Effective
Date
Fujitsu
Apr May
0.0
0.1
0.2
0.3
0.4
Fujitsu Ltd
Figure 3: Measure of Merger Performance. Shows the cumulative fractional change (CFC) of Fujitsu’s stockmarket price (blue solid line) for the period of one month before the merger announcement and one month afterthe merger was confirmed (effective date). The merger announcement and confirmation date are here the sameand are visually represented by the vertical line that divides the figure into two parts. Merger success is taken tobe the amount by which the firm outperforms the S&P 500 (orange solid line) for the full extent of this period oftime.
31

Tables
Part 1: Product Market PresenceNumb. of Markets: 1 2 3 4Numb. of Firms: 152 24 44 10
Part 2: Product MarketMarket: SRAM DRAM FLASH SEMINumb. of Firms: 60 54 30 228
Table 1: Descriptives of Sample. Part 1 describes the product market presence of the 230 firm observations (115mergers) within our sample. Part 2 describes the firms’ market presence by each specific product market.
(1) (2)Realized Mergers Random Mergers
Variable Mean Std. Dev. Mean Std. Dev.
PS † 24.502 24.160 23.358 21.190TP 0.570 0.319 0.485 0.286MME 0.813 0.796 0.575 0.520MMP 0.003 0.011 0.001 0.004MMS 1.300 0.713 1.114 0.468
N 115 2,333† – denotes variables defined with logs.
Table 2: Summary Statistics of Variables. These are provided for two cases: (i) realized mergers and (ii) randommatching within the merger population.
32

(1) (2)Variables V(i,j) V(i,j)PS +1 +1
[1 , 1] [1 , 1]
TP 13.7* 42.8*[9.6 , 25.0] [43.3 , 78.9]
MME - 12.6*[- , -] [2.9 , 22.5]
MMP - 88.3***[- , -] [64.1 , 204.4]
MMS 8.8*** 0.7[8.0 , 14.4] [-1.3 , 2.1]
Numb. Mergers: 115 115Numb. Ineq.: 1,188 1,188% Ineq. Satisfied: 64% 66%
Table 3: Maximum Score Estimates. We report the 90% and 99% confidence regions within the brackets belowthe point estimates. * – indicates significance at the 10% level, i.e., the 90% confidence region does not include0. *** – indicates significance at the 1% level, i.e., the 99% confidence region does not include 0. The confidenceregions were computed using bootstrapping: subsamples = 100, subsample size = 12 (out of 14) nests. Subsamplingis done without replacement.
33

(1) (2) (3) (4)Variables 1b1a 1b6a 1b6a 1b6a
V(i,j) 0.10 0.16** 0.18** 0.29**(0.06) (0.06) (0.08) (0.11)
MktV ali -2.23e-07(1.23e-06)
MktV alj 1.44e-06(2.38e-06)
TQi -0.001(0.02)
t_tobins_q -0.07(0.05)
Observations 60 62 49 49R-squared 0.05 0.09 0.12 0.14
Robust standard errors in parentheses*** p<0.01, ** p<0.05, * p<0.1
Table 4: Merger Success Regressions (ordinary least squares with robust standard errors). Variable definitions:1b1a = cumulative fractional change (measured 1 one month before the merger announcement date until onemonth (or six months) after the merger is confirmed) difference between the firm stock price performance and thegeneral market (S&P 500) performance; MktV ali = Market value for firm i at time of merger; TQi = firm i′s
Tobin’s-Q value at time of merger.
34

Appendix
Appendix A: Proofs and Computational Details
A1. Proof for Proposition 1.
In the following, we concentrate on one market and drop the market subscriptm. Now, let the post-merger
output be denoted by qPMij = (qi + qj − ε) < qi + qj , where ε = dqPMij > 0, and let the post-merger price
be P (Q̃) where Q̃ = Q−ij + qij +dQ, with dQ = δ = dQdqPM
ijdqPMij . For a merger to add value, the following
equation has to apply:
πPMij > πi + πj ⇐⇒ P (Q̃)qPMij − P (Q)(qi + qj) > TC(qPMij )− (TC(qi) + TC(qj)) = ∆TC.
Remember that ∆TC < 0, and since qPMij < qi + qj , this will also hold if there are post-merger synergies.
Next, we can simplify the above expression to:
P (Q− δ)(qi + qj − ε)− P (Q)(qi + qj) > ∆TC ⇐⇒ (P (Q− δ)− P (Q)) (qi + qj)− P (Q− δ)ε > ∆TC.
This can further be rewritten as:33
dP ∗ (qi + qj)− P (Q− δ)ε = dP ∗ (qi + qj)− P (Q− δ)∣∣dqPMij ∣∣ > ∆TC.
Next, we recognize that dQ < 0 and that dQdQ = 1, so we can rewrite the equation above as:34
dQdP
dQ(qi + qj)− P (Q− δ)
∣∣dqPMij ∣∣ > ∆TC,
multiplying both sides by QP (Q−δ)Q :
dQ
(dP
dQ
Q
P
)(qi + qj)
Q−∣∣dqPMij ∣∣ > ∆TC
P,
where ( dPdQQP ) is the absolute inverse price elasticity of demand 1
|ηQp| . The above equation can further berewritten as:35
33Note that we take ε to represent an infinitesimal small change in the production of the merged firm and as such,−ε = −
∣∣∣dqPMij ∣∣∣ applies. We write this in terms of the absolute value to make it clearer what the sign of the terms are.Also, since δ is taken to represent an infinitesimal small change in the market output, we take that dP ≈ ∆P =
P (Q− δ)− P (Q) > 0. Note that the equality holds strictly in the limit as δ → 0.
34Note, if all firms adjust to reestablish a Cournot equilibrium, then ε < δ < 0 will hold here. This follows from theLemma provided in Farrell and Shapiro (1990: 111). However, if the outsiders are assumed to not respond to the change,then ε = δ.
35Note the negative sign within the parentheses results from: dPdQ
= P ′(Q) = limε→0
P (Q−ε)−P (Q)(Q−ε)−Q = lim
ε→0
P (Q−ε)−P (Q)−ε =
35
dQ
(− (si + sj)∣∣ηQp
∣∣)−∣∣dqPMij ∣∣ = |dQ|
((si + sj)∣∣ηQp
∣∣)−∣∣dqPMij ∣∣ > ∆TC
P.
Dividing by∣∣dqPMij ∣∣:
|dQ|∣∣dqPMij ∣∣(
(si + sj)∣∣ηQp
∣∣)− 1 >
∆TC
P∣∣dqPMij ∣∣ .
Noting that |dQ||dqPM
ij |=∣∣∣ dQdqPM
ij
∣∣∣ =
∣∣∣∣dqPMij
dqPMij
+dQ−ij
dqPMij
∣∣∣∣ = |1 + λij |, where λij ≤ 0, and that mr = P ∗∣∣dqPMij ∣∣ we
have:
|1 + λij |
((si + sj)∣∣ηQp
∣∣)>
∆TC +mr
mr.
Scaling this result over the m common markets of firms i and j we get the result of Proposition 1. QED.
A2. Proof of Proposition 2:
While this proof is similar to that in Proposition 1, there are some important departures we illustrate
here.
For notational simplicity, we again consider one market and omit the subscript m. Now, suppose
that post-merger output is given by qPMij = (qi + qj + ε) > qi + qj , where ε = dqPMij > 0 and that the
post-merger price is P (Q̃), where Q̃ = Q−ij + qij +dQ, with dQ = δ = dQdqPM
ijdqPMij . A merger is profitable
if:
πPMij > πi + πj ⇐⇒ P (Q̃)qPMij − P (Q)(qi + qj) > TC(qPMij )− (TC(qi) + TC(qj)) = ∆TC.
Note that ∆TC > 0 since qPMij > qi+ qj , and we have assumed no synergies.36 Next, we can simplify this
expression to:
37
P (Q+ δ)(qi + qj + ε)− P (Q)(qi + qj) > β ⇐⇒ (P (Q+ δ)− P (Q)) (qi + qj) + P (Q+ δ)ε > ∆TC,
⇐⇒ −dP ∗ (qi + qj) + P (Q+ δ)ε = −dP ∗ (qi + qj) + P (Q+ δ)dqPMij > ∆TC,
multiplying both sides by 1dQ∗Q we get:
(−1) ∗ limε→0
(P (Q− ε)− P (Q)
ε
)︸ ︷︷ ︸
positive
. Hence, even though we are dealing with a decreasing change in output, the sign of the
elasticity of demand is as previously expected; however, we note that dQ < 0 here.36Allowing for synergies may reverse this sign. That is, the presence of additional synergies may yield ∆TC < 0 even
when qPMij > qi + qj .37As previously noted, if all firms adjust to reestablish a Cournot equilibrium, then ε > δ > 0 due to the Lemma provided
in Farrell and Shapiro (1990: 111).
36

−dPdQ
(qi + qj)
Q+P (Q+ δ)
Q
dqPMijdQ
>∆TC
dQ ∗Q,
multiplying by QP (Q+δ) :
−(dP
dQ
Q
P
)(qi + qj)
Q+dqPMijdQ
>∆TC
P ∗ dQ,
recognizing that qiQ = si and that we have the price elasticity of demand:38
(si + sj∣∣ηQp
∣∣)
+dqPMijdQ
>∆TC
P ∗ dQ,
multiplying through by P ∗ dQ:
(si + sj∣∣ηQp
∣∣)
(dQ ∗ P ) + dqPMij ∗ P > ∆TC,
and dividing through by 1dqPMij
:
(si + sj∣∣ηQp
∣∣)(
dQ
dqPMij∗ P
)+ P >
∆TC
dqPMij.
Note that dQdqPM
ij= 1 + dQ−i
dqPMij
= 1 + λ where λ ≤ 0. Hence,
P ∗
(1 + (1 + λ)
si + sj∣∣ηQp
∣∣)>
∆TC
dqPMij,
and noting that mr = P ∗ dqPMij , we have:
(1 + λ)si + sj∣∣ηQp
∣∣ >
(∆TC
P ∗ dqPMij− 1
)=
(∆TC −mr
mr
).
Scaling this result over the m common markets of firms i and j, we get the result of Proposition 2. QED.
Appendix B: Relevant Literature on Matching
The study of mergers is, at its core, a study of assignments and matching. General matching games
were first studied by Gale and Shapley (1962), who introduced the concept of pairwise stability within
a matching market and proved existence of pairwise stable equilibria for markets characterized by a
38Note:(dPdQ
QP
)= 1/
(dQdP
Pq
)= 1
ηQp= − 1
|ηQp|
37
bipartite structure (e.g., where men can match only with women within a marriage) and where players
have non-transferable utilities.39
Shapley and Shubik (1972) later showed that many of the results of Gale and Shapley’s marriage
market can be extended to a setting where people instead have transferable utilities (e.g., an environment
where buyers are matched to sellers of a particular good). Within a transferable utility (two-sided and
one-to-one matching) setting, the pairwise stable assignment coincides with the solution of a linear pro-
gramming problem where the objective function is the sum of all individual match payoffs. As such, the
existence of pairwise stable assignments within this type of game is assured by the existence of a solution
to the linear programming problem: a result that was proved by Dantzig (1963).40
While Gale and Shapley (1962) and Shapley and Shubik (1972) focus on deriving existence results for
the case of general preferences, Becker (1973) sets out to use a matching model with far more structured
preferences in order to tease out testable predictions regarding the sorting behavior within the marriage
market. In so doing, Becker also provides a bridge between the previously theoretical work on matching
and its use as a foundation for empirical work. While Becker’s focus was on the marriage market, his
framework is general enough to be applied across any setting where the matching market is characterized
by heterogeneous players, two-sided matching and where there may be strategic interactions between the
players.
The use of a matching model to describe merger activity originates with Hall (1988), who also described
the limitations of utilizing a standard discrete choice model when characterizing mergers.41 In particular,
Hall’s (1988) matching model is an adaptation of Becker’s (1973) marriage market model to the problem
of mergers. It depicts the market for corporate assets as two sided (acquirers and targets) and assumes
the presence of transfers (which the acquirer pays to the target). While transfer prices are endogenous,
a benefit of the matching framework is that these prices are not needed for the analysis. This is because
the transfers can be substituted out of the final inequalities necessary for empirical estimation. Another
39Gale and Shapley (1962) provided a deferred acceptance algorithm for the marriage market, which yields a pairwisestable assignment. This assignment is either man or woman optimal, depending on which side is assumed to be the proposingside of the game. In addition to the marriage problem, the authors also studied the college admission problem (two-sided,one-to-many matching) and the roommate problem (one-sided matching).
40For more details on the literature regarding assignment problems of this type see Chapter 8 in Roth and Sotomayor(1990) and Roth and Sotomayor (1992).
41It is worth reiterating some of the limitations of traditional discrete models that have been noted within the literature.As pointed out by Hall (1988), traditional discrete choice models are unable to accommodate the key features of mergermarkets, such that firms are unique, mergers are two sided, and that competing firms are subject to strategic interactions.These features are important for the purposes of applied work because they present econometric challenges that need tobe considered and addressed. They also suggest that mergers are better thought of within a matching framework than asa one-sided discrete choice problem. In fact, Hall (1988) shows that it is not possible to derive the standard Logit modelsrigorously when the market consists of a finite number of differentiated firms. When estimating the demand for any givenfirm using a discrete choice model, the identification of the demand curve is achieved by assuming an infinite supply of theparticular good at the market price in question. This is clearly an unacceptable assumption when considering mergers andacquisitions. Another (often unstated) assumption in discrete choice models is that there can be no strategic interactionsbetween firms. Furthermore, these models also fail to accommodate the two-sided nature of matches.
38

benefit of the matching approach is that it fully accounts for the features of the merger market. That
is, it is able to accommodate strategic interactions between competing firms because firms are unique
(there is scarcity in terms of good matches) and merger decisions are two-sided. As previously mentioned,
these are features that cannot be accommodated by alternative tools such as traditional discrete choice
models.42
While Hall (1988) presented the first matching model representation of mergers, she did not estimate
her model. Fox (2009) notes that Hall (1988) likely did not estimate her model due to computational
concerns, since, a key difficulty in matching games is that the number of firms or agents within a market
can be very large, and this can make standard maximum likelihood and method of moments estimators
computationally infeasible. Fox (2010a) introduces a maximum score estimator that maximizes the num-
ber of inequalities (implied by pairwise stability).43 This approach gets rid off the computational curse
of dimensionality because not all inequalities need to be included for the estimator to be consistent (see
Fox (2009, 2010a, 2010b)).44
In terms of identification within these models, Fox (2009, 2010b) presents two important results for
matching games with transfers. The first is that the only the relative contribution of complementarities
in payoffs is identified. Within our merger setting this means that we can recover whether, for example,
the merger value is primarily driven by efficiency or market power incentives. The second is that the
ranking of match payoffs is identified. This means that we can use our fitted match value function to rank
order the merger value of all matches. We can also compare the realized merger value with the value from
hypothetical mergers for counterfactual comparisons.45
Following Fox’s contributions, several authors have applied structured matching models to examine
transferable utility scenarios in a variety of settings (Akkus et al. 2015, Baccara et al. 2013, and Levin
2009). Baccara et al. (2013) apply Fox’s estimator to the study of professors’ office choices. The authors
42Parker (2012) further elaborated on restrictions of using a discrete choice model by illustrating how the set of availablemergers changes with each matching. Suppose firms i and j merge. Then firm j will no longer be in the consideration set offirms that might otherwise have had firm j within their choice set. That is, the action of one pair has direct implications onthe possible actions of other firms within the merger market. While this feature is explicitly accounted for within a matchingframework by the consideration of pairwise stable matchings, it is not accounted for when using traditional discrete choicemodels.
43The maximum score estimator was first introduced by Manski (1975).44It should also be noted that in developing his identification results, Fox (2010a, 2010b) provides a generalization of
Becker’s (1973) model to a setting where agents may match over a vector of characteristics, rather than just one feature.45 A few more things are worth noting about the scope and limitation of matching models for empirical work (see Fox
(2010a) for additional details). First, the type of objects that can be recovered differs across many-to-many and other typesof matching settings, such as one-to-one matching. In many-to-many matching, it is possible to recover attributes of eachindividual’s objective function separately. However, for other cases, such as one-to-one matching, one can identify only thesum of these functions (the match production function). Since our interest is in the estimation of the joint merger valueand not with the payoff of each individual firm, this does not impose any restrictions for our estimation. Second, there isan identification issue for this class of models, which is common across all specifications, that is, the inability to identifya parameter on a firm characteristic that is not interacted with the characteristic of any other firm (see Fox (2010a: 15)).While this, again, does not put any restrictions on our choice of model specification, it will generally put restrictions on theset of feasible functional forms that one can use when using a matching model for empirical work.
39

find that it is not only office characteristics, but also friendship/professional networks that impose an
externality upon the choice behavior of the professors.
To our knowledge, only one study to date specifically utilizes Fox’s methodology and estimator within
a merger framework. Akkus et al. (2015) study merger value creation within the banking industry and
perform their estimation using data on observed merger transfers. The authors find that merger value
within this industry arises from cost efficiencies due to economies of scale and scope, additional market
power, and the degree of market overlap between the merging firms. Another interesting finding is that
their matching value function greatly outperforms a traditional logit model in predicting merger forma-
tions. This result, again, highlights the benefit of utilizing a matching framework instead of traditional
discrete choice models for the study of mergers and acquisitions.
40