mergers, foreign collaborations and financial innovations in a global economy international tax...
TRANSCRIPT

Mergers, Foreign Collaborations and Financial Innovations in a Global Economy
International Tax Conference on Cross Border Transactions
Theme Presentation
November 2005

2
Part I: India and the global economy
Part II: The trends
Part III: The Regulatory Framework
Part IV: The Tax Framework
Part V: Concluding Remarks
Agenda

3
Part I: India and the global economy

4
The Drivers of the Global Economy
GDP of BRIC countries, in 2003 US$bn, Source: Goldman Sachs BRIC report
Engines of growth US and Europe are expected to grow at 2-4%
Brazil, Russia, India and China are going to be the next big drivers of the global economy
In less than 40 years, the BRIC companies could be larger than the G6 in dollar terms
Among BRICs, India will be the fastest growing and will rank behind China and USA by 2033
The movement of capital Higher growth will lead to higher returns
Increased demand for capital will mean more fund flows in these countries
Accompanying shifts in spending would provide significant opportunities for global companies
Cumulative FDI InflowIndia has witnessed a strong inflow of FDI in the last 5 years
Source: Reserve Bank of India
-
1,000
2,000
3,000
4,000
5,000
6,000
7,000
FY
199
1
FY
199
2
FY
1993
FY
199
4
FY
1995
FY
199
6
FY
199
7
FY
199
8
FY
1999
FY
200
0
FY
200
1
FY
2002
FY
200
3
FY
2004
-
5,000
10,000
15,000
20,000
25,000
30,000
35,000
40,000Cumulative FDI (USDmn) FDI (USDmn)
5
Why India ?
Sweeping reforms post liberalization
Cost competitiveness
Large scientific research capabilities
Reforms in key growth areas like infrastructure and power
Demographic changes
Indian companies are warming to the concept of shareholder value
6
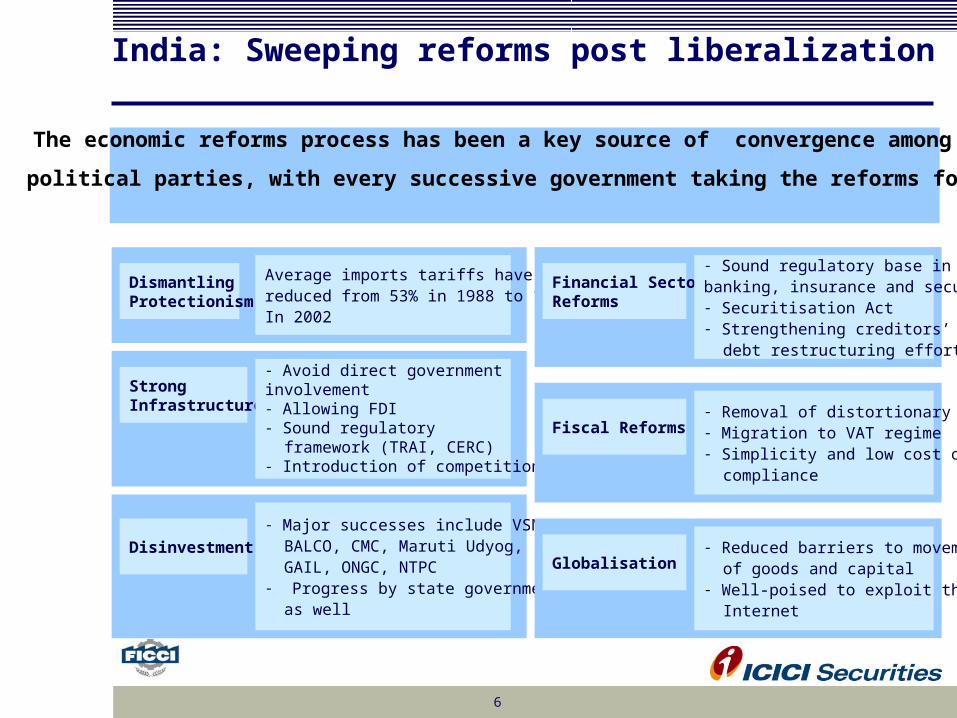
India: Sweeping reforms post liberalization
Dismantling Protectionism
Average imports tariffs have reduced from 53% in 1988 to 18% In 2002
Strong Infrastructure
- Avoid direct government involvement- Allowing FDI- Sound regulatory framework (TRAI, CERC)- Introduction of competition
Disinvestment
- Major successes include VSNL, BALCO, CMC, Maruti Udyog, GAIL, ONGC, NTPC- Progress by state governments as well
Financial SectorReforms
- Sound regulatory base in banking, insurance and securities- Securitisation Act- Strengthening creditors’ rights, debt restructuring efforts
Fiscal Reforms- Removal of distortionary taxes- Migration to VAT regime- Simplicity and low cost of compliance
Globalisation- Reduced barriers to movement of goods and capital- Well-poised to exploit the Internet
The economic reforms process has been a key source of convergence among the
political parties, with every successive government taking the reforms forward

7
India: Cost competitiveness Increasing participation limits for FII and
FDI in different sectors
Lower custom tariffs leading to competition
and lower prices
More than half of cost diff between India &
China is on account of high tariffs and taxes
FTA with Thailand, CECA with SG, moving
towards pact with ASEAN
ChinaIndia Indirecttaxes
Interest costs
LabourProduc-tivity
Others**Import duties*
100 14-164-7 3-4 2-5 2-5
67-72
Price structure comparison between India and China: higher taxes main difference
Source: McKinsey Global Institute, CII
Source: Budget documents
10152025303540455055
FY
96
FY
97
FY
98
FY
99
FY
00
FY
01
FY
02
FY
03
FY
04
FY
05
FY
06
%
Peak Import duty reduced to 15%

8
India: Large scientific research capabilities
More than 100 companies outsource R&D facilities from India
GE, Monsanto, Eli Lily, to name a few have largest facilities outside US, in India
Well established IT and ITES services market with CAGR of > 50% in last 5 yrs
IT exports touch US$ 22bn in 2004, form 20% of total exports (goods+services)
Skilled workforce: 0.36m engineers are certified every year
Source: GOI
0
200
400
600
800
1000
1200
1400
FY 98 FY 99 FY 00 FY 01 FY 02 FY 03
0
0.05
0.1
0.15
0.2
0.25
0.3
0.35
0.4No of engineering colleges (LHS)
Annual enrollment, million (RHS)
Cisco announces US$1.1bn investment in R&D base

9
India: Key reforms in growth areas
Significant milestones in infrastructure developments over last 5 years
New Telecom Policy of 1999 led to rapid penetration of telephony
Government initiated NHDP at a cost of US$13.2bn (Phase 1&2) until 2008– Phase 3 to add another 10,000km by 2012
– Plans to extend further by another 26,000km
Electricity Act 2003 improves investment scenario in power sector– US$ 62bn of investments only in generation until 2012
– Additional investments in T&D and generation could push total to US$150bn
Development of new airports and upgradation of major airports
Private sector participation in ports
Increased investments in mining (oil & gas, coal, minerals)– NELP progressing well
– Private / Foreign participation in iron ore, coal into last lap of evolution

10
Source: India Census 2001
Age profile
India: Demographic changes have ….
Almost half the population is under 25 years Literacy levels among young significantly high Impact of mass media is potent Legacy savings nest of US$600bn+ Time to ditch the adage ‘Indians live poor but die rich’
% of population (2003) 2003 2002
15-19 10.6 84.3 76.1
20-24 10.0 76.9 70.2
25-34 17.1 67.9 57.4
35-44 12.8 58.6 46.9
45+ 18.3 45.2 36.9Source: NRS
Literacy levels
(%) Age group Popn (mn) (%)< 14 363.61 35.3%15-24 189.98 18.5%25-39 228.27 22.2%40-59 167.39 16.3%> 59 79.36 7.7%
11
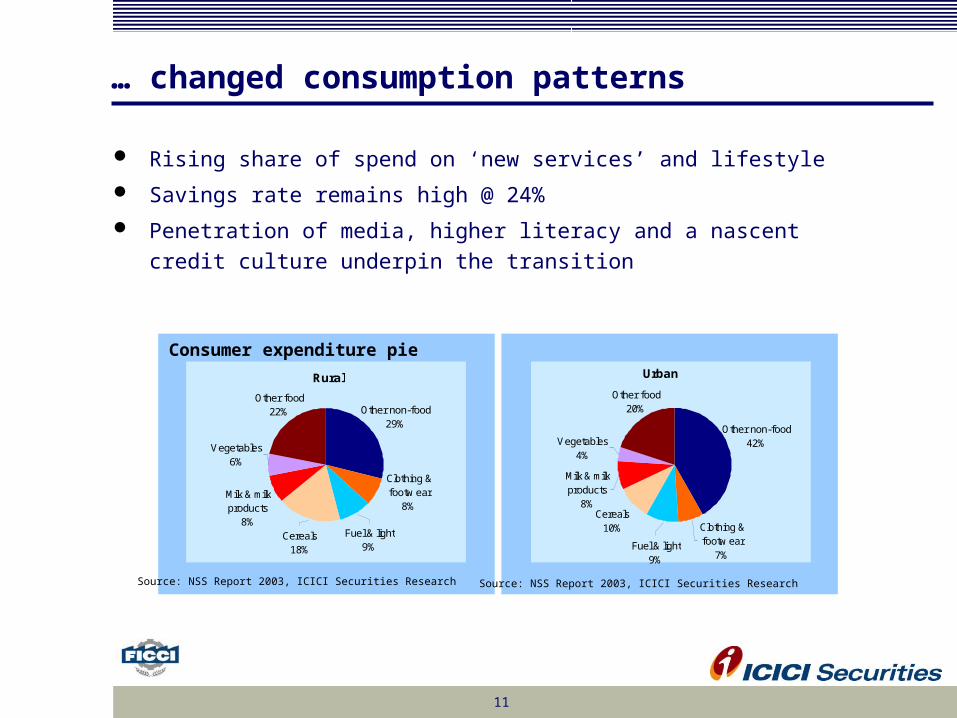
… changed consumption patterns
Rising share of spend on ‘new services’ and lifestyle
Savings rate remains high @ 24%
Penetration of media, higher literacy and a nascent credit culture underpin the
transition
Rural
Other food22%
Vegetables6%
Milk & milk products
8%Cereals
18%
Fuel & light9%
Clothing & footw ear
8%
Other non-food29%
Urban
Other non-food42%
Clothing & footw ear
7%Fuel & light
9%
Cereals10%
Milk & milk products
8%
Vegetables4%
Other food20%
Source: NSS Report 2003, ICICI Securities Research Source: NSS Report 2003, ICICI Securities Research
Consumer expenditure pie

12
India: Unlocking shareholder value
Universal restructuring : Top 100…Midcap 200… down to SMEs
Relearned the mantra post liberalisation: ROCE > WACC !
Focus on de-gearing and free cash flows
Operating rates near peak – Cement, Automobiles, Steel, Mining, Electricity
Well positioned for modular, ‘high yield’ capex phase
Job creation - Manufacturing renaissance
– Textiles, Tourism, Pharma R&D, Ad industry joins IT/ITES in globalisation/ outsourcing
– PSUs : ‘employment boomers’ of 70s’ to retire over next 3-5 years
The ROCE transformation
Source: CMIE; Note: ex IT, Pharma & Banks (BSE 100)
-300
-200
-100
0
100
200
300
400
500
FY96 FY97 FY98 FY99 FY00 FY01 FY02 FY03 FY04
(Rs
bn)
0%
10%
20%
30%
40%
50%
60%
70%
80%FCF Net D/E (RHS) NWC/ Sales (RHS) Capex
Free cash flow mantra
Source: CMIE; Note: ex IT, Pharma & Banks (BSE 100)
0%
2%
4%
6%
8%
10%
12%
14%
16%
18%
20%
FY96 FY97 FY98 FY99 FY00 FY01 FY02 FY03 FY04
RoCE WACC Rf

13
Part II: The trends

14
International Investors have reposed faith in the Indian Economy …
Source: RBI
Source: A T Kearney
FDI Confidence IndexIndia ranks 3rd in global FDI Confidence Index
As per a study conducted by AT Kearney, India ranks among the top 3 in global FDI Confidence Index
Growth opportunities in India have attracted global investors including VC funds and private equity investors
– PE Investments worth over
USD1.75bn in FY2005 (USD 1bn in
1HFY06) and exits of over
USD 545mn (USD 939mn in
1HFY06)
Cumulative FDI InflowIndia has witnessed a strong inflow of FDI in the last 5 years, USD mn
0 0.5 1 1.5 2 2.5
Japan
Italy
HK
Aus
France
Ger
UK
India
USA
China
0
2000
4000
6000
8000
1995-96
1996-97
1997-98
1998-99
1999-00
2000-01
2001-02
2002-03 (R)
2003-04 (P)
2004-05 (P)
-5000
15000
35000
55000
75000
Cumulative FDI FDI

15
… which is reflected in bullish capital markets
Sources: SEBI, www.moneycontrol.com
Performance of Emerging Market Economies
India has delivered superior returns over the last year
Source: Bloomberg, Returns as on Oct 7, 2005
Country Y-o-Y Return PE RatioIndia 51.69% 16.38South Korea 50.38% 12.06Indonesia 15.76% 12.29Hong Kong 12.46% 13.82FTSE 11.91% 13.03Taiwan 6.83% 15.02Thailand 5.98% 10.89Dow Jones 2.36% 16.33Malaysia 1.30% 15.54
Total Equity Holdings of MFs and FIIs
Increased institutional buying in the stock markets
Source: AMFI, SEBI ; Mutual fund data for only pure equity funds
Strong rally in the market in spite of minor hiccups along the way
Superior returns attracting increased FII participation
– Nearly 800 registered FIIs with a
cumulative investment of over USD
39 bn Equity Mutual Funds have emerged
as strong players with AUM of about USD12 bn
-15000
-9000
-3000
3000
9000
15000
21000
Jan-05 Feb-05 Mar-05 Apr-05 May-05 Jun-05 Jul-05 Aug-05 Sep-05
4600
5100
5600
6100
6600
7100
7600
8100
8600FII Inflows MF Inflows Sensex
Stock Markets are Witnessing a Bull Run, USD mn
24.90%19.05%18.37%
75.10%
80.95%
81.63%
0
5
10
15
20
25
30
35
40
45
50
Aug-04 Feb-05 Aug-05USD bn
MF FII

16
India Inc. is on a second wave of investments …
Source: CSO
Industrial and Services GrowthIndustrial growth has complemented growth in services
Source: NCAER, CSO
NCAER BCI and Capital Goods outputCapex is closely related to the Business Confidence Index
Industrial growth catching up with
services after a long gap
– Automobiles, Capital goods,
Engineering & construction, metals
lead industrial growth
Strong correlation between business
confidence index (BCI) and capex
– BCI at record high indicates strong
capex cycle into near future
– Power, Oil & Gas, Metals,
Automobiles, Textiles, Construction
driving investments
50
80
110
140
170
Ma
y-9
3
Ma
y-9
4
Ma
y-9
5
Ma
y-9
6
Ma
y-9
7
Ma
y-9
8
Ma
y-9
9
Ma
y-0
0
Ma
y-0
1
Ma
y-0
2
Ma
y-0
3
Ma
y-0
4
Ma
y-0
5
(In
de
x)
-20
-10
0
10
20
30
40
(% c
hg
Yo
Y)
NCAER BCI Capital goods (RHS)
0
2
4
6
8
10
12
Jun-02
Oct-02
Feb-03
Jun-03
Oct-03
Feb-04
Jun-04
Oct-04
Feb-05
Jun-05
Industry growth Services growth

17
…underpinned by domestic capital raising … Companies are tapping primary
equity markets for financing a
large number of expansion
projects
– A record USD 4.9 bn of equity
raised in FY 05 demonstrating
the depth of markets
– Virtuous cycle of larger IPOs
leading to increasing inflows
by QIBs; especially FIIs
– Primary markets remain active
with a total of USD 1.7 bn
equity raised by 35 companies
in first 6 months of 2005-06
– The primary market will
continue to remain active with
a strong pipeline of issues
expected to hit the market
Source: Prime Database * Data till September 30, 2005
568
4,087
4,915
1,690238232
0
1000
2000
3000
4000
5000
6000
FY 2001 FY 2002 FY 2003 FY 2004 FY 2005 FY 2006*
Issu
e A
mou
nt
0
10
20
30
40
50
No.
of
Issu
es
Issue Amount USD mn No: of issues
Primary Market IssuancesFirst half of 2006 has already witnessed issuances of over USD 1.6 bn with many more issues in the pipeline

18
… and overseas capital raising Overseas fund raising options
– GDR and FCCB gaining significant popularity
Break up of Equity Capital IssuancesSignificant international investor participation through DRs and FCCBs
Source: Prime Database (Excluding Sponsored ADR Issues) * Data till September 30, 2005
84.10%
55.33%
36.60%
3.00%
12.11%
22.77%
12.90%
32.56%40.63%
0%
10%
20%
30%
40%
50%
60%
70%
80%
90%
100%
FY 04 FY 05 FY 06*
IPO/FPO DR FCCB

19
Case Study 1: Reliance Industries Multi-currency Term Loan
US$ 350 mn multi-currency
loan
– Facility consists of a USD,
Euro and JPY tranche
– Syndicated with a consortium
of 34 banks across 13
countries
– Finest pricing among offshore
medium term loans
June 2005
Reliance Industries Limited
Syndication of term loan
USD 350,000,000
June 2005
Reliance Industries Limited
Syndication of term loan
USD 350,000,000

20
Case Study 2: Motherson Sumi’s FCCB
Asia’s first Euro denominated FCCB (deal size
EUR 50 mn)
– Conversion Premium of 50%
– 5 yr, Zero Coupon, Bullet deal with issue at par
– Redemption Premium of 126.77% ; YTM 4.8%
– Call Option after 3 years with 130% hurdle and
no greenshoe
Ideal from the Company’s standpoint
– Currency provides a better match for its cash
flows with nearly two thirds of production
exported
July 2005
Motherson Sumi
FCCB Offering
EUR 50,300,000
July 2005
Motherson Sumi
FCCB Offering
EUR 50,300,000
21
Growth Through Consolidation and Inorganic Expansion: Predatory India Inc Large number of companies in India are looking at achieving growth through
acquisition of companies in the US, Europe and Asia
– Key aspect of acquisition of the customers of the target
– Creation of value through usage of the manufacturing set up at a lower cost Indian
location
– Acquisition of a competency / technology
The potential Indian acquirers are evaluating the available opportunities on the
following criteria
– Reasonably large customer base including blue chip customers
– Established technology
– Reasonable size
– Flexibility towards shifting of operations to India, if required, and a willing management

22
Indian Corporates are Seeking International Acquisition Opportunities to Reach Global Size
Target Name Acquirer Name DateAnnounced Total
Value (USD mn)Industry
Television-tube Business Videocon International Ltd Jun 05 291 Manufacturing
Natsteel Asia Pte Ltd Tata Steel Ltd Aug o4 284 Steel
Flag Telecom Group Ltd Reliance Gateway Net Private Oct 03 191 Telecom
DSI Financial Solutions Pte HCL Technologies Ltd Nov 04 157 Software
Tyco Global Network Videsh Sanchar Nigam Ltd Nov 04 130 Telecom
Tata Daewoo Commercial
Vehicle Co. LtdTata Motors Ltd Nov 03 118 Auto
Trevira Gmbh Reliance Industries Limited Jun 04 97 Textile

23
International Companies are also Seeking a Foothold in the Growing Indian Market
Target Name Acquirer Name DateAnnounced Total Value (USD mn)
Industry
BPL Mobile Cellular Ltd Hutchison Telecommunications Nov 05 1,152 Telecom
I-flex Solutions Ltd Oracle Corp Aug 05 779 Software
Indian Phone Ventures Hutchison Telecommunications Feb 05 592 Telecom
ACC Holcim Jan 05 583 Cement
GECIS Global US Based Private Equity Firms Non 04 500 BPO
Aircel Televentures Ltd Afk Sistema Feb 05 450 Telecom
Flextronics Software Sys Ltd Flextronics Intl Ltd Jun 04 399 Software
Digital Globalsoft Ltd Hewlett-Packard Co Dec 03 304 Applications Software
24
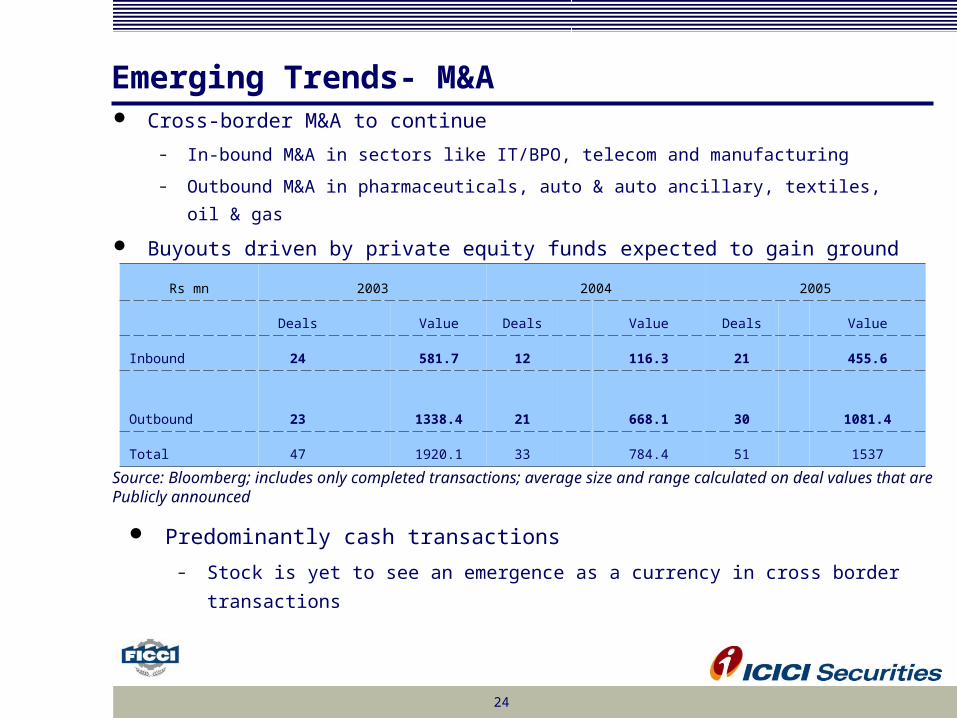
Emerging Trends- M&A Cross-border M&A to continue
– In-bound M&A in sectors like IT/BPO, telecom and manufacturing
– Outbound M&A in pharmaceuticals, auto & auto ancillary, textiles, oil & gas
Buyouts driven by private equity funds expected to gain ground
Rs mn 2003 2004 2005
Deals Value Deals Value Deals Value
Inbound 24 581.7 12 116.3 21 455.6
Outbound 23 1338.4 21 668.1 30 1081.4
Total 47 1920.1 33 784.4 51 1537
Source: Bloomberg; includes only completed transactions; average size and range calculated on deal values that arePublicly announced
Predominantly cash transactions
– Stock is yet to see an emergence as a currency in cross border transactions

25
Emerging Trends- Private Equity
Private Equity boom in emerging
markets
– India’s phenomenal investment
opportunities are attracting the likes
of Carlyle and Blackstone
– Well entrenched capital markets
and ease of transactions ensure
smooth exits for PE players
Buyouts driven by private equity
funds expected to gain ground
526
413
917
197
99
542
-
100
200
300
400
500
600
700
800
900
1,000
Q1-2004 Q2-2004 Q3-2004 Q4-2004 Q1-2005 Q2-2005
Private Equity Investments in India ( US$ mn)
Source: Business Today, August 2005
26
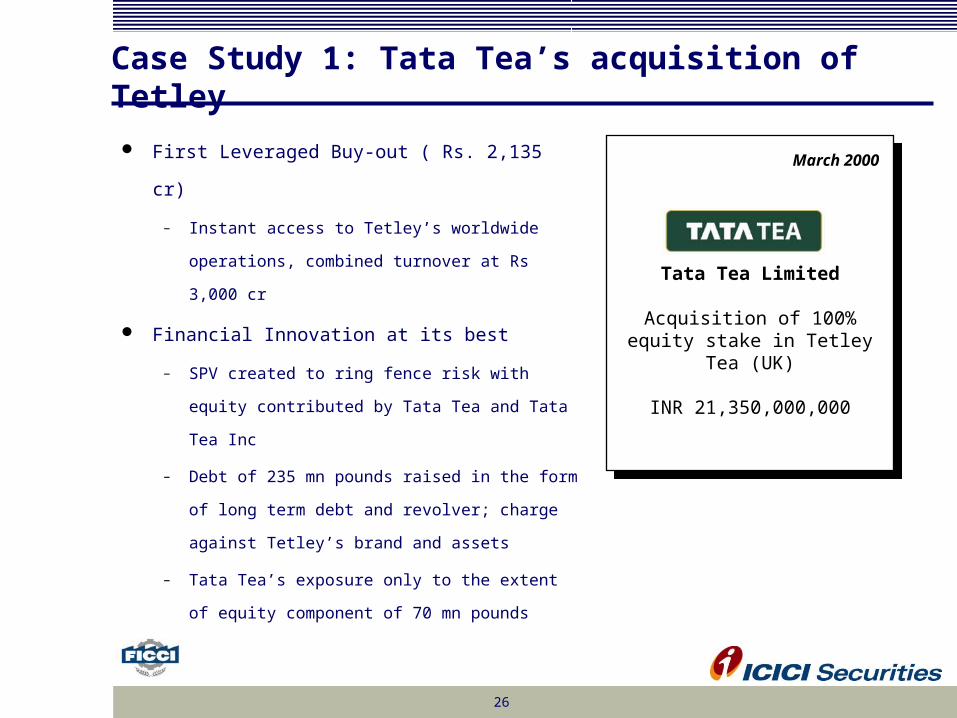
Case Study 1: Tata Tea’s acquisition of Tetley
First Leveraged Buy-out ( Rs. 2,135 cr)
– Instant access to Tetley’s worldwide
operations, combined turnover at Rs 3,000 cr
Financial Innovation at its best
– SPV created to ring fence risk with equity
contributed by Tata Tea and Tata Tea Inc
– Debt of 235 mn pounds raised in the form of
long term debt and revolver; charge against
Tetley’s brand and assets
– Tata Tea’s exposure only to the extent of
equity component of 70 mn pounds
March 2000
Tata Tea Limited
Acquisition of 100% equity stake in Tetley Tea (UK)
INR 21,350,000,000
March 2000
Tata Tea Limited
Acquisition of 100% equity stake in Tetley Tea (UK)
INR 21,350,000,000

27
Case Study 2: Amtek Group’s Global StepsPhase I: Setting up a strong efficient base
Amtek Group is a leading player in auto ancillary
business manufacturing connecting rods,
crankshafts, gear shifter forks, etc
Phase II: Acquires Domain Expertise in a niche
Sets up a joint venture with Benda Kogyo,
Japan for manufacture of flywheel ring gears
and flexplates
Phase III: Acquires Smith Jones, Inc
Acquires Smith Jones, Inc., a leading
manufacturer of flywheel ring gears
– Present in the OEM and replacement market
– Market share of around 40% in the USA
Acquisition catapults Amtek Auto into number
three producer of ring gears in the world and
provides access to key OEM customers
December 2002
Amtek Auto Limited
Acquisition of 100% equity stake in Smith Jones, Inc. (USA)
Rs358,010,000
December 2002
Amtek Auto Limited
Acquisition of 100% equity stake in Smith Jones, Inc. (USA)
Rs358,010,000

28
Case Study 3: Vodafone enters India
Largest investment in the Indian telecom
sector by overseas player (Deal Size: Rs
6700 cr)
– India is the third-largest mobile with 65 mn
subscribers; growth of 54% Y/Y
– Bharti is the fastest-growing mobile market in
Asia with 14 mn subscribers
10% of Bharti at Rs 351/sh with 4.39%
indirectly from Bharti Enterprises and 5.61%
from Warburg Pincus
– Exit for Warburg Pincus who originally
invested US$ 300 mn for 18 % in 1999-2001
September 2005
Bharti Televentures
Sale of 10% equity stake to Vodafone Plc.
Rs 21,350,000,000
September 2005
Bharti Televentures
Sale of 10% equity stake to Vodafone Plc.
Rs 21,350,000,000

29
Part IV: The Regulatory framework

30
Investment in India – Alternatives
Portfolio Investment by institutional investors through Securities and Exchange Board of
India Regulations
– Requires registration with SEBI
Foreign Direct Investment is freely allowed in all sectors including the services sector,
except a few sectors where the existing and notified sectoral policy does not permit FDI
beyond a ceiling
FDI for virtually all items allowed through the automatic route under powers delegated to the
Reserve Bank of India (RBI) and for the remaining items through Government approval
– Government approvals are accorded on the recommendation of the Foreign Investment Promotion
Board (FIPB)
Approval Route – Through FIPB
Automatic Route – Through RBI
Foreign Direct Investment
Foreign Direct Investment
Portfolio InvestmentInvestment In India by
Foreigners

31
Investment in Existing Companies
If the investment is made in a listed entity, the Acquirer needs to comply with
various provisions of Securities and Exchange Board of India (Substantial
Acquisition of Shares and Takeovers) Regulations, 1997
Listed entity
Unlisted entity
Fair valuation of shares to be performed by a chartered accountant as per the
Guidelines issued by the Controller of Capital Issues
Listed entity
Unlisted entity
Investment in Existing Company

32
Easing of Government Approval Process
FDI limits being eased up
– 100% in all infrastructure projects, drugs and pharmaceuticals, hotels and tourism, etc
– Currently at 74% in banking, telecom services, exploration and mining
– 49% in civil aviation
– 26% in insurance
Foreign investment approval through FIPB route do not require any further clearance from RBI for the purpose of receiving inward remittance and issue of shares to foreign investors
– RBI Notification:
Notification by the company to the RBI within 30 days of receipt of inward remittances
Filing the required documentation within 30 days after issue of shares

33
Part V: The Tax framework

34
Tax Regime – Taxing the Corporate
Dividend Distribution Tax – 14.025%– DDT : 12.5% plus surcharge: 10% plus
cess: 2%
A minimum alternate tax under Section 115 JB(7.5% plus 2.5% plus 2.0%) is also imposed
Fringe Benefit Tax – 30.6% FBT: 30% plus cess: 2% on certain
percentages of expenditure
Foreign Company – 41.82%– Income tax: 40% plus surcharge: 2.5%
plus cess: 2%
The Indian
Corporate
Domestic Company – 33.66%
Income tax: 30% plus surcharge: 10%
plus cess: 2%

35
Tax Regime – Issues
Carry Forward of Losses Can be carried forward and set off
against future profits up to 8 years No carry backward of business
losses
Securities Transaction tax (STT)
STT levied at 0.02%
Abolition of long-term capital gains
Need to cover
– Share buy-back
– Shares transferred under open offer
– Sale/transfer of shares under SEBI
approved routes
Special Tax Treatment 100% Tax exemption for Export
Oriented Units (EOUs)
Facilitation of R&D
Weighted deduction benefit for
biotechnology, drugs and
pharmaceuticals
Tax advantage of 7-8% as against
35% in developed countries
36
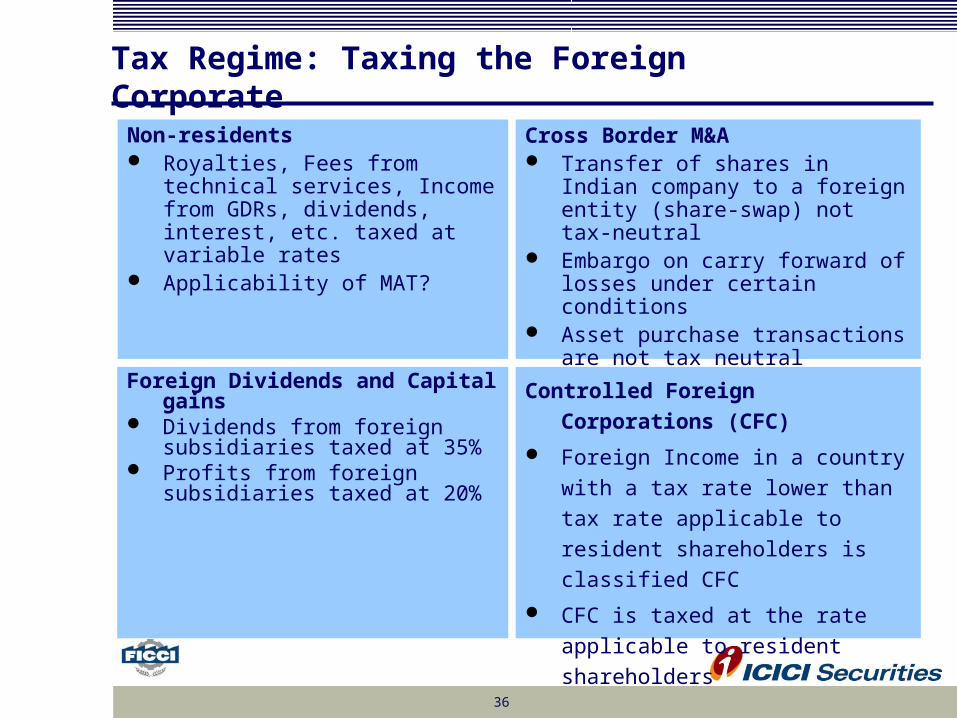
Tax Regime: Taxing the Foreign Corporate
Non-residents Royalties, Fees from technical
services, Income from GDRs, dividends, interest, etc. taxed at variable rates
Applicability of MAT?
Foreign Dividends and Capital gains Dividends from foreign subsidiaries
taxed at 35% Profits from foreign subsidiaries
taxed at 20%
Controlled Foreign Corporations
(CFC)
Foreign Income in a country with a
tax rate lower than tax rate
applicable to resident shareholders
is classified CFC
CFC is taxed at the rate applicable to
resident shareholders
Cross Border M&A Transfer of shares in Indian
company to a foreign entity (share-swap) not tax-neutral
Embargo on carry forward of losses under certain conditions
Asset purchase transactions are not tax neutral

37
Part VI: Concluding Remarks

38
Recap
The borders in a global economy are becoming seamless
– India occupies a favorable place for foreign investment
– Indian corporates are looking at opportunities abroad
– Financial innovation has spawned a host of products
The Regulatory and the Tax framework
– Foreign Investment in the form of FII/FDI
– FII Investment requires SEBI registration
– FDI Investment through (a) approval and (b) automatic route
– Indian and Foreign corporates taxed differently
– Tax structure needs to be streamlined to facilitate cross border transactions