merino bloodlines: a comparison based on wether … bloodline performance: a comparison based on...
TRANSCRIPT
Merino bloodlines: a comparison based on wether trial results 2006 - 2016June 2016 Primefact 1472 S Hatcher, SI Mortimer, BCD Wilson and RP Graham Sheep Industries Unit
Introduction The relative performance of commonly used Merino bloodlines has been updated with the 2016 analysis of 25 wether trials conducted in NSW (23), Victoria (1) and Tasmania (1) and one ewe productivity trial located in WA between 2006 and 2016.
The 2006 – 2016 Merino Bloodline Performance information is presented as follows:
• Table 1 describes the presentation of the traits and provides an explanation of the Table 2 headings.
• Table 2 reports 77 bloodlines for the 11 individual traits and two financial performance indicators.
• Figure 1 depicts the clean fleece weight and fibre diameter performance of each bloodline listed in Table 2.
• Figure 2 shows the range in liveweight and fibre diameter of the 77 bloodlines.
• Figure 3 shows the performance of (a) staple strength, (b) staple length, (c) style and (d) colour versus fibre diameter.
• Table 3 contains the median wool prices used to determine the financial performance of the bloodlines.
• Figure 4 depicts the deviations in financial performance of the bloodlines, calculated as $/head, and fibre diameter.
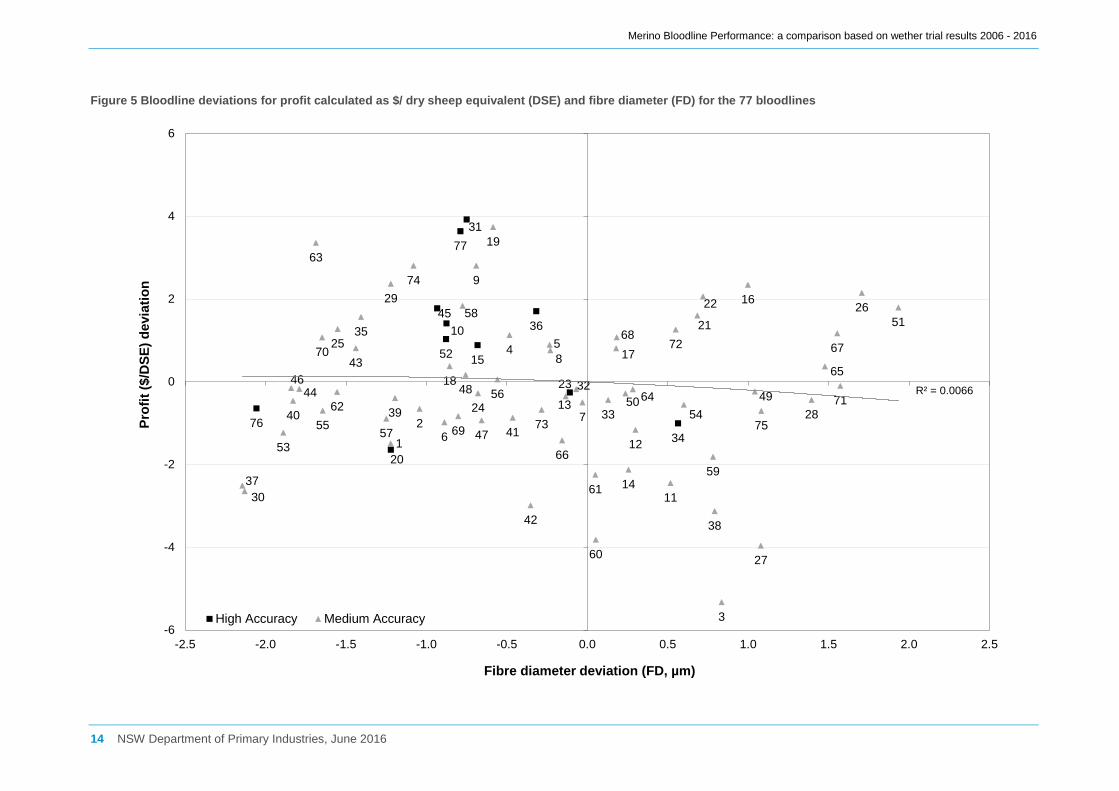
• Figure 5 represents the deviations in financial performance of the bloodlines, calculated as $/dry sheep equivalent (DSE), and fibre diameter.
• Figure 6 shows the deviations in financial performance ($/DSE) with clean fleece weight.
• Figure 7 represents the deviations in financial performance ($/DSE) with liveweight.
The trends The relative performance of 77 bloodlines involved in wether and ewe comparisons across Australia are provided for clean fleece weight, fibre diameter, liveweight and both objectively measured (staple length and staple strength) and assessed wool quality traits (style and colour). Fibre diameter and clean fleece weight stability traits, which quantify the annual changes in these two traits with age, are also presented along with two measures of financial performance of the bloodlines, expressed on a $/head and $/DSE basis. A measure of the variability in financial performance of the bloodlines has been included in the 2016 analysis. The standard deviation of profit provides an indication of the variation around the average profit on both a $/hd and $/DSE basis.
The 77 bloodlines reported in this Primefact have information that is of high to medium accuracy. Only those bloodlines with a standard error of less than 3% for clean fleece weight are reported, which ensures the reliability of the relative performance of each bloodline.
The previous 2004 - 2014 analysis (Primefact 1381), reported data from 22 trials with 1 high and 70 medium accuracy bloodlines. Compared with the previous analysis, there are 57 common and 20 new bloodlines represented in the 2016 analysis.
Merino Bloodline Performance: a comparison based on wether trial results 2006 - 2016
2 NSW Department of Primary Industries, June 2016
The Genetic Differences The relative performance of each of the teams of sheep in the different wether and ewe trials is a combination of the genetics of the sheep and the environment in which they were run. For any group of sheep, the performance we can see and measure (the phenotype) is a result of their genetics and the environment in which they have been raised. This is represented by the following equation:
Phenotype = Genetics + Environment
The Merino Bloodline Performance analysis removes the differences in environments between years in a trial and between trials. Bloodlines with multiple teams, both within and across trials, provide the linkage that allows variation between trials and across years within a trial to be accounted for, leaving only the genetic differences between bloodlines.
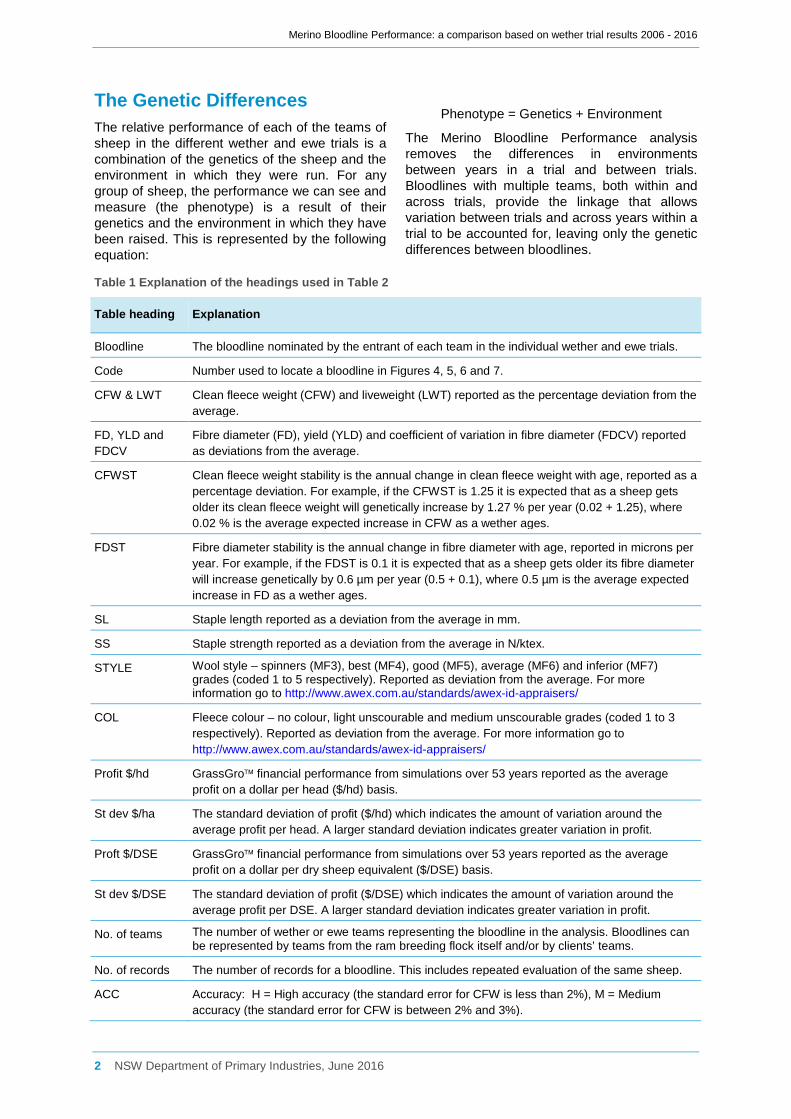
Table 1 Explanation of the headings used in Table 2
Table heading Explanation
Bloodline The bloodline nominated by the entrant of each team in the individual wether and ewe trials.
Code Number used to locate a bloodline in Figures 4, 5, 6 and 7.
CFW & LWT Clean fleece weight (CFW) and liveweight (LWT) reported as the percentage deviation from the average.
FD, YLD and FDCV
Fibre diameter (FD), yield (YLD) and coefficient of variation in fibre diameter (FDCV) reported as deviations from the average.
CFWST Clean fleece weight stability is the annual change in clean fleece weight with age, reported as a percentage deviation. For example, if the CFWST is 1.25 it is expected that as a sheep gets older its clean fleece weight will genetically increase by 1.27 % per year (0.02 + 1.25), where 0.02 % is the average expected increase in CFW as a wether ages.
FDST Fibre diameter stability is the annual change in fibre diameter with age, reported in microns per year. For example, if the FDST is 0.1 it is expected that as a sheep gets older its fibre diameter will increase genetically by 0.6 µm per year (0.5 + 0.1), where 0.5 µm is the average expected increase in FD as a wether ages.
SL Staple length reported as a deviation from the average in mm.
SS Staple strength reported as a deviation from the average in N/ktex.
STYLE Wool style – spinners (MF3), best (MF4), good (MF5), average (MF6) and inferior (MF7) grades (coded 1 to 5 respectively). Reported as deviation from the average. For more information go to http://www.awex.com.au/standards/awex-id-appraisers/
COL Fleece colour – no colour, light unscourable and medium unscourable grades (coded 1 to 3 respectively). Reported as deviation from the average. For more information go to http://www.awex.com.au/standards/awex-id-appraisers/
Profit $/hd GrassGro financial performance from simulations over 53 years reported as the average profit on a dollar per head ($/hd) basis.
St dev $/ha The standard deviation of profit ($/hd) which indicates the amount of variation around the average profit per head. A larger standard deviation indicates greater variation in profit.
Proft $/DSE GrassGro financial performance from simulations over 53 years reported as the average profit on a dollar per dry sheep equivalent ($/DSE) basis.
St dev $/DSE The standard deviation of profit ($/DSE) which indicates the amount of variation around the average profit per DSE. A larger standard deviation indicates greater variation in profit.
No. of teams The number of wether or ewe teams representing the bloodline in the analysis. Bloodlines can be represented by teams from the ram breeding flock itself and/or by clients’ teams.
No. of records The number of records for a bloodline. This includes repeated evaluation of the same sheep.
ACC Accuracy: H = High accuracy (the standard error for CFW is less than 2%), M = Medium accuracy (the standard error for CFW is between 2% and 3%).
Merino Bloodline Performance: a comparison based on wether trial results 2006 - 2016
3 NSW Department of Primary Industries, June 2016
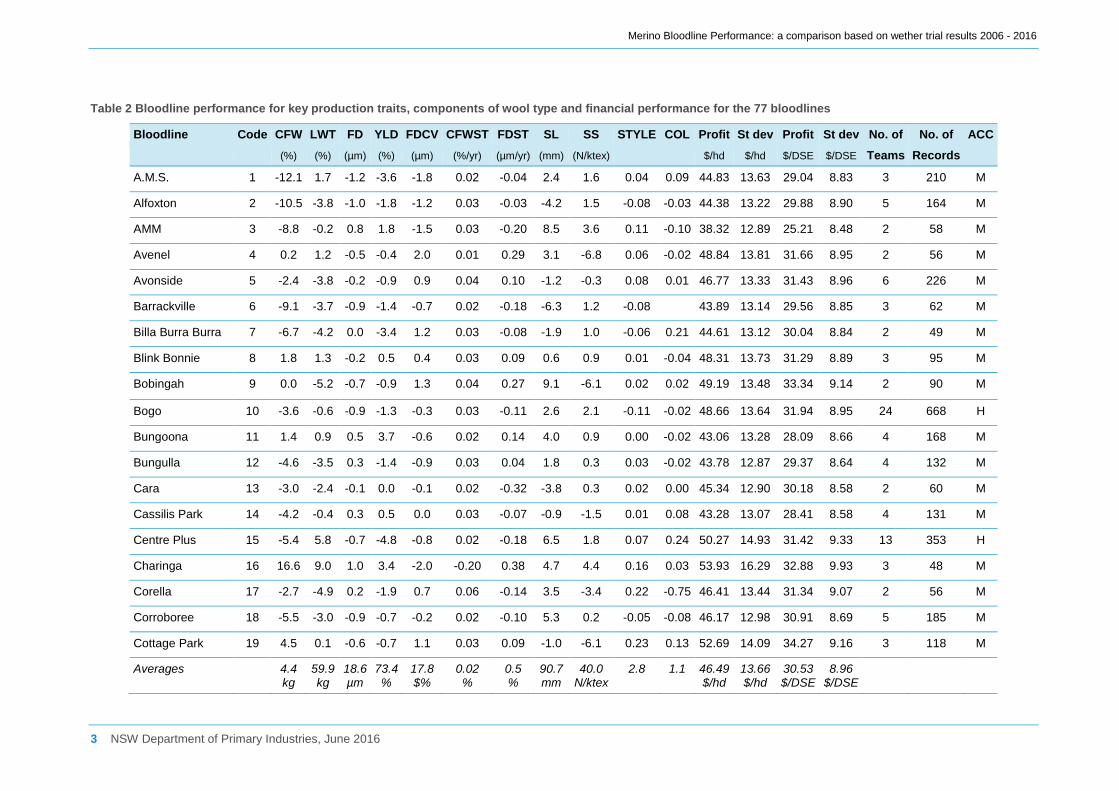
Table 2 Bloodline performance for key production traits, components of wool type and financial performance for the 77 bloodlines
Bloodline Code CFW LWT FD YLD FDCV CFWST FDST SL SS STYLE COL Profit St dev Profit St dev No. of No. of ACC
(%) (%) (µm) (%) (µm) (%/yr) (µm/yr) (mm) (N/ktex) $/hd $/hd $/DSE $/DSE Teams Records
A.M.S. 1 -12.1 1.7 -1.2 -3.6 -1.8 0.02 -0.04 2.4 1.6 0.04 0.09 44.83 13.63 29.04 8.83 3 210 M
Alfoxton 2 -10.5 -3.8 -1.0 -1.8 -1.2 0.03 -0.03 -4.2 1.5 -0.08 -0.03 44.38 13.22 29.88 8.90 5 164 M
AMM 3 -8.8 -0.2 0.8 1.8 -1.5 0.03 -0.20 8.5 3.6 0.11 -0.10 38.32 12.89 25.21 8.48 2 58 M
Avenel 4 0.2 1.2 -0.5 -0.4 2.0 0.01 0.29 3.1 -6.8 0.06 -0.02 48.84 13.81 31.66 8.95 2 56 M
Avonside 5 -2.4 -3.8 -0.2 -0.9 0.9 0.04 0.10 -1.2 -0.3 0.08 0.01 46.77 13.33 31.43 8.96 6 226 M
Barrackville 6 -9.1 -3.7 -0.9 -1.4 -0.7 0.02 -0.18 -6.3 1.2 -0.08 43.89 13.14 29.56 8.85 3 62 M
Billa Burra Burra 7 -6.7 -4.2 0.0 -3.4 1.2 0.03 -0.08 -1.9 1.0 -0.06 0.21 44.61 13.12 30.04 8.84 2 49 M
Blink Bonnie 8 1.8 1.3 -0.2 0.5 0.4 0.03 0.09 0.6 0.9 0.01 -0.04 48.31 13.73 31.29 8.89 3 95 M
Bobingah 9 0.0 -5.2 -0.7 -0.9 1.3 0.04 0.27 9.1 -6.1 0.02 0.02 49.19 13.48 33.34 9.14 2 90 M
Bogo 10 -3.6 -0.6 -0.9 -1.3 -0.3 0.03 -0.11 2.6 2.1 -0.11 -0.02 48.66 13.64 31.94 8.95 24 668 H
Bungoona 11 1.4 0.9 0.5 3.7 -0.6 0.02 0.14 4.0 0.9 0.00 -0.02 43.06 13.28 28.09 8.66 4 168 M
Bungulla 12 -4.6 -3.5 0.3 -1.4 -0.9 0.03 0.04 1.8 0.3 0.03 -0.02 43.78 12.87 29.37 8.64 4 132 M
Cara 13 -3.0 -2.4 -0.1 0.0 -0.1 0.02 -0.32 -3.8 0.3 0.02 0.00 45.34 12.90 30.18 8.58 2 60 M
Cassilis Park 14 -4.2 -0.4 0.3 0.5 0.0 0.03 -0.07 -0.9 -1.5 0.01 0.08 43.28 13.07 28.41 8.58 4 131 M
Centre Plus 15 -5.4 5.8 -0.7 -4.8 -0.8 0.02 -0.18 6.5 1.8 0.07 0.24 50.27 14.93 31.42 9.33 13 353 H
Charinga 16 16.6 9.0 1.0 3.4 -2.0 -0.20 0.38 4.7 4.4 0.16 0.03 53.93 16.29 32.88 9.93 3 48 M
Corella 17 -2.7 -4.9 0.2 -1.9 0.7 0.06 -0.14 3.5 -3.4 0.22 -0.75 46.41 13.44 31.34 9.07 2 56 M
Corroboree 18 -5.5 -3.0 -0.9 -0.7 -0.2 0.02 -0.10 5.3 0.2 -0.05 -0.08 46.17 12.98 30.91 8.69 5 185 M
Cottage Park 19 4.5 0.1 -0.6 -0.7 1.1 0.03 0.09 -1.0 -6.1 0.23 0.13 52.69 14.09 34.27 9.16 3 118 M
Averages 4.4 kg
59.9 kg
18.6 µm
73.4 %
17.8 $%
0.02 %
0.5 %
90.7 mm
40.0 N/ktex
2.8 1.1 46.49 $/hd
13.66 $/hd
30.53 $/DSE
8.96 $/DSE

Merino Bloodline Performance: a comparison based on wether trial results 2006 - 2016
4 NSW Department of Primary Industries, June 2016
Bloodline Code CFW LWT FD YLD FDCV CFWST FDST SL SS STYLE COL Profit St dev Profit St dev No. of No. of ACC (%) (%) (µm) (%) (µm) (%/yr) (µm/yr) (mm) (N/ktex) $/hd $/hd $/DSE $/DSE Teams Records
Cressbrook 20 -8.1 -1.2 -1.2 0.3 -1.1 0.02 -0.10 -2.8 2.1 -0.19 -0.04 43.61 12.98 28.89 8.60 15 535 H
Darriwell 21 3.8 0.9 0.7 -0.8 0.5 0.02 0.12 2.0 1.5 0.25 0.35 49.64 14.48 32.13 9.38 3 95 M
East Loddon 22 11.3 6.8 0.7 1.8 -0.7 -0.19 0.37 -1.5 2.1 0.24 0.00 52.40 15.94 32.60 9.92 3 50 M
Egelabra 23 -2.5 -0.3 -0.1 -0.7 -0.2 0.03 -0.16 2.1 0.1 0.01 -0.02 46.16 13.27 30.28 8.71 18 740 H
Ellerina 24 -6.0 -5.8 -0.7 -0.5 0.4 0.02 0.04 -1.6 -3.1 -0.11 -0.10 44.26 12.88 30.26 8.81 2 46 M
Fosterfield 25 -8.2 -1.8 -1.6 -2.5 -0.4 0.02 0.00 0.9 0.6 -0.20 -0.06 47.99 13.46 31.81 8.92 2 75 M
Glen Donald 26 3.1 3.9 1.7 -3.2 0.6 0.04 0.31 1.0 0.6 0.29 0.06 51.67 15.53 32.68 9.83 3 48 M
Glendemar 27 -6.8 5.7 1.1 -0.1 -0.8 0.02 -0.12 16.9 4.8 0.44 0.19 42.12 14.77 26.57 9.32 2 73 M
Gowandale 28 6.3 3.6 1.4 2.6 -0.3 0.03 0.88 10.0 0.8 0.04 -0.03 47.23 14.74 30.10 9.39 3 48 M
Grassy Creek 29 -5.8 0.1 -1.2 -4.0 -0.7 0.03 -0.08 -2.1 3.4 -0.03 50.51 14.01 32.90 9.13 3 92 M
Grathlyn 30 -19.1 -7.0 -2.1 -2.9 -0.8 0.04 -0.22 -13.5 -2.8 -0.18 -0.01 40.21 12.34 27.89 8.56 2 74 M
Greendale 31 2.1 -2.9 -0.7 -1.6 0.7 0.03 0.00 1.2 -1.9 0.06 0.04 51.79 13.66 34.46 9.08 15 473 H
Greenland 32 -4.2 -2.0 -0.1 -2.5 0.2 0.02 -0.21 -6.9 1.2 -0.17 -0.02 45.76 13.08 30.36 8.67 3 132 M
Grogansworth 33 0.9 -0.3 0.1 1.2 1.7 0.03 0.02 3.0 -4.2 0.07 0.07 45.91 13.24 30.09 8.68 6 222 M
Haddon Rig 34 -0.7 -0.5 0.6 -0.1 0.6 0.02 0.06 -0.9 -0.7 0.07 0.09 45.01 13.56 29.53 8.89 16 690 H
Havilah North 35 -5.1 -0.7 -1.4 -1.5 -1.0 0.03 -0.10 -4.0 0.2 -0.18 0.01 48.80 13.65 32.10 8.98 2 89 M
Hazeldean 36 0.2 -1.0 -0.3 -0.8 0.6 0.04 0.11 6.0 -2.8 0.10 -0.02 49.14 13.52 32.24 8.87 29 1067 H
Karori 37 -17.1 -7.0 -2.1 -1.4 -1.4 0.00 -0.34 -5.3 0.8 -0.45 -0.08 40.37 12.34 28.02 8.57 3 101 M
Leahcim Poll 38 -5.2 3.6 0.8 -0.3 -0.1 0.05 -0.12 8.0 5.4 0.16 -0.10 42.86 14.05 27.41 8.98 2 52 M
Longford 39 -7.5 0.4 -1.2 -0.9 -1.4 0.01 -0.21 -1.9 0.2 -0.20 -0.02 46.08 13.48 30.14 8.82 3 90 M
Averages 4.4 kg
59.9 kg
18.6 µm
73.4 %
17.8 $%
0.02 %
0.5 %
90.7 mm
40.0 N/ktex
2.8 1.1 46.49 $/hd
13.66 $/hd
30.53 $/DSE
8.96 $/DSE

Merino Bloodline Performance: a comparison based on wether trial results 2006 - 2016
5 NSW Department of Primary Industries, June 2016
Bloodline Code CFW LWT FD YLD FDCV CFWST FDST SL SS STYLE COL Profit St dev Profit St dev No. of No. of ACC
(%) (%) (µm) (%) (µm) (%/yr) (µm/yr) (mm) (N/ktex) $/hd $/hd $/DSE $/DSE Teams Records
Lorelmo 40 -9.3 -2.2 -1.8 -0.6 -1.0 0.02 -0.21 -1.2 0.8 -0.13 0.05 45.02 13.06 30.07 8.73 3 90 M
Merrignee 41 -8.4 -4.7 -0.5 -1.4 -0.5 0.03 -0.70 -0.5 0.7 -0.09 0.04 43.74 12.88 29.67 8.74 2 51 M
Merrinjuck 42 -15.8 -5.2 -0.4 -4.9 -0.4 0.01 -0.47 -10.6 -1.2 0.01 -0.13 40.50 12.52 27.55 8.51 2 60 M
Merryshiels 43 -9.1 -0.7 -1.4 -3.1 -1.6 0.03 -0.11 3.2 0.0 0.02 -0.06 47.65 13.54 31.35 8.91 2 59 M
Merryville 44 -12.5 -4.6 -1.8 -1.9 -0.4 0.03 -0.23 -10.3 -1.2 -0.23 -0.07 44.74 13.15 30.36 8.93 11 306 M
Middle View 45 -4.8 -1.8 -0.9 -2.2 -0.3 0.03 -0.14 -5.1 1.1 -0.13 -0.05 48.77 13.44 32.31 8.90 14 456 H
Mt Buffalo 46 -13.5 -4.7 -1.8 -3.7 -0.4 0.01 -0.27 -11.6 -5.7 -0.11 -0.04 44.83 13.22 30.38 8.96 2 42 M
Myocum 47 -8.8 -3.4 -0.7 -2.4 -0.4 0.03 -0.10 -7.1 1.7 -0.15 -0.04 44.09 12.68 29.60 8.52 3 121 M
Nerstane 48 -4.4 -2.7 -0.8 -0.5 -0.9 0.01 -0.09 5.8 2.3 -0.04 0.02 45.92 12.99 30.70 8.69 9 326 M
One Oak 49 4.7 2.7 1.0 1.9 0.3 0.02 0.00 5.6 -1.3 0.11 0.01 47.25 14.52 30.30 9.31 8 207 M
One Oak No 2 50 0.7 1.5 0.2 0.0 0.6 0.01 -0.14 2.8 2.0 -0.12 -0.02 46.77 13.74 30.25 8.89 2 90 M
Panorama 51 13.1 7.3 1.9 2.8 -0.9 -0.20 0.38 5.9 1.0 0.12 -0.02 52.14 16.37 32.33 10.15 3 46 M
Pastora 52 -3.8 1.4 -0.9 -1.8 0.0 0.02 -0.06 -0.3 -0.2 -0.01 0.02 48.79 13.94 31.56 9.02 47 1589 H
Pomanara 53 -13.6 -3.0 -1.9 -1.6 -0.3 0.01 -0.20 -13.0 -2.9 -0.26 -0.08 43.61 12.81 29.30 8.61 2 44 M
Pooginook 54 2.8 1.3 0.6 1.8 0.3 0.03 0.09 4.9 0.4 0.12 0.22 46.24 13.93 29.98 9.03 9 272 M
Quamby Park Poll 55 -8.6 -2.3 -1.6 -0.1 -0.9 0.02 -0.30 -7.7 0.7 -0.12 -0.08 44.60 12.95 29.84 8.66 2 73 M
Rockdale 56 -3.2 0.2 -0.6 -0.6 0.2 0.02 -0.31 1.2 1.7 0.03 0.12 46.80 13.44 30.59 8.79 3 77 M
Rogara 57 -7.7 -0.1 -1.2 -0.3 -1.0 0.03 -0.27 -5.4 2.1 -0.08 -0.03 45.16 13.32 29.65 8.74 2 50 M
Roseville Park 58 -2.2 0.2 -0.8 -1.7 0.2 0.03 0.21 0.0 -2.0 0.00 0.01 49.62 13.81 32.37 9.01 8 270 M
Averages 4.4 kg
59.9 kg
18.6 µm
73.4 %
17.8 $%
0.02 %
0.5 %
90.7 mm
40.0 N/ktex
2.8 1.1 46.49 $/hd
13.66 $/hd
30.53 $/DSE
8.96 $/DSE

Merino Bloodline Performance: a comparison based on wether trial results 2006 - 2016
6 NSW Department of Primary Industries, June 2016
Bloodline Code CFW LWT FD YLD FDCV CFWST FDST SL SS STYLE COL Profit St dev Profit St dev No. of No. of ACC
(%) (%) (µm) (%) (µm) (%/yr) (µm/yr) (mm) (N/ktex) $/hd $/hd $/DSE $/DSE Teams Records
Roxanna Poll 59 -1.1 0.2 0.8 1.4 0.5 0.03 0.12 0.0 0.6 0.32 0.04 43.91 13.59 28.72 8.89 3 138 M
Salt Creek 60 -7.4 -0.5 0.1 1.3 0.6 0.02 -0.58 -6.2 0.6 0.08 -0.03 40.53 12.62 26.72 8.32 3 47 M
Severn Park 61 -4.1 2.4 0.1 0.1 -0.8 0.03 0.02 5.8 0.5 0.14 -0.15 43.91 13.46 28.29 8.67 7 262 M
Shalimar Park 62 -8.9 -1.2 -1.6 -0.6 -0.8 0.02 -0.22 -6.5 -0.5 -0.30 -0.04 45.69 13.22 30.29 8.77 4 120 M
Tallawong 63 -3.0 -2.9 -1.7 -1.1 -0.7 0.03 -0.10 3.0 0.7 -0.14 0.01 50.80 13.62 33.89 9.08 9 278 M
The Lagoons 64 -0.6 -0.4 0.3 -0.9 0.2 0.03 -0.08 -0.1 -1.2 -0.11 -0.06 46.34 13.58 30.35 8.90 3 84 M
Towalba 65 2.1 -0.8 1.5 -0.3 2.5 0.03 0.70 2.2 -4.9 0.02 0.00 47.08 14.18 30.91 9.31 2 77 M
Wallaloo Park 66 -4.0 -0.3 -0.2 -0.1 -0.6 0.03 -0.01 7.5 0.8 0.16 0.22 44.36 13.08 29.12 8.58 3 89 M
Wanganella 67 12.1 7.0 1.6 2.6 -0.6 -0.19 0.37 1.7 1.0 0.16 0.03 51.00 16.09 31.70 10.00 3 45 M
Wantana 68 -1.9 -3.3 0.2 -2.6 0.8 0.04 -0.04 -0.4 0.3 0.06 0.12 47.35 13.30 31.61 8.88 3 102 M
West Vale 69 -7.4 -5.6 -0.8 0.0 -0.1 0.02 -0.18 -7.5 0.5 -0.23 -0.08 43.45 12.82 29.70 8.77 4 120 M
Weston Park 70 -11.5 -4.4 -1.6 -4.3 -0.2 0.02 -0.53 -5.3 -2.6 -0.05 -0.04 46.80 13.47 31.61 9.09 3 66 M
Willandra 71 11.0 5.4 1.6 4.6 0.3 0.01 0.03 2.2 1.8 0.01 48.34 15.23 30.44 9.59 2 56 M
Woodpark 72 8.6 7.5 0.6 0.4 -2.1 -0.23 -0.29 4.3 2.7 0.10 -0.02 51.35 15.84 31.80 9.81 3 46 M
Woodpark Poll 73 -2.8 3.7 -0.3 -1.4 0.0 0.02 -0.12 2.5 -0.2 0.07 0.25 46.82 13.99 29.86 8.92 9 248 M
Woolaroo 74 -2.2 -2.0 -1.1 -1.7 0.7 0.03 -0.19 -4.5 -1.3 -0.13 -0.02 50.29 13.64 33.34 9.04 11 373 M
Wyuna 75 0.4 -2.7 1.1 1.6 1.0 0.02 0.24 2.5 -2.6 0.36 0.24 44.78 13.49 29.83 8.98 2 75 M
Yalgoo 76 -12.4 -3.6 -2.1 -1.0 -1.3 0.02 -0.22 -3.1 1.3 -0.10 -0.08 44.36 13.34 29.89 8.99 12 363 H
Yarrawonga 77 0.3 -1.8 -0.8 -2.2 0.3 0.01 -0.15 1.9 -1.1 -0.03 -0.02 51.73 13.76 34.17 9.09 10 346 H
Averages 4.4 kg
59.9 kg
18.6 µm
73.4 %
17.8 $%
0.02 %
0.5 %
90.7 mm
40.0 N/ktex
2.8 1.1 46.49 $/hd
13.66 $/hd
30.53 $/DSE
8.96 $/DSE

Merino Bloodline Performance: a comparison based on wether trial results 2006 - 2016
7 NSW Department of Primary Industries, June 2016
Clean fleece weight vs. fibre diameter The distribution of bloodlines based on clean fleece weight and fibre diameter is depicted in Figure 1. The high accuracy bloodlines are represented by the dark squares and the medium accuracy bloodlines by the grey triangles. Moving from right to left identifies bloodlines with lower fibre diameter, while moving from bottom to top identifies those with higher fleece weights.
Each bloodline is represented by a code that can be matched with the bloodline named in Table 2 which is reported in alphabetical and code order.
Table 2 provides detailed results for clean fleece weight, fibre diameter, liveweight and wool quality traits including both fibre diameter and clean fleece weight stability traits. The average performance for all bloodlines (high and medium accuracies) is reported at the bottom of each page in Table 2
The average values for clean fleece weight and fibre diameter for the bloodlines from the 2016 analysis were 4.4 kg and 18.6 µm respectively. Note that it is not advisable to use these average values to define bloodline performance as the actual performance of a bloodline for clean fleece weight and fibre diameter will vary according to the environment in which the sheep are run.
There was a strong relationship between clean fleece weight and fibre diameter across bloodlines (Figure 1), with clean fleece weight tending to increase by 5 % with every 1 µm increase in fibre diameter. However, there was significant genetic variation in clean fleece weight across the fibre diameter range, particularly within plus or minus 1 µm of the average fibre diameter, where there were differences in clean fleece weight between bloodlines of up to 20 %. This genetic variation between bloodlines in clean fleece weight provides producers with two key options to use when evaluating one or more bloodlines depending on the breeding objective of their commercial flock:
1. a finer bloodline can be chosen that will reduce fibre diameter without compromising clean fleece weight, or;
2. a bloodline with heavier clean fleece weight can be chosen while maintaining fibre diameter at the current level.
Liveweight vs. fibre diameter There was a 23 % difference in liveweight between the lightest (52.9 kg) and heaviest (68.9 kg) bloodlines. Finer bloodlines tend to have lower liveweight than broader bloodlines, the overall relationship being an increase of 2.3 kg
liveweight for each 1 µm increase in fibre diameter. However, there was significant genetic variation in liveweight (between 5 and 10 kg) at a given fibre diameter, again within plus or minus 1 µm of the average fibre diameter (Figure 2). This indicates that at a given fibre diameter, it is possible for producers to select bloodlines with heavier liveweight if that is a component of their breeding objective.
Wool quality vs. fibre diameter Differences between the bloodlines in staple length, staple strength, style and colour are presented in Table 2. The average staple length and staple strength were 90.7 mm and 40.0 N/ktex respectively. The average style was 2.8, which is representative of good or MF5 style. The average colour was 1.1 indicative of little to no colour evident in the fleece.
There was evidence of significant genetic variation in both staple length and staple strength at a given fibre diameter (Figures 3 a & b). This means that for a given fibre diameter, there is scope for producers to choose a bloodline with increased staple length and/or strength to complement their particular breeding objective.
For the 77 bloodlines analysed, there was less genetic variation in either style or colour at a given fibre diameter (Figures 3 c & d). Therefore, the choice of bloodline will have little influence on either the style or colour that is able to be achieved.

Merino Bloodline Performance: a comparison based on wether trial results 2006 - 2016
8 NSW Department of Primary Industries, June 2016
Figure 1 Performance of 77 bloodlines for clean fleece weight (CFW) relative to fibre diameter (FD)
12
3
45
6
7
89
10
11
12
13
1415
16
17
18
19
20
21
22
23
2425
26
27
28
29
30
31
32
33
34
35
36
37
3839
4041
42
43
44
45
46
47
48
49
50
51
52
53
54
55
56
57
58 59
60
61
62
63
64
65
66
67
68
69
70
71
72
7374
75
76
77
R² = 0.5664
-25
-20
-15
-10
-5
0
5
10
15
20
-2.5 -2.0 -1.5 -1.0 -0.5 0.0 0.5 1.0 1.5 2.0 2.5
Cle
an fl
eece
wei
ght d
evia
tion
(CFW
, %)
Fibre diameter deviation (FD, µm)
High Accuracy Medium Accuracy
High CCWLow C5
Low CCWHigh C5

Merino Bloodline Performance: a comparison based on wether trial results 2006 - 2016
9 NSW Department of Primary Industries, June 2016
Figure 2 Performance of 77 bloodlines for liveweight (LWT) relative to fibre diameter (FD)
R² = 0.4049
40.0
45.0
50.0
55.0
60.0
65.0
70.0
75.0
-2.5 -2.0 -1.5 -1.0 -0.5 0.0 0.5 1.0 1.5 2.0 2.5
Live
wei
ght (
LWT,
kg)
Fibre diameter deviation (FD, µm)
High Accuracy Medium Accuracy

Merino Bloodline Performance: a comparison based on wether trial results 2006 - 2016
10 NSW Department of Primary Industries, June 2016
Figure 3 Performance of 77 bloodlines for (a) staple length (SL, mm), (b) staple strength (SS, N/ktex), (c) style and (d) colour relative to fibre diameter deviation (FD, µm)
R² = 0.3498
60
70
80
90
100
110
120
-2.5 -2.0 -1.5 -1.0 -0.5 0.0 0.5 1.0 1.5 2.0 2.5
Stap
le le
ngth
(SL,
mm
)
Fibre diameter deviation (FD, µm)
High Accuracy Medium Accuracy
R² = 0.0335
30
35
40
45
50
-2.5 -2.0 -1.5 -1.0 -0.5 0.0 0.5 1.0 1.5 2.0 2.5
Stap
le s
tren
gth
(SS,
N/k
tex)
Fibre diameter deviation (FD, µm)
High Accuracy Medium Accuracy
(b)
R² = 0.5441
1
2
3
4
5
-2.5 -2.0 -1.5 -1.0 -0.5 0.0 0.5 1.0 1.5 2.0 2.5
Styl
e
Fibre diameter deviation (FD, µm)
High Accuracy Medium Accuracy
(c)
R² = 0.0362
0
1
2
3
-2.5 -2.0 -1.5 -1.0 -0.5 0.0 0.5 1.0 1.5 2.0 2.5
Col
our
Fibre diameter deviation (FD, µm)
High Accuracy Medium Accuracy
(d)

Merino Bloodline Performance: a comparison based on wether trial results 2006 - 2016
11 NSW Department of Primary Industries, June 2016
Bloodline Financial Performance The financial performance of each bloodline was determined using the GrassGro™ decision support tool. GrassGro™ uses historical daily weather data to drive models of interacting pasture growth and animal production, with day-to-day changes in the water content of the soil, pasture growth and decay and responses to grazing simulated for a particular location.
The greasy fleece weight, yield, fibre diameter and liveweight for each of the 77 bloodlines provided the livestock production parameters for 77 GrassGro™ simulations. The same farm system was used for each simulation, with parameters for soil, pasture and weather provided by a site at Bookham, near Yass, in NSW.
Enterprise structure, prices and costs were held constant for all simulations and were reflective of a wether enterprise at Bookham, with wethers shorn three times and then sold.
The simulations ran from 1962 to the end of 2015, providing a quantitative assessment of the performance of each bloodline across the full spectrum of seasonal conditions from drought through to long wet years.
The stocking rate (9.4 wethers/ha) used in the GrassGro™ simulations for all bloodlines was chosen such that the bloodline with the median liveweight would achieve the rule of maintaining a minimum ground cover of 70% in 71% of the years. This ground cover rule ensured the sustainability of the pasture over the long term. As the bloodlines were run at the same stocking rate, there was a difference in ground cover of 5%. Bloodlines with lower liveweight had higher ground cover, with the heavier bloodlines the lower ground cover.
Median wool and mutton prices for the 5 years from 2011 to the end of 2015 were used to determine the financial performance of each bloodline as this provided a better indication of the prices likely to be achieved by producers than the average wool and mutton prices. The median wool prices for that time period are presented in Table 3 and the median mutton price used was 304c/kg carcass weight. Changes in the wool and mutton prices would have an impact on the bloodline rankings. The greatest change would result from a change in the per micron price.
Measures of financial performance GrassGro™ outputs include profit per head ($/hd), per hectare ($/ha) and per dry sheep equivalent ($/DSE). Each of these outputs
includes typical enterprise costs and an overhead cost per hectare calculated by the program for the environment in which the simulations were run. As the same stocking rate was used for each of the 77 GrassGro™ simulations the $/hd and $/ha outputs are essentially the same. Table 3 Average and median wool prices (c/kg clean) for the period 2011 – 2015
Fibre diameter Median price
16 1473
17 1419
18 1349
19 1292
20 1230
21 1218
The two measures of financial performance of the bloodlines reported here are:
• profit per head ($/hd) which partially accounts for differences in liveweight between bloodlines as GrassGro™ allocates more supplementary feed to those bloodlines with higher liveweight to maintain the required minimum fat score of 1.5.
• profit per dry sheep equivalent ($/DSE) which accounts for the impact that differences in liveweight will have on grazing pressure. The DSE rating calculated by GrassGro™ over the 53 years of simulations is based on the consumption of feed for a given liveweight and fleece production. Profit per DSE is calculated as follows:
Figure 4 shows the bloodline distribution of profit/hd and fibre diameter, while Figure 5 depicts the relationship between profit/DSE and fibre diameter. The relationship with fibre diameter was relatively weak for both measures of financial performance, particularly at the broader end of the fibre diameter range.
The relationship between profit/DSE and clean fleece weight is stronger than that between profit/DSE and fibre diameter (Figure 6). Under the current market scenario, profit/DSE tends to be higher at heavier fleece weights.
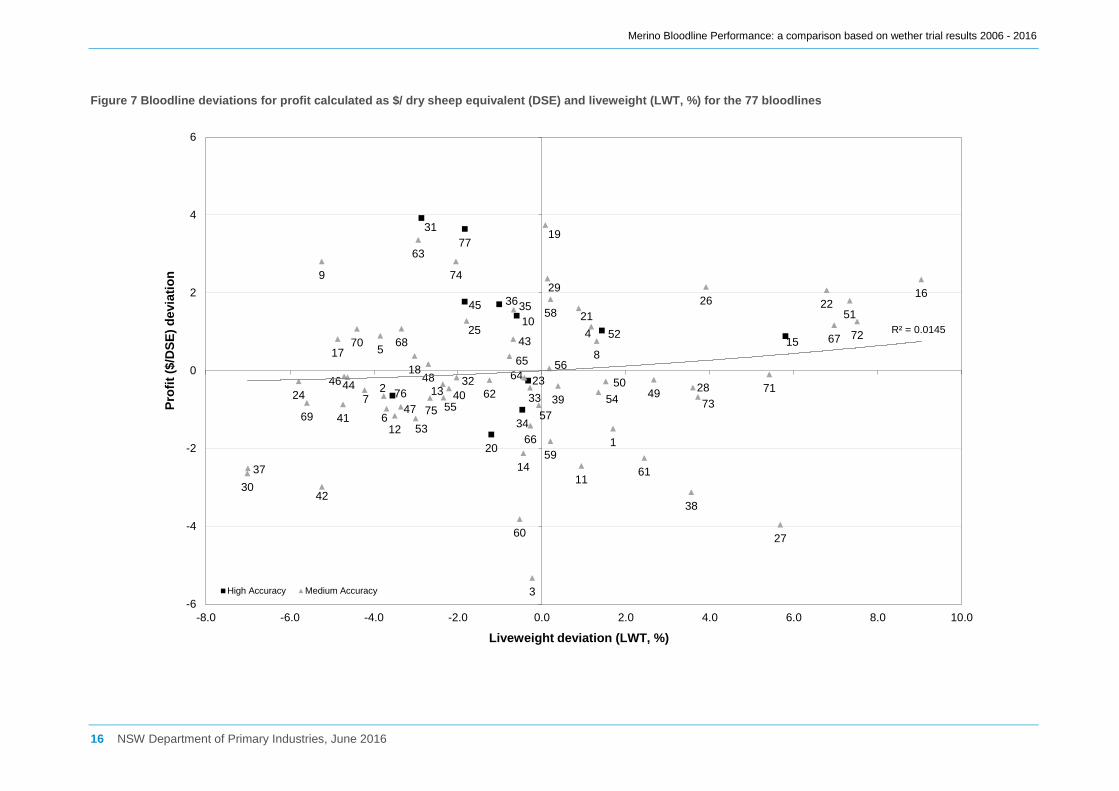
The bloodline deviation in profit/DSE with liveweight is presented in Figure 7 which shows a weak relationship. There is no clear trend in profit/DSE with change in liveweight.

Merino Bloodline Performance: a comparison based on wether trial results 2006 - 2016
12 NSW Department of Primary Industries, June 2016
GrassGro™ was also used to estimate the financial performance for each of the 77 bloodlines using soil and pasture parameters for two other sites, Woolbrook and Narrandera (both in NSW). This was undertaken to explore the impact of location on the relative financial performance of the bloodlines. For the 2016 analysis, the correlations between profit per head ($/hd) and profit per DSE ($/DSE) among the 3 sites ranged from 98% to 99% with many of the bloodlines retaining their ranking across the three sites. Therefore, despite large differences in the environment between these three sites, the relative financial performance of the bloodlines was similar.
For the 2016 analysis, the standard deviation of each of the two measures of profit was calculated. These are presented in Table 2. The standard deviation provides an indication of the amount of variation around the average profit (both per head and per DSE) for each of the 77 bloodlines over the 53 years of GrassGro simulations. A large standard deviation indicates greater variation in profit compared with a smaller standard deviation.
The financial performance of the 77 bloodlines at each of the three sites, Bookham, Narrandera and Woolbrook, together with the standard deviation of profit ($/hd and $/DSE), for the median price as well as low (30 percentile) and high (70 percentile) market scenarios can be found on the Merino Bloodline Performance website:
www.merinobloodlines.com.au

Merino Bloodline Performance: a comparison based on wether trial results 2006 - 2016
13 NSW Department of Primary Industries, June 2016
Figure 4 Bloodline deviations for profit calculated as $/head ($/hd) and fibre diameter (FD) for the 77 bloodlines
12
3
4
5
67
8
910
11
12
13
14
15
16
1718
19
20
21
22
23
24
25
26
27
28
29
30
31
32 33
34
3536
37
38
3940
41
42
43
44
45
4647
48
4950
51
52
53
54
55
56
57
58
59
60
61
62
63
64
65
66
67
68
69
70
71
72
73
74
7576
77
R² = 0.0339
-10
-8
-6
-4
-2
0
2
4
6
8
10
-2.5 -2.0 -1.5 -1.0 -0.5 0.0 0.5 1.0 1.5 2.0 2.5
Prof
it ($
/hd)
dev
iatio
n
Fibre diameter deviation (FD, µm)
High Accuracy Medium Accuracy
Merino Bloodline Performance: a comparison based on wether trial results 2006 - 2016
14 NSW Department of Primary Industries, June 2016
Figure 5 Bloodline deviations for profit calculated as $/ dry sheep equivalent (DSE) and fibre diameter (FD) for the 77 bloodlines
1
2
3
4 5
67
8
9
10
11
12
13
14
15
16
17
18
19
20
21
22
23
24
25
26
27
28
29
30
31
32
33
34
35 36
37
38
394041
42
43
44
45
46
47
48 4950
51
52
53
5455
56
57
58
59
60
61
62
63
64
65
66
6768
69
70
71
72
73
74
7576
77
R² = 0.0066
-6
-4
-2
0
2
4
6
-2.5 -2.0 -1.5 -1.0 -0.5 0.0 0.5 1.0 1.5 2.0 2.5
Prof
it ($
/DSE
) dev
iatio
n
Fibre diameter deviation (FD, µm)
High Accuracy Medium Accuracy

Merino Bloodline Performance: a comparison based on wether trial results 2006 - 2016
15 NSW Department of Primary Industries, June 2016
Figure 6 Bloodline deviations for profit calculated as $/ dry sheep equivalent (DSE) and clean fleece weight (CFW, %) for the 77 bloodlines
1
2
3
45
67
8
9
10
11
12
13
14
15
16
17
18
19
20
2122
2324
25
26
27
28
29
30
31
3233
34
35 36
37
38
3940
41
42
43
44
45
46
47
48
4950
51
52
53
5455
56
57
58
59
60
61
62
63
64
65
66
6768
69
70
71
72
73
74
7576
77
R² = 0.2405
-6
-4
-2
0
2
4
6
-25.0 -20.0 -15.0 -10.0 -5.0 0.0 5.0 10.0 15.0 20.0
Prof
it ($
/DSE
) dev
iatio
n
Clean fleece weight deviation (CFW, %)
High Accuracy Medium Accuracy
Merino Bloodline Performance: a comparison based on wether trial results 2006 - 2016
16 NSW Department of Primary Industries, June 2016
Figure 7 Bloodline deviations for profit calculated as $/ dry sheep equivalent (DSE) and liveweight (LWT, %) for the 77 bloodlines
1
2
3
45
67
8
9
10
11
12
13
14
15
16
1718
19
20
2122
2324
25
26
27
28
29
30
31
3233
34
3536
37
38
3940
41
42
43
44
45
46
47
4849
50
51
52
53
5455
56
57
58
59
60
61
62
63
6465
66
6768
69
70
71
72
73
74
7576
77
R² = 0.0145
-6
-4
-2
0
2
4
6
-8.0 -6.0 -4.0 -2.0 0.0 2.0 4.0 6.0 8.0 10.0
Prof
it ($
/DSE
) dev
iatio
n
Liveweight deviation (LWT, %)
High Accuracy Medium Accuracy

Merino Bloodline Performance: a comparison based on wether trial results 2006 - 2016
17 NSW Department of Primary Industries, June 2016
Trials included in this analysis Bloodline data used in this analysis were sourced from wether and ewe comparisons that had been run for a minimum of two years (50% of
comparisons), and a maximum of three years (Table 4).
Table 4 The 26 wether comparisons and 1 ewe productivity^ trial included in this analysis
Trial name State Trial years
Wagga (CWWT) NSW 2004-2006
Yass IV NSW 2005-2006
ANFD Schute Bell 2005 NSW 2004-2007
Bathurst 2005 NSW 2005-2007
M2M - Elmore VIC 2004-2006
Midlands Ag Assoc. TAS 2006-2007
Avondale Ewe Trial^ WA 2004-2006
Alectown NSW 2007-2008
Armour NSW 2005-2008
Glen Innes 05 NSW 2005-2007
ANFD Wether Trial 2007 - 2010 NSW 2007-2010
Bookham 2008 - 2011 NSW 2007-2011
Paling Yards, Taralga NSW 2008-2010
Merrimba NSW 2009-2010
Peter Westblade Memorial Merino Challenge NSW 2010-2012
Bathurst 2009 - 2011 NSW 2009-2011
Bookham 2011 - 2013 NSW 2011-2013
Glen Innes 2009 - 2011 NSW 2009-2011
Parkes 2010 – 2012 NSW 2010-2012
Peter Westblade Memorial Merino Challenge 2 NSW 2013-2014
Monaro 2012 - 2014 NSW 2012-2014
Bathurst 2013 - 2015 NSW 2013-2015
Glen Innes 2013 - 2015 NSW 2013-2015
ANFD 2012 - 2015 NSW 2013-2015
Peter Westblade Memorial Merino Challenge 3 NSW 2015-2016
Bookham Ag 2015 - 2018 NSW 2015-2016
Limitations The information generated by the Merino Bloodline Performance analysis provides an objective comparative evaluation of the genetic variation between Merino bloodlines. It is a useful tool to aid decision making by wool producers in choosing alternative bloodline sources that match the breeding objectives of their commercial flocks. However the limitations of the information need to be recognised:
• The financial performance reported in this Primefact is based on a wether enterprise shorn 3 times and sold as mutton.
• Merino Bloodline Performance information is historic as the database for this report was restricted to comparisons that commenced within the past 10 years. Therefore, the relative performance of each bloodline represents the breeding policies of that stud and their commercial clients 5 to 15 years ago. Recent changes in breeding objectives

Merino Bloodline Performance: a comparison based on wether trial results 2006 - 2016
18 NSW Department of Primary Industries, June 2016
or practices at the stud and commercial level will not be reflected in this information.
• Differences in the number of teams representing each bloodline and the accuracy of each bloodline’s performance information are listed in Table 2. Making decisions on alternative bloodlines of MODERATE accuracy will involve a slightly higher risk than those of HIGH accuracy.
• All teams included in this analysis were selected according to the guidelines set out in Designing and conducting Merino wether comparisons and on-farm genetic evaluations. This limits the ability of wether and ewe trial entrants to specifically select sheep for the trials and assists stud breeders and each of the wether and ewe trials contributing data to this analysis to define a team representing a flock as being of a particular bloodline.
• This analysis is unable to account for whether the teams have come from the bloodline’s ram breeding flock or from their commercial clients. A high proportion of teams from higher merit flocks may occur when the stud’s own commercial flock provides the majority of the teams which make up the bloodline result. We recommend that producers ask their stud whether the teams representing that bloodline were from the studs own flock or their commercial clients.
• The relative financial performance of the bloodlines do not account for any variation between bloodlines in reproductive performance.
When using the information presented in this Primefact to evaluate one or more bloodlines it is important to contact the stud representing each bloodline directly and seek information that describes their bloodline’s genetic improvement policy and direction.
Primefact 74, Choosing a Bloodline Source, provides a comprehensive description of how to use bloodline performance information to evaluate one or more bloodlines (http://www.dpi.nsw.gov.au/agriculture/merino-bloodline-performance/choose-a-bloodline-source).
Further information Not all traits measured or assessed by some of the wether and ewe trials contributing data to this project are included in this Primefact. These include meat traits, face cover, fertility, wrinkle development and fleece rot. Producers should
make contact with the coordinator of each trial to access this information. Some of these traits are evaluated at Merino sire evaluation sites. Reports from these sites can be accessed from the Australian Merino Sire Evaluation Association’s (AMSEA) Merino Superior Sires website or via the Sheep Genetics MERINOSELECT website.
Merino Bloodline Performance information complements the Australian Sheep Breeding Values (ASBVs) provided by MERINOSELECT that predict the genetic merit of individual sheep and stud averages.
Other useful resources To make the best use of this information, producers should consider the details on the inside cover of the Merino Bloodline Performance folder and the information contained in the folder which includes:
• Primefact 1472. Merino bloodlines: a comparison based on wether trial results 2006 – 2016
• Primefact 74. Choosing a bloodline source • Bloodline contacts • Application to be added to the mailing list • Feedback form to suggest changes for future
publications
The Merino Bloodline Performance website (www.merinobloodlines.com.au) has been updated with the results of this analysis along with all the information contained in the bloodline package.
Other associated information sources include:
• Designing and conducting Merino wether comparisons and on-farm genetic evaluations. http://www.dpi.nsw.gov.au/agriculture/merino-bloodline-performance/running-wether-trials
• Ewe productivity trials, including information on reproduction differences. http://www.agric.wa.gov.au/PC_91878.html?s=1001
• Merino Superior Sires website. http://www.merinosuperiorsires.com.au/
• Sheep Genetics MERINOSELECT website. http://www.sheepgenetics.org.au/Breeding-services/MERINOSELECT-Home
If you require further information, contact
Dr Sue Hatcher, Principal Research Scientist, NSW DPI, ph (02) 6391 3861; email [email protected]
Brett Wilson, Development Officer NSW DPI, ph (02) 6391 3896 email [email protected]
Merino Bloodline Performance: a comparison based on wether trial results 2006 - 2016
19 NSW Department of Primary Industries, June 2016
Acknowledgments This national Merino Bloodline Performance analysis was made possible with co-funding from Australian Wool Innovation Limited and NSW DPI.
We gratefully acknowledge the efforts of the individual wether and ewe trial committees who collect the information and provide their data to this combined analysis.
© State of New South Wales through the Department of Industry, Skills and Regional Development, 2016. You may copy, distribute and otherwise freely deal with this publication for any purpose, provided that you attribute the NSW Department of Primary Industries as the owner. ISSN 1832 6668 Check for updates of this Primefact at: www.dpi.nsw.gov.au/primefacts Disclaimer: The information contained in this publication is based on knowledge and understanding at the time of writing (June 2016). However, because of advances in knowledge, users are reminded of the need to ensure that information upon which they rely is up to date and to check currency of the information with the appropriate officer of the Department of Primary Industries or the user’s independent advisor.
Published by the NSW Department of Primary Industries