merrick & company - renewable fuels association · 2010 ethanol industry outlook 1 ......
TRANSCRIPT
2 016 E T H A N O L I N D U S T RY O U T LO O K
Randall Doyal, ChairmanAl-Corn Clean Fuelwww.al-corn.com
Mick Henderson, Vice ChairmanCommonwealth Agri-Energy, LLCwww.commonwealthagrienergy.com
Jim Seurer, TreasurerGlacial Lakes Energy, LLCwww.glaciallakesenergy.com
Bob Dinneen, PresidentRenewable Fuels Associationwww.ethanolrfa.org
Absolute Energy, L.L.C.Rick Schwarckwww.absenergy.org
Ace Ethanol LLCBob Satherwww.aceethanol.com
Adkins Energy LLCRay Bakerwww.adkinsenergy.com
Badger State Ethanol, LLCErik Huschittwww.badgerstateethanol.com
Big River Resources, LLCRaymond Defenbaughwww.bigriverresources.com
Buffalo Lake Advanced Biofuels, LLCJed Latkinwww.blabllc.com
Bushmills Ethanol Inc.Erik Osmonwww.bushmillsethanol.com
Central MN Renewables, LLCDana Perssonwww.centralmnethanol.com
Chippewa Valley Ethanol, Co.Chad Friesewww.cvec.com
CHS Inc.John Litteriowww.chsinc.com
CIERyan Drookwww.cie.us
Dakota Ethanol, LLCScott Mundtwww.dakotaethanol.com
Didion Ethanol LLCJohn Didionwww.didionmilling.com
DuPont Cellulosic EthanolTroy Wilsonwww.dupont.com
E Energy Adams, LLCCarl Sitzmannwww.eenergyadams.com
East Kansas Agri-Energy, LLCJeff Oestmannwww.ekaellc.com
Fox River Valley Ethanol, LLCBob Satherwww.frvethanol.com
Golden Grain Energy, LLCJim Boedingwww.goldengrainenergy.com
Grain Processing Corp.Mark Rickettswww.grainprocessing.com
Granite Falls Energy, LLCSteve Christensenwww.granitefallsenergy.com
Guardian Energy, LLCMike Jerkewww.guardiannrg.com
Guardian Lima, LLCMike Jerkewww.guardianlima.com
Hankinson Renewable Energy, LLCMike Jerkewww.hankinsonre.com
Heartland Corn ProductsScott Blumhoefer
Highwater Ethanol, LLCBrian Kletscherwww.highwaterethanol.com
Homeland Energy Solutions, LLCPat Boylewww.homelandenergysolutions.com
Husker Ag, LLCSeth Harderwww.huskerag.com
Ingredion Inc.www.ingredion.com
KAAPA Ethanol, LLCChuck Woodsidewww.kaapaethanol.com
Lincolnland Agri-Energy, LLCEric Mosbeywww.lincolnlandagrienergy.com
Little Sioux Corn Processors, L.P.Steve Roewww.littlesiouxcornprocessors.com
Merrick & CompanyJohn Kosanovichwww.merrick.com
Mid-America BioEnergy, LLCRobert Lundeenwww.standard-ethanol.com
Mid-Missouri Energy, Inc.Chris Wilsonwww.midmissourienergy.com
Pacific Ethanol Inc.Neil Koehlerwww.pacificethanol.net
Parallel ProductsBob Pasmawww.parallelproducts.com
Plymouth Energy, LLCEamonn Byrnewww.plymouth-energy.com
Quad County Corn ProcessorsDelayne Johnsonwww.quad-county.com
Redfield Energy, LLCDana Siefkes-Lewiswww.redfieldenergy.com
Show Me Ethanol, LLCRichard Hansonwww.showmeethanolllc.com
Southwest Iowa Renewable Energy, LLCBrian Cahillwww.sireethanol.com
Tate & LyleTim Meinholdwww.tateandlyle.com
The Andersons, Inc.Neill McKinstraywww.andersonsethanol.com
Trenton Agri Products LLCCharles Wilsonwww.trentonagriproducts.com
Western New York Energy LLCMichael Sawyerwww.wnyenergy.com
White Energy–HerefordDon Galeswww.white-energy.com
RFA BOARD OF DIRECTORS
12010 Ethanol Industry OUTLOOK
Sincerely,
Bob Dinneen, President & CEO
Amidst the seemingly endless drama attributable to the legislative or regulatory battle de jour and the ever increasing din of misleading advertising funded by the incumbent energy industry, one might be forgiven for losing sight of the fact that ethanol is still a business. So, while not ignoring the policy issues that will most certainly continue to shape the industry’s trajectory in 2016 and beyond, this year’s Outlook responds to a collective desire to return to the business of ethanol – one that has revitalized rural communities, created jobs in production, processing and marketing across the country, and provided consumer savings at the pump.
The politics of ethanol may be rooted in its renewable, home-grown, and clean burning characteristics. But the business of ethanol is rooted in octane. The world motor fuel market is short on octane, and ethanol is the lowest-cost source of octane available. Moreover, future growth in the industry is quite likely tied directly to automaker efforts to meet increasingly stringent fuel economy standards with higher compression ratio engines that will require even higher octane fuels.
So understanding the octane benefits of ethanol, particularly when compared to potential competitors in the market, is critical to an appreciation for future challenges and opportunities facing the U.S. ethanol industry. These pages will provide an octane primer, along with a review of ethanol’s place in the market today.
While 2015 was a far cry from 2014 in terms of profitability, last year was still another solid year of growth in the face of falling oil prices and policy instability. Indeed, in November, the industry hit the phenomenal production milestone of 1 million barrels per day! That’s the equivalent of 15.3 billion gallons on an annualized basis. The industry also saw DuPont open the world’s largest cellulosic ethanol production facility in Nevada, Iowa. Congratulations!
The industry’s commercial success only added to the frustration when EPA, on November 30, finalized an RFS rule that adopted the oil companies’ narrative about the blend wall and reduced the 2016 RFS obligation for undifferentiated biofuels (corn ethanol) to 14.5 billion gallons, 800 million gallons less than our demonstrated production capability. Of course, the number was not the main issue. What EPA’s rule really did was to fatally undermine the ability of the RFS’s credit trading mechanism (RINs) to incentivize investment in the new technologies or infrastructure that is necessary to fuel further market expansion. That is a drama that will most certainly continue to impact the legislative, regulatory, legal, and marketplace reality throughout 2016. Stay tuned.
In the meanwhile, enjoy this year’s Outlook, the U.S. ethanol industry’s most trusted and cited resource for the facts and trends driving the industry forward – this year in high octane fashion.
2016 ETHANOL INDUSTRY OUTLOOK 1
(Number of Installed Plants, Nameplate Capacity)
Installed Ethanol Plant
RI
VT
NJ
DEDC
CT
NH
MA
MD
ID
NMAZ
CA
OR
NV
WAMT ND
MNWI
LATX
COUT
WYSD
NE
KS
OK AR
MO
IA
FL
MI NY
PA
WVVA
NC
SCGA
ALMS
IL IN
OH
KY
TN
ME
Ethanol Plant Under Construction or Expansion
0
2,000
4,000
6,000
8,000
10,000
2015*
2014
2013
2012
2011
2010
2009
2008
2007
2006
2005
2004
2003
2002
2001
2000
1999
1998
1997
1996
1995
1994
1993
1992
1991
1990
1989
1988
1987
1986
1985
1984
1983
1982
1981
1980175
215
350
415
510
617
712
819
831
843
848
866
985
1,154
1,289
1,358 1,088
1,288
1,405
1,465
1,622
1,765
2,140
2,810
3,404
3,904
4,884
6,521
9,309
10,938
13,298
12,000
14,000
16,000
13,929 13,218
13,293
14,313
14,700
Source: U.S. Dept. of Energy and RFA *Estimated
Mill
ion
Gal
lons
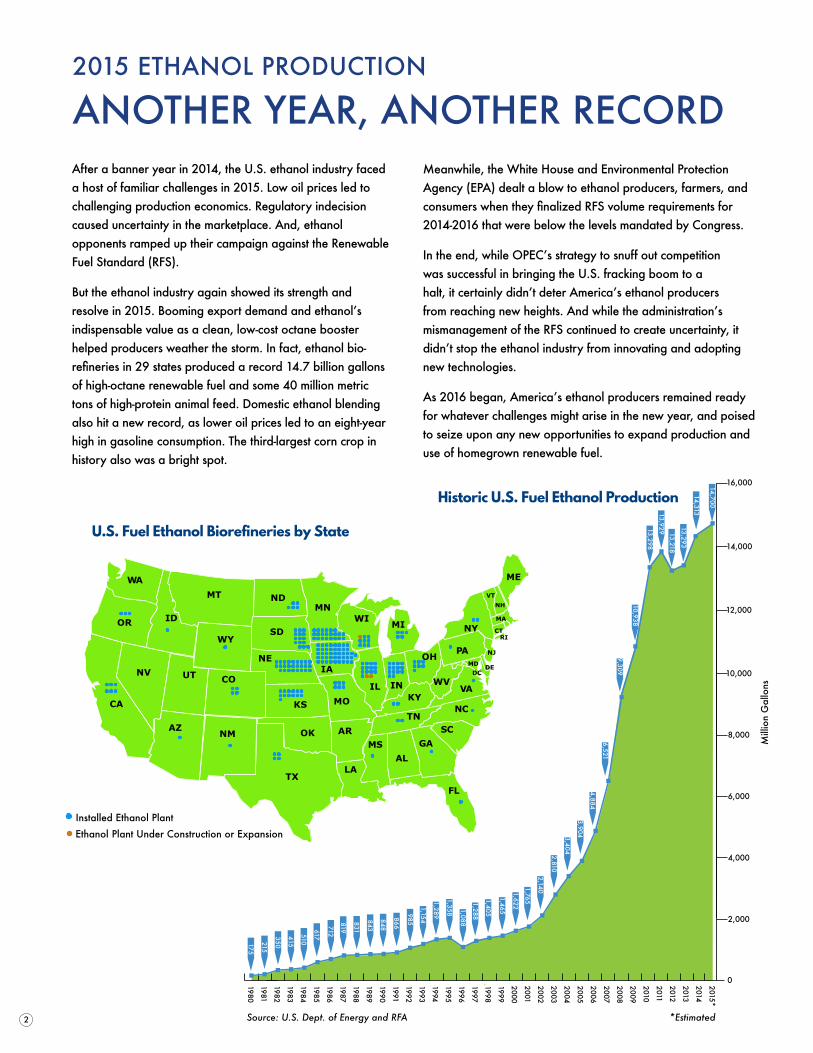
U.S. Fuel Ethanol Biorefineries by State
Historic U.S. Fuel Ethanol Production
After a banner year in 2014, the U.S. ethanol industry faced a host of familiar challenges in 2015. Low oil prices led to challenging production economics. Regulatory indecision caused uncertainty in the marketplace. And, ethanol opponents ramped up their campaign against the Renewable Fuel Standard (RFS).
But the ethanol industry again showed its strength and resolve in 2015. Booming export demand and ethanol’s indispensable value as a clean, low-cost octane booster helped producers weather the storm. In fact, ethanol bio-refineries in 29 states produced a record 14.7 billion gallons of high-octane renewable fuel and some 40 million metric tons of high-protein animal feed. Domestic ethanol blending also hit a new record, as lower oil prices led to an eight-year high in gasoline consumption. The third-largest corn crop in history also was a bright spot.
Meanwhile, the White House and Environmental Protection Agency (EPA) dealt a blow to ethanol producers, farmers, and consumers when they finalized RFS volume requirements for 2014-2016 that were below the levels mandated by Congress.
In the end, while OPEC’s strategy to snuff out competition was successful in bringing the U.S. fracking boom to a halt, it certainly didn’t deter America’s ethanol producers from reaching new heights. And while the administration’s mismanagement of the RFS continued to create uncertainty, it didn’t stop the ethanol industry from innovating and adopting new technologies.
As 2016 began, America’s ethanol producers remained ready for whatever challenges might arise in the new year, and poised to seize upon any new opportunities to expand production and use of homegrown renewable fuel.
2015 ETHANOL PRODUCTION
ANOTHER YEAR, ANOTHER RECORD
2
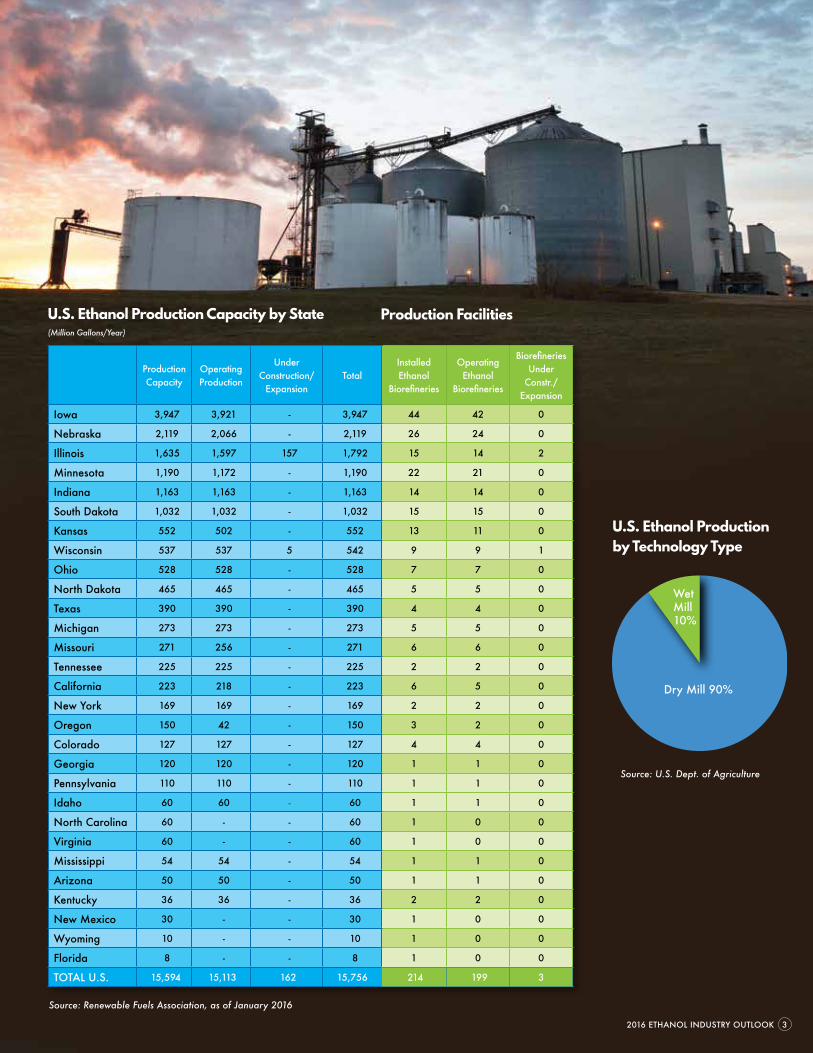
Source: Renewable Fuels Association, as of January 2016Source: U.S. Dept. of Energy and RFA *Estimated
Production Capacity
Operating Production
Under Construction/
ExpansionTotal
Installed Ethanol
Biorefineries
Operating Ethanol
Biorefineries
Biorefineries Under
Constr./ Expansion
Iowa 3,947 3,921 - 3,947 44 42 0
Nebraska 2,119 2,066 - 2,119 26 24 0
Illinois 1,635 1,597 157 1,792 15 14 2
Minnesota 1,190 1,172 - 1,190 22 21 0
Indiana 1,163 1,163 - 1,163 14 14 0
South Dakota 1,032 1,032 - 1,032 15 15 0
Kansas 552 502 - 552 13 11 0
Wisconsin 537 537 5 542 9 9 1
Ohio 528 528 - 528 7 7 0
North Dakota 465 465 - 465 5 5 0
Texas 390 390 - 390 4 4 0
Michigan 273 273 - 273 5 5 0
Missouri 271 256 - 271 6 6 0
Tennessee 225 225 - 225 2 2 0
California 223 218 - 223 6 5 0
New York 169 169 - 169 2 2 0
Oregon 150 42 - 150 3 2 0
Colorado 127 127 - 127 4 4 0
Georgia 120 120 - 120 1 1 0
Pennsylvania 110 110 - 110 1 1 0
Idaho 60 60 - 60 1 1 0
North Carolina 60 - - 60 1 0 0
Virginia 60 - - 60 1 0 0
Mississippi 54 54 - 54 1 1 0
Arizona 50 50 - 50 1 1 0
Kentucky 36 36 - 36 2 2 0
New Mexico 30 - - 30 1 0 0
Wyoming 10 - - 10 1 0 0
Florida 8 - - 8 1 0 0
TOTAL U.S. 15,594 15,113 162 15,756 214 199 3
U.S. Ethanol Production Capacity by State(Million Gallons/Year)
Production Facilities
Dry Mill 90%
Wet Mill10%
U.S. Ethanol Production by Technology Type
Source: U.S. Dept. of Agriculture
2016 ETHANOL INDUSTRY OUTLOOK 3
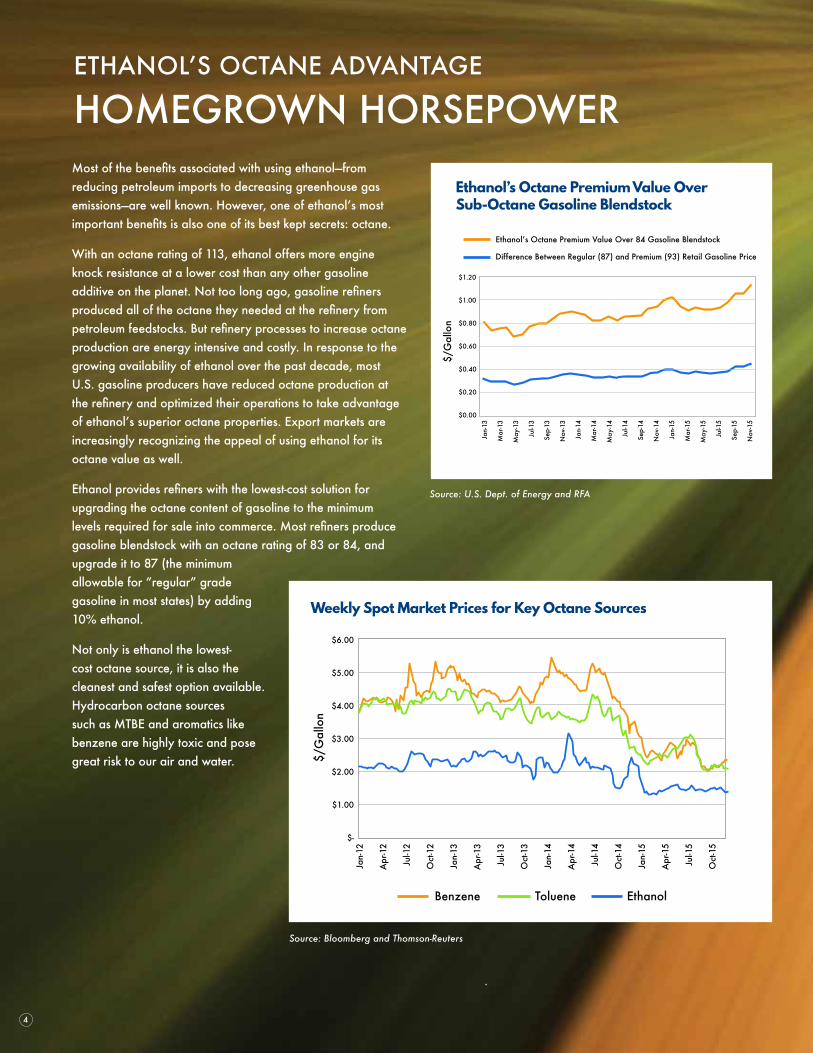
Most of the benefits associated with using ethanol—from reducing petroleum imports to decreasing greenhouse gas emissions—are well known. However, one of ethanol’s most important benefits is also one of its best kept secrets: octane.
With an octane rating of 113, ethanol offers more engine knock resistance at a lower cost than any other gasoline additive on the planet. Not too long ago, gasoline refiners produced all of the octane they needed at the refinery from petroleum feedstocks. But refinery processes to increase octane production are energy intensive and costly. In response to the growing availability of ethanol over the past decade, most U.S. gasoline producers have reduced octane production at the refinery and optimized their operations to take advantage of ethanol’s superior octane properties. Export markets are increasingly recognizing the appeal of using ethanol for its octane value as well.
Ethanol provides refiners with the lowest-cost solution for upgrading the octane content of gasoline to the minimum levels required for sale into commerce. Most refiners produce gasoline blendstock with an octane rating of 83 or 84, and upgrade it to 87 (the minimum allowable for “regular” grade gasoline in most states) by adding 10% ethanol.
Not only is ethanol the lowest-cost octane source, it is also the cleanest and safest option available. Hydrocarbon octane sources such as MTBE and aromatics like benzene are highly toxic and pose great risk to our air and water.
Source: Bloomberg and Thomson-Reuters
ETHANOL’S OCTANE ADVANTAGE
HOMEGROWN HORSEPOWER
Jan-
12
Apr
-12
Jul-1
2
Oct
-12
Jan-
13
Apr
-13
Jul-1
3
Oct
-13
Jan-
14
Apr
-14
Jul-1
4
Oct
-14
Jan-
15
Apr
-15
Jul-1
5
Oct
-15
$/G
allo
n
Benzene Toluene Ethanol
$6.00
$5.00
$4.00
$3.00
$2.00
$1.00
$-
Weekly Spot Market Prices for Key Octane Sources
Jan-
13
Mar
-13
May
-13
Jul-1
3
Sep-
13
Nov
-13
Jan-
14
Mar
-14
May
-14
Jul-1
4
Sep-
14
Nov
-14
Jan-
15
Mar
-15
May
-15
Jul-1
5
Sep-
15
Nov
-15
$1.20
$1.00
$0.80
$0.60
$0.40
$0.20
$0.00
Ethanolʼs Octane Premium Value Over 84 Gasoline Blendstock
Difference Between Regular (87) and Premium (93) Retail Gasoline Price
$/G
allo
n
Ethanol’s Octane Premium Value Over Sub-Octane Gasoline Blendstock
4
Source: U.S. Dept. of Energy and RFA
Source: Bloomberg and Thomson-Reuters
ETHANOL’S OCTANE ADVANTAGE
HOMEGROWN HORSEPOWER
2016 ETHANOL INDUSTRY OUTLOOK 5
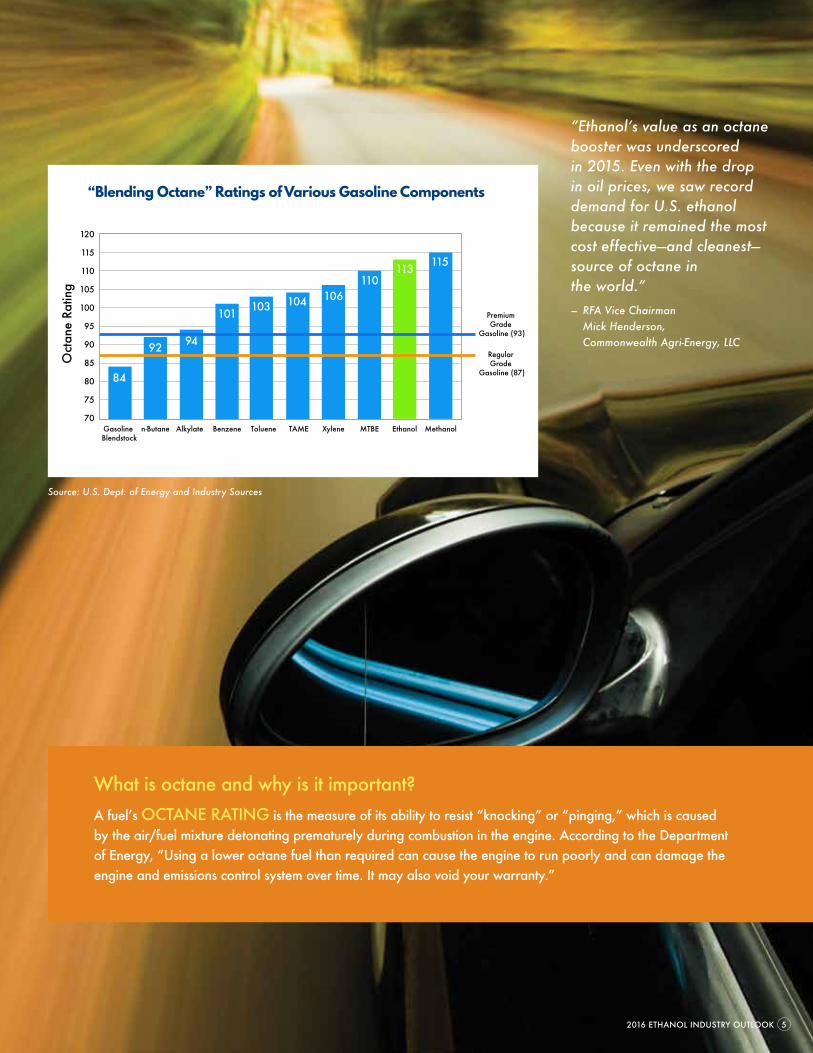
What is octane and why is it important?A fuel’s OCTANE RATING is the measure of its ability to resist “knocking” or “pinging,” which is caused by the air/fuel mixture detonating prematurely during combustion in the engine. According to the Department of Energy, “Using a lower octane fuel than required can cause the engine to run poorly and can damage the engine and emissions control system over time. It may also void your warranty.”
Weekly Spot Market Prices for Key Octane Sources
“Blending Octane” Ratings of Various Gasoline Components
“Ethanol’s value as an octane booster was underscored in 2015. Even with the drop in oil prices, we saw record demand for U.S. ethanol because it remained the most cost effective—and cleanest—source of octane in the world.” – RFA Vice Chairman
Mick Henderson, Commonwealth Agri-Energy, LLC
Source: U.S. Dept. of Energy and RFA
120
115
110
105
100
95
90
85
80
75
70Gasoline Blendstock
n-Butane Alkylate Benzene Toluene TAME Xylene MTBE Ethanol Methanol
Oct
ane
Ratin
g
84
92 94
101 103 104 106110
113 115
Premium Grade
Gasoline (93)
Regular Grade
Gasoline (87)
Source: U.S. Dept. of Energy and Industry Sources
Meeting aggressive new corporate average fuel economy (CAFE) requirements and tailpipe GHG emissions standards will require revolutionary changes in fuel and vehicle technologies. Accordingly, automakers are exploring a broad portfolio of technologies that can simultaneously improve vehicle efficiency and reduce emissions impacts. As stated by Sergio Marchionne, CEO of Fiat Chrysler Automobiles, “Everything is on the table.”
As automakers have assessed various technology pathways toward complying with new CAFE/GHG standards, one very promising strategy has risen to the top: using high octane fuels in advanced internal combustion engines. When paired with downsized, high-compression, turbo-charged engines, high octane fuels can deliver the same—or better—fuel economy as regular gasoline, but with less energy and far fewer emissions. As EPA has recognized, high octane fuels “…could help manufacturers who wish to raise compressions ratios to improve vehicle efficiency as a step toward complying with the 2017 and later GHG and CAFE standards.”
“Our analysis suggests that transitioning the fleet to higher-octane gasoline would result in significant economic and environmental benefits through reduced gasoline consumption.”— Massachusetts Institute of Technology
(Speth et al., 2014)
HIGH OCTANE FUELS
POWERING THE FUTURE
A recent study by the Massachusetts Institute of Technology (MIT) found that use of high octane fuels in appropriately tuned vehicles by 2040 could:
• Reduce annual gasoline consumption in the U.S. by 3.0 - 4.4%;
• Provide additional CO2 emission reductions of 19–35 metric tons/year;
• Generate an annual direct economic benefit of $0.4–6.4 billion; and
• Offer a net societal benefit (including the social cost of carbon) of $1.7–8.8 billion annually.
A growing body of research by automakers, government laboratories, and universities demonstrates that gasoline blends containing 20-40% ethanol can deliver the octane needed to maximize efficiency in advanced internal combustion engines. In addition to possessing an extremely high octane rating, ethanol is less expensive and cleaner than other potential octane sources.
In recent years, a broad coalition of stakeholders has rallied to help advance ethanol as the “key ingredient” in the high octane fuels of tomorrow. Ethanol producers, automakers, government researchers, fuel retailers, agricultural groups, and others continue to collaboratively chart the course to a high octane future that finally recognizes ethanol’s full potential.
6
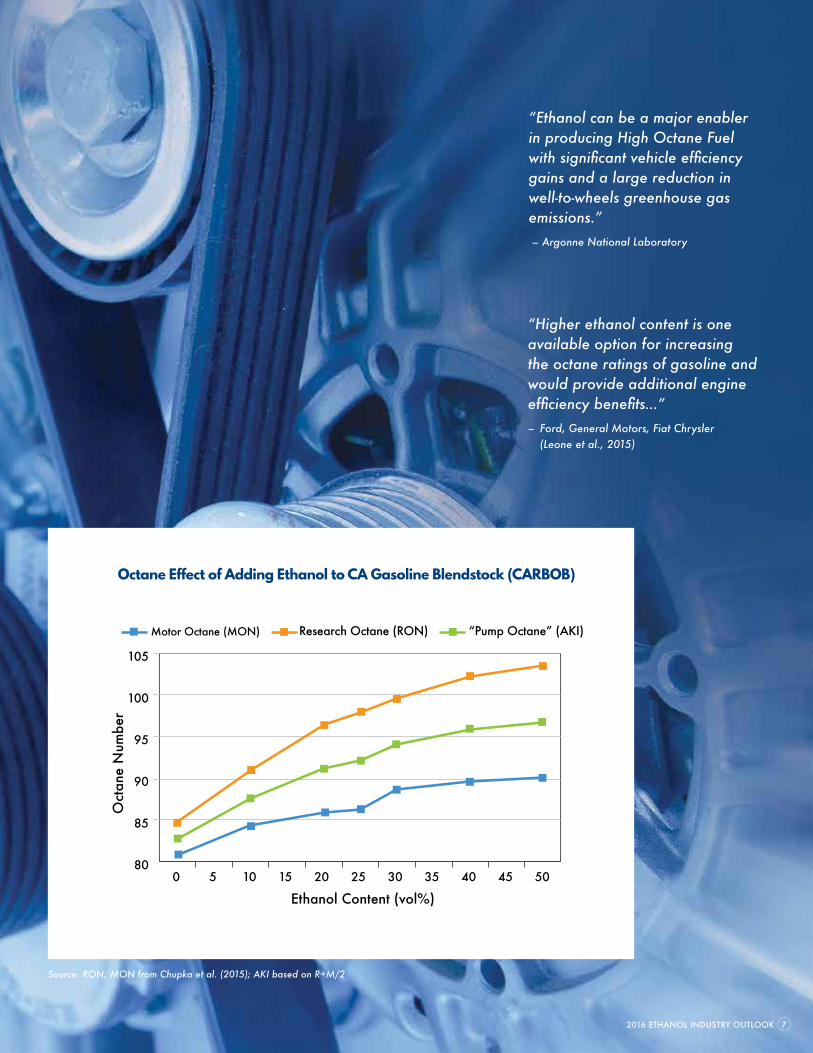
Octane Effect of Adding Ethanol to CA Gasoline Blendstock (CARBOB)
“Ethanol can be a major enabler in producing High Octane Fuel with significant vehicle efficiency gains and a large reduction in well-to-wheels greenhouse gas emissions.” – Argonne National Laboratory
“Higher ethanol content is one available option for increasing the octane ratings of gasoline and would provide additional engine efficiency benefits…” – Ford, General Motors, Fiat Chrysler
(Leone et al., 2015)
105
100
95
90
85
800 5 10 15 20 25 30 35 40 45 50
Ethanol Content (vol%)
Oct
ane
Num
ber
Motor Octane (MON) Research Octane (RON) “Pump Octane” (AKI)
2016 ETHANOL INDUSTRY OUTLOOK 7
Source: RON, MON from Chupka et al. (2015); AKI based on R+M/2
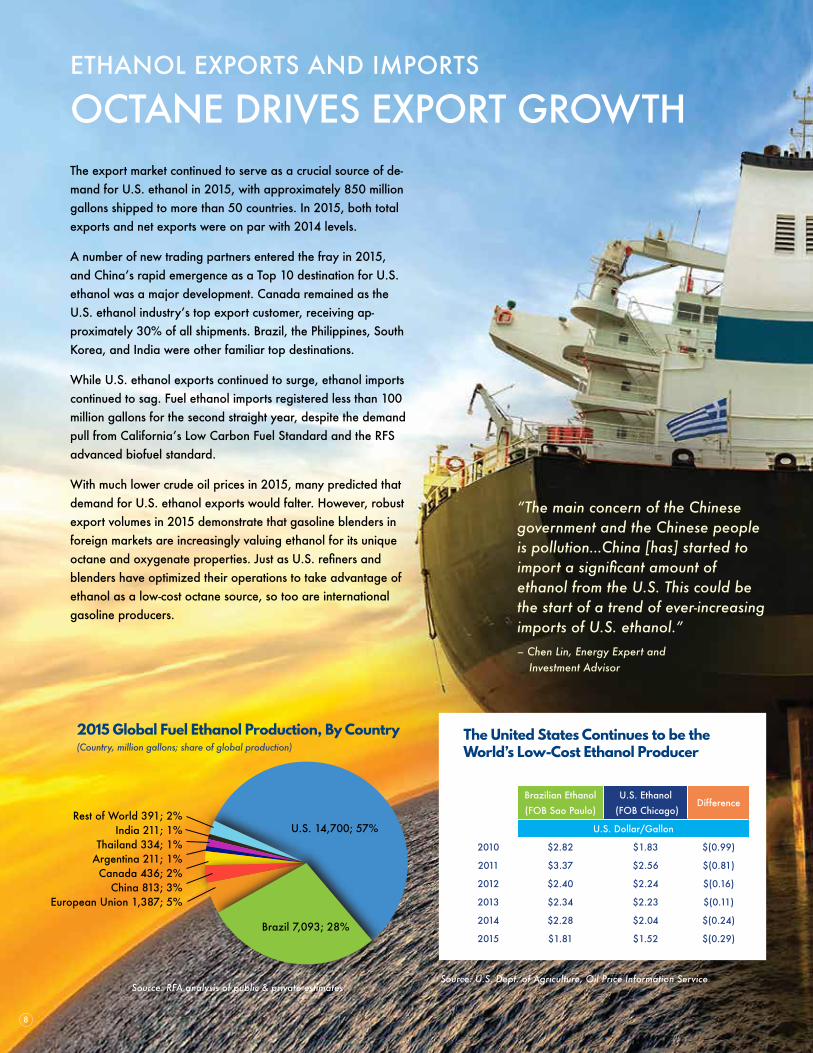
The export market continued to serve as a crucial source of de-mand for U.S. ethanol in 2015, with approximately 850 million gallons shipped to more than 50 countries. In 2015, both total exports and net exports were on par with 2014 levels.
A number of new trading partners entered the fray in 2015, and China’s rapid emergence as a Top 10 destination for U.S. ethanol was a major development. Canada remained as the U.S. ethanol industry’s top export customer, receiving ap-proximately 30% of all shipments. Brazil, the Philippines, South Korea, and India were other familiar top destinations.
While U.S. ethanol exports continued to surge, ethanol imports continued to sag. Fuel ethanol imports registered less than 100 million gallons for the second straight year, despite the demand pull from California’s Low Carbon Fuel Standard and the RFS advanced biofuel standard.
With much lower crude oil prices in 2015, many predicted that demand for U.S. ethanol exports would falter. However, robust export volumes in 2015 demonstrate that gasoline blenders in foreign markets are increasingly valuing ethanol for its unique octane and oxygenate properties. Just as U.S. refiners and blenders have optimized their operations to take advantage of ethanol as a low-cost octane source, so too are international gasoline producers.
ETHANOL EXPORTS AND IMPORTS
OCTANE DRIVES EXPORT GROWTH
U.S. 14,700; 57%
Brazil 7,093; 28%
Rest of World 391; 2%India 211; 1%
Thailand 334; 1%Argentina 211; 1%Canada 436; 2%
China 813; 3%European Union 1,387; 5%
2015 Global Fuel Ethanol Production, By Country (Country, million gallons; share of global production)
8
“The main concern of the Chinese government and the Chinese people is pollution…China [has] started to import a significant amount of ethanol from the U.S. This could be the start of a trend of ever-increasing imports of U.S. ethanol.”
– Chen Lin, Energy Expert and Investment Advisor
Source: RFA analysis of public & private estimates
Brazilian Ethanol (FOB Sao Paulo)
U.S. Ethanol (FOB Chicago)
Difference
U.S. Dollar/Gallon
2010 $2.82 $1.83 $(0.99)
2011 $3.37 $2.56 $(0.81)
2012 $2.40 $2.24 $(0.16)
2013 $2.34 $2.23 $(0.11)
2014 $2.28 $2.04 $(0.24)
2015 $1.81 $1.52 $(0.29)
The United States Continues to be the World’s Low-Cost Ethanol Producer
Source: U.S. Dept. of Agriculture, Oil Price Information Service
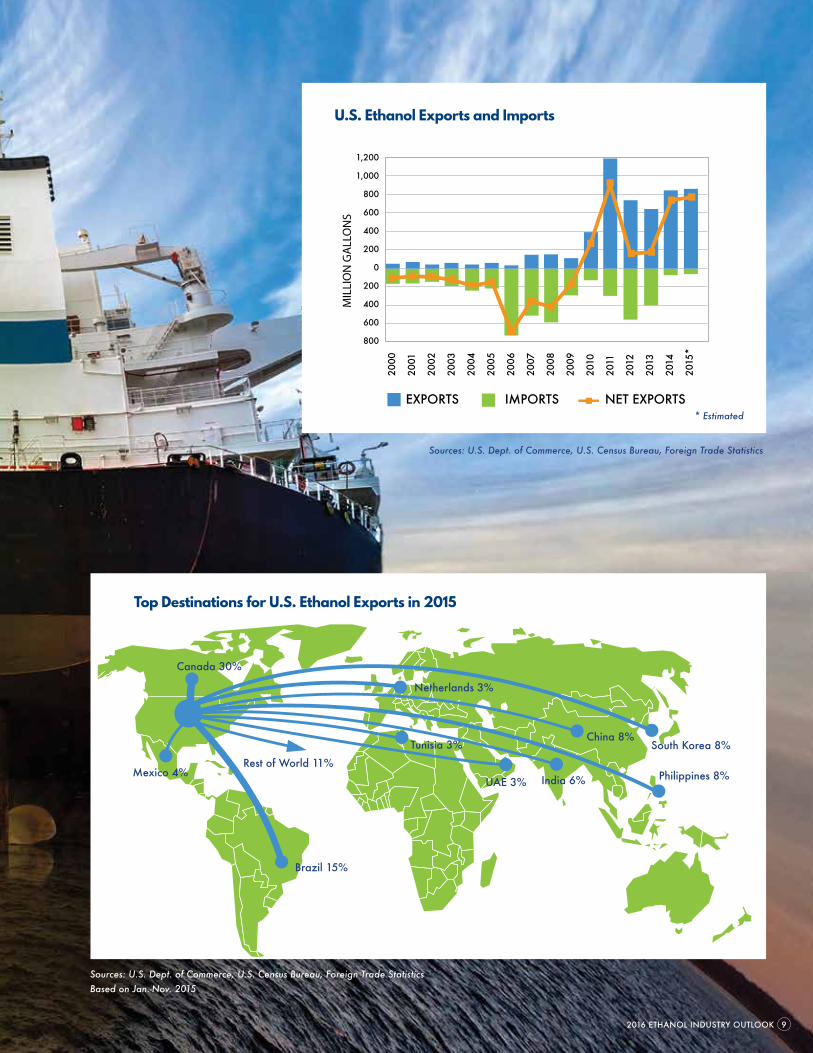
Top Destinations for U.S. Ethanol Exports in 2015
Canada 30%
UAE 3%
Rest of World 11%Mexico 4%
Netherlands 3%
South Korea 8%China 8%
Philippines 8%
ETHANOL EXPORTS AND IMPORTS
OCTANE DRIVES EXPORT GROWTH
Sources: U.S. Dept. of Commerce, U.S. Census Bureau, Foreign Trade Statistics
U.S. Ethanol Exports and Imports
1,200
1,000
800
600
400
200
0
200
400
600
800
2000
2001
2002
2003
2004
2005
2006
2007
2008
2009
2010
2011
2012
2013
2014
2015
*
MIL
LIO
N G
ALL
ON
S
EXPORTS IMPORTS NET EXPORTS *Estimated
Brazil 15%
Tunisia 3%
Sources: U.S. Dept. of Commerce, U.S. Census Bureau, Foreign Trade Statistics Based on Jan.-Nov. 2015
2016 ETHANOL INDUSTRY OUTLOOK 9
* Estimated
Brazilian Ethanol (FOB Sao Paulo)
U.S. Ethanol (FOB Chicago)
Difference
U.S. Dollar/Gallon
2010 $2.82 $1.83 $(0.99)
2011 $3.37 $2.56 $(0.81)
2012 $2.40 $2.24 $(0.16)
2013 $2.34 $2.23 $(0.11)
2014 $2.28 $2.04 $(0.24)
2015 $1.81 $1.52 $(0.29)
The United States Continues to be the World’s Low-Cost Ethanol Producer
India 6%
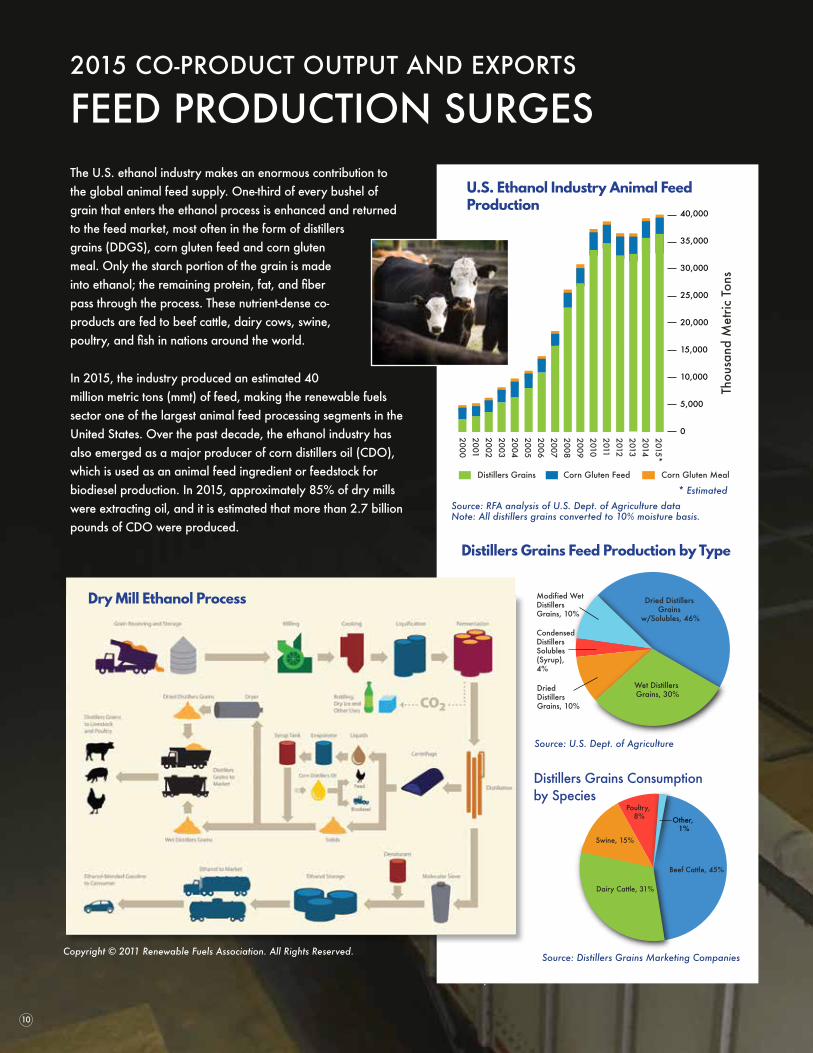
The U.S. ethanol industry makes an enormous contribution to the global animal feed supply. One-third of every bushel of grain that enters the ethanol process is enhanced and returned to the feed market, most often in the form of distillers grains (DDGS), corn gluten feed and corn gluten meal. Only the starch portion of the grain is made into ethanol; the remaining protein, fat, and fiber pass through the process. These nutrient-dense co-products are fed to beef cattle, dairy cows, swine, poultry, and fish in nations around the world.
In 2015, the industry produced an estimated 40 million metric tons (mmt) of feed, making the renewable fuels sector one of the largest animal feed processing segments in the United States. Over the past decade, the ethanol industry has also emerged as a major producer of corn distillers oil (CDO), which is used as an animal feed ingredient or feedstock for biodiesel production. In 2015, approximately 85% of dry mills were extracting oil, and it is estimated that more than 2.7 billion pounds of CDO were produced.
2015 CO-PRODUCT OUTPUT AND EXPORTS
FEED PRODUCTION SURGES
Dried Distillers Grains
w/Solubles, 46%
Wet Distillers Grains, 30%
Dried Distillers Grains, 10%
Modified Wet Distillers Grains, 10%
CondensedDistillers Solubles (Syrup), 4%
Distillers Grains Feed Production by Type
Beef Cattle, 45%
Dairy Cattle, 31%
Swine, 15%
Poultry, 8% Other,
1%
Distillers Grains Consumption by Species
Thou
sand
Met
ric T
ons
2015*201420132012201120102009200820072006200520042003200220012000
40,000
35,000
30,000
25,000
20,000
15,000
10,000
5,000
0
Distillers Grains Corn Gluten Feed Corn Gluten Meal
U.S. Ethanol Industry Animal Feed Production
Dry Mill Ethanol Process
10
Copyright © 2011 Renewable Fuels Association. All Rights Reserved.
Source: RFA analysis of U.S. Dept. of Agriculture dataNote: All distillers grains converted to 10% moisture basis.
* Estimated
Source: U.S. Dept. of Agriculture
Source: Distillers Grains Marketing Companies
2010 Ethanol Industry OUTLOOK
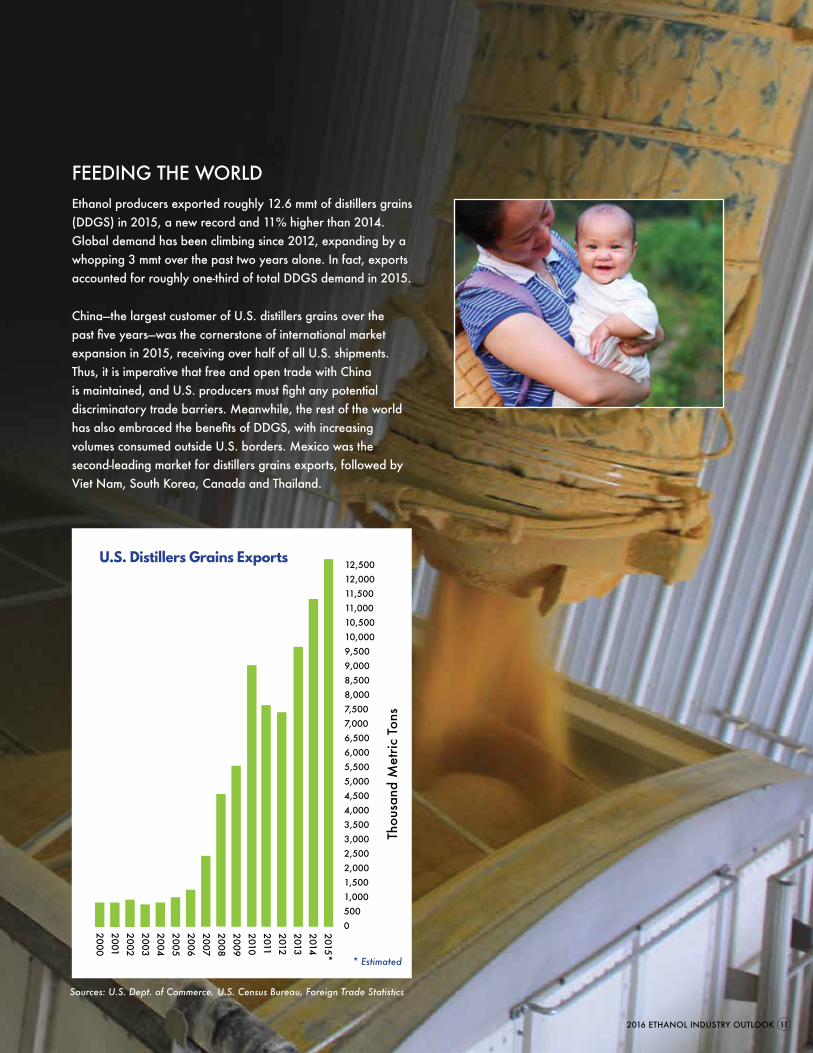
FEEDING THE WORLDEthanol producers exported roughly 12.6 mmt of distillers grains (DDGS) in 2015, a new record and 11% higher than 2014. Global demand has been climbing since 2012, expanding by a whopping 3 mmt over the past two years alone. In fact, exports accounted for roughly one-third of total DDGS demand in 2015.
China—the largest customer of U.S. distillers grains over the past five years—was the cornerstone of international market expansion in 2015, receiving over half of all U.S. shipments. Thus, it is imperative that free and open trade with China is maintained, and U.S. producers must fight any potential discriminatory trade barriers. Meanwhile, the rest of the world has also embraced the benefits of DDGS, with increasing volumes consumed outside U.S. borders. Mexico was the second-leading market for distillers grains exports, followed by Viet Nam, South Korea, Canada and Thailand.
Distillers Grains Feed Production by Type
2015*201420132012201120102009200820072006200520042003200220012000
12,50012,00011,50011,00010,50010,0009,5009,0008,5008,0007,5007,0006,5006,0005,5005,0004,5004,0003,5003,0002,5002,0001,5001,0005000
Thou
sand
Met
ric T
ons
U.S. Ethanol Industry Animal Feed Production
U.S. Distillers Grains Exports
2016 ETHANOL INDUSTRY OUTLOOK 11
Source: RFA analysis of U.S. Dept. of Agriculture dataNote: All distillers grains converted to 10% moisture basis.
Sources: U.S. Dept. of Commerce, U.S. Census Bureau, Foreign Trade Statistics
* Estimated
While the 2015 crash in oil prices led to thousands of layoffs in the petroleum sector and economic challenges for many communities, growth in the ethanol sector continued to serve as a crucial wealth generator for rural areas across the nation. The ethanol industry is responsible for creating well paying, stable jobs in areas where such employment is often hard to come by.
In 2015, the production of 14.7 billion gallons of ethanol supported 85,967 direct jobs in renewable fuel production and agriculture, as well as 271,440 indirect and induced jobs across all sectors of the economy. Not surprisingly, five of the top 10 states with the lowest unemployment rates also rank in the top 10 ethanol-producing states.
The industry added $44 billion to the nation’s Gross Domestic Product (GDP) in 2015 and paid $10 billion in taxes. The sector’s economic activity and job creation helped raise household income by $24 billion. Meanwhile, the U.S. ethanol industry spent $25 million on raw materials, other inputs, and other goods and services.
ECONOMIC IMPACT OF ETHANOL
STABILIZING RURAL ECONOMIESBut more importantly, ethanol industry workers take great pride in what they do. A recent survey by Ethanol Producer Magazine found that more than 90% of ethanol employees are “satisfied” with their jobs, with 66% being “very” or “extremely satisfied.” Amongst the reasons for their job satisfaction, “job security” ranked highest, with “competitive salaries” and “positive work environment” following closely behind.
Jobs in the ethanol industry are not solely limited to those found inside the gates of the biorefinery. America’s renewable fuel industry supports jobs in the following sectors of the economy:
• Electric and water utilities
• Enzyme, yeast, chemical manufacturing
• Engineering and construction
• Machinery repair and maintenance
• Feed merchandising
• Transportation and handling
• Row crop farming
• Seed production
• Farm equipment manufacturing
• Livestock production
• Legal and accounting
• Government and regulatory
• Retail and wholesale fuel marketing
• Natural gas production
12
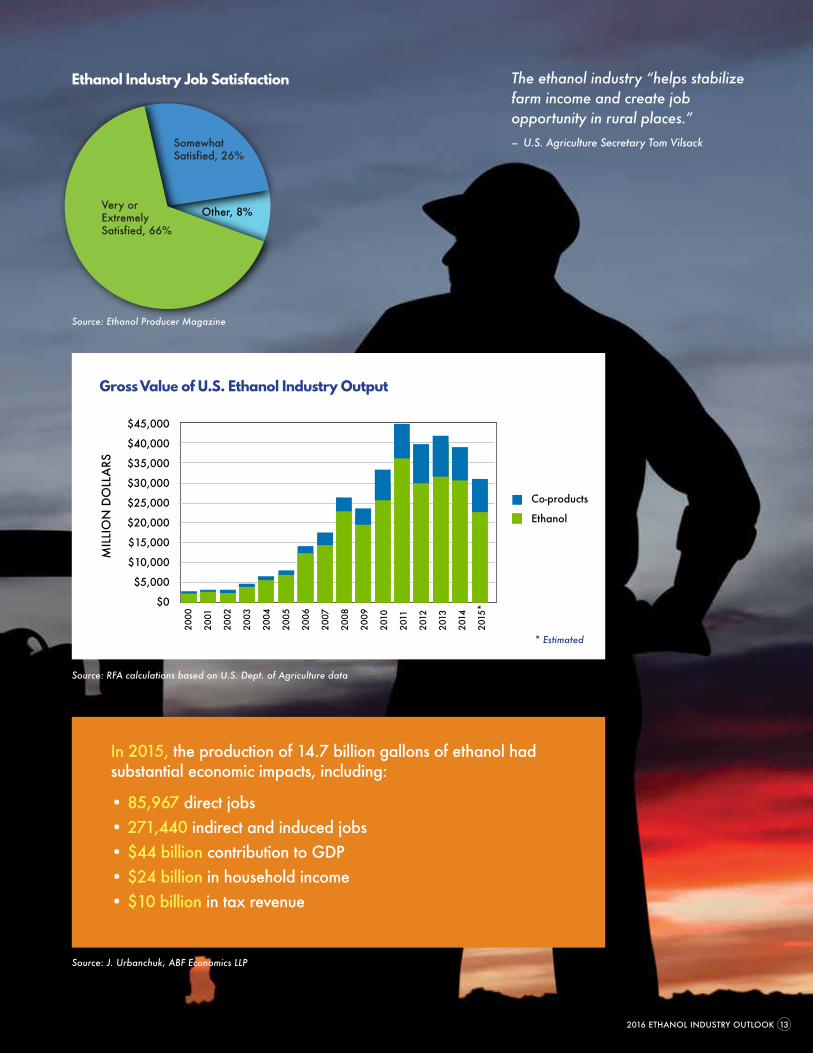
In 2015, the production of 14.7 billion gallons of ethanol had substantial economic impacts, including:
• 85,967 direct jobs• 271,440 indirect and induced jobs• $44 billion contribution to GDP• $24 billion in household income• $10 billion in tax revenue
2016 ETHANOL INDUSTRY OUTLOOK 13
$45,000
$40,000
$35,000
$30,000
$25,000
$20,000
$15,000
$10,000
$5,000
$0
Co-products
Ethanol
2000
2001
2002
2003
2004
2005
2006
2007
2008
2009
2010
2011
2012
2013
2014
2015
*
MIL
LIO
N D
OLL
ARS
Gross Value of U.S. Ethanol Industry Output
* Estimated
Source: RFA calculations based on U.S. Dept. of Agriculture data
The ethanol industry “helps stabilize farm income and create job opportunity in rural places.”
– U.S. Agriculture Secretary Tom Vilsack
Very or Extremely Satisfied, 66%
Somewhat Satisfied, 26%
Other, 8%
Ethanol Industry Job Satisfaction
Source: Ethanol Producer Magazine
Source: J. Urbanchuk, ABF Economics LLP
The unexpected shutdown of a major oil refinery in Indiana in 2015 provided a clear-cut reminder of the dangers of over-reliance on one energy source. Though the Indiana refinery represents less than 2 percent of national refining capacity, the shutdown caused gas prices to spike by 30-40 cents per gallon throughout the Midwest. Increasing our use of domestic alternative fuels, like ethanol, can help blunt the impacts of such market shocks.
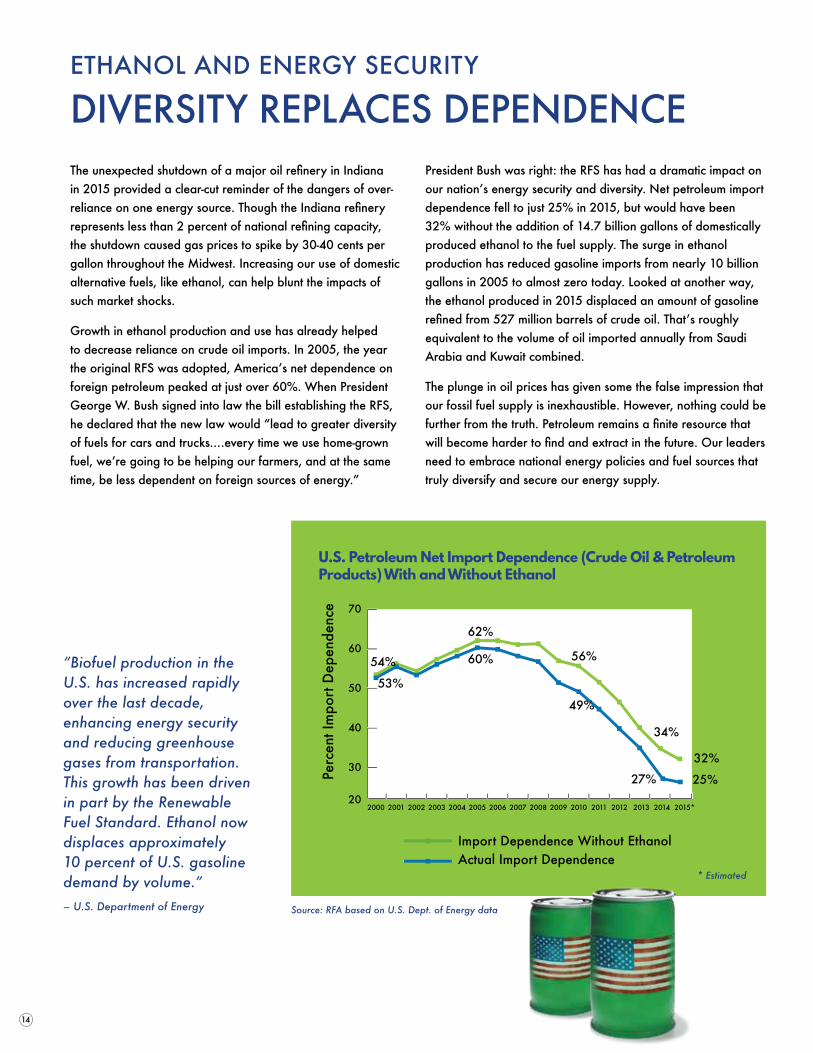
Growth in ethanol production and use has already helped to decrease reliance on crude oil imports. In 2005, the year the original RFS was adopted, America’s net dependence on foreign petroleum peaked at just over 60%. When President George W. Bush signed into law the bill establishing the RFS, he declared that the new law would “lead to greater diversity of fuels for cars and trucks.…every time we use home-grown fuel, we’re going to be helping our farmers, and at the same time, be less dependent on foreign sources of energy.”
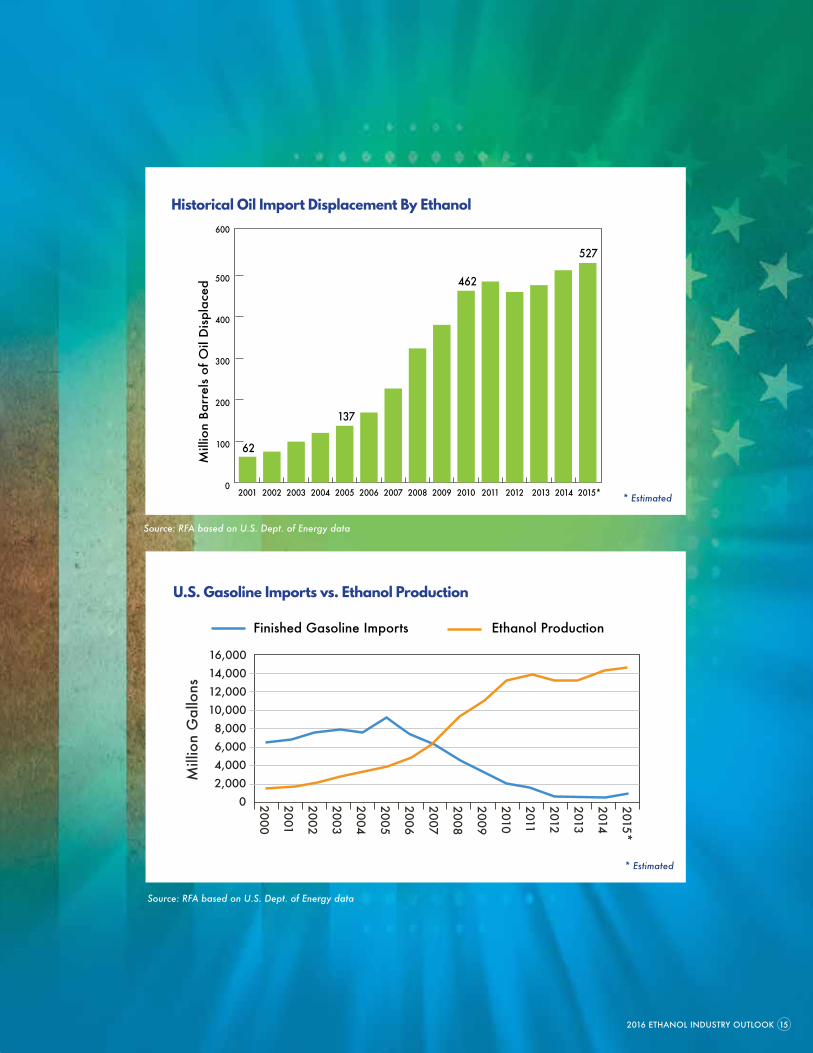
President Bush was right: the RFS has had a dramatic impact on our nation’s energy security and diversity. Net petroleum import dependence fell to just 25% in 2015, but would have been 32% without the addition of 14.7 billion gallons of domestically produced ethanol to the fuel supply. The surge in ethanol production has reduced gasoline imports from nearly 10 billion gallons in 2005 to almost zero today. Looked at another way, the ethanol produced in 2015 displaced an amount of gasoline refined from 527 million barrels of crude oil. That’s roughly equivalent to the volume of oil imported annually from Saudi Arabia and Kuwait combined.
The plunge in oil prices has given some the false impression that our fossil fuel supply is inexhaustible. However, nothing could be further from the truth. Petroleum remains a finite resource that will become harder to find and extract in the future. Our leaders need to embrace national energy policies and fuel sources that truly diversify and secure our energy supply.
ETHANOL AND ENERGY SECURITY
DIVERSITY REPLACES DEPENDENCE
30
20
40
50
60
70
Import Dependence Without EthanolActual Import Dependence
2013 2014 2015*2012201120102009200820072006200520042003200220012000
Perc
ent I
mpo
rt D
epen
denc
e
54%
53%
62%
60% 56%
49%
34%
27%
32%
25%
U.S. Petroleum Net Import Dependence (Crude Oil & Petroleum Products) With and Without Ethanol
“Biofuel production in the U.S. has increased rapidly over the last decade, enhancing energy security and reducing greenhouse gases from transportation. This growth has been driven in part by the Renewable Fuel Standard. Ethanol now displaces approximately 10 percent of U.S. gasoline demand by volume.”
– U.S. Department of Energy
14
* Estimated
Source: RFA based on U.S. Dept. of Energy data
ETHANOL AND ENERGY SECURITY
DIVERSITY REPLACES DEPENDENCE
Historical Oil Import Displacement By Ethanol
U.S. Gasoline Imports vs. Ethanol Production
0
100
200
300
400
500
600
2013 2014 2015*201220112010200920082007200620052004200320022001
Mill
ion
Barr
els
of O
il D
ispl
aced
62
137
462
527
2015*
2014
2013
2012
2011
2010
2009
2008
2007
2006
2005
2004
2003
2002
2001
2000
16,00014,00012,00010,0008,0006,0004,0002,000
0
Mill
ion
Gal
lons
Finished Gasoline Imports Ethanol Production
2016 ETHANOL INDUSTRY OUTLOOK 15
* Estimated
* Estimated
Source: RFA based on U.S. Dept. of Energy data
Source: RFA based on U.S. Dept. of Energy data
Even in the face of low corn prices, record feed supplies, and falling food prices, opponents of ethanol unbelievably clung to the contrived “food vs. fuel” myth in 2015. Lobbyists representing fast food restaurants, grocery manufacturers, and corporate poultry producers continued to suggest that the RFS is responsible for higher food prices. But their absurd claims fell on deaf ears…and for good reason.
Farmers harvested a corn crop of 13.6 billion bushels in 2015—the third-largest ever, trailing only 2014’s record crop and 2013’s robust haul. When grain stocks and ethanol co-products are properly considered, more grain is available for food and feed today than ever before. What’s more, global grain supplies and ending stocks were projected to hit all-time highs in 2015/16, and just 2.95% of that record supply is expected to be used for U.S. ethanol production—a six-year low.
ETHANOL AND FOOD/FEED MARKETS
NOURISHING THE TRUTHMeanwhile, food price inflation continued its downward trend, and consumers are spending a smaller portion of their income on food today than before. Between 1980 and 2004, food prices increased by an average of 3.5% per year; in contrast, food prices have risen by an average of just 2.7% per year since 2005, the year RFS was adopted. Further, the world food price index in 2015 fell to its lowest point since the global financial crisis of 2009.
0% 10% 20% 30% 40% 50% 60% 70% 80% 90% 100%
Transportation, Energy, Labor, Packaging, Advertising, Etc.Farm
Ingredients
Source: U.S. Dept. of Agriculture
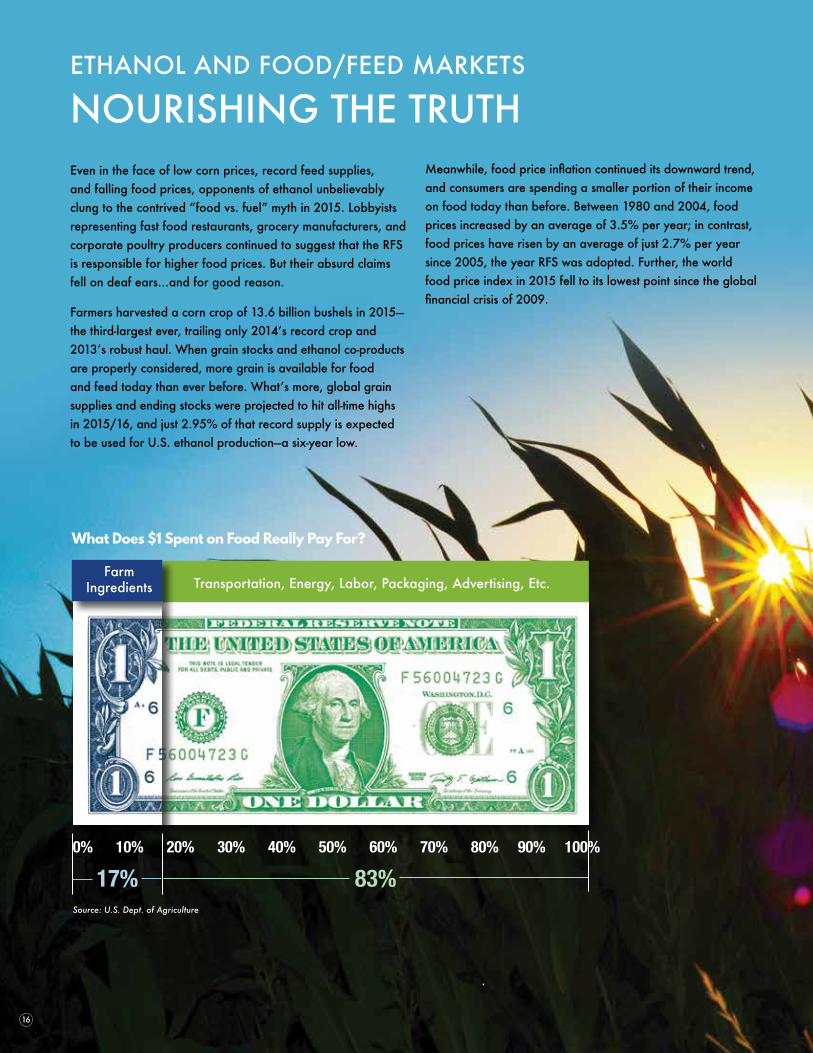
17% 83%
16
What Does $1 Spent on Food Really Pay For?
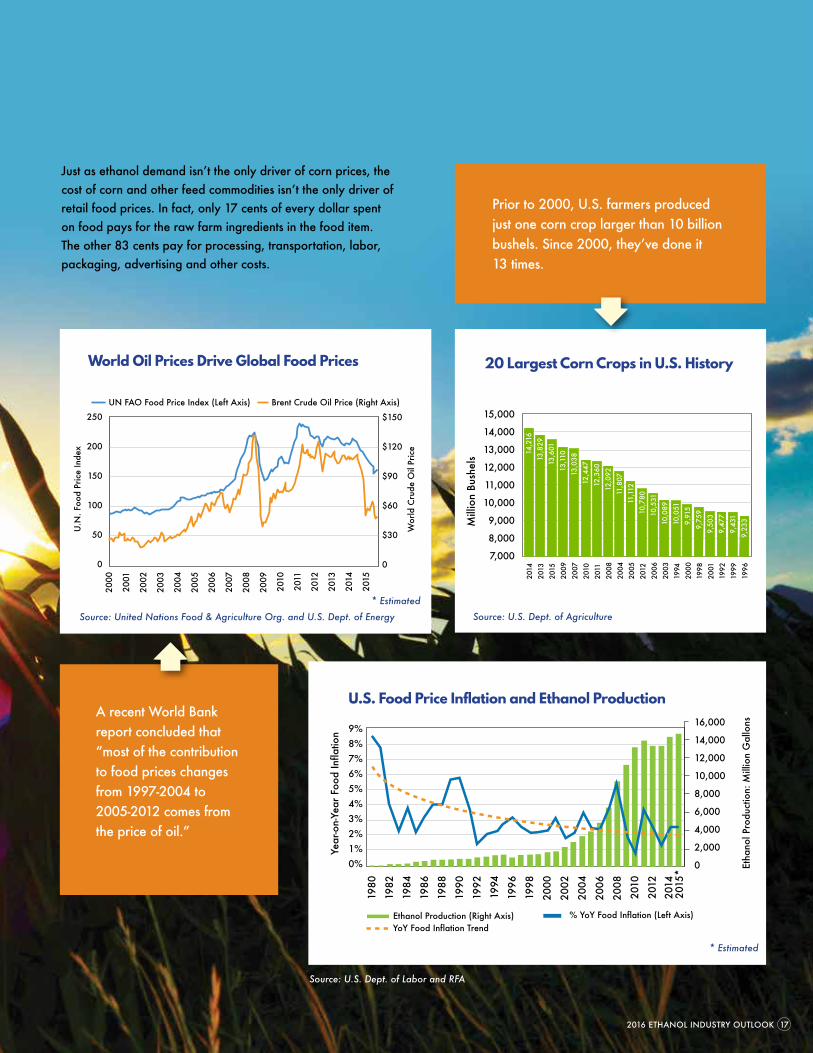
Prior to 2000, U.S. farmers produced just one corn crop larger than 10 billion bushels. Since 2000, they’ve done it 13 times.
Just as ethanol demand isn’t the only driver of corn prices, the cost of corn and other feed commodities isn’t the only driver of retail food prices. In fact, only 17 cents of every dollar spent on food pays for the raw farm ingredients in the food item. The other 83 cents pay for processing, transportation, labor, packaging, advertising and other costs.
250
200
150
100
50
0
2000
2001
2002
2003
2004
2005
2006
2007
2008
2009
2010
2011
2012
2013
2014
2015
$150
$120
$90
$60
$30
0
UN FAO Food Price Index (Left Axis) Brent Crude Oil Price (Right Axis)
U.N
. Foo
d Pr
ice
Inde
x
Wor
ld C
rude
Oil
Pric
e
9%8%7%6%5%4%3%2%1%0%
16,000
14,000
12,000
10,000
8,000
6,000
4,000
2,000
0
1980
1982
1984
1986
1988
1990
1992
1994
1996
1998
2000
2002
2004
2006
2008
2010
2012
Year
-on-
Year
Foo
d In
flatio
n
Ethanol Production (Right Axis)YoY Food Inflation Trend
% YoY Food Inflation (Left Axis)
Etha
nol P
rodu
ctio
n: M
illio
n G
allo
ns
2014
20
15*
A recent World Bank report concluded that “most of the contribution to food prices changes from 1997-2004 to 2005-2012 comes from the price of oil.”
World Oil Prices Drive Global Food Prices
U.S. Food Price Inflation and Ethanol Production
15,000
14,000
13,000
12,000
11,000
10,000
9,000
8,000
7,000
2014
2013
2015
2009
2007
2010
2011
2008
2004
2005
2012
2006
2003
1994
2000
1998
2001
1992
1999
1996
14
,216
13,8
29
13,
601
13,
110
1
3,03
8
1
2,44
7
12
,360
1
2,09
2
1
1,80
7
11,
112
1
0,78
0
10,
531
10,0
89
10
,051
9,91
5
9,7
59 9
,503
9,4
77 9
,431
9,23
3Mill
ion
Bush
els
20 Largest Corn Crops in U.S. History
2016 ETHANOL INDUSTRY OUTLOOK 17
* Estimated
* Estimated
Source: U.S. Dept. of Labor and RFA
Source: United Nations Food & Agriculture Org. and U.S. Dept. of Energy Source: U.S. Dept. of Agriculture
The Renewable Fuel Standard (RFS) celebrated its 10th anniversary in 2015, and the occasion provided an excellent opportunity to reflect on the program’s many successes. Originally adopted in 2005, the RFS was greatly expanded two years later with the goals of reducing petroleum consumption, combating climate change, and stimulating the farm economy.
RENEWABLE FUEL STANDARD
10 YEARS OF SUCCESSWithout a doubt, tremendous progress has been made toward achieving the original objectives of the RFS. Biofuel production and consumption have grown dramatically. Dependence on petroleum imports is down significantly. Greenhouse gas emissions from transportation have fallen. The value of agricultural products rose to record levels. And, communities across the country have benefited from the job creation, tax revenue, and household income that stem from the construction and operation of a biorefinery.
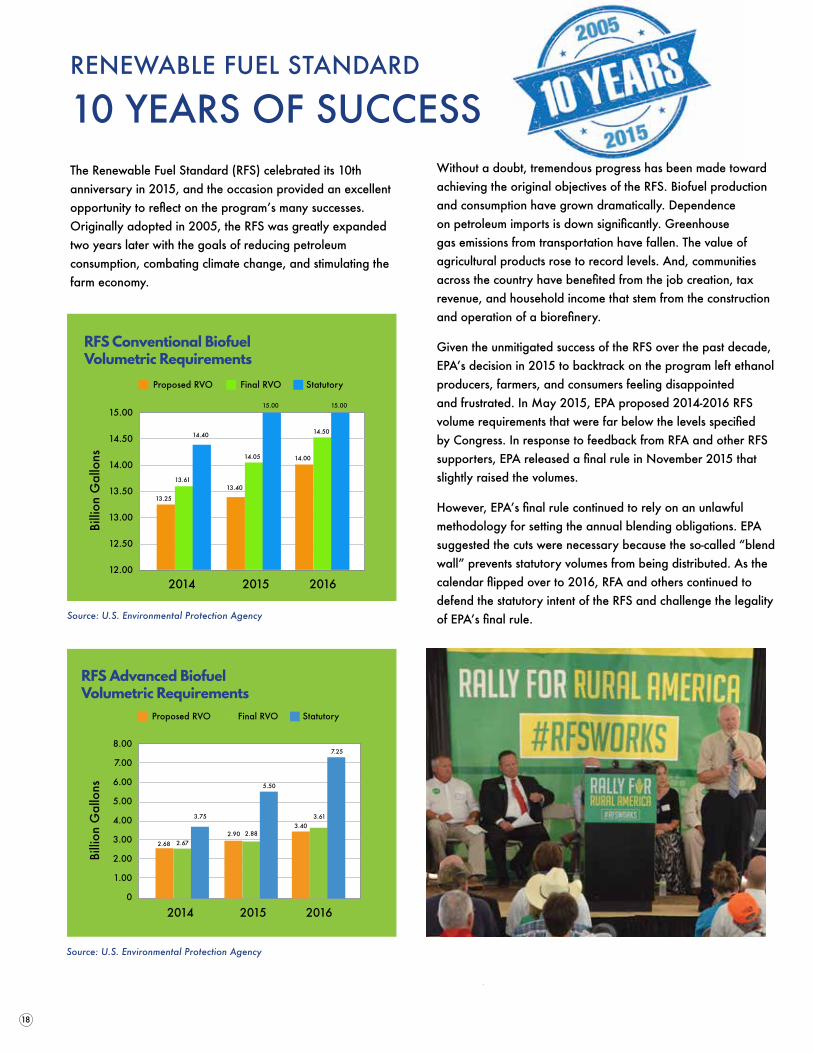
Given the unmitigated success of the RFS over the past decade, EPA’s decision in 2015 to backtrack on the program left ethanol producers, farmers, and consumers feeling disappointed and frustrated. In May 2015, EPA proposed 2014-2016 RFS volume requirements that were far below the levels specified by Congress. In response to feedback from RFA and other RFS supporters, EPA released a final rule in November 2015 that slightly raised the volumes.
However, EPA’s final rule continued to rely on an unlawful methodology for setting the annual blending obligations. EPA suggested the cuts were necessary because the so-called “blend wall” prevents statutory volumes from being distributed. As the calendar flipped over to 2016, RFA and others continued to defend the statutory intent of the RFS and challenge the legality of EPA’s final rule.
18
15.00
14.50
14.00
13.50
13.00
12.50
12.00
Billi
on G
allo
ns
2014 2015 2016
Proposed RVO Final RVO Statutory
13.25
13.61
14.40
14.05
13.40
15.00 15.00
14.50
14.00
Source: U.S. Environmental Protection Agency
RFS Conventional Biofuel Volumetric Requirements
Source: U.S. Environmental Protection Agency
8.00
7.00
6.00
5.00
4.00
3.00
2.00
1.00
0
Billi
on G
allo
ns
2014 2015 2016
Proposed RVO Final RVO Statutory
2.68 2.67
3.75
2.882.90
5.50
7.25
3.613.40
RFS Advanced Biofuel Volumetric Requirements
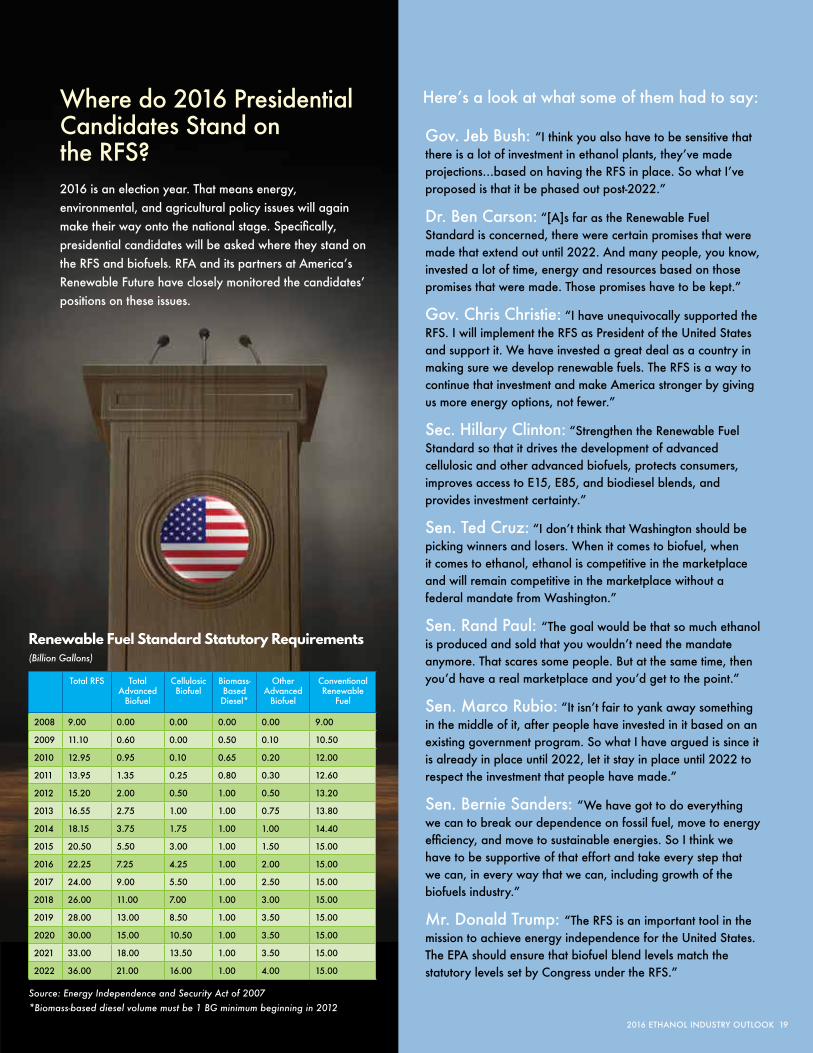
Where do 2016 Presidential Candidates Stand on the RFS?2016 is an election year. That means energy, environmental, and agricultural policy issues will again make their way onto the national stage. Specifically, presidential candidates will be asked where they stand on the RFS and biofuels. RFA and its partners at America’s Renewable Future have closely monitored the candidates’ positions on these issues.
Total RFS Total Advanced
Biofuel
Cellulosic Biofuel
Biomass-Based Diesel*
Other Advanced
Biofuel
Conventional Renewable
Fuel
2008 9.00 0.00 0.00 0.00 0.00 9.00
2009 11.10 0.60 0.00 0.50 0.10 10.50
2010 12.95 0.95 0.10 0.65 0.20 12.00
2011 13.95 1.35 0.25 0.80 0.30 12.60
2012 15.20 2.00 0.50 1.00 0.50 13.20
2013 16.55 2.75 1.00 1.00 0.75 13.80
2014 18.15 3.75 1.75 1.00 1.00 14.40
2015 20.50 5.50 3.00 1.00 1.50 15.00
2016 22.25 7.25 4.25 1.00 2.00 15.00
2017 24.00 9.00 5.50 1.00 2.50 15.00
2018 26.00 11.00 7.00 1.00 3.00 15.00
2019 28.00 13.00 8.50 1.00 3.50 15.00
2020 30.00 15.00 10.50 1.00 3.50 15.00
2021 33.00 18.00 13.50 1.00 3.50 15.00
2022 36.00 21.00 16.00 1.00 4.00 15.00
2016 ETHANOL INDUSTRY OUTLOOK 19
Renewable Fuel Standard Statutory Requirements (Billion Gallons)
Gov. Jeb Bush: “I think you also have to be sensitive that there is a lot of investment in ethanol plants, they’ve made projections…based on having the RFS in place. So what I’ve proposed is that it be phased out post-2022.”
Dr. Ben Carson: “[A]s far as the Renewable Fuel Standard is concerned, there were certain promises that were made that extend out until 2022. And many people, you know, invested a lot of time, energy and resources based on those promises that were made. Those promises have to be kept.”
Gov. Chris Christie: “I have unequivocally supported the RFS. I will implement the RFS as President of the United States and support it. We have invested a great deal as a country in making sure we develop renewable fuels. The RFS is a way to continue that investment and make America stronger by giving us more energy options, not fewer.”
Sec. Hillary Clinton: “Strengthen the Renewable Fuel Standard so that it drives the development of advanced cellulosic and other advanced biofuels, protects consumers, improves access to E15, E85, and biodiesel blends, and provides investment certainty.”
Sen. Ted Cruz: “I don’t think that Washington should be picking winners and losers. When it comes to biofuel, when it comes to ethanol, ethanol is competitive in the marketplace and will remain competitive in the marketplace without a federal mandate from Washington.”
Sen. Rand Paul: “The goal would be that so much ethanol is produced and sold that you wouldn’t need the mandate anymore. That scares some people. But at the same time, then you’d have a real marketplace and you’d get to the point.”
Sen. Marco Rubio: “It isn’t fair to yank away something in the middle of it, after people have invested in it based on an existing government program. So what I have argued is since it is already in place until 2022, let it stay in place until 2022 to respect the investment that people have made.”
Sen. Bernie Sanders: “We have got to do everything we can to break our dependence on fossil fuel, move to energy efficiency, and move to sustainable energies. So I think we have to be supportive of that effort and take every step that we can, in every way that we can, including growth of the biofuels industry.”
Mr. Donald Trump: “The RFS is an important tool in the mission to achieve energy independence for the United States. The EPA should ensure that biofuel blend levels match the statutory levels set by Congress under the RFS.”
Source: Energy Independence and Security Act of 2007 *Biomass-based diesel volume must be 1 BG minimum beginning in 2012
Here’s a look at what some of them had to say:
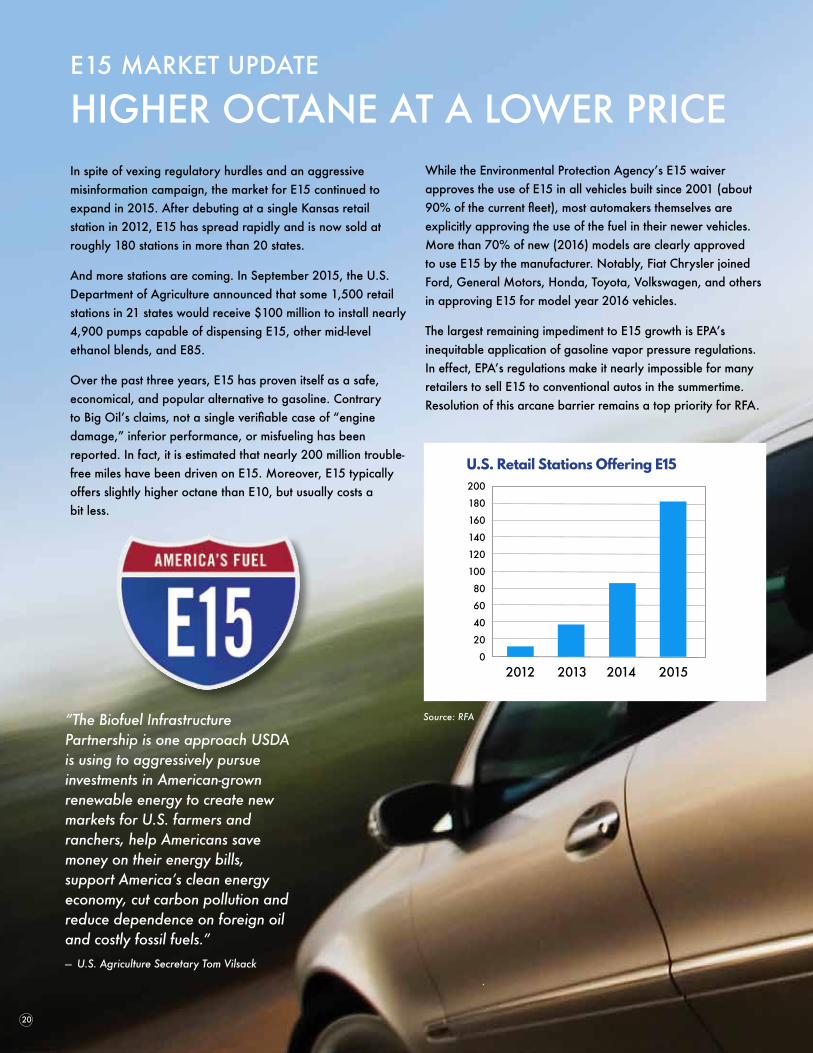
In spite of vexing regulatory hurdles and an aggressive misinformation campaign, the market for E15 continued to expand in 2015. After debuting at a single Kansas retail station in 2012, E15 has spread rapidly and is now sold at roughly 180 stations in more than 20 states.
And more stations are coming. In September 2015, the U.S. Department of Agriculture announced that some 1,500 retail stations in 21 states would receive $100 million to install nearly 4,900 pumps capable of dispensing E15, other mid-level ethanol blends, and E85.
Over the past three years, E15 has proven itself as a safe, economical, and popular alternative to gasoline. Contrary to Big Oil’s claims, not a single verifiable case of “engine damage,” inferior performance, or misfueling has been reported. In fact, it is estimated that nearly 200 million trouble-free miles have been driven on E15. Moreover, E15 typically offers slightly higher octane than E10, but usually costs a bit less.
E15 MARKET UPDATE
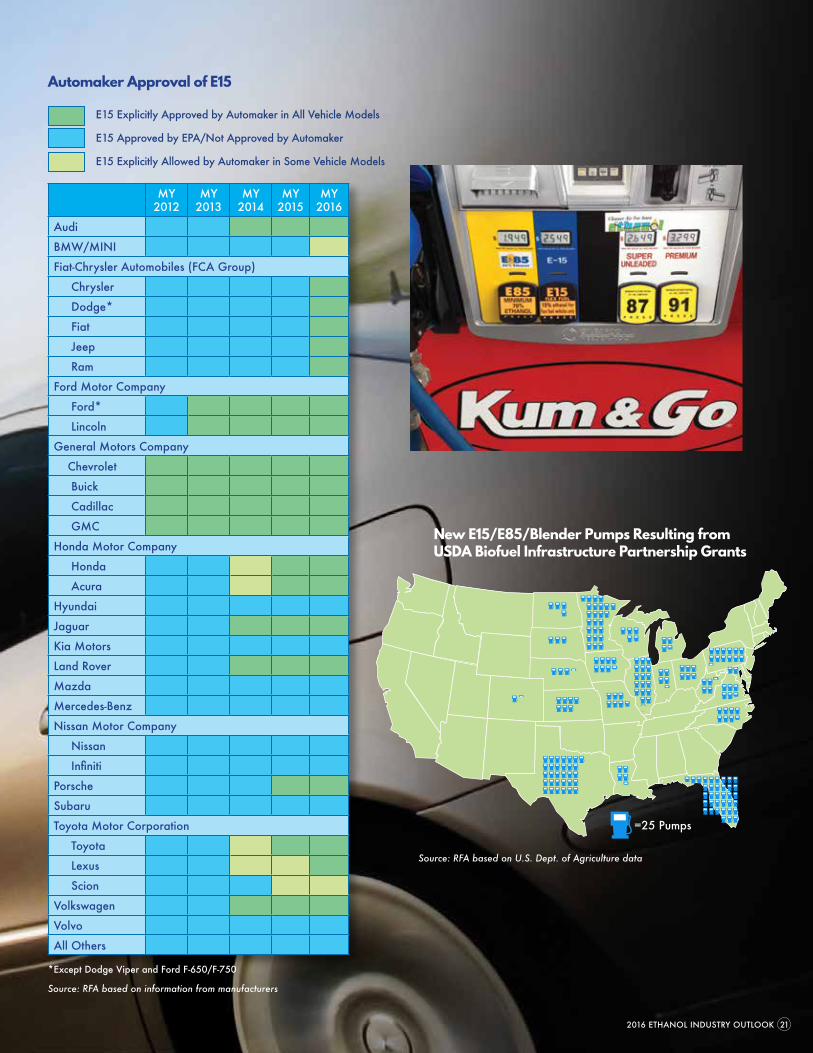
HIGHER OCTANE AT A LOWER PRICEWhile the Environmental Protection Agency’s E15 waiver approves the use of E15 in all vehicles built since 2001 (about 90% of the current fleet), most automakers themselves are explicitly approving the use of the fuel in their newer vehicles. More than 70% of new (2016) models are clearly approved to use E15 by the manufacturer. Notably, Fiat Chrysler joined Ford, General Motors, Honda, Toyota, Volkswagen, and others in approving E15 for model year 2016 vehicles.
The largest remaining impediment to E15 growth is EPA’s inequitable application of gasoline vapor pressure regulations. In effect, EPA’s regulations make it nearly impossible for many retailers to sell E15 to conventional autos in the summertime. Resolution of this arcane barrier remains a top priority for RFA.
20
“The Biofuel Infrastructure Partnership is one approach USDA is using to aggressively pursue investments in American-grown renewable energy to create new markets for U.S. farmers and ranchers, help Americans save money on their energy bills, support America’s clean energy economy, cut carbon pollution and reduce dependence on foreign oil and costly fossil fuels.”
— U.S. Agriculture Secretary Tom Vilsack
200
180
160
140
120
100
80
60
40
20
02012 2013 2014 2015
U.S. Retail Stations Offering E15
Source: RFA
2016 ETHANOL INDUSTRY OUTLOOK 21
Source: RFA based on information from manufacturers
MY 2012
MY 2013
MY 2014
MY 2015
MY 2016
Audi
BMW/MINI
Fiat-Chrysler Automobiles (FCA Group)
Chrysler
Dodge*
Fiat
Jeep
Ram
Ford Motor Company
Ford*
Lincoln
General Motors Company
Chevrolet
Buick
Cadillac
GMC
Honda Motor Company
Honda
Acura
Hyundai
Jaguar
Kia Motors
Land Rover
Mazda
Mercedes-Benz
Nissan Motor Company
Nissan
Infiniti
Porsche
Subaru
Toyota Motor Corporation
Toyota
Lexus
Scion
Volkswagen
Volvo
All Others
E15 Explicitly Approved by Automaker in All Vehicle Models
E15 Approved by EPA/Not Approved by Automaker
E15 Explicitly Allowed by Automaker in Some Vehicle Models
=25 Pumps
*Except Dodge Viper and Ford F-650/F-750
New E15/E85/Blender Pumps Resulting from USDA Biofuel Infrastructure Partnership Grants
Source: RFA based on U.S. Dept. of Agriculture data
U.S. Retail Stations Offering E15
Automaker Approval of E15
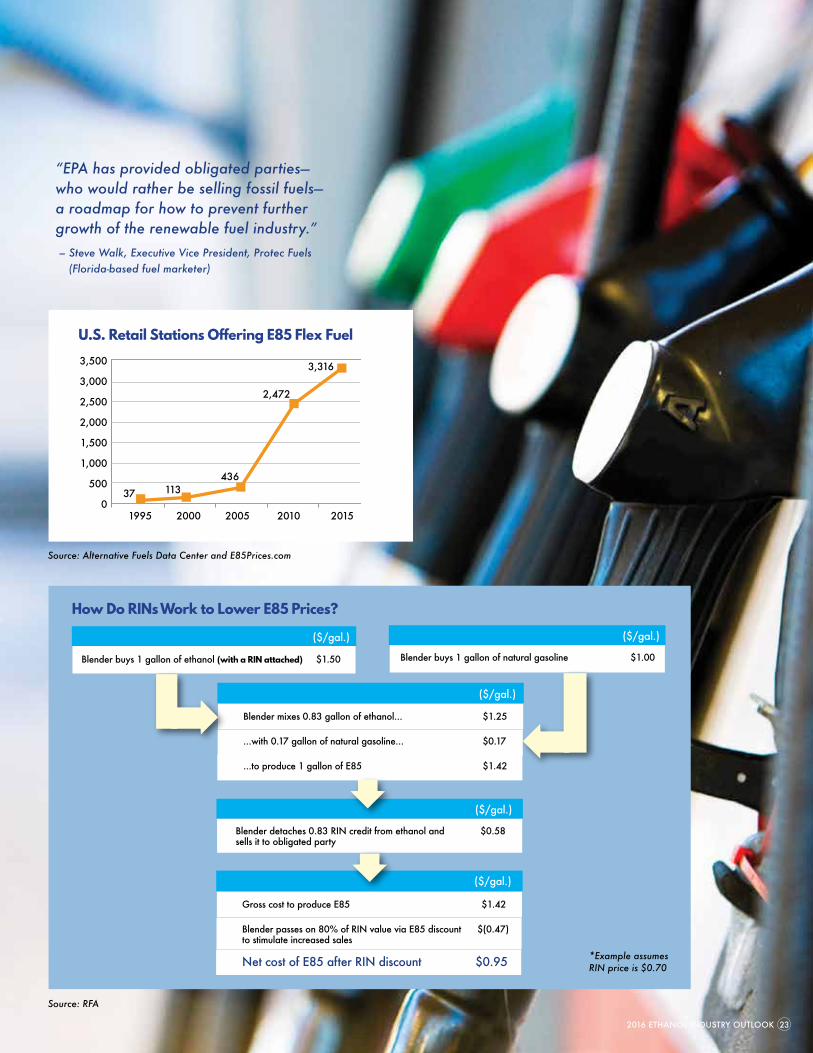
The market for E85 and other flex fuels took two steps forward and one big step backward in 2015. First, the population of flex-fuel vehicles (FFVs) continued to grow, meaning more consumers have the ability to choose E85 and other flex fuels at the pump. Second, more retail gas stations began offering E85, with significant growth occurring in the densely populated southeast and west coast regions. These two important developments helped move E85 forward in 2015.
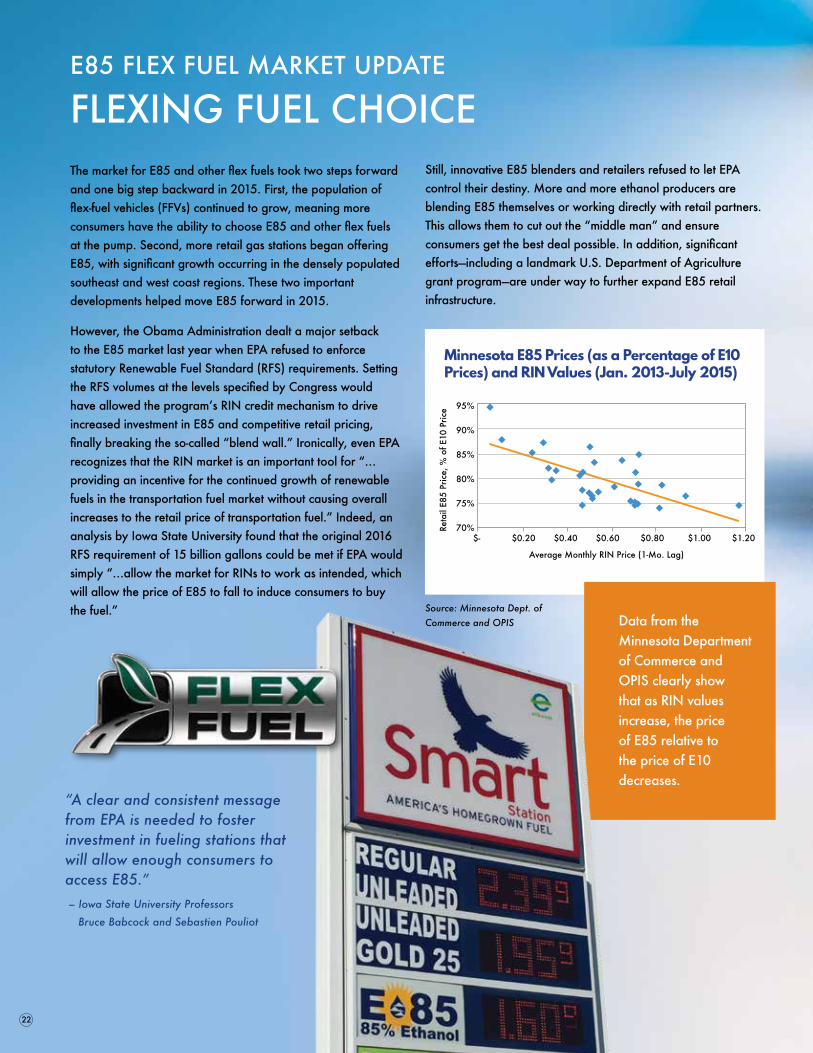
However, the Obama Administration dealt a major setback to the E85 market last year when EPA refused to enforce statutory Renewable Fuel Standard (RFS) requirements. Setting the RFS volumes at the levels specified by Congress would have allowed the program’s RIN credit mechanism to drive increased investment in E85 and competitive retail pricing, finally breaking the so-called “blend wall.” Ironically, even EPA recognizes that the RIN market is an important tool for “…providing an incentive for the continued growth of renewable fuels in the transportation fuel market without causing overall increases to the retail price of transportation fuel.” Indeed, an analysis by Iowa State University found that the original 2016 RFS requirement of 15 billion gallons could be met if EPA would simply “…allow the market for RINs to work as intended, which will allow the price of E85 to fall to induce consumers to buy the fuel.”
E85 FLEX FUEL MARKET UPDATE
FLEXING FUEL CHOICE
“A clear and consistent message from EPA is needed to foster investment in fueling stations that will allow enough consumers to access E85.” – Iowa State University Professors Bruce Babcock and Sebastien Pouliot
Still, innovative E85 blenders and retailers refused to let EPA control their destiny. More and more ethanol producers are blending E85 themselves or working directly with retail partners. This allows them to cut out the “middle man” and ensure consumers get the best deal possible. In addition, significant efforts—including a landmark U.S. Department of Agriculture grant program—are under way to further expand E85 retail infrastructure.
22
95%
90%
85%
80%
75%
70%$- $0.20 $0.40 $0.60 $0.80 $1.00 $1.20
Reta
il E8
5 Pr
ice,
% o
f E10
Pric
e
Average Monthly RIN Price (1-Mo. Lag)
Data from the Minnesota Department of Commerce and OPIS clearly show that as RIN values increase, the price of E85 relative to the price of E10 decreases.
Minnesota E85 Prices (as a Percentage of E10 Prices) and RIN Values (Jan. 2013-July 2015)
Source: Minnesota Dept. of Commerce and OPIS
2016 ETHANOL INDUSTRY OUTLOOK 23
“EPA has provided obligated parties—who would rather be selling fossil fuels—a roadmap for how to prevent further growth of the renewable fuel industry.” – Steve Walk, Executive Vice President, Protec Fuels (Florida-based fuel marketer)
Blender buys 1 gallon of ethanol (with a RIN attached) $1.50 Blender buys 1 gallon of natural gasoline $1.00
Blender mixes 0.83 gallon of ethanol... $1.25
...with 0.17 gallon of natural gasoline... $0.17
...to produce 1 gallon of E85 $1.42
Blender detaches 0.83 RIN credit from ethanol and $0.58sells it to obligated party
Gross cost to produce E85 $1.42
Blender passes on 80% of RIN value via E85 discount $(0.47) to stimulate increased sales
Net cost of E85 after RIN discount $0.95
($/gal.) ($/gal.)
($/gal.)
($/gal.)
($/gal.)
How Do RINs Work to Lower E85 Prices?
U.S. Retail Stations Offering E85 Flex Fuel
Source: Alternative Fuels Data Center and E85Prices.com
3,500
3,000
2,500
2,000
1,500
1,000
500
01995 2000 2005 2010 2015
3,316
2,472
43611337
Source: RFA
*Example assumes RIN price is $0.70
24
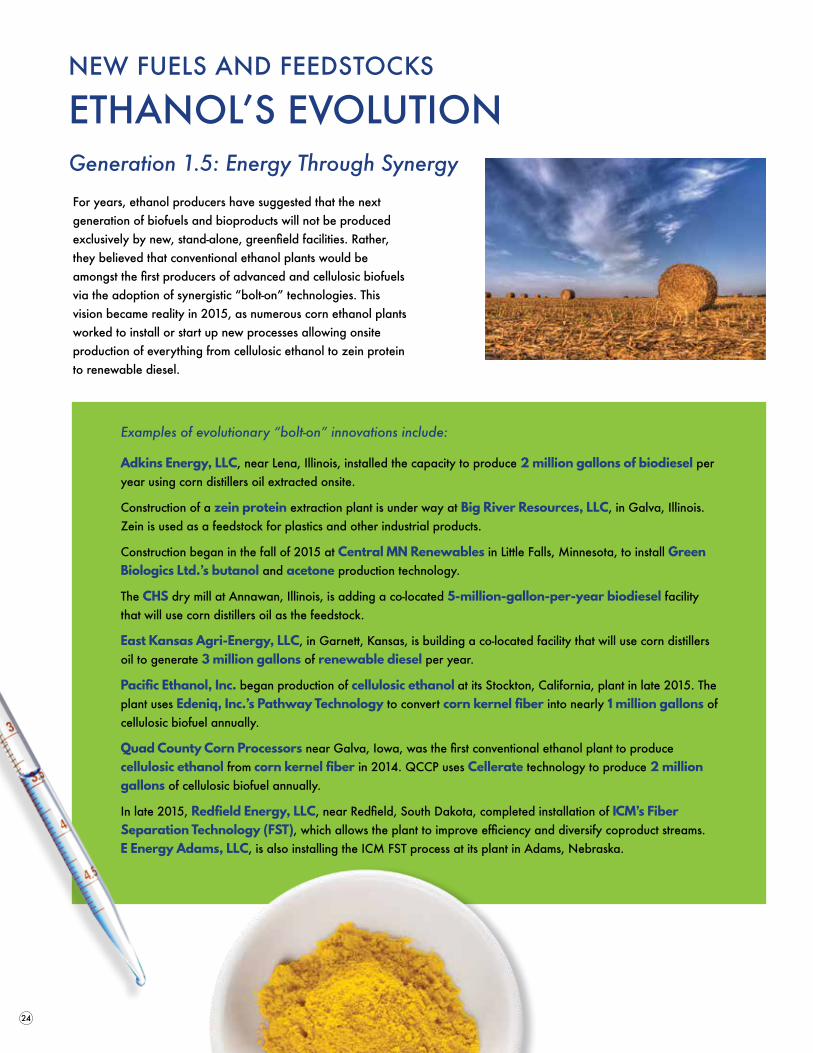
For years, ethanol producers have suggested that the next generation of biofuels and bioproducts will not be produced exclusively by new, stand-alone, greenfield facilities. Rather, they believed that conventional ethanol plants would be amongst the first producers of advanced and cellulosic biofuels via the adoption of synergistic “bolt-on” technologies. This vision became reality in 2015, as numerous corn ethanol plants worked to install or start up new processes allowing onsite production of everything from cellulosic ethanol to zein protein to renewable diesel.
NEW FUELS AND FEEDSTOCKS
ETHANOL’S EVOLUTION
Examples of evolutionary “bolt-on” innovations include:
Adkins Energy, LLC, near Lena, Illinois, installed the capacity to produce 2 million gallons of biodiesel per year using corn distillers oil extracted onsite.
Construction of a zein protein extraction plant is under way at Big River Resources, LLC, in Galva, Illinois. Zein is used as a feedstock for plastics and other industrial products.
Construction began in the fall of 2015 at Central MN Renewables in Little Falls, Minnesota, to install Green Biologics Ltd.’s butanol and acetone production technology.
The CHS dry mill at Annawan, Illinois, is adding a co-located 5-million-gallon-per-year biodiesel facility that will use corn distillers oil as the feedstock.
East Kansas Agri-Energy, LLC, in Garnett, Kansas, is building a co-located facility that will use corn distillers oil to generate 3 million gallons of renewable diesel per year.
Pacific Ethanol, Inc. began production of cellulosic ethanol at its Stockton, California, plant in late 2015. The plant uses Edeniq, Inc.’s Pathway Technology to convert corn kernel fiber into nearly 1 million gallons of cellulosic biofuel annually.
Quad County Corn Processors near Galva, Iowa, was the first conventional ethanol plant to produce cellulosic ethanol from corn kernel fiber in 2014. QCCP uses Cellerate technology to produce 2 million gallons of cellulosic biofuel annually.
In late 2015, Redfield Energy, LLC, near Redfield, South Dakota, completed installation of ICM’s Fiber Separation Technology (FST), which allows the plant to improve efficiency and diversify coproduct streams. E Energy Adams, LLC, is also installing the ICM FST process at its plant in Adams, Nebraska.
Generation 1.5: Energy Through Synergy
2016 ETHANOL INDUSTRY OUTLOOK 25
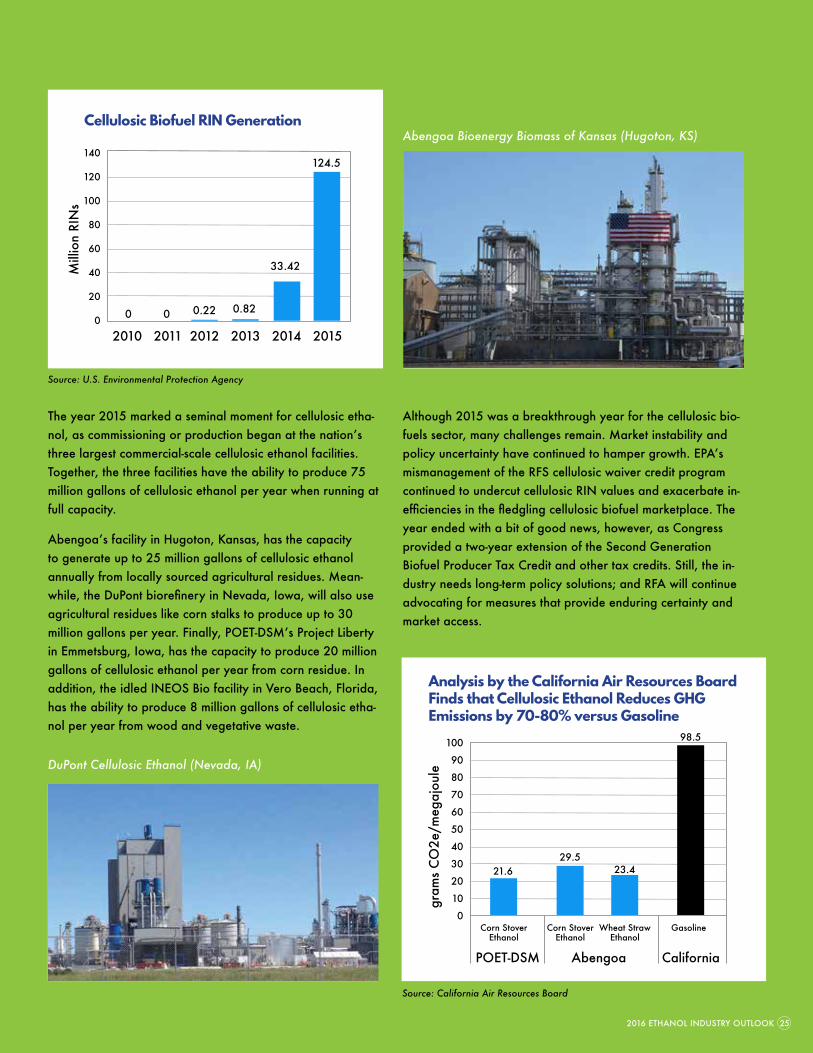
The year 2015 marked a seminal moment for cellulosic etha-nol, as commissioning or production began at the nation’s three largest commercial-scale cellulosic ethanol facilities. Together, the three facilities have the ability to produce 75 million gallons of cellulosic ethanol per year when running at full capacity.
Abengoa’s facility in Hugoton, Kansas, has the capacity to generate up to 25 million gallons of cellulosic ethanol annually from locally sourced agricultural residues. Mean-while, the DuPont biorefinery in Nevada, Iowa, will also use agricultural residues like corn stalks to produce up to 30 million gallons per year. Finally, POET-DSM’s Project Liberty in Emmetsburg, Iowa, has the capacity to produce 20 million gallons of cellulosic ethanol per year from corn residue. In addition, the idled INEOS Bio facility in Vero Beach, Florida, has the ability to produce 8 million gallons of cellulosic etha-nol per year from wood and vegetative waste.
Although 2015 was a breakthrough year for the cellulosic bio-fuels sector, many challenges remain. Market instability and policy uncertainty have continued to hamper growth. EPA’s mismanagement of the RFS cellulosic waiver credit program continued to undercut cellulosic RIN values and exacerbate in-efficiencies in the fledgling cellulosic biofuel marketplace. The year ended with a bit of good news, however, as Congress provided a two-year extension of the Second Generation Biofuel Producer Tax Credit and other tax credits. Still, the in-dustry needs long-term policy solutions; and RFA will continue advocating for measures that provide enduring certainty and market access.
140
120
100
80
60
40
20
0
2010 2011 2012 2013 2014 2015
Mill
ion
RIN
s
0 0 0.22 0.82
33.42
124.5
Cellulosic Biofuel RIN Generation
100
90
80
70
60
50
40
30
20
10
0
POET-DSM Abengoa California
gram
s C
O2e
/meg
ajou
le
98.5
Corn Stover Ethanol
Corn Stover Ethanol
Wheat Straw Ethanol
Gasoline
29.521.6 23.4
Analysis by the California Air Resources Board Finds that Cellulosic Ethanol Reduces GHG Emissions by 70-80% versus Gasoline
Source: California Air Resources Board
Abengoa Bioenergy Biomass of Kansas (Hugoton, KS)
DuPont Cellulosic Ethanol (Nevada, IA)
Source: U.S. Environmental Protection Agency
While some have argued that grain ethanol is a “mature technology” with little room for improvement, America’s ethanol producers have proven otherwise. Engineering and design enhancements, new process technologies, automation upgrades, and other advances have led to remarkable gains in efficiency.
In turn, those efficiency improvements have reduced the energy intensity and environmental impacts associated with making ethanol. In other words, today’s ethanol producers are doing more with less. Natural gas and electricity use at dry mill ethanol plants has fallen nearly 40% since 1995, while consumptive water use has been cut in half.
ETHANOL AND SUSTAINABILITY
DOING MORE WITH LESSMeanwhile, producers are getting more out of each bushel of corn processed. Today’s dry mill plants produce 2.8-2.9 gallons of ethanol per bushel, up more than 15% over the past 20 years. In addition, each bushel processed by a dry mill is also yielding about 0.6 pounds of corn distillers oil, a feedstock for biodiesel or animal feed. Ethanol producers also captured and marketed 2.5 million tons of carbon dioxide in 2015.
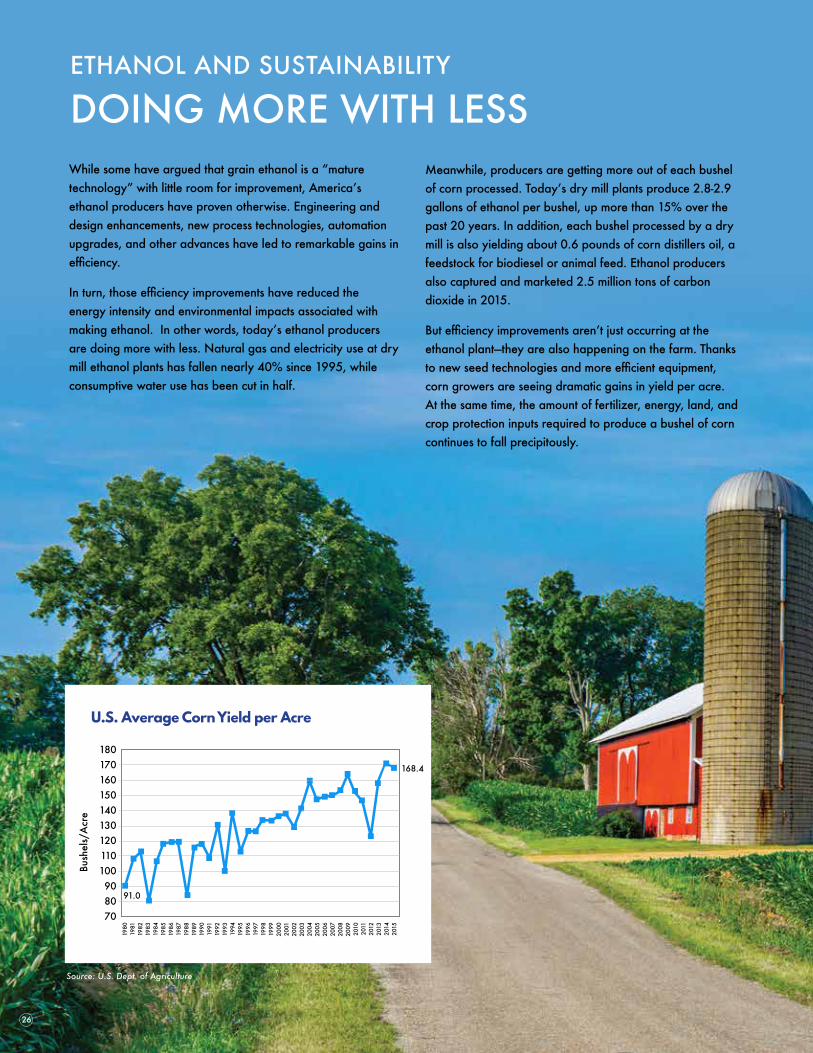
But efficiency improvements aren’t just occurring at the ethanol plant—they are also happening on the farm. Thanks to new seed technologies and more efficient equipment, corn growers are seeing dramatic gains in yield per acre. At the same time, the amount of fertilizer, energy, land, and crop protection inputs required to produce a bushel of corn continues to fall precipitously.
26
180170160150140130120110100908070
1980
1981
1982
1983
1984
1985
1986
1987
1988
1989
1990
1991
1992
1993
1994
1995
1996
1997
1998
1999
2000
2001
2002
2003
2004
2005
2006
2007
2008
2009
2010
2011
2012
2013
2014
2015
Bush
els/
Acr
e
91.0
168.4
U.S. Average Corn Yield per Acre
Source: U.S. Dept. of Agriculture
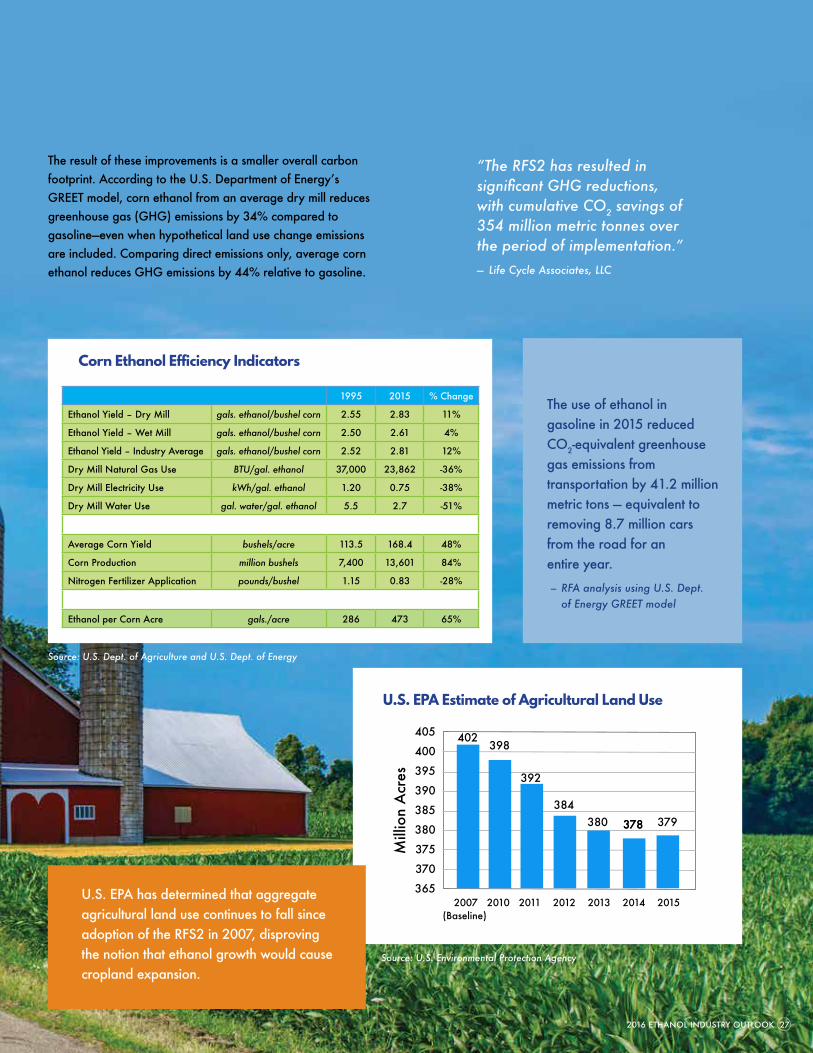
“The RFS2 has resulted in significant GHG reductions, with cumulative CO2 savings of 354 million metric tonnes over the period of implementation.”— Life Cycle Associates, LLC
2016 ETHANOL INDUSTRY OUTLOOK 27
Source: U.S. Environmental Protection Agency
The result of these improvements is a smaller overall carbon footprint. According to the U.S. Department of Energy’s GREET model, corn ethanol from an average dry mill reduces greenhouse gas (GHG) emissions by 34% compared to gasoline—even when hypothetical land use change emissions are included. Comparing direct emissions only, average corn ethanol reduces GHG emissions by 44% relative to gasoline.
U.S. EPA has determined that aggregate agricultural land use continues to fall since adoption of the RFS2 in 2007, disproving the notion that ethanol growth would cause cropland expansion.
405
400
395
390
385
380
375
370
365
Mill
ion
Acr
es
2007 2010 2011 2012 2013 2014 2015
402398
392
384380 378 379
(Baseline)
378
U.S. EPA Estimate of Agricultural Land Use
The use of ethanol in gasoline in 2015 reduced CO2-equivalent greenhouse gas emissions from transportation by 41.2 million metric tons — equivalent to removing 8.7 million cars from the road for an entire year.
– RFA analysis using U.S. Dept. of Energy GREET model
1995 2015 % Change
Ethanol Yield – Dry Mill gals. ethanol/bushel corn 2.55 2.83 11%
Ethanol Yield – Wet Mill gals. ethanol/bushel corn 2.50 2.61 4%
Ethanol Yield – Industry Average gals. ethanol/bushel corn 2.52 2.81 12%
Dry Mill Natural Gas Use BTU/gal. ethanol 37,000 23,862 -36%
Dry Mill Electricity Use kWh/gal. ethanol 1.20 0.75 -38%
Dry Mill Water Use gal. water/gal. ethanol 5.5 2.7 -51%
Average Corn Yield bushels/acre 113.5 168.4 48%
Corn Production million bushels 7,400 13,601 84%
Nitrogen Fertilizer Application pounds/bushel 1.15 0.83 -28%
Ethanol per Corn Acre gals./acre 286 473 65%
Corn Ethanol Efficiency Indicators
Source: U.S. Dept. of Agriculture and U.S. Dept. of Energy
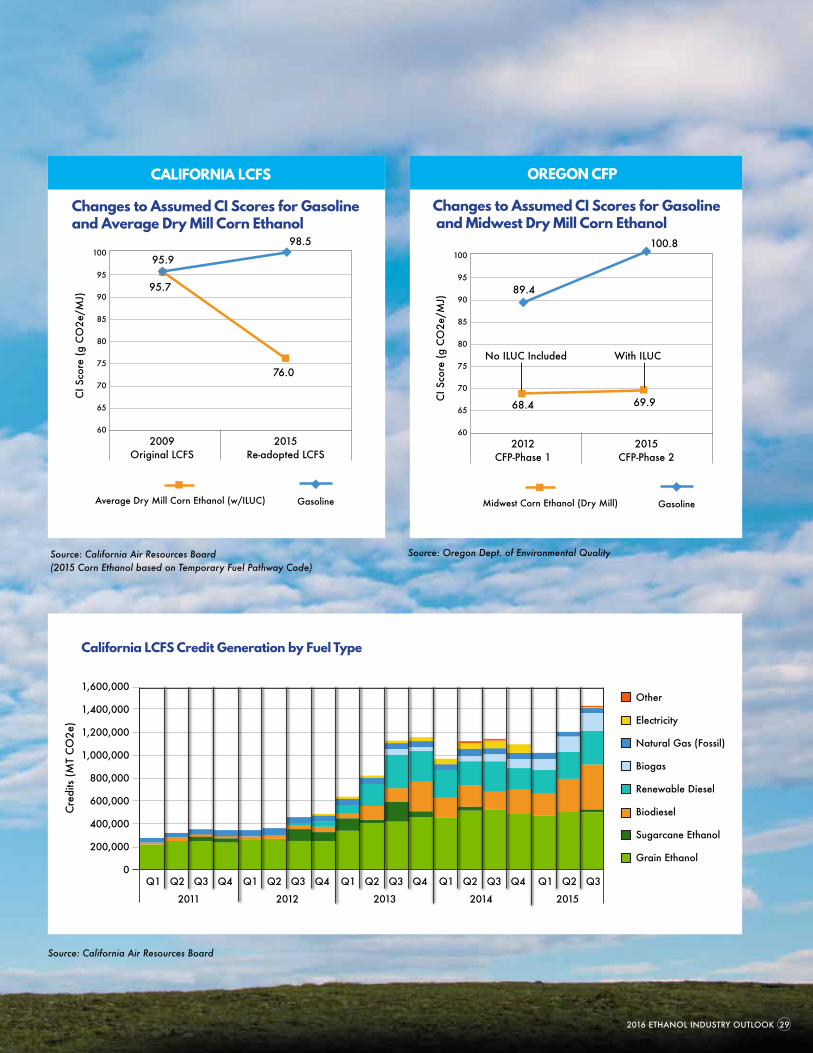
Low carbon fuel policies were back in the headlines in 2015, as California re-adopted its LCFS and Oregon, Washington, and British Columbia took steps to advance their own programs. These regulations seek to reduce the carbon intensity (CI) of transportation fuels by requiring fuel suppliers to substitute lower-carbon fuels for petroleum.
Under the LCFS structure, each different fuel type is assigned a CI “score” based on its estimated lifecycle greenhouse gas (GHG) emissions. When fair and consistent analytical boundaries are used to determine CI scores, ethanol emerges as an attractive fuel option for meeting compliance obligations. However, when hypothetical “indirect emissions” are unfairly added to the CI scores for crop-based biofuels—but not for any other fuels—the scales are wrongly tipped toward other fuel options. Unfortunately, California’s LCFS continues to penalize grain ethanol for emissions from supposed indirect land use changes (ILUC), despite a lack of evidence that such land conversions are occurring.
LOW CARBON FUEL REGULATIONS
ETHANOL’S CARBON CREDENTIALS Still, even with a discriminatory ILUC penalty, grain-based ethanol has made a huge contribution to compliance with the California LCFS. When the LCFS was adopted in 2009, California regulators believed corn ethanol would soon be pushed out of the state due to its assigned CI score and the ILUC penalty. However, U.S. producers have demonstrated that the actual CI of their ethanol is much lower than California regulators anticipated, and grain ethanol has accounted for 48% of the carbon credits generated under the LCFS. Moving forward, however, compliance with the California LCFS becomes much harder, as CI reduction requirements ramp up quickly.
Meanwhile, Oregon adopted regulations in 2015 that will begin the enforcement phase of its program in 2017. Oregon also broke from California by adopting a much lower ILUC penalty for corn ethanol, based on analysis by several universities and the Department of Energy. Washington regulators released a draft LCFS proposal, but the state’s legislature voted to suspend the program. And British Columbia continued to enforce an LCFS that pragmatically does not include any indirect emissions penalties at all.
28
LOW CARBON FUEL REGULATIONS
ETHANOL’S CARBON CREDENTIALS
California LCFS Credit Generation by Fuel Type
2016 ETHANOL INDUSTRY OUTLOOK 29
Source: California Air Resources Board
1,600,000
1,400,000
1,200,000
1,000,000
800,000
600,000
400,000
200,000
0
Cre
dits
(M
T C
O2e
)
Q1 Q2 Q3 Q4 Q1 Q2 Q3 Q4 Q1 Q2 Q3 Q4 Q1 Q2 Q3 Q4 Q1 Q2 Q3
2011 2012 2013 2014 2015
Other
Electricity
Natural Gas (Fossil)
Biogas
Renewable Diesel
Biodiesel
Sugarcane Ethanol
Grain Ethanol
100
95
90
85
80
75
70
65
602012
CFP-Phase 12015
CFP-Phase 2
89.4
100.8
68.4 69.9
No ILUC Included With ILUC
Midwest Corn Ethanol (Dry Mill) Gasoline
CI S
core
(g
CO
2e/M
J)
100
95
90
85
80
75
70
65
602009
Original LCFS2015
Re-adopted LCFS
95.9
98.5
95.7
76.0
Average Dry Mill Corn Ethanol (w/ILUC) Gasoline
CI S
core
(g
CO
2e/M
J)
Source: California Air Resources Board (2015 Corn Ethanol based on Temporary Fuel Pathway Code)
Source: Oregon Dept. of Environmental Quality
CALIFORNIA LCFS
Changes to Assumed CI Scores for Gasoline and Average Dry Mill Corn Ethanol
OREGON CFP
Changes to Assumed CI Scores for Gasoline and Midwest Dry Mill Corn Ethanol
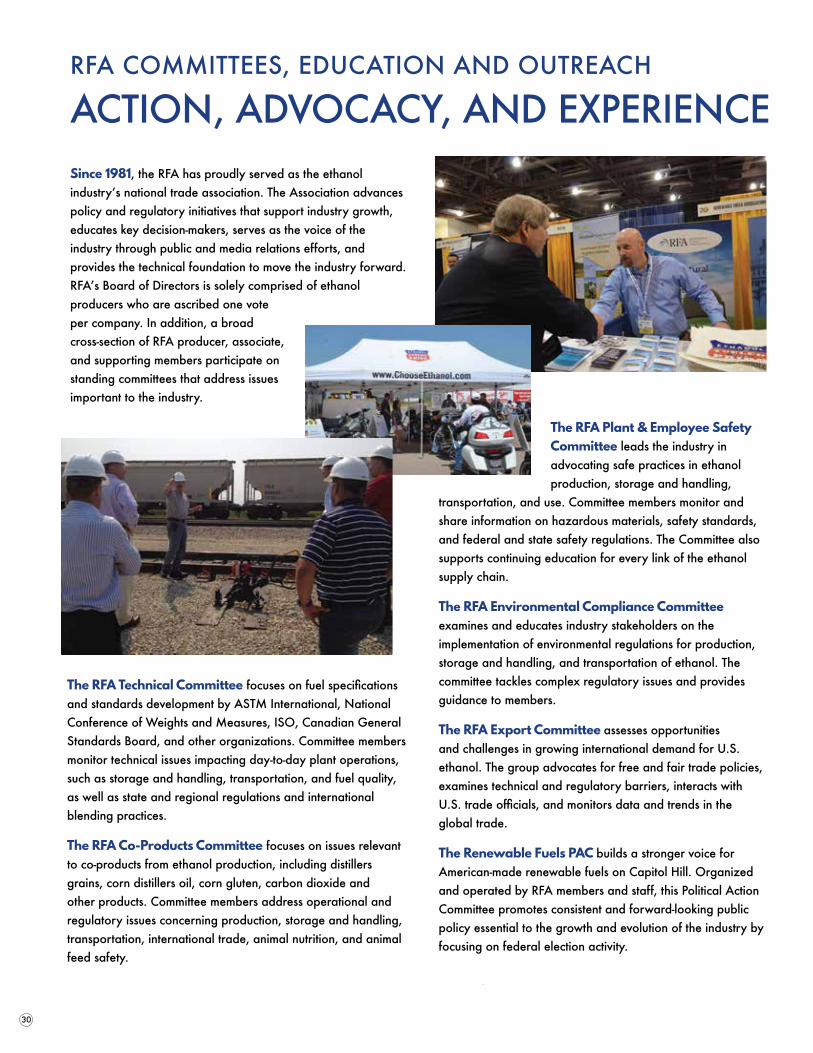
Since 1981, the RFA has proudly served as the ethanol industry’s national trade association. The Association advances policy and regulatory initiatives that support industry growth, educates key decision-makers, serves as the voice of the industry through public and media relations efforts, and provides the technical foundation to move the industry forward. RFA’s Board of Directors is solely comprised of ethanol producers who are ascribed one vote per company. In addition, a broad cross-section of RFA producer, associate, and supporting members participate on standing committees that address issues important to the industry.
RFA COMMITTEES, EDUCATION AND OUTREACH
ACTION, ADVOCACY, AND EXPERIENCE
The RFA Technical Committee focuses on fuel specifications and standards development by ASTM International, National Conference of Weights and Measures, ISO, Canadian General Standards Board, and other organizations. Committee members monitor technical issues impacting day-to-day plant operations, such as storage and handling, transportation, and fuel quality, as well as state and regional regulations and international blending practices.
The RFA Co-Products Committee focuses on issues relevant to co-products from ethanol production, including distillers grains, corn distillers oil, corn gluten, carbon dioxide and other products. Committee members address operational and regulatory issues concerning production, storage and handling, transportation, international trade, animal nutrition, and animal feed safety.
30
The RFA Plant & Employee Safety Committee leads the industry in advocating safe practices in ethanol production, storage and handling,
transportation, and use. Committee members monitor and share information on hazardous materials, safety standards, and federal and state safety regulations. The Committee also supports continuing education for every link of the ethanol supply chain.
The RFA Environmental Compliance Committee examines and educates industry stakeholders on the implementation of environmental regulations for production, storage and handling, and transportation of ethanol. The committee tackles complex regulatory issues and provides guidance to members.
The RFA Export Committee assesses opportunities and challenges in growing international demand for U.S. ethanol. The group advocates for free and fair trade policies, examines technical and regulatory barriers, interacts with U.S. trade officials, and monitors data and trends in the global trade.
The Renewable Fuels PAC builds a stronger voice for American-made renewable fuels on Capitol Hill. Organized and operated by RFA members and staff, this Political Action Committee promotes consistent and forward-looking public policy essential to the growth and evolution of the industry by focusing on federal election activity.

Navigating the Regulatory LandscapeNearly every facet of the ethanol industry—from production at the facility to consumption in the vehicle—is affected by a plethora of federal and state regulations. Ethanol producers face a multitude of registration, reporting, recordkeeping, and compliance requirements, and the regulatory landscape is constantly changing and is becoming more complex. Providing analyses of important regulations and technical issues has long been a hallmark of the RFA, and we strive to ensure our member companies know exactly how their operations—and industry—will be affected by new, pending, or amended regulations. On behalf of its members, RFA staff frequently interacts with the following regulatory bodies (among others):
• Alcohol Tobacco Tax and Trade Bureau (TTB)
• Federal Trade Commission (FTC)
• Occupational Safety & Health Administration (OSHA)
• U.S. Department of Agriculture (USDA)
• U.S. Department of Commerce (DOC)
• U.S. Department of Energy (DOE)
• U.S. Department of Transportation (DOT)
• U.S. Environmental Protection Agency (EPA)
• U.S. Food and Drug Administration (FDA)
2016 ETHANOL INDUSTRY OUTLOOK 31
Bob Dinneen President & CEO
Lauren Davie HR Manager
Christopher Findlay Communications Manager
Mary Giglio Director, Special Projects/Events
Edward S. Hubbard, Jr., Esq. General Counsel
Tony Jackson Communications Director
Luke Lawal Market Development Specialist
Samantha Slater Vice President, Government Affairs
Matt Stuckey IT Director
Geoff Cooper Senior Vice President
Kelly Davis Director, Regulatory Affairs
Ann Lewis Research Analyst
Missy Ruff Technical Services Manager
Robert White Vice President, Industry Relations
Staff bios are available at www.EthanolRFA.org/about/staff
The Renewable Fuels Foundation (RFF) addresses the education, research and strategic planning needs of the U.S. fuel ethanol industry. RFF collaborates with industry and academic stake-holders and public policymakers to address issues related to new uses, new feedstocks and new technologies, with the goal of assuring a growing and healthy renewable fuels industry well into the future.
www.renewablefuels-foundation.org
Mike JerkeChairmanGuardian Energy, LLC
Bob SatherVice ChairmanAce Ethanol LLC
Neil KoehlerTreasurer Pacific Ethanol Inc.
Bob DinneenPresidentRenewable Fuels Association
HEADQUARTERS
BOARD OF DIRECTORS
As the leading trade association for America’s ethanol industry, we work to advance the development, produc-tion & use of fuel ethanol and its co-products and to raise awareness of the benefits of renewable fuels. Our exper-tise, advocacy and member services focus on these areas:
PUBLIC POLICY & REGULATION
FUEL ETHANOL TECHNICAL ISSUES
TRADE POLICY & EXPORT PROMOTION
SAFETY TRAINING & EMERGENCY RESPONSE
U.S. MARKET DEVELOPMENT
RESEARCH & ANALYSIS
COMMUNICATIONS, MEDIA & PUBLIC RELATIONS
CONSUMER ADVERTISING & EDUCATION
STAKEHOLDER ENGAGEMENT
MIDWEST STAFF
AgMotion, Inc.www.agmotion.com
AgStar Financial Services, ACAwww.agstar.com
BASF Enzymes LLCwww.verenium.com
Buckman Laboratories International, Inc.www.buckman.com
ButamaxTM Advanced Biofuels LLCwww.butamax.com
Carl Marks Advisory Group LLCwww.carlmarks.com
Christianson & Associates, PLLPwww.christiansoncpa.com
CoBankwww.cobank.com
COFCOwww.cofco.com/en
CSX Transportationwww.csx.com
Eco-Energy, Inc.www.eco-energy.com
Emerald Foam Control, LLCwww.emeraldmaterials.com
ERI Solutions Inc.www.erisolutions.com
Fagen, Inc.www.fageninc.com
Farm Credit Services of Americawww.fcsamerica.com
Fluid Quip Process Technologies, LLCwww.fluidquip.com
Fremont Industries, Inc.www.fremontind.com
Gavilon, LLCwww.gavilon.com
GlobalView Software, Inc.www.marketview.com
Gold Eagle Co.www.goldeagle.com
GROWMARK, Inc.www.growmark.com
Hartland Fuel Productswww.hartlandfuels.com
Hawkeye Gold LLC, a subsidiary of J.D. Heiskell & Co.www.heiskell.com
Hydro-Klean LLCwww.hydro-klean.com
ICM, Inc.www.icminc.com
Illinois Corn Marketing Boardwww.ilcorn.org
Indiana Corn Marketing Councilwww.incorn.org
Innospec Fuel Specialties LLCwww.innospecinc.com
Inspectorate America Corporationwww.inspectorate.com
INTL FCStone Inc.www.intlfcstone.com
Iowa Corn Growers Associationwww.iowacorn.org
Iowa Renewable Fuels Associationwww.iowarfa.org
Kansas Corn Commissionwww.ksgrains.com
KATZEN International, Inc.www.katzen.com
Kenan Advantage Group, Inc.www.thekag.com
Kentucky Corn Promotion Councilwww.kycorn.org
Kinder Morgan, Inc.www.kindermorgan.com
Lallemand Biofuels & Distilled Spiritswww.ethanoltech.com
Leaf Technologieswww.leaftechnologies.com
Michael Best & Friedrich LLPwww.michaelbest.com
Midwest Laboratories, Inc.www.midwestlabs.com
Minnesota Bio-Fuels Associationwww.mnbiofuels.org
Minnesota Corn Research & Promotion Councilwww.mncorn.org
Monsanto Co.www.monsanto.com
Murex LLCwww.murexltd.com
Nalco Co.www.nalco.com
National Corn Growers Associationwww.ncga.com
National Sorghum Producerswww.sorghumgrowers.com
Nebraska Corn Boardwww.nebraskacorn.org
Noble Americas Corp.www.nobleamericas.com
North Dakota Corn Councilwww.ndcorn.org
Ohio Corn Marketing Programwww.ohiocorn.org
PhibroChemwww.phibrochem.com
Pinnacle Engineering, Inc.www.pineng.com
Protec Fuel Management, LLCwww.protecfuel.com
PRX Geographic Inc./The ProExporter Networkwww.prxgeo.com
Renewable Products Marketing Group, LLCwww.rpmgllc.com
RSM US LLPhttp://www.rsmus.com
South Dakota Corn Utilization Councilwww.sdcorn.org
Syngentawww.syngenta.com
Union Pacific Railroad Co.www.up.com
U.S. Water Services, Inc.www.uswaterservices.com
United Sorghum Checkoff Programwww.sorghumcheckoff.com
Agriculture Retailers Associationwww.aradc.org
Bemidji (MN) State Universitywww.bemidjistate.edu
Bismarck State Collegewww.bsc.nodak.edu
Colorado Farm Bureauwww.coloradofarmbureau.com
Corn Marketing Program Of Michiganwww.micorn.org
Distillers Grains Technology Councilwww.distillersgrains.org
Downstream Alternatives, Inc.
Ethanol Producers And Consumerswww.ethanolmt.org
Great Falls Montana Development Authoritywww.gfdevelopment.org
Iowa Central Fuel Testing Laboratorywww.iowafuellab.com
Jamestown/Stutsman Development Corp.www.growingjamestown.com
Kentucky Energy & Environment Cabinet–Department for Energy Development & Independencewww.eec.ky.gov
Maryland Grain Producers Utilization Boardwww.marylandgrain.com
Michigan State University–Department of Agricultural, Food, and Resource Economicswww.afre.msu.edu
Minnesota Department of Agriculturewww.mda.state.mn.us
Mississippi State University–Department of Forestrywww.cfr.msstate.edu/forestry
Missouri Corn Growers Associationwww.mocorn.org
Morton Collegewww.morton.edu
National Corn-To-Ethanol Research Center at SIUEwww.ethanolresearch.com
Renew Kansaswww.renewkansas.com
South Dakota Corn Growers Associationwww.sdcorn.org
Southeastern Illinois Collegewww.sic.edu
Steele-Waseca Cooperative Electricwww.swce.coop
Sugar Processing Research Institutewww.spriinc.org
Texas Renewable Energy Industry Alliancewww.treia.org
The New School–Milano School of International Affairs, Management, and Urban Policywww.newschool.edu/milano
United Associationwww.ua.org
Water Assurance Technology Energy Resourceswww.waterc3.com
Western Iowa Tech Community College–National Boiler Training & Renewable Fuels Institutewww.witcc.edu
Wisconsin Pipe Tradeswww.wipipetrades.org
ASSOCIATE MEMBERS
SUPPORTING MEMBERS
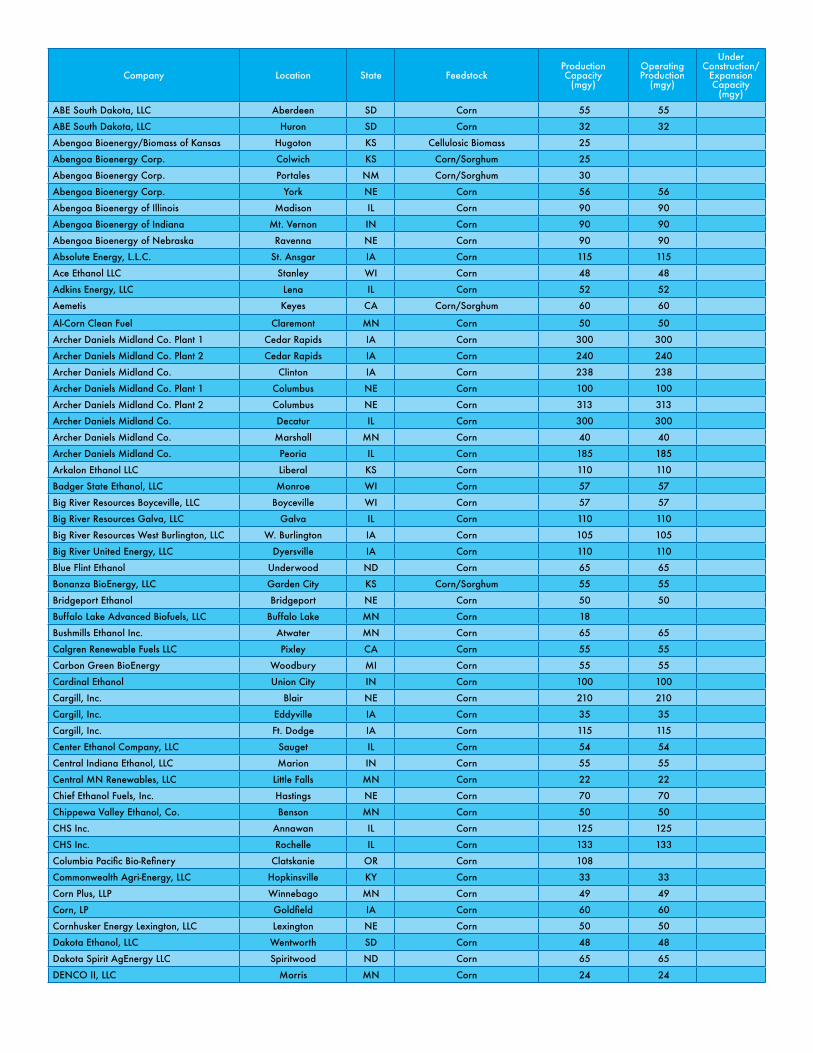
Company Location State FeedstockProduction Capacity
(mgy)
Operating Production
(mgy)
Under Construction/
Expansion Capacity
(mgy)
ABE South Dakota, LLC Aberdeen SD Corn 55 55
ABE South Dakota, LLC Huron SD Corn 32 32
Abengoa Bioenergy/Biomass of Kansas Hugoton KS Cellulosic Biomass 25
Abengoa Bioenergy Corp. Colwich KS Corn/Sorghum 25
Abengoa Bioenergy Corp. Portales NM Corn/Sorghum 30
Abengoa Bioenergy Corp. York NE Corn 56 56
Abengoa Bioenergy of Illinois Madison IL Corn 90 90
Abengoa Bioenergy of Indiana Mt. Vernon IN Corn 90 90
Abengoa Bioenergy of Nebraska Ravenna NE Corn 90 90
Absolute Energy, L.L.C. St. Ansgar IA Corn 115 115
Ace Ethanol LLC Stanley WI Corn 48 48
Adkins Energy, LLC Lena IL Corn 52 52
Aemetis Keyes CA Corn/Sorghum 60 60
Al-Corn Clean Fuel Claremont MN Corn 50 50
Archer Daniels Midland Co. Plant 1 Cedar Rapids IA Corn 300 300
Archer Daniels Midland Co. Plant 2 Cedar Rapids IA Corn 240 240
Archer Daniels Midland Co. Clinton IA Corn 238 238
Archer Daniels Midland Co. Plant 1 Columbus NE Corn 100 100
Archer Daniels Midland Co. Plant 2 Columbus NE Corn 313 313
Archer Daniels Midland Co. Decatur IL Corn 300 300
Archer Daniels Midland Co. Marshall MN Corn 40 40
Archer Daniels Midland Co. Peoria IL Corn 185 185
Arkalon Ethanol LLC Liberal KS Corn 110 110
Badger State Ethanol, LLC Monroe WI Corn 57 57
Big River Resources Boyceville, LLC Boyceville WI Corn 57 57
Big River Resources Galva, LLC Galva IL Corn 110 110
Big River Resources West Burlington, LLC W. Burlington IA Corn 105 105
Big River United Energy, LLC Dyersville IA Corn 110 110
Blue Flint Ethanol Underwood ND Corn 65 65
Bonanza BioEnergy, LLC Garden City KS Corn/Sorghum 55 55
Bridgeport Ethanol Bridgeport NE Corn 50 50
Buffalo Lake Advanced Biofuels, LLC Buffalo Lake MN Corn 18
Bushmills Ethanol Inc. Atwater MN Corn 65 65
Calgren Renewable Fuels LLC Pixley CA Corn 55 55
Carbon Green BioEnergy Woodbury MI Corn 55 55
Cardinal Ethanol Union City IN Corn 100 100
Cargill, Inc. Blair NE Corn 210 210
Cargill, Inc. Eddyville IA Corn 35 35
Cargill, Inc. Ft. Dodge IA Corn 115 115
Center Ethanol Company, LLC Sauget IL Corn 54 54
Central Indiana Ethanol, LLC Marion IN Corn 55 55
Central MN Renewables, LLC Little Falls MN Corn 22 22
Chief Ethanol Fuels, Inc. Hastings NE Corn 70 70
Chippewa Valley Ethanol, Co. Benson MN Corn 50 50
CHS Inc. Annawan IL Corn 125 125
CHS Inc. Rochelle IL Corn 133 133
Columbia Pacific Bio-Refinery Clatskanie OR Corn 108
Commonwealth Agri-Energy, LLC Hopkinsville KY Corn 33 33
Corn Plus, LLP Winnebago MN Corn 49 49
Corn, LP Goldfield IA Corn 60 60
Cornhusker Energy Lexington, LLC Lexington NE Corn 50 50
Dakota Ethanol, LLC Wentworth SD Corn 48 48
Dakota Spirit AgEnergy LLC Spiritwood ND Corn 65 65
DENCO II, LLC Morris MN Corn 24 24
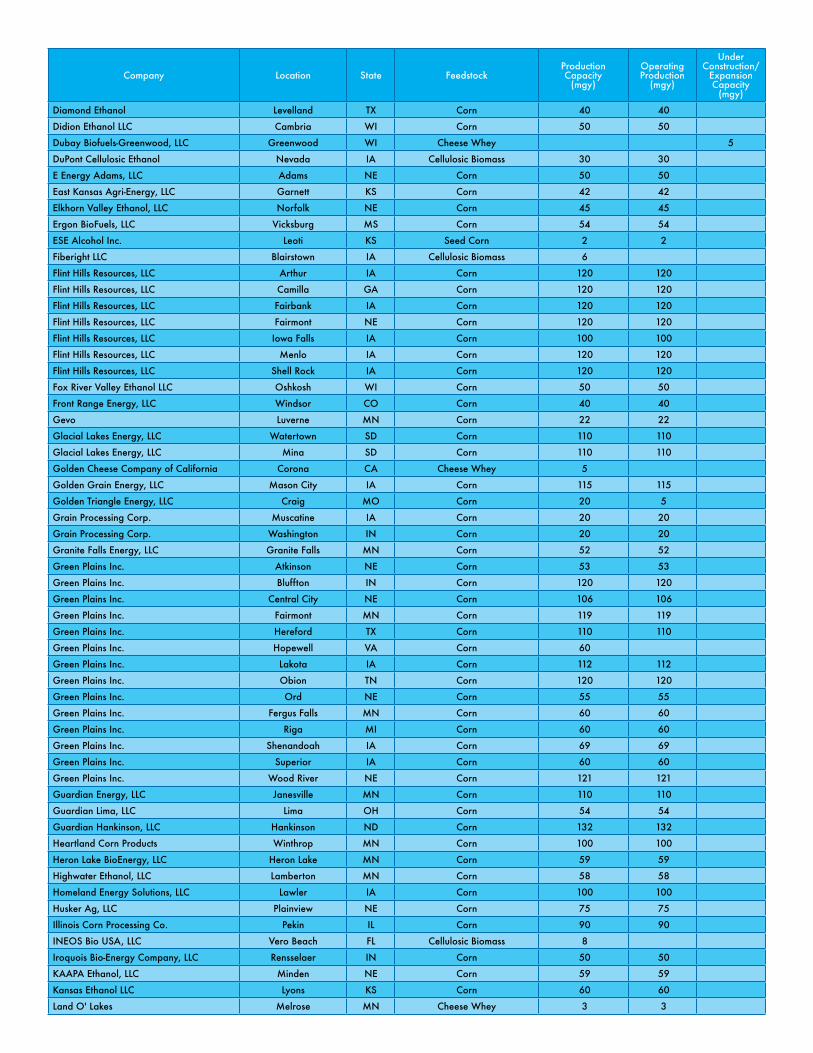
Company Location State FeedstockProduction Capacity
(mgy)
Operating Production
(mgy)
Under Construction/
Expansion Capacity
(mgy)
Diamond Ethanol Levelland TX Corn 40 40
Didion Ethanol LLC Cambria WI Corn 50 50
Dubay Biofuels-Greenwood, LLC Greenwood WI Cheese Whey 5
DuPont Cellulosic Ethanol Nevada IA Cellulosic Biomass 30 30
E Energy Adams, LLC Adams NE Corn 50 50
East Kansas Agri-Energy, LLC Garnett KS Corn 42 42
Elkhorn Valley Ethanol, LLC Norfolk NE Corn 45 45
Ergon BioFuels, LLC Vicksburg MS Corn 54 54
ESE Alcohol Inc. Leoti KS Seed Corn 2 2
Fiberight LLC Blairstown IA Cellulosic Biomass 6
Flint Hills Resources, LLC Arthur IA Corn 120 120
Flint Hills Resources, LLC Camilla GA Corn 120 120
Flint Hills Resources, LLC Fairbank IA Corn 120 120
Flint Hills Resources, LLC Fairmont NE Corn 120 120
Flint Hills Resources, LLC Iowa Falls IA Corn 100 100
Flint Hills Resources, LLC Menlo IA Corn 120 120
Flint Hills Resources, LLC Shell Rock IA Corn 120 120
Fox River Valley Ethanol LLC Oshkosh WI Corn 50 50
Front Range Energy, LLC Windsor CO Corn 40 40
Gevo Luverne MN Corn 22 22
Glacial Lakes Energy, LLC Watertown SD Corn 110 110
Glacial Lakes Energy, LLC Mina SD Corn 110 110
Golden Cheese Company of California Corona CA Cheese Whey 5
Golden Grain Energy, LLC Mason City IA Corn 115 115
Golden Triangle Energy, LLC Craig MO Corn 20 5
Grain Processing Corp. Muscatine IA Corn 20 20
Grain Processing Corp. Washington IN Corn 20 20
Granite Falls Energy, LLC Granite Falls MN Corn 52 52
Green Plains Inc. Atkinson NE Corn 53 53
Green Plains Inc. Bluffton IN Corn 120 120
Green Plains Inc. Central City NE Corn 106 106
Green Plains Inc. Fairmont MN Corn 119 119
Green Plains Inc. Hereford TX Corn 110 110
Green Plains Inc. Hopewell VA Corn 60
Green Plains Inc. Lakota IA Corn 112 112
Green Plains Inc. Obion TN Corn 120 120
Green Plains Inc. Ord NE Corn 55 55
Green Plains Inc. Fergus Falls MN Corn 60 60
Green Plains Inc. Riga MI Corn 60 60
Green Plains Inc. Shenandoah IA Corn 69 69
Green Plains Inc. Superior IA Corn 60 60
Green Plains Inc. Wood River NE Corn 121 121
Guardian Energy, LLC Janesville MN Corn 110 110
Guardian Lima, LLC Lima OH Corn 54 54
Guardian Hankinson, LLC Hankinson ND Corn 132 132
Heartland Corn Products Winthrop MN Corn 100 100
Heron Lake BioEnergy, LLC Heron Lake MN Corn 59 59
Highwater Ethanol, LLC Lamberton MN Corn 58 58
Homeland Energy Solutions, LLC Lawler IA Corn 100 100
Husker Ag, LLC Plainview NE Corn 75 75
Illinois Corn Processing Co. Pekin IL Corn 90 90
INEOS Bio USA, LLC Vero Beach FL Cellulosic Biomass 8
Iroquois Bio-Energy Company, LLC Rensselaer IN Corn 50 50
KAAPA Ethanol, LLC Minden NE Corn 59 59
Kansas Ethanol LLC Lyons KS Corn 60 60
Land O' Lakes Melrose MN Cheese Whey 3 3
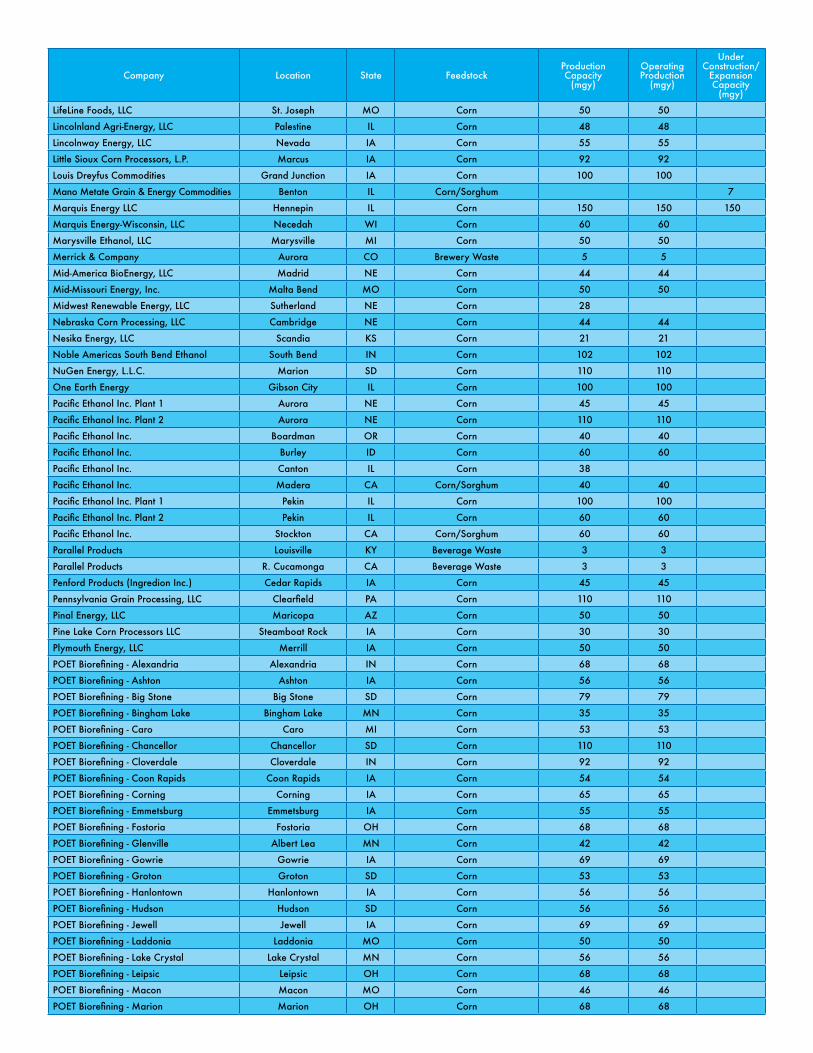
Company Location State FeedstockProduction Capacity
(mgy)
Operating Production
(mgy)
Under Construction/
Expansion Capacity
(mgy)
LifeLine Foods, LLC St. Joseph MO Corn 50 50
Lincolnland Agri-Energy, LLC Palestine IL Corn 48 48
Lincolnway Energy, LLC Nevada IA Corn 55 55
Little Sioux Corn Processors, L.P. Marcus IA Corn 92 92
Louis Dreyfus Commodities Grand Junction IA Corn 100 100
Mano Metate Grain & Energy Commodities Benton IL Corn/Sorghum 7
Marquis Energy LLC Hennepin IL Corn 150 150 150
Marquis Energy-Wisconsin, LLC Necedah WI Corn 60 60
Marysville Ethanol, LLC Marysville MI Corn 50 50
Merrick & Company Aurora CO Brewery Waste 5 5
Mid-America BioEnergy, LLC Madrid NE Corn 44 44
Mid-Missouri Energy, Inc. Malta Bend MO Corn 50 50
Midwest Renewable Energy, LLC Sutherland NE Corn 28
Nebraska Corn Processing, LLC Cambridge NE Corn 44 44
Nesika Energy, LLC Scandia KS Corn 21 21
Noble Americas South Bend Ethanol South Bend IN Corn 102 102
NuGen Energy, L.L.C. Marion SD Corn 110 110
One Earth Energy Gibson City IL Corn 100 100
Pacific Ethanol Inc. Plant 1 Aurora NE Corn 45 45
Pacific Ethanol Inc. Plant 2 Aurora NE Corn 110 110
Pacific Ethanol Inc. Boardman OR Corn 40 40
Pacific Ethanol Inc. Burley ID Corn 60 60
Pacific Ethanol Inc. Canton IL Corn 38
Pacific Ethanol Inc. Madera CA Corn/Sorghum 40 40
Pacific Ethanol Inc. Plant 1 Pekin IL Corn 100 100
Pacific Ethanol Inc. Plant 2 Pekin IL Corn 60 60
Pacific Ethanol Inc. Stockton CA Corn/Sorghum 60 60
Parallel Products Louisville KY Beverage Waste 3 3
Parallel Products R. Cucamonga CA Beverage Waste 3 3
Penford Products (Ingredion Inc.) Cedar Rapids IA Corn 45 45
Pennsylvania Grain Processing, LLC Clearfield PA Corn 110 110
Pinal Energy, LLC Maricopa AZ Corn 50 50
Pine Lake Corn Processors LLC Steamboat Rock IA Corn 30 30
Plymouth Energy, LLC Merrill IA Corn 50 50
POET Biorefining - Alexandria Alexandria IN Corn 68 68
POET Biorefining - Ashton Ashton IA Corn 56 56
POET Biorefining - Big Stone Big Stone SD Corn 79 79
POET Biorefining - Bingham Lake Bingham Lake MN Corn 35 35
POET Biorefining - Caro Caro MI Corn 53 53
POET Biorefining - Chancellor Chancellor SD Corn 110 110
POET Biorefining - Cloverdale Cloverdale IN Corn 92 92
POET Biorefining - Coon Rapids Coon Rapids IA Corn 54 54
POET Biorefining - Corning Corning IA Corn 65 65
POET Biorefining - Emmetsburg Emmetsburg IA Corn 55 55
POET Biorefining - Fostoria Fostoria OH Corn 68 68
POET Biorefining - Glenville Albert Lea MN Corn 42 42
POET Biorefining - Gowrie Gowrie IA Corn 69 69
POET Biorefining - Groton Groton SD Corn 53 53
POET Biorefining - Hanlontown Hanlontown IA Corn 56 56
POET Biorefining - Hudson Hudson SD Corn 56 56
POET Biorefining - Jewell Jewell IA Corn 69 69
POET Biorefining - Laddonia Laddonia MO Corn 50 50
POET Biorefining - Lake Crystal Lake Crystal MN Corn 56 56
POET Biorefining - Leipsic Leipsic OH Corn 68 68
POET Biorefining - Macon Macon MO Corn 46 46
POET Biorefining - Marion Marion OH Corn 68 68
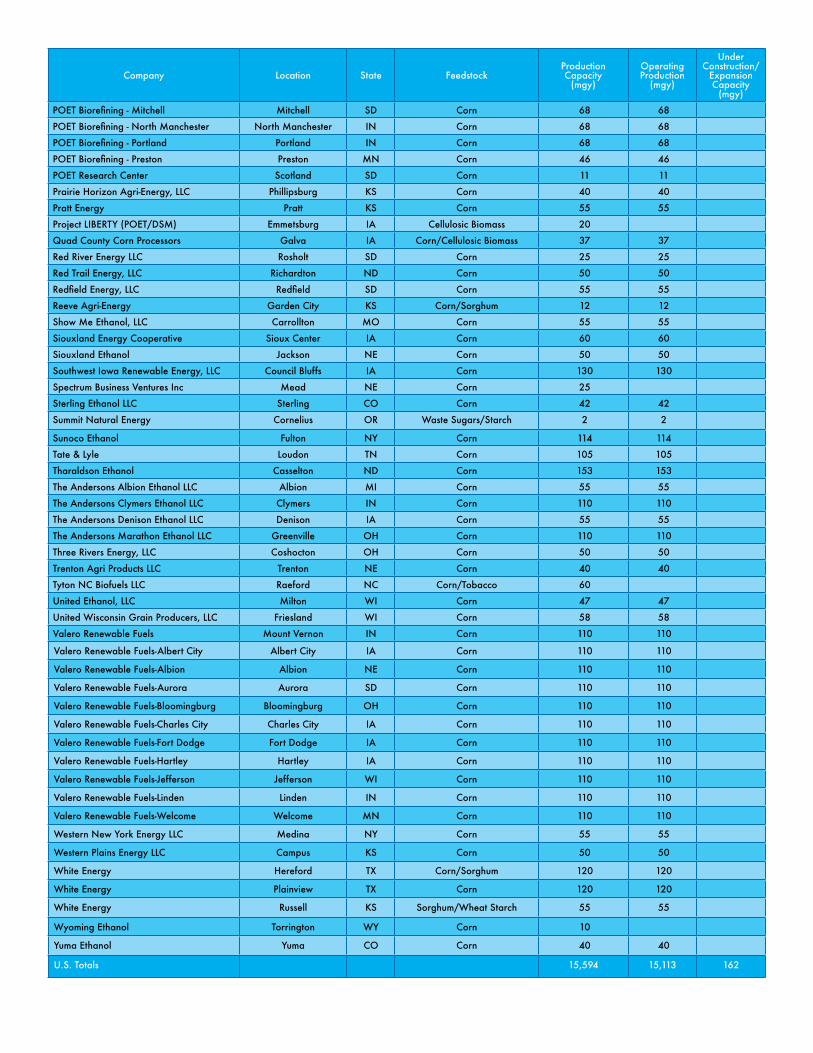
Company Location State FeedstockProduction Capacity
(mgy)
Operating Production
(mgy)
Under Construction/
Expansion Capacity
(mgy)
POET Biorefining - Mitchell Mitchell SD Corn 68 68
POET Biorefining - North Manchester North Manchester IN Corn 68 68
POET Biorefining - Portland Portland IN Corn 68 68
POET Biorefining - Preston Preston MN Corn 46 46
POET Research Center Scotland SD Corn 11 11
Prairie Horizon Agri-Energy, LLC Phillipsburg KS Corn 40 40
Pratt Energy Pratt KS Corn 55 55
Project LIBERTY (POET/DSM) Emmetsburg IA Cellulosic Biomass 20
Quad County Corn Processors Galva IA Corn/Cellulosic Biomass 37 37
Red River Energy LLC Rosholt SD Corn 25 25
Red Trail Energy, LLC Richardton ND Corn 50 50
Redfield Energy, LLC Redfield SD Corn 55 55
Reeve Agri-Energy Garden City KS Corn/Sorghum 12 12
Show Me Ethanol, LLC Carrollton MO Corn 55 55
Siouxland Energy Cooperative Sioux Center IA Corn 60 60
Siouxland Ethanol Jackson NE Corn 50 50
Southwest Iowa Renewable Energy, LLC Council Bluffs IA Corn 130 130
Spectrum Business Ventures Inc Mead NE Corn 25
Sterling Ethanol LLC Sterling CO Corn 42 42
Summit Natural Energy Cornelius OR Waste Sugars/Starch 2 2
Sunoco Ethanol Fulton NY Corn 114 114
Tate & Lyle Loudon TN Corn 105 105
Tharaldson Ethanol Casselton ND Corn 153 153
The Andersons Albion Ethanol LLC Albion MI Corn 55 55
The Andersons Clymers Ethanol LLC Clymers IN Corn 110 110
The Andersons Denison Ethanol LLC Denison IA Corn 55 55
The Andersons Marathon Ethanol LLC Greenville OH Corn 110 110
Three Rivers Energy, LLC Coshocton OH Corn 50 50
Trenton Agri Products LLC Trenton NE Corn 40 40
Tyton NC Biofuels LLC Raeford NC Corn/Tobacco 60
United Ethanol, LLC Milton WI Corn 47 47
United Wisconsin Grain Producers, LLC Friesland WI Corn 58 58
Valero Renewable Fuels Mount Vernon IN Corn 110 110
Valero Renewable Fuels-Albert City Albert City IA Corn 110 110
Valero Renewable Fuels-Albion Albion NE Corn 110 110
Valero Renewable Fuels-Aurora Aurora SD Corn 110 110
Valero Renewable Fuels-Bloomingburg Bloomingburg OH Corn 110 110
Valero Renewable Fuels-Charles City Charles City IA Corn 110 110
Valero Renewable Fuels-Fort Dodge Fort Dodge IA Corn 110 110
Valero Renewable Fuels-Hartley Hartley IA Corn 110 110
Valero Renewable Fuels-Jefferson Jefferson WI Corn 110 110
Valero Renewable Fuels-Linden Linden IN Corn 110 110
Valero Renewable Fuels-Welcome Welcome MN Corn 110 110
Western New York Energy LLC Medina NY Corn 55 55
Western Plains Energy LLC Campus KS Corn 50 50
White Energy Hereford TX Corn/Sorghum 120 120
White Energy Plainview TX Corn 120 120
White Energy Russell KS Sorghum/Wheat Starch 55 55
Wyoming Ethanol Torrington WY Corn 10
Yuma Ethanol Yuma CO Corn 40 40
U.S. Totals 15,594 15,113 162
www.EthanolRFA.org
Headquarters425 Third Street, SW, Suite 1150Washington, DC 20024TEL: 202-289-3835FAX: 202-289-7519 email: [email protected]
St. Louis Office16024 Manchester Rd.Suite 200Ellisville, MO 63011TEL: 636-594-2284FAX: 636-594-2222
Join us onFacebook “f ” Logo CMYK / .eps Facebook “f ” Logo CMYK / .eps